pnbhfl training final
TRANSCRIPT

Business Intelligence and Reporting Tool

Agenda
1.BIRT Overview.
2.Working with BIRT Report Designer.
3.Working with Charts & Cross Tab.
4.Preview Report.
5.Deploying Reports.

BIRT Overview

Introduction to BIRT
BIRT is an Eclipse-based open source reporting system for web applications, especially those based on Java and Java EE.
BIRT has two main components: a report designer based on Eclipse, and a run time component that you can add to your app server.
With BIRT, you can add a rich variety of reports to your application.
Lists - The simplest reports are lists of data. As the lists get longer, you can add grouping to organize related data together.Charts - Numeric data is much easier to understand when presented as a chart. BIRT provides pie charts, line & bar charts and many more.Cross tabs - Cross tabs (also called a cross-tabulation or matrix) shows data in two dimensions: sales per quarter or hits per web page.Letters & Documents - Notices, form letters, and other textual documents are easy to create with BIRT. Documents can include text, formatting, lists, charts and more.
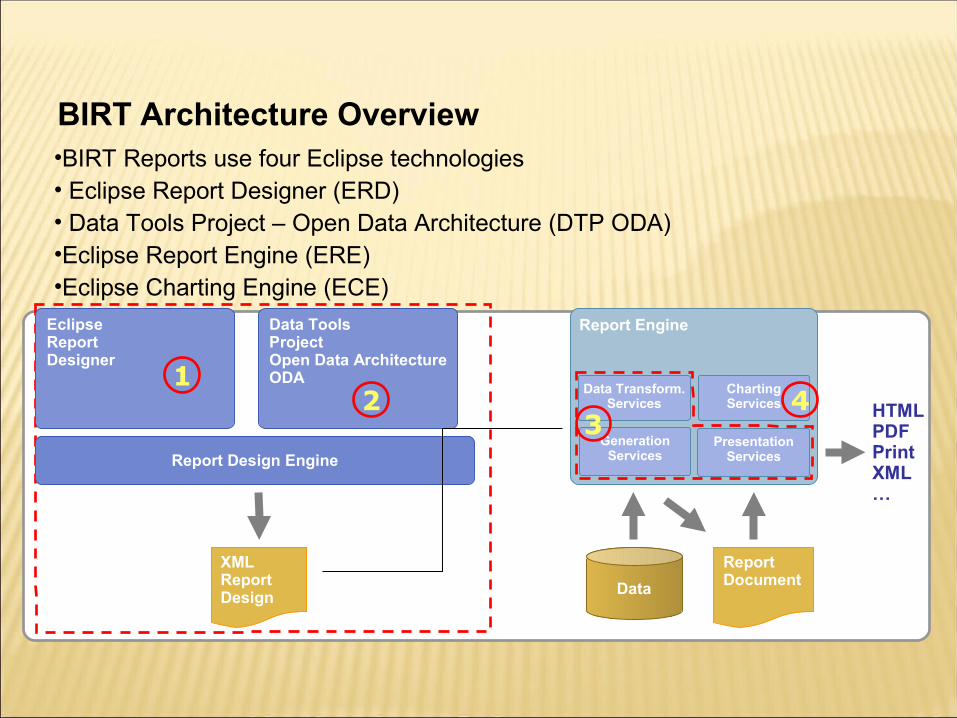
BIRT Architecture Overview•BIRT Reports use four Eclipse technologies• Eclipse Report Designer (ERD)• Data Tools Project – Open Data Architecture (DTP ODA) •Eclipse Report Engine (ERE) •Eclipse Charting Engine (ECE)
`
EclipseReportDesigner
Data Tools ProjectOpen Data ArchitectureODA
Report Design Engine
XMLReportDesign
21
Report Engine
Data Transform.Services
ChartingServices
GenerationServices
PresentationServices
34
v
Data
ReportDocument
HTMLPDFPrintXML…

BIRT reports consist of four main parts: data, data transforms business logic and presentation.Data - Databases, web services, Java objects all can supply data to your BIRT report. BIRT provides JDBC, XML, Web Services, and Flat File support, as well as support for using code to get at other sources of data. A single report can include data from any number of data sources.
Data Transforms - Reports present data sorted, summarized, filtered and grouped to fit the user's needs. BIRT must do it for "simple" data sources such as flat files or Java objects. BIRT allows sophisticated operations such as grouping on sums, percentages of overall totals and more.

Business Logic - Real-world data is seldom structured exactly as you'd like for a report. Many reports require business-specific logic to convert raw data into information useful for the user. If the logic is just for the report, you can script it using BIRT's JavaScript support.
Presentation - Once the data is ready, you have a wide range of options for presenting it to the user. Tables, charts, text and more. A single data set can appear in multiple ways, and a single report can present data from multiple data sets.

Top level open source Eclipse project. Flexible with rich programmatic control. Full support for libraries and reuse. Support for a wider range of report types and easier report development. Easier application integration and extension development. Powerful,extensible data visualization technology.
Simplicitythat makes
simple layoutseasy
PowerTo create
very complex layouts
BIRT

Possible output formats from BIRT Report Designer are:- DOCX Excel PDF HTML Open Document Word Power point

The BIRT All-in-One installation package is a large ZIP file (roughly 242 Mb).ZIP file contains a full Eclipse installation, with the BIRT plug-ins already installed and pre- configured for use.Step 1:-Once you have downloaded required package, unzip the package into your chosen directory (“C:\Eclipse” as base installation directory).Step 2:-This will create an eclipse directory that contains eclipse.exe. Run eclipse.exe to start the designer.

Working with BIRT Report Designer

Report design viewsApplication development with BIRT starts with the report designer. This Eclipse-based set of plug-ins offers a variety of tools to build reports quickly. Some of these are listed below.
Data Explorer:-Organizes your data sources (connections) and data sets (queries).This view also is used to design report parameters.
Palette - Contains the standard BIRT report elements such as labels, tables, and charts and isused in conjunction with the Layout View to design reports.
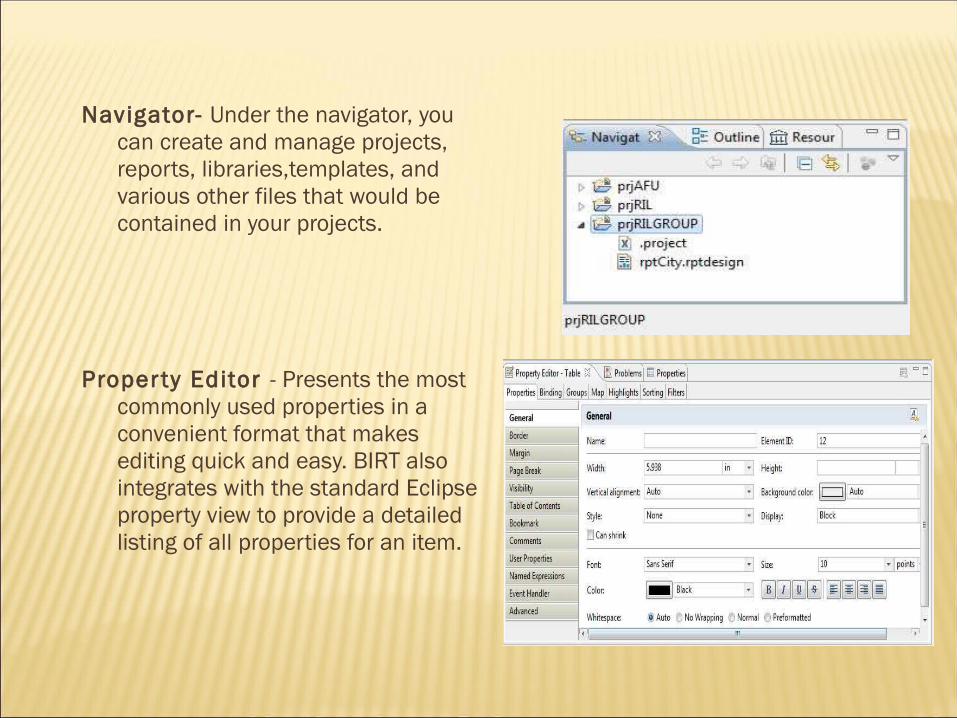
Navigator- Under the navigator, you can create and manage projects, reports, libraries,templates, and various other files that would be contained in your projects.
Proper ty Editor - Presents the most commonly used properties in a convenient format that makes editing quick and easy. BIRT also integrates with the standard Eclipse property view to provide a detailed listing of all properties for an item.

Outl ine - BIRT reports are organized as a tree structure with the overall report as the root, and separate categories for styles, report content, data sources, data sets, report parameters and more. The Outline view provides a compact overview of your entire report structure.
Resource Explorer - BIRT allows the reuse of report objects, such as tables, data sources and styles. Objects created for reuse are stored in a library file.

Create a New Project
Step 1:-Click File->New->Project.
Step 2:-Select Business Intelligence and Reporting Tools->Report Project.
Step 3:-Click Next then name the project and select the location of the project. By default it is created in Workspace.
Step 4:-Click Finish.

Create a Report
Step 1:-Click File->New->Report.
Step 2:-Select the project in which the report has to be created.
Step 3:-Name the report.
Step 4:-Click next.

New Report provides options for starting with a blank report and several report templates.
Step 5:-Select Blank Report, then choose Finish. Your new report appears in the main window.

This window displays the layout editor. The layout editor shows an empty report page Blank report

Connecting to the database
BIRT data source connects your report to a database or other type of data source.
A report can access data from the following types of data sources
- Relational database through a JDBC driver.
- Flat file — text or CSV.
- XML document.
- Web services.
- Other data sources, such as Java objects, through a custom driver.

Create a New Data source
Step 1:-Under outline tab of report.
Step 2:-Select Data source->New Data source
Step 3:-The pop up window will open for setting the property of the new connection.
Step 4:-Select JDBC Data source
Step 5:-Name the Data source.
Step 6:-Click Next.
Step 7:-Enter the database connection details.
Database Connection Details:-
Driver Class:-The driver for the D/B that has to be used. In our case it is Oracle data therefore we are using OJDBC driver. Managing Drivers are shown in later Slides.
Database URL:-For oracle:-
jdbc:oracle:thin:@D/B server IP:Port no:Service name
User name:-User name of D/B schema
Password:-Password of D/B Schema
Step 8:-After entering details test the connection and click finish.
This creates the data source for BIRT.


For connections from JDBC data source we need to add JDBC driver.Step 1:-In create data source pane go to Manage Drivers. This will open a new pane.

Step 2:-For adding drivers we need to download the required JDBC (.JAR Files) then click add browse the file and add the drivers. In our case we have added OJDBC driver.

Once the driver is installed we can see the list of added drivers in the drivers tab in Manage JDBC drivers pane.

Create a Data Set
Step 1:-On outline tab of Report under report. Right Click Data set->New Data set
Step 2:- Select Data Source.
Step 3:-Select Data Set type.

Create a Query for Data Set
After data set is created. When we click next the Query Editor windows open for that particular data set.

Create a Query for Data SetImage below displays output columns of the query.

Data Source:-Display the data source of the data set.
Query:-Query that is used for the report are written in Query editor.
Output columns:-Shows the output columns that are displayed after executing query.
Computed Columns:-The columns that we have on report level are created here.
Parameters: -Parameters that have to used in report are mapped here.
Fil ters:-It contains filters that have to be applied at report level.
Proper ty Binding:- Used in data set to set some condition using java script.
Settings:-Sets how many rows have to be fetched from data set and ordering null values with locale information.
Preview Results :-Used for viewing the final result.
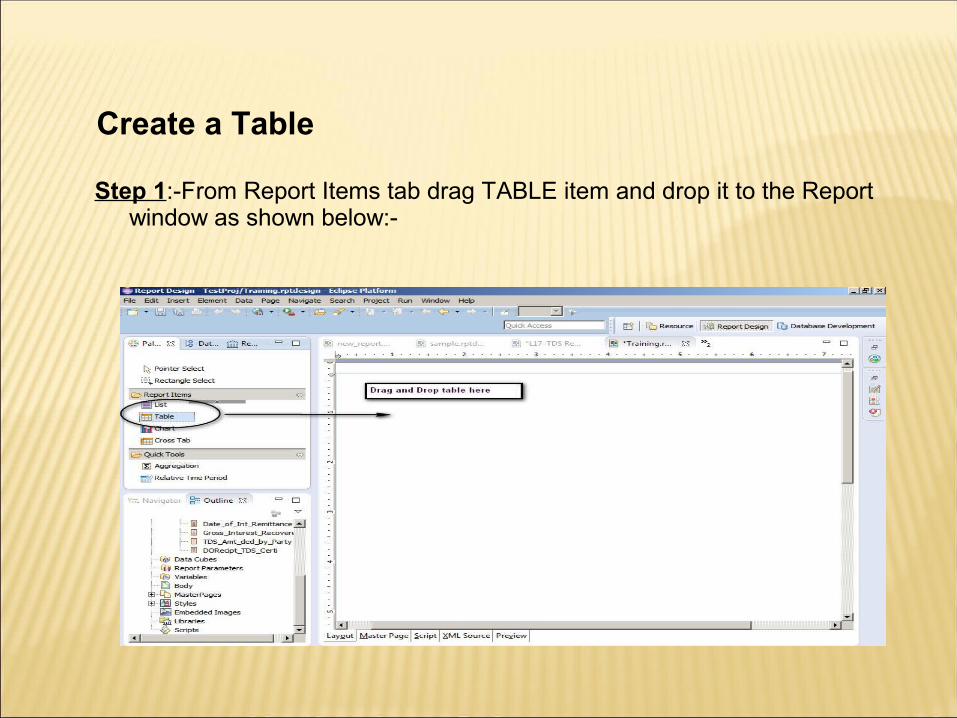
Create a Table
Step 1:-From Report Items tab drag TABLE item and drop it to the Report window as shown below:-

Step 2:-Select number of columns and detail rows and then click next as shown below.

Step 3:-Select the data set type from the given list.
Step 4:-Select columns to display on report and click Finish.

Step 5:-After the step 4 table structure is prepared. Now we need to drag and drop columns as per our requirement to table structure as shown below.

A grid item contains a set of report items, and the items are arranged into a grid. Each cell in the grid can contain a single item. However, the user can easily add multiple items by placing a container into a cell, and placing other items into the container.The grid section is divided into rows and columns. Rows grow or shrink depending on content. Columns ensure that items line up vertically. Columns can also grow or shrink depending on their contents.The grid layout is ideal for reports that will be exported to Excel or shown on the web.The grid layout can be applied to a list to align column headings with detail rows.

Step 1:-From the Palette tab select Grid and drop it to the report layout. Step 2:-Select the number of rows and columns as per the requirement.Step 3:-Drag and drop the report item as per the requirement of the report.

Adding Styles
Step 1:Select Table part right click->style->new style

Step 2:-In general tab of style pane select Predefined style. Select report element Table header cell and set the properties.

Set fontSet background
color
Set Border

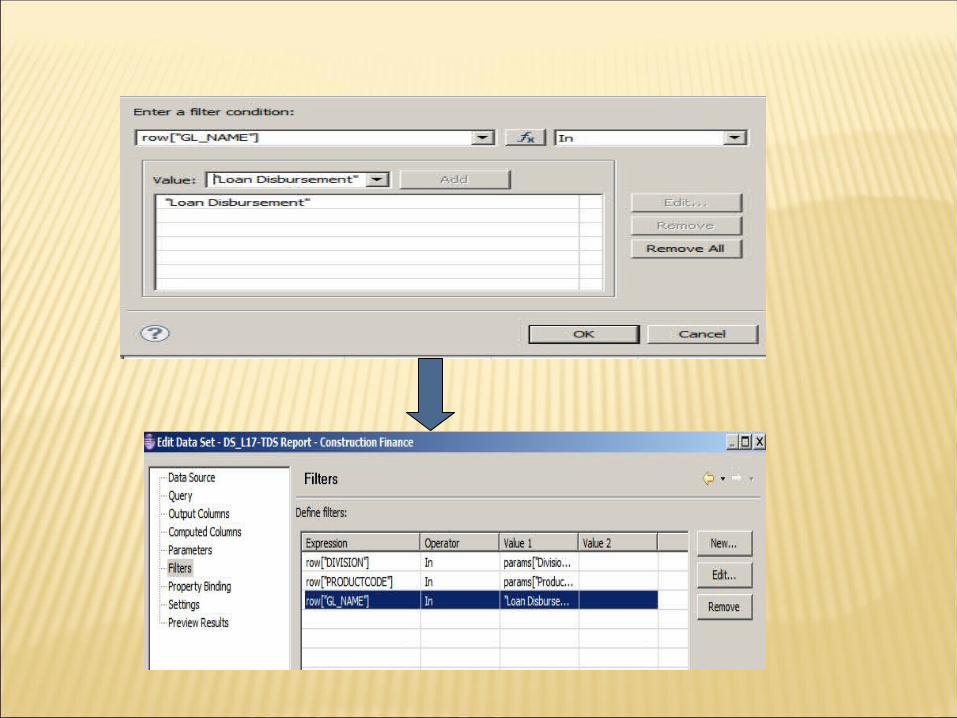
Adding Filters
Step 1:-Right Click data set select edit. In edit data set pane select Filters as shown in image.

Step 2:- Click New->Add column to be filtered->select operator->enter expression

Add Grand Total
For adding Total and grand totals we have to go through following steps:-
Step 1:- Palette->Quick tools->Drop Aggregation to Report.
The above will open the aggregation builder pane as shown below:-

Select Display Name
Select Data Type
Select Function
(SUM,AVG,COUNT)
Select Column on which sum have to be performed

Step 3:- Grand total will appear at the bottom of the table as shown below:

About report parameters
User-entered values that determine the data to display in the report, for example
- Sales in a particular region
- Sales over a certain amount
- Sales for a particular quarter
Report parameters support
- Designing a report once, and running it many times to display different data
- Managing large reports

Add ParameterStep 1:-In outline tab,under Report Parameter,right click add new
parameter.
Step 2:-Create new data set query for values in Parameter.
Step 3:-In new parameter pane set the properties of new parameter.
Step 4:-For values in parameter link the parameter query with parameter.
Step 5:-Link the new parameter with the main data set.
Step 6:-Define parameter with “?” or in filter tab of data set.

Adding Group
Step 1:-Select table,right click select insert group above/below.
Set the name for group
Set the name for group
Set the field on which
grouping has to be done
Set the field on which
grouping has to be done
Click okClick ok

Name:-Name of the group that we have to create.Group On:-The Fields on which the grouping has to done. It includes fields
from data setInterval:-It is basically used when we have to do grouping on date field.Sort Direction:-Defines the sorting order of the grouping filed.Page Break:-Is used when we have to display each group on different
page.Filters:-Used for defining filters for grouping field. For example,we have to
display only dept no 10 and 20 in our report so we will add filter here.Sorting:-On which field sorting have to be done.Table of Contents:-Contains the expression for the grouping field.

Step 2:-Image given below displays group.

Adding Computed Column
Step 1:-Open data set->edit->Computed Columns.
Step 2:-Select New computed column. New computed column pane will open as shown below:

Step 3:-Set the data type of new column.
Step 4:-Set the aggregation type of new column if any.

Step 5:-Set the expression for the new column in expression builder.
Step 6:-After the computed column is created we need to drop the computed column to report builder. The image below shows the computed columns.

BIRT includes page scripts that can be used in conjunction with new page variables to provide such features as individual group page numbering, first and last page contents, and page level aggregation.Variables are created using the Data Explorer view and can be one of two types: Page Variable :-Page Variables are evaluated at the time a page is written.Report Variable:-Report Variables are evaluated when the report is complete. Either type can be placed on the master page by selecting the Palette View and selecting the Variable Auto Text field.

In BIRT Report designer their are pre built variables that are used to display the page count,current date,ect as shown in the image below:-

Page:-Gives the page number.
Total page Count:-Displays total number of pages in a report..
Author # Page # Date #:-Displays created by,page number,Creation date.
Created on:-Displays the execution date time of the report.
File name:-Displays the report name.
There are other page variables that can run on any page event.

The default master page includes a text element. You can add elements to the master page by dragging them from the
palette and dropping them in the page footer or header.

Step 1:-In the layout editor, choose the Master Page tab. The layout editor displays the master page. The palette displays additional elements under Auto Text, specifically for use in the master page.
Step 2:-To display a single text element in the header or footer, drag the desired element from the palette, and drop it in the header or footer. For example, to display the page number, insert either the Page element or the Page n of m element.
Step 3:-To display multiple text elements in the header or footer:
a) Insert the grid element in the header or footer. Delete the date element from the default footer first.
b) On Insert Grid, specify the number of columns and rows for the grid. If, for example, you want to display two elements on the same line, specify 2 columns and 1 row


About charts
A chart is a graphical representation of summary data or the relationships among sets of data.
A chart displays data as category series and value series.
We can use different types of charts as shown below:-
Bar Chart Line Chart Pie Chart
GaugeArea Chart Bubble Chart

Adding Charts
Step 1:-Form palette tab drag and drop Chart to the report layout. This will open new chart wizard as shown below:-

Step 2:-The chart wizard will show the different chart types available as shown:-
Step 3:-After selection of chart click next and then we can set the data properties for the chart.

Step 4:-Select the data set for chart as shown below:-

Step 5:-Set the title of the chart as shown :-
Step 6:-Set the legend property of the chart as shown:-

Step 7:-Set all the properties of the chart and set it to the report window.
Using hyperlinks
Use hyperlinks provide the report user with access to additional information.
Hyperlinks can link:
-Two sections in a report.
-A section in a report to a section of a different report.
-A report to a web page or other external document.

Creating a hyperlink
In the source report, select the source report element. Property Editor displays the properties of the selected report element.
Step 1:-On Property Editor, under Properties, select Hyperlink. The hyperlink properties appear, as shown

Step 2:-Choose the edit button.
Step 3:-On Hyperlink Options, complete the following tasks:
- In Select hyperlink type, choose Drill-through. - In Select a target report, complete one of the following tasks:
Step 4:-Select Report Design then choose the Browse For File button and navigate to the target report design.
Step 5:-Select Report Document then choose the Browse For File button and navigate to the target report document.
Step 6:-If the target report has parameters, Report Parameters is enabled.

Step 7:-To set the value for a report parameter in the target report, perform the following steps:
- Select the field below the Parameters column heading.
- Select a parameter name from the drop-down list in this field.
- Select the field below the Required column heading. A check mark appears if the target report requires a value for this parameter.

Adding Cross tab
Step 1:-Drag cross tab from palette and drop in Report Editor.
Step 2 :-When we drop the column from data set it will open the data set cube screen,where we have to create group and summary fields as shown in image:-
Name of Cross Tab Data Set
Drop columns and Row
Group
Drop Measures

Step 3:-When we click finish we can see that data cube is created.
Step 4:-Once the data cube is created we need to drop the required fields to the cross tab structure.

Preview of Cross tab

Preview Report

Previewing and viewing the report
Step 1:-Use the Preview window to test the report format.
Step 2:-View a complete report in the following formats
- Adobe PDF
- HTML and XHTML
- Microsoft Excel, XLS
- Microsoft PowerPoint, both PPT and PPTX
- Microsoft Word, both DOC and DOCX
- Postscript
Step 3:-You can also view a report in the interactive report viewer
Step 4:-Select the field below the Values column heading.

Templates and Libraries In BIRT
You can add a report template making it available for others to create new reports based on the template. A BIRT report template that includes a pre-formatted report structure and layout to facilitate easy and expedient report designing.BIRT report developers select the template when building new content, then choose from a variety of pre-built components.Report developers are spared the tasks of report construction that may be complex or time consuming.
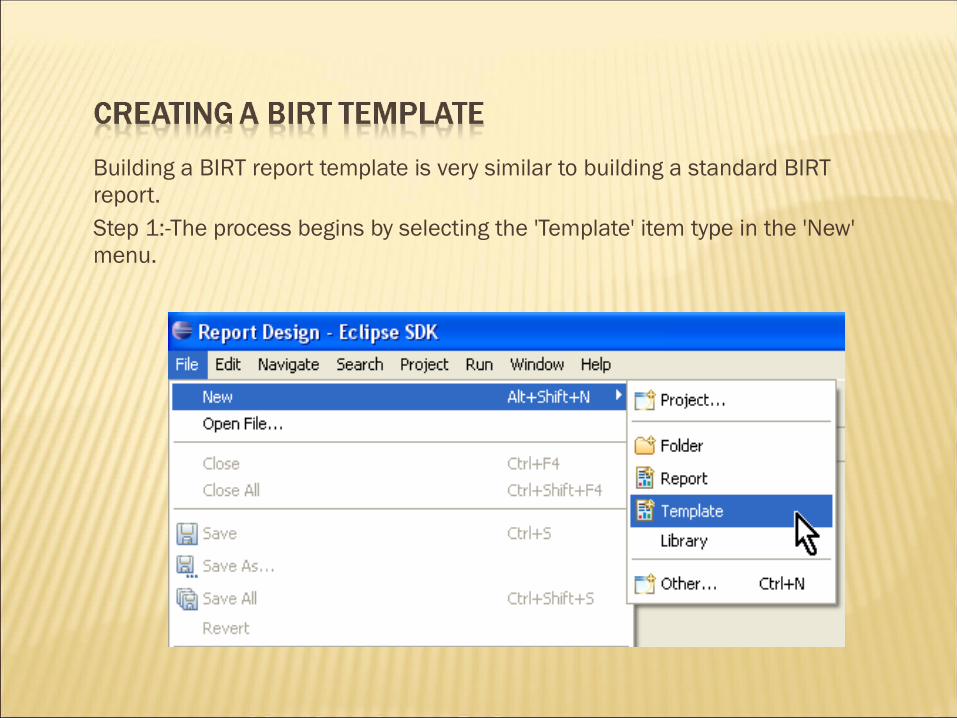
Building a BIRT report template is very similar to building a standard BIRT report. Step 1:-The process begins by selecting the 'Template' item type in the 'New' menu.
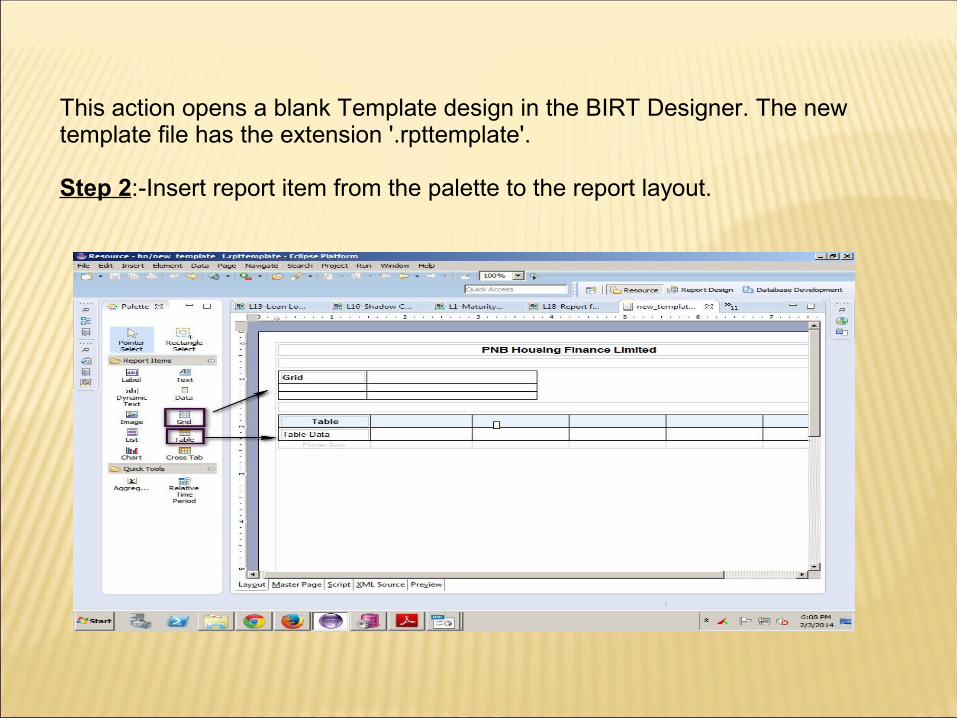
This action opens a blank Template design in the BIRT Designer. The new template file has the extension '.rpttemplate'.
Step 2:-Insert report item from the palette to the report layout.

For those elements in the template that can be edited or changed, descriptive prompts are added to guide the developer.
Step 3:-Right click report element and Create Template Report Item then adding a prompt phrase.

This is repeated for all elements that the template user can edit or change. Once complete, the template is then ready to be published for use.

The BIRT Designer now includes a Template Publishing Wizard that quickly deploys templates for use. It allows the template developer to specify what the user will be presented with when selecting the new template, such as a display name, description, and a sample image of the layout.

The publish location is configurable, and can be set from the BIRT Designer interface by clicking 'Window>Preferences>BIRT>Template'.
Add Template to custom template folder.

This presents the standard list of report templates, as well as the new template that was published

BIRT introduces the library feature. With this feature, commonly required functions and report items can be encapsulated within a library.These libraries can then be imported into any number of BIRT report designs and templates for reuse, significantly reducing design time. This is very useful in cases where business or technical changes would otherwise require report rework. For example, if library components such as corporate logos and database queries are used in a large number of report designs, then the database schema changes or the company logo is altered, only the library would require the change. All referencing reports would be automatically updated to reflect the change.

A new project item type is available for library creation in the BIRT Designer interface.Step 1:-The process begins by selecting the 'Library' item type in the 'New' menu.

Step 2:-Select the project in which the library have to be created and name the library,in our case it is Library sample.

Step 3: -This action opens a blank library design view in the BIRT Designer.

Step 4:-Next, open the 'Outline View' in the BIRT Designer, then add report components by right clicking over the 'Report Items' icon and selecting 'Insert'. The desired type of component is selected from the 'Insert Element' menu.

Step 5:-Components that can be added to a library include Data Sources and Sets, Report Parameters, Grids, Charts and Tables, Themes, and Images. All added components are displayed in the Outline View, where they can be accessed for further adjustment and visual fine tuning as required.

Next we will examine how a report developer can access, import, and use a library in their own design.Step 6:-To access the library, the developer opens the Library Explorer View in the BIRT Designer.

Step 8:-Next, the preferred library is opened in the Library Explorer View, and all desired components are dragged directly into the report design where appropriate. By dragging components to the design, the Library is automatically imported to the report design file.

All data connections, queries, and formatting are encapsulated in the library components, no further adjustments or settings are required for the chart.

When developing a BIRT report using the Eclipse workbench, you can write custom event handlers in either Java or JavaScript.
Whether you use Java or JavaScript, the set of event handlers that you can write is the same.
Two types of Scripting:-Expression Scripts - Scripts that return a data value. Available in the Expression Builder.Element Scripts – JavaScript methods that are called on events. Customize the behavior of the Report. Available in the Script view. Context of when the event occurs is important.

Use BIRT Report Designer to enter a JavaScript event handler(Element Scripting)
In Outline, select the report element, data source, or data set for which you want to write an event handler.Choose the Script tab.Choose an event handler from the drop-down list of methods.Enter the event handler code in the script editor.

Image below shows the expression scripting. Its the script written for formatting data.


Deploy the Web Viewer Example.
Deploy BIRT Under an RCP application.
Build your own Servlet using the BIRT Engine.
Use the BIRT Engine in your own Java Application.

Paginated HTML, PDF, TOC, Bookmarks, CSV
Eclipse Plugin
Web Viewer
ReportEngine
J2EE AS
Web Viewer
ReportEngine
J2EE AS
Custom Servlet
ReportEngineJava Application
ReportEngine
RptDocumentReport
Document
RptDocumentReport
Document
RptDocumentReport
Document
RptDesignXML
Design File
RptDesignXML
Design File
RptDesignXML
Design File

We can deploy the reports on Weblogic server.
First we have to create WAR file then we have to upload it on application. It gives the following URL:-
http://10.1.48.230:7001/birt/preview__report=SANCTIONED_MP1.rptdesign&__format=PDF¶m1=MME¶m2=5000
10.1.48.230 - Server IP7001 - Portbirt - context pathpreview - Servlet path (chk in Web.xml in side birt.war file for more info )_format - This is used to show report format other like HTML , DOC, RTF, XLS param1 - this is parameters to the report you can pass multiple parameters
