pocket tax guide
DESCRIPTION
Pocket Tax Guide of the Australian Government for 2012. We can see here resumed - the most important Australian tax categories.TRANSCRIPT

POCKET GUIDE TO THE AUSTRALIAN TAXATION SYSTEM
2012-13
Detailed information about taxation revenue can be found in the 2012-13 Mid-Year Economic and Fiscal Outlook (MYEFO). This guide includes information up to and including the 2012-13 MYEFO and the Tax Expenditures Statement 2011 (TES).
Australian Government financial statistics are reported on two accounting frameworks, both of which are used in this document. Part 1 uses accrual financial statistics as this is the accounting framework adopted by Organisation for Economic Co-operation and Development (OECD), whereas Part 2 uses cash financial statistics as this accounting framework provides for better historical analysis.
JANUARY 2013
ii
CONTENTS Part 1: Australia’s tax system compared with the OECD 1
Part 2: Australian Government taxes 6
Appendix A: Description of revenue heads 11
Appendix B: Classification of Australian Government taxes 19
Appendix C: Revenue and receipts history and forecasts 21
1
Part 1: Australia’s tax system compared with the OECD
The analysis in this section combines the tax systems of all levels of government — national, state and local — and compares Australia with the tax systems of other OECD economies using the accrual accounting framework.
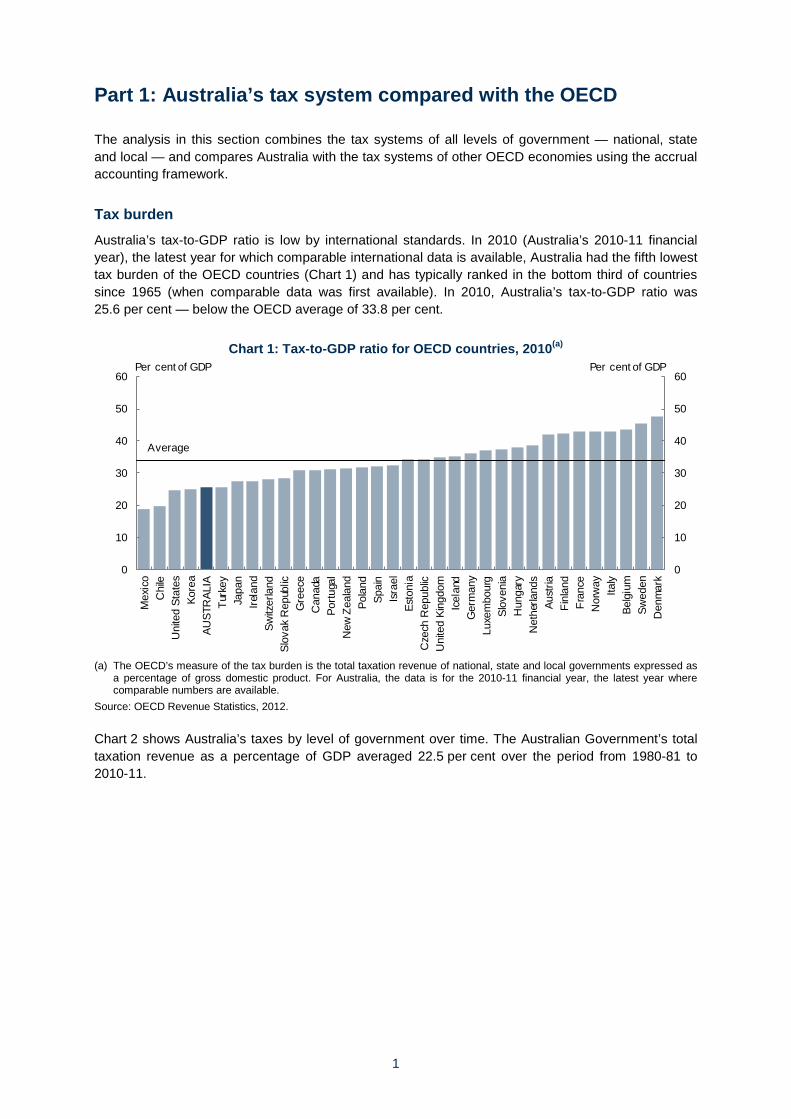
Tax burden Australia’s tax-to-GDP ratio is low by international standards. In 2010 (Australia’s 2010-11 financial year), the latest year for which comparable international data is available, Australia had the fifth lowest tax burden of the OECD countries (Chart 1) and has typically ranked in the bottom third of countries since 1965 (when comparable data was first available). In 2010, Australia’s tax-to-GDP ratio was 25.6 per cent — below the OECD average of 33.8 per cent.
Chart 1: Tax-to-GDP ratio for OECD countries, 2010(a)
0
10
20
30
40
50
60
0
10
20
30
40
50
60
Mex
ico
Chi
leU
nite
d St
ates
Kore
aAU
STR
ALIA
Turk
eyJa
pan
Irela
ndSw
itzer
land
Slov
ak R
epub
licG
reec
eC
anad
aPo
rtuga
lN
ew Z
eala
ndPo
land
Spai
nIs
rael
Esto
nia
Cze
ch R
epub
licU
nite
d Ki
ngdo
mIc
elan
dG
erm
any
Luxe
mbo
urg
Slov
enia
Hun
gary
Net
herla
nds
Aust
riaFi
nlan
dFr
ance
Nor
way
Italy
Belg
ium
Swed
enD
enm
ark
Per cent of GDPPer cent of GDP
Average
(a) The OECD’s measure of the tax burden is the total taxation revenue of national, state and local governments expressed as
a percentage of gross domestic product. For Australia, the data is for the 2010-11 financial year, the latest year where comparable numbers are available.
Source: OECD Revenue Statistics, 2012.
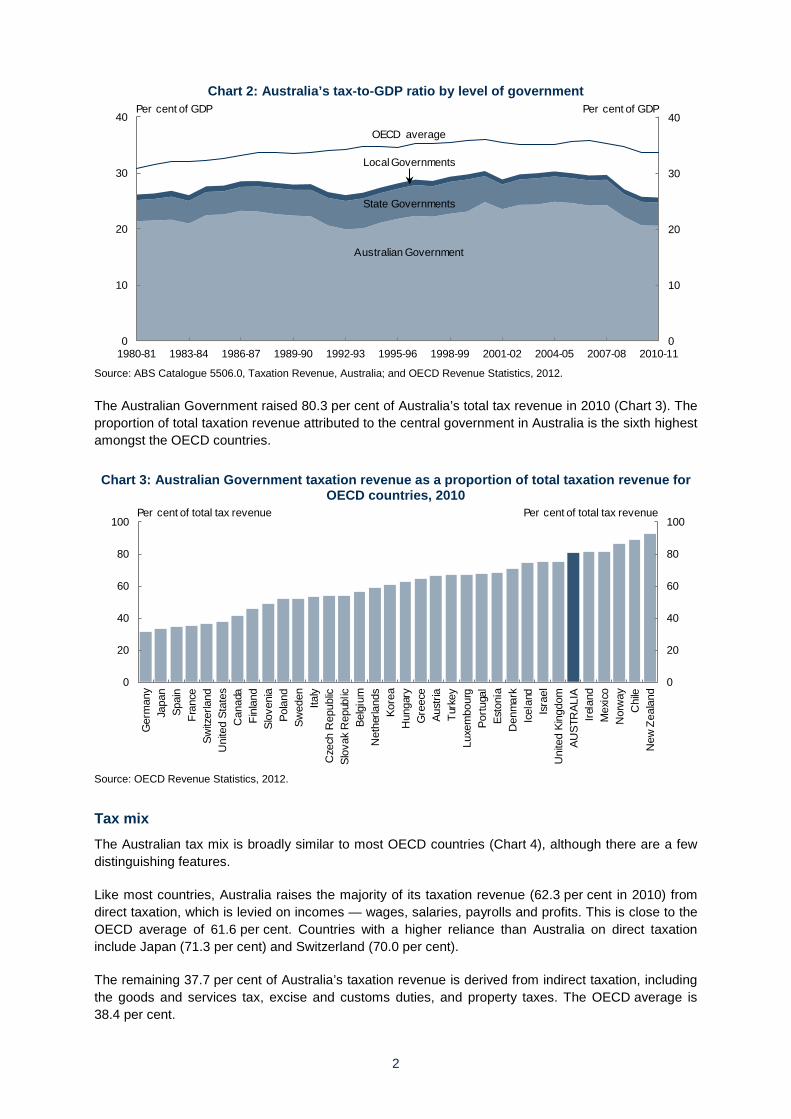
Chart 2 shows Australia’s taxes by level of government over time. The Australian Government’s total taxation revenue as a percentage of GDP averaged 22.5 per cent over the period from 1980-81 to 2010-11.
2
Chart 2: Australia’s tax-to-GDP ratio by level of government
0
10
20
30
40
0
10
20
30
40
1980-81 1983-84 1986-87 1989-90 1992-93 1995-96 1998-99 2001-02 2004-05 2007-08 2010-11
Per cent of GDPPer cent of GDP
Australian Government
Local Governments
State Governments
OECD average
Source: ABS Catalogue 5506.0, Taxation Revenue, Australia; and OECD Revenue Statistics, 2012.
The Australian Government raised 80.3 per cent of Australia’s total tax revenue in 2010 (Chart 3). The proportion of total taxation revenue attributed to the central government in Australia is the sixth highest amongst the OECD countries.
Chart 3: Australian Government taxation revenue as a proportion of total taxation revenue for OECD countries, 2010
0
20
40
60
80
100
0
20
40
60
80
100
Ger
man
yJa
pan
Spai
nFr
ance
Switz
erla
ndU
nite
d St
ates
Can
ada
Finl
and
Slov
enia
Pola
ndSw
eden
Italy
Cze
ch R
epub
licSl
ovak
Rep
ublic
Belg
ium
Net
herla
nds
Kore
aH
unga
ryG
reec
eAu
stria
Turk
eyLu
xem
bour
gPo
rtuga
lEs
toni
aD
enm
ark
Icel
and
Isra
elU
nite
d Ki
ngdo
mAU
STR
ALIA
Irela
ndM
exic
oN
orw
ayC
hile
New
Zea
land
Per cent of total tax revenue Per cent of total tax revenue
Source: OECD Revenue Statistics, 2012.
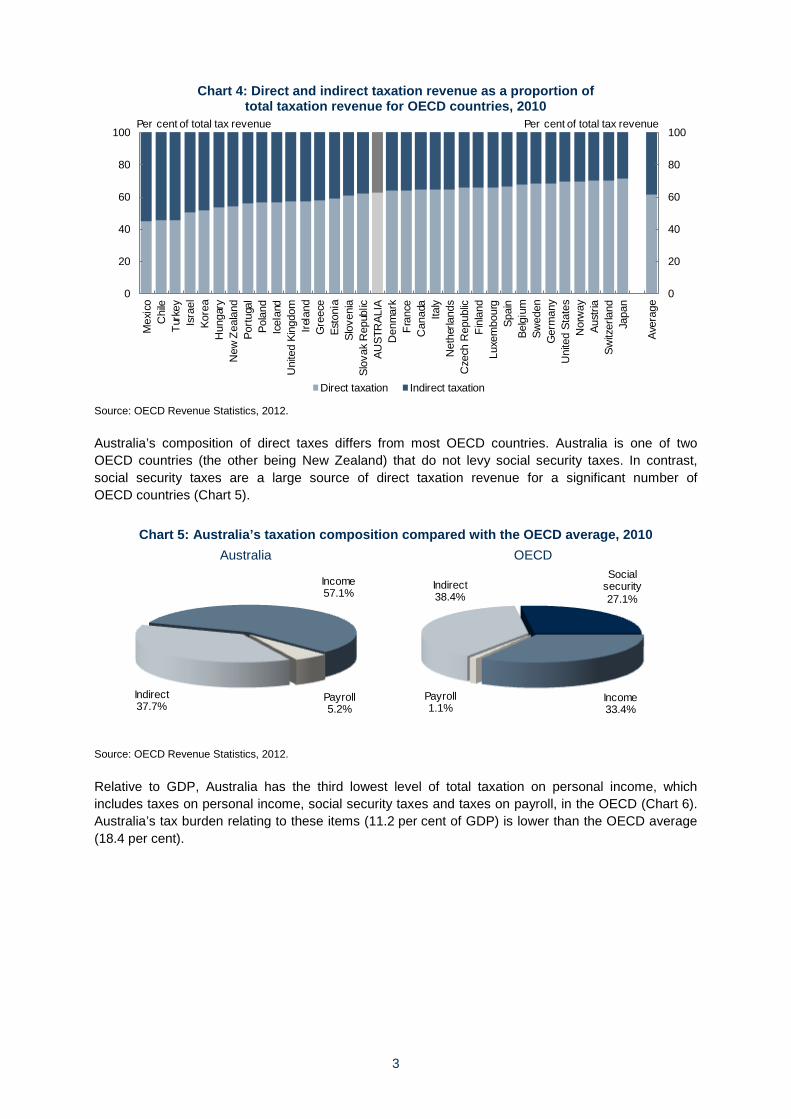
Tax mix The Australian tax mix is broadly similar to most OECD countries (Chart 4), although there are a few distinguishing features.
Like most countries, Australia raises the majority of its taxation revenue (62.3 per cent in 2010) from direct taxation, which is levied on incomes — wages, salaries, payrolls and profits. This is close to the OECD average of 61.6 per cent. Countries with a higher reliance than Australia on direct taxation include Japan (71.3 per cent) and Switzerland (70.0 per cent).
The remaining 37.7 per cent of Australia’s taxation revenue is derived from indirect taxation, including the goods and services tax, excise and customs duties, and property taxes. The OECD average is 38.4 per cent.
3
Chart 4: Direct and indirect taxation revenue as a proportion of total taxation revenue for OECD countries, 2010
0
20
40
60
80
100
0
20
40
60
80
100M
exic
oC
hile
Turk
eyIs
rael
Kore
aH
unga
ryN
ew Z
eala
ndPo
rtuga
lPo
land
Icel
and
Uni
ted
King
dom
Irela
ndG
reec
eEs
toni
aSl
oven
iaSl
ovak
Rep
ublic
AUST
RAL
IAD
enm
ark
Fran
ceC
anad
aIta
lyN
ethe
rland
sC
zech
Rep
ublic
Finl
and
Luxe
mbo
urg
Spai
nBe
lgiu
mSw
eden
Ger
man
yU
nite
d St
ates
Nor
way
Aust
riaSw
itzer
land
Japa
n
Aver
age
Direct taxation Indirect taxation
Per cent of total tax revenue Per cent of total tax revenue
Source: OECD Revenue Statistics, 2012.
Australia’s composition of direct taxes differs from most OECD countries. Australia is one of two OECD countries (the other being New Zealand) that do not levy social security taxes. In contrast, social security taxes are a large source of direct taxation revenue for a significant number of OECD countries (Chart 5).
Chart 5: Australia’s taxation composition compared with the OECD average, 2010 Australia OECD
Indirect 37.7%
Payroll 5.2%
Income 57.1%
Income 33.4%
Payroll 1.1%
Indirect 38.4%
Socialsecurity27.1%
Source: OECD Revenue Statistics, 2012.
Relative to GDP, Australia has the third lowest level of total taxation on personal income, which includes taxes on personal income, social security taxes and taxes on payroll, in the OECD (Chart 6). Australia’s tax burden relating to these items (11.2 per cent of GDP) is lower than the OECD average (18.4 per cent).

4
Chart 6: Components of direct taxation in respect of individuals and payrolls, 2010(a)
0
5
10
15
20
25
30
35
0
5
10
15
20
25
30
35
Kore
aTu
rkey
AUST
RAL
IAN
ew Z
eala
ndIs
rael
Irela
ndU
nite
d St
ates
Portu
gal
Slov
ak R
epub
licG
reec
eSw
itzer
land
Pola
ndC
anad
aJa
pan
Uni
ted
King
dom
Icel
and
Esto
nia
Luxe
mbo
urg
Cze
ch R
epub
licH
unga
rySp
ain
Nor
way
Slov
enia
Net
herla
nds
Ger
man
yIta
lyFr
ance
Finl
and
Den
mar
kBe
lgiu
mAu
stria
Swed
en
Aver
age
Individuals' income tax Social security taxes Payroll tax
Average
Per cent of GDP Per cent of GDP
(a) Chile and Mexico have not been included due to incomplete data. This affects the average OECD figure. Source: OECD Revenue Statistics, 2012.
Most indirect taxation in OECD countries is generated through various taxes on goods and services. Australia has the fourth lowest level for goods and services taxes and total indirect taxation in the OECD (Chart 7). Australia’s indirect tax burden relating to these items is 9.7 per cent of GDP which is significantly lower than the OECD average of 12.9 per cent.
Chart 7: Components of indirect taxation, 2010
0
5
10
15
20
0
5
10
15
20
Uni
ted
Stat
esJa
pan
Switz
erla
ndAU
STR
ALIA
Mex
ico
Chi
leSl
ovak
Rep
ublic
Spai
nC
anad
aG
erm
any
Irela
ndC
zech
Rep
ublic
Kore
aAu
stria
Luxe
mbo
urg
Gre
ece
Nor
way
Net
herla
nds
Portu
gal
Pola
ndTu
rkey
Esto
nia
Belg
ium
Swed
enSl
oven
iaFi
nlan
dN
ew Z
eala
ndU
nite
d Ki
ngdo
mIta
lyIc
elan
dFr
ance
Isra
elD
enm
ark
Hun
gary
Aver
age
Goods & services Taxes on property Other
Average
Per cent of GDPPer cent of GDP
Source: OECD Revenue Statistics, 2012.
Note: The OECD Revenue Statistics publication bundles other indirect taxes such as excise, customs and sales taxes into their label for ‘goods and services taxes’ — this terminology should not be confused with the ‘goods and services tax’ as reported in the Australian Government budget papers, which does not incorporate any additional indirect taxes.
5
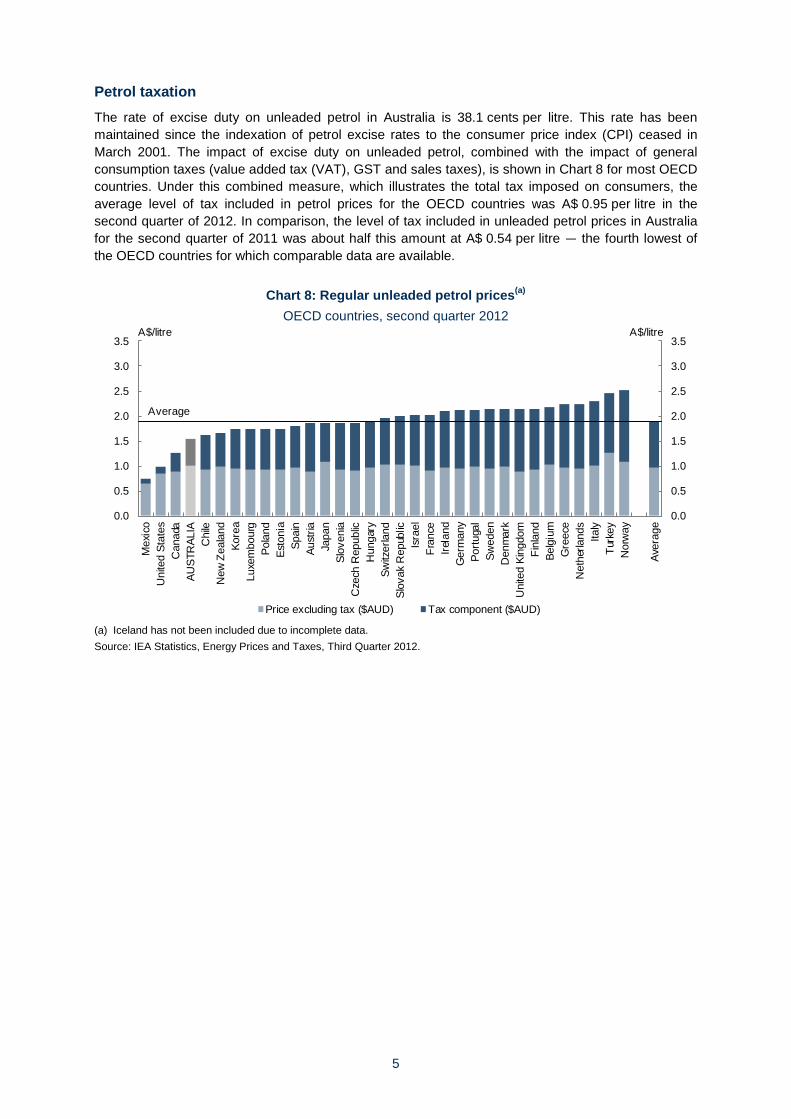
Petrol taxation The rate of excise duty on unleaded petrol in Australia is 38.1 cents per litre. This rate has been maintained since the indexation of petrol excise rates to the consumer price index (CPI) ceased in March 2001. The impact of excise duty on unleaded petrol, combined with the impact of general consumption taxes (value added tax (VAT), GST and sales taxes), is shown in Chart 8 for most OECD countries. Under this combined measure, which illustrates the total tax imposed on consumers, the average level of tax included in petrol prices for the OECD countries was A$ 0.95 per litre in the second quarter of 2012. In comparison, the level of tax included in unleaded petrol prices in Australia for the second quarter of 2011 was about half this amount at A$ 0.54 per litre — the fourth lowest of the OECD countries for which comparable data are available.
Chart 8: Regular unleaded petrol prices(a) OECD countries, second quarter 2012
0.0
0.5
1.0
1.5
2.0
2.5
3.0
3.5
0.0
0.5
1.0
1.5
2.0
2.5
3.0
3.5
Mex
ico
Uni
ted
Stat
esC
anad
aAU
STR
ALIA
Chi
leN
ew Z
eala
ndKo
rea
Luxe
mbo
urg
Pola
ndEs
toni
aSp
ain
Aust
riaJa
pan
Slov
enia
Cze
ch R
epub
licH
unga
rySw
itzer
land
Slov
ak R
epub
licIs
rael
Fran
ceIre
land
Ger
man
yPo
rtuga
lSw
eden
Den
mar
kU
nite
d Ki
ngdo
mFi
nlan
dBe
lgiu
mG
reec
eN
ethe
rland
sIta
lyTu
rkey
Nor
way
Aver
age
Price excluding tax ($AUD) Tax component ($AUD)
Average
A$/litre A$/litre
(a) Iceland has not been included due to incomplete data. Source: IEA Statistics, Energy Prices and Taxes, Third Quarter 2012.
6
Part 2: Australian Government taxes
The analysis in Part 1 combined the tax systems of all levels of government and used the accrual accounting framework. This section focuses on Australian Government taxes — that is, it excludes taxes imposed by state and local governments — and uses the cash accounting framework.
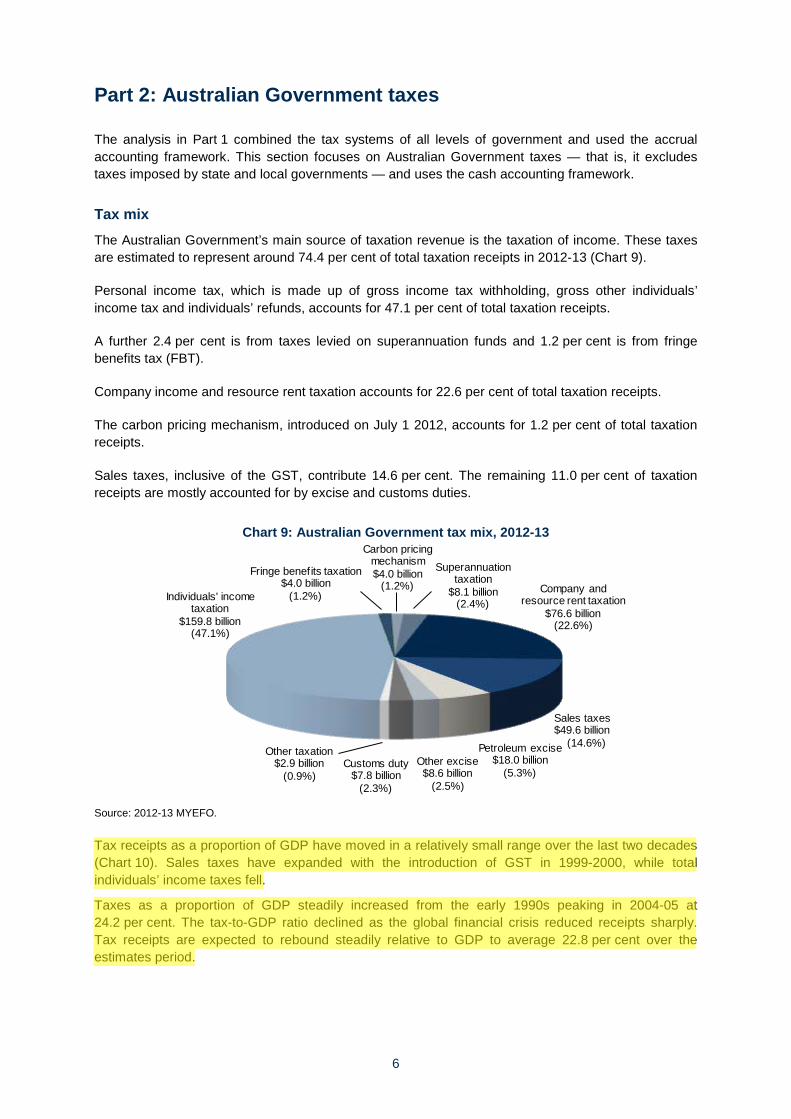
Tax mix The Australian Government’s main source of taxation revenue is the taxation of income. These taxes are estimated to represent around 74.4 per cent of total taxation receipts in 2012-13 (Chart 9).
Personal income tax, which is made up of gross income tax withholding, gross other individuals’ income tax and individuals’ refunds, accounts for 47.1 per cent of total taxation receipts.
A further 2.4 per cent is from taxes levied on superannuation funds and 1.2 per cent is from fringe benefits tax (FBT).
Company income and resource rent taxation accounts for 22.6 per cent of total taxation receipts.
The carbon pricing mechanism, introduced on July 1 2012, accounts for 1.2 per cent of total taxation receipts.
Sales taxes, inclusive of the GST, contribute 14.6 per cent. The remaining 11.0 per cent of taxation receipts are mostly accounted for by excise and customs duties.
Chart 9: Australian Government tax mix, 2012-13
Fringe benefits taxation$4.0 billion
(1.2%)
Superannuation taxation
$8.1 billion(2.4%)
Company and resource rent taxation
$76.6 billion(22.6%)
Sales taxes$49.6 billion
(14.6%)Petroleum excise $18.0 billion
(5.3%)Other excise$8.6 billion
(2.5%)
Other taxation$2.9 billion
(0.9%)Customs duty
$7.8 billion(2.3%)
Individuals' income taxation
$159.8 billion(47.1%)
Carbon pricing mechanism$4.0 billion
(1.2%)
Source: 2012-13 MYEFO.
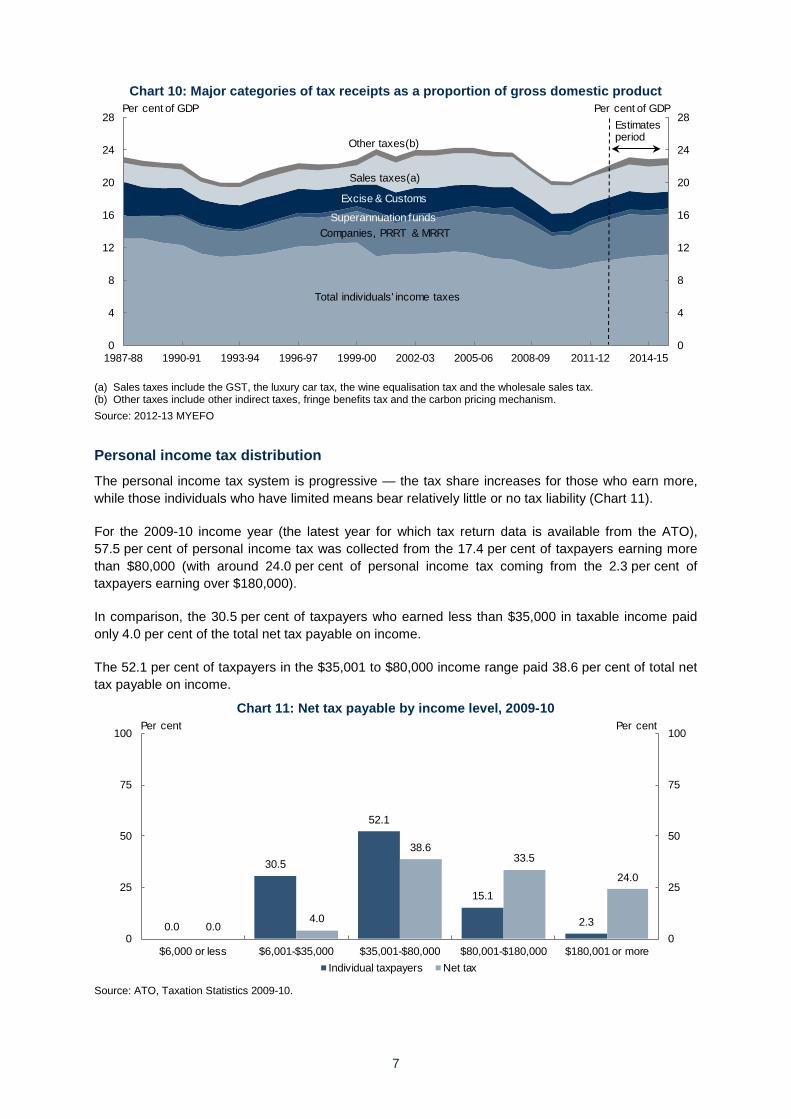
Tax receipts as a proportion of GDP have moved in a relatively small range over the last two decades (Chart 10). Sales taxes have expanded with the introduction of GST in 1999-2000, while total individuals’ income taxes fell.
Taxes as a proportion of GDP steadily increased from the early 1990s peaking in 2004-05 at 24.2 per cent. The tax-to-GDP ratio declined as the global financial crisis reduced receipts sharply. Tax receipts are expected to rebound steadily relative to GDP to average 22.8 per cent over the estimates period.
7
Chart 10: Major categories of tax receipts as a proportion of gross domestic product
0
4
8
12
16
20
24
28
0
4
8
12
16
20
24
28
1987-88 1990-91 1993-94 1996-97 1999-00 2002-03 2005-06 2008-09 2011-12 2014-15
Total individuals' income taxes
Companies, PRRT & MRRTSuperannuation funds
Excise & Customs
Other taxes(b)
Sales taxes(a)
Per cent of GDP Per cent of GDPEstimates period
(a) Sales taxes include the GST, the luxury car tax, the wine equalisation tax and the wholesale sales tax. (b) Other taxes include other indirect taxes, fringe benefits tax and the carbon pricing mechanism. Source: 2012-13 MYEFO
Personal income tax distribution The personal income tax system is progressive — the tax share increases for those who earn more, while those individuals who have limited means bear relatively little or no tax liability (Chart 11).
For the 2009-10 income year (the latest year for which tax return data is available from the ATO), 57.5 per cent of personal income tax was collected from the 17.4 per cent of taxpayers earning more than $80,000 (with around 24.0 per cent of personal income tax coming from the 2.3 per cent of taxpayers earning over $180,000).
In comparison, the 30.5 per cent of taxpayers who earned less than $35,000 in taxable income paid only 4.0 per cent of the total net tax payable on income.
The 52.1 per cent of taxpayers in the $35,001 to $80,000 income range paid 38.6 per cent of total net tax payable on income.
Chart 11: Net tax payable by income level, 2009-10
0.0
30.5
52.1
15.1
2.30.04.0
38.633.5
24.0
0
25
50
75
100
0
25
50
75
100
$6,000 or less $6,001-$35,000 $35,001-$80,000 $80,001-$180,000 $180,001 or moreIndividual taxpayers Net tax
Per cent Per cent
Source: ATO, Taxation Statistics 2009-10.

8
Company income tax distribution Most company income tax is paid by a relatively small group of large companies (Chart 12). For the 2009-10 income year, 63.9 per cent of company income tax was collected from the 0.5 per cent of incorporated taxpayers that earned more than $100 million in total income.
Chart 12: Net tax payable by company income size, 2009-10
0.1
85.3
11.03.1 0.2 0.20.1
11.5 10.114.4
5.7
58.2
0
25
50
75
100
0
25
50
75
100
Loss/nil $1 to $2m $2m to $10m $10m to $100m $100m to $250m Above $250mCompany taxpayers Net tax
Per cent Per cent
Source: ATO, Taxation Statistics 2009-10.
Indirect taxes The share of indirect taxes in total receipts exhibits a long-term declining trend (Chart 13) as some of the indirect tax bases do not grow as quickly as the income tax bases. Policy decisions taken by governments, such as trade liberalisation and removal of indexation on petroleum excises, have accelerated this trend.
However, with the introduction of the GST in July 2000, the share of indirect taxes in total tax receipts increased from 22.9 per cent in 1999-2000 to 29.9 per cent in 2000-01. In addition, decisions to increase the luxury car tax and to remove the crude oil excise exemption on condensate production increased indirect tax receipts from 2008-09. The carbon pricing mechanism, effective from 1 July 2012, is expected to increase indirect taxes by 1.2 per cent of total tax receipts in 2012-13.
Chart 13: Australian Government indirect taxes
0
5
10
15
20
25
30
35
0
5
10
15
20
25
30
35
1990-91 1993-94 1996-97 1999-00 2002-03 2005-06 2008-09 2011-12 2014-15
Per cent of total tax receipts Per cent of total tax receipts
Other excise
Customs duty
Sales taxes(a)
Other taxes
Petroleum excise
Estimates period
Carbonpricing
mechanism
(a) Sales taxes comprise the GST, the luxury car tax, the wine equalisation tax and the wholesale sales tax. Source: 2012-13 MYEFO.
9
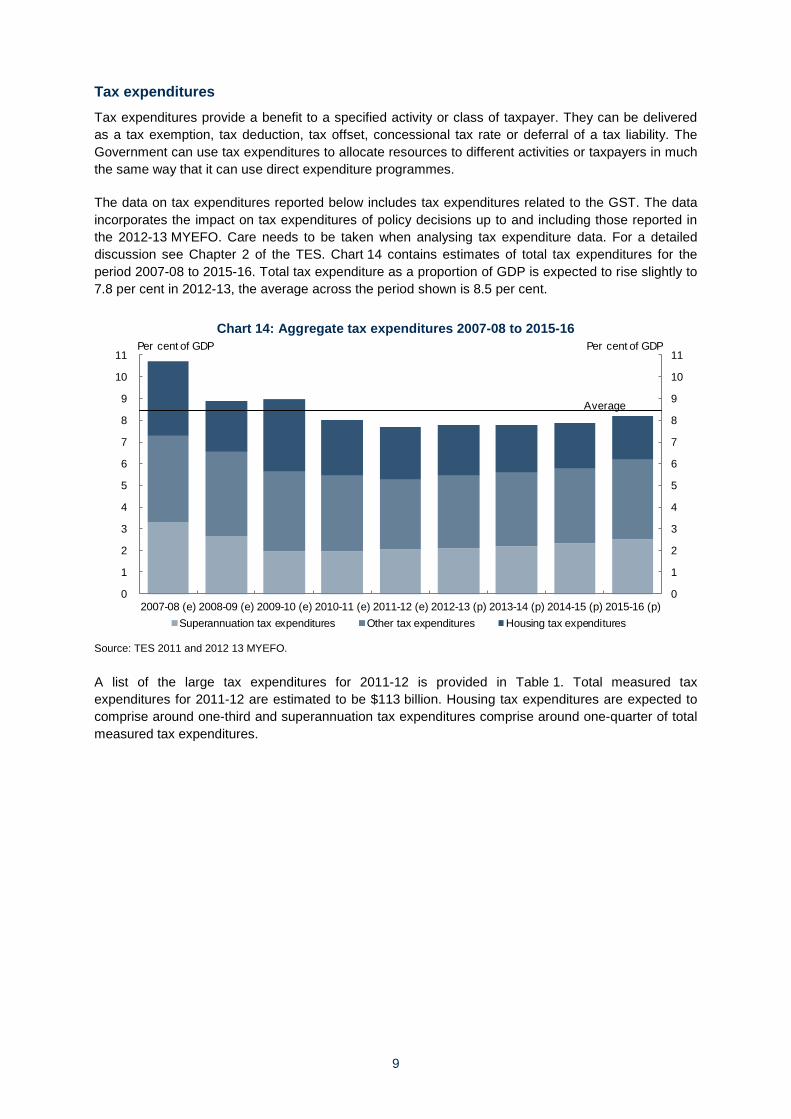
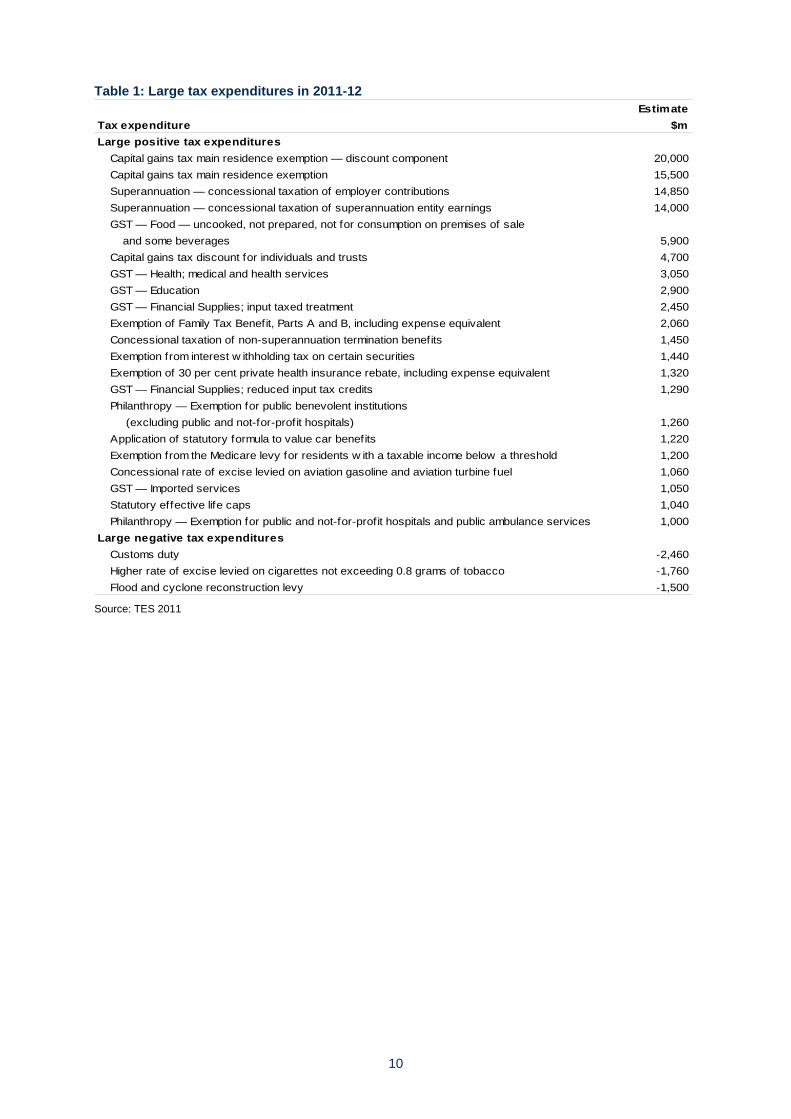
Tax expenditures Tax expenditures provide a benefit to a specified activity or class of taxpayer. They can be delivered as a tax exemption, tax deduction, tax offset, concessional tax rate or deferral of a tax liability. The Government can use tax expenditures to allocate resources to different activities or taxpayers in much the same way that it can use direct expenditure programmes.
The data on tax expenditures reported below includes tax expenditures related to the GST. The data incorporates the impact on tax expenditures of policy decisions up to and including those reported in the 2012-13 MYEFO. Care needs to be taken when analysing tax expenditure data. For a detailed discussion see Chapter 2 of the TES. Chart 14 contains estimates of total tax expenditures for the period 2007-08 to 2015-16. Total tax expenditure as a proportion of GDP is expected to rise slightly to 7.8 per cent in 2012-13, the average across the period shown is 8.5 per cent.
Chart 14: Aggregate tax expenditures 2007-08 to 2015-16
0
1
2
3
4
5
6
7
8
9
10
11
0
1
2
3
4
5
6
7
8
9
10
11
2007-08 (e) 2008-09 (e) 2009-10 (e) 2010-11 (e) 2011-12 (e) 2012-13 (p) 2013-14 (p) 2014-15 (p) 2015-16 (p)Superannuation tax expenditures Other tax expenditures Housing tax expenditures
Per cent of GDP Per cent of GDP
Average
Source: TES 2011 and 2012 13 MYEFO. A list of the large tax expenditures for 2011-12 is provided in Table 1. Total measured tax expenditures for 2011-12 are estimated to be $113 billion. Housing tax expenditures are expected to comprise around one-third and superannuation tax expenditures comprise around one-quarter of total measured tax expenditures.
10
Table 1: Large tax expenditures in 2011-12 Estimate
Tax expenditure $mLarge positive tax expenditures
Capital gains tax main residence exemption — discount component 20,000Capital gains tax main residence exemption 15,500Superannuation — concessional taxation of employer contributions 14,850Superannuation — concessional taxation of superannuation entity earnings 14,000GST — Food — uncooked, not prepared, not for consumption on premises of sale
and some beverages 5,900Capital gains tax discount for individuals and trusts 4,700GST — Health; medical and health services 3,050GST — Education 2,900GST — Financial Supplies; input taxed treatment 2,450Exemption of Family Tax Benefit, Parts A and B, including expense equivalent 2,060Concessional taxation of non-superannuation termination benefits 1,450Exemption from interest w ithholding tax on certain securities 1,440Exemption of 30 per cent private health insurance rebate, including expense equivalent 1,320GST — Financial Supplies; reduced input tax credits 1,290Philanthropy — Exemption for public benevolent institutions
(excluding public and not-for-profit hospitals) 1,260Application of statutory formula to value car benefits 1,220Exemption from the Medicare levy for residents w ith a taxable income below a threshold 1,200Concessional rate of excise levied on aviation gasoline and aviation turbine fuel 1,060GST — Imported services 1,050Statutory effective life caps 1,040Philanthropy — Exemption for public and not-for-profit hospitals and public ambulance services 1,000
Large negative tax expendituresCustoms duty -2,460Higher rate of excise levied on cigarettes not exceeding 0.8 grams of tobacco -1,760Flood and cyclone reconstruction levy -1,500
Source: TES 2011
11
APPENDIX A: DESCRIPTION OF REVENUE HEADS
INCOME TAXATION
1. Individuals and other withholding taxation These revenue heads broadly cover all personal income tax. A schedule of the legislated personal income tax rates from 1 July 2010 is provided in Table 2.
As part of the introduction of a carbon pricing mechanism (CPM), significant changes have been made to the personal income tax rates and thresholds, including more than trebling the tax free threshold from $6,000 to $18,200. These changes were made effective on 1 July 2012.
1.1. Gross income tax withholding (ITW)
The bulk of ITW revenue arises from the pay-as-you-go (PAYG) withholding system, under which taxes are withheld from wage and salary income.
ITW also includes all other withholding taxes levied on natural resource payments, dividends, interest and royalties paid to non-residents, payments to Australian indigenous groups for the use of land for mineral exploration and mining, and amounts withheld because no tax file number or Australian business number (ABN) was quoted — these taxes are often withheld from companies, rather than individuals. It also includes applicable Medicare levy revenue.
1.2. Gross other individuals’ income tax
Gross revenue from other individuals consists of income tax paid by individuals other than that collected through the PAYG withholding system, and includes applicable Medicare levy revenue. It comprises:
• PAYG instalments paid directly by individuals — that is, not withheld by employers; and
• debit assessments on income tax returns lodged after the end of each financial year (which arise when tax credits are insufficient to meet the final tax liability, requiring taxpayers to make an additional payment for the difference).
Taxpayers in this category derive their income from many sources, including:
• profits from small unincorporated businesses, primary production and investment activities;
• wages and salaries (when PAYG withholding credits are insufficient to meet the tax liability on assessment); and
• capital gains.
Most revenue from other individuals is collected directly from the taxpayer through the PAYG instalment system. Individuals with annual tax liabilities of $8,000 or more and individuals who are registered for the GST will generally make quarterly payments. Individuals who have annual taxation liabilities of less than $8,000 and are not registered for the GST have the choice of making quarterly payments or an annual payment.
1.3. Income tax refunds for individuals
A final assessment of the income tax liabilities of individual taxpayers is normally made on the basis of returns lodged after the end of each financial year. Refunds from the Australian Tax Office (ATO) are made where tax credits to an individual exceed their final liability on assessment.
12
1.4. Medicare levy
The amount of Medicare levy paid is based on an individual’s taxable income and is normally calculated at 1.5 per cent of taxable income, but this rate may vary depending on circumstances. An individual may be exempt from the levy or may pay a reduced levy if the taxpayer has a low income.
Individuals and families on higher incomes who do not have an appropriate level of private health insurance may also have to pay the Medicare levy surcharge, which is currently calculated at an additional 1.0 per cent of taxable income. Effective from 1 July 2010, surcharge rates of 1.0, 1.25 and 1.5 per cent are tiered across three bands of income, with the surcharge rate increasing with income.
1.5. Low income tax offset (LITO)
The LITO provides targeted tax relief to low and middle income earners. Effective from 1 July 2012, the LITO decreased from $1,500 to $445 as part of the introduction of a CPM. The LITO is withdrawn at 1.5 cents for each additional dollar earned above the income level of $37,000. LITO recipients receive a small amount of the benefits of the LITO through their regular pay, with the remainder claimable when their income tax return is assessed.
Because of changes to the tax free threshold as part of the introduction of a CPM, those eligible for the full LITO will not pay tax after assessment until their annual income exceeds at least $20,542, up from an effective tax-free threshold of $16,000 in 2011-12.
1.6. Fringe benefits tax (FBT)
FBT is payable by employers on the value of certain non-cash benefits that have generally been provided to their employees. The intent of the FBT is to improve the fairness of the tax system, by ensuring that tax cannot be avoided by paying employees in benefits rather than cash. The employer is liable to pay FBT. Since 1 April 2006, FBT has been levied at 46.5 per cent of the grossed-up taxable value of benefits (which includes any right, privilege, service or facility provided in respect of employment), as calculated under FBT rules.
2. Taxation on superannuation funds These taxes cover all income taxes generally paid by superannuation funds on behalf of their members on their contributions and earnings. Complying funds are currently subject to a 15 per cent tax rate while non-complying funds pay a 45 per cent tax rate. The concessional taxation treatment of superannuation is designed to encourage superannuation saving for retirement. Contributions made to a superannuation fund, and the earnings on those contributions, are taxed through the PAYG instalment system.
Superannuation funds are taxed generally at a concessional rate of 15 per cent in relation to taxable contributions received, realised capital gains and investment income. Only two-thirds of a capital gain is included in assessable income if the asset is held for at least 12 months.
Life insurers and retirement savings account (RSA) providers also provide superannuation products. Tax on superannuation related contributions, realised capital gains and investment income in life insurers and RSA providers is levied at the same rates as applies to superannuation funds but is paid through the company income tax system.

13
Table 2: Personal income tax rates(a)
Taxable income Per cent Taxable income Per cent Taxable income Per cent Taxable income Per cent
Residents $0–$6,000 Nil $0–$6,000 Nil $0–$18,200 Nil $0–$18,200 Nil$6,001–$37,000 15 $6,001–$37,000 15 $18,201–$37,000 19 $18,201–$37,000 19$37,001–$80,000 30 $37,001–$80,000 30 $37,001–$80,000 32.5 $37,001–$80,000 32.5$80,001–$180,000 37 $80,001–$180,000 37 $80,001–$180,000 37 $80,001–$180,000 37> $180,000 45 > $180,000 45 > $180,000 45 > $180,000 45
Non-residents $0–$37,000 29 $0–$37,000 29$37,001–$80,000 30 $37,001–$80,000 30 $0–$80,000 32.5 $0–$80,000 32.5$80,001–$180,000 37 $80,001–$180,000 37 $80,001–$180,000 37 $80,001–$180,000 37> $180,000 45 > $180,000 45 > $180,000 45 > $180,000 45
Medicare levy(b) $0–$18,839 Nil $0–$19,404 Nil $0–$20,542 Nil $0–$20,542 Nil(for singles) $18,840-$22,163 10% of > $19,405-$22,828 10% of > $20,543-$24,167 10% of > $20,543-$24,167 10% of >
$18,839 $19,404 $20,542 $20,542> $22,163 1.5 > $22,828 1.5 > $24,167 1.5 > $24,167 1.5
Amount Amount Amount AmountLow Income $0-$30,000 $1,500 $0-$30,000 $1,500 $0-$37,000 $445 $0-$37,000 $445Tax Offset $30,001-$67,500 less 4% $30,001-$67,500 less 4% $37,001-$66,666 less 1.5% $37,001-$66,666 less 1.5%
of > of > of > of > $30,000 $30,000 $37,000 $37,000
> $67,500 Nil > $67,500 Nil > $66,666 Nil > $66,666 Nil
From 1 July 2010 From 1 July 2013From 1 July 2012From 1 July 2011
(a) This table includes legislated changes to tax rates and thresholds, excluding temporary changes such as the Temporary Flood and Cyclone Reconstruction Levy in 2011-12. Source: 2012-13 Budget.
14
3. Company and other related income taxation These revenue heads broadly cover all income taxes paid by corporate type entities.
3.1. Company income taxation
Company income taxation is levied at a rate of 30 per cent on all taxable income earned by companies, including incorporated and unincorporated associations, limited partnerships and some corporate unit trusts and public trading trusts. Special tax rates apply to pooled development funds and to certain classes of taxable income of life insurance companies, credit unions, non-profit companies and retirement savings account providers.
Generally, every resident company that derives assessable income (including capital gains), whether sourced within or outside of Australia, and every non-resident company that derives assessable income from Australian sources is required to pay company tax.
Company income tax serves two primary purposes.
• In respect of that portion of company profits attributable to resident shareholders, company income tax is a withholding tax. Resident shareholders declare the dividends they receive from the company in their personal taxable income, they receive a credit for tax paid by the company and they can use the credit to offset their personal income tax liability.
• In respect of that portion of company profits attributable to non-resident shareholders, company income tax may be the final taxing point. Credits for tax paid by the company may not be available for use by non-residents.
3.2. Resource rent taxes
Petroleum resource rent tax (PRRT) is levied at a rate of 40 per cent on taxable profit in respect of offshore petroleum projects other than some of the North-West Shelf production areas, which are subject to excise (included in excise on petroleum and other fuel products) and royalties. The amount paid is deductible from a company’s taxable income when determining its company tax liability. The tax aims to ensure an equitable return accrues to the community for access to Australia’s non-renewable petroleum resources and to provide a fiscal regime that encourages the exploration and production of petroleum by taxing only after a threshold rate of return is reached.
The Australian Government has introduced a Minerals Resource Rent Tax (MRRT) on the profits derived from new and existing iron ore and coal projects. The MRRT, effective from 1 July 2012, is levied at 30 per cent on taxable profit for mining projects that exceed $75 million per annum. This reform ensures that the Australian people will receive a better return from the exploitation of its non-renewable resources.
INDIRECT TAXES
1. Carbon pricing mechanism (CPM) The Australian Government introduced a CPM on polluters who emit more than 25,000 tonnes of CO2-equivalent a year, effective from 1 July 2012. From 1 July 2012 the CPM has involved a fixed price starting at $23 per tonne of CO2-equivalent emissions, rising by 2.5 per cent each year in real terms.
From 1 July 2015, a floating market-based Emission Trading Scheme (ETS) will commence whereby the Government will set a cap on emissions, and the market will determine the price of permits. During the first three years of the scheme, until 30 June 2018, there will be a transitional price ceiling to
15
manage price volatility. The price ceiling for 2015-16 will be set at $20 above the expected international carbon price, rising by 5 per cent each year in real terms in 2016-17 and 2017-18.
2. Sales taxes 2.1. Goods and services tax (GST)
The GST is a broad-based, indirect tax levied at a rate of 10 per cent on most goods and services consumed in Australia. The GST is estimated to be levied on around 56 per cent of total household consumption with key exclusions being basic food items, health care, child care, rent and education. Exports are not consumed in Australia and therefore are exempt from the GST.
In accordance with the Intergovernmental Agreement on Federal Financial Relations, the Australian Government administers the GST on behalf of the States and Territories, which receive GST revenues.
2.2. Wine equalisation tax (WET)
All wines, meads, perries, ciders and sakes are subject to WET. Unlike alcohol excises, WET is an ad valorem tax. It is calculated at a rate of 29 per cent of the final wholesale price or, in certain other permitted circumstances, of a nominal wholesale value calculated as 50 per cent of the retail price, or alternatively at the average wholesale price for identical wine.
A maximum rebate of $500,000 is payable annually to wine producers or producer groups.
2.3. Luxury car tax (LCT)
The LCT, currently set at 33 per cent, is a single stage tax that is calculated on the value of the car that exceeds the luxury car tax threshold. The luxury car threshold for the 2012-13 financial year is $75,375 for fuel-efficient cars or $59,133 for other cars. The LCT threshold is usually indexed using the CPI and the fuel-efficient cars rate is indexed annually using the motor vehicle purchase component of the CPI, which is composed of observed price movements for new vehicles sold in Australia. If the change in the motor vehicle purchase component of the CPI is negative, the threshold is not reduced.
The fuel efficient car limit replaces the luxury car tax threshold for cars with a fuel consumption not exceeding seven litres per 100 kilometres as a combined rating under vehicle standards in force under Section 7 of the Motor Vehicle Standards Act 1989.
3. Excise The major categories of excisable products are petroleum and other fuel products, crude oil, oils and lubricants, tobacco and alcoholic beverages (other than wine). Equivalent duties on identical imported products are imposed through, and reported under, customs duty.
Petroleum and other fuel excise includes excise on petrol (gasoline), diesel, fuel ethanol, bio diesel, blends, aviation gasoline, aviation kerosene, fuel oil, heating oil and kerosene. It is imposed at specific rates per litre of product.
Excise on aviation fuel is channelled to fund the Civil Aviation Safety Authority (CASA). The current excise rates are 8.616 cents per litre for aviation gasoline and 9.536 cents per litre for aviation kerosene. The excise increased on 1 July 2012 from 3.556 cents per litre to include the carbon price. As aviation gasoline and kerosene have different carbon emissions, they have different excise rates from 1 July 2012.
16
Crude oil excise provides a return to the community for the exploitation of its natural resources. The rate of excise varies according to the quantity sold, the sale price, and the dates of discovery and development of the oil field. The crude oil excise regime applies to:
• crude oil production from offshore fields in the North-West Shelf production licence areas that are not subject to petroleum resource rent tax;
• crude oil production from onshore fields and fields in coastal waters; and
• condensate production from petroleum fields located in the North-West Shelf Project area and onshore Australia (brought into the crude oil excise regime on 13 May 2008). Condensate is light oil extracted from ‘wet’ gas and primarily processed for use in motor vehicles.
Other excise is derived from beer, spirits, other alcoholic beverages (other than wine) and tobacco products.
• For beer, spirits and other alcoholic beverages, excise is imposed on the alcohol content. The excise rate on commercial beer in containers greater than 48 litres (draught beer) is lower than for other commercial beer.
– Beer for personal consumption (non-commercial beer) brewed in commercial facilities attracts duty at a reduced rate, equivalent to 7 per cent of the applicable beer excise.
– From 1 August 2011, the excise on ‘other excisable beverages’ was increased to the rate on full strength spirits. Other excisable beverages are those not exceeding 10 per cent by volume of alcohol and include most ‘ready-to-drink’ alcoholic beverages.
• Excise is imposed on a per stick basis for cigarettes that do not exceed 0.8 grams (actual tobacco content) and on a per kilogram basis for other tobacco products.
– The excise on cigarettes and loose leaf tobacco is $0.34889 per stick and $436.13 per kilogram respectively, effective from 1 August 2012. This excise increase also applied to excise-equivalent customs duty on comparable imported tobacco products.
• Wine is not subject to excise, but is subject to the wine equalisation tax.
17
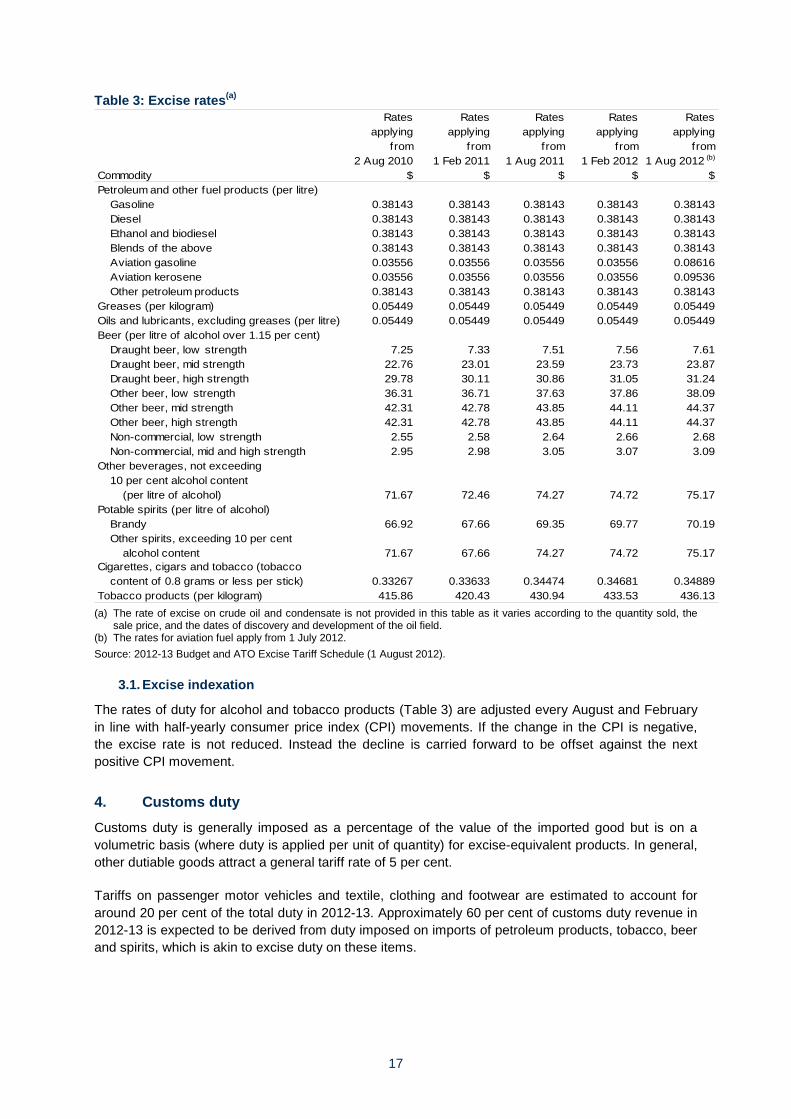
Table 3: Excise rates(a) Rates Rates Rates Rates Rates
applying applying applying applying applyingfrom from from from from
2 Aug 2010 1 Feb 2011 1 Aug 2011 1 Feb 2012 1 Aug 2012 (b)
Commodity $ $ $ $ $Petroleum and other fuel products (per litre)
Gasoline 0.38143 0.38143 0.38143 0.38143 0.38143Diesel 0.38143 0.38143 0.38143 0.38143 0.38143Ethanol and biodiesel 0.38143 0.38143 0.38143 0.38143 0.38143Blends of the above 0.38143 0.38143 0.38143 0.38143 0.38143Aviation gasoline 0.03556 0.03556 0.03556 0.03556 0.08616Aviation kerosene 0.03556 0.03556 0.03556 0.03556 0.09536Other petroleum products 0.38143 0.38143 0.38143 0.38143 0.38143
Greases (per kilogram) 0.05449 0.05449 0.05449 0.05449 0.05449Oils and lubricants, excluding greases (per litre) 0.05449 0.05449 0.05449 0.05449 0.05449Beer (per litre of alcohol over 1.15 per cent)
Draught beer, low strength 7.25 7.33 7.51 7.56 7.61Draught beer, mid strength 22.76 23.01 23.59 23.73 23.87Draught beer, high strength 29.78 30.11 30.86 31.05 31.24Other beer, low strength 36.31 36.71 37.63 37.86 38.09Other beer, mid strength 42.31 42.78 43.85 44.11 44.37Other beer, high strength 42.31 42.78 43.85 44.11 44.37Non-commercial, low strength 2.55 2.58 2.64 2.66 2.68Non-commercial, mid and high strength 2.95 2.98 3.05 3.07 3.09
Other beverages, not exceeding10 per cent alcohol content
(per litre of alcohol) 71.67 72.46 74.27 74.72 75.17Potable spirits (per litre of alcohol)
Brandy 66.92 67.66 69.35 69.77 70.19Other spirits, exceeding 10 per cent
alcohol content 71.67 67.66 74.27 74.72 75.17Cigarettes, cigars and tobacco (tobacco
content of 0.8 grams or less per stick) 0.33267 0.33633 0.34474 0.34681 0.34889Tobacco products (per kilogram) 415.86 420.43 430.94 433.53 436.13
(a) The rate of excise on crude oil and condensate is not provided in this table as it varies according to the quantity sold, the sale price, and the dates of discovery and development of the oil field.
(b) The rates for aviation fuel apply from 1 July 2012. Source: 2012-13 Budget and ATO Excise Tariff Schedule (1 August 2012).
3.1. Excise indexation
The rates of duty for alcohol and tobacco products (Table 3) are adjusted every August and February in line with half-yearly consumer price index (CPI) movements. If the change in the CPI is negative, the excise rate is not reduced. Instead the decline is carried forward to be offset against the next positive CPI movement.
4. Customs duty Customs duty is generally imposed as a percentage of the value of the imported good but is on a volumetric basis (where duty is applied per unit of quantity) for excise-equivalent products. In general, other dutiable goods attract a general tariff rate of 5 per cent.
Tariffs on passenger motor vehicles and textile, clothing and footwear are estimated to account for around 20 per cent of the total duty in 2012-13. Approximately 60 per cent of customs duty revenue in 2012-13 is expected to be derived from duty imposed on imports of petroleum products, tobacco, beer and spirits, which is akin to excise duty on these items.
18
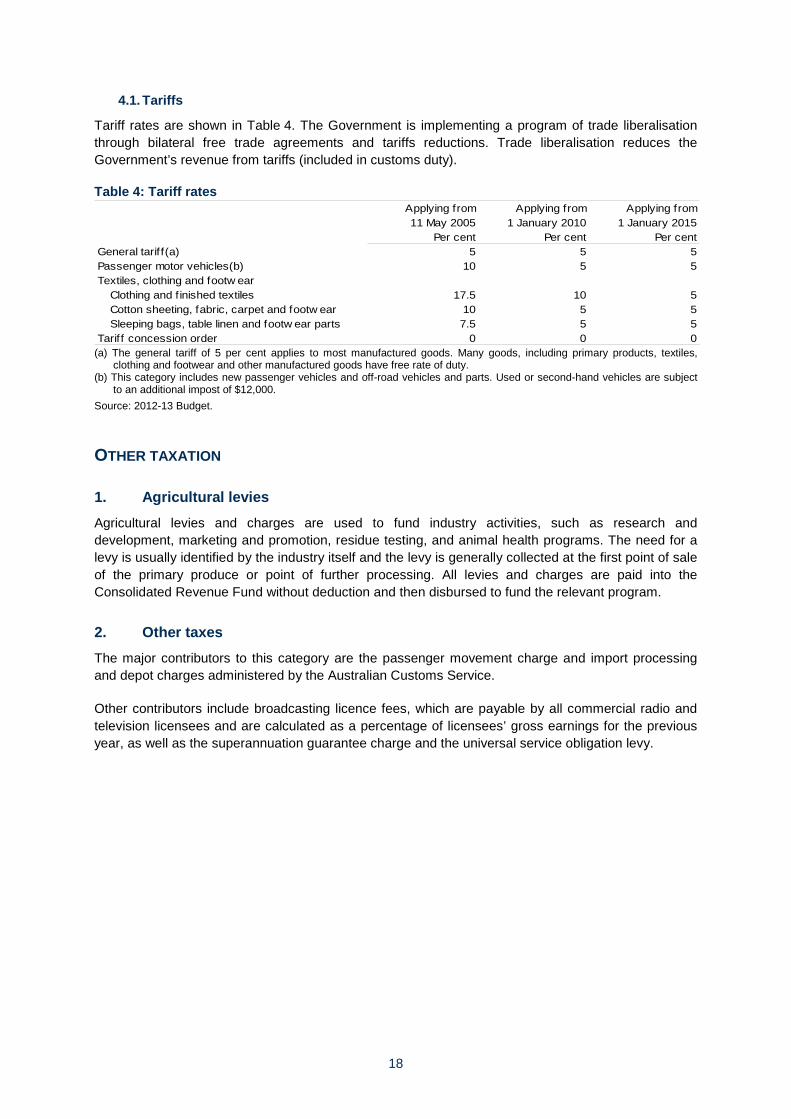
4.1. Tariffs
Tariff rates are shown in Table 4. The Government is implementing a program of trade liberalisation through bilateral free trade agreements and tariffs reductions. Trade liberalisation reduces the Government’s revenue from tariffs (included in customs duty).
Table 4: Tariff rates Applying from Applying from Applying from11 May 2005 1 January 2010 1 January 2015
Per cent Per cent Per centGeneral tarif f(a) 5 5 5Passenger motor vehicles(b) 10 5 5Textiles, clothing and footw ear
Clothing and f inished textiles 17.5 10 5Cotton sheeting, fabric, carpet and footw ear 10 5 5Sleeping bags, table linen and footw ear parts 7.5 5 5
Tariff concession order 0 0 0 (a) The general tariff of 5 per cent applies to most manufactured goods. Many goods, including primary products, textiles,
clothing and footwear and other manufactured goods have free rate of duty. (b) This category includes new passenger vehicles and off-road vehicles and parts. Used or second-hand vehicles are subject
to an additional impost of $12,000. Source: 2012-13 Budget.
OTHER TAXATION
1. Agricultural levies Agricultural levies and charges are used to fund industry activities, such as research and development, marketing and promotion, residue testing, and animal health programs. The need for a levy is usually identified by the industry itself and the levy is generally collected at the first point of sale of the primary produce or point of further processing. All levies and charges are paid into the Consolidated Revenue Fund without deduction and then disbursed to fund the relevant program.
2. Other taxes The major contributors to this category are the passenger movement charge and import processing and depot charges administered by the Australian Customs Service.
Other contributors include broadcasting licence fees, which are payable by all commercial radio and television licensees and are calculated as a percentage of licensees’ gross earnings for the previous year, as well as the superannuation guarantee charge and the universal service obligation levy.
19
APPENDIX B: CLASSIFICATION OF AUSTRALIAN GOVERNMENT TAXES
Changes in the classification of transactions generally can arise from changes in the financial reporting standards on which the Australian Government budget documents are based and ongoing reconciliation of Australian Bureau of Statistics (ABS) and budget statistics.
Classification changes affect historical reporting. Therefore, comparisons between budget year publications can be misleading. A list of significant classification changes to revenue items in various budgets is provided below.
2009-10 • Excess contributions tax (ECT) is a tax that taxpayers are liable to pay on contributions made to
their superannuation that exceed their concessional, transitional or non-concessional contributions cap. The cap amount and how much extra tax must be paid once the cap is exceeded depends on whether the contributions are concessional, transitional or non-concessional. As part of the 2009-10 Budget the concessional and transitional caps were lowered.
• Categories of excisable products reported are changed to protect taxpayer confidentiality. Revenue from crude oil and condensate excise cannot be published separately without risking the disclosure of sensitive commercial information in relation to the tax affairs of potentially identifiable businesses. A category of ‘other excisable products’ is introduced that comprises the previous categories of ‘other fuel products’, ‘crude oil and condensate’, ‘spirits’ and ‘other excisable beverages’.
2008-09 • GST was reclassified as an Australian Government tax, in accordance with ABS Government
Finance Statistics’ (GFS) and Australian Accounting Standards (AAS). Since the introduction of the GST in 2000-01, the GST had been reported in budgets as a State Government tax and was therefore excluded from total Australian Government tax revenue. The impact of this change is outlined in the 2008-09 Budget (Budget Paper No. 1, box 5, page 5-26).
• As a consequence of the change to GST reporting, there are two related changes.
– GST non-general interest charge (GIC) penalties are reclassified to be reported with GST. In the previous budgets, the GST non-GIC penalties were reported under ‘other tax’.
– The level of reported cash GST receipts is adjusted by a small amount for GST collected by Commonwealth agencies but not yet passed to the ATO at the end of each financial year.
• The wine equalisation tax (WET) and luxury car tax (LCT) are reclassified under ‘sales taxes,’ along with the GST. The WET and LCT were previously classified under ‘other tax’.
2006-07 • Fringe benefits tax (FBT) was reclassified under ‘income tax’ from ‘other tax’. This was due to a
change in ABS’s classification of FBT under the Government Financial Statistics (GFS) standard such that it is now considered a tax on the income of individuals.
– The value of reported FBT increased by the value of tax on fringe benefits provided by Australian Government agencies to their employees. These transactions were no longer
20
classified as internal to government (that is tax payments by Australian Government agencies to the Australian Government) but rather as transactions between individuals and the government.
• The WET and LCT were reclassified under ‘other tax’. The items were previously classified under ‘indirect tax’.
• Broadcasting licence fees and other levies were aggregated and reclassified under ‘other tax’. These items were previously reported separately under ‘other tax’.
2002-03 • Gross income tax withholding was previously reported as two separate items: gross PAYG
(withholding) and other withholding. ‘Other withholding’ was previously reported under ‘company and other income tax’. This includes amounts withheld for failure to quote a tax file number or an Australian business number, interest, dividends and royalty payments to non-residents, and payments to aboriginal groups for the use of land for mineral exploration and mining.
2001-02 • Medicare levy was reclassified to be included within ‘gross PAYG withholding’, ‘gross other
individuals’ and refunds. Previously, it was identified as a separate item under ‘individuals’ income tax’.
2000-01 • PAYG system replaced pay as you earn system (PAYE), prescribed payments system (PPS) and
reportable payments system (RPS).
– Tax withheld under ‘gross PAYE’ is now recorded as ‘gross PAYG withholding’.
– Under the PAYG system, individuals in the PPS who qualify for an ABN may choose to enter into voluntary withholding arrangements. Tax withheld from such individuals (estimated to be around $800 million in 2000-01) is recorded under ‘gross PAYG withholding’.
– The remaining tax that would have been collected under PPS is now collected through the PAYG instalment system or as payments on assessment. These payments (estimated to be around $1.9 billion in 2000-01) are generally recorded under the ‘gross other individuals’ head of revenue.
1999-2000 • From 1999-2000 the taxation revenue figures have been based on the GFS framework of accrual
accounting. Prior to this, accrual figures did not exist (the taxation figures were based on the Commonwealth Budget Sector cash accounting framework).

21
APPENDIX C: REVENUE AND RECEIPTS HISTORY AND FORECASTS Table C1: Australian Government (cash) receipts 2003-04 2004-05 2005-06 2006-07 2007-08 2008-09 2009-10 2010-11 2011-12 2012-13(e) 2013-14(e) 2014-15(p) 2015-16(p)
$m $m $m $m $m $m $m $m $m $m $m $m $mIncome taxationIndividuals and other w ithholding
Income tax w ithholding 89,638 97,304 103,120 107,119 113,982 115,899 118,532 129,654 142,770 151,300 163,900 174,800 185,600Other individuals 19,935 22,554 24,895 25,797 29,525 30,030 25,928 27,795 31,141 35,000 37,300 41,000 44,700less: Refunds 12,325 13,734 15,244 17,145 19,601 23,569 24,390 24,711 25,537 26,500 26,700 28,800 30,700
Total individuals and other w ithholding 97,247 106,123 112,770 115,770 123,906 122,361 120,070 132,739 148,373 159,800 174,500 187,000 199,600Fringe benefits tax 3,590 3,703 4,049 3,761 3,856 3,399 3,504 3,303 3,731 3,970 4,450 4,920 5,130Superannuation funds 5,551 6,248 6,368 8,211 12,054 9,217 6,099 6,519 7,562 8,050 9,050 11,010 12,950Company tax 36,101 40,404 48,960 57,100 61,700 60,391 52,209 56,262 66,584 71,170 78,680 78,540 81,580Resource rent taxes(a) 1,168 1,459 1,917 1,510 1,686 2,184 1,251 806 1,463 5,400 6,400 5,630 6,620Income taxation receipts 143,658 157,937 174,063 186,353 203,202 197,552 183,132 199,628 227,714 248,390 273,080 287,100 305,880Sales taxes
Goods and services tax 33,069 35,184 37,342 39,614 42,424 41,335 43,967 46,083 45,861 48,432 51,189 53,900 56,611Wine equalisation tax 704 682 656 650 665 693 733 722 708 710 720 760 810Luxury car tax 335 298 322 364 452 393 472 483 435 450 460 480 520Other sales taxes(b) -48 -10 -16 -6 0 -1 0 0 0 0 0 0 0
Total sales taxes 34,060 36,154 38,304 40,621 43,541 42,420 45,173 47,288 47,004 49,592 52,369 55,140 57,941Excise duty Fuel excise 13,540 14,276 13,992 14,663 15,252 15,637 15,675 16,267 16,978 17,950 18,670 18,800 19,260
Other excise 7,539 7,612 7,822 8,086 8,474 8,736 8,764 9,490 8,567 8,520 8,310 8,360 8,690Total excise duty 21,079 21,888 21,814 22,749 23,727 24,373 24,439 25,756 25,545 26,470 26,980 27,160 27,950Customs duty 5,038 5,012 4,488 5,063 5,561 5,814 5,341 5,429 6,996 7,800 9,000 9,130 9,570Excise and customs receipts 26,117 26,900 26,302 27,812 29,288 30,186 29,780 31,185 32,541 34,270 35,980 36,290 37,520Carbon pricing mechanism 4,020 6,640 7,340 6,750Other indirect taxation
Agricultural levies 603 584 610 608 611 620 395 445 421 440 436 443 449Other taxes 1,655 1,740 1,936 1,999 1,734 1,848 2,494 2,292 2,263 2,497 2,888 2,923 2,999
Total other indirect taxation receipts 2,258 2,324 2,546 2,607 2,345 2,468 2,888 2,738 2,684 2,937 3,324 3,366 3,447Indirect taxation receipts 62,435 65,377 67,152 71,039 75,174 75,075 77,841 81,211 82,229 90,819 98,313 102,136 105,658
Interest received 1,056 1,400 2,325 3,731 4,769 5,166 4,025 4,943 4,267 4,390 4,486 4,414 4,756Dividends and other 10,627 11,271 12,403 11,514 11,772 14,806 19,665 16,242 15,665 23,442 16,715 16,393 18,330Non-taxation receipts 11,683 12,670 14,728 15,245 16,540 19,973 23,689 21,185 19,931 27,832 21,201 20,806 23,086Total receipts 217,776 235,985 255,943 272,637 294,917 292,600 284,662 302,024 329,874 367,041 392,595 410,042 434,625
257,392241,215223,314Taxation receipts 206,092 280,839260,973272,627278,376 411,538389,236371,393339,209309,943
(a) Resource rent taxes include PRRT and gross receipts from the MRRT. Net receipts from the MRRT are expected to be $2.0 billion in 2012-13, $2.4 billion in 2013-14, $2.1 billion in 2014-15 and
$2.6 billion in 2015-16, which represent the net impact on receipts across several different revenue heads. These include the offsetting reductions in company tax (through deductibility) and interactions with other taxes.
(b) Other sales taxes include wholesale sales tax.
Source: 2012-13 MYEFO.
22
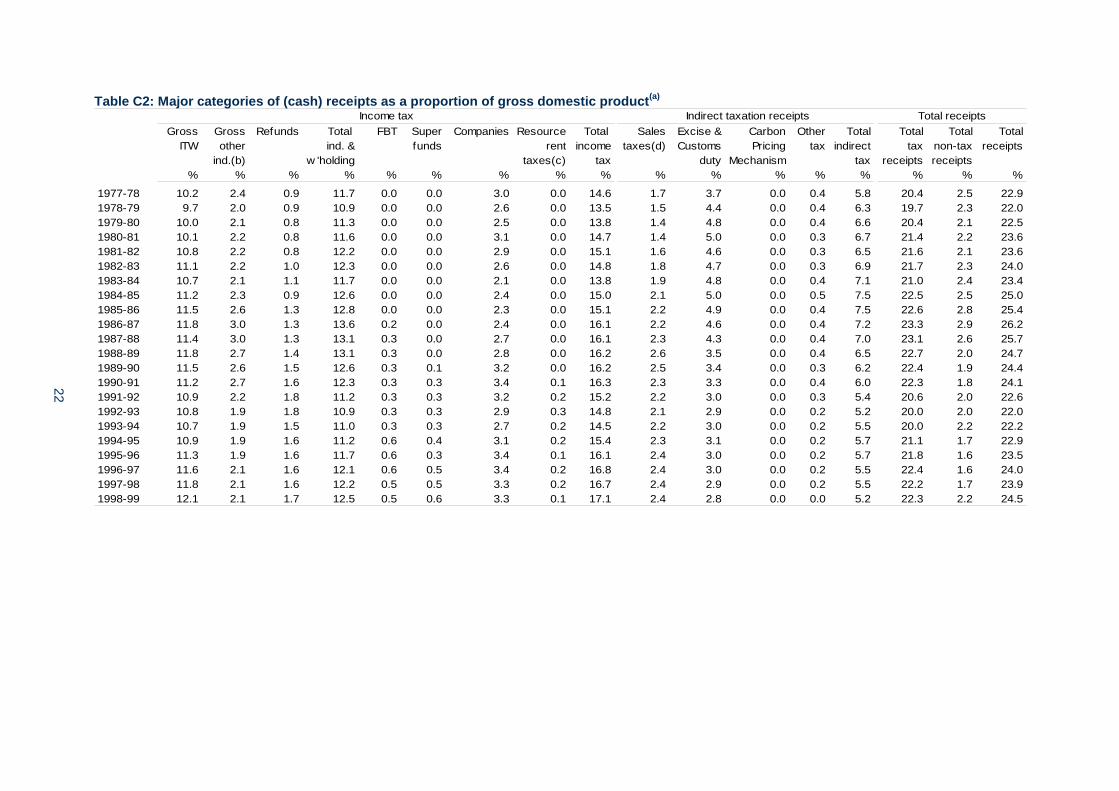
Table C2: Major categories of (cash) receipts as a proportion of gross domestic product(a)
Gross Gross Refunds Total FBT Super Companies Resource Total Sales Excise & Carbon Other Total Total Total TotalITW other ind. & funds rent income taxes(d) Customs Pricing tax indirect tax non-tax receipts
ind.(b) w 'holding taxes(c) tax duty Mechanism tax receipts receipts% % % % % % % % % % % % % % % % %
1977-78 10.2 2.4 0.9 11.7 0.0 0.0 3.0 0.0 14.6 1.7 3.7 0.0 0.4 5.8 20.4 2.5 22.91978-79 9.7 2.0 0.9 10.9 0.0 0.0 2.6 0.0 13.5 1.5 4.4 0.0 0.4 6.3 19.7 2.3 22.01979-80 10.0 2.1 0.8 11.3 0.0 0.0 2.5 0.0 13.8 1.4 4.8 0.0 0.4 6.6 20.4 2.1 22.51980-81 10.1 2.2 0.8 11.6 0.0 0.0 3.1 0.0 14.7 1.4 5.0 0.0 0.3 6.7 21.4 2.2 23.61981-82 10.8 2.2 0.8 12.2 0.0 0.0 2.9 0.0 15.1 1.6 4.6 0.0 0.3 6.5 21.6 2.1 23.61982-83 11.1 2.2 1.0 12.3 0.0 0.0 2.6 0.0 14.8 1.8 4.7 0.0 0.3 6.9 21.7 2.3 24.01983-84 10.7 2.1 1.1 11.7 0.0 0.0 2.1 0.0 13.8 1.9 4.8 0.0 0.4 7.1 21.0 2.4 23.41984-85 11.2 2.3 0.9 12.6 0.0 0.0 2.4 0.0 15.0 2.1 5.0 0.0 0.5 7.5 22.5 2.5 25.01985-86 11.5 2.6 1.3 12.8 0.0 0.0 2.3 0.0 15.1 2.2 4.9 0.0 0.4 7.5 22.6 2.8 25.41986-87 11.8 3.0 1.3 13.6 0.2 0.0 2.4 0.0 16.1 2.2 4.6 0.0 0.4 7.2 23.3 2.9 26.21987-88 11.4 3.0 1.3 13.1 0.3 0.0 2.7 0.0 16.1 2.3 4.3 0.0 0.4 7.0 23.1 2.6 25.71988-89 11.8 2.7 1.4 13.1 0.3 0.0 2.8 0.0 16.2 2.6 3.5 0.0 0.4 6.5 22.7 2.0 24.71989-90 11.5 2.6 1.5 12.6 0.3 0.1 3.2 0.0 16.2 2.5 3.4 0.0 0.3 6.2 22.4 1.9 24.41990-91 11.2 2.7 1.6 12.3 0.3 0.3 3.4 0.1 16.3 2.3 3.3 0.0 0.4 6.0 22.3 1.8 24.11991-92 10.9 2.2 1.8 11.2 0.3 0.3 3.2 0.2 15.2 2.2 3.0 0.0 0.3 5.4 20.6 2.0 22.61992-93 10.8 1.9 1.8 10.9 0.3 0.3 2.9 0.3 14.8 2.1 2.9 0.0 0.2 5.2 20.0 2.0 22.01993-94 10.7 1.9 1.5 11.0 0.3 0.3 2.7 0.2 14.5 2.2 3.0 0.0 0.2 5.5 20.0 2.2 22.21994-95 10.9 1.9 1.6 11.2 0.6 0.4 3.1 0.2 15.4 2.3 3.1 0.0 0.2 5.7 21.1 1.7 22.91995-96 11.3 1.9 1.6 11.7 0.6 0.3 3.4 0.1 16.1 2.4 3.0 0.0 0.2 5.7 21.8 1.6 23.51996-97 11.6 2.1 1.6 12.1 0.6 0.5 3.4 0.2 16.8 2.4 3.0 0.0 0.2 5.5 22.4 1.6 24.01997-98 11.8 2.1 1.6 12.2 0.5 0.5 3.3 0.2 16.7 2.4 2.9 0.0 0.2 5.5 22.2 1.7 23.91998-99 12.1 2.1 1.7 12.5 0.5 0.6 3.3 0.1 17.1 2.4 2.8 0.0 0.0 5.2 22.3 2.2 24.5
Total receiptsIncome tax Indirect taxation receipts
23
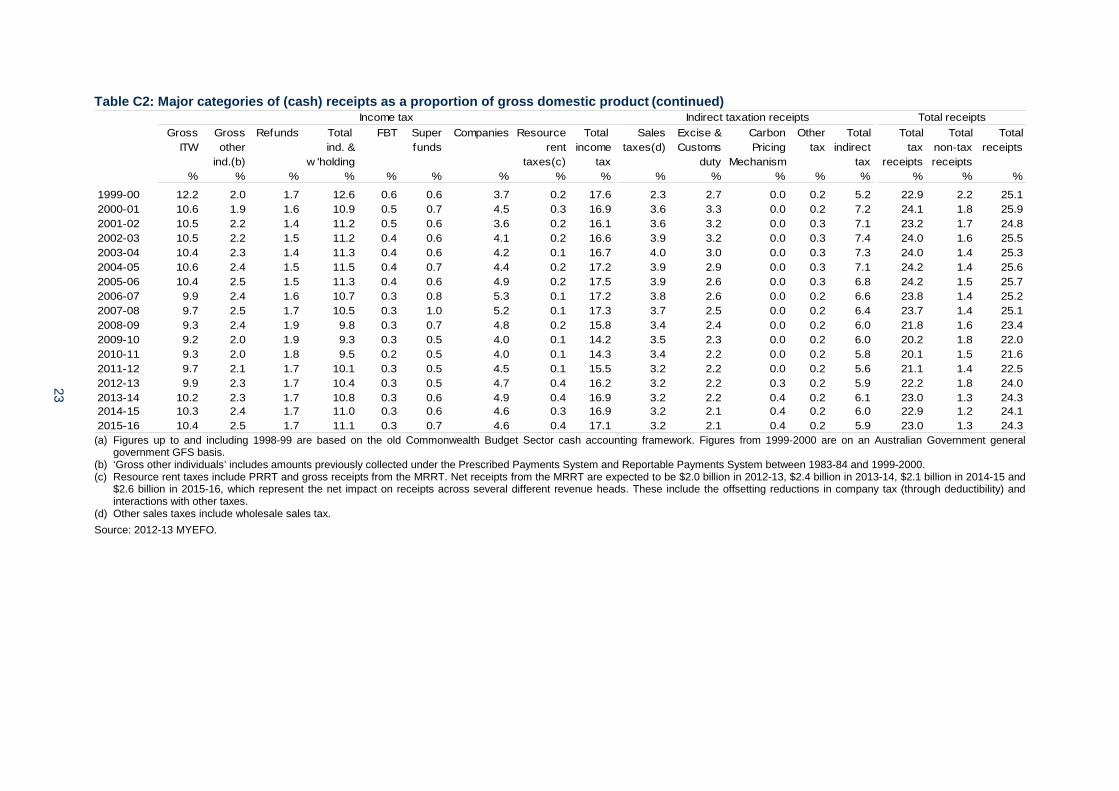
Table C2: Major categories of (cash) receipts as a proportion of gross domestic product (continued)
Gross Gross Refunds Total FBT Super Companies Resource Total Sales Excise & Carbon Other Total Total Total TotalITW other ind. & funds rent income taxes(d) Customs Pricing tax indirect tax non-tax receipts
ind.(b) w 'holding taxes(c) tax duty Mechanism tax receipts receipts% % % % % % % % % % % % % % % % %
1999-00 12.2 2.0 1.7 12.6 0.6 0.6 3.7 0.2 17.6 2.3 2.7 0.0 0.2 5.2 22.9 2.2 25.12000-01 10.6 1.9 1.6 10.9 0.5 0.7 4.5 0.3 16.9 3.6 3.3 0.0 0.2 7.2 24.1 1.8 25.92001-02 10.5 2.2 1.4 11.2 0.5 0.6 3.6 0.2 16.1 3.6 3.2 0.0 0.3 7.1 23.2 1.7 24.82002-03 10.5 2.2 1.5 11.2 0.4 0.6 4.1 0.2 16.6 3.9 3.2 0.0 0.3 7.4 24.0 1.6 25.52003-04 10.4 2.3 1.4 11.3 0.4 0.6 4.2 0.1 16.7 4.0 3.0 0.0 0.3 7.3 24.0 1.4 25.32004-05 10.6 2.4 1.5 11.5 0.4 0.7 4.4 0.2 17.2 3.9 2.9 0.0 0.3 7.1 24.2 1.4 25.62005-06 10.4 2.5 1.5 11.3 0.4 0.6 4.9 0.2 17.5 3.9 2.6 0.0 0.3 6.8 24.2 1.5 25.72006-07 9.9 2.4 1.6 10.7 0.3 0.8 5.3 0.1 17.2 3.8 2.6 0.0 0.2 6.6 23.8 1.4 25.22007-08 9.7 2.5 1.7 10.5 0.3 1.0 5.2 0.1 17.3 3.7 2.5 0.0 0.2 6.4 23.7 1.4 25.12008-09 9.3 2.4 1.9 9.8 0.3 0.7 4.8 0.2 15.8 3.4 2.4 0.0 0.2 6.0 21.8 1.6 23.42009-10 9.2 2.0 1.9 9.3 0.3 0.5 4.0 0.1 14.2 3.5 2.3 0.0 0.2 6.0 20.2 1.8 22.02010-11 9.3 2.0 1.8 9.5 0.2 0.5 4.0 0.1 14.3 3.4 2.2 0.0 0.2 5.8 20.1 1.5 21.62011-12 9.7 2.1 1.7 10.1 0.3 0.5 4.5 0.1 15.5 3.2 2.2 0.0 0.2 5.6 21.1 1.4 22.52012-13 9.9 2.3 1.7 10.4 0.3 0.5 4.7 0.4 16.2 3.2 2.2 0.3 0.2 5.9 22.2 1.8 24.02013-14 10.2 2.3 1.7 10.8 0.3 0.6 4.9 0.4 16.9 3.2 2.2 0.4 0.2 6.1 23.0 1.3 24.32014-15 10.3 2.4 1.7 11.0 0.3 0.6 4.6 0.3 16.9 3.2 2.1 0.4 0.2 6.0 22.9 1.2 24.12015-16 10.4 2.5 1.7 11.1 0.3 0.7 4.6 0.4 17.1 3.2 2.1 0.4 0.2 5.9 23.0 1.3 24.3
Total receiptsIncome tax Indirect taxation receipts
(a) Figures up to and including 1998-99 are based on the old Commonwealth Budget Sector cash accounting framework. Figures from 1999-2000 are on an Australian Government general
government GFS basis. (b) ‘Gross other individuals’ includes amounts previously collected under the Prescribed Payments System and Reportable Payments System between 1983-84 and 1999-2000. (c) Resource rent taxes include PRRT and gross receipts from the MRRT. Net receipts from the MRRT are expected to be $2.0 billion in 2012-13, $2.4 billion in 2013-14, $2.1 billion in 2014-15 and
$2.6 billion in 2015-16, which represent the net impact on receipts across several different revenue heads. These include the offsetting reductions in company tax (through deductibility) and interactions with other taxes.
(d) Other sales taxes include wholesale sales tax. Source: 2012-13 MYEFO.

24
Table C3: Australian Government (accrual) revenue 2003-04 2004-05 2005-06 2006-07 2007-08 2008-09 2009-10 2010-11 2011-12 2012-13 2013-14 2014-15 2015-16
(e) (e) (p) (p)$m $m $m $m $m $m $m $m $m $m $m $m $m
Individuals and other w ithholding taxesGross income tax w ithholding 90,095 98,250 103,811 107,809 114,700 117,086 119,922 130,790 143,978 152,590 165,250 176,240 187,140Gross other individuals 21,010 24,003 25,859 26,952 31,036 32,260 27,287 30,642 32,992 37,840 40,080 43,930 47,860less: Refunds 12,325 13,734 15,239 17,147 19,601 23,569 24,390 24,660 25,537 26,500 26,700 28,800 30,700
Total individuals and other w ithholding 98,779 108,519 114,431 117,614 126,135 125,777 122,820 136,772 151,433 163,930 178,630 191,370 204,300Fringe benefits tax 3,642 3,476 4,084 3,754 3,796 3,581 3,523 3,348 3,964 4,040 4,530 5,010 5,220Company tax 36,337 43,106 48,987 58,538 64,790 60,705 53,193 57,312 66,726 72,982 80,459 80,320 83,426Superannuation funds 5,785 6,410 6,705 7,879 11,988 9,227 6,182 6,693 7,852 8,250 9,290 11,310 13,310Resource rent taxes(a) 1,165 1,465 1,991 1,594 1,871 2,099 1,297 806 1,293 5,580 6,560 5,650 6,660Income taxation revenue 145,709 162,974 176,198 189,378 208,579 201,389 187,016 204,931 231,268 254,782 279,469 293,660 312,916Sales taxes
Goods and services tax 34,121 35,975 39,118 41,208 44,381 42,626 46,553 48,093 48,849 50,790 53,730 56,590 59,430Wine equalisation tax 705 693 657 651 661 707 748 747 716 720 730 770 820Luxury car tax 336 302 331 365 464 384 499 489 440 450 460 480 520Other sales taxes(b) -38 -13 -19 60 -19 -1 0 0 0 0 0 0 0
Total sales taxes 35,122 36,957 40,086 42,284 45,486 43,716 47,800 49,329 50,004 51,960 54,920 57,840 60,770Excise duty
Fuel excise 13,529 14,350 14,073 14,653 15,085 15,592 15,766 16,305 16,924 17,970 18,270 18,870 19,330Other excise 7,539 7,631 7,854 8,082 8,441 8,727 8,781 9,497 8,557 8,520 8,180 8,390 8,720
Total excise duty 21,068 21,981 21,927 22,734 23,526 24,319 24,547 25,803 25,480 26,490 26,450 27,260 28,050Customs duty 5,622 5,548 4,988 5,644 6,070 6,276 5,748 5,828 7,105 7,830 9,030 9,160 9,600Carbon pricing mechanism 7,690 8,685 9,275 9,400Other indirect taxation
Agricultural levies 603 584 610 608 611 620 395 445 421 440 436 443 449Other taxes 1,835 1,899 1,908 1,862 1,957 2,334 2,494 2,669 2,501 2,900 3,033 3,114 3,223
Total other indirect taxation revenue 2,438 2,483 2,518 2,470 2,567 2,954 2,889 3,115 2,922 3,339 3,470 3,558 3,672Indirect taxation revenue 64,250 66,969 69,518 73,132 77,650 77,264 80,984 84,074 85,511 97,309 102,555 107,093 111,492Taxation revenue 209,959 229,943 245,716 262,510 286,229 278,653 268,000 289,005 316,779 352,092 382,023 400,753 424,408Interest received 1,304 1,621 2,437 3,921 5,558 5,124 4,430 5,169 4,617 4,465 4,628 4,608 4,864Dividends and other 10,905 10,943 13,085 11,979 11,942 15,155 20,337 15,716 16,714 17,182 16,509 16,510 17,166Non-taxation revenue 12,209 12,564 15,522 15,900 17,500 20,280 24,767 20,885 21,330 21,647 21,138 21,119 22,030Total revenue 222,168 242,507 261,238 278,410 303,729 298,933 292,767 309,890 338,109 373,739 403,161 421,871 446,438
(a) Resource rent taxes include PRRT and gross revenue from the MRRT. Net revenue from the MRRT is expected to be $2.0 billion in 2012-13, $2.4 billion in 2013 14, $2.1 billion in 2014-15 and $2.6 billion in 2015-16, which represent the net impact on revenue across several different revenue heads. These include the offsetting reductions in company tax (through deductibility) and interactions with other taxes.
(b) Other sales taxes include wholesale sales tax. Source: 2012-13 MYEFO.

25
Table C4: Major categories of (accrual) revenue as a proportion of gross domestic product
Gross Gross Refunds Total FBT Super Companies Resource Total Sales Excise & Carbon Other Total Total Total TotalITW other ind. & funds rent income taxes(b) Customs Pricing tax indirect tax non-tax revenue
ind. w 'holding taxes(a) tax duty Mechanism tax revenue revenue% % % % % % % % % % % % % % % % %
1999-00 12.3 2.1 1.6 12.8 0.6 0.6 3.7 0.2 17.9 2.4 2.7 - 0.2 5.3 23.2 2.1 25.32000-01 10.7 1.9 1.6 11.0 0.5 0.7 5.0 0.3 17.6 3.7 3.3 - 0.3 7.3 24.9 1.4 26.32001-02 10.6 2.3 1.4 11.4 0.5 0.6 3.6 0.2 16.3 3.7 3.3 - 0.3 7.3 23.6 1.6 25.22002-03 10.6 2.3 1.5 11.4 0.4 0.6 4.2 0.2 16.8 4.0 3.3 - 0.3 7.6 24.4 1.5 25.82003-04 10.5 2.4 1.4 11.5 0.4 0.7 4.2 0.1 17.0 4.1 3.1 - 0.3 7.5 24.4 1.4 25.82004-05 10.7 2.6 1.5 11.8 0.4 0.7 4.7 0.2 17.7 4.0 3.0 - 0.3 7.3 25.0 1.4 26.32005-06 10.4 2.6 1.5 11.5 0.4 0.7 4.9 0.2 17.7 4.0 2.7 - 0.3 7.0 24.7 1.6 26.32006-07 10.0 2.5 1.6 10.9 0.3 0.7 5.4 0.1 17.5 3.9 2.6 - 0.2 6.8 24.2 1.5 25.72007-08 9.8 2.6 1.7 10.7 0.3 1.0 5.5 0.2 17.7 3.9 2.5 - 0.2 6.6 24.3 1.5 25.82008-09 9.4 2.6 1.9 10.0 0.3 0.7 4.8 0.2 16.1 3.5 2.4 - 0.2 6.2 22.3 1.6 23.92009-10 9.3 2.1 1.9 9.5 0.3 0.5 4.1 0.1 14.5 3.7 2.3 - 0.2 6.3 20.7 1.9 22.62010-11 9.3 2.2 1.8 9.8 0.2 0.5 4.1 0.1 14.6 3.5 2.3 - 0.2 6.0 20.7 1.5 22.12011-12 9.8 2.2 1.7 10.3 0.3 0.5 4.5 0.1 15.7 3.4 2.2 0.0 0.2 5.8 21.6 1.5 23.02012-13 (e) 10.0 2.5 1.7 10.7 0.3 0.5 4.8 0.4 16.7 3.4 2.2 0.5 0.2 6.4 23.0 1.4 24.42013-14 (e) 10.2 2.5 1.7 11.1 0.3 0.6 5.0 0.4 17.3 3.4 2.2 0.5 0.2 6.4 23.7 1.3 25.02014-15 (p) 10.4 2.6 1.7 11.3 0.3 0.7 4.7 0.3 17.3 3.4 2.1 0.5 0.2 6.3 23.6 1.2 24.82015-16 (p) 10.5 2.7 1.7 11.4 0.3 0.7 4.7 0.4 17.5 3.4 2.1 0.5 0.2 6.2 23.7 1.2 24.9
Income tax Indirect taxation revenue Total revenue
(a) Resource rent taxes include PRRT and gross revenue from the MRRT. Net revenue from the MRRT is expected to be $2.0 billion in 2012-13, $2.4 billion in 2013-14, $2.1 billion in 2014-15 and
$2.6 billion in 2015-16, which represent the net impact on revenue across several different revenue heads. These include the offsetting reductions in company tax (through deductibility) and interactions with other taxes.
(b) Other sales taxes include wholesale sales tax. Source: 2012-13 MYEFO.
