pohjola bank plc report by the board of directors and
TRANSCRIPT

Pohjola Bank plcReport by the Board of Directors and Financial Statements 2014

List of contents
............................................................................................... 1Report by the Board of Directors for 2014 Operating Environment Consolidated Earnings Analysis Risk Management Group Risk Exposure Operational risks Capital Adequacy Credit Ratings Pohjola’s Efficiency-enhancement Programme Financial Performance and Risk exposure by Business Segment Personnel and Remuneration Capital Expenditure Corporate Social Responsibility Management Corporate Governance Statement Decisions by the Annual General Meeting Pohjola Bank plc became wholly-owned by OP Cooperative Group Restructuring Shares and Shareholders Representative Offices and Branches Abroad Joint Liability Protection Afforded by the Deposit Guarantee Fund and the Investors’ Compensation Fund Outlook for 2015 Pohjola Bank plc's Board Proposal for the Allocation of Distributable Funds Financial Indicators and Share-Related Figures and Ratios Formulas for Key Figures and Ratios
............................................................................................ 25Consolidated Financial Statements (IFRS) Consolidated Income Statement Consolidated Statement of Comprehensive Income Consolidated Balance Sheet Consolidated Statement of Changes in Equity Consolidated Cash Flow Statement Segment Information Notes to the Consolidated Financial Statements Note 1. Pohjola Group’s Accounting Policies Note 2. Pohjola Group’s Risk Management and Capital Adequacy Management Principles Note 3. Change in accounting policy
.......................................................................................................... 84NOTES TO THE INCOME STATEMENT Note 4. Net interest income Note 5. Impairment loss on receivables Note 6. Net income from Non-life Insurance Note 7. Net commissions and fees Note 8. Net trading income Note 9. Net investment income Note 10. Other operating income Note 11. Personnel costs Note 12. Depreciation and amortisation Note 13. Other expenses Note 14. Income tax Note 15. Assets and liabilities as held for distribution to owners and discontinued operations
............................................................................................................... 96 NOTES TO THE BALANCE SHEET Note 16. Cash and cash equivalents Note 17. Receivables from credit institutions Note 18. Financial assets at fair value through profit or loss Note 19. Derivative contracts Note 20. Receivables from customers Note 21. Non-life Insurance assets Note 22. Investment assets Note 23. Reclassified notes and bonds Note 24. Investment in accounted for using the equity method

Note 25. Intangible assets Note 26. Property, plant and equipment Note 27. Other assets Note 28. Tax assets Note 29. Liabilities to credit institutions Note 30. Financial liabilities at fair value through profit or loss Note 31. Derivative contracts Note 32. Liabilities to customers Note 33. Non-life insurance liabilities Note 34. Debt securities issued to the public Note 35. Provisions and other liabilities Note 36. Tax liabilities Note 37. Subordinated liabilities Note 38. Shareholders’ equity
................................................................................................................... 138NOTES TO RISK MANAGEMENT Note 39. Pohjola Group's exposure split by geographic region and exposure class
......................................................................... 139RISK EXPOSURE BY BANKING AND THE GROUP FUNCTIONS Note 40.Lonans and receivables and cumulative impairment losses recognised on them Note 41. Exposure Note 42. Exposure by sector Note 43. Receivables from credit institutions and customers, and doubtful receivables Note 44. Credit losses and impairments Note 45. Corporate exposure by sector Note 46. Corporate exposure by rating category Note 47. Corporate exposure by the amount of customer’s exposure Note 48. Liabilities of financial institutions and insurance companies by rating category Note 49. Collateral received by type of collateral Note 50. Funding structure Note 51. Maturity of assets and liabilities by residual term to maturity Note 52. Liquidity buffer Note 53. Maturities of assets and liabilities by maturity or repricing Note 54. Sensitivity analysis of market risk Note 55. Equity risk Note 56. Real estate risk
........................................................................................................................... 154PILLAR III DISCLOSURES Note 57. Capital base Note 58. Minimum capital requirement Note 59. Capital ratios Note 60. Derivative contracts and counterparty risk
.................................................................................................. 158RISK EXPOSURE BY NON-LIFE INSURANCE Note 61. Risk-bearing capacity Note 62. Sensitivity analysis of Non-life insurance Note 63. Premiums written and sums insured by class Note 64. Trend in large claims Note 65. Insurance profitability Note 66. Information on the nature of insurance liabilities Note 67. Insurance liabilities by estimated maturity Note 68. Risk exposure of insurance investments Note 69. Sensitivity analysis of investment risks Note 70. Interest-rate risk Note 71. Currency risk Note 72. Counterparty risk OTHER NOTES TO THE BALANCE SHEET.................................................................................................... 167 Note 73. Classification of assets and liabilities Note 74. Recurring fair value measurements by valuation technique Note 75. Collateral given Note 76. Financial collateral held

NOTES TO CONTINGENT LIABILITIES AND DERIVATIVES............................................................................... 176 Note 77. Off-balance-sheet commitments Note 78. Derivative contracts Note 79. Financial assets and liabilities offset in the balance sheet or subject to enforceable master netting arrangements or similar agreements Note 80. Contingent liabilities and assets Note 81. Operating leases Note 82. Ownership in interests in subsidiaries, structured entities and joint operations OTHER NOTES......................................................................................................................................... 190 Note 83. Related-party transactions Note 84. Variable remuneration Parent Company Financial Statement (FAS) ....................................................................................... 197 Parent Company Income Statement Parent Company Balance Sheet Parent Company Cash Flow Statement Parent Company's (Pohjola Bank plc) Accounting Policies NOTES TO THE INCOME STATEMENT......................................................................................................... 213 Note 1. Interest income and expenses Note 2. Net lease income Note 3. Income from equity investments Note 4. Commissions and fees Note 5. Net income from securities and foreign exchange trading Note 6. Net income from available-for-sale financial assets Note 7. Net income from hedge accounting Note 8. Net income from investment property Note 9. Other operating income Note 10. Depreciation/amortisation and write-downs on tangible and intangible assets Note 11. Other operating expenses Note 12. Impairment losses on loans and other commitments and other financial assets Note 13. Income taxes Note 14. Income, operating profit or loss and assets and liabilities by Division NOTES TO THE BALANCE SHEET............................................................................................................... 217 Note 15. Receivables from credit institutions Note 16. Receivables from the public and public sector entities Note 17. Asset leased out under finance leases Note 18. Notes and bonds Note 19. Reclassified notes and bonds Note 20. Shares and participations Note 21. Derivative contracts Note 22. Intangible assets and tangible assets and changes during the financial year Note 23. Other assets Note 24. Deferred income and advances paid Note 25. Deferred tax assets and liabilities Note 26. Debt securities issued to the public Note 27. Other liabilities Note 28. Statutory provisions Note 29. Deferred expenses and advances received Note 30. Subordinated liabilities Note 31. Shareholders’ equity Note 32. Restricted and non-restricted equity and distributable funds Note 33a. Financial assets and liabilities by residual term to maturity Note 33b. Classification of assets and liabilities Note 33c. Financial instruments measured at fair value, grouped by valuation technique Note 34. Assets and liabilities denominated in euros and foreign currencies 3

OTHER NOTES......................................................................................................................................... 234 Note 35. Variable remuneration Note 36. Assets pledged as collateral Note 37. Pension liabilities Note 38. Lease and other rental liabilities Note 39. Off-balance-sheet commitments Note 40. Other contingent liabilities and commitments at the year-end Note 41. Personnel and members of administrative bodies, and related parties Note 42. Holdings in other companies 31 December 2014 Note 43. Trustee Services Signatures............................................................................................................................................. 241 Auditor's Report..................................................................................................................................... 242

Pohjola Bank plc Report by the Board of Directors and Financial statements 2014
Report by the Board of Directors for 2014
Consolidated earnings before tax amounted to EUR 584 million (479) and consolidated earnings before tax at fair value to EUR 663 million (464). Return on equity was 14.3% (14.4). The Common Equity Tier 1 ratio (CET1) was 12.4% (11.9*) as against the target of 15%.
Strong growth in income improved Banking earnings. The loan portfolio grew by 5% to EUR 14.9 billion (14.2). The average margin on the corporate loan portfolio was 1.44% (1.57). Earnings included EUR 25 million (35) in impairment loss on receivables.
Within Non-life Insurance, insurance premium revenue increased by 5% (11). The combined ratio was 91.0% (91.6). A reduction in the discount rate for pension liabilities decreased earnings by EUR 62 million (38). Excluding changes in reserving bases and amortisation on intangible assets arising from company acquisition, the operating combined ratio improved to 84.7% (86.9). Return on investments at fair value was 6.7% (3.5).
Asset Management earnings improved due to higher performance-based management fees. Assets under management increased by 14% to EUR 43.3 billion (37.9).
The Board of Directors proposes a dividend per share of EUR 0.43. This means a dividend payout ratio of 30%. OP Cooperative completed its public voluntary bid announced in February 2014 and obtained ownership of all Pohjola
Bank plc shares by decision of the Arbitral Tribunal. Pohjola's series A shares were delisted from the Helsinki Stock Exchange on 30 September 2014. OP Cooperative was entered as the only shareholder in Pohjola's shareholder register on 7 October 2014.
Outlook for 2015: Consolidated earnings from continuing operations before tax in 2015 are expected to be at the same level as in 2014. For more detailed information on the outlook, see “Outlook for 2015” below.
Earnings before tax, € million 2014 2013 Change %
Banking 303 251 21 Non-life Insurance 223 166 34 Group Functions 20 39 -48 Asset Management 38 24 59 Group total 584 479 22 Change in fair value reserve 79 -15 Earnings before tax at fair value 663 464 43
Equity per share, € 10.38 9.54 Average personnel 2,563 2,632 The above figures describe Pohjola Group as a whole without the division into continuing and discontinued operations. Financial targets 2014 2013 Target
Return on equity, % 14.3 14.4 13 Common Equity Tier 1 ratio (CET1), % *) 12.4 11.9 15 Operating cost/income ratio by Banking, % 33 36 < 35 Operating combined ratio by Non-life Insurance, % 84.7 86.9 < 92 Operating expense ratio by Non-life Insurance, % 18.4 18.7 18 Non-life Insurance solvency ratio (under Solvency II framework), % **) 117 125 120 Operating cost/income ratio by Asset Management, % 42 53 < 45 Total expenses in 2015 at the same level as at the end of 2012 598 581 569 AA rating affirmed by at least two credit rating agencies or credit ratings at least at the main competitors’ level 2 2 2
Dividend payout ratio at least 50%, provided that CET 1 ratio is at least 15%. Dividend payout ratio is 30% until CET1 ratio of 15% has been achieved. 30***) 50 ≥ 50 (30) *) In accordance with the Capital Requirements Regulation (EU 575/2013) (CRR) since 1 January 2014. **) According to the Solvency II draft (EU 138/2009). ***) Board proposal
1

Pohjola Bank plc Report by the Board of Directors and Financial statements 2014
Operating environment The world economy continued to grow in 2014 at a below-average rate, with considerable differences from country to country. In the euro area, the economy first began to recover after a two-year recession, but confidence in the recovery suffered setbacks during the year owing to the crisis in Ukraine, for example. Inflation in the euro area slowed down during the year, ending up being negative when oil prices suddenly plummeted. The European Central Bank (ECB) reduced its main refinancing rate to as low as 0.05 per cent in September, bringing down Euribor rates. The ECB went to unusual lengths towards the end of the year to boost the economy, such as by buying covered bonds on the market. The Finnish economy was sluggish, with GDP failing to grow, investments decreasing and employment increasing. Home prices fell by almost one per cent, and home sales decreased. Later in the year, the economy improved a fraction as industrial orders increased and exports were up by a little towards the end of the year. The fall of oil prices slowed down inflation to 0.5% in December. Banks' total consumer loan volumes grew last year at a slow annual rate of 2%. The number of new home mortgages levelled off closer to the year-end. Corporate loans increased slightly more than household loans owing to a greater volume of working capital financing. Demand for credit is expected to be below average in 2015. Deposits made by private and corporate customers increased in the low-interest-rate environment by only a fraction year on year. Term deposits continued to decrease vigorously, as assets were allocated to current accounts and riskier savings and investments. Capital markets developed favourably, although the markets' risk indicators increased a little in the second half of the year. Mutual fund assets and insurance savings in Finland increased by 13%. Net asset inflows continued to develop favourably throughout the year, with the highest demand being for corporate bond funds. Life Insurance's premiums written increased by 10% year on year. The trend in insurance savings continued as people shifted away from products with guaranteed technical interest in favour of unit-linked products. Non-life Insurance's premiums written increased according to preliminary figures by 5% in 2014. The growth of claims expenditure was still slower than the growth of premiums written. World economy prospects have improved thanks to the lower price of oil, but there are still a number of exceptional risks that cast a shadow on economic development. The euro area economy is still growing slowly and is susceptible to disturbances. The ECB will commence an asset purchase programme in March, set to continue until at least September 2016. Euribor rates will probably remain near zero throughout the year. An increase in exports will give a boost to the Finnish economy, but economic development will on the whole remain weak.
-20
-10
0
10
20
30
40
50
2010 2011 2012 2013 2014
%
Financial sector volumes12-month change
Life insurance assets
Mutual fund assets
Banking market total
Loans
Deposits
Sources: Bank of Finland, Federation of Finnish Financial Services, Investment Research Finland
Loans and deposits excl. financial and insurance corporations
0
1
2
3
2010 2011 2012 2013 2014
%Euribor rates and ECB refi rate
12-month Euribor
3-month Euribor
ECB: Main refinancing rate
Source: Bank of Finland
-4
-2
0
2
4
6
2010 2011 2012 2013 2014
%
GDPAnnual volume change
Euro area
Finland
Sources: Eurostat, Statistics Finland
Seasonally adjusted series
-10
-5
0
5
10
2010 2011 2012 2013 2014
%
Fixed investmentsAnnual volume change
Source: Statistics Finland
2

Pohjola Bank plc Report by the Board of Directors and Financial statements 2014
Consolidated earnings analysis € million 2014 2013 Change %
Continuing operations *) Net interest income Corporate and Baltic Banking 255 227 12
Markets 28 -3 Other operations -26 6
Total 257 230 12 Net commissions and fees 114 111 2 Net trading income 77 93 -16 Net investment income 64 46 37 Net income from Non-life Insurance Insurance operations 466 440 6
Investment operations 173 131 33 Other items -42 -43 -3
Total 597 528 13 Other operating income 32 36 -12 Total income 1,141 1,045 9 Personnel costs 163 170 -4 ICT costs 94 87 7 Depreciation and amortisation 52 52 0 Other expenses 258 241 7 Total expenses 567 550 3 Earnings before impairment loss on receivables 574 495 16 Impairment loss on receivables 25 37 -31 Earnings of continuing operations before tax 548 458 20 Discontinued operations *) Asset Management net income
Net commissions and fees 64 51 25
Share of associates’ profit/loss 1 0
Other Asset Management income and expenses, net -30 -30 -1 Other
Earnings of discontinued operations before tax 36 21 69 Total earnings before tax 584 479 22 Change in fair value reserve 79 -15
Earnings before tax at fair value 663 464 43 *) Following the realisation of OP Cooperative's public voluntary bid, Pohjola Group is planning structural changes, meaning, for example, that the Non-life Insurance segment and the Asset Management segment would be transferred from Pohjola Group to be directly owned by OP Cooperative. For this reason, the Non-life Insurance and Asset Management segments were reported as discontinued operations in accordance with IFRS 5. The structural change relating to the Non-life Insurance segment is delayed for over a year, which is why it has returned to be reported under continuing operations together with Banking and the Group Functions. The Asset Management segment is still being reported, according to IFRS 5, as discontinued operations in the income statement and as assets and liabilities classified as held for distribution to owners in the balance sheet. 2014 earnings
Consolidated earnings before tax improved by EUR 105 million to EUR 584 million (479). Total income and total expenses rose by 11% and 3%, respectively. Impairment loss on receivables decreased to EUR 25 million (37). The fair value reserve before tax increased by EUR 79 million, amounting to EUR 289 million on 31 December. Earnings before tax at fair value were EUR 663 million (464).
Continuing operations
Earnings of continuing operations before tax improved by EUR 90 million to EUR 548 million (458). Net interest income from continuing operations increased by a total of EUR 27 million, or by 12%. Combined net interest income from Corporate Banking and Baltic Banking grew by 12% year on year. The loan portfolio increased by 5% to EUR 14.9 billion. The average margin on the corporate loan portfolio decreased by 13 basis points to 1.44% (1.57).
3

Pohjola Bank plc Report by the Board of Directors and Financial statements 2014
Net interest income from Markets and net trading income improved as a result of growth in client trading and income from trading. A change in the credit and counterparty risk model applied to the fair value measurement of derivatives eroded net trading income by EUR 16 million. In the Group Functions, net interest income from the liquidity buffer was reduced by persistently low interest rates and as the Group was preparing for tighter liquidity regulation. Net commissions and fees increased by EUR 3 million, or by 2%. This increase came from commissions and fees related to lending and securities issuance. Net investment income increased by EUR 17 million. Capital gains on notes and bonds amounted to EUR 11 million (14) and capital gains on shares to EUR 12 million (1). Dividend income totalled EUR 43 million (28). Dividend income includes EUR 14 million (16) in interest paid on cooperative capital by Suomen Luotto-osuuskunta and EUR 12 million (5) of dividends paid by OP Life Assurance. Net income from Non-life Insurance improved by 13%. Insurance premium revenue increased by 5% and claims incurred by 5%. The reduction in the discount rate for pension liabilities increased claims incurred by EUR 62 million (38). Excluding the effect of the reduced discount rate, claims incurred would have increased by 2%.Investment income was EUR 43 million higher than the year before. Investment income included EUR 114 million (41) in capital gains and EUR 2 million (10) in impairment loss on investments. Return on investments at fair value was 6.7% (3.5). Other operating income declined by EUR 4 million, due mainly to lower income related to maintenance lease.
Expenses rose by 3%. Other expenses were increased by advisory fees related to the public voluntary bid for Pohjola shares and tax penalty payment, amounting to a total of EUR 4 million. Furthermore, sales commissions paid by Non-life Insurance increased. Discontinued operations Earnings of discontinued operations before tax improved by EUR 14 million to EUR 36 million (21) due to higher performance-based management fees. Asset Management net commissions and fees increased by EUR 13 million year on year, or by 25%. Risk management The purpose of risk management is to identify threats and opportunities affecting strategy implementation. The objective is to help achieve the targets set in the strategy by ensuring that risks are proportional to risk-bearing capacity. Pohjola Group’s major risks include credit risk, market risk, liquidity risk and underwriting risk. Strategic and operational risks, such as changes in the operating environment, competition or customer behaviour, are inherently related to all Group business lines. A description of the risk management principles can be found in Note 2 “Pohjola Group’s Risk Management and Capital Adequacy Management Principles”.
4
Pohjola Bank plc Report by the Board of Directors and Financial statements 2014
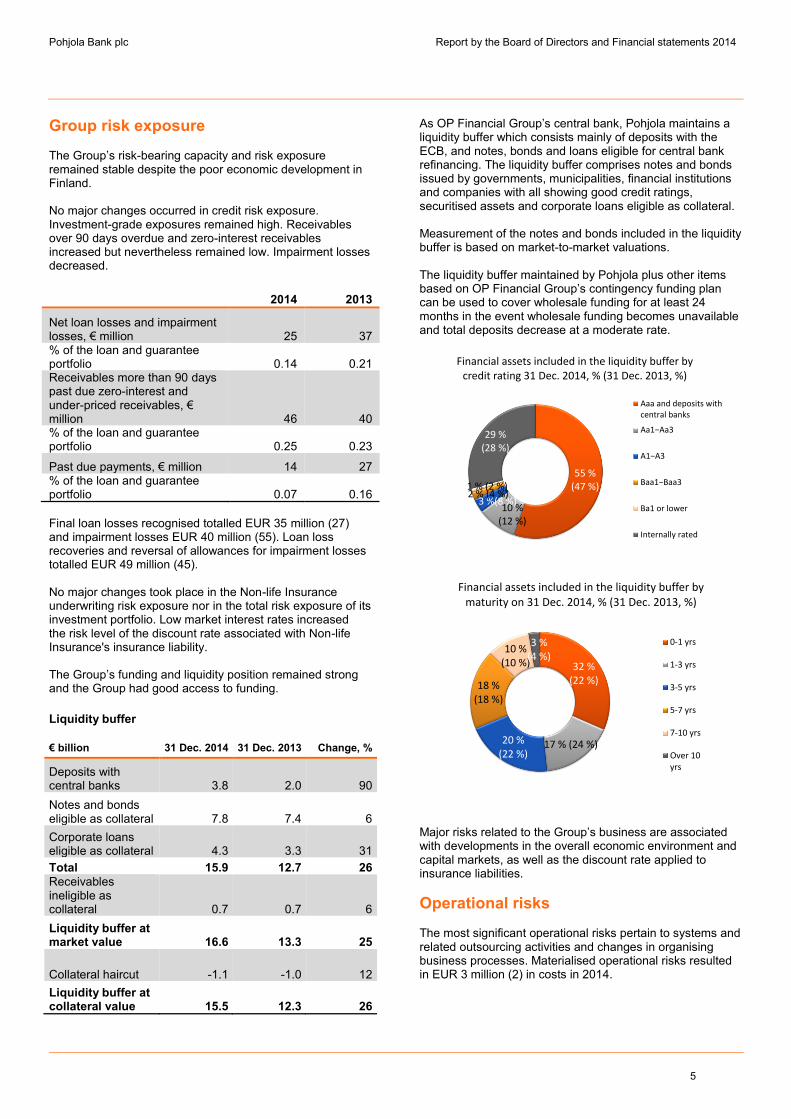
Group risk exposure The Group’s risk-bearing capacity and risk exposure remained stable despite the poor economic development in Finland. No major changes occurred in credit risk exposure. Investment-grade exposures remained high. Receivables over 90 days overdue and zero-interest receivables increased but nevertheless remained low. Impairment losses decreased. 2014 2013
Net loan losses and impairment losses, € million 25 37 % of the loan and guarantee portfolio 0.14 0.21 Receivables more than 90 days past due zero-interest and under-priced receivables, € million 46 40 % of the loan and guarantee portfolio 0.25 0.23
Past due payments, € million 14 27 % of the loan and guarantee portfolio 0.07 0.16 Final loan losses recognised totalled EUR 35 million (27) and impairment losses EUR 40 million (55). Loan loss recoveries and reversal of allowances for impairment losses totalled EUR 49 million (45). No major changes took place in the Non-life Insurance underwriting risk exposure nor in the total risk exposure of its investment portfolio. Low market interest rates increased the risk level of the discount rate associated with Non-life Insurance's insurance liability. The Group’s funding and liquidity position remained strong and the Group had good access to funding. Liquidity buffer
€ billion 31 Dec. 2014 31 Dec. 2013 Change, %
Deposits with central banks 3.8 2.0 90 Notes and bonds eligible as collateral 7.8 7.4 6 Corporate loans eligible as collateral 4.3 3.3 31 Total 15.9 12.7 26 Receivables ineligible as collateral 0.7 0.7 6 Liquidity buffer at market value 16.6 13.3 25
Collateral haircut -1.1 -1.0 12 Liquidity buffer at collateral value 15.5 12.3 26
As OP Financial Group’s central bank, Pohjola maintains a liquidity buffer which consists mainly of deposits with the ECB, and notes, bonds and loans eligible for central bank refinancing. The liquidity buffer comprises notes and bonds issued by governments, municipalities, financial institutions and companies with all showing good credit ratings, securitised assets and corporate loans eligible as collateral. Measurement of the notes and bonds included in the liquidity buffer is based on market-to-market valuations. The liquidity buffer maintained by Pohjola plus other items based on OP Financial Group’s contingency funding plan can be used to cover wholesale funding for at least 24 months in the event wholesale funding becomes unavailable and total deposits decrease at a moderate rate.
Major risks related to the Group’s business are associated with developments in the overall economic environment and capital markets, as well as the discount rate applied to insurance liabilities. Operational risks The most significant operational risks pertain to systems and related outsourcing activities and changes in organising business processes. Materialised operational risks resulted in EUR 3 million (2) in costs in 2014.
55 % (47 %)
10 %(12 %)
3 %(8 %)2 % (4 %)1 % (2 %)
29 %(28 %)
Financial assets included in the liquidity buffer by credit rating 31 Dec. 2014, % (31 Dec. 2013, %)
Aaa and deposits withcentral banks
Aa1−Aa3
A1−A3
Baa1−Baa3
Ba1 or lower
Internally rated
32 %(22 %)
17 % (24 %)20 % (22 %)
18 % (18 %)
10 %(10 %)
3 % (4 %)
Financial assets included in the liquidity buffer bymaturity on 31 Dec. 2014, % (31 Dec. 2013, %)
0-1 yrs
1-3 yrs
3-5 yrs
5-7 yrs
7-10 yrs
Over 10yrs
5

Pohjola Bank plc Report by the Board of Directors and Financial statements 2014
Group’s capital adequacy Capital base and capital adequacy
Pohjola Group’s Common Equity Tier 1 (CET1) ratio was 12.4% (11.9) on 31 December. In December, Pohjola Insurance Ltd decided to distribute EUR 130 million in interim dividends for 2014 profit to Pohjola Bank plc, which increased the CET1 ratio by 0.6 percentage points. Pohjola Group’s minimum CET1 target is 15% by the end of 2016. The capital adequacy ratio was 16.6% (16.5), as against the minimum regulatory requirement of 8%. The capital adequacy ratios have been presented in accordance with the new Capital Requirements Regulation (CRR) since 1 January 2014, and the comparatives have not been restated. The CET1 capital increased by EUR 259 million to EUR 2,700 million because of strong earnings performance in Banking and the interim dividend paid by Pohjola Insurance Ltd. Risk-weighted assets increased by EUR 1,341 million to EUR 22 billion at the end of December, thanks to growth in the corporate loan portfolio and the additional requirement for market risk set by EBA. The quality of the loan portfolio improved slightly. Of the risk-weighted assets, EUR 3.9 billion included intra-Group insurance holdings.
Pohjola Group belongs to OP Financial Group, whose capital adequacy is supervised in accordance with the Act on the Supervision of Financial and Insurance Conglomerates. Pohjola Group’s capital adequacy ratio under the Act was 1.76 (1.67) on 31 December.
Capital adequacy under the Act on the Supervision of Financial and Insurance Conglomerates
Regulatory changes under Basel III and Solvency II As a result of the financial crisis, the regulatory framework for banks’ capital adequacy requirements became more rigorous. The Capital Requirements Directive and Regulation (CRD IV/CRR) were published in the EU Official Journal on 27 June 2013. These new rules and regulations entered into force on 1 January 2014, implementing the Basel III standards in phases within the EU during 2014–19. These regulatory changes are aimed, for example, at improving the quality of the capital base of banks, reducing the cyclic nature of capital requirements, decreasing banks’ indebtedness and setting quantitative limits on liquidity risk. From Pohjola’s perspective, the most important individual change in the regulations relates to the treatment of insurance holdings within a banking-led financial and insurance conglomerate. On 27 November 2013, Pohjola and OP Financial Group received permission from the Finnish Financial Supervisory Authority to treat insurance holdings within the conglomerate as risk-weighted assets. The method applied to insurance holdings leads to a risk weight of approximately 280%. The permission will be valid from 1 January 2014 until 31 December 2014 at the latest. The European Central Bank is considering an extension to the permission. The requirements for capital buffers implemented through national legislation will add to capital requirements. As of the beginning of 2015, the fixed additional capital requirement is 2.5 per cent of risk-weighted assets. The additional capital requirement as of the beginning of 2016, applying to other credit institutions relevant for financial stability, is still unconfirmed. The Finnish Financial Supervisory Authority may also set a variable additional capital requirement to reduce cyclicality. The upcoming liquidity regulation will add liquidity management costs. Profitability will play a key role when preparing for regulatory changes. As part of OP Financial Group, Pohjola as a credit institution was transferred under European Central Bank's (ECB) supervision in November 2014. In 2014, the ECB carried out a supervisory risk assessment , comprehensive asset quality review and stress test on OP Financial Group as a banking institution, including Pohjola as a credit institution. The ECB's comprehensive assessment and stress tests were aimed at making European banks more transparent
13,3
10,6
13,1
12,7
16,5 16,6
12,5
10,6
12,4
12,7 13,0 13,4
10,510,3
10,6 11,3 11,9 12,4
0,0
2,0
4,0
6,0
8,0
10,0
12,0
14,0
16,0
18,0
0
500
1 000
1 500
2 000
2 500
3 000
3 500
4 000
4 500
31 Dec.2010
31 Dec.2011
31 Dec.2012
31 Dec.2013
1 Jan.2014
31 Dec.2014
%€ million
CET 1 capital (left axis) Other Tier 1 capital (left axis)
Tier 2 capital (left axis) Capital adequacy ratio, % (right axis)
Tier 1 ratio, % (right axis) CET 1 ratio, % (right axis)
1.5 (53%)
1.1 (5%)11.8 (9%)
1.0 (7%)1.3 (-5%)
4.1 (-2%)
1.0 (-13%)
Credit and Counterparty risk
19.2 (4%)
Risk-weighted assets 31 Dec. 2014Total 21.8 € billion
(change from year end +7%)
Market risk
Operational risk
Corporate exposure
Retail exposure
Credit InstitutionexposureEquity investments
Other
1,711,41
1,70 1,75 1,67 1,76
0,0
0,5
1,0
1,5
2,0
2,5
3,0
0
500
1 000
1 500
2 000
2 500
3 000
31 Dec.2010
31 Dec.2011
31 Dec.2012
31 Dec.2013
1 Jan.2014
31 Dec.2014
€ million
Amount in excess of minimum capital requirement (left axis)
Minimum capital requirement for insurance operations (left axis), minimum solvency margin according to Solvency I
Minimum capital requirement for credit institutions (left axis), 8% of RWA
Capital Adequacy under the Act on the Supervision of Financial and Insurance Conglomerates (right axis)
Statutory minimum requirement for capital adequacy 1.00 (right axis)
6

Pohjola Bank plc Report by the Board of Directors and Financial statements 2014
and ensuring that they have sufficient capital. A total of 130 European banks took part in the new type of comprehensive assessment carried out using uniform principles and a tight schedule. The results of the comprehensive assessment were published on 26 October 2014. According to the results, OP Financial Group's risk-bearing capacity was strong. Based on the comprehensive assessment results, the credit and counterparty risk model applied to the fair value measurement of derivatives and the model for collective impairment for receivables were updated. These changes had no significant effect on the financial statements or accounting policies. Changes in the insurance sector’s Solvency II regulations aim to improve the quality of insurance companies’ capital base, improve their risk management, increase the risk-based capital requirements and harmonise insurance sector solvency requirements in Europe. The regulations are still being processed, and are scheduled to come into effect at the beginning of 2016. The estimated solvency ratio on 31 December under the Solvency II framework, excluding the effect of transition provisions, was 117% (125). The estimated buffer relative to the solvency capital requirement under Solvency II was EUR 119 million (181). The transition provisions are expected to improve the capital buffer. Non-life Insurance capital base and solvency ratio *) under Solvency II € million 31 Dec.
2014 31 Dec.
2013 Target
Tier 1 754 844 Tier 2 50 50
Capital base (Solvency II) 804 894 Solvency capital requirement (SCR) 685 713
Solvency ratio (Solvency II), % *) 117 125 120 *) According to the Solvency II draft (EU 138/2009)
7

Pohjola Bank plc Report by the Board of Directors and Financial statements 2014
Capital base and capital adequacy
The Group has presented its capital base and capital adequacy of 31 December 2014 in accordance with the EU capital requirement regulation and directive (EU 575/2013) (CRR) entered into force on 1 January 2014. Comparatives for 2013 are presented according to CRD III in force on 31 December 2013. In addition, an estimate of the figures a year ago under CRR is presented in column CRR 1 Jan. 2014.
CRR CRR CRD3
EUR million
31 Dec 2014
1 Jan 2014 31 Dec 2013 Shareholders' equity
3,408 3,150 3,150
Elimination of insurance companies' effect in equity capital (equity capital and Group eliminations)
-183 -137 -137
Fair value reserve, cash flow hedging
-17 -11 -11 Common Equity Tier 1 (CET1) before deductions
3,209 3,001 3,001
Intangible assets
-195 -193 -193 Excess funding of pension liability, valuation adjustments, indirect holdings and deferred tax assets for losses -1 -8 -4 Planned profit distribution / profit distribution as proposed by the Board -141 -212 -212 Unrealised gains under transitional provisions
-50 -31 -31
Investments in insurance companies and financial institutions
-703 Shortfall of impairments – expected losses
-122 -115 -50
Common Equity Tier 1 (CET1)*)
2,700 2,441 1,808 Subordinated loans to which transitional provision applies 219 219 274 Shortfall of Tier 2 capital
-38
Additional Tier 1 capital (AT1)
219 219 235 Tier 1 capital (T1)
2,919 2,660 2,043
Debenture loans
663 683 683 Unrealised gains under transitional provisions
50 31 31
Investments in insurance companies and financial institutions
-703 Shortfall of impairments – expected losses
-50
Reclassification into AT1
38 Tier 2 Capital (T2)
713 714
Total capital base
3,633 3,375 2,043
Risk-weighted assets Credit and counterparty risk Central government and central banks exposure
26 82 82 Credit institution exposure
1,305 1,368 1,140
Corporate exposure
11,831 10,848 10,965 Retail exposure
1,010 941 941
Equity investments**)
4,132 4,205 195 Other ***)
931 1,013 684
Market risk
1,467 958 958 Operational risk
1,137 1,083 1,083
Total
21,839 20,499 16,048
Ratios, % CET1 capital ratio
12.4 11.9 11.3 Tier 1 ratio
13.4 13.0 12.7
Capital adequacy ratio
16.6 16.5 12.7
Basel I floor, EUR million Capital base
3,633 3,375 Basel I capital requirements floor
1,441 1,239
Capital buffer for Basel I floor 2,192 2,136 *) The row of CET1 based on CRD III figures shows Core Tier as defined by the EBA
8

Pohjola Bank plc Report by the Board of Directors and Financial statements 2014
Capital adequacy under the Act on the Supervision of Financial and Insurance Conglomerates
EUR million 31 Dec 2014 1 Jan 2014 31 Dec 2013
Pohjola Group's equity capital
3,408 3,150 3,150
Hybrid instruments, perpetual bonds and debenture bonds
932 952 1 007 Other sector-specific items excluded from capital base
-91 -107 -5
Goodwill and intangible assets
-863 -880 -880 Equalisation provision
-172 -198 -198
Proposed profit distribution
-141 -212 -212 Items under IFRS deducted from capital base*
-19 -24 -122
Shortfall of impairments – expected losses
-106 -99 -99 Conglomerate's capital base, total
2,948 2,581 2,639
Regulatory capital requirement for credit institutions**
1,433 1,326 1,284 Regulatory capital requirement for insurance operations***
247 222 222
Conglomerate’s total minimum capital requirement
1,680 1,548 1,506 Conglomerate’s capital adequacy
1,269 1,033 1,134
Conglomerate's capital adequacy ratio (capital resources/minimum of capital resources) 1.76 1.67 1.75
* Excess funding of pension liability, Fair value measurement of investment property, Portion of cash flow hedge of fair value reserve ** Risk-weighted assets x 8% *** Minimum solvency margin OP Financial Group's capital adequacy ratio was 1.89 (1.90).
Credit ratings Pohjola Bank plc’s credit ratings on 31 December 2014 Rating agency
Short-term debt
Outlook Long-term debt
Outlook
Standard & Poor's
A-1+ Negative AA- Negative
Moody's P-1 Negative Aa3 Negative Fitch F1 Stable A+ Stable Pohjola Insurance Ltd’s financial strength ratings on 31 December 2014 Rating agency Rating Outlook Standard & Poor's AA- Negative Moody's A3 Stable In 2014, no changes occurred in the credit rating of Pohjola Bank plc and the financial strength rating of Pohjola Insurance Ltd affirmed by Fitch Ratings Limited, Standard & Poor’s Credit Market Services Europe Limited and Moody’s Investors Services Ltd, including their rating outlook. On 22 October 2014, S&P affirmed Pohjola Bank plc's long-term and short-term debt ratings, and on 31 October 2014 it affirmed Pohjola Insurance Ltd's financial strength rating. The outlook for both companies remained negative. Moody's affirmed on 29 May 2014 Pohjola Bank plc's long-term and short-term debt rating and changed the outlook from stable to negative as part of its extensive review of the European banking sector. Moody's affirmed Pohjola
Insurance Ltd's credit rating on 26 June 2014 while keeping the outlook stable. On 24 June 2014, Fitch Ratings affirmed OP Financial Group’s and Pohjola Bank plc’s long-term and short-term debt rating and kept the outlook stable. Pohjola’s efficiency-enhancement programme The efficiency-enhancement programme launched within Pohjola in late 2012 is aimed at achieving annual cost savings of around EUR 50 million by the end of 2015. The programme aims at annual cost savings of EUR 150 million within the whole OP Cooperative by the end of 2015. A total of 55% of the annual savings target of EUR 50 million was achieved in 2013 and a total of 20% in 2014. The Group expects to achieve the rest of the target in 2015. As its financial target, Pohjola Group aims to keep its total expenses at the end of 2015 at the levels recorded at the end of 2012. Cost savings out of the EUR 12 million estimated for 2014 based on the efficiency-enhancement programme amounted to EUR 10 million.
9

Pohjola Bank plc Report by the Board of Dictors and Financial statements 2014
Financial performance and risk exposure by business segment Continuing operations Banking
Earnings before tax improved to EUR 303 million (251) because of strong growth in income and a reduction in impairment losses.
The loan portfolio grew by 5% to EUR 14.9 billion (14.2) and the average corporate loan portfolio margin decreased by 13 basis points to 1.44%.
Impairment loss on receivables decreased to EUR 25 million (35), accounting for 0.14% of the loan and guarantee portfolio (0.20).
The operating cost/income ratio was 33% (36). Banking: financial results and key figures and ratios € million 2014 2013 Change %
Net interest income
Corporate and Baltic Banking 255 227 12
Markets 28 -3
Total 283 224 26
Net commissions and fees 103 100 3 Net trading income 84 101 -17
Other income 18 17 5 Total income 488 443 10 Expenses
Personnel costs 55 57 -5
ICT costs 34 31 12
Depreciation and amortisation 14 15 -8
Other expenses 57 54 5 Total expenses 160 157 2 Earnings before impairment loss on receivables 328 285 15 Impairment loss on receivables 25 35 -27
Earnings before tax 303 251 21 Earnings before tax at fair value 301 260 16
Loan portfolio, € billion 14.9 14.2 5 Guarantee portfolio, € billion 2.7 2.7 1
Risk-weighted assets *), € billion 16.0 14.3 Margin on corporate loan portfolio, % 1.44 1.57 -8 Ratio of receivables more than 90 days past due and zero-interest receivables to loan and guarantee portfolio, % 0.26 0.23
Ratio of impairment loss on receivables to loan and guarantee portfolio, % 0.14 0.20
Operating cost/income ratio, % 33 36 Personnel 616 634 *) In accordance with the EU capital requirements regulation and directive (EU 575/2013) (CRR) entered into force on 1 January 2014 2014 earnings Earnings before tax improved to EUR 303 million (251). Total income increased by 10% and expenses by 2%. Impairment loss on receivables decreased to EUR 25 million (35).
The loan portfolio grew by 5% to EUR 14.9 billion mainly due to increased demand for working capital products. Demand for corporate loans remained weak, and as a result of toughening competition, the average margin on the corporate loan portfolio decreased by 13 basis points to 1.44% (1.57).
10

Pohjola Bank plc Report by the Board of Directors and Financial statements 2014
Net interest income from Markets and net trading income improved as a result of growth in client trading and income from trading. A change in the credit and counterparty risk model applied to the fair value measurement of derivatives eroded net trading income by EUR 16 million. The guarantee portfolio remained unchanged from the year before, totalling EUR 2.7 billion. Committed standby credit facilities amounted to EUR 3.2 billion (3.1). Net commissions and fees increased by 3% to EUR 103 million as a result of higher fees on lending, securities issuance and custody. Total expenses increased by 2% to EUR 160 million due to higher ICT costs. Earnings before tax by division
€ million 2014 2013 Change %
Corporate Banking 220 184 19 Markets 82 66 24 Baltic Banking 0 0 Total 303 251 21 Risk exposure by Banking Within Banking, key risks are associated with credit risk arising from customer business, and market risks. Credit risk exposure Credit risk monitoring highlights developments in total exposure and customer credit rating. Total exposure means the total amount of receivables and off-balance-sheet items exposed to credit risk, including the principal and interest less impairment loss based on individually assessed receivables. Risk exposure by Banking remained favourable. The exposure rating distribution remained good. In 2014, total exposure increased by EUR 1.8 billion to EUR 26.9 billion. Total exposure by countereparty
€ billion 31 Dec
2014 31 Dec
2013 Change, % Corporates and housing associations 21.3 20.4 5 Financial institutions and insurance companies 2.7 2.2 22 Member banks and OP Cooperative 0.2 0.2 8 Public-sector entities 1.3 1.0 32 Households 1.2 1.1 6 Non-profit organisations 0.2 0.2 1 Total 26.9 25.1 7
Total exposure is divided by counterparty into six customer groups. The largest customer group was corporate customers (including housing corporations) exposures representing 79% (81) of total Banking exposures. Corporate
customer exposures increased by EUR 0.9 billion i.e. 5% during the year. Total exposure by rating category
Rating category 31 Dec
2014 31 Dec
2013
Change,
€ bn
1–2 2.7 2.4 0.2 3–5 13.7 12.3 1.4 6–7 6.6 6.5 0.0 8–9 2.1 2.0 0.1 10 0.1 0.2 -0.1
11–12 0.2 0.3 -0.1
Non-rated 0.3 0.2 0.1
Households 1.2 1.1 0.1 Total 26.9 25.1 1.7
The ratio of investment-grade exposure – i.e. rating categories 1–5 – to total exposure, excluding households, remained at a healthy level, standing at 64% (62). The proportion of rating categories 11–12 was 0.9% (1.3). Of corporate customer exposure, the investment-grade exposure accounted for 58% (56) and the exposure of the lowest two rating categories amounted to EUR 234 million (310), accounting for 1.1% (1.5) of the total corporate exposure. Corporate and housing association exposure by rating category
Rating category 31 Dec 2014 31 Dec 2013 Change,
€ bn
1–2 1.0 1.1 0.0 3–5 11.4 10.4 1.0 6–7 6.3 6.3 0.0 8–9 2.0 2.0 0.0 10 0.1 0.2 -0.1 11–12 0.2 0.3 -0.1 Non-rated 0.3 0.2 0.1 Total 21.3 20.4 0.9
Corporate exposure by industry remained highly diversified. The most significant industries included Energy 11.0% (7.5), Wholesale and Retail Trade 10.7% (10.2) and Renting and Operating of Residential Real Estate 9.9% (9.9). A total of 45% of exposures within Renting and Operating of Residential Real Estate were guaranteed by general government. Baltic Banking exposures totalled EUR 1.2 billion (0.8), accounting for 4.3% (3.2) of total Banking exposures. Large customer risks Large customer risks include customer risks whose direct exposure exceeds 10% of the Group’s capital base. The amount of large corporate customer exposures totalled EUR 0.4 billion (2.7) at the end of 2014. Pohjola’s own funds
11

Pohjola Bank plc Report by the Board of Directors and Financial statements 2014
covering the Group’s large customer exposure increased to EUR 3.6 billion (2.1). Past due payments, doubtful receivables and impairment loss Past due payments decreased by EUR 13 million to EUR 14 million and their ratio to the total loan and guarantee portfolio was 0.07% (0.16). Net loan losses and impairment losses within Banking amounted to EUR 25 million (35), accounting for 0.14% (0.20) of the loan and guarantee portfolio. Final loan losses recognised totalled EUR 35 million (17) and impairment losses EUR 40 million (55). Loan loss recoveries and reversal of allowances for impairment losses totalled EUR 49 million (38). The Baltic Banking net loan losses and impairment charges amounted to EUR 0.1 million (-0.8). In Banking, the definition of doubtful receivables was aligned with EBA's guideline on forbearance that will enter into force in 2015. Compared to the earlier definition, this increased the amount of receivebles reported as doubtful. The redefined doubtful receivables of Banking totalled EUR 263 million, as against EUR 278 million calculated in a comparable manner a year earlier. Market risk exposure The Markets division within Banking is mostly exposed to interest rate risk.The interest rate risk by Banking in the event of a one-percentage-point change in the interest rate averaged EUR 13.2 million (12.4). Derivatives business Notes to the Financial Statements present derivative contracts by their purpose of use.
12

Pohjola Bank plc Report by the Board of Directors and Financial statements 2014
Non-life Insurance
Earnings before tax amounted to EUR 223 million (166). Earnings before tax at fair value were EUR 272 million (149). A reduction in the discount rate for pension liabilities decreased earnings by EUR 62 million (38).
Insurance premium revenue increased by 5% (11). The number of loyal customer households increased by 39,658 (45,612). Operating profitability improved from the previous year. The operating combined ratio was 84.7% (86.9) and operating
expense ratio 18.4% (18.7). Return on investments at fair value was 6.7% (3.5).
Non-life Insurance: financial results and key figures and ratios € million 2014 2013 Change %
Insurance premium revenue 1,310 1,249 5
Claims incurred -930 -889 5
Operating expenses -242 -234 3
Amortisation adjustment of intangible assets -21 -21 0
Balance on technical account 117 104 Net investment income 171 131 30
Other income and expenses -66 -70 -6
Earnings before tax 223 166 34 Earnings before tax at fair value 272 149 82
Combined ratio, % 91.0 91.6 Operating combined ratio, % 84.7 86.9
Operating loss ratio, % 66.3 68.1 Operating expense ratio, % 18.4 18.7
Operating risk ratio, % 60.2 61.7 Operating cost ratio, % 24.4 25.2
Return on investments at fair value, % 6.7 3.5 Solvency ratio , % 75 73
Solvency ratio (Solvency II), % *) 117 125
Large claims incurred retained for own account -79 -73
Changes in claims for previous years (run off result) 27 10
Personnel 1,766 1,872 *) According to the Solvency II draft (EU 138/2009) 2014 earnings
Earnings before tax improved to EUR 223 million (166) as a result of the operating balance on technical account that was better than a year ago as well as the strong investment performance. The reduction in the discount rate for pension liabilities from 2.8% to 2.5% increased claims incurred by EUR 62 million. A year earlier, the reduced discount rate for technical provisions increased claims incurred by EUR 38 million. Excluding the effect of the reduced discount rate, profitability improved as a result of the increase in insurance premium revenue and favourable claims developments. Insurance premium revenue increased by 5%. The operating balance on technical account improved to EUR 201 million (164) and the operating combined ratio was 84.7% (86.9). These key operating figures exclude changes in reserving bases and amortisation on intangible assets arising from the corporate acquisition. The combined ratio, including the above-mentioned items, was 91.0% (91.6).
Insurance premium revenue
€ million 2014 2013 Change %
Private Customers 687 630 9.1
Corporate Customers 568 567 0.1
Baltics 55 52 6.1 Total 1,310 1,249 4.9
Developments in insurance premium revenue were twofold. Growth in insurance premium revenue remained strong among private customers and in the Baltic States. Among corporate customers, the general economic situation affected developments and insurance premium revenue remained at the previous year's level. In 2013, Pohjola’s market share in terms of Non-life insurance premiums written was 30.3% (29.1). Measured in terms of the market share in premiums written, Pohjola is Finland’s largest non-life insurer.
13

Pohjola Bank plc Report by the Board of Directors and Financial statements 2014
The number of loyal customer households increased by 39,658 (45,612) from the levels recorded at the end of 2013. On 31 December, the number of loyal customer households totalled 655,264 (615,606), of which up to 75% (73) also use OP Financial Group cooperative banks as their main bank. Customers of OP Financial Group member cooperative banks and Helsinki OP Bank used OP bonuses that they had earned through the use of banking and insurance services to pay 1,912,000 insurance bills (1,783,000), with 255,000 (253,000) paid in full using bonuses. Insurance premiums paid using bonuses totalled EUR 95 million (89). Pohjola has decided to expand the business of Omasairaala Oy, which started operations in 2013 in the Helsinki Metropolitan Area, by opening four new private hospitals in Finland. It will also expand to new fields of specialised medicine and occupational healthcare. The nationwide hospital network is built under the Pohjola brand. Omasairaala will change its name to Pohjola Health Ltd in the autumn of 2015. Sales of policies to private and corporate customers increased by 1% over the previous year. Excluding the reduction in the discount rate for pension liabilities, claims incurred would have increased by 2%. Excluding large claims, claims development was favourable. Claims incurred arising from new large claims were higher than a year ago. The reported number of large claims under property and business liability insurance (in excess of EUR 0.3 million) amounted to 82 (77), with their claims incurred retained for own account totalling EUR 79 million (73). The change in provisions for unpaid claims under statutory pension increased to EUR 62 million (59). Changes in claims for previous years, excluding the effect of changes to the discount rate, improved the balance on technical account by EUR 27 million (10). The operating loss ratio was 66.3% (68.1) and the risk ratio (excluding indirect loss adjustment expenses) 60.2% (61.7). Operating expenses increased by 3%. Thanks to increased earnings, the operating expense ratio improved to 18.4% (18.7). Higher sales commissions paid in non-life insurance added to operating expenses. The operating cost ratio (incl. indirect loss adjustment expenses) was 24.4% (25.4). Other income and expenses decreased by EUR 4 million, which improved the financial results. Operating balance on technical account and
combined ratio (CR)
2014
2013
Balance, € million CR, %
Balance, € million CR, %
Private Customers 142 79.4 111 82.4 Corporate Customers 54 90.5 48 91.5 Baltics 6 90.0 5 90.2 Total 201 84.7 164 86.9
Profitability was improved by the positive growth in premium income from private customers and the favourable development of losses. With respect to corporate customers, lower operating
expenses improved the financial results. In the Baltic countries, profitability improved slightly from the previous year. Investment Investment income at fair value was better than a year ago because of a significant decline in interest rates. Investment income at fair value amounted to EUR 220 million (115), or 6.7% (3.5). Net investment income recognised in the income statement amounted to EUR 171 million (131). Risk exposure by Non-life Insurance Major risks within Non-life Insurance include underwriting risks associated with claims developments, market risks associated with investments covering insurance liabilities, and the discount rate applied to insurance liabilities. The Solvency II Directive regulating the solvency requirements of insurance companies will come into force at the beginning of 2016. On 31 December, the Non-life Insurance capital base under Solvency II totalled EUR 804 million (894) and capital requirement EUR 685 million (713). The solvency ratio conforming to Solvency II was 117% (125). These figures do not include the effects of transitional provisions. The transitional provisions are expected to improve the capital buffer. The capital adequacy of Non-life Insurance amounted to EUR 988 million (913) at the end of December. The ratio between solvency capital and insurance premium revenue (solvency ratio) was 75% (73). Equalisation provisions were EUR 215 million (248). Underwriting risk exposure No significant changes took place in Non-life Insurance's underwriting risks. Low market interest rates increased the risk level of the discount rate associated with Non-life Insurance's insurance liability. The reinsurance of Non-life Insurance is managed on a centralised basis. Retention in both risk-specific reinsurance and catastrophe reinsurance is a maximum of EUR 5 million. The capacity of catastrophe reinsurance covering loss accumulation amounted to EUR 150 million. In addition, retention in large claims under the short-tail insurance products had an annual aggregate protection with a capacity of EUR 15 million in 2014. This protection will be brought into use when an annual claims expenditure arising from large claims is higher than usual. The number and size of claims vary annually. The year-on-year variation in earnings generated by the underwriting business is, to a large extent, explained by the claims incurred resulting from large claims. A large part of insurance liabilities consists of annuities affected by estimated mortality and the discount rate used. Estimated mortality is based on the mortality model commonly used by Finnish insurers, which assumes the current trend of an increase in life expectancy to continue. This model was last updated in 2011. The duration of insurance liabilities was 12.7 years (12.6) Discounted insurance liabilities amounted to EUR 1,658
14

Pohjola Bank plc Report by the Board of Directors and Financial statements 2014
million (1,568). They were discounted using the discount rate of 2.5% (2.8). Part of the insurance liabilities are hedged with insterst rate derivatives. The positive fair values of these derivatives totalling to EUR 12 million (0) have been added to insurance liabilities and excluded from solvency margin as exceptional items. The remaining part of insurance liabilities, EUR 947 million (953), were undiscounted, with a duration of 2.1 years (2.1). Investment risk exposure Non-life Insurance’s investment portfolio totalled to EUR 3,522 million (3,219) on December 31.
Investment portfolio by asset class
% 31 Dec. 2014 31 Dec. 2013
Bonds and bond funds 73 72 Alternative investments 1 1 Equities 7 10 Private equity 3 3 Real property 11 10 Money market instruments 5 4 Total 100 100 The fixed-income portfolio by credit rating remained healthy, considering that investments within the “investment-grade” category represented 94% (91), and 71% (74) of the investments were rated at least A–. The average residual term to maturity of the fixed-income portfolio was 4.5 years (4.4) and the duration 4.3 years (3.7). The running yield for direct bond investments averaged 1.9% (2.7) at the end of December. Non-life Insurance’s open currency position was EUR 157 million (136), accounting for 4% of the investment portfolio. As a whole, no major changes took place to investment risk levels. Pohjola reduced slightly the equity risk associated with the investment portfolio. The risk level of bonds and illiquid investments was slightly increased.
15

Pohjola Bank plc Report by the Board of Directors and Financial statements 2014
Group Functions
Earnings before tax amounted to EUR 20 million (39). These included EUR 7 million (14) in capital gains on notes and bonds and EUR 43 million (28) in dividend income.
Earnings before tax at fair value were EUR 53 million (33). Liquidity and access to funding remained good.
Group Functions: financial results and key figures and ratios € million 2014 2013 Change %
Net interest income -3 27 Net commissions and fees 4 -1 Net trading income -8 -12 -34 Net investment income 55 46 18 Other income 9 9 -4 Total income 56 69 -18 Personnel costs 6 6 1
Other expenses 30 21 43
Total expenses 36 27 33 Earnings before impairment loss on receivables 20 41 -51 Impairment loss on receivables 2 Earnings before tax 20 39 -48 Earnings before tax at fair value 53 33 60 Liquidity buffer, € billion 16.6 13.3 25 Risk-weighted assets, € billion *) 5.7 6.0 Receivables and liabilities from/to OP Cooperative entities, net position, € billion 3.8 4.7
Central Banking earnings, € million 17 9 93 Personnel 33 26 *) In accordance with the EU capital requirements regulation and directive (EU 575/2013) (CRR) entered into force on 1 January 2014 2014 earnings Group Functions's earnings before tax were EUR 20 million, or EUR 19 million lower than a year ago. Earnings before tax at fair value totalled EUR 53 million, or EUR 20 million higher than the year before. Net interest income was reduced by persistently low interest rates and as the Group was preparing for tighter liquidity regulation. A credit limit granted to OP Cooperative relating to financing for the bid for Pohjola shares added to net commissions and fees. Net investment income included EUR 7 million in capital gains on notes and bonds (14), EUR 43 million (28) in dividend income and EUR 7 million (0) in income recognised from mutual fund investments. Dividend income includes EUR 14 million (16) in interest paid on cooperative capital by Suomen Luotto-osuuskunta and EUR 12 million (5) of dividends paid by OP Life Assurance. Other expenses included EUR 2 million of tax-related penalty interest and EUR 2 million of advisory fees related to the public voluntary bid for Pohjola shares. The total expenses decreased in the last quarter as the amounts of expense provisions were revised. Pohjola’s access to funding remained good. In January-December, Pohjola issued long-term bonds worth EUR 3.5 billion. In March, Pohjola issued two senior bonds in the international capital market, each worth EUR 750 million with a maturity of three and seven years. In June, Pohjola issued
a senior bond worth EUR 750 million with a maturity of five years and two Samurai bonds in the Japanese market worth a total of EUR 60 billion yen (EUR 432 million). OP Mortgage Bank, which is part of OP Financial Group, issued three covered bonds each worth EUR 1.0 billion. The maturity of the bond issued in March is seven years, that of the bond issued in June five years and that of the bond issued in November ten years. On 31 December, the average margin of senior wholesale funding was 39 basis points (40). Risk exposure by Group Functions Credit risk exposure Major risks exposed by the Group Functions include credit and market risks associated with the liquidity buffer, and liquidity risks. The Group Functions exposure totalled EUR 22.7 billion (19.8), consisting of notes and bonds to secure OP Financial Group’s liquidity, deposits with central banks and receivables from OP Financial Group cooperative banks. A total of 99% (99) of the exposure came from investment-grade counterparties. Group member cooperative banks and OP Cooperative with its subsidiaries form a significant customer group for Pohjola Bank plc acting as OP Financial Group’s central financial institution. Group member cooperative banks’ and
16

Pohjola Bank plc Report by the Board of Directors and Financial statements 2014
OP Cooperative’s exposure increased by EUR 0.9 billion, or roughly 9%, year on year. All of their exposure was investment-grade exposure. Total exposure by rating category, EUR billion
Rating category
31 Dec 2014
31 Dec 2013 Change
1–2 19.2 16.8 2.3 3–5 3.3 2.7 0.5 6–7 0.1 0.1 0.0 8–9 0.1 0.1 0.0 10 0.0 0.0 Total 22.7 19.8 2.8
The share of central bank deposits in liquidity buffer investments was increased and that of notes and bonds eligible as collateral increased. Market risk exposure In January-December, the interest rate risk by Group Functions in the event of a one percentage-point change in the interest rate averaged EUR 14.9 million (28.4).
17
Pohjola Bank plc Report by the Board of Directors and Financial statements 2014
Financial performance and risk exposure by business segment Discontinued operations Asset Management
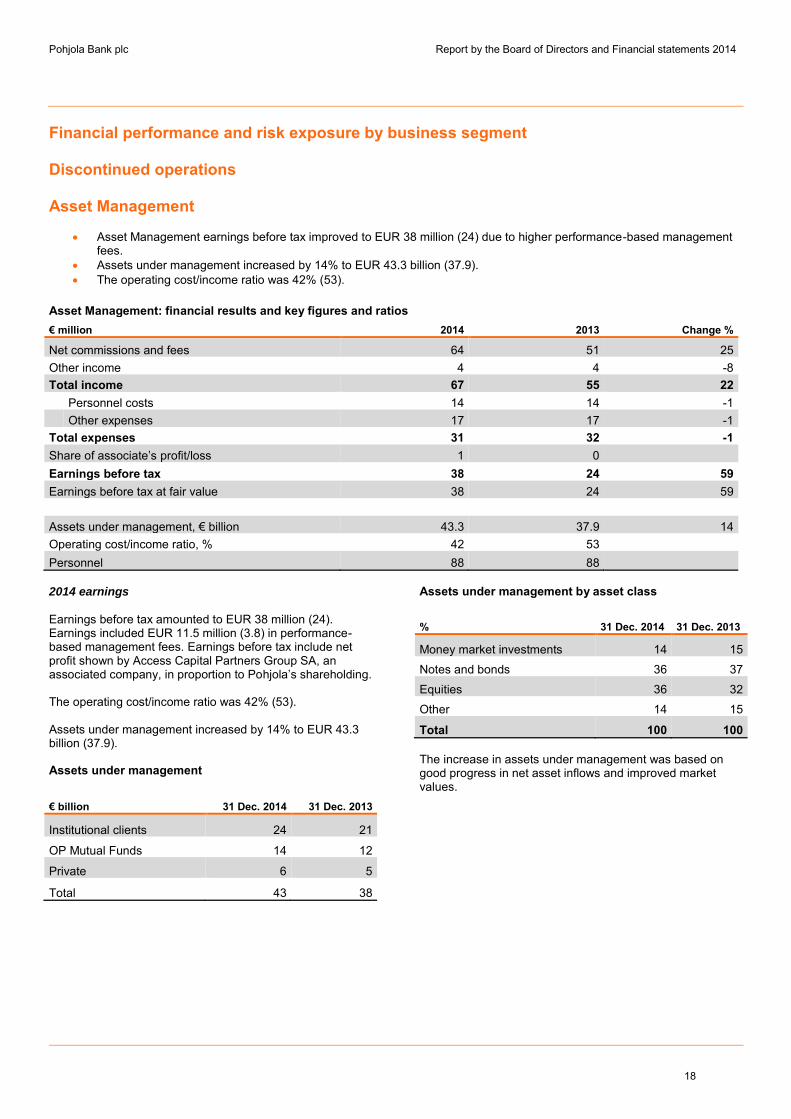
Asset Management earnings before tax improved to EUR 38 million (24) due to higher performance-based management fees.
Assets under management increased by 14% to EUR 43.3 billion (37.9). The operating cost/income ratio was 42% (53).
Asset Management: financial results and key figures and ratios € million 2014 2013 Change %
Net commissions and fees 64 51 25 Other income 4 4 -8 Total income 67 55 22
Personnel costs 14 14 -1
Other expenses 17 17 -1 Total expenses 31 32 -1 Share of associate’s profit/loss 1 0 Earnings before tax 38 24 59 Earnings before tax at fair value 38 24 59
Assets under management, € billion 43.3 37.9 14 Operating cost/income ratio, % 42 53
Personnel 88 88 2014 earnings Earnings before tax amounted to EUR 38 million (24). Earnings included EUR 11.5 million (3.8) in performance-based management fees. Earnings before tax include net profit shown by Access Capital Partners Group SA, an associated company, in proportion to Pohjola’s shareholding. The operating cost/income ratio was 42% (53). Assets under management increased by 14% to EUR 43.3 billion (37.9). Assets under management
€ billion 31 Dec. 2014 31 Dec. 2013
Institutional clients 24 21
OP Mutual Funds 14 12
Private 6 5
Total 43 38
Assets under management by asset class
% 31 Dec. 2014 31 Dec. 2013
Money market investments 14 15
Notes and bonds 36 37
Equities 36 32
Other 14 15
Total 100 100 The increase in assets under management was based on good progress in net asset inflows and improved market values.
18

Pohjola Bank plc Report by the Board of Directors and Financial statements 2014
Personnel and remuneration On 31 December 2014, the Group had a staff of 2,503, or 117 less than on 31 December 2013. Personnel by segment 31 Dec. 2014 31 Dec. 2013
Banking 616 634 Non-Life Insurance 1,766 1,872 Asset Management 88 88 Group Functions 33 26 Total 2,503 2,620 A total of 468 Group employees (462) worked abroad. The scheme for variable remuneration within OP Financial Group and Pohjola consists of short-term, company-specific incentives and OP Financial Group-wide long-term incentives. More detailed information on remuneration can be found in the Notes to the Financial Statements. Capital expenditure Capital expenditure for 2014 totalled EUR 28 million (45), Banking accounting for EUR 10 million (15), Non-life Insurance for EUR 14 million (27), Asset Management for EUR 2 million (2) and Group Functions for EUR 2 million (1). Capital expenditure mainly came from ICT investments. Corporate social responsibility Corporate social responsibility (CSR) is an integral part of Pohjola’s business and, according to the strategy, is further developed as part of OP Financial Group's CSR programme. More detailed information on OP Financial Group’s CSR programme can be found in OP’s Year 2014 report and OP Financial Group's GRI appendix which form CSR raport based on GRI G4 Guidelines. Management On 23 September 2014, Pohjola Bank plc's Board of Directors gave its approval to the plans to change OP Financial Group's management system and to renew the OP Financial Group Central Cooperative's organisation. The new organisation of OP Financial Group Central Cooperative entered into force on 1 October 2014. OP Financial Group's new management system will be founded on three business segments: Banking, Non-life Insurance and Wealth Management. As part of the reorganisation, Pohjola's Board of Directors decided to dissolve Pohjola Bank's Executive Committee. At the same time, the Audit Committee, Risk Management Committee and Remuneration Committee established by Pohjola’s Board of Directors were dissolved. Pohjola's operations will be managed in the future in accordance with the new management system through three business segments. In the Annual Ggeneral Meeting the following members elected to the Board of Directors: Jukka Hienonen, President and CEO; Jukka Hulkkonen, Managing Director;
Mirja-Leena (Mirkku) Kullberg, Managing Director; Marjo Partio, Managing Director; Harri Sailas, President and CEO; and Tom von Weymarn, M.Sc. (Eng.). Their term of the Board ended 7 October 2014. On 8 October 2014, OP Financial Group Central Cooperative made a unanimous decision, as referred to in Chapter 5, Subsection 1(2) of the Limited Liability Companies Act, to change Pohjola Bank plc's Articles of Association so that the Board's Chairman will be the Chairman of the Board of the amalgamation's central organisation, with at least two but no more than three other members appointed by the Annual General Meeting. Pohjola Bank plc's Chairman of the Board is President, Group Executive Chairman of OP Reijo Karhinen, and Executive Vice President of Operations of OP Tony Vepsäläinen, Chief Financial Officer of OP Harri Luhtala and Chief Risk Officer of OP Erik Palmén were appointed Board members. Jouko Pölönen has acted as Pohjola’s President and CEO. Corporate Governance Statement Pohjola Bank plc’s Corporate Governance Statement can be found on the Company’s website at www.pohjola.com. On 16 December 2014, Pohjola Bank plc's Board of Directors approved OP Financial Group's Group-level Communications and Disclosure Policy. This replaces the Disclosure Policy issued by Pohjola on 17 December 2013. Decisions by the Annual General Meeting Pohjola Bank plc's Annual General Meeting (AGM) of 20 March 2014 adopted the Financial Statements for 2013, discharged members of the Board of Directors and the President and CEO from liability and decided to distribute a dividend of EUR 0.67 per Series A share and EUR 0.64 per Series K share. KPMG Oy Ab, a firm of authorised public accountants, was elected to act as the auditor with Raija-Leena Hankonen, APA, acting as the chief auditor, appointed by KPMG Oy Ab. Pohjola Bank plc became wholly-owned by OP Cooperative OP Cooperative completed its public voluntary bid announced in February 2014 and obtained ownership of all Pohjola Bank plc shares by decision of the Arbitral Tribunal in accordance with Chapter 18, Section 6 of the Finnish Limited Liability Companies Act. As a result of the decision of the Arbitration Court, trading in the series A shares of Pohjola Bank plc ceased on 29 September 2014, and the shares were delisted from the Helsinki Stock Exchange on 30 September 2014. OP Cooperative was entered as the only shareholder in Pohjola Bank plc's shareholder register on 7 October 2014. On 29 October 2014, OP Cooperative announced that it had received permission from the arbitrators to pay minority shareholders 16.13 euros per Pohjola Bank plc share that it considered as a fair price plus statutory interest, prior to the close of the arbitration proceedings. OP Cooperative paid the undisputed part of the redemption price to Pohjola Bank plc's minority shareholders on 29 October 2014. Interest was
19

Pohjola Bank plc Report by the Board of Directors and Financial statements 2014
paid on the squeeze-out price since 6 May 2014. The interest was the statutory reference interest rate of 0.5%. According to the Redemption Committee, the arbitration procedure will last an average of approximately six months. On this basis, the overall redemption proceedings pertaining to Pohjola’s minority shares are expected to last until the first half of 2015. Group restructuring Pohjola Group is planning to carry out structural changes in accordance with the tender offer made by OP Cooperative, in practice, for example, by transferring the Non-life Insurance and Asset Management segments from Pohjola Group to direct ownership of OP Cooperative. The transfer of Asset Management is scheduled during 2015. In addition, the businesses of Helsinki OP Bank Plc and Pohjola Bank plc will be combined under the shared management. The process of planning and examination of different options regarding the restructuring of OP Financial Group Central Cooperative and the implementation of legal structures of the organisation is still underway. In the context of further planning of the restructuring, the separation of OP Financial Group's central banking operations, being presently part of Pohjola Bank plc, as a detached subsidiary fully owned by OP Financial Group Central Cooperative, is also under consideration. OP Financial Group's banking operations in their entirety will continue to fall within the scope of joint liability as laid down in the applicable law. The specific manner to implement these changes or schedule have not yet been decided. On 30 October 2014, Pohjola Health Ltd merged with Pohjola Insurance Ltd. The new name of the OP-Pohjola Group, OP Financial Group, was adopted on 1 January 2015. Shares and shareholders As a result of the completion of OP Cooperative's public voluntary bid for Pohjola Bank plc, the shares of Pohjola Bank plc were removed from the book-entry system on 28 November 2014, and Series A and K shares were combined into a single share class. Shares, votes and share capital on 31 December 2014
Number of shares Votes Share capital, € 319,551,415 319,551,415 427,617,463.01
Representative offices and branches abroad Pohjola Bank plc runs a representative office in St. Petersburg and has branches in Estonia, Latvia and Lithuania. In addition, it has subsidiaries in Estonia, Latvia and Lithuania engaged in finance-company operations. Non-life insurance business in Estonia is conducted by a subsidiary with a branch in both Latvia and Lithuania.
Joint liability Pohjola Bank plc is a member of the central institution (OP Cooperative) of the amalgamation, as referred to in the “Laki talletuspankkien yhteenliittymästä” Act (Act on the Amalgamation of Deposit Banks), and belongs to said amalgamation. Pohjola Bank plc, OP Cooperative as the central institution of the amalgamation, other companies belonging to the central institution’s consolidation group, the central institution’s member credit institutions and companies belonging to their consolidation groups, and credit institutions, financial institutions and service companies in which the abovementioned institutions jointly hold more than half of the voting rights form the amalgamation. Pohjola Group insurance companies are not members of the aforementioned amalgamation. The member credit institutions within the amalgamation (181 OP Financial Group’s member cooperative banks, Pohjola Bank plc, Helsinki OP Bank Plc, OP Mortgage Bank, OP-Card Company Oyj and OP-Process Services Ltd) and the central institution are jointly and severally liable for each other’s debts. A creditor who has not received payment of an overdue amount (principal debt) may demand payment from the central institution when the principal debt falls due. In such a case, the central institution must produce a statement referred to in said Act, showing the amount of liability apportioned to each member credit institution. This liability between the credit institutions is determined in proportion to the total assets shown in their most recently adopted balance sheets. The member credit institutions, including Pohjola Bank plc, are obliged to participate in any necessary support measures aimed at preventing another member credit institution from going into liquidation, and to pay a debt for another member credit institution as referred to in Section 5 of the Act on the Amalgamation of Deposit Banks. Furthermore, upon default of the central institution, a member credit institution shall have unlimited refinancing liability for the central institution’s debts as laid down in the Co-operatives Act. The central institution supervises its member credit institutions as specified in the Act on the Amalgamation of Deposit Banks, confirms the operating principles referred to in Section 5 of said Act with which it must comply, and issues instructions to the member credit institutions on capital adequacy and risk management, good corporate governance and internal control to secure liquidity and capital adequacy, as well as instructions on compliance with uniform accounting policies in the preparation of the amalgamation’s consolidated financial statements. Protection afforded by the Deposit Guarantee Fund and the Investors’ Compensation Fund By virtue of the law governing the Deposit Guarantee Fund, deposit banks as members of the amalgamation of cooperative banks (OP Financial Group member cooperative banks, Pohjola Bank plc, Helsinki OP Bank Plc) are
20

Pohjola Bank plc Report by the Board of Directors and Financial statements 2014
regarded as a single bank with respect to deposit guarantee. The Deposit Guarantee Fund reimburses a maximum of EUR 100,000 to an individual account holder who has receivables from deposit banks belonging to the amalgamation of cooperative banks. Pohjola Bank plc belongs to the Investors’ Compensation Fund which will safeguard investors’ undisputed claims due for payment if an investment firm or credit institution is unable to pay investor claims within the stipulated time, due to a reason other than temporary default. This compensation payable to the investor accounts for 90% of his claim, up to a maximum of EUR 20,000. The member credit institutions belonging to the amalgamation of the cooperative banks are considered to constitute a single credit institution in respect of investors’ compensation. The Fund does not cover losses incurred due to changes in the prices of securities or to wrong investment decisions. The Fund safeguards only retail investors’ claims. From the beginning of 2015, the deposit guarantee will be at a responsibility of a nw authority: Office of Financial Stability whic operations will be managed under the Ministry of Finance. Outlook for 2015 The euro area economy will continue to grow at a slow rate and remains prone to disturbances despite the loose financial policy of the European Central Bank and other measures taken to support economic growth. Similarly, economic growth in Finland is expected to remain weak, although exports have begun to grow slowly. The tension in international politics will continue to cause uncertainty for the Finnish economy, slowing the country's recovery from recession. Modest economic development combined with the tensions of international politics are weakening growth prospects in the financial sector. Historically low interest rates will erode banks’ net interest income and weaken insurance institutions’ investment income. The significance of measures that support capital adequacy and profitability is heightened by changes in the operating environment and the tightening of regulation. Despite the challenging operating environment, Pohjola Group's consolidated earnings from continuing operations before tax in 2015 are expected to be at the same level as in 2014. The most significant uncertainties affecting earnings in 2015 relate to the rate of business growth, impairment loss on receivables, developments in bond and capital markets, the effect of large claims on claims expenditure and to the discount rate applied to insurance liabilities. All forward-looking statements in this report expressing the management’s expectations, beliefs, estimates, forecasts, projections and assumptions are based on the current view of the future development in the operating environment and the future financial performance of Pohjola Group and its various functions, and actual results may differ materially from those expressed in the forward-looking statements.
Pohjola Bank plc’s Board proposal for the allocation of distributable funds On 31 December 2014, the shareholders’ equity of Pohjola Bank plc totalled EUR 2,095,123,453.54, EUR 915,384,812.75 of which represented distributable equity. The following funds are at the AGM’s disposal for profit distribution: EUR
Profit for 2014 425,089,296.01
Retained earnings 158,914,679.68 Reserve for invested non-restricted equity 307,931,364.75
Other non-restricted reserves 23,449,472.31 Total 915,384,812.75 The Board of Directors proposes that the Company’s distributable funds be distributed to shareholders as a dividend of EUR 0.43 per share, i.e. EUR 137,407,108.45. Accordingly, EUR 777,977,704.30 remains in the Company’s distributable equity. The Company’s financial position has not undergone any material changes since the end of the financial year 2014. The Company’s liquidity is good and will not be jeopardised by the proposed profit distribution, in the Board of Directors’ view.
21

Financial indicators and share-related figures and ratios 2010 2011 2012 2013 2014 Return on equity (ROE), % 9.9 9.2 11.2 14.4 14.3 Return on equity at fair value (ROE), % 9.3 3.1 23.3 14.1 16.0 Return on assets (ROA), % 0.6 0.6 0.7 1.0 1.0 Equity ratio, % 6.6 5.6 6.2 7.2 6.7 Average personnel 3,005 3,189 3,421 2,632 2,563 Cost/income ratio, % 56 62 57 53 50
Share-related figures and ratios 2010 2011 2012 2013 2014
Equity per share, € 7.44 7.22 8.67 9.54 10.38 Dividend per share, €* 0.39 0.40 0.45 0.66 0.43 Dividend payout ratio, %*, 54.9 59.9 50.9 50.0 30.0 Number of shares (all)
Year average 319,551,415 319,551,415 319,551,415 319,551,415 319,551,415 Year end 319,551,415 319,551,415 319,551,415 319,551,415 319,551,415
*) Board proposal 2014
Formulas for key figures and ratios Return on equity (ROE), % Profit for the period / Shareholders’ equity (average of the beginning and end of period) x 100 Return on equity (ROE) at fair value, % Comprehensive income for the period / Shareholders’ equity (average of the beginning and end of period) x 100 Return on assets (ROA), % Profit for the period / Average balance sheet total (average of the beginning and end of the period) x 100 Equity ratio, % Shareholders’ equity / Balance sheet total x 100 Cost/income ratio, % Personnel costs + Other administrative expenses + Other operating expenses / (Net interest income + net income from Non-life Insurance + net commissions and fees + net trading income + net investment income+ other operating income + share of associates’ profit) x 100 Equity/share Shareholders’ equity / Share-issue adjusted number of shares on the balance sheet date Dividend per share Dividends paid for the financial year/ Share-issue adjusted number of shares on the balance sheet date Dividend payout ratio, % Dividend per share / Earnings per share x 100 Capital adequacy ratio under the Act on the Supervision of Financial and Insurance Conglomerates Conglomerate’s total capital base / Conglomerate’s total minimum capital base Capital adequacy ratio, % Total capital base / Total minimum capital requirement x 8 Tier 1 ratio, % Total Tier 1 capital / Total minimum capital requirement x 8 22

Core Tier 1 ratio, % Total Tier 1 capital, excl. hybrid capital and shortfall of Tier 2 capital covered by hybrid capital / Total minimum capital requirement x 8 Common Equity Tier 1 capital ratio, % (CET1)*) Common Equity Tier 1 (CET1)/Total risk exposure amount x 100 *) Common Equity Tier 1 capital (CET1) as defined in Article 26 of EU Regulation 575/2013 and total risk exposure amount as defined in Article 92. Key ratios for Non-life Insurance The key ratio formulas for Non-life Insurance are based on regulations issued by the Finnish Financial Supervisory Authority, using the corresponding IFRS sections to the extent applicable. The ratios are calculated using expenses by function applied by non-life insurance companies, which are not presented on the same principle as in the Consolidated Income Statement. Loss ratio (excl. unwinding of discount) Claims and loss adjustment expenses / Net insurance premium revenue x 100 Expense ratio Operating expenses + Amortisation/adjustment of intangible assets related to company acquisition / Net insurance premium revenue x 100 Combined ratio (excl. unwinding of discount) Loss ratio + expense ratio Risk ratio + cost ratio Solvency ratio (+ Non-life Insurance net assets + Subordinated loans + Net tax liability for the period - Deferred tax to be realised in the near future and other items deducted from the solvency margin - Intangible assets)/ Insurance premium revenue x 100 Operating key ratios Operating cost/income ratio (+ Personnel costs + Other administrative expenses + Other operating expenses excl. amortisation on intangible assets and goodwill related to Pohjola acquisition) / (+ Net interest income + Net income from Non-life Insurance + Net commissions and fees + Net trading income + Net investment income + Other operating income + Share of associates’ profit) x 100 Operating loss ratio Claims incurred, excl. changes in reserving bases / Insurance premium revenue, excl. net changes in reserving bases x 100 Operating expense ratio Operating expenses / Insurance premium revenue, excl. net changes in reserving bases x 100 Operating combined ratio Operating loss ratio + operating expense ratio Operating risk ratio + Operating cost ratio Operating risk ratio Claims excl. loss adjustment expenses and changes in reserving bases / Net insurance premium revenue excl. changes in reserving bases x 100 Operating cost ratio Operating expenses and loss adjustment expenses / Net insurance premium revenue, excl. changes in reserving bases, x 100
23

Values used in calculating the ratios
EUR million
2014
2013
Non-life Insurance Non-life Insurance net assets
1,661 1,603
Net tax liabilities for the period
-18 -8 Own subordinated loans
50 50
Deferred tax to be realised in the near future and other items deducted from the solvency margin of the companies
0 4
Intangible assets
-704 -728
Changes in reserving bases and other non-recurring items
2014
2013
Change in discount rate
-62 -38
24

2014 2013EUR million Note Restated*Continuing operationsNet interest income 4 257 230
5 25 37231 193
6 597 5287 114 1118 77 939 64 46
10 32 361,116 1,008
11 163 170ICT costs 94 87Depreciation/amortisation 12 52 52Other expenses 13 258 241
567 550
0 0548 458
14 107 43Results of continuing operations 441 415Discontinued operationsResults of discontinued operations 15 29 15Profit for the period 470 430
Attributable to:461 426
9 4470 430
*Comparative figures have been restated as a result of the adoption of IFRS 10 Consolidated Financial Statements
Share of associates' profits/lossesaccounted for using the equity methodEarnings before taxIncome tax expense
Personnel costs
Total expenses
Other operating income
Consolidated financial statements, IFRS
Financial statements
Net trading incomeNet investment income
Consolidated income statement
Impairment of receivablesNet interest income after impairmentsNet income from Non-life InsuranceNet commissions and fees
Total income
Attributable to owners of the ParentAttributable to non-controlling interestProfit for the period
25

2014 2013EUR million Note Restated*Profit for the period 470 430Items that will not be reclassified to profit or loss
-50 0Items that may be reclassified to profit or loss
Change in fair value reserveMeasurement at fair value 73 1Cash flow hedge 7 -16
Translation differences 0 0Income tax on other comprehensive income
Items that will not be reclassified to profit or lossGains/(losses) arising from remeasurement of defined benefit plans 10 -2
Items that may be reclassified to profit or lossMeasurement at fair value -14 9Cash flow hedge -1 5
Total comprehensive income for the period 493 426
Attributable to:Total comprehensive income attributable to owners of the Parent 484 421Total comprehensive income attributable to non-controlling interest 9 6Total comprehensive income for the period 493 426
Comprehensive income attributable to owners of the parent is divided as follows:Continuing operations 455 405Discontinued operations 28 15Total 484 421
*Comparative figures have been restated as a result of the adoption of IFRS 10 Consolidated Financial Statements
Consolidated statement of comprehensive income
Gains/(losses) arising from remeasurement of defined benefitplans
26

31 Dec.2014
31 Dec.2013
1 Jan.2013
EUR million Note Restated* Restated*Liquid assets 16 3,774 2,046 5,643Receivables from financial institutions 17 10,257 9,899 8,816Financial assets at fair value through profit or loss 18
Financial assets held for trading 360 435 2460 9 9
Derivative contracts 19 5,946 3,444 4,462Receivables from customers 20 15,513 14,510 13,834Non-life Insurance assets 21 3,854 3,502 3,500Investment assets 22 8,112 7,574 5,548Investment accounted for using the equity method 24 2 29 26Intangible assets 25 786 910 922Property, plant and equipment (PPE) 26 72 82 67Other assets 27 1,789 1,369 1,598Tax assets 28 34 15 37Total 50,498 43,824 44,710
Assets classified as held for distribution to owners 15 205Total assets 50,703 43,824 44,710
31 Dec.2014
31 Dec.2013
1 Jan.2013
EUR million Note Restated* Restated*Liabilities to financial institutions 29 5,241 4,789 5,840Financial liabilities at fair value through profit or loss 30
Financial liabilities held for trading 4 4 3Derivative contracts 31 5,889 3,420 4,557Liabilities to customers 32 11,442 10,183 10,767Non-life Insurance liabilities 33 2,972 2,746 2,599Debt securities issued to the public 34 17,587 16,097 13,769Provisions and other liabilities 35 2,479 2,076 2,572Tax liabilities 36 391 378 487Subordinated liabilities 37 1,084 984 1,275Total 47,090 40,675 41,869
15 205Total liabilities 47,295 40,675 41,869
Shareholders’ equity 38Capital and reserves attributable to owners of the ParentShare capital 428 428 428Reserves 1,324 1,261 1,264Retained earnings 1,564 1,358 1,080Non-controlling interest 92 103 69Total shareholders’ equity 3,408 3,150 2,841Total liabilities and shareholder's equity 50,703 43,824 44,710
*Comparative figures have been restated as a result of the adoption of IFRS 10 Consolidated Financial Statements
Liabilities associated with assets classified held as distribution toowners
Financial assets at fair value through profit or loss at inception
Consolidated balance sheet
27

EUR millionShare
capitalFair value
reserveOther
reservesRetainedearnings Total
Non-controlling
interestsTotal
equity428 167 1,093 1,081 2,769 2,769
4 0 -1 2 69 72
428 171 1,093 1,080 2,771 69 2,841
-3 424 421 6 427Profit for the period 426 426 4 430Other comprehensive income -3 -2 -5 1 -3
Profit distribution -145 -145 -145EUR 0.46 per Series A share -116 -116 -116EUR 0.43 per Series K share -29 -29 -29
-1 -1 -1Other 0 0 0 28 28
428 168 1,093 1,358 3,047 103 3,150
EUR millionShare
capitalFair value
reserveOther
reservesRetainedearnings Total
Non-controlling
interestsTotal
equity
428 168 1,093 1,358 3,047 103 3,150
63 421 484 9 493Profit for the period 461 461 9 470Other comprehensive income 63 -40 23 0 23
Profit distribution -212 -212 -212EUR 0.67 per Series A share -169 -169 -169EUR 0.64 per Series K share -43 -43 -43
Other 0 -2 -2 -20 -22
428 231 1,093 1,564 3,316 92 3,408
Consolidated statement of changes in equity
Effect of the adoption of IFRS10 Consolidated FinancialStatements, less taxes
Total comprehensive income forthe period
Balance at 1 Jan. 2013
Balance at31 December 2013
Attributable to owners of Pohjola Group
Restated shareholders' equity1 Jan. 2013
Equity-settled share-basedtransactions
Attributable to owners of Pohjola Group
Restated shareholders' equity1 Jan. 2014
Equity-settled share-basedtransactions
Balance at31 December 2014
Total comprehensive income forthe period
28

2014 2013
EUR million Restated*Cash flow from operating activitiesProfit for the period 461 426Adjustments to profit for the period 97 159Increase (-) or decrease (+) in operating assets -2,133 -4,135Receivables from financial institutions -494 -986Financial asset at fair value through profit or loss 405 -338Derivative contracts 63 28Receivables from customers -1,008 -736Non-life Insurance assets -232 -62Investment assets -281 -2,285Other assets -584 244Increase (+) or decrease (-) in operating liabilities 2,323 -2,058Liabilities to financial institutions 447 -1,031Financial liabilities at fair value through profit or loss 0 1Derivative contracts 70 -10Liabilities to customers 1,259 -584Non-life Insurance liabilities 149 48Provisions and other liabilities 396 -482
Income tax paid -92 -126Dividends received 63 55A. Net cash from operating activities 719 -5,680Cash flow from investing activitiesIncreases in held-to-maturity financial assets -10Decreases in held-to-maturity financial assets 69 129Acquisition of subsidiaries and associates, net of cash acquired 0 -4Purchase of PPE and intangible assets -28 -45Proceeds from sale of PPE and intangible assets 3 3B. Net cash used in investing activities 34 83Cash flow from financing activitiesIncreases in subordinated liabilitiesDecreases in subordinated liabilities -271Increases in debt securities issued to the public 34,709 24,340Decreases in debt securities issued to the public -33,616 -21,833Dividends paid -212 -145Other monetary decreases in equity items 0C. Net cash provided by (used in) financing activities 881 2,092Net increase/decrease in cash and cash equivalents (A+B+C) 1,634 -3,506
Cash and cash equivalents at year-start 2,672 6,177Cash and cash equivalents at year-end 4,306 2,672
Interest received 2,000 1,790Interest paid -1,722 -1,582
incl. discontinued operationsConsolidated cash flow statement
29

EUR millionAdjustments to profit for the financial year
Non-cash items and other adjustmentsImpairment losses on receivables 26 40Unrealised net earnings in Non-life Insurance 50 108Change in fair value for trading 160 -199Unrealised net gains on foreign exchange operations 79 2Change in fair value for investment assets 2 -3Planned amortisation/depreciation 55 55Share of associates' profits 0 1Other -275 156
Items presented outside cash flow from operating activitiesCapital gains, share of cash flow from investing activities -1Total adjustments 97 159
Cash and cash equivalentsLiquid assets** 3,815 2,051Receivables from financial institutions payable on demand 491 621Total 4,306 2,672
*Comparative figures have been restated as a result of the adoption of IFRS 10 Consolidated Financial Statements** Of which EUR 41 million (11) consists of Non-life Insurance cash and cash equivalents.
30

Segment information
The segment analysis has been prepared in accordance with IFRS 8 Operating Segments. Financial information serves as thebasis of this standard, which the executive in charge monitors regularly. Defining segments and presentation are based onmanagement reporting.
Pohjola Group is organised into three business segments – Banking, Non-life Insurance and Asset Management – and theGroup Functions which together constitute the Group’s operating segments. The Board of Directors is the executive body incharge of deciding on the Group’s operations, which allocates resources to the reportable segments and assesses theirperformance.
Following the realisation of OP Cooperative's public voluntary bid, Pohjola Group is planning structural changes, meaning forexample, that the Asset Management segment would be transferred from Pohjola Group to be directly owned by OP Cooperativeduring 2015. For this reason, the Asset Management segment is reported, according to IFRS 5, as discontinued operations inthe income statement and assets and liabilities classified as held for distribution to owners in the balance sheet. Banking, Non-life and the Group Functions segments are reported under continuing operations.
Segment accounting policies
Segment reporting conforms to the accounting policies applied to the consolidated financial statements. Income, expenses,assets and liabilities which are considered to relate directly to and be reasonably attributable to the segments are allocated tothe segments. Income, expenses, investments and capital which have not been allocated to the business segments are reportedunder the Group Functions. Inter-segment Group eliminations are reported under the “Eliminations” column. Intra-Group transferprices are based on market prices. The acquisition costs of intangible and PPE assets are presented as investments. Thenumber of employees in each segment is presented as the number of employees at the end of the period.
Capitalisation of Banking, Asset Management and the Group Functions is based on Pohjola Group’s capital adequacymeasurement under the Act on Credit Institutions. Capital requirements according to this measurement are allocated among theoperating segments. The Group has allocated capital to its operating segments in such a way that the Core Tier 1 ratio stands at11%.
Non-life Insurance capitalisation is based on the solvency capital requirement (SCR) within the proposed Solvency II frameworkplus intangible assets and goodwill arising from company acquisition. The SCR for Non-life Insurance has been covered by CoreTier 1 capital and the solvency requirement for intangible assets and goodwill by Tier 2 notes/bonds.
Banking
Pohjola’s Banking provides corporate and institutional customers with solutions for their financing and financial managementneeds. Banking consists of the following divisions: Corporate Banking, Markets and Baltic Banking.
Corporate Banking provides corporate and institutional customers with financing and cash management services and financingservices for foreign trade, and grants loans and guarantees as well as leasing and factoring services. Its income derives mainlyfrom lending margins and commissions and fees resulting from the arrangement of financing and the management of paymenttransactions.
The Markets division’s services range from the arrangement of debt issues, corporate finance services and custody, equity,foreign exchange, money market and derivative products to investment research. The division executes both its clients’ and theBank’s orders in international financial markets and is also an active player in international derivatives markets, the governmentbond market in the euro area and corporate bond markets. Its income derives from net commissions and fees and income fromtrading. Pohjola Corporate Finance Ltd merged with Pohjola Bank plc on 31 December 2013 and is part of the Markets division.
Baltic Banking provides finance-company products in Estonia, Latvia and Lithuania. Pohjola has established itself in Estonia,Latvia and Lithuania through its own branch offices.
Non-life Insurance
The following three Group companies conduct Non-life Insurance business in Finland: Pohjola Insurance Ltd is a general non-lifeinsurance company, A-Insurance Ltd focuses on non-life insurance for commercial transport and Eurooppalainen InsuranceCompany Ltd specialises in travel insurance. Non-life insurance business in Estonia is conducted by Seesam Insurance AS witha branch in both Latvia and Lithuania. On 30 October 2014, Pohjola Health Ltd merged with Pohjola Insurance Ltd.
The Non-life Insurance segment also includes Omasairaala Oy which started its business in early 2013.
The range of Non-life Insurance products includes non-life policies for corporate and private customers. In addition, the domesticservice network provides corporate customers with OP Financial Group’s life and pension policies and Ilmarinen Mutual PensionInsurance Company’s employment pension policies while being in charge of customer service for Suomi Mutual Life AssuranceCompany and Ilmarinen. Furthermore, commissions and fees come from managing certain statutory charges and from riskmanagement services.
31

Non-life Insurance pre-tax earnings consist of the balance on technical account, investment income and other income andexpenses. The balance on technical account refers to insurance premium revenue less claims incurred and operating expenses.The most important profitability indicator is the combined ratio showing the proportion of claims incurred and operating expensesto insurance premium revenue. With respect to investment operations, Non-life Insurance is tasked with investing assetscovering insurance liabilities and equity in a safe and profitable way conducting a policy of sufficient risk diversification.
Asset Management
The Asset Management business line comprises Pohjola Asset Management Ltd, Pohjola Asset Management ExecutionServices Ltd, Pohjola Property Management Ltd and the associated company Access Capital Partners Group SA. Pohjola AssetManagement Ltd provides Finnish institutional clients and wealthy private individuals with discretionary and advisory investmentmanagement services. Furthermore, the portfolio management of OP Fund Management Company Ltd’s mutual funds is mainlycentralised within Pohjola Asset Management. In addition to its own portfolio management, Pohjola Asset Management hassome 30 international partners boasting a wide range of funds for the needs of both institutional and private clients. PohjolaProperty Management Ltd focuses on real property investment in Finland and on the selection of real estate funds ininternational markets. The division’s income comes mainly from management commissions and fees.
Group Functions
Group Functions supports Pohjola Group's and its business segments financing.
It is responsible for the management of financing and liquidity for OP Financial Group’s retail banks and Pohjola Group, as wellas for OP Financial Group’s wholesale funding. Income, expenses, investments and capital which have not been allocated to thebusiness segments are reported under the Group Functions. Group taxes are allocated to the Group Functions in their entirety.
Eliminations
Inter-segment eliminations are presented under the “Eliminations” column.
32

Discon-tinued
operations
2014, EUR million BankingGroup
FunctionsNon-life
Insurance
AssetManage-
mentElimi-
nationsGroup
totalNet interest income
Corporate Banking and Baltic Banking 255 255Markets 28 28Other operations -3 -26 2 1 -26Total 283 -3 -26 2 1 257
Net commissions and fees 103 4 15 64 -8 178Net trading income 84 -8 0 0 1 77Net investment income 5 55 0 4 64Net income from Non-life Insurance
From insurance operations 466 0 466From investment operations 171 2 173From other items -42 -42Total 595 2 597
Other operating income 13 9 11 1 -1 33Total income 488 56 595 67 -1 1,206Personnel costs 55 6 102 14 0 177ICT costs 34 5 53 3 1 97Amortisation on intangible assetsrelated to company acquisitions 21 2 24Other depreciation/amortisationand impairments 14 1 16 1 31Other expenses 57 24 180 11 -2 269Total expenses 160 36 372 31 -1 598Earnings/loss beforeimpairment of receivables 328 20 223 36 0 608Impairments of receivables 25 25Share of associates' profits/losses 0 1 0 2Earnings before tax 303 20 223 38 0 584Change in fair value reserve -1 33 49 0 -1 79Gains/(losses) arising from remeasurement ofdefined benefit plans -42 -5 -2 0 -50Total comprehensive income for theperiod, before tax 259 48 270 37 -1 613
Segment information
Continuing operations
33

Discon-tinued
operations
2013, EUR million BankingGroup
FunctionsNon-life
Insurance
AssetManage-
mentElimi-
nationsGroup
totalNet interest income
Corporate Banking and Baltic Banking 227 227Markets -3 -3Other operations 27 -24 3 1 6Total 224 27 -24 3 1 230
Net commissions and fees 100 -1 17 51 -4 162Net trading income 101 -12 0 0 3 93Net investment income 0 46 0 46Net income from Non-life Insurance
From insurance operations 440 440From investment operations 131 -1 131From other items -43 -43Total 529 -1 528
Other operating income 17 9 10 1 0 38Total income 443 69 532 55 -1 1,097Personnel costs 57 6 107 14 184ICT costs 31 5 50 3 1 90Amortisation on intangible assetsrelated to company acquisitions 21 2 24Other depreciation/amortisationand impairments 15 1 14 1 31Other expenses 54 15 174 11 -2 252Total expenses 157 27 366 32 -1 581Earnings/loss beforeimpairment of receivables 285 41 166 24 0 516Impairments of receivables 35 2 37Share of associates' profits/losses 0 0 0 0Earnings before tax 251 39 166 24 0 479Change in fair value reserve 9 -6 -17 0 -1 -15Gains/(losses) arising from remeasurement ofdefined benefit plans 0 0 0 0Total comprehensive income for theperiod, before tax 260 33 149 24 -1 465
Continuing operations
34

For distri-bution to
owners
31 Dec 2014, EUR million BankingGroup
FunctionsNon-life
Insurance
AssetManage-
mentElimi-
nationsGroup
totalReceivables from customers 15,222 537 -246 15,513Receivables from credit institutions 483 13,566 5 7 -24 14,037Financial assets at fair valuethrough profit or loss 373 -13 360Non-life Insurance assets 4,150 -297 3,854Investment assets 553 7,581 16 9 -9 8,151Investments in associates 2 27 29Other assets 6,335 1,721 732 136 -165 8,759Total assets 22,968 23,392 4,905 180 -741 50,703Liabilities to customers 8,434 3,233 -226 11,442Liabilities to credit institutions 609 4,878 -246 5,241Non-life Insurance liabilities 3,116 -144 2,972Debt securities issued to the public 1,672 16,157 -46 17,782Subordinated liabilities -20 1,054 50 1,084Other liabilities 7,043 1,685 79 10 -44 8,773Total liabilities 17,738 27,007 3,245 10 -705 47,295Shareholders' equity 3,408
Average personnel 616 33 1,766 88 2503Capital expenditure, EUR million 10 2 14 2 28
31 Dec 2013, EUR million BankingGroup
FunctionsNon-life
Insurance
AssetManage-
mentElimi-
nationsGroup
totalReceivables from customers 14,432 291 -213 14,510Receivables from credit institutions 659 11,300 4 3 -21 11,945Financial assets at fair valuethrough profit or loss 487 -42 444Non-life Insurance assets 3,750 -248 3,502Investment assets 524 7,025 16 22 -14 7,574Investments in associates 2 27 29Other assets 3,792 1,242 780 114 -109 5,819Total assets 19,894 19,816 4,552 166 -604 43,824Liabilities to customers 7,035 3,309 -160 10,183Liabilities to credit institutions 614 4,387 -213 4,789Non-life Insurance liabilities 2,844 -98 2,746Debt securities issued to the public 16,159 -62 16,097Subordinated liabilities 934 50 984Other liabilities 4,381 1,463 56 9 -33 5,877Total liabilities 12,029 26,252 2,950 9 -566 40,675Shareholders' equity 3,150
Average personnel 634 26 1,872 88 2,620Capital expenditure, EUR million 15 1 27 2 45
35

1. Accounting policies2. Risk management and capital adequacy management principles3. Change in accounting policy
Notes to the income statement4. Net interest income5. Impairment loss on receivables6. Net income from Non-life Insurance7. Net commissions and fees8. Net trading income9. Net investment income10. Other operating income11. Personnel costs12. Depreciation and amortisation13. Other expenses14. Income tax15. Assets and liabilities classified as held for distribution to owners and discontinued operations
Notes to the balance sheet16. Cash and cash equivalents17. Receivables from credit institutions18. Financial assets at fair value through profit or loss19. Derivative contracts20. Receivables from customers21. Non-life Insurance assets22. Investment assets23. Reclassified notes and bonds24. Investment accounted for using the equity method25. Intangible assets26. Property, plant and equipment27. Other assets28. Tax assets29. Liabilities to credit institutions30. Financial liabilities at fair value through profit or loss31. Derivative contracts32. Liabilities to customers33. Non-life Insurance liabilities34. Debt securities issued to the public35. Provisions and other liabilities36. Tax liabilities37. Subordinated liabilities38. Shareholders’ equity
Notes to risk management39. Pohjola Group's exposure split by geographic region and exposure classRisk exposure by Banking and the Group Functions40. Loans and receivables and cumulative impairment losses recognised on them41. Exposure42. Exposure by sector43. Receivables from credit institutions and customers, and doubtful receivables44. Credit losses and impairments45. Corporate exposure by sector
Notes to the consolidated financial statementsContents
36

46. Corporate exposure by rating category47. Corporate exposure by the amount of customer’s exposure48. Liabilities of financial institutions and insurance companies by rating category49. Collateral received by type of collateral50. Funding structure51. Maturity of assets and liabilities by residual term to maturity52. Liquidity buffer53. Maturities of assets and liabilities by maturity or repricing54. Sensitivity analysis of market risk55. Equity risk56. Real estate riskPillar III disclosures57. Capital base58. Minimum capital requirement59. Capital ratios60. Derivative contracts and counterparty riskRisk exposure by Non-life Insurance61. Risk-bearing capacity62. Sensitivity analysis of Non-life Insurance63. Premiums written and sums insured by class64. Trend in large claims65. Insurance profitability66. Information on the nature of insurance liabilities67. Insurance liabilities by estimated maturity68. Risk exposure of insurance investments69. Sensitivity analysis of investment risks70. Interest-rate risk71. Currency risk72. Counterparty risk
Other notes to the balance sheet73. Classification of financial assets and liabilities74. Recurring fair value measurements by valuation technique75. Collateral given76. Financial collateral held
Notes to contingent liabilities and derivatives77. Off-balance-sheet commitments78. Derivative contracts79.
80. Contingent liabilities and assets81. Operating leases82. Ownership interests in subsidiaries, structured entities and joint operations
Other notes83. Related-party transactions84. Variable remuneration
Financial assets and liabilities offset in the balance sheet or subject to enforceablemaster netting arrangements or similar agreements
37

Note 1. Pohjola Group’s Accounting Policies
1. General
Pohjola is Finland’s leading non-life insurer and institutional asset manager and ranks among the leading corporate banks. Pohjola has a well-established and broad customer base consisting of companies and institutions to which it provides an extensive range of banking, non-life insurance and asset management services. In addition, Pohjola provides private customers with non-life insurance and asset management products and services. Pohjola also acts as the central bank for OP Financial Group's cooperative banks.
OP Cooperative completed its public voluntary bid announced in February 2014 and obtained ownership of all Pohjola Bank plc shares by decision of the Arbitral Tribunal in accordance with Chapter 18, Section 6 of the Finnish Limited Liability Companies Act. As a result of the decision of the Arbitration Court, trading in the series A shares of Pohjola Bank plc ceased on 29 September 2014, and the shares were delisted from the Helsinki Stock Exchange on 30 September 2014. On 7 October 2014, OP Cooperative was entered as the only shareholder in Pohjola Bank plc's shareholder register.
Pohjola Group has the following four operating segments: Banking, Non-life Insurance, Asset Management, and the Group Functions. Banking provides corporate and institutional customers with financing, investment and payment transaction solutions on an international scale. Non-life Insurance provides corporate and private customers with non-life insurance products covering both statutory and voluntary policies. Asset Management is in charge of managing the assets of OP Financial Group's largest institutional and private customers. Furthermore, Asset Management manages the portfolio of OP mutual funds on a centralised basis. In addition to these three business segments, the financial results of Central Banking and Treasury and administrative functions are presented under the Group functions segment.
Following the realisation of OP Cooperative's public voluntary bid, Pohjola Group is planning structural changes, meaning, for example, that the Asset Management segment would be transferred from Pohjola Group to be directly owned by OP Cooperative. As a result, the Asset Management segment has been reported, according to IFRS 5, as discontinued operations in the income statement and as assets and liabilities classified as held for distribution to owners in the balance sheet. Banking, Non-Life Insurance and the Group Functions are reported as continuing operations in the income statement.
Pohjola Bank plc belongs to OP Financial Group, which consists of 181 cooperative banks and their central institution, OP Cooperative with its subsidiaries. OP Financial Group's member credit institutions comprise Pohjola, Helsinki OP Bank Plc, OP Card Company Plc, OP Mortgage Bank and OP Cooperative's member cooperative banks.
In accordance with the Laki talletuspankkien yhteenliittymästä Act (Act on the amalgamation of deposit banks), the member credit institutions, Pohjola included, and OP Cooperative are ultimately jointly and severally liable for each other’s debts and commitments. If a member credit institution’s own capital is depleted to such a low level owing to losses that the criteria, specified in the Act, for being placed in liquidation are fulfilled, OP Cooperative has the right to collect from its member credit institutions extra contributions on the basis of the combined balance sheets previously adopted.
Pohjola is domiciled in Helsinki and the street address of its registered office is Teollisuuskatu 1 B, FI-00510 Helsinki, Finland, and the postal address of its registered office is P.O. Box 308, FI-00013 Pohjola, Finland. A copy of Pohjola’s consolidated financial statements is available at www.pohjola.fi or the Company’s registered office.
Pohjola Bank plc's parent company is OP Cooperative and Pohjola's consolidated accounts are included in its consolidated financial statements.
Copies of the financial statements of OP Cooperative are available at the following address: Vääksyntie 4, FI-00510 HELSINKI, Finland. OP Financial Group financial statements are available at www.op.fi or at the company's office at Vääksyntie 4, 00510 Helsinki.
The Board of Directors approved the consolidated financial statements for issue on 5 February 2015.
1.1 Basis of preparation
These consolidated financial statements were prepared in accordance with the International Financial Reporting Standards (IFRS), applying IASs, IFRSs and SIC and IFRIC interpretations effective on 31 December 2014. The International Financial Reporting Standards refer to standards and their interpretations adopted in accordance with Regulation (EC) No. 1606/2002 of the European Parliament and of the Council. Pohjola's notes also conform to the requirements of Finnish accounting and company legislation that complement IFRS regulations.
38

In 2014, Pohjola adopted the following standards and interpretations:
IFRS 10 – Consolidated Financial Statements builds on the existing principles according to which control determines whether the parent company consolidates an entity. The standard includes new guidance on circumstances where control is difficult to assess. As a result of the change in the standard, the number of subsidiaries to be consolidated in Pohjola Group's financial statements increased by two real estate funds. The effects of the change in the standard are presented in Note 3, Changes to accounting policies in financial statements.
IFRS 11 – Joint Arrangements focuses on the accounting treatment of joint arrangements on the rights and obligations arising from such arrangements rather than on their legal form. The standard classifies joint arrangement into two types: joint operations and joint ventures. In addition, the standard requires that joint ventures be accounted for only using the equity method. This amendment only had a minor effect on Pohjola’s balance sheet and statement of comprehensive income. Property companies owned by Pohjola have been reported as joint operations and consolidated proportionally. The effects of the change in the standard are presented in Note 3, Changes to accounting policies in financial statements.
IFRS 12 – Disclosure of Interests in Other Entities includes disclosure requirements for all forms of interests in other entities, including subsidiaries, associates, joint arrangements, structured entities and other unconsolidated entities. The new standard expanded Note 97 Ownership in subsidiaries, structured entities and joint operations.
IAS 32 – Financial Instruments: amendment to the presentation of Offsetting Financial Assets and Financial Liabilities. The amendment clarified the regulations on the net presentation of financial assets and liabilities and added application guidance concerning the subject. The amendment did not have a significant effect on OP Financial Group's financial statements.
IAS 36 Asset impairment change "Information in the financial statements concerning recoverable amount disclosures for non-financial assets". The change clarified disclosure requirements for cash generating units that have been subject to impairment.
IAS 39 – Financial Instruments: change in recognition and measurement "Novation of derivatives and the continuation of hedge accounting". The amendment concerned hedge accounting application criteria when a derivative contract is novated to a central counterparty. As a result of the amendment, hedge accounting can continue in such novation cases if specific conditions are met.
IFRIC 21 Interpretation Levies applied to the accounting treatment for an obligation to pay a levy. The interpretation addressed what the obligating event is that gives rise to pay the levy and when a liability should be recognised. In Pohjola, this interpretation was applied, for example, to the recognition of bank levy liability and to liability arising from contribution to the Deposit Guarantee Fund.
Pohjola Group’s consolidated financial statements were prepared at historical cost, with the exception of financial assets and liabilities at fair value through profit or loss, available-for-sale financial assets, hedged items in fair value hedging (for hedged risk), derivative contracts and investment property.
The financial statements are presented in millions of euro.
Pohjola Group's presents Pillar 3 capital adequacy information, consistent with EU Regulation No. 575/2013 of the European Parliament and of the Council is presented as part of OP Financial Group's financial statements. Pohjola Group presents its capital base, total minimum capital requirement, key indicators for capital adequacy and derivative contracts and counterparty risk.
1.2 Use of estimates
The preparation of the financial statements in conformity with IFRS requires the Group's management to make judgements, estimates and assumptions in the application of the accounting policies. Section 1.6 “Critical accounting estimates and judgements” provides more detailed information on applying accounting policies requiring management assessment and judgement.
1.3 Consolidation principles
The Consolidated Financial Statements contains the parent company Pohjola Bank plc and any subsidiaries which the parent company controls. Pohjola Group has control over an entity if it is exposed, or has rights, to variable returns from its involvement with the entity and has the ability to affect those returns through its power over the entity (including structured entities). Most of the subsidiaries are fully owned by the Group, which means that control is based on votes.
Pohjola both acts as investor and manages various mutual funds in order to gain investment income and various commissions. Funds that have been classified as structured entities have been consolidated into the Group's financial statements when the Group's control is not based on votes but the control of significant operations, exposure to variable returns from the fund, and organising the fund's management. Changes in control concerning various fund investments consolidated into the Group are
39

monitored quarterly. When estimating the amount of control, we take into account the investor's power to direct relevant activities over an investee and the investor's exposure to variable returns. Once the Group's control ceases, any retained interest in the entity is remeasured at fair value at the date when control was lost, and the change in carrying amount is recognised in the income statement. The fair value is the initial carrying amount for the purposes of subsequently accounting for the retained interest as an associate, joint venture or financial assets. Any amounts entered previously from the fund in the comprehensive income are treated as if the Group had directly transferred the related assets and liabilities. This may mean that amounts previously recognised in other comprehensive income are reclassified to the income statement.
Intra-Group shareholding has been eliminated using the acquisition method. The consideration transferred and the acquiree’s identifiable assets acquired and liabilities assumed are measured at fair value at the time of acquisition. Acquisition cost in excess of net assets is presented under goodwill. If the acquisition cost is lower than the fair value of net assets, the difference is entered in the profit and loss.
Acquisition-related costs are expensed as incurred. Any contingent consideration is measured at fair value and classified as a liability or equity. Contingent consideration classified as a liability is measured at fair value in the income statement on the balance sheet date.
Associated companies, in which Pohjola holds 20–50% of voting shares and over which Pohjola exercises significant influence but not control, are accounted for using the equity method. Under the equity method, the investment is initially recognised at cost, and the carrying amount is increased or decreased to recognise the investor’s share of the profit or loss of the investee after the date of acquisition. If the Group's share of losses in an associate exceeds its interest in the associate, the investment is entered in the balance sheet at zero value, and further losses exceeding the carrying amount are not recognised unless the Group is committed to fulfil the obligations of associates. A joint arrangement is an arrangement of which two or more parties have joint control. Joint control is the contractually agreed sharing of control of an arrangement, which exists only when decisions about the relevant activities require the unanimous consent of the parties sharing control. A joint arrangement is either a joint operation or a joint venture. A joint venture is an arrangement in which the Group has rights to the arrangement's net assets, while in a joint operation the Group has both rights to assets and obligations for the liabilities relating to the arrangement. Property companies are incorporated into Pohjola Group's financial statements as joint operations by consolidating the proportionate share of the Group's holding of the property company's assets and liabilities.
Subsidiaries, associates or joint arrangements acquired during the financial year are consolidated from the date on which control, joint control or significant influence is transferred to the Group and are de-consolidated from the date on which control or significant influence ceases.
Intra-Group transactions, receivables, liabilities and profit distribution are eliminated in the preparation of the consolidated financial statements.
1.3.1 Non-controlling interests
Profit for the financial year attributable to the owners of the parent and non-controlling interests is presented in the income statement, and total comprehensive income attributable to the owners of the parent and non-controlling interests is presented in the statement of comprehensive income.
Profit shown in the income statement and the statement of comprehensive income is also attributed to non-controlling interests in the event that their share, as a result, would become negative. Non-controlling interests are presented as part of equity capital in the balance sheet. If the investee's equity does not fulfil the equity classification criteria under IAS 32, the non-controlling parties' share of the net assets is presented as liability.
Non-controlling interests in an acquiree are measured either at fair value or as the proportionate share of net assets of the acquiree. The valuation principle applied is determined separately for each acquiree.
1.4 Assets and liabilities classified as held for distribution to owners and discontinued operations Assets (or a group of items to be distributed) and related liabilities are classified to be held for distribution to owners if they have been decided to be transferred at carrying amount within OP Financial Group as a result of structural arrangements. The conditions for classification of asset distributable to owners is considered to have been fulfilled when the transfer is highly probable, the asset (or group of items to be distributed) is available for immediate sale in its present condition subject only to terms that are usual and customary, the management is committed to the transfer and the transfer is expected to be completed within one year from the date of classification. 40

A discontinued operation is a part of the Group which has been classified to be distributed to owners and which fulfils one of the following conditions: 1. It represents a separate major line of business. 2. It is part of a single coordinated plan concerning the transfer of a key business segment. The earnings of discontinued operations are presented as a separate line item in the income statement and the statement of comprehensive income. Assets distributed to owners (or group of items to be distributed) and any liabilities related to them are presented in the balance sheet separately from other items. If it is found out later that the criteria for an asset (or a group of assets) classified held for distribution to owners are no longer fulfilled, the asset (or group assets) is reclassified to continuing operations and measured according to the applicable IFRS standards.
1.5 Foreign currency translation
The consolidated financial statements are presented in euros, which is the functional and presentation currency of the parent. Non-euro transactions are recognised in euros at the exchange rate quoted on the transaction date or at the average exchange rate of the month of recognition. On the balance sheet date, non-euro monetary balance sheet items are translated into euros at the exchange rate quoted on the balance sheet date. Non-monetary balance sheet items measured at cost are presented at the exchange rate quoted on the transaction date.
The exchange rate differences arising from the translation of non-euro transactions and monetary balance-sheet items into euros are recognised as foreign exchange gains or losses under “Net trading income” in the income statement.
The income statements of foreign subsidiaries, whose functional currency is other than the euro, are translated into euros using the average exchange rate for the financial year, while their balance sheets are translated into euros using the exchange rate quoted on the balance sheet date. The resulting exchange rate differences are recognised as translation differences in other comprehensive income. For foreign subsidiaries, translation differences arising from the use of the acquisition method and from post-acquisition equity items are recognised in other comprehensive income. If a subsidiary is sold, any accumulated translation differences will be recognised as part of capital gain or loss in the income statement.
1.6 Financial instruments
1.6.1 Fair value determination
Fair value is the price that would be received to sell an asset or paid to transfer a liability in an orderly transaction between market participants at the measurement date.
The fair value of financial instruments is determined using either prices quoted in an active market or the Group’s own valuation techniques where no active market exists. Markets are deemed to be active if price quotes are easily and regularly available and reflect real and regularly occurring market transactions on an arm's length basis. The current bid price is used as the quoted market price of financial assets.
If the market has a commonly used valuation technique applied to a financial instrument to which the fair value is not directly available, the fair value is based on a commonly used valuation technique and market quotations of the inputs used by the technique.
If the valuation technique is not a commonly used technique in the market, a valuation model created for the instrument in question will be used to determine the fair value. Valuation models are based on widely used measurement techniques, incorporating all factors that market participants would consider in setting a price, and are consistent with accepted economic methodologies for pricing financial instruments.
The valuation techniques used include prices of market transactions, the discounted cash flow method and reference to the current fair value of another instrument that is substantially the same. The valuation techniques take account of estimated credit risk, applicable discount rates, the possibility of early repayment and other factors affecting the reliable measurement of the fair value of financial instruments.
41

The fair values of financial instruments are categorised into three hierarchy levels, depending on the inputs used in valuation techniques:
Quoted prices (unadjusted) in active markets for identical assets or liabilities (Level 1); Inputs other than quoted prices included within Level 1 that are observable for the asset or liability, either directly (i.e.
as prices) or indirectly (i.e. derived from prices) (Level 2); and Inputs for the asset or liability that are not based on observable market data (Level 3).
If the inputs used to measure fair value are categorised into different levels of the fair value hierarchy, the fair value measurement is categorised in its entirety at the same level as the lowest level input that is significant to the entire measurement. The significance of inputs has been assessed on the basis of the fair value measurement in its entirety.
It is typical of illiquid instruments that their price calculated using a pricing model differs from the actual transaction price. However, the actual transaction price is the best evidence of the instrument’s fair value. The Day 1 profit/loss, based on the difference between the actual transaction price and the price deriving from the pricing model that uses market prices, is recognised in the income statement over the term of the contract or a shorter period taking account of the product's structure and counterparty. However, the non-recognised amount will be recognised as soon as there is a genuine market price for the instrument or a well-established pricing practice is created in the market. The amount of illiquid financial assets is insignificant in the balance sheet.
1.6.2 Impairment of financial assets
At the end of each reporting period, the Group assesses whether there is objective evidence that a financial asset other than that carried at fair value through profit or loss is impaired.
A financial asset is impaired and impairment losses are incurred if there is objective evidence of impairment as a result of one or more events that occurred after the initial recognition of the asset and that the loss event has an impact on the estimated future cash flows of the financial asset that can be reliably estimated.
The criteria used to determine whether there is objective evidence of an impairment loss include:
significant decline in the issuer’s financial results, credit rating, balance sheet, payment status or business plans, and unfavourable changes in the issuer’s economic and operating environment;
a bona fide bid for the same or similar investment from the market below acquisition value; events or circumstances that significantly weaken the issuer’s ability to operate on a going concern basis, such as
negative cash flows resulting from operations, insufficient capital and shortage of working capital; debtor's bankruptcy or other reorganisation becomes probable; debtor's breach of contract; a concession granted to the borrower; impairment loss recognised earlier; and the disappearance of an active market for a financial asset.
In addition, a significant or prolonged decline in the equity instrument’s fair value below its cost constitutes objective evidence of impairment.
A more detailed description of recognition of impairments can be found under the various financial instruments below.
1.6.3 Securities sale and repurchase agreements
The purchase price of securities bought under ‘resell conditions’ binding on both parties is recognised as a receivable under the balance sheet item determined by the counterparty. The difference between the purchase price and resale price is treated as interest income and accrued over the term of the agreement.
The selling price of securities sold under ‘resell conditions’ binding on both parties is recognised as a financial liability under the balance sheet item determined by the counterparty. The difference between the selling price and repurchase price is treated as interest expenses and accrued over the term of the agreement. Securities sold under the repurchase obligation and the corresponding securities provided as maintenance margin are included in the original balance sheet item despite the agreement.
42

1.6.4 Classification and recognition
Upon initial recognition, financial assets and liabilities are classified as follows: financial assets and liabilities at fair value through profit or loss, loans and receivables, held-to-maturity investments, available-for-sale financial assets and other financial liabilities. The classification depends on the purpose for which the financial assets and liabilities were acquired.
The purchase and sale of financial assets and liabilities at fair value through profit or loss, held-to-maturity investments and available-for-sale financial assets are recognised in the balance sheet on the transaction date, or the date on which the Group agrees to buy or sell the asset or liability in question. Notes and bonds classified as loans and receivables are recognised as financial assets on the transaction date and loans granted on the date on which the customer draws down the loan.
Financial assets and liabilities are offset in the balance sheet if Pohjola currently has a legally enforceable right of set-off in the normal course of business and in the event of default, insolvency or bankruptcy, and intends to settle the asset and liability on a net basis. OTC interest rate derivatives for central counterparty clearing are offset in the balance sheet, which are cleared in the daily clearing process with London Clearing House.
The Group derecognises a financial asset when the contractual rights to the cash flows from the financial asset expire, or when it transfers the financial asset in a transaction in which substantially all the risks and rewards of ownership of the financial asset are transferred. Financial liabilities are derecognised when they are extinguished, i.e. when the obligation is discharged, cancelled or expires.
1.6.4.1 Financial assets and liabilities at fair value through profit or loss
Financial instruments at fair value through profit or loss include financial assets and liabilities held for trading, derivative contracts held for trading and financial assets at fair value through profit or loss at inception. Financial assets at fair value through profit or loss are initially recognised at fair value and transaction costs are charged to expenses. A subsequent change in fair value as well as capital gains and losses, interest income and expenses, and dividend income are recognised in the item by their nature in the income statement.
1.6.4.1.1 Financial assets and liabilities held for trading and derivative contracts held for trading
Assets held for trading include notes and bonds, and shares and participations acquired with a view to generating profits from short-term fluctuations in market prices. Liabilities held for trading refer to the obligation to deliver securities which have been sold but which have not been owned at the time of selling (short selling). Derivatives are also treated as held for trading unless they are designated as derivatives for effective hedging or they are guarantee contract derivatives.
1.6.4.1.2 Financial assets at fair value through profit or loss at inception
Financial assets at fair value through profit or loss at inception include financial assets which are designated as at fair value through profit or loss upon their initial recognition.
Financial assets recognised at fair value through profit or loss at inception comprise bonds which the Group, in accordance with its risk management principles, manages and assesses performance at fair value in order to receive a true and real-time picture of investment operations. Reporting to the Group's management is based on fair values.
Since the business involves investment on a long-term basis, financial assets are presented separately from those held for trading.
Financial assets at fair value through profit or loss also include hybrid instruments in which the fair value of an embedded derivative cannot be determined separately.
1.6.4.2 Loans and receivables
Financial assets classified as loans and receivables are non-derivative financial assets with fixed or determinable payments that are not quoted in an active market.
Receivables related to insurance contracts, claims administration contracts and disposal of investments are presented within this asset class. These financial assets are shown as receivables from customers, from credit and financial institutions or as Non-life Insurance assets in the consolidated balance sheet.
43

Loans and receivables are initially recognised at cost, which is the fair value of consideration given plus directly attributable transaction costs. Loans and receivables are carried at amortised cost after their initial recognition, using the effective interest method.
Impairment losses on loans and receivables are recognised on an individual or collective basis. Impairments will be assessed on an individual basis if the debtor’s total exposure is significant. In other respects, impairments are assessed on a collective basis.
Impairment is recognised when impairment loss is incurred and there is objective evidence that the receivable cannot be collected in full. The receivable has impaired if its present value of the estimated future cash flows – collateral included – is lower than the aggregate carrying amount of the loan and the related unpaid interest. Estimated future cash flows are discounted at the loan's original effective interest rate. If the loan carries a variable interest rate, the discount rate for measuring any impairment is the current effective interest rate determined under the agreement. Impairment loss recognised in profit or loss equals the difference between the loan carrying amount and the lower present value of future cash flows.
Impairment assessment is a two-phase process. Impairment is assessed individually for significant loans and receivables. If loans and receivables are not assessed individually, they will be assessed collectively for impairment. Collectively assessed impairment includes losses incurred but not yet reported, which cannot yet be allocated to a certain loan. Collectively assessed impairment provisions are based on a statistical model used in the measurement of economic capital requirement. The model is derived from the expected credit loss model used in capital adequacy measurement, adjusted to correspond to the requirements under IFRS. The largest adjustments relate to minimum limits set for capital adequacy and to the materialisation of a loss event. In the model, receivables are classified into groups with similar credit risk by rating category. Collectively assessed impairment is measured based on the expected loss by rating category, and the measurement also takes account of the discounted present values of collateral and the average past loss experience.
If the contractual payment terms of a loan are modified, the reason for such modification and the severity class are documented using an internally defined scale. Loans may also be modified for reasons related to the management of customer relationships, not to the financial difficulties of the customer. Such modifications do not affect loan impairment assessment. In some cases, the Group may, due to the customer’s financial difficulties, modify the loan terms and conditions, such as in terms of repayment holiday for a limited period or another loan modification, which are aimed at securing the customer’s repayment capacity and limiting credit risk associated with liabilities. Such renegotiated credit is reported as doubtful receivables. Modifications in the contractual payment terms that are due to the customer’s financial difficulties are forbearance measures and together with other criteria reduce the customer’s credit rating and thereby increase collective impairment allowance. Modifications with the highest severity class are also forbearance measures that will have an effect on the loan being assessed for impairment on an individual basis. If the customer has adhered to the new payment terms and no impairment allowance has been recognised for the customer’s exposure, it will be removed from troubled debt classification. Modifications in payment terms are subject to regular monitoring and reporting to the management as an indicator anticipating customer solvency.
Loans and receivables are categorised in the notes to evaluate the credit quality also on the basis of how the debtor is estimated to be able to fulfil its payment obligations. A loan is categorised as non-performing if payments are more than 90 days past due, if the customer has been rated in the Group's internal 12-grade rating system in the weakest two categories (11 or 12) or if an individual impairment loss has been recognised. In all other cases the loan is reported under performing category.
Both individual and collective impairments are recorded in a separate allowance account to reduce the carrying amount of receivables in the balance sheet. Impairment losses on loans are presented in the income statement in a separate line item “Impairment losses on receivables”. Recognition of interest on the reduced amount continues after the recognition of impairment.
The loan is derecognised after the completion of all debt-collection measures if the loan terms are substantially modified (such as refinancing) or otherwise based on the management's decision. Following the derecognition, payments received are recognised as an adjustment to impairment losses on receivables. If there is subsequent objective evidence of the debtor’s improved solvency, the amount of the impairment loss recognised earlier will be reassessed and any change in the recoverable amount will be recorded in the income statement.
1.6.4.3 Investments held to maturity
Investments held to maturity are non-derivative financial assets with fixed or determinable payments that the Group has the positive intention and ability to hold to maturity. Held-to-maturity investments are initially recognised at fair value to which transaction costs are added. These investments are subsequently carried at amortised cost after their initial recognition, using the effective interest method.
Impairment of investments held to maturity is reviewed on the basis of the same principles as that of loans and receivables. The difference between the carrying amount of notes and bonds and a lower present value of future cash flows is recognised as an impairment loss in the income statement. 44

Investments included in the financial assets held to maturity category are sold before their maturity only in exceptional cases mentioned in IAS 39.
1.6.4.4 Available-for-sale financial assets
Available-for-sale financial assets include non-derivative assets which are not classified as the abovementioned financial assets but which may be sold before their maturity, comprising notes and bonds, shares and participations.
At the time of their acquisition, available-for-sale financial assets are recognised at cost, which equals the fair value of the consideration paid plus transaction costs directly attributable to their acquisition. Available-for-sale financial assets are subsequently measured at fair value. Any changes in their fair value are recognised in the other comprehensive income, from where they are transferred to the income statement when the asset is derecognised or there is objective evidence that the asset is impaired.
In the case of available-for-sale financial assets, for example, a significant downgrade of the credit rating of the issuer of bonds and notes, or a significant or prolonged decline in the equity instrument’s fair value below its cost, constitutes objective evidence. If an equity instrument’s market value continues to fall following impairment recognition, the impairment loss will be recognised in the income statement.
If the fair value of impaired notes and bonds classified as available-for-sale financial assets increases subsequently and this increase can be objectively regarded as being related to an event after their impairment loss recognition, the impairment loss will be reversed and recorded in the income statement. If the fair value of an impaired equity instrument increases subsequently, this increase will be recognised in other comprehensive income.
Interest income related to available-for-sale financial assets is recognised under "Net interest income" in the income statement and dividends under "Net investment income". For Non-life Insurance, both items are recognised under "Net income from Non-life Insurance".
The difference between the nominal value and the acquisition cost of fixed-rate bonds is recognised in interest income over the estimated residual term to maturity, using the effective interest method.
1.6.5 Cash and cash equivalents
Cash and cash equivalents consist of cash and receivables from credit institutions repayable on demand.
1.6.6 Other financial liabilities
Other financial liabilities include financial liabilities other than those at fair value through profit or loss, comprising deposits and other liabilities to credit institutions and customers, debt securities issued to the public and other financial liabilities. Other financial liabilities are recognised in the balance sheet on the settlement date and carried at amortised cost after initial recognition.
The difference between the nominal value and the acquisition cost of fixed-rate bonds is recognised in interest expenses over the estimated residual term to maturity, using the effective interest method.
1.6.7 Derivative contracts
Derivative contracts are classified as hedging derivative contracts and derivative contracts held for trading, containing interest rate, currency, equity, commodity and credit derivatives. Derivatives are measured at fair value at all times.
The Group’s Risk Management has prepared methods and internal principles used for hedge accounting, whereby a financial instrument can be defined as a hedging instrument.
In accordance with the hedging principles, the Group can hedge against interest rate risk, currency risk and price risk by applying fair value hedge or cash flow hedge. Cash flow hedge refers hedging against changes in the fair value of future cash flows. Fair value hedge refers to hedging against changes in the fair value of a hedged asset/liability.
Contracts may not be accounted for according to the rules of hedge accounting if the hedging relationship between the hedging instrument and the related hedged item, as required by IAS 39, does not meet the criteria of the standard. The Group’s parent company, Pohjola Bank plc, also concludes derivative contracts which are in fact used to hedge against financial risks but which do not fulfil these criteria.
45

The fair value of OTC interest rate derivatives for central counterparty clearing is cleared in cash on a daily basis. In the balance sheet, these cleared derivatives are netted and shown as a net change in cash. Other derivatives are presented in the balance sheet on a gross basis, in which case positive value changes are presented as Derivative contracts under assets and negative value changes as Derivative contracts under liabilities.
1.6.7.1 Derivatives held for trading
The difference between interest received and paid on interest-rate swaps held for trading is recorded in interest income or expenses and the corresponding interest carried forward is recognised in other assets or other liabilities. Changes in the fair value of derivatives held for trading are recorded under "Net trading income" or "Net income from Non-life Insurance". Derivatives are carried as assets under "Derivative contracts" when their fair value is positive and as liabilities under "Derivative contracts" or "Non-life Insurance liabilities" when their fair value is negative.
Embedded derivatives associated with structured bonds issued are separated from the host contract and measured at fair value in the balance sheet, and derivatives designated as hedging instruments are recognised in "Net interest income".
1.6.8 Hedge accounting
Hedge accounting is used to verify that changes in the fair value of a hedging instrument fully or partially offset changes in the fair value or cash flows of a hedged item.
The relationship between hedging and hedged instruments is formally documented, containing information on risk management principles, hedging strategy and the methods used to demonstrate hedge effectiveness. Hedge effectiveness is tested at the inception of the hedge and in subsequent periods by comparing respective changes in the fair value or cash flows of the hedging and hedged instrument. The hedge is considered highly effective if the change in the fair value of the hedging instrument or in cash flows offsets the change in the fair value of the hedged contract or portfolio or in cash flows within a range of 80–125%.
In hedge accounting, the Group does not apply an accounting model for macro hedging or the EU carve-out of IAS 39 standard.
1.6.8.1 Fair value hedges
Fair value hedging against interest rate risk involves long-term fixed-rate debt instruments (Pohjola’s own issues), individual bond and loan portfolios, as well as individual loans. Pohjola uses forward exchange contracts and interest-rate and currency swaps as hedging instruments. Hedging against equity and foreign currency risks applies to Non-life Insurance's equity fund investments.
Changes in the fair value of derivative contracts that are documented as hedging the fair value and are highly effective hedges are recognised in the income statement. Hedged assets and liabilities are also measured at fair value during the period for which the hedge is designated, and any fair value changes are recognised through profit or loss.
In fair value hedge accounting, changes in the fair value of the hedged item and hedging instrument are recorded under "Net interest income", with the exception of changes in the fair value of mutual fund investments included in Non-life Insurance's available-for-sale financial assets and that of instruments hedging them, which are recognised in "Net income from Non-life Insurance".
1.6.8.2 Cash flow hedges
A cash flow hedge is a hedge of the exposure to the variability attributable to a particular risk associated with variable-rate debt or other variable-rate assets and liabilities. In addition, cash flow hedging is used to hedge the future interest flows of the loans defined on the basis of reference interest rate linkage. Interest rate swaps are mainly used as hedging instruments.
Derivative contracts which are documented as cash flow hedges and provide effective hedges are measured at fair value. The effective portion of changes in the fair value of the hedging instrument is recognised in other comprehensive income. Any ineffective portion of changes in the fair value is recognised immediately in profit or loss. Fair value changes recognised in equity are included in the income statement in the period when hedged items affect net income.
1.7 Investment property
Investment property is land and/or buildings or part thereof held to earn rental income or for capital appreciation. Property, a minor part of which is used by the owner company or its personnel, is also accounted for as investment property. However, a
46

part of property used by the owner company or its personnel is not accounted for as investment property if the part can be sold separately. Investment property is shown as investment assets or as Non-life Insurance assets in the consolidated balance sheet.
Investment property is initially recognised at cost which includes transaction costs. It is subsequently carried at fair value. Investment property under construction is also measured at fair value only if the fair value can be determined reliably. Any changes in the fair value are recognised in "Net income from Non-life Insurance" or "Net investment income".
If no comparable market data is available on the actual transaction prices of the property comparable with the property under review, Pohjola uses the income approach and internal methods based on property-specific net income to determine the fair value of commercial, office and industrial premises. We use the Group’s internal and external information in the income approach. A property’s net income comprises the difference between rental income and maintenance charges and it is based on income under current leases or, if no lease is in force, on average market rents. Expenses deducted from income are mainly based on actual expenses. Assumption of underutilisation of the property is also taken into account in the calculation. For the income approach, we obtain information on market rental and cost levels from sources outside the Group, in addition to our own expertise. The return requirements for investment property holdings are determined on the basis of the property’s purpose of use, location and condition/modernness and are based on market data provided by KTI Property Information Ltd.
The fair value of residential buildings and land areas is primarily determined using the market approach, based on information on the actual transaction prices of similar properties and on OP Financial Group’s internal expertise. In the fair value of undeveloped plots, we have taken account of the planning and market situation at the time of appraisal. The fair value of major property holdings is based on valuation reports drawn up by Authorised Property Valuers. External valuers use a cash flow analysis as the basis for their appraisal.
1.8 Intangible assets
1.8.1 Goodwill
For business combinations on or after 1 January 2010, the Group measures goodwill as the fair value of the consideration transferred including the recognised amount of any non-controlling interest in the acquiree and the previous holding exceed the Group’s share of the fair value of the acquired assets and assumed liabilities.
For acquisitions before the above date, goodwill represents at the time of acquisition the excess of the cost of an acquisition over the fair value of the Group’s share of the net identifiable assets, liabilities and contingent liabilities of an acquiree.
Goodwill is tested annually for any impairment. For the purpose of impairment testing, goodwill is allocated to cash-generating units, which are either business segments or entities belonging to them. Goodwill is carried at cost less accumulated impairment losses.
1.8.2 Customer relationships
Identifiable customer relationships acquired through business combinations are measured at fair value upon acquisition. This intangible asset arising from customer relationships is amortised on a straight-line basis over the asset’s estimated useful life. The estimated useful life of Pohjola Group's acquired customer relationships is 10-13 years.
1.8.3 Brands
Identifiable brands acquired through business combinations are measured at fair value upon acquisition. The estimated useful lives of brands acquired through business combinations are indefinite, since they will generate cash flows for an indefinable period. The value of brands is tested annually for impairment.
1.8.4 Deferred acquisition costs of insurance contracts
Foreign subsidiaries defer costs associated with the acquisition of new insurance contracts or with the renewal of existing contracts. The resulting intangible asset is amortised on a straight-line basis over the effective lives of the contracts, which is a policy period. An intangible asset is assessed annually for impairment in connection with testing the adequacy of the liability associated with insurance contracts.
47

1.8.5 Other intangible assets
Other intangible assets are measured at cost less accumulated amortisation and any impairment losses. These assets are amortised over their estimated useful lives, which is 2–10 years for computer software and licences and 5 years in general for other intangible assets. The useful lives of assets are reviewed on each balance sheet date and, if necessary, their value is tested for impairment.
Expenditure on the development of computer software or assets is presented as an intangible asset when their amount can be reliably determined and they will generate future economic benefits. The asset will be amortised from the time it is ready for use, mainly 3–10 years. An asset that is not yet ready for use is tested annually for impairment.
1.9 Property, plant and equipment
Property, plant and equipment (PPE) are stated at cost less accumulated depreciation and any write-downs. These assets are depreciated on a straight-line basis over their estimated useful lives. Land is not subject to depreciation.
Subsequent expenditures are capitalised at the asset’s carrying amount only if it is probable that the asset will generate greater economic benefits than initially estimated.
The estimated useful lives are mainly as follows:
Buildings 20–50 years Machinery and equipment 3–10 years IT equipment 3–5 years Cars 5–6 years Other PPE assets 3–10 years
The assets’ residual value and useful lives are reviewed on each balance sheet date and adjusted as appropriate if expectations differ from previous estimates with respect to economic benefits.
1.9.1 Impairment of PPE and intangible assets
On each balance sheet date, the Group assesses whether there is any indication of an asset’s impairment. If such indication exists, the amount recoverable from the asset will be estimated. Regardless of the existence of such indication, the recoverable amount is estimated for assets not yet available for use, goodwill and intangible assets with indefinite useful lives (brands). An impairment loss is recognised for the amount by which the asset's carrying amount exceeds its future recoverable amount.
The recoverable amount is the higher of an asset's fair value less costs to sell (net selling price) or value in use. The recoverable amount is primarily determined on the basis of the asset's net selling price, but if this is not possible, the asset's value in use must be determined. The asset's value in use equals the present value of future cash flows expected to be recoverable from the asset. The discount rate used is a pre-tax rate that reflects current market assessments of the time value of money and the risks specific to the asset. The need for impairment of the annually tested assets stated above is always determined on the basis of value-in-use calculations.
If the asset's net selling price cannot be determined and the asset does not generate cash flows independent of other assets, the need for impairment will be determined through the cash-generating unit, or the business segment or its company, to which the asset belongs. In such a case, the carrying amounts of the unit's assets are compared with the entire unit's recoverable amounts.
An impairment loss is reversed if there has been a change in the estimates used to determine the asset's recoverable amount since the last impairment loss was recognised. The increased carrying amount of the asset may not exceed the carrying amount of the asset that would have been determined had no impairment loss been previously recognised. Impairment losses on goodwill may not be reversed under any circumstances.
1.10 Leases
Whether a lease is classified as a finance lease or an operating lease depends on the substance of the transaction. A lease is classified as a finance lease if it transfers substantially all the risks and rewards incident to ownership to the lessee. All other leases are classified as operating leases. Lease classification is performed at the inception of the lease.
48

Assets leased out under finance lease are recorded as receivables from customers in the balance sheet, to the amount equal to the net investment in the lease. Finance income is recognised in interest income based on a pattern reflecting a constant periodic rate of return on the lessor's net investment outstanding in respect of the finance lease.
Assets leased under finance lease are recognised as property, plant and equipment and the corresponding finance lease liability is included in other liabilities. At the inception of the lease term, these leased assets are recorded as assets and liabilities at the lower of the fair value of the asset and the present value of the minimum lease payments. Assets held under finance lease are depreciated over the shorter of the lease term or the life of the asset. Finance charges are recognised in interest expenses so as to produce a constant periodic rate of interest on the remaining balance of the liability.
Assets leased out under operating lease are shown under property, plant and equipment and lease income is recognised on a straight-line basis over the lease term. Lease payments for leased assets under operating lease are recognised as expenses on a straight-line basis over the lease term.
1.11 Employee benefits
1.11.1 Pension benefits
Statutory pension cover for Pohjola Group companies’ employees is arranged through pension insurance taken out with OP Bank Group Pension Fund or pension insurance companies. Some Group companies provide their employees with supplementary pension cover through OP Bank Group Pension Foundation or an insurance company.
Pohjola Group has both defined benefit and defined contribution plans. With respect to funded disability and old-age pensions, pensions managed by OP Bank Group Pension Fund are defined benefit plans. Pension plans managed by insurance companies may be either defined benefit or defined contribution plans. All of the plans managed by OP Bank Group Pension Foundation are defined benefit plans.
Expenses arising from pension plans are recognised under "Personnel costs" in the income statement. Contributions under defined contribution plans are paid to the insurance company and charged to expenses for the financial year to which they relate. No other payment obligations are included in defined contribution plans.
Defined benefit plans managed by insurance companies, OP Bank Group Pension Fund and OP Bank Group Pension Foundation are funded through payments based on actuarial calculations.
The liability recognised in the balance sheet in respect of the defined benefit plan is the present value of the defined benefit obligation on the balance sheet date less the fair value of plan assets.
Defined benefit obligations are calculated separately for each plan using the projected unit credit method. Pension costs are charged to expenses over the employees' expected working lives on the basis of calculations performed by authorised actuaries. The discount rate for the present value of the defined benefit obligation is determined on the basis of the market return on high-grade corporate bonds on the closing date of the reporting period.
Items resulting from remeasurements of the net defined benefit liability are recognised in other comprehensive income in the period they occur. Remeasurements of the net defined benefit liability recognised in other comprehensive income will not be reclassified to income statement in later financial periods.
Plan curtailments are recognised when the curtailment occurs.
1.11.2 Long-term incentive scheme
The Group has short-term and long-term management incentive schemes in place, on the basis of which the person covered by the schemes may receive the related compensation for services rendered during each performance period fully in cash or as a reward settled as a combination of cash and a debenture loan issued by OP. The maximum amount of the incentive scheme is calculated at the grant date and the amount charged to expenses is recognised in personnel costs and deferred expenses over the vesting period.
The amount of compensation corresponding to the objectives reached is reviewed quarterly. Any effects resulting from reviewing the original estimates are recognised in personnel costs and the corresponding adjustment is made in deferred expenses.
49

1.12 Insurance assets and liabilities
1.12.1 Classification of Non-life Insurance financial assets and liabilities
The section “Classification and recognition” under Financial Instruments contains information on the classification of financial assets and liabilities within Non-life Insurance.
1.12.2 Classification of insurance contracts issued by insurers
An insurance contract is a contract which transfers significant insurance risk from the policyholder to the insurer, as defined in IFRS 4. Other contracts which the company may issue under its licence represent investment contracts. If a contract does not involve any significant insurance risk on the balance sheet date but the policyholder has the right to change the contract in such a way that the contract transfers significant insurance risk to the insurer, the contract is classified as an insurance contract. Almost all of the contracts issued by non-life insurers are insurance contracts.
Insurance contracts are classified into risk groups in such a way that the risks of contracts are homogeneous in each group. This classification into categories takes account of the insured object and differences in the duration of contracts or the average length of the period between the occurrence of a loss event and the date of the fully-paid claim (claim settlement period).
The main insurance contract categories are short-term non-life contracts and long-term contracts.
Short-term policies usually have a policy term of 12 months or less, very rarely over 24 months. In particular, policies for private individuals, motor-vehicle policies and statutory workers’ compensation policies are usually automatically renewable annual policies that are treated as short-term contracts.
Long-term non-life insurance contracts refer to contracts with an average minimum policy term of two years. These include perpetual insurance policies and decennial insurance policies under the Housing Transactions Act.
Descriptions of insurance contracts can be found in the section "Risk Management Principles", Insurance operations.
1.12.3 Recognition and measurement of insurance contracts issued by insurers
Contracts are recognised when an insurer’s obligation to pay out the related claim begins following the occurrence of an insurance event.
Insurance contracts are measured and accounted for in accordance with IFRS 4 – Insurance Contracts. Investment contracts are measured in accordance with IAS 39.
Liabilities of contracts issued by insurers and measured under IFRS 4 are calculated mainly national in accordance with national accounting standards. However, equalisation provisions are not included in these liabilities but are included in equity capital.
The liabilities comprise provisions for unearned premiums and claims liability. Non-life provisions for unearned premiums equal the liabilities arising from claims and other expenses expected for the remaining coverage periods of the recognised policies. The claims liability arises from reported and non-reported claims incurred and from their claims and settlement expenses paid in the future.
1.12.3.1 Measurement of insurance contracts issued by non-life insurers
Premiums are primarily recognised as revenue over the term of the contract. However, revenue recognition in decennial and perpetual insurance policies is based on the distribution of underwriting risk. In these policies, the portion of premiums written for the post-balance sheet date is recorded as provision for unearned premiums in the balance sheet and recognised as premium revenue relative to risk over the policy term.
Claims paid out and direct and indirect claim settlement expenses are charged to claims incurred on the basis of the date of loss occurrence. Claims unsettled on the balance sheet date for losses already occurred and their settlement expenses – including claims incurred but not yet reported to the Group (IBNR) – are reserved in the provision for unpaid claims consisting of both claims reserved for individual cases and statistically reserved claims. The provision, included in the provision for unpaid claims, for the future settlement of expenses is based on estimated costs.
Provision for unearned premiums for decennial insurance and perpetual insurance policies and provision for unpaid claims for annuities are discounted based on a constant discount rate for the entire pension period. When specifying the rate, the general 50

trend for the interest rate is taken into account. The discount rate may not exceed the expected return on the assets covering the liability or the level set by the authorities. An increase in liabilities due to the passage of time (unwinding of discount) is shown in the income statement as a separate item within “Other Non-life Insurance items” under “Net income from Non-life Insurance”. Non-life Insurance's interest rate risk of the insurance liability is reduced by entering into interest rate derivative contracts that are recognised at fair value through profit or loss. The value of derivatives is included in the insurance liability, because any benefit from the derivatives is used for the cash flows payable from the contracts.
1.12.4 Liability adequacy test on insurance contracts
On each balance sheet date, the Group tests for the adequacy of liabilities in the balance sheet, using current estimates of future cash flows from insurance contracts. If the test shows that the carrying amount of insurance liabilities, less intangible assets related to capitalised policy acquisition costs, is inadequate, the deficiency is recognised in profit or loss primarily by recording an additional amortisation on intangible assets and secondarily by increasing liabilities.
1.12.5 Premiums written
Premiums written included in net income from insurance operations in the income statement are a consideration of the insurance coverage that began during the period.
Insurance premium tax, but not commissions and credit loss on insurance premiums, is deducted from premiums written.
Insurance premiums based on non-life insurance contracts are recognised as premiums written when the insurance period begins.
1.12.5.1 Receivables and payables related to insurance contracts
Non-life Insurance premium receivables are recognised at the beginning of the insurance period when the right to the receivable is established. These receivables are mainly those from policyholders and only to a minor extent from insurance intermediaries. Prepaid insurance premiums are included in “Direct insurance liabilities” under Non-life Insurance liabilities.
Non-life Insurance receivables based on insurance contracts are tested for impairment on each balance sheet date. If there is objective evidence of an impaired receivable, its carrying amount is reduced through profit or loss. Both final impairment losses (credit losses) and impairment losses established statistically on the basis of the phase of collecting the charge are deducted from receivables.
1.12.6 Salvage and subrogation reimbursements
Subrogation reimbursements and damaged property that has come into the Group’s possession are recognised at fair value under “Non-life Insurance assets” in the balance sheet when the claim is settled.
1.12.7 Reinsurance contracts
Reinsurance taken out by the Group refers to an insurance contract which meets the classification requirements set for insurance contracts and under which the Group may be paid compensation by another insurer if the Group becomes liable to pay compensation on the basis of other insurance contracts (ceded reinsurance).
Assets based on reinsurance contracts are tested for impairment on each balance sheet date. If there is objective evidence that the Group may not receive all amounts to which it is entitled on the basis of the contract terms, the carrying amount of the reinsurance asset is reduced to correspond to the recoverable amount and the impairment loss is recognised in the income statement.
Non-life insurance benefits received under reinsurance contracts held are included in “Loans and receivables” or receivables “From reinsurance under Other assets”, with the latter receivables corresponding to reinsurers' share of provision for unearned premiums and provision for unpaid claims of the insurance contracts reinsured by the Group. Items included in “Loans and receivables” are shorter-term receivables. Premiums unpaid to reinsurers are included in "Reinsurance liabilities" under Non-life Insurance liabilities.
51

1.12.8 Coinsurance and pools
The Group is involved in a few coinsurance arrangements with other reinsurers. Of coinsurance contracts, the Group treats only its share of the contract as insurance contracts and its liability is limited to this share.
The Group also underwrites shares of insurance contracts through pools, whose members are primarily responsible for their own proportionate share of the underwriting risk. These shares are based on contracts confirmed annually. The Group treats as insurance contracts its own proportionate share of the direct insurance business managed by pools and of the reinsurance business from the pool to its members. The pool's share of these insurance contracts is treated as reinsurance. In some pools, members are responsible for an insolvent member's liabilities in proportion to their shares in the pool. The Group recognises liabilities and receivables based on joint liability if joint liability is likely to materialise.
1.13 Provisions and contingent liabilities
A provision is recognised for an obligation if the obligation is based on a past event and it is probable that an outflow of resources will be required to settle the obligation, but there is uncertainty about the timing or amount required in settlement. In addition, an entity must have a present legal or constructive obligation towards a third party as a result of past events. If it is possible to receive compensation for part of the obligation from a third party, the compensation is recognised as a separate asset, but only at the time when receipt of the compensation is actually certain.
A contingent liability is a possible obligation arising from past events, whose existence will be confirmed only by the realisation of an uncertain future event beyond the Group's control. A present obligation which probably does not require fulfilment of payment obligation or the amount of which cannot be defined reliably is also considered as contingent liability. A contingent liability is presented as a note.
1.14 Income tax and deferred tax
Income tax expense shown in the income statement includes current tax, based on the taxable income of Pohjola Group companies for the financial year, and income tax for prior financial years and deferred tax expense or income. Taxes are recognised in the profit and loss except when they are directly linked to items entered into equity capital or other items in the statement of comprehensive income. In this case also the tax will be entered in the items in question. The current income tax charge is calculated on the basis of the tax laws enacted or substantively enacted at the balance sheet date in the countries where the Group companies operate and generate taxable income. Deferred tax liabilities are recognised for all temporary differences between the carrying amount and tax base of assets and liabilities. Deferred tax assets are calculated on tax-deductible temporary differences between the carrying amount and taxable value included in the financial statements, and on losses confirmed for tax purposes. Deferred tax assets are recognised to the extent that it is probable that taxable profits will be available against which deductible temporary differences can be utilised. The greatest temporary differences in the Group are caused by tax provisions (such as loan loss provision), valuation of investments at fair value, and elimination of equalisation provision within non-life insurance.
Deferred tax assets and liabilities are offset separately for each company. Deferred tax assets and liabilities resulting from consolidation are not offset. Deferred tax assets and liabilities are measured at the tax rate that is expected to apply to the period when the asset is realised or the liability is settled, based on tax rates enacted or substantively enacted by the balance sheet date.
1.15 Revenue recognition
Interest income and expenses for interest-bearing assets and liabilities are recognised on an accrual basis. Interest on receivables with non-settled, due payments is also recognised as revenue and this interest receivable is tested for impairment. The difference between the receivable's acquisition cost and its nominal value is allocated to interest income and that between the amount received and nominal value of the liability to interest expenses.
Commission income and expenses for services are recognised when the service is rendered. For one-off commissions covering several years that may have to be refunded at a later date, only the portion of their revenue related to the period is recognised.
Dividends are primarily recognised when they are approved by the General Meeting of Shareholders by the distributing entity.
Income and expense items in the income statement are presented separately without offsetting them unless there is a justified reason for offsetting them in order to give a true and fair view.
Summary of presentation of income statement items: 52

Net interest income Received and paid interest on fixed-income instruments, the recognised difference between the nominal value and acquisition value, interest on interest-rate derivatives and fair value change in fair value hedging, commissions and fees regarded as compensation for risk associated with a financial instrument and taken by the bank and are deemed to be an integral part of the financial instrument’s effective interest
Net income from Non-life Insurance Premiums written, change in insurance liability, investment income and expenses (interest, dividends, realised capital gains and losses, impairment losses) and claims paid
Net commissions and fees Commission income and expenses, and the recognition of Day 1 profit related to illiquid derivatives
Net trading income Fair value changes in financial instruments at fair value through profit or loss, excluding accrued interest, and capital gains and losses, as well as dividends
Net investment income Realised capital gains and losses on available-for-sale financial assets, impairment losses, dividends as well as fair value changes in investment property, capital gains and losses, rents and other property-related expenses
Other operating income Other operating income, central banking service fee Personnel costs Wages and salaries, pension costs, long term incentive schemes, social
expenses Other administrative expenses Office expenses, ICT costs, other administrative expenses Other operating expenses Bank levy, depreciation/amortisation, rents and other expenses
1.16 Segment reporting
Financial information, which the executive in charge monitors regularly, serves as the basis of defining operating segments. The Group's reportable operating segments comprise Banking, Non-life Insurance, Asset Management, and the Group Functions.
A description of the operating segments and segment accounting policies can be found as part of segment information.
1.17 Critical accounting estimates and judgements
The preparation of financial statements requires making estimates and assumptions about the future and the future actual results may differ from these estimates and assumptions. It also requires the management to exercise its judgement in the process of applying the accounting policies.
Liabilities arising from insurance contracts involve several discretionary factors and uncertainty. With respect to Non-life Insurance, estimates are based on assumptions about the operating environment and on the actuarial analyses of Group's own claims statistics. An especially high degree of management judgement is required for determining the discount rate and estimating claims expenditure arising from the already occurred loss events. Information on uncertainties included in assumptions related to insurance contracts and their effects can be found in Notes 33 and 76.
When estimating the control over structured entities, the Group takes into account the investor's power to direct investee's relevant activities and the exposure or right to variable returns from its involvement with the investee. Discretion is exercised when estimating power to direct relevant activities and variable returns. The control is evaluated in more detail when the investment accounts for 10–20% of the investee's net assets and returns. The investee is consolidated as a subsidiary at the latest when the Group's share of the variable returns exceeds 37% and there is a link between the power and the returns.
The values of insurance contracts, customer relationships and brands acquired through business combinations are based on estimates of eg future cash flows and the applicable discount rate. Information on the effects of these assumptions and estimates can be found in Note 25.
Goodwill, assets with indefinite useful lives and intangible assets not yet available for use are tested annually for impairment. The recoverable amount determined in the impairment test is usually based on value in use, and its calculation requires estimates of future cash flows and the applicable discount rate. Information on the effects of these assumptions and estimates can be found in Note 25.
Impairment tests of receivables are performed on an individual or collective basis. An impairment test carried out for an individual receivable is based on the management's estimate of the future cash flows of the individual loan. The most critical factor in testing an individual loan for impairment is to determine the cash flow whose realisation is the most probable.
53

Collectively assessed impairment provisions are based on a statistical model used in the measurement of economic capital, in which expected future losses are adjusted for incurred losses based on historical data. In such a case, the management’s judgement is required to assess how estimates of expected future losses adjusted for historical data correspond to the incurred losses and whether any possible adjustments for these are needed.
Available-for-sale financial assets, notes and bonds included in loans and receivables, and investments held to maturity must be tested for impairment on each balance sheet date. If there is objective evidence of an impaired asset, the impairment loss will be recognised in the income statement. Verifying objective evidence involves management judgement. Impairment loss on an equity instrument must also be recognised if there is a significant or prolonged decline in the fair value. Determining a significant and prolonged decline in the fair value is part of the normal management judgement. Defining objective evidence is a two-step approach where at first instruments that exceed certain indicators are regularly listed and put under closer review. The Group continuously assesses such instruments under review for impairment. Impairment loss will be recognised at the latest when the maximum limits specified for each instrument are exceeded with respect to the prolonged criteria (an average of 18 months) or the significant criteria of 40%.
The management must assess when markets for financial instruments are not active. The management must also assess whether an individual financial instrument is actively traded and whether the price obtained from the market is a reliable indication of the instrument's fair value. When the fair value of financial instruments is determined using a valuation technique, management judgement is required to select the applicable valuation technique. Whenever market observable input data is not available for outputs produced by valuation techniques, the management must evaluate how much other information will be used.
The present value of pension obligations depends on several factors determined based on actuarial calculations and using several assumptions. The discount rate, future increases in salaries and pension payments and the inflation rate are the assumptions used to determine net costs (or income) arising from pensions. Changes in actuarial assumptions have an effect on the carrying amount of pension obligations (Note 35. Provisions and other liabilities).
The measurement of investment property at fair value is partially based on the management's estimates of the market value of property holdings. Investment property is also measured using a calculation model based on the income capitalisation approach utilising estimates of future net yield on property holdings. This is presented in more detail in Note 88.
1.18 New standards and interpretations
In 2015, Pohjola Group will adopt the following standards and interpretations:
IAS 19, Change in employee benefits, Defined Benefit Plans: Employee Contributions (effective for accounting periods beginning on or after 1 July 2014). These changes have clarified accounting treatment when a defined benefit pension plan requires the employees or third parties to contribute. These standard changes have no effect on Pohjola Group's financial statements.
The IASB (International Accounting Standards Board) has also issued other significant future IFRS amendments.
IFRS 9 Financial Instruments and amendments to it (effective for accounting periods beginning on or after January 2018). The new standard replaces the current IAS 39 Financial Instruments: Recognition and Measurement. IFRS 9 changes the classification and measurement of financial assets and includes a new expected credit losses model for the assessment of financial asset impairments. The classification and valuation of financial liabilities correspond to a large extent with the existing IAS 39 requirements. The hedge accounting types remain unchanged. A larger number of risk positions can be included in hedge accounting, and the hedge accounting principles have been aligned with risk management. Pohjola Group is currently evaluating the effects of the standard.
IFRS 15 Revenue from Contracts with Customers (effective for accounting periods beginning on or after 1 January 2017). The new standard is not applied to the recognition of financial instruments or insurance policies, and mainly concerns various commissions and fees. The standard contains 5-stage guidelines for revenue recognition, and replaces the current IAS 18 standard. The revenue is recognised over a period or at a specific time, and the key criterion is transfer of control. The standard will also increase the number of notes to be disclosed. Pohjola Group is currently evaluating any effects the standard may have.
These standard changes have not yet been adopted in the EU.
54

Note 2. Pohjola Group’s Risk Management and Capital Adequacy Management Principles
Pohjola’s core values, strategic goals and financial targets form the basis for risk and capital adequacy management. The purpose of risk management is to identify threats and opportunities affecting strategy implementation. The objective is to help achieve the targets set in the strategy by ensuring that risks are proportional to risk-bearing capacity.
Pohjola is a moderate risk taker and its business operations are based on a reasoned risk/return approach. Pohjola applies integrated risk management aimed at identifying, assessing and mitigating all major business-related risks to an acceptable level. Risk-taking is controlled by means of the risk policy approved by Pohjola Group, which in turn is based on OP Financial Group's risk policy. The risk policy confirms annually the risk management guidelines, targets and restrictions that business functions must follow in order to steer business operations in the direction specified in OP Financial Group's and Pohjola Group's strategies. In addition, Non-life Insurance is guided by risk policies applied to private and corporate customers, reinsurance principles, investment plans and the policy governing hedging against interest rate risk associated with insurance liabilities.
1. General principles of risk and capital adequacy management
Risk and capital adequacy management forms part of internal control. The purpose of risk and capital adequacy management is to secure OP Financial Group's and its institutions' risk bearing capacity and, thereby, ensure the continuity of operations.
Risk-bearing capacity is made up of good risk management that is proportionate to the extent and complexity of operations and of adequate capital resources based on profitable business operations. Capital adequacy management is based on a proactive approach based on the Group’s business strategy and plans. Well-balanced risk-taking, the capital structure, strong earnings power and proactive risk management secure Pohjola Group’s risk-bearing capacity. Risk and capital adequacy management has been integrated as an integral part of its business and management.
Pohjola Group adheres to the risk and capital adequacy management principles approved by OP Cooperative's Supervisory Board. The principles provide guidelines on how OP Financial Group and its companies organise their risk management and internal capital adequacy assessment (ICAAP) process.
1.1 Risk identification, assessment, measurement and restriction
The risk and ICAAP process consists of the continuous identification and assessment of business and operating environment risks. Before any new operating model or product is launched, their risks are assessed as laid down by the central cooperative’s Risk Management.
Quantifiable risks are controlled through limits set by the central cooperative's Executive Board for capital adequacy and major risks. The limits ensure that Pohjola Group does not take excessive risks to endanger its own or OP Financial Group's capital adequacy, profitability, liquidity and continued operations.
The capital base of Pohjola Group is assessed in relation to the economic capital requirement and the existing and predictable regulatory minimum capital requirements. Such assessment also makes use of the results of stress tests.
The central cooperative's independent Risk Management monitors the development of Pohjola Group's and its subsidiaries' risk exposure and risk-bearing capacity. It provides regular reports on its observations and assessments to Pohjola Bank plc's Board of Directors, OP Cooperative's Executive Board and the Supervisory Board's Risk Management Committee.
1.2 Economic capital requirement
The economic capital requirement is OP Financial Group's own estimate of the amount of capital sufficient to cover any annual losses with a 99.97% level of confidence that may arise from risks associated with business and the operating environment. Economic capital is calculated using models for each risk type, the results of which are combined taking account of correlations between the risk types and the resulting diversification benefits.
Economic capital requirement is divided into quantitative and qualitative, i.e assessed, risks. Quantitative risks include credit risk; interest rate, equity, property and investment spread risk associated with Banking; and market and underwriting risks associated with insurance operations. The risks assessed are divided into operational risks and other risks. ‘Other risks’ include any major risks that have not been taken into consideration in any other risk-specific models related to economic capital requirement. These risks are typically caused by external factors, such as changes in competition or the market situation or official regulations. About a third of Pohjola Group's economic capital requirement consists of credit risks and about a fifth of market risks associated with insurance operations. 55

In the model for economic capital requirement, several risk types are assessed in more detail than required by the authorities in capital adequacy measurement. Such risk types include banking interest rate risk, insurance market risks and other risks. The key difference in the calculation of economic capital for credit risks is related to concentration risk. Moreover, the calculation of economic capital differs from capital adequacy measurement in that many risk types are calculated separately in terms of economic capital, while in capital adequacy calculations they are included in the credit risk of capital requirement.
Indicators based on economic capital requirements are used in, for example, target, limit and control limit indicators, credit and insurance policy pricing and capital planning when defining the capital conservation buffer.
1.3 Capital planning
The purpose of capital planning is to ensure sufficient capital adequacy even under exceptional conditions so that operations can continue without interruption. Capital planning consists of, for example, quantitative and qualitative targets concerning capital adequacy, a contingency plan, and capital adequacy monitoring and control procedures per threshold level.
Capital adequacy management places emphasis on profitability and effective capital management. Pohjola Bank plc's parent company OP Cooperative is responsible for capital management on a coordinated basis.
2. Organisation of risk management
Pohjola's Board of Directors decides on the goals and organisation of risk management and capital adequacy management, confirms the risk and capital adequacy management principles, risk policy, investment plans and the main principles governing risk management in line with the principles adopted by the Central Cooperative's Executive Board. In addition, the Board supervises and monitors the implementation of risk management and capital adequacy management. The Board ensures the adequacy of risk management systems, confirms business goals, assesses the need for the Group’s and Group companies’ capital buffers, confirms capital plans and a proactive contingency plan for the capital base, and decides on principles for ensuring that the Company and its consolidated group operate in compliance with external regulation and internal instructions (compliance). It also decides on reporting procedures which senior management uses to monitor the Group’s and subsidiaries’ business, risk-bearing capacity and risk status. The Board assesses the appropriateness, extent and reliability of Pohjola Group’s capital adequacy management on a holistic basis at least once a year. The Board also approves the Group’s decision-making system and appoints members of Pohjola’s Senior Credit Committee, and confirms the description of the Underwriting Executives’ duties and appointments. In the aforementioned tasks, the Board of Directors acts in line with the principles adopted by the Central Cooperative's Executive Board. The Board supervises the scope and performance of the Company’s risk management systems and the quantity and quality of the Company’s and its consolidated group’s capital base, developments in their financial performance, risk exposure and compliance with the risk policy, credit limits and other instructions. The Board also supervises the Company to ensure that risk management is in conformity with laws and regulations and instructions issued by the relevant authorities. Tasked with the management of Pohjola Bank Group's credit risks, the Senior Credit Committee takes decisions – within the framework of its authorisations – on exposure limits, credit limits and exposures concerning customer, bank and country risks, and decides on impairment losses on loans, with input provided by the Credit Committee and Risk Management function. The Senior Credit Committee reports of its decisions to OP Cooperative's Balance Sheet and Risk Management Committee. The Underwriting Executives make decisions within their authorisations concerning underwriting decisions, annual pricing, reinsurance and other major issues on granting insurance contracts. The Underwriting Executives report to the Board of Directors of Pohjola Insurance Ltd. Pohjola's President and CEO takes charge of the overall control of the company in such a way that the company as a whole achieves its profit, risk-bearing capacity and other targets and goals by following shared strategies and policies. Pohjola Group's business lines shall bear primary responsibility for their risk-taking, financial performance and compliance with the principles of internal control and risk management and capital adequacy management. The business lines have the right to take decisions on risk-taking within the approved decision-making powers, exposure limits and credit limits. The new organisation of OP Cooperative Consolidated entered into force on 1 October 2014. The new management system will be founded on three business segments: Banking, Non-life Insurance, and Wealth Management. As part of the reorganisation, Pohjola's Board of Directors dissolved Pohjola Bank plc's Management Group. At the same time, the Audit Committee, Risk Management Committee and Remuneration Committee established by Pohjola’s Board of Directors were dissolved. Pohjola's operations will be managed in the future in accordance with the central cooperative's new management system through three business segments.
56

The central cooperative is responsible for Group-level risk and capital adequacy management and for ensuring that the Group’s risk management system is sufficient and kept up to date.
OP Financial Group's risk management is a function-independent business that defines policy, and steers and supervises the overall risk management of the Group and its institutions, and analyses their risk exposure. Risk management focuses on preventive work, preparation and predictive analysis of risk exposure. The objective is to secure the Group's and its entities' sufficient risk-bearing capacity and to ensure that any business risks taken do not threaten profitability, capital adequacy, liquidity, continued operations and the reaching of strategic targets.
Pohjola Group's risk and capital adequacy management duties have been centralised to the parent company, OP Cooperative.
OP Financial Group's Internal Audit function is tasked with assisting Pohjola's Board of Directors and the Company's senior management in controlling, supervising and assuring operations by carrying out operational audits. Internal audit is based on an independent and objective assessment, assurance and consulting activities. It supports the management in their efforts to achieve objectives by providing a systematic, disciplined approach to assessing and upgrading the efficiency of the organisation’s risk management, control and management and governance processes, with the focus on the identification of risk factors and the assessment of the performance of internal control.
3. Pohjola Group's risks
The table below presents Pohjola Group's major risks. The paragraphs after the table describe the nature of the risks and how they can be managed.
57

4. Strategic risk and business risks
Strategic risks and business risks arise from competition, internal pressures or market forces which result in unexpected fluctuations in volumes, margins or costs, thus affecting the volatility of earnings and the achievement of long-term business goals. Strategic and business risks may also arise from opting for a wrong strategy and from mismanagement and inadequate monitoring or from slow reaction to changes in the operating environment.
4.1 Management of strategic and business risks
The management of strategic and business risks is aimed at creating a corporate culture with a risk-preventive approach. Risk management is based on systematic planning, diligence and continuity throughout business operations. Pohjola prevents the materialisation of risks by developing processes enabling the Group to identify and assess potential risks better and more efficiently manage measures taken to control risks.
4.2 Methods of the management of strategic and business risks, and their measurement
The Group manages strategic risks through continuous planning based on analyses and forecasts of developments in market areas, of competition and future customer needs and monitors strategic risks by business line.
The Group monitors and assesses risks and their significance annually in connection with updating its business strategies and plans. At the same time, it also evaluates changes in the operating environment and competition and their effect on the implementation of the strategy, and links the identified risk factors to the planned strategic initiatives.
4.3 Monitoring and reporting strategic and business risks
The Group monitors strategic and business risks and the related risk-management measures by using risk maps and risk registers in which identified and assessed risks have been registered. The Group draws up strategy and business risk reviews twice a year.
5 Management of operational risks
Operational risk management ensures that operations have been organised appropriately and that risks do not result in unforeseeable financial losses or other negative consequences, such as loss of reputation. OP Financial Group maintains and strengthens a corporate culture that takes a positive approach to operational risk management and internal control.
No risk limit in terms of risk-taking has been set for operational risks, but the target level for risk management is moderate. The key in operational risk management is to identify and assess risks and to assess the effectiveness and adequacy of risk control and management tools. Risk identification also involves paying attention to the illegal use of the banking system (money laundering and terrorism financing) as well as regulatory compliance-related risks. Before any new operating models (including outsourcing) are carried out or products or services are launched, their risks are assessed as laid down by the central cooperative’s Risk Management. OP Financial Group only offers to customers products and applies business models that have been approved at Group level. Risks that may disrupt business operations continuity are prepared against by means of contingency planning in key business divisions. Contingency planning also forms the basis for preparation against emergency conditions referred to in the Emergency Powers Act. Contingency plans are tested according to testing plans that have been made.
In its operational risk management, Pohjola adheres to a uniform Group-level, system-supported operating model. Business units assess operational risks involving identifying and analysing their risks and defining and monitoring measures designed to reduce them. Each month, the business units report events above a certain threshold through the operational risk reporting and management system. The business lines describe in a reporting application reasons for the loss event and measures taken to prevent similar losses.
The Group and its companies assess the level of operational risks and risk-mitigating management tools on a regular basis or immediately whenever necessary, using standardised methods. Reports issued by Internal Audit and ensuring the flow of sufficient information also form an important part of operational risk management.
The coordination, monitoring and reporting related to the identification and assessment of Pohjola Group's operational risks are carried out by Risk Management.
58

5.1 Monitoring and reporting operational risks
For reporting purposes, operational risks are divided into different categories. Identified and materialised risks are reported to the executive management.
6. Compliance risks
Forming part of operational risk, the objective of compliance operations is to ensure that all Group entities comply with laws, official instructions and orders, self-regulation of the markets, and internal guidelines, policies and instructions of the OP Financial Group and the entities. Compliance also ensures that customer relationships are conducted with appropriate and ethically sound principles and practices.
Realisation of a compliance risk may result not only in financial loss but also other sanctions. Such sanctions may include a corporate fine and separate administrative fines for violation of obligations, and public warnings and reprimands. Compliance risk may also materialise in terms of loss or deterioration of reputation or trust.
Responsibility for regulatory compliance and its controls within Group entities rests with the senior and line management and all supervisors and managers. Everyone employed by the Group is also responsible for their own part for compliance with regulations.
Guidelines, advice and support concerning compliance within OP Financial Group are the responsibility of a risk management function that is independent of the central cooperative. Institutions within the central cooperative, just like Pohjola Group, have centralised compliance functions within Risk Management.
6.1 Management tools
Managing compliance risks forms part of sound corporate governance practices and internal control and, as such, an integral part of business management duties and the corporate culture. Compliance risk is managed by monitoring legislative amendments and by providing the organisation with guidelines, training and consultation. The Compliance function also supervises that the procedures chosen conform to the regulations.
6.2 Monitoring and reporting
Compliance risks are identified, assessed and reported regularly according to the operational risk management model. Any observations made by Compliance are reported regularly to the senior and executive management.
7. Reputational risk
Reputational risk is managed proactively and in the long term by following regulations, good practices of the financial sector and the Group’s Code of Business Ethics and by emphasising transparency of operations and communications. The Group adheres to international financial, social and environmental responsibility principles and international commitments. A report on reputational risks is made to the management of the Group's parent company and subsidiaries. Any threat to imminent reputational risk will be reported immediately.
8. Risk management: Banking
8.1 Credit risk management
Credit risk refers to a risk of loss arising from the inability of the bank’s counterparties to meet their obligations. Credit risk also includes country risks and settlement risks, the former representing a credit risk associated with foreign receivables by country and the latter relating to the clearing and settlement process involving the risk of losing a receivable being settled.
Credit risk management aims to restrict losses due to credit risks arising from customer and other exposures to an acceptable level whilst seeking to optimise the risk/return ratio.
Credit approval and the effectiveness of the credit approval process play a key role in the management of credit risks. The process is guided by risk policy, decision-making powers and operating guidelines. Pohjola mitigates credit risks by diversifying its loan portfolio and defining collateral and covenant policies on a customer-specific basis and through active customer 59

relationship management. It also mitigates credit risks by using netting agreements and exchange-traded products in derivatives trading. In order to further mitigate credit risks, Pohjola has defined a maximum customer exposure on the basis of its capital base, and has a credit limit system in place.
In settlement risk management, it is vital to ensure the reliability of counterparties. The Group mitigates settlement risks by concluding standard agreements and using only reliable clearing centres. Written guidelines are in place governing the use and assessment of collateral and valuation percentages for each type of collateral. Developments in collateral values are monitored on a regular basis. The value of collateral is re-assessed, for instance, when it has significantly changed or the customer’s financial standing has weakened substantially. The Group exercises special care in assessing the value of collateral deemed as cyclical in nature, and its usability.
8.2 Credit risk policy
The risk policy and supplementary guidelines define principles governing the composition, diversification and customer selection in respect of total exposure, as well as the use of collateral and covenants, with a view to ensuring a sufficiently diversified loan portfolio in order to avoid excessive risk concentrations by country, customer sector, industry, credit rating, group of connected clients or time period.
For the portfolio analysis, customers are divided into the following six groups: corporate customers, financial institutions and insurance companies, households, OP Financial Group institutions, public-sector entities, and non-profit institutions serving households.
Target values have been set for corporate exposure, for example, by rating category and by group of connected clients, as well as a relative maximum exposure by industry.
OP Financial Group’s rating system is not so far used extensively in Baltic Banking. For lending purposes Pohjola makes use of credit status reports provided by selected agencies in each country.
Risks associated with credit institutions are diversified by credit rating, issuer and product. In addition, in order to ensure the liquidity of secondary markets for fixed-income investments, the Group has determined minimum sizes for issues in which it can invest. Risks have also been diversified by setting country limits for each country.
8.3 Credit risk limits
The exposure limit is a euro-denominated ceiling on customer-specific exposure and uncovered exposure and is annually confirmed for at least corporate and institutional customers and credit institution customers whose actual or planned exposure exceeds EUR 5 million. An exposure limit may also include restrictions in terms of maturity or product. The Group also confirms a customer-specific risk acceptance policy for most corporate and institutional customers, comprising the minimum amount of collateral and the covenants to be used. The exposure limit is provided on condition that the counterparty is located in a country for which a country limit has been approved.
The country limit is a euro-denominated ceiling on receivables from a given country. The amount of the country limit for each country and any related time restriction are defined in accordance with the country’s credit rating and Pohjola Bank plc’s risk-bearing capacity in such a way that it supports the approved business principles. Country limits are reviewed at least once a year.
8.4 Credit process
The day-to-day credit process plays a crucial role in credit risk management. From the risk management perspective, its key stages include credit standing assessment (credit rating), credit approval and execution, which are separate processes. Risk Management supervises the credit process flow and quality.
8.5 Credit rating
At OP Financial Group, credit risk models are used to control credit risk taking and assess the amount of risk involved. Credit rating covers models for risk parameters involving Probability of Default (PD), Loss Given Default (LGD) and Exposure at Default (EAD).
60

Credit risk parameters within internal ratings
Credit risk models are utilised, for example, in
credit approval and pricing; specifying financing decision-making authorisations; setting and monitoring the loan portfolio’s qualitative objectives; credit risk reporting; capital adequacy measurement using the Internal Ratings Based Approach (IRBA) measuring economic capital requirement and expected loss calculation of impairment losses on a collective basis.
8.5.1 Probability of default
The purpose of credit rating is to divide customers into different groups according to the risk involved. A customer’s credit rating is an estimate of the risk of some of the customer’s exposures becoming non-performing receivables to OP Financial Group within 12 months, or of the customer having more serious payment defaults. The size of this risk for OP Financial Group is explained by probability of default, or PD, estimated for each credit rating category, which is the average probability within one year over the economic cycle. In other words, during a good economy cycle, the actual proportion of defaulted customers in a given credit rating category is lower than the estimated PD, and when economic trends are poor, higher than the estimated PD.
OP Financial Group uses several methods to evaluate customers’ probability of default. Private customers’ loans included in retail exposures in capital adequacy measurement are categorised using specific models in the credit application stage and as part of the bank’s loan portfolio. Small business exposures included in retail exposures in capital adequacy measurement are categorised using an ‘A’ rating or a rating model for low exposures. Mid-size and large companies’ exposures included in corporate exposures are categorised using an ‘R’ rating. Small business exposures included in corporate exposures are categorised using an ‘A’ rating. An internal credit rating model is used for credit institution counterparties.
8.5.2 Assessment of corporate customer creditworthiness
OP Financial Group assesses the probability of default of its corporate customers using its internal 20-step credit rating system. Corporate exposure is put into categories ranging from 1.0 to 12.0, with defaulted customers falling into categories 11 or 12.
61

Rating of corporate customers in OP Financial Group
Probability of default assessment of mid-size and large corporate customers (‘R’ rating) is based on the companies’ financial indicators and qualitative background information transferred into a statistical scoring model. An expert familiar with the customer will make a rating proposal on the basis of what is suggested by the model and of any other information available. Any changes and uncertainties relating to the future outlook will be regarded as warning signs and exceptions to the rating provided by the model. Based on the expert’s proposal, a decision on the customer’s credit rating will be made at least once a year. The model currently used in ‘R’ rating was adopted at the beginning of 2008 and is annually validated according to the IRB requirements.
Suomen Asiakastieto Oy’s rating model, Rating Alfa, which it has used since 1999, forms the basis of small corporate customers’ ‘A’ ratings. This is a statistical regression model in which variables cover a comprehensive range of factors related to the company’s payment method, key indicators based on financial statements, and other background information. The rating model has been supplemented with safety and backup clauses restricting the credit rating of a company if, for example, no financial statements are available. Scores provided by Rating Alfa have been calibrated with OP Financial Group’s internal credit ratings. The rating given to corporate exposures by the statistical model will be assessed annually and may be adjusted to correspond to the company’s actual probability of default. The current model has been used since the beginning of 2008 and was last partly updated in 2012.
Low exposure corporate customers are rated using a rating model for low exposures. Rating is based on customer history and payment behaviour data available from information systems. Each rating is updated once a month. The rating model for low exposures was adopted in 2009 and updated in 2012.
Irrespective of the model, each credit rating category is subject to the same probability of default, i.e. credit rating categories deriving from various models are comparable with one another. In deriving probability of default, the Group has used recent years’ actual payment default data, long-term credit loss data and bankruptcy statistics and the cyclical nature of the model. The need for updating probabilities of default for each category is assessed annually.
The table below shows the correspondence between OP Financial Group’s credit rating categories for corporate exposure and the credit rating categories of an international rating agency.
Correspondence between corporate exposure rating categories and S&P ratings
S&P Rating AAA...AA+ AA...BBB+ BBB...BBB- BB+...BB- B+...B B-...CCC OP Financial Group 1.0–2.0 2.5–4.0 4.5–5.0 5.5–7.0 7.5–8.5 9.0–10.0
8.5.3 Assessment of credit institution creditworthiness
A specific ‘L’ rating model used to assess the probability of default of credit institutions is based on the probability of default deriving from qualitative and quantitative factors. Credit institution exposure is divided into 20 categories ranging from 1.0 to 12.0, with defaulted customers falling into categories 11–12.
62

The statistical model that forms the basis of credit ratings is based on empirical data on Pohjola Bank plc’s international credit institutions as counterparties. The model applies the so-called sovereign ceiling rule according to which a private-sector counterparty cannot have a higher credit rating than the government. The Group decides on the credit ratings of credit institutions at least once a year or more frequently in the case of any changes in the credit institution’s creditworthiness. The ‘L’ credit rating model was adopted in 2009 and last updated in 2012.
The table below shows the correspondence between OP Financial Group’s credit rating categories for credit institution exposure and the credit rating categories of international rating agencies.
Correspondence between credit institution exposure rating categories and S&P ratings
S&P Rating AAA...AA+ AA...BBB+ BBB...BBB- BB+...BB- B+...B B-...CCC OP Financial Group 1.0–2.0 2.5–4.5 5.0 5.5–7.0 7.5–8.0 8.5–10.0
8.5.4 Assessment of private customer creditworthiness
In the assessment of probability of default of private customers, exposures are divided into 16 rating categories from A+ to F, the latter representing exposures of defaulted customers. In this assessment, Pohjola uses a credit rating model of the customer’s loan portfolio and the rating of the application stage. The rating of private customers is based on information available from the loan application, the customer’s payment behaviour and other transaction history data. The scores calculated on the basis of this data determine the exposure category. Average PD has been calculated for each category for a period of 12 months.
The rating model for private customers' loan portfolio is used to categorise the exposures of private customers. The loan portfolio’s rating categories are updated once a month. This model was adopted in 2006 and its current version dates back to 2013. The rating model for the loan portfolio is used in the assessment of credit risk and the measurement of capital requirement.
Pohjola's private customers' exposures are categorised, before any credit rating model is applied, using for the application stage of finance-company products, with updated versions being adopted in spring 2014. The models for assessing creditworthiness in use are as follows: car finance, trade finance and accounts with credit facility, and merchant MasterCard.
The rating based on the application stage supports the credit approval process, credit risk assessment and the pricing of new loans. This rating takes place as part of OP Financial Group’s credit process.
8.5.5 Country rating
Pohjola examines country risks on the basis of external credit ratings.
8.5.6 Loss given default (LGD) and exposure at default (EAD)
In addition to the models used for assessing the probability of default, Pohjola uses models for predicting loss given default (LGD) and exposure at default (EAD) to measure credit risk. In OP Financial Group’s credit risk models, LGD is an estimate of a financial loss (as a share of customer exposures at default) which the bank would incur if the customer would default within one year. EAD refers to the estimated amount of the bank’s receivable from the customer at default. Off-balance-sheet exposures are assessed by means of a Conversion Factor (CF), which describes how much of off-balance-sheet exposures have been assessed to be utilised at the time of default.
8.6 Credit decision
The assessment of credit standing, the credit rating decision and the customer memorandum form the basis of a proposal for credit decisions. Account managers prepare proposals for the exposure limit, credit limit and financing in cooperation with credit directors and representatives from different product areas. Credit directors present the proposals for the exposure limit to the decision-making bodies. The proposals for a credit decision and exposure limit includes a report on the applicant, any previously granted credit and the related collateral and uncovered exposure. In addition to the assessment of credit standing and the credit rating decision, a credit proposal for corporate customers includes the collateral and covenant policy for short- and long-term exposure and a forecast of the development of the customer’s financial standing. A financial statements analysis is always included in the proposal for the exposure limit of corporate customers and a company analysis is often also required of new corporate customers. In most cases, credit proposals for corporate and credit institution customers involve an opinion of credit risk issued by the bank and/or the central cooperative’s Risk Management.
63

Credit decisions are taken by Pohjola’s Senior Credit Committee and Credit Committee. The decision-making bodies make decisions to accept risks within the framework of their powers and in compliance with the risk policy, limits and policy guidelines. The powers of the decision-making bodies have been scaled on the basis of the customer’s credit rating, exposure and uncovered exposure. Decisions on credit for private customers are based on OP Financial Group’s internal credit rating applicable to private customers using an automatic credit-decision system.
8.6.1 Measuring, monitoring and reporting credit risk
Pohjola measures credit risk on a customer-specific basis in terms of total exposure and uncovered exposure. Exposure refers to the total amount of balance sheet and off-balance-sheet items that the bank holds for a specific customer. Uncovered exposure is calculated as the difference between the exposure and the collateral value. Credit risk is also measured using a weighted collateral shortfall figure calculated by multiplying the customer-specific uncovered exposure against the probability of default corresponding to the customer’s credit rating. Other credit risk indicators include the ratio of doubtful receivables and past due loan repayments to the loan and guarantee portfolio, as well as the ratio of loan losses to the loan and guarantee portfolio.
The credit risk associated with a loan portfolio is also measured by the amount of expected and unexpected losses and the development of expected losses in relation to the loan and guarantee portfolio. Customer monitoring consists of an annual analysis of financial statements and interim reports, and continuous monitoring of the customer’s payment behaviour and business. Customer credit record, past due payments and non-performing loans are monitored continuously on the basis of information obtained from both the OP Financial Group's internal monitoring service, as well as from external services.
Customers whose financial status performance, credit risk and payment behaviour justify a more detailed examination are subject to special observation. In this context, the Group also analyses the need to change the customer’s credit rating, the probability of a credit loss and the need to recognise an impairment loss. This often means that the credit approval decision is made by a higher-level decision-making body.
8.6.2 Decision-making and assessment related to credit risk models
OP Financial Group’s Risk Management Committee decides on the adoption of any significant changes in the credit risk models. These decisions are based on the general principles governing credit ratings and the validation of credit risk models approved by the Central Cooperative’s Executive Board. The models are developed and maintained by the Central Cooperative’s Risk Management, independent of business lines/divisions.
The effectiveness of the credit rating process and credit risk models is subject to regular monitoring and supervision. Risk Management collects continuous feedback from the business lines/divisions on the effectiveness of the credit rating process and models related to credit risk parameters. It monitors monthly the models that automatically create a credit rating category. with a view to following changes in the loan portfolio and lending while ensuring the effectiveness of the rating process.
In addition, the quality of the models is assured at least once a year in accordance with the validation instructions approved by OP Financial Group’s Risk Management Committee. The set of the validation instructions contains requirements for quality assurance that must be carried out when adopting a model. Validation uses statistical methods to test, for example, the model’s sensitivity and the validity of risk parameter estimates (PD, LGD and EAD). Validation also involves qualitative assessment, such as an analysis of user feedback, and a peer group analysis. The results of validation and any recommendations for required measures are reported to the Risk Management Committee, which decides on any improvements on the basis of the validation.
The central cooperative's Internal Audit ensures that validation is performed independent of businesses. It also reviews the credit risk models and their use in the central cooperative’s companies and member cooperative banks as a part of their regular audit.
8.6.3 Use of credit risk models in capital adequacy measurement
OP Financial Group uses the Foundations Internal Ratings Based Approach (FIRBA) to measure its capital adequacy requirement for credit risk on corporate and credit institution exposures. In FIRBA, an estimate of probability of default (PD) generated by OP Financial Group’s credit risk models affects the capital adequacy requirement for credit risk associated with the customer. Pohjola uses the so-called standard estimates supplied by the authorities on loss given default (LGD) and exposure at default (EAD).
When FIRBA is used to measure the capital requirement for credit risk on retail exposures, PD, LDG and EAD values based on OP Financial Group’s internal models are used to calculate the risk weight. Pohjola uses the Standardised Approach (SA) for government and central bank exposures and for some other exposure categories (like those of the Baltic countries). As a rule, a
64

simple model applies to equity investments. The PD/LGD method applies to OP Financial Group’s strategic investments, where the PD values are based on internal models and LGD values on standard estimates.
8.7 Securitised assets
Pohjola has not acted as an originator or manager of securitisation transactions but has invested in asset-backed securities. Credit derivatives are not used to asset-backed securities within Banking. In calculating the total amount of the risk-weighted assets of securitisation exposures, the Group has used IRBA to credit risk when the securitisation exposure belongs to the exposure category to which the assessment model based on credit rating is applied.
The Group applies credit ratings affirmed by Moody’s, Fitch and Standard & Poor’s to securitised exposures. If two selected credit rating agencies have affirmed credit ratings pertaining to a securitisation transaction, the lower rating will apply. If more than two selected credit rating agencies have affirmed credit ratings pertaining to a securitisation transaction, the two highest ratings will apply. If the two highest ratings differ from one another, the lower rating will apply.
9. Liquidity risk management
Liquidity risk management involves the management of structural funding risk and funding liquidity risk. A difference between the maturities of receivables and liabilities presents risks. Such a risk also arises if liabilities or receivables, or both, are concentrated with respect to counterparties, instruments or market segments. Liquidity risk may also result from changes in customer behaviour, the business environment or market liquidity.
Structural funding risk refers to uncertainty related to long-term lending, arising from the refinancing risk due to the structure of financing. Pohjola’s structural funding risk mainly arises from the differences of the maturity structures between lending characterised by long maturity plus deposit funding dependent on customer behaviour and wholesale funding.
Funding liquidity risk refers to the risk that a bank will not be able to meet its current and future cash flows and collateral needs, both expected and unexpected, without affecting its daily operations or overall financial position.
For the management of funding liquidity risks, Pohjola maintains a liquidity portfolio consisting of liquid notes and bonds. Funding liquidity management is governed by the regulations of the minimum reserve and marginal lending facility systems by the European Central Bank.
Liquidity risk management is based on policy guidelines issued by and risk limits approved by OP Financial Group. The Executive Board of the central cooperative approves the qualitative targets set for the liquidity buffer, a funding plan, a business continuity and contingency funding plan in the case of threat scenarios and a liquidity status control model. The contingency funding plan involves a control model based on threshold levels, a contingency plan containing funding sources, and a contingency funding plan at operational level. The liquidity buffer’s quantitative and qualitative targets, the contingency plan and the control model based on threshold levels have been determined on the basis of threat-scenario stress tests.
As the central financial institution of OP Financial Group, Pohjola Bank plc is responsible for the liquidity and sufficient liquidity buffer of OP Financial Group. The liquidity buffer consists mainly of notes and bonds, issued by entities of high credit rating, which may be used as collateral for central bank debt or sold on the secondary markets.
Liquidity risk management aims to ensure that the buffers and other precautions are correctly proportioned to the risk-bearing capacity, to ensure capital commitment and to mitigate the structural funding risk and the funding liquidity risk arising from the balance sheet structure.
Funding liquidity risk management aims to ensure sufficient liquidity in an acute, unexpected liquidity squeeze, focusing on establishing and maintaining a framework for supporting sufficient liquidity, as well as planning precautionary measures.
Liquidity risk management involves planning liquidity and the balance sheet structure, maintaining a sufficient liquidity buffer and diversifying funding by maturity category, counterparty, product and market area. With a view to managing liquidity and funding liquidity risks, Pohjola Group carries out scenario analyses describing threats critical to liquidity and their effects on funding and liquidity, as well as tools to secure liquidity.
Pohjola Group's risk policy describes the principles and methods of liquidity risk management and the limitation of structural funding risk. Group Functions is responsible, on a centralised basis, for Pohjola’s liquidity risk and funding liquidity risk management, long-term funding as well as the maintenance of liquidity portfolios.
Key sources of funding include issues of CDs and bonds/notes, deposits from other banks and member cooperative banks, deposits from the public and shareholders’ equity. Pohjola’s credit rating contributes to the access to and price of funding in international money and capital markets.
65

9.1 Measuring, monitoring and reporting liquidity risks
The Group monitors structural funding risk on the basis of net cash flows by maturity, for which it has set limits. The Group monitors long-term funding maturity using a maturity distribution, for which it has set limits. Funding liquidity management is based on the scenarios of maturing cash flows and the liquidity buffer, Limits have been set to liquidity scenarios. Liquidity is also measured by means of stress tests.
Financing risks are reported both to the business lines/divisions and the management on a monthly basis. A liquidity risk report must be prepared on a daily basis.
10. Market risk management
Market risks in this section refer to Banking’s and the Group Functions’ exposure to market risks. Section “Risk Management of Non-life Insurance” below deals with market risks associated with investment operations by Non-life Insurance subsidiaries.
Market risks include the effects caused by changes in market prices (interest rates, foreign exchange rates, equity prices and credit spreads) or by implicit volatilities on the bank’s financial performance. Market risks may have a direct effect on earnings or the effect may be divided over several financial years. The recognition of the effects on earnings depends on the accounting treatment of the financial instruments or derivative contracts. Market liquidity has an effect on the formation of market prices. If markets lack sufficient depth or cease to function in a regular manner due to a disruption, market risks also arise due to the lack of market liquidity. In general, a decrease in market liquidity leads to weaker financial results due to higher liquidity premiums included in market prices.
Market risk management aims to limit risks arising from price fluctuations in balance sheet and off-balance-sheet items to an acceptable level and to promote healthy financial performance by optimising the risk/return ratio.
Both trading book and the banking book involve market risks. Trading aims to benefit from market price changes in the short term by actively taking market risks. The effects on earnings of the market risks taken in trading are mainly immediately reflected in changes in the fair value of financial instruments and derivatives.
The banking book contains the bank’s structural interest-rate risk arising from the loan and deposit portfolio, and domestic and foreign wholesale funding and derivative contracts hedging the abovementioned items. The banking book also includes liquidity buffers and other assets (for example shares, real property holdings and equity). The management of market risks associated with the banking book has the aim of hedging the Group’s net financial income against interest rate fluctuations and maintaining OP Financial Group’s liquidity buffer at optimum levels. No currency risks are taken in the management of the banking book. The market risk associated with the banking book tends to materialise in net interest income recognised over financial periods.
Pohjola restricts its market risk exposure by means of the risk policy decided by the Board of Directors, the policy describing the methods applied in market risk measurement, and bank-level risk limits. In addition, the policy specifies those authorised to take open market risks and presents other restrictions with respect to taking market risks. The risk policy is subject to annual updating.
In addition to implementing its risk policy, Pohjola limits its liquidity portfolio’s market risk exposure based on an investment plan for its liquidity portfolio, which specifies the basic allocation of investments (tactical asset allocation) within certain ranges. The liquidity portfolio mainly comprises deposits with central banks and notes and bonds eligible as collateral for central bank refinancing. The Board of Directors approves the investment plan on an annual basis.
Risk Management and the Middle Offices of the Markets division and Asset Management monitor and report market risks and their outcome to the business lines/divisions and executive management. The principles and indicators used in managing market risks involved in trading and the banking book are largely the same.
Analysing the risk exposure structure and markets on an ongoing basis and anticipating the impact of changes on the bank’s risk exposure and earnings play a key role in market risk management. Effective market risk management requires real-time and accurate information on exposures and markets and a quick response to changes. The Group manages market risks by adjusting the risk exposure using both assets and derivative instruments within the risk limit framework, in line with the current market views. Derivative instruments can also be used to hedge market exposure or individual contracts against changes in market values or in order to secure net financial income.
66

10.1 Measuring, monitoring and reporting market risks
Pohjola uses the indicators and parameters shown in the table below to monitor market risks:
Type of risk Risk indicator EBT Frequency Interest rate risk/trading portfolios As part of VaR indicator Change in market value Daily Interest rate risk/banking book As part of VaR indicator Change in market value, net
financial income Daily
Credit spread risk As part of VaR indicator Change in market value Daily Currency risk As part of VaR indicator Change in market value Daily
Price risk of structured products and securitised investments
As part of VaR indicator (liquid investments) or separate VaR indicator (illiquid investments)
Change in market value Daily (liquid investments) or monthly (illiquid investments)
Commodity risk Separate VaR indicator, As part of VaR indicator
Change in market value Daily
Equity risk As part of VaR indicator
Change in market value Daily
Volatility risk Effect of 1-percentage point or 1 basis point volatility change on the present value of exposure
Change in market value Daily
In the risk policy, the Board of Directors decides on the acceptable total market risk exposure level.
Pohjola mitigates its total market risk exposure by means of the Value-at-Risk limit (VaR), which is allocated to business divisions and covers all key market risk exposures.
Market risk exposures requiring VaR limits are defined by using long-term, over-the-cycle volatility and correlation estimates. VaR levels have been calculated according to a one-day holding period at a 99% confidence level.
In addition to the VaR limit, specific VaR limits have been set for commodity derivatives and repurchased index-linked bonds issued by Pohjola Bank plc. Pohjola mitigates market risks associated with equity and private equity investments and the vega risk of option positions using limits based on sensitivity indicators. Nominal amount limits are used to mitigate market risk associated with underwriting commitments issued.
In addition to the VaR limits that mitigate risk exposure under an average economic situation, Pohjola manages market risks using dynamic VaR indicators sensitive to market movements. Furthermore, Pohjola applies risk factor sensitivity indicators for exposure, stress test scenarios and the monitoring of cumulative returns of trading positions. The risk measurement methods supplement with each other.
10.2 Interest rate risk
Interest rate risks arise from differences between the maturities of balance-sheet and off-balance-sheet items, interest rate reset dates or the bases of interest rates. In trading, interest rate risks materialise when market rates change as a result of changes in the market value of securities and derivative contracts. Interest rate risks exposed by the banking book translate into a change in net financial income, those by notes and bonds at fair value through profit or loss, included in the liquidity buffer, into a change in fair values shown in the income statement and those by available-for-sale notes and bonds into a change in fair value reserve under equity.
The Group measures and reports interest rate risks exposed by trading and the banking book on a daily basis using the same benchmarks and principles governing limits set for the risks. The interest rate risk of both trading and the banking book is included in the VaR indicator. In addition, Pohjola uses a specific tool to estimate the sensitivity of the accumulated net financial income to interest rate movements. Only specifically designated units may take interest rate risks within the set limits.
10.3 Credit spread risk
Credit spread risk refers to a position’s negative change in the market value, arising from changes in the pricing of credit risk premiums and liquidity risk premiums in the market. The credit spread risk exposure is defined for notes and bonds used in
67

trading and those in the banking book. Consequently, the price risk of notes and bonds are divided into interest rate risk and credit spread risk components.
Pohjola daily measures and set limits for credit spread risks as part of the VaR limit.
10.4 Currency risk
Currency risks arise if there is a gap between assets and liabilities denominated in the same currency. Currency risk management is carried out in the context of trading. Pohjola sets a limit for currency risk as part of the VaR limit. Foreign currency exposures are subject to daily reporting.
10.5 Price risk associated with structured products and securitised assets
Pohjola follows the price risk of structured investments with a separate VaR indicator, and the price risk of securitised bonds and notes as part of the VaR indicator. Investments in securitised assets are included in long-term investment assets.
The market risk of structured products and securitised assets are included in the VaR limit. The risk of liquid investments and illiquid investments is subject to daily and monthly reporting, respectively.
10.6 Commodity risk
Commodity risk arises from uncovered commodity derivative position. The Group takes commodity risk through electricity, oil and metal derivatives.
Commodity exposures are subject to daily reporting.
10.7 Equity risk
Equity risk arises from equity and private equity investments. Equity investments include shares held for trading and long-term ownership.
The risk policy specifies the principles regulating the composition of the equity portfolio and the selection of investments.
Treasury is responsible for the management of the equity portfolio for available-for-sale investments. Pohjola sets limits for equity risks as part of the VaR limit on daily basis.
Nominal amount limits are used to mitigate equity risk associated with underwriting commitments issued.
10.8 Volatility risk
Volatility risks arise from uncovered option exposure. Interest rate, currency and commodity options create volatility risk.
Interest rate, foreign currency and commodity volatility risks are subject to daily reporting.
10.9 Real estate risk
Real estate risks refer to risks associated with fair value changes in and returns on property holdings.
The risk policy specifies the principles regulating the composition of the real estate portfolio and the selection of investments. The Group makes annually value estimates and action plans for each property holding.
10.10 Derivatives business
Pohjola uses interest rate and currency derivatives actively and equity, equity index and credit derivatives to a lesser extent. Note 92 provides detailed information on the underlying values and credit equivalents. Derivatives are used for trading and hedging purposes as part of total exposure management. The Group monitors derivative risks as part of the total exposure in trading and treasury using the same benchmarks as for balance sheet exposure.
68

Counterparty risk involved in the derivatives business is monitored using credit equivalents determined on the basis of the repurchase cost of contracts (market value) and product-specific future credit risk factors. Credit risk caused by derivatives is reduced by entering into a master agreement for derivative contracts and through collateral received on the basis of Credit Support Annex. Counterparty risk is also limited by means of central counterparty clearing.
The purpose of hedging loans and debt issues against interest rate risks is to lock the margin, or the interest rate difference between the hedged and hedging item. Hedge effectiveness is assessed by the ratio between the interest rate risk figures and market values of the hedged and hedging items.
Additional earnings components related to the issued index-linked bonds are hedged using derivative structures. The hedging derivatives are equity, equity index, currency, interest rate, commodity and credit derivatives.
11. Risk management of Non-life Insurance
11.1 Risks of insurance operations
The insurance business is based on taking and managing risks. The largest risks pertain to risk selection and pricing, the acquisition of reinsurance cover, and the adequacy of insurance liabilities. The risk inherent in insurance liabilities lies mainly in insurance lines characterised by a long claims settlement period. In addition to underwriting risks, a major insurance business risk consists of the investment risk related to the assets covering insurance liabilities.
11.2 Underwriting risks
Underwriting risks in non-life insurance comprise risk of loss or damage, and provision risk.
Risk of loss or damage occurs when there is an above-average number of losses or they are exceptionally extensive. This results in profits made of the policies being reduced owing to higher claims expenditure.
Provision risk occurs when the claims expenditure of incurred losses are higher than forecast on the balance sheet date. The uncertainty concerning the timing of compensation payments also has an effect on the amount of claims liability.
An accumulation of loss due to natural catastrophes or large catastrophes caused by human activity constitutes a specific risk type. In such a case, one catastrophic event may in practice give rise to simultaneously payable claims for a large number of insured risks at high amounts. The resulting total claims expenditure may be extremely large. However, this risk can be diversified, since the Group operates in the region with a perceived relatively low risk of natural catastrophes, enabling the Group to protect against the risk through reinsurance.
Unidentified background factors may also affect underwriting risks. Examples from recent history include cases of occupational diseases caused by exposure to asbestos dust, and the effect of higher life expectancy than predicted on the pension portfolio of statutory insurance.
11.2.1 Underwriting risk management
The most important tasks within underwriting risk management relate to risk selection and pricing, the acquisition of reinsurance cover, the monitoring of claims expenditure and the analysis of insurance liabilities. The Underwriting Executives act as the highest decision-making body in charge of underwriting risks. Responsible for Pohjola Group's underwriting risk management, the Underwriting Executives make underwriting decisions within the framework of powers confirmed by the boards of directors of the insurance companies, and report its decisions to these boards.
Decisions on customer and insurance object selection and risk pricing are made according to the Underwriting Guidelines. The UW Executives approve risks with the most significant effect and the most demanding risks while decisions on smaller risks, depending on the size and severity of the risk, require decisions made jointly by several underwriters or managers. For basic insurance lines, decisions are made on a system-supported basis and customers and the objects of insurance are selected within the powers allowed by instructions specifically approved.
11.2.2 Risk selection and pricing
Operating models highlight the role of risk selection and pricing. The Group has set limits for the size and extent of risk for each insurance line and risk concentration. The Group has a centralised data warehouse and analysis applications in place to support risk selection and pricing. Insurance terms and conditions serve as a vital tool in mitigating risks. In addition, risk analyses are performed on a customer or insurance line specific basis to mitigate risks.
69

11.2.3 Reinsurance
The reinsurance principles and the Group’s maximum retention levels for different type of risks are annually approved by the Board of Directors. In practice, the Group’s own retention levels can be kept lower than the maximum retention levels approved by the Board of Directors, if the reinsurance pricing supports this. The actual retention level is a maximum of EUR 5 million on a property per risk basis and EUR 5 million on a per event (accumulation) basis. The per event reinsurance cover had a capacity of EUR 150 million in 2014. In addition, claims under the short-tail business have an annual aggregate protection with a capacity of EUR 15 million.
Reinsurance has an effect on the solvency capital requirement. Only reinsurance companies with a sufficient rating are accepted as reinsurers. The reinsurer's counterparty risk is managed by means of reinsurance diversification limits.
12.2.4 Risk concentrations
The Group takes account of local risk concentrations in EML (Estimated Maximum Loss) estimates for property risks and through EML breakthrough cover included in reinsurance cover. Our operating region has no major risk of earthquakes. With respect to risks associated with other natural disasters, such as storms and floods, Finland is a stable area. However, the Group has protected against catastrophe accumulation losses through an extensive catastrophe reinsurance cover whose size has been dimensioned to correspond to the calculated size of a catastrophe loss occurring once every 200 years. The catastrophe accumulation cover applies to property damage and personal injuries.
11.2.5 Evaluation of insurance liabilities
The Group monitors the adequacy of insurance liabilities on an annual basis. Insurance liabilities arising from insurance contracts are determined on the basis of estimated future cash flows. The cash flows comprise payable claims and loss adjustment expenses.
The amount of insurance liabilities has been estimated in such a way that it is, in reasonable probability, sufficient to cover the liabilities arising from insurance contracts. This has been performed by estimating an expected value for the insurance liability and then by determining a safety loading based on the degree of uncertainty related to the liability.
The provision for unearned premiums has mainly been determined in accordance with the pro-rata rule, calculated in relation to the duration of the insurance period. The provision for unearned premiums is determined for each insurance in contracts with companies and for private customers using specific statistical coefficients.
For the provision for unpaid claims, known losses above a provision level and the provision for unpaid claims for annuities are reserved on a case-by-case basis. The provision for unpaid claims for unknown losses, future changes to known provisions, and known losses below a case-specific provision level are reserved collectively using actuarial techniques.
The provision for unpaid claims for annuities corresponds to the discounted present value of cash flow of compensation for loss of income payable as continuous annuity. The discount rate is determined taking account of the current interest rate, security required by law and the maximum discount rate set by the authorities. On 31 December 2014, the discount rate used was 2.5% (31 December 2013: 2.8%). As a result of a reduction in the lower discount rate for pension liabilities, the provision for unpaid claims for annuities rose by EUR 62 million.
The valuation of collective liability is based on different statistical methods. In the valuation of collective liability, the largest risks relate to estimating the future rate of inflation (excl. compensation for loss of income), the adjustment of changes due to changed compensation practices and legislation in the development triangle of claims (i.e. whether history provides a true picture of the future) and the adequacy of historical information over dozens of years. Of the collective liability, only the liability for annuities has been discounted.
When estimating the collective liability for medical expenses and rehabilitation expenses benefits in statutory workers’ compensation and motor liability insurance, the Group has taken account of the fact that claims paid for accidents occurred more than 10 years ago are financed through the pay-as-you-go system.
The evaluation of insurance liabilities always involves uncertainties which may be due, for instance, to the prediction of the claims trend, delays in verifying losses, cost inflation, legislative amendments and general economic development. Every three years, an external actuary performs for the Group an analysis of the appropriateness of the calculation bases and the amount of Group insurance liabilities. Such an analysis was last carried out in 2012.
70

11.3 Statutory insurance
By law, statutory insurance is mandatory for the policyholder. On the other hand, an insurance company is obliged to grant statutory insurance. The indemnification regulations and the amount of compensation are strictly prescribed by law. In addition, statutory lines of insurance are regulated by joint bodies which supervise compliance with consistent claims principles and claims standards. Private motor vehicles account for a larger share of the Group's motor liability insurance portfolio than motor vehicles owned by companies. In other respects, statutory insurance is mainly taken out by companies or other organisations.
With respect to statutory workers’ compensation insurance, employers take out the insurance for the benefit of their employees to provide cover for occupational injuries and diseases. Motor liability insurance covers all bodily injuries resulting from the use of a motor vehicle on roads and, with certain restrictions, bodily injuries sustained by the driver who caused the accident, and material damage caused to a third party. Patient insurance covers bodily injuries caused to patients as a result of medical treatment.
11.3.1 Number and size of claims
The majority of claims expenditure in statutory lines of insurance for bodily injuries consists of compensation for loss of income and for medical care, which are covered in full. As an exception to the above, compensation for loss of income in statutory workers’ compensation insurance is, before the age of 65 years, only covered up to 85% of the full compensation. Compensation for permanent loss of income is paid in the form of a lifetime annuity. In the case of death, the insured person’s widow(er) and his/her children until the age of 25 years are entitled to survivors’ pension. No maximum monetary amount has been set for pension benefits paid. With respect to statutory workers’ compensation insurance and motor liability insurance, the insurance company is not, however, liable for the index increments of compensation for loss of income nor for any medical expenses that are paid for over ten years after the accident’s occurrence. These are financed through the so-called pay-as-you-go system (see Pay-as-you-go system below).
As regards claims paid out under statutory lines of insurance, the public sector also charges for losses, based on actual costs incurred due to medical care, which have occurred after 2004. However, the risk for medical treatment expenses is substantially limited by the fact that medical treatment expenses for accidents that have occurred more than 10 years ago do not fall within the scope of compensation payable under insurance contracts (see Pay-as-you-go system below). In addition, Pohjola actively seeks to conclude contracts with different medical care providers in order to minimise costs.
In statutory workers' compensation insurance, a major loss may occur, since a large number of those insured may be working within a small area. A traffic accident may involve many casualties and injured persons, in addition to material damage. However, an upper limit of EUR 3.3 million applies to compensation payable for material damage under one motor liability policy.
In addition to accidental injuries, statutory workers’ compensation insurance covers occupational diseases, which tend to develop slowly and therefore the evaluation of the related claims expenditure involves more uncertainty than accidents. Latent occupational diseases are an extreme example of this, in which the period from exposure until the actual outbreak of the disease may take several decades, such as asbestos-induced diseases. Any latent occupational diseases diagnosed after 2007, with at least five years since exposure, are financed under the pay-as-you-go system (see Pay-as-you-go system).
Since taking out insurance is mandatory in statutory lines of insurance, the law provides that insurers must aim at risk correlation in their rating of insurance policies in such a way that premiums are reasonably proportioned to the costs incurred due to the policies. Motor liability insurance has a no-claims bonus system under which a loss event raises the insurance premium. In statutory workers' compensation insurance schemes for large companies, the policyholder has the option of experience rating, which means that premiums are linked to the policyholder’s own claims experience. The larger the company the stronger the linkage, and the more reliable the estimation of the company’s actual risk level, measured on the basis of the company’s own claims experience. A corresponding principle also applies to the rating of the largest vehicle fleets of a single policyholder. In this way, the risk associated with premium rating is limited, since the rating of the insured risk follows automatically, albeit not fully, the policyholder’s own claims experience.
The provision for unpaid claims for annuities consists mainly of annuities of statutory insurance lines. Discounting is used in the computation of the provision for unpaid claims for annuities and the discount rate used is of great significance for the provision.
11.3.2 Uncertainties related to future cash flows
It is typical of the statutory lines of insurance that the period from the date of the occurrence of loss until the date on which the claim is fully paid is often long. Such underwriting business generates a long-term cash flow, on the evaluation of which medical-cost inflation and the mortality of beneficiaries have the greatest impact.
71

A downward trend in mortality increases cash flow from claims, since compensation for loss of income is mainly paid as lifetime annuity. Mortality has continued its downward trend in Finland and other industrialised countries for several decades. In Finland, the life expectancy of new-born babies has increased by around 1.5 years in the last ten years. This trend has been assumed to continue in the mortality model used by the Group for calculating insurance liabilities. The estimation of medical-cost inflation also plays a major role in the evaluation of cash flows. Advancements in medicine and improvements in living conditions have both decreased mortality and increased medical treatment expenses. In the projection of future cash flows, the Group has assumed medical-cost inflation to be two percentage points higher than the general inflation rate.
Since index increments in annuities under statutory insurance lines and medical expenses payable in excess of ten years after occurrence of a loss event are excluded from the scope of cover of an insurance contract (see Pay-as-you-go system below), the provision for unpaid claims contains practically no inflation risk in this respect. However, the medical-cost inflation risk associated with statutory lines of insurance concerns insurance liabilities arising from the Group’s insurance contracts for the first ten years after occurrence of the loss event.
Losses coverable as occupational diseases resulting from exposure to asbestos fall, almost without exception, within the scope of occupational diseases covered under statutory workers' compensation insurance. The related compensation paid mainly covers medical expenses, loss of income and survivors’ pensions. Assessing liabilities due to asbestos losses is difficult, since the latent period of various asbestos-induced diseases, i.e. the symptom-free period from asbestos exposure until the outbreak of an occupational disease, is long varying from 15 to 40 years on average, depending on the type of asbestos disease. The use of asbestos was stopped in Finland primarily in the 1980s. The estimate of liabilities resulting from asbestos losses is based on the average amount and estimated number of losses. The transfer of latent occupational disease since 2007 to be financed under the pay-as-you-go system will decrease uncertainty related to estimated cash flows concerning potential occupational diseases which have not yet been diagnosed but for which liability exists as a result of exposure.
11.3.3 Pay-as-you-go system
The pay-as-you-go system is a scheme based on special laws governing each statutory line of insurance. Under this system, the financing of certain benefits, the so-called pay-as-you-go benefits, specified in these laws, has been arranged through the pay-as-you-go system. The system is a statutory scheme not generate any financial benefit or harm to the insurance company that would lead to changes in equity.
Pay-as-you-go benefits include index increments in annuities, medical treatment expenses paid under statutory workers’ compensation insurance and motor liability insurance over ten years after the accident occurred, latent occupational diseases (diagnosed after 2007) under statutory workers' compensation insurance and certain other benefits and increases in benefits, as provided in special laws on various statutory lines of insurance.
In accordance with these laws, the pay-as-you-go benefits are financed through contributions charged annually by insurers from policyholders in connection with premium payment. The amount of this contribution is determined on the basis of the insurance company’s market share of the line of insurance concerned during the same year. In particular, an insurance company which no longer underwrites the insurance line in question does not participate in the financing within the pay-as-you-go system. The amount collected through this contribution is annually remitted to the central cooperative for the particular insurance line, as provided by law, which is in charge of distributing the related funds in such a way that each company engaged, or was previously engaged, in the insurance line concerned receives exactly the amount that corresponds to the claims it had paid pay-as-you-go benefits during that year.
Accordingly, future policyholder generations will pay for the financing of future pay-as-you-go benefits. The obligation to insure regarding all statutory lines of insurance guarantees the financing basis for the system. For instance, in the case of statutory workers' compensation insurance, the contribution for financing the pay-as-you-go benefits payable in any given year is charged from all employers who have employees in Finland or Finnish employees assigned abroad in that particular year. Therefore, the financing of the pay-as-you-go system, based on the special laws governing statutory lines of insurance, could fail only if paid work, motor traffic or medical care in Finland ceased altogether.
11.4 Voluntary accident and health insurance
Under these lines of voluntary insurance, compensation is paid for medical expenses incurred due to treatment of a bodily injury or illness. In addition, a lump-sum benefit is paid in the case of handicap or death caused by injury or illness. The policyholder may be either a private individual or a company. The actual insurance risk between these two does not differ materially.
11.4.1 Number and size of claims
Claims are usually small in other accident and health insurance. The largest claims may arise from catastrophes with a large number of injured people. In designated crisis areas, insurance cover is not in force.
72

An upper age limit has generally been set for insured persons, with the aim of restricting the amount of claims paid under policies. Furthermore, a person to be insured under medical expenses insurance is, as the main rule, required to provide a health declaration on the basis of which the insured person’s entitlement to compensation may be limited.
Insurers have the right to alter the price and terms and conditions of insurance annually when renewing automatically renewable annual policies. However, insurance legislation restricts the grounds for altering insurance premiums and terms and conditions, and these grounds must be listed in the insurance contract. Moreover, an insurance contract may not be terminated because of a loss event.
Pohjola has taken out reinsurance cover against catastrophe accumulation in statutory and voluntary accident and health insurance. Retention under reinsurance amounts to EUR 5 million and claims are paid up to EUR 25 million. In addition, the amount remaining for own account has been reinsured under general catastrophe cover.
11.4.2 Uncertainties related to future cash flows
Medical expenses insurance policies are mainly contracts which cover only medical treatment expenses incurred during the insurance period. Under the health insurance terms and conditions, insurance premiums may be raised in proportion to an increase in medical treatment expenses. Consequently, how the medical-cost inflation will develop does not add to any major uncertainty with respect to the future cash flows of the lines of health insurance.
Medical-cost inflation has a major impact on projecting cash flows in medical expenses insurance, with respect to illnesses for which compensation is paid for a long time. Rapid progress in medicine and rising pharmaceuticals costs will increase medical-cost inflation.
Developments in public healthcare will also affect future cash flows. If tax-funded public healthcare services decline, people will increasingly start financing their medical care through medical expenses insurance.
11.5 Comprehensive and cargo insurance
Comprehensive insurance policies cover loss of or damage to insured motor vehicles and railway rolling stock. The comprehensive insurance portfolio consists mainly of comprehensive motor vehicle policies taken out by private individuals and companies. Cargo insurance applies mainly to companies' transport risks, covering loss of or damage to goods in transit. This line of insurance also contains luggage and boat/yacht insurance whose policyholder is mainly a private individual.
11.5.1 Number and size of claims
Weather conditions have the greatest effect on the number and size of claims. Claims expenditure is therefore larger during the winter than during the summer.
The greatest risks within cargo insurance are associated with risk concentrations caused by sea transport and trading stock. In addition, weather conditions may involve accumulation risks covering a geographically large region, such as storms and floods, and the risk of snow and icy roads during the winter pertains to comprehensive insurance.
The rating of motor vehicle insurance employs a no-claims bonus system, under which the occurrence of a loss event raises the premium. In addition, the insurance company has the right to alter the premium annually. However, the premium paid by a private individual as the policyholder may be altered only if the conditions set out in the insurance contract are met.
The Group has taken out reinsurance cover against major loss of or damage to cargoes, with the retention under reinsurance amounting to EUR 5 million. In addition, the Group has taken out reinsurance cover for losses for own account under catastrophe cover under the same reinsurance agreement as property and business interruption policies. Retention under this catastrophe protection totals EUR 5 million per loss event.
The majority of the motor vehicle insurance portfolio comprises private individuals' policies. In other respects, the insurance risk in this class consists mainly of insurance taken out by companies.
11.5.2 Uncertainties related to future cash flows
Projecting future cash flows in private individual and motor vehicle insurance does not involve any major uncertainties. Almost all claims have been paid out within six months of the occurrence of the loss event. For other policies, the claim settlement period is somewhat longer.
73

11.6 Property and business interruption/consequential loss insurance
Property insurance covers loss of or damage to the insured property, excluding property coverable under comprehensive or cargo insurance. Companies and other institutions account for over half of the property insurance portfolio. This line also comprises business interruption insurance which covers financial losses arising from interrupted business operations due to damage to the company’s property.
11.6.1 Number and size of claims
The largest single risks within property and business interruption insurance include fire, natural phenomenon and breakage risks exposed by companies' production facilities and buildings, and the related business interruption risks. Households' individual property risks are small and the related individual claims have no material effect on the Group's earnings. The majority of claims expenditure for households is due to leakage, fire and burglary claims.
The risk of natural catastrophes has been considered minor in Finland and the Baltic region. On the basis of our current knowledge based on studies, it is still uncertain whether the recent storms are due to climate change or natural variations in climatic conditions. However, the studies have suggested that there are indications of a change in climatic conditions in the Group's operating region at least in the long term. The projected temperature increase will probably be reflected in changes in summer and winter conditions and, for instance, in higher precipitation, although there is no clear proof of higher temperatures intensifying storms in our region.
In the selection of property and business interruption risks, the Group applies standardised procedures based on customer segments' various insurance needs and solutions. Rating is performed in a graded way in accordance with the size and severity of the risk. In the rating process, resources and managerial decision-making are increased as the size and severity grows.
Customer-selection and discount guidelines serve as guiding principles in the rating of corporate and institutional customers. The customer-selection guidelines provide details on a potential customer's eligibility for becoming a customer, taking account of eg payment defaults. In sectors characterised by large risks, the Group conducts stricter risk selection. The discount guidelines define the seller's, risk manager's, underwriter's and supervisor's powers to grant discounts by line of insurance and partly by customer segment. The Group also applies system authorisations to control the rating of small companies.
The Group monitors the profitability of property and business interruption insurance contracts using a diversified follow-up and analysis system based on an insurance and loss data warehouse. Profitability analyses are carried out by line of insurance, customer segment, business sector and customer care organisation.
The Group has the right to re-rate policies in connection with a policy renewal or to terminate a policy. However, the premium paid by a private individual as the policyholder may be altered only on conditions specified in the insurance contract.
The Group has reinsured its insurance portfolio under a non-proportional reinsurance treaty in which its retention amounts to EUR 5 million per underwriting risk. In addition, it has taken out reinsurance protection against catastrophe accumulation claims.
11.6.2 Uncertainties related to future cash flows
Projecting future cash flows in property and business interruption insurance does not involve any major difficulties. Claims are mainly paid within one year of the occurrence of the loss event and the amount of loss can be estimated reliably. By and large, the greatest uncertainty in claim-specific estimates pertains to new business interruption and accumulation losses.
With respect to monitoring the extent of storm damage, the Group monitors separately the damage caused by each storm. In each monthly report, the Group compares the initial overall loss estimate with the established claims expenditure and adjusts this estimate, where necessary.
74

11.7 Liability and legal expenses insurance
The lines of statutory insurance which comprise liability insurance components are not included in this group. Pure liability insurance covers loss provided that the insured party is liable to pay damages for a loss caused to a third party. Corporate insurance accounts for the majority of the insurance risk associated with this group. Legal expenses insurance covers financial loss resulting from legal expenses. Private individuals’ insurance cover forms the majority of the insurance risk of this group.
11.7.1 Number and size of claims
Laws and legal practice governing the liability to pay damages have a major impact on the number and size of liability claims.
Claims made by private individuals are usually small. In addition, private individuals' risks account for a minor share of the total risk within the class.
The majority of corporate liability policies consist of product liability and commercial general liability policies. In the selection of insurance risk, the same guidelines apply as in property and business interruption insurance. In product liability insurance, for instance, the risk of losses incurred due to a single defect or act – the so-called serial losses – has been reduced in such a way that, for losses incurred at different times from the same defect, the total maximum indemnity equals the sum insured for the period during which the first loss was detected.
Legal expenses insurance covers expenses for legal proceedings incurred by the insured person. Since the insured person can contribute to the costs of legal proceedings, for instance, through the choice of attorney, legal expenses insurance applies a proportional deductible, whereby the customer always pays a certain percentage of the overall loss.
The Group’s retention for liability insurance amounts to EUR 4 million for any single loss event.
11.7.2 Uncertainties related to future cash flows
Liability insurance is characterised by losses being revealed slowly. Once a loss has been reported, uncertainty may still prevail as regards the size of the loss. However, the most significant uncertainty relates to the assessment of unknown losses.
In liability insurance, claims can be allocated either by the time of occurrence or by the time at which the claim was made. This is of major significance with respect to cash flow projections. If the insurance contract stipulates that the loss must be allocated in accordance with the loss report, the policyholder cannot file new claims after an agreed period of time from the expiry of the insurance contract.
No significant uncertainty relates to cash flows from legal expenses insurance, since losses in this line are always reported promptly. The size of the losses does not therefore involve any major uncertainty.
11.8. Long-term insurance contracts
Long-term insurance contracts refer to contracts with an average minimum policy term of two years, comprising decennial insurance and perpetual insurance.
11.8.1 Number and size of claims
The majority of the decennial policies are statutory construction defects insurance policies. In these policies regarding residential buildings, a loss event requires a construction defect and the builder's default. Since the liability period under the insurance is 10 years, the risk of serial loss is involved. For a builder with exceptionally many recorded construction defects, the risk of default increases substantially. In the case of a serial loss, the Group has a stop loss reinsurance treaty covering loss accumulation per underwriting year.
The underwriting of perpetual insurance was terminated in the 1970s. The insured property may be a building or a forest. The policyholder has paid a lump-sum premium for the entire insurance period. The unlimited cover is valid until the sum insured has been indemnified. The policyholder is entitled to surrender. Owing to the effect of inflation, the sums insured and risks or perpetual insurance are small. The policyholders consist mainly of private individuals.
75

11.9 Investment risks
In insurance business, investments comprise assets covering insurance liabilities and shareholders’ equity. Through controlled investment risks, Pohjola aims to achieve the best possible return on the investment portfolio at an acceptable risk level while taking account of the structure of insurance liabilities and the solvency targets.
The most significant investment risks pertain to market, credit and liquidity risks which can materialise in terms of lower-than-expected return on investment assets or of impaired investments. The Group mitigates investment risks by diversifying investments as efficiently as possible by asset class, counterparty, sector, geographical area, and by ensuring that the investment portfolio is as liquid as possible.
In Non-life Insurance, investment operations are based on investment plans and investment authorisations, confirmed annually by the Board of Directors, which specify the basic allocation and range of investments by asset class, the organisation of investment, risk limits as well as decision-making powers and authority.
The basic allocation of investments by asset class forms the key investment-management tool. In its determination, Pohjola takes account of the operating environment and prospects, investment risks in relation to expected return, requirements set by insurance liabilities, requirements set by the authorities, rating targets and risk appetite.
Non-life Insurance applies the Asset/Liability Management (ALM) model used to determine the basic allocation. As a result of fluctuations in asset values and active investing, the company occasionally deviates from the basic allocation within defined limits.
Investment operations are subject to monthly reporting to the Executive Committee, Risk Management and the non-life insurance companies’ boards of directors. These reports specify the amount invested, recorded income by asset class and recorded income based on benchmark indices, as well as risk indicators.
Risk Management monitors daily the set risk limits set in the investment plan, key risk limits including allocation limits, interest rate and currency limits, counterparty credit-rating limits and diversification limits.
11.9.1 Market risk
Market risk consists of price, interest rate and currency risks. Changes in equity prices, interest rates, foreign exchange rates, prices of commodities and real properties have an effect on the value of, and annual income from, investment assets. The Group uses an internal ALM model and the market risk sensitivity analysis to assess the relation between the Non-life Insurance investment risk and solvency capital.
The maximum allocation of asset classes involving price risks, such as equities, alternative investments and real property, is subject to limits. The Group also manages investment risks by diversifying investments across various instruments, by region and by industry.
11.9.2 Interest rate risk
In addition to the sensitivity analysis, the interest rate risk associated with fixed-income portfolios is monitored using modified duration. The investment plan sets a range for the modified duration of fixed-income portfolios proportioned to the modified duration of a benchmark portfolio. In determining the interest rate risk limit, Non-life Insurance has taken account of the effect of interest rate risk arising from the discounting of insurance liabilities.
11.9.3 Currency risk
In the management of currency risks, Non-life Insurance takes account of the currency risk arising from both investments and insurance operations. Currency risks exposed by Non-life Insurance arise mainly from foreign equity investments. The investment plan specifies a limit set for currency risks and presents principles of hedging against currency risks by asset class. The Group is active in changing the degree of hedging within the risk limit according to the current market view.
11.9.4 Use of derivatives
For the management of market risk, the Group also uses derivatives. The investment plan defines the principles of their use every year. Interest rate, equity and credit derivatives may be used both for hedging purposes and for increasing the risk level of the portfolio, within defined limits. Currency derivatives may be used for hedging purposes only. Derivative contracts may be signed on regulated markets or with a counterparty whose long-term rating is adequate.
76

11.9.5 Credit risk
Credit risks associated with investment arise from the issuer's credit risk and the counterparty risk associated with derivative contracts. The company manages credit risks by diversifying the portfolio and limiting the proportion of weaker credit risk in the portfolio. The investment plan specifies limitations regarding credit ratings and maximum investments regarding any single counterparty. The company performs an internal credit risk assessment of non-rated issuers, on the basis of which it can make an investment decision.
11.9.6 Liquidity risk
In the investment plan, the Group annually assesses the liquidity status and takes account of its liquidity requirements when building up the investment portfolio. Active insurance operations show a surplus in terms of liquidity, since premiums written are collected before payment of compensation. Whenever necessary, the money market portfolio serves as the primary liquidity buffer. Investments in equities and notes/bonds consist mainly of quoted and liquid instruments.
77

Assets and liabilities classified as held for distribution to owners and discontinued operations
Consolidated financial statements
Effect on the consolidated income statement for 1 Jan. - 31 Dec. 2013
EUR million
Previousaccounting
policy
Newaccounting
policy
Effect ofchange in
accountingpolicy
Net interest income 229 230 1Impairment of receivables 37 37Net interest income after impairments 193 193 1Net income from Non-life insurance 529 528 0Net commissions and fees 162 162 0Net trading income 93 93 0Net investment income 39 46 7Other operating income 38 38 0Total income 1,053 1,060 7Personnel costs 184 184ICT costs 90 90Depreciation/amortisation 55 55 0Other expenses 251 252 1Total expenses 580 581 1
0 0Earnings before tax 473 479 6Income tax expense 49 49 1Profit for the period 424 430 6
Atributable to:Owners of the parent 424 426 1Non-controlling interests 4 4Total 424 430 6
Share of associates' profits/losses accounted for using the equitymethod
Note 3. Change in accounting policy
Following the realisation of OP Cooperative's public voluntary bid, Pohjola Group is planning structural changes,meaning for example, that the Non-life Insurance segment and the Asset Management segment would be transferredfrom Pohjola Group to be directly owned by OP Cooperative. As to asset management, the transfer has beenscheduled to take place during 2015. For this reason, the Asset Management segment is reported, according to IFRS5, as discontinued operations in the income statement and assets and liabilities classified as held for distribution toowners in the balance sheet. The Non-life Insurance and Asset Management segments were reported as discontinuedoperations in accordance with IFRS 5. The structural change relating to the Non-life Insurance segment is delayed forover a year, which is why it is reported under continuing operations together with Banking and the Group Functions. Amore detailed description of the effects can be found in note 15.
The table below shows the effect of the change in the accounting policy on the income statement, statement ofcomprehensive income, balance sheet and cash flow statement for the financial year 2013. Changes in the accountingpolicy also include discontinued operations.
Pohjola Group has applied the following standards since 1 January 2014: IFRS 10 "Consolidated FinancialStatements", IFRS 11 "Joint arrangements", IFRS 12 "Disclosure of Interests in Other Entities" and IAS 28"Investments in Associates and Joint Ventures" revised as a result of the standards. According to IFRS 10, controldetermines whether the parent company consolidates an entity. The Group has control over an entity if it is exposed, orhas rights, to variable returns from its involvement with the enity and has the ability to affect those returns through itspower over the entity. As a result of the adoption of the standards, the accounts of two property investment funds havebeen included in Pohjola Group's financial statements as new subsidiaries. In addition, 42 property companies are nowreported as joint operations to wich proportionate consolidation applies. The new companies are reported under theGroup Functions and Non-life Insurance operating segments. in addition, the proportion of the owners of non-controlling interests has increased.
78

Effect on the consolidated statement of comprehensive income for 1 Jan. - 31 Dec. 2013
EUR million
Previousaccounting
policy
Newaccounting
policy
Effect ofchange in
accountingpolicy
Profit for the period 424 430 6Items that will not be reclassified to profit or loss
Gains/(losses) arising from remeasurement of defined benefit plans 0 0Items that may be reclassified to profit or loss
Change in fair value reserveMeasurement at fair value -1 1 2Cash flow hedge -16 -16
Translation differences 0 0 0Income tax on other comprehensive income
Items that will not be reclassified to profit or lossGains/(losses) arising from remeasurement of defined benefit plans -2 -2
Items that may be reclassified to profit or lossMeasurement at fair value 9 9 0Cash flow hedge 5 5
Total comprehensive income for the period 419 426 7
Attributable to:Owners of the parent 419 421 2Non-controlling interests 6 6Total 419 426 7
79

Effect on the consolidated balance sheet on 1 January 2013
EUR million
Previousaccounting
policy
Newaccounting
policy
Effect ofchange in
accountingpolicy
Cash and cash equivalents 5,643 5,643Receivables from credit institutions 8,815 8,816 1Financial assets at fair value through profit or loss
Financial assets held for trading 246 246Financial assets at fair value through profit or loss at inception 9 9
Derivative contracts 4,462 4,462Receivables from customers 13,839 13,834 -5Non-life insurance assets 3,523 3,500 -23Investment assets 5,431 5,548 117
26 26Intangible assets 922 922Property, plant and equipment (PPE) 69 67 -2Other assets 1,600 1,598 -1Tax assets 36 37 1Total assets 44,623 44,710 87
EUR million
Previousaccounting
policy
Newaccounting
policy
Effect ofchange in
accountingpolicy
Liabilities to credit institutions 5,840 5,840Financial liabilities at fair value through profit or loss
Financial liabilities held for trading 3 3Derivative contracts 4,557 4,557Liabilities to customers 10,775 10,767 -8Non-life insurance liabilities 2,599 2,599Debt securities issued to the public 13,769 13,769Provisions and other liabilities 2,550 2,572 22Tax liabilities 485 487 2Subordinated liabilities 1,275 1,275Total liabilities 41,854 41,869 16
Shareholders' equityCapital and reserves attributable to
Share capital 428 428Fair value reserve 167 171 4Other reserves 1,093 1,093 0Retained earnings 1,081 1,080 -1
Non-controlling interest 69 69Total shareholders' equity 2,769 2,841 72Total liabilities and shareholders' equity 44,623 44,710 87
Investment accounted for using the equity method
80

Effect on the consolidated balance sheet on 31 December 2013
EUR million
Previousaccounting
policy
Newaccounting
policy
Effect ofchange in
accountingpolicy
Cash and cash equivalents 2,046 2,046Receivables from credit institutions 9,899 9,899 0Financial assets at fair value through profit or loss
Financial assets held for trading 435 435Financial assets at fair value through profit or loss at inception 9 9
Derivative contracts 3,444 3,444Receivables from customers 14,515 14,510 -5Non-life insurance assets 3,539 3,502 -37Investment assets 7,427 7,574 147
29 29Intangible assets 910 910Property, plant and equipment (PPE) 84 82 -2Other assets 1,367 1,369 2Tax assets 15 15 0Total assets 43,720 43,824 105
EUR million
Previousaccounting
policy
Newaccounting
policy
Effect ofchange in
accountingpolicy
Liabilities to credit institutions 4,789 4,789Financial liabilities at fair value through profit or loss
Financial liabilities held for trading 4 4Derivative contracts 3,420 3,420Liabilities to customers 10,188 10,183 -5Non-life insurance liabilities 2,746 2,746Debt securities issued to the public 16,097 16,097Provisions and other liabilities 2,075 2,076 0Tax liabilities 375 378 3Subordinated liabilities 984 984Total liabilities 40,677 40,675 -2
Shareholders' equityCapital and reserves attributable to
Share capital 428 428Fair value reserve 164 168 4Other reserves 1,093 1,093 0Retained earnings 1,358 1,358 0
Non-controlling interest 103 103Total shareholders' equity 3,043 3,150 107Total liabilities and shareholders' equity 43,720 43,824 105
Investment accounted for using the equity method
81

Effect on the consolidated cash flow statement 1 Jan. - 31 Dec. 2013
EUR million
Previousaccounting
policy
Newaccounting
policy
Effect ofchange in
accountingpolicy
Cash flow from operating activitiesProfit for the period 424 426 1Adjustments to profit for the period 161 159 -2Increase (-) or decrease (+) in operating assets -4,150 -4,135 15Receivables from credit institutions -986 -986Financial assets at fair value through profit or loss -338 -338Derivative contracts 28 28Receivables from customers -736 -736Non-life Insurance assets -77 -62 15Investment assets -2,289 -2,285 4Other assets 248 244 -3Increase (+) or decrease (-) in operating liabilities -2,040 -2,058 -19Liabilities to credit institutions -1,031 -1,031Financial liabilities at fair value through profit or loss 1 1Derivative contracts -10 -10Liabilities to customers -588 -584 3Non-life Insurance liabilities 48 48Provisions and other liabilities -460 -482 -22
Income tax paid -126 -126Dividends received 51 55 3A. Net cash from operating activities -5,680 -5,680 0Cash flow from investing activitiesDecreases in held-to-maturity financial assets 129 129Acquisition of subsidiaries and associates, net of cash acquired -4 -4Purchase of PPE and intangible assets -45 -45Proceeds from sale of PPE and intangible assets 3 3B. Net cash used in investing activities 83 83Cash flow from financing activitiesDecreases in subordinated liabilities -271 -271Increases in debt securities issued to the public 24,340 24,340Decreases in debt securities issued to the public -21,833 -21,833Dividends paid -145 -145Other decreases in equity items 0 0C. Net cash used in financing activities 2,092 2,092Net increase/decrease in cash and cash -3,505 -3,506 0
Cash and cash equivalents at period-start 6,177 6,177 1Cash and cash equivalents at period-end 2,671 2,672 0
Interest received 1,790 1,790Interest paid -1,582 -1,582
82

Adjustments to profit for the financial yearNon-cash items and other adjustmentsImpairment losses on receivables 40 40Unrealised net earnings in Non-life Insurance 108 108Change in fair value for trading -199 -199Unrealised net gains on foreign exchange operations 2 2Change in fair value of investment property 1 -3 -3Planned amortisation/depreciation 55 55 0Share of associates' profits 1 1Other 155 157 2
Items presented outside cash flow from operating activitiesCapital gains, share of cash flow from investing activities -1 -1 0Total adjustments 161 159 -2
Cash and cash equivalentsLiquid assets 2,051 2,051Receivables from credit institutions payable on demand 620 621 0Total 2,671 2,672 0
Other changes
LeviesIn addition, the Group has used IFRIC interpretation 21: Levies since the beginning of 2014 before its entry into forceand EU approval. According to the interpretation, the bank levy liability and the liability arising from contributions to theDeposti Guarantee Fund are recognised in full in accrued income and prepaid expenses and accrued expenses anddeferred income in the balance sheet when the levy is imposed under said legislation, i.e on 1 January 2014. Thechange in the accounting policy does not change the recognition principle applied to these expenses through profit orloss.
83

EUR million 2014 2013*
Interest incomeReceivables from credit institutions 68 65Receivables from customers 319 305
Loans 294 282Finance lease receivables 24 22Impaired loans and other commitments 1 2
Notes and bonds 166 154Held for trading 14 10At fair value through profit or loss 0 0Available for sale 142 133Held to maturity 1 2Loans and other receivables 8 9
Derivative contracts 1,369 1,246Held for trading 1,471 1,335Fair value hedge -114 -103Cash flow hedge 12 13Ineffective portion of cash flow hedge -1 1
Other 12 2Total 1,933 1,771
Interest expensesLiabilities to credit institutions 59 68Financial liabilities at fair value through profit or loss 0 0Liabilities to customers 26 27Debt securities issued to the public 247 183Subordinated liabilities 45 50
Subordinated loans 8 8Other 37 42
Derivative contracts 1,288 1,213Held for trading 1,428 1,362Cash flow hedge -140 -149
Other 9 1Total 1,675 1,542
Net interest income before fair value adjustment under hedge accounting 259 230Hedging derivatives -185 -135Value changes of hedged items 183 135Total net interest income 257 230
* Comparative figures have been restated as a result of the adoption of IFRS 10 Consolidated Financial Statements.
NOTES TO THE INCOME STATEMENT
Note 4. Net interest income
84
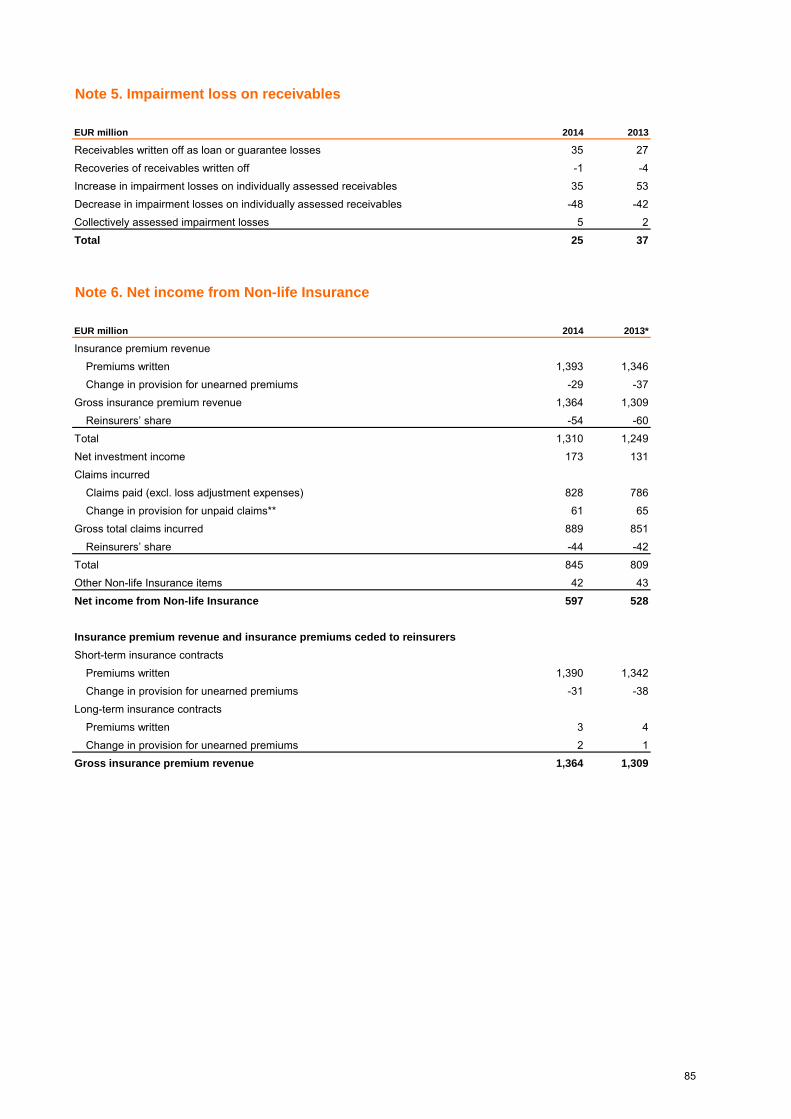
EUR million 2014 2013
Receivables written off as loan or guarantee losses 35 27Recoveries of receivables written off -1 -4Increase in impairment losses on individually assessed receivables 35 53Decrease in impairment losses on individually assessed receivables -48 -42Collectively assessed impairment losses 5 2Total 25 37
EUR million 2014 2013*
Insurance premium revenuePremiums written 1,393 1,346Change in provision for unearned premiums -29 -37
Gross insurance premium revenue 1,364 1,309Reinsurers’ share -54 -60
Total 1,310 1,249Net investment income 173 131Claims incurred
Claims paid (excl. loss adjustment expenses) 828 786Change in provision for unpaid claims** 61 65
Gross total claims incurred 889 851Reinsurers’ share -44 -42
Total 845 809Other Non-life Insurance items 42 43Net income from Non-life Insurance 597 528
Insurance premium revenue and insurance premiums ceded to reinsurersShort-term insurance contracts
Premiums written 1,390 1,342Change in provision for unearned premiums -31 -38
Long-term insurance contractsPremiums written 3 4Change in provision for unearned premiums 2 1
Gross insurance premium revenue 1,364 1,309
Note 6. Net income from Non-life Insurance
Note 5. Impairment loss on receivables
85
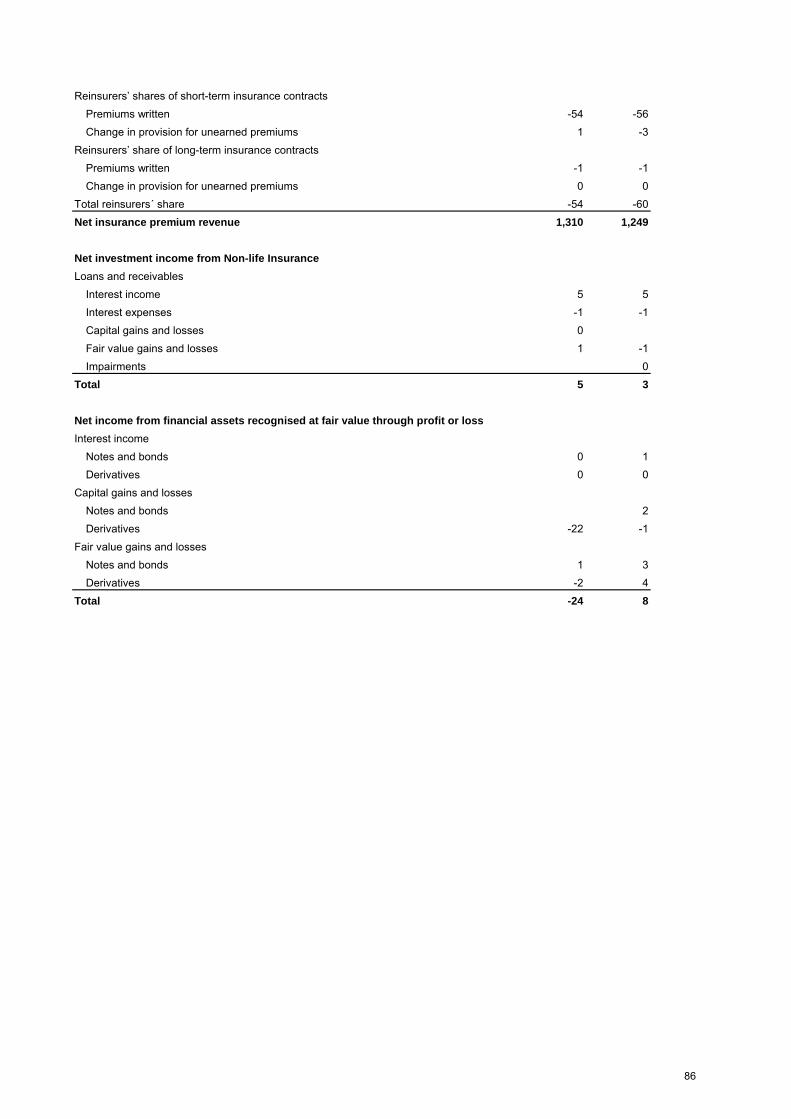
Reinsurers’ shares of short-term insurance contractsPremiums written -54 -56Change in provision for unearned premiums 1 -3
Reinsurers’ share of long-term insurance contractsPremiums written -1 -1Change in provision for unearned premiums 0 0
Total reinsurers´ share -54 -60Net insurance premium revenue 1,310 1,249
Net investment income from Non-life InsuranceLoans and receivables
Interest income 5 5Interest expenses -1 -1Capital gains and losses 0Fair value gains and losses 1 -1Impairments 0
Total 5 3
Net income from financial assets recognised at fair value through profit or lossInterest income
Notes and bonds 0 1Derivatives 0 0
Capital gains and lossesNotes and bonds 2Derivatives -22 -1
Fair value gains and lossesNotes and bonds 1 3Derivatives -2 4
Total -24 8
86

Net income from available-for-sale financial assetsNotes and bonds
Interest income 51 53Capital gains and losses 35 -2Transferred from fair value reserve during financial year 25 21Fair value gains and losses 1 0Impairments 0 -2Total 112 69
Shares and participationsDividends 18 25Other income and expenses 3 4Capital gains and losses 13 3Transferred from fair value reserve during financial year 41 19Fair value gains and losses -1Impairments -2 -8Total 72 44
Total 184 113
Net income from investment propertyRental income 17 17Capital gains and losses 0 -1Value changes from fair value measurement 2 4Maintenance charges and expenses -10 -12Other -1 -1Total 8 7
Total net investment income from Non-life Insurance 173 131
Unwinding of discount, Non-life Insurance
* Comparative figures have been restated as a result of the adoption of IFRS 10 Consolidated Financial Statements.
** The item includes EUR 62 million (38) as a result of the changed discount rate for insurance liabilities.
The increase in the discounted insurance liabilities of Non-life Insurance due to the passage of time (Note 33)(unwinding of discount) totals EUR 41 million (43). Unwinding of discount is computed monthly applying the discountrate at the end of the previous month and the insurance liabilities at the beginning of the current month. The discountrate was 3.7% from 31 December 2003 to 30 November 2004, 3.5% from 1 December 2004 to 30 November 2005,3.3% from 1 December 2005 to 30 November 2007, 3.5% from 1 December 2007 to 30 November 2011, 3.3% from 1December 2011 to 31 July 2012, 3.0% from 1 August 2012 to 31 October 2013, 2.8% from 1 November 2013 to 31July 2014 and 2,5% from 1 August to 31 December 2014.
87

EUR million 2014 2013*
Commissions and feesLending 53 45Deposits 0 0Payment transfers 36 31Securities brokerage 22 21Mutual fund brokerage 0 0Securities issuance 10 8Asset management and legal services 1 2Insurance operations 16 17Guarantees 15 16Other 5 6Total 158 148
Commission expensesPayment transfers 20 14Securities brokerage 8 8Securities issuance 3 4Asset management and legal services 3 3Other 9 8Total 44 37
Net commissions and fees 114 111
Note 7. Net commissions and fees
* Comparative figures have been restated as a result of the adoption of IFRS 10 Consolidated Financial Statements.
88

EUR million 2014 2013*
Financial assets and liabilities held for tradingCapital gains and losses
Notes and bonds 4 2Shares and participations 0 0Derivatives 35 100Total 39 102
Fair value gains and lossesNotes and bonds 2 -1Shares and participations 0Derivatives 10 -30Total 12 -31
Dividend incomeAssets and liabilities at fair value through profit or loss
Capital gains and lossesNotes and bonds 0Total 0
Fair value gains and lossesNotes and bonds -1 0Total -1 0
Net income from foreign exchange operations Currency exchange -78 -1
Other 106 22Total 77 93
* Comparative figures have been restated as a result of the adoption of IFRS 10 Consolidated Financial Statements.
Note 8. Net trading income
89

EUR million 2014 2013*
Available-for-sale financial assetsNotes and bonds
Capital gains and losses 11 14Transferred from fair value reserve during the financial year 0 1
Shares and participationsCapital gains and losses 5 1Transferred from fair value reserve during the financial year 9 1Impairments -1 0
Dividend income 43 28Total available-for-sale financial assets 67 44
Financial assets carried at amortised costLoans and other receivables
Capital gains and losses -1 0Total financial assets carried at amortised cost -1 0
Investment propertyRental income 6 4Gains and losses from fair value measurement -2 3Maintenance charges and expenses -5 -4Other 0 0Total investment property -2 2
Total net investment income 64 46
EUR million 2014 2013*
Rental income from property in own use 0 0Capital gains on property in own use 0 1
8 8Realisation of repossessed items 0Rental income from assets rented under operating lease 6 10Reinsurance commissions of Non-life Insurance 2 2Other 16 15Total 32 36
Note 10. Other operating income
Central banking service fees
* Comparative figures have been restated as a result of the adoption of IFRS 10 Consolidated Financial Statements.
* Comparative figures have been restated as a result of the adoption of IFRS 10 Consolidated Financial Statements.
Note 9. Net investment income
90

EUR million 2014 2013
Wages and salaries 116 118Variable remuneration 15 18Pension costs 24 26
Defined contribution plans 19 20Defined benefit plans 4 6
Other social expenses 9 9Total 163 170
EUR million 2014 2013*
Depreciation and amortisationBuildings 3 1Machinery and equipment 1 1Intangible assets related to business combinations 21 21Other intangible assets 21 19Leased out assets 5 7Other 0 0Total 52 51
Impairment lossProperty in own use 0 1Total 0 1
Total 52 52
Note 11. Personnel costs
Note 12. Depreciation and amortisation
* Comparative figures have been restated as a result of the adoption of IFRS 10 Consolidated Financial Statements.
91

EUR million 2014 2013*
Other administrative expensesOffice expenses 47 33Telecommunication expenses 9 9Marketing expenses 6 7Corporate social responsibility expenses 1 1Other administrative expenses 41 51Total 104 101
Rental expenses 2 3Expenses for property and business premises in own use 24 25Capital losses on property in own use 0Expenses for realisation of repossessed items 1 1Reinsurance commissions of Non-life Insurance 2 3Credit losses of Non-life Insurance 4 6Bank levy 20 19Other** 100 83Total 258 241
** The item includes EUR 321,000 (292,000) in audit fees paid to auditors, EUR 119,000 (143,000) in fees for assignments as referredto in sub-paragraph 2, paragraph 1, section 1 of the Auditing Act, EUR 20,000 (154,000) in fees for legal counselling and EUR 118,000(386,000) in fees for other services.** The item includes EUR 61 million (51) in insurance business sales commissions paid to OP Financial Group member banks.
Note 13. Other expenses
* Comparative figures have been restated as a result of the adoption of IFRS 10 Consolidated Financial Statements.
92

EUR million 2014 2013*
Current tax 105 90Tax for previous financial years 24 -6Deferred tax -21 -40Income tax expense 107 43
Corporate income tax rate 20.0 24.5
Earnings before tax 548 456
Tax calculated at a tax rate of 20.0% (2013:24.5%) 110 112Tax for previous financial years 24 -6Income not subject to tax -25 -9Expenses not deductible for tax purposes 10 7Re-evaluation of unrecognised tax losses -1 0Tax adjustments -9 6Change in tax rate 1 Jan. 2014 -65Other items -1 0
Tax expense 107 43
Note 14. Income tax
* Comparative figures have been restated as a result of the adoption of IFRS 10 Consolidated Financial Statements.
Reconciliation between tax expense in the income statement and tax expense calculated by the applicable taxrate
93

a) Results of discontinued operations
Asset ManagementEUR million 2014 2013
Net commissions and fees 64 51Share of associates' profits/losses accounted for using the equity method 1 0Other income and expenses -30 -30Earnings before tax 36 21Taxes 7 6Results of discontinued operations for the period 29 15
Share of parent company owners of discontinued operations 29 15Total 29 15
b) Assets classified as held for distribution to owners and associated liabilities
Asset Management segment assets
EUR million 2014
Receivables from credit institutions 7Investment assets 0Investment accounted for using the equity method* 27Intangible assets 102Property, plant and equipment (PPE) 0Other assets 30Total Asset Management segment assets 167
Other holdingsOther assets classified as held for distribution to owners 39
Total assets classified as held for distribution to owners 205
Intangible assets include EUR 97 million in goodwill and EUR 5 million in other intangible assets.
* The Asset Management segment has one significant associated company, Access Capital Partners Group S.A., withNote 54 of OP Financial Group's 2014 financial statements presenting specified information on the company.
As a result of OP Cooperative's execution of the public voluntary bid for Pohjola Bank plc shares, Pohjola Group isplanning to make structural changes. In the plan OP Cooperative will become the owner of the Asset Managementsegment and the transfer will be implemented as a demerger at carrying amounts. The demerger is estimated to takeplace during 2015. As a result, the assets and liabilities of the Asset Management segment will be presented as of 30June 2014 separately in the balance sheet as assets and liabilities classified as held for distribution to owners and inthe income statement as discontinued operations, in accordance with IFRS 5.
Note 15. Assets and liabilities classified as held for distribution to owners anddiscontinued operations
94

Asset Management segment liabilities
EUR million 2014
Provisions and other liabilities 10Total Asset Management segment liabilities 10
Other liabilities for transferLiabilities allocated in demerger 195
205
EUR million 2014
Fair value reserve 0Retained earnings 0Total 0
Total liabilities associated with assets classified as held for distribution to owners
Shareholder's equity associated with assets classified as held for distribution toowners
95

EUR million 31 Dec. 2014 31 Dec. 2013
Cash 1 1Deposits with central banks repayable on demand
Pohjola Bank’s minimum reserve deposit 537 527Cheque account 3,236 1,518
Total cash and cash equivalents 3,774 2,046
EUR million 31 Dec. 2014 31 Dec. 2013*
Receivables from credit institutionsDeposits
Repayable on demand 484 621Other 1
Total 484 622of which receivables from credit institutions due in less than 3 months 484 622
Loans and other receivablesRepayable on demand
From other credit institutions 0Total 0Other
From OP Financial Group institutions 9,323 8,740From other credit institutions 449 537
Total 9,772 9,277Total receivables from credit institutions 10,257 9,899
Receivables from credit institutions include subordinated receivables 42 42
* Comparative figures have been restated as a result of the adoption of IFRS 10 Consolidated Financial Statements.
In accordance with the minimum reserve system under the euro system, credit institutions are obligated to have aminimum reserve deposit with their national central bank. The reserve deposit equals the required percentage of thereserve base, as specified by the European Central Bank. The reserve base includes deposits (extensive) and debtsecurities with a maximum maturity of two years. The reserve base does not include deposits from other parties subjectto the minimum reserve obligation. The reserve deposit is currently 1% of the reserve base. Credit institutions withinOP Financial Group place a reserve deposit with Pohjola Bank plc, which acts as an intermediary authorised by OPFinancial Group credit institutions and is responsible for OP Financial Group’s obligation to place a deposit with theBank of Finland.
Note 16. Cash and cash equivalents
NOTES TO THE BALANCE SHEET
Note 17. Receivables from credit institutions
96

EUR million 31 Dec. 2014 31 Dec. 2013
Financial assets held for tradingGovernment notes and bonds 3 8Certificates of deposit and commercial papers 29 4Debentures 19 6Bonds 308 409Other notes and bonds 0 7Shares and participations 0 1
Total 360 435
Bonds 0 9Total 0 9Total financial assets at fair value through profit or loss 360 444
Financial assets held for trading, EUR millionNotes and
bonds
Shares andpartici-pations
Notes andbonds
Shares andpartici-pations
QuotedFrom public sector entities 3 8From others 310 399
OtherFrom public sector entities 29 4From others 18 0 23 1
Total 360 0 434 1
Financial assets at fair value through profit or loss at inception
31 Dec. 2013
Note 18. Financial assets at fair value through profit or loss
31 Dec. 2014
Notes and bonds at fair value through profit or loss and shares and participations by quotation and issuer
97

Notes andbonds
Shares andpartici-pations
Notes andbonds
Shares andpartici-pations
QuotedFrom others 4
OtherFrom others 0 5
Total 0 9
360 0 443 1
EUR million 31 Dec. 2014 31 Dec. 2013
Held for tradingInterest rate derivatives 4,867 2,836Currency derivatives 652 169Equity derivatives 62 108Credit derivatives 2 3Other 54 55
Total 5,637 3,171Hedging derivative contracts
Fair value hedgingInterest rate derivatives 216 218Currency derivatives 83 38
Cash flow hedgeInterest rate derivatives 10 17
Total 309 273Total derivative contracts 5,946 3,444
Note 19. Derivative contracts
Financial assets at fair value through profit or loss at inception, EURmillion
Derivative contracts in the balance sheet include positive value changes and paid premiums.
31 Dec. 2014 31 Dec. 2013
Total financial assets at fair value through profit or loss
Financial assets at fair value through profit or loss include EUR 205 million (234) in notes and bonds eligible for centralbank refinancing and EUR 19 million (11) in subordinated publicly-quoted notes and bonds.
98

EUR million 31 Dec. 2014 31 Dec. 2013*
Loans to the public and public sector entities 11,183 10,698Notes and bonds 19 50Finance lease receivables 1,162 1,148Other receivables
Other 3,401 2,874Impairment losses on loans
Based on credit risk -252 -259Total receivables from customers 15,513 14,510
* Comparative figures have been restated as a result of the adoption of IFRS 10 Consolidated Financial Statements.
Changes in impairments of loans and guarantees
EUR million LoansNotes and
bonds
Bankguarantee
receivablesInterest
receivables Total
Impairments 1 Jan. 2014 260 0 1 -3 259
27 10 -13 24
5 5
-22 15 -7
-29 -29Exchange rate difference on impairments on loansImpairments 31 Dec. 2014 241 0 12 -1 252
EUR million LoansNotes and
bonds
Bankguarantee
receivablesInterest
receivables Total
Impairments 1 Jan. 2013 240 7 0 -2 246
52 1 -12 41
2 2
-22 12 -11
-12 -7 -19Exchange rate difference on impairments on loans 0 0Impairments 31 Dec. 2013 260 0 1 -3 259
Loans and guarantee receivables derecognisedfrom balance sheet,
of which an individually assessed impairmentwas recognised
Reversal of impairments of loans and receivablesindividually assessedLoans and guarantee receivables derecognisedfrom balance sheet,
Change in impairments of collectively assessedloans and receivables
Change in impairments of collectively assessedloans and receivables
Reversal of impairments of loans and receivablesindividually assessed
Note 20. Receivables from customers
Increase in impairments of individually assessedloans and receivables
of which an individually assessed impairmentwas recognised
Increase in impairments of individually assessedloans and receivables
99

31 Dec. 2014 31 Dec. 2013
Maturity of finance leasesNot later than one year 307 3221–5 years 550 528Over 5 years 393 390
Gross investment in finance leases 1,250 1,240Unearned finance income (–) -88 -93
Present value of minimum lease payments 1,162 1,148Present value of minimum lease payment receivables
Not later than one year 288 3021–5 years 509 487Over 5 years 365 358
Total 1,162 1,148
Gross increase during the financial year 359 487
EUR million
Pohjola Group mainly offers transport equipment and industrial machinery and equipment through finance leases.
Finance lease receivables
100

EUR million 31 Dec. 2014 31 Dec. 2013*
InvestmentsLoans and other receivables 15 16Shares and participations 463 471Investment property 161 152Notes and bonds 2,330 2,035Derivative contracts 12 4Other participations 231 300Total 3,211 2,979Other assetsPrepayments and accrued income 33 40Other
From direct insurance 404 324From reinsurance 100 90Cash in hand and at bank 41 4Other receivables 66 64
Total 643 523Total Non-life Insurance assets 3,854 3,502
Non-life Insurance investmentsLoans and other receivables
Loans and other receivables 14 15Deposits with ceding undertakings 1 1Total 15 16
Financial assets recognised at fair value through profit or lossNotes and bonds 7 6Derivative contracts 12 4Total 19 10
Available-for-sale financial assetsNotes and bonds 2,323 2,029Shares and participations 463 471Other participations 231 300Total 3,016 2,800
Investment propertyLand and water areas 23 22Buildings 138 131Total 161 152
Total Non-life Insurance investments 3,211 2,979
* Comparative figures have been restated as a result of the adoption of IFRS 10 Consolidated Financial Statements.
Note 21. Non-life Insurance assets
101

EUR million
Notesand
bonds
Shares andpartici-pations
Derivativecontracts
Notesand
bonds
Shares andpartici-pations
Derivativecontracts
QuotedFrom others 7 6
OtherFrom others 12 4
Total 7 12 6 4
At fair valueAt amortised
cost Total At fair value At cost Total*
QuotedFrom public sector entities 503 503From others 1,819 1,819 435 435
OtherFrom others 0 0 258 258
Total 2,323 2,323 693 693
0 0 -2 -2
At fair valueAt amortised
cost Total At fair value At cost Total*
QuotedFrom public sector entities 465 465From others 1,549 1,549 581 581
OtherFrom others 14 14 191 191
Total 2,029 2,029 771 771
-2 -2 -8 -8
** Comparative figures have been restated as a result of the adoption of IFRS 10 Consolidated Financial Statements.
Available-for-sale financial assets of Non-life Insurance, 31 Dec. 2013**, EURmillion
Impairment losses for the financialyear
Available-for-sale financial assets of Non-life Insurance, 31 Dec. 2014, EUR million
The available-for-sale financial assets of Non-life Insurance include EUR 2 million (4) in pledged items, consistingmainly of collateral for derivatives trading.
31 Dec. 2014
Breakdown of Non-life Insurance notes and bonds recognised through profit or loss and shares andparticipations and derivatives by quotation and issuer
Available-for-saleshares and participations
31 Dec. 2013
Available-for-salenotes and bonds
Impairment losses for the financialyear
Available-for-salenotes and bonds
Available-for-saleshares and participations
* Available-for-sale shares and participations include EUR 463 million (471) in equities and mutual funds with equity risk and EUR 231million (300) in other participations. Other participations consist mainly of units in bond, money market, convertible bond, commodities,hedge funds and real estate funds.
102

Changes in Non-life Insurance investment property, EUR million 2014 2013*
Acquisition cost 1 Jan. 133 143Increase 11 18Decrease -5 -8Transfers between items 0 -20
Acquisition cost 31 Dec. 138 133Accumulated changes in fair value 1 Jan. 19 17
Changes in fair value during financial year 2 4Decrease 1 -2
Accumulated changes in fair value 31 Dec. 22 19Carrying amount 31 Dec. 161 152
* Comparative figures have been restated as a result of the adoption of IFRS 10 Consolidated Financial Statements.
A total of 94% of Non-life Insurance's investment property, or EUR 150 million, was appraised by an external propertyvaluer, Antti Huotari, authorised property valuer, (AKA), from Realia Group Oy.
Construction and repair obligations regarding investment property amounted to EUR 0 million (2). The fair value ofinvestment property holdings includes the portion of debt.
103

EUR million 31 Dec. 2014 31 Dec. 2013*
Available-for-sale financial assetsNotes and bonds 7,782 7,108Shares and participations 101 175Total 7,882 7,283
Financial assets held to maturityNotes and bonds 144 202Total 144 202
Investment propertyLand and water areas 5 5Buildings 80 83Total 85 88
Total investment assets 8,112 7,574
* Comparative figures have been restated as a result of the adoption of IFRS 10 Consolidated Financial Statements.
Available-for-sale financial assets and held-to-maturity investments on 31 Dec. 2014
EUR million
Atamortised
cost Total At fair value At cost Total
Held-to-maturity
investments
QuotedFrom public sector entities 7,302 7,302From others 398 398 7 7 144
OtherFrom others 82 82 83 11 94
Total 7,782 7,782 90 11 101 144
-1 -1
Note 22. Investment assets
Impairment losses for thefinancial year
Investment property does not include real property received as collateral in 2014 and 2013.
At fair value
Available-for-saleshares and participations
Available-for-salenotes and bonds
Available-for-sale financial assets did not include subordinated publicly-quoted notes and bonds from others orsubordinated notes and bonds other than publicly quoted from others. Investments in private equity funds, worth EUR16 million (14), were measured at fair value. It was not possible to determine reliably a fair value for investmentsmeasured at cost. Held-to-maturity investments included EUR 130 million (187) in notes and bonds eligible for centralbank refinancing and EUR 14 million (15) in other publicly-quoted notes and bonds.
104

Available-for-sale financial assets and held-to-maturity investments on 31 Dec. 2013*
EUR million
Atamortised
cost Total At fair value At cost Total
Held-to-maturity
investments
QuotedFrom public sector entities 6,725 6,725From others 322 322 7 7 202
OtherFrom others 61 61 105 64 169
Total 7,108 7,108 111 64 175 202
0 0
* Comparative figures have been restated as a result of the adoption of IFRS 10 Consolidated Financial Statements.
Changes in investment property, EUR million 2014 2013*
Acquisition cost 1 Jan. 86 67Increase 19Decrease -2Transfers between items
Acquisition cost 31 Dec. 84 86Accumulated changes in fair value 1 Jan. 3 0
Changes in fair value during financial year -2 3Decrease 1
Accumulated changes in fair value 31 Dec. 2 3Carrying amount 31 Dec. 85 88
* Comparative figures have been restated as a result of the adoption of IFRS 10 Consolidated Financial Statements.
The investment property holdings were appraised by the following external property valuer: Raino Pesu, M.Sc. Tech,authorised property valuer (AKA), authorised real estate agent (LKV), appraisal expert, and Ville Vaarala, M.Sc. Tech,appraisal expert, on behalf of Catella Property Oy.
Available-for-salenotes and bonds
Available-for-saleshares and participations
Impairment losses for thefinancial year
Any changes in the fair value of investment property are recognised under 'Net investment income'. The fair value ofinvestment property holdings includes the portion of debt.
Information on investment property leased out under operating lease can be found in Note 81.
At fair value
105

EUR million, 31 Dec. 2014Carryingamount Fair value
Effectiveinterest rate
Impairmentsarising from
credit risk
Loans and other receivables 231 245 5.5Investments held to maturity 59 56 4.3Available-for-sale financial assets 45 45 4.2Total 335 347
EUR million, 31 Dec. 2013Carryingamount Fair value
Effectiveinterest rate
Impairmentsarising from
credit risk
Loans and other receivables 298 306 5.2Investments held to maturity 99 89 4.2Available-for-sale financial assets 42 42 4.2Total 438 436
EUR millionIncome
statementFair value
reserveIncome
statementFair value
reserve
Banking 2 -1Non-life Insurance 0 0 0 -1Group Functions 12 -1 29 -3Total 13 -1 27 -3
2013
Interest accrued on reclassified notes and bonds in January–December totalled EUR 8 million (10). The pricedifference between the nominal value and acquisition value recognised in the income statement totalled EUR 2 million(3). Capital losses recognised on notes and bonds totalled EUR 1 million (2). Impairment losses recognised on notesand bonds amounted to EUR 0 million (0). The Group used derivatives to hedge against interest rate risks, applyinghedge accounting from 1 October 2008. Positive mark-to-market valuations recognised on hedging derivative contractsamounted to EUR 3 million (6).
Note 23. Reclassified notes and bonds
2014
If notes and bonds were not reclassified and had been measured using fair values available in the market:
Loans and receivables and held-to-maturity investments were reclassified in 2008. Available-for-sale financial assetswere reclassified in 2012.
The table below shows the carrying amounts and fair values of the reclassified notes and bonds.
106

Amounts entered in the balance sheet:
EUR million 31 Dec. 2014 31 Dec. 2013
Associates 2 29Total 2 29
Amounts entered in the income statement:
EUR million 2014 2013
Associates 0 0Total 0 0
Investments in associates and joint ventures
Milj. e 2014 2013
Profit of continuing operations 0 0Comprehensive income 0 0
Associates consolidated using equitymethod
Pohjola Group's investments in associated have no quoted market price and no contingent liabilities are involved inthem.
Summary of financial information on all individually immaterial associates and joint ventures included in theconsolidated financial statements
Note 24. Investment accounted for using the equity method
Pohjola Group's continuing operations include as at 31 December 2014 one (1) associated company which isindividually immaterial. The Group has a 27.75% interest (27.75) in Autovahinkokeskus Oy. Pohjola Group has noinvestments in joint ventures.
107

Goodwill Brands
Otherintangible
assets Total
Acquisition cost 1 Jan. 2014 519 179 259 1,258Increases 24 24Decreases -1 -1
-97 -39 -136Transfers between items 0 0
Acquisition cost 31 Dec. 2014 422 179 243 1,146
-7 -148 -349
-22 -45Decreases 0 0
33 33Other changes 0 0
-7 -136 -360Carrying amount 31 Dec. 2014 422 172 107 786
Transfers to assets distributed toowners
Depreciation on assets distributed toowners
301
Note 25. Intangible assets
Accumulated amortisation andimpairments 1 Jan. 2014
Customer relationshipsrelated to insurancecontracts and policy
acquisition costs
-194
301
-218Accumulated amortisation andimpairments 31 Dec. 2014
Other intangible assets include computer software to the carrying amount of EUR 81 million and EUR 27 million incomputer software under development.
Amortisation, impairment losses and their reversals were recognised on the income statement under Other operatingexpenses.
-24Amortisation during the financialyear
84
Changes in intangible assets, EURmillion
108

Goodwill Brands
Otherintangible
assets Total
Acquisition cost 1 Jan. 2013 519 179 230 1,230Increases 31 31Decreases -3 -3Transfers between items
Acquisition cost 31 Dec. 2013 519 179 259 1,258
-7 -131 -308
-20 -43Decreases 3 3Other changes
-7 -148 -349Carrying amount 31 Dec. 2013 519 172 111 910
Intangible assets with indefinite economic lives, EUR million 31 Dec. 2014 31 Dec. 2013
Goodwill 422 519Brands 172 172Total 595 691
Other most significant intangible assets
Carryingamount,
EUR million
Remainingamortisation
period
Carryingamount,
EUR million
Remainingamortisation
period
Customer relationships 84 1–4 yrs 108 2–5 yrsSoftware 81 2–5 yrs 92 2–5 yrsSoftware under development 27 17
Changes in intangible assets, EURmillion
301
Other intangible assets include computer software to the carrying amount of EUR 92 million and EUR 17 million incomputer software under development.
Amortisation during the financialyear -24
Goodwill was acquired as part of the acquisition of Pohjola Group plc’s business operations in 2005 and as part of theacquisition of Pohjola Finance Ltd (formerly K-Finance Ltd) in 2008. In 2011, goodwill increased as a result of theacquisition of Excenta Ltd, a strategic corporate wellness services provider. Brands, customer relationships and asignificant part of computer software were acquired as part of the acquisition of the Non-life Insurance operations.
-170Accumulated amortisation andimpairments 1 Jan. 2013
Customer relationshipsrelated to insurancecontracts and policy
acquisition costs
31 Dec. 2013
Amortisation, impairment losses and their reversals were recognised on the income statement under Other operatingexpenses.
108
301
31 Dec. 2014
The economic lives of goodwill and brands acquired through business combinations are estimated to be indefinite,since they affect the accrual of cash flows for an indefinable period.
Accumulated amortisation andimpairments 31 Dec. 2013 -194
109
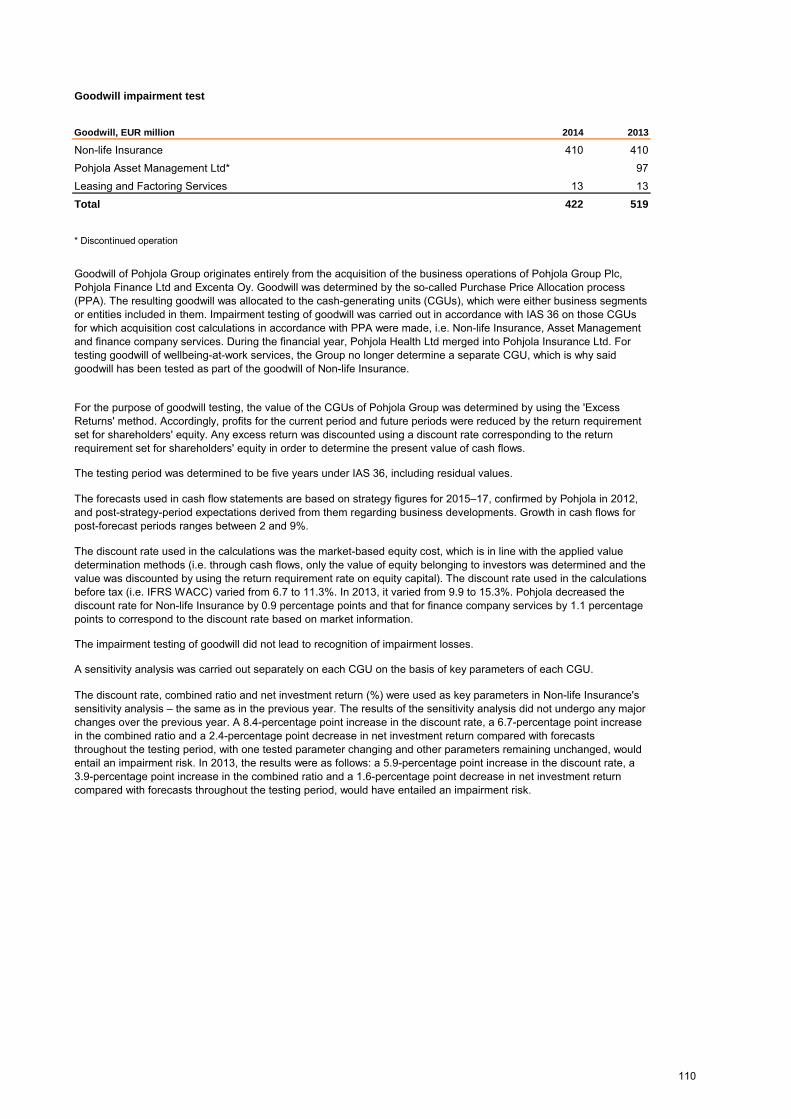
Goodwill impairment test
Goodwill, EUR million 2014 2013
Non-life Insurance 410 410Pohjola Asset Management Ltd* 97Leasing and Factoring Services 13 13Total 422 519
* Discontinued operation
For the purpose of goodwill testing, the value of the CGUs of Pohjola Group was determined by using the 'ExcessReturns' method. Accordingly, profits for the current period and future periods were reduced by the return requirementset for shareholders' equity. Any excess return was discounted using a discount rate corresponding to the returnrequirement set for shareholders' equity in order to determine the present value of cash flows.
The discount rate used in the calculations was the market-based equity cost, which is in line with the applied valuedetermination methods (i.e. through cash flows, only the value of equity belonging to investors was determined and thevalue was discounted by using the return requirement rate on equity capital). The discount rate used in the calculationsbefore tax (i.e. IFRS WACC) varied from 6.7 to 11.3%. In 2013, it varied from 9.9 to 15.3%. Pohjola decreased thediscount rate for Non-life Insurance by 0.9 percentage points and that for finance company services by 1.1 percentagepoints to correspond to the discount rate based on market information.
A sensitivity analysis was carried out separately on each CGU on the basis of key parameters of each CGU.
The forecasts used in cash flow statements are based on strategy figures for 2015–17, confirmed by Pohjola in 2012,and post-strategy-period expectations derived from them regarding business developments. Growth in cash flows forpost-forecast periods ranges between 2 and 9%.
The impairment testing of goodwill did not lead to recognition of impairment losses.
The discount rate, combined ratio and net investment return (%) were used as key parameters in Non-life Insurance'ssensitivity analysis – the same as in the previous year. The results of the sensitivity analysis did not undergo any majorchanges over the previous year. A 8.4-percentage point increase in the discount rate, a 6.7-percentage point increasein the combined ratio and a 2.4-percentage point decrease in net investment return compared with forecaststhroughout the testing period, with one tested parameter changing and other parameters remaining unchanged, wouldentail an impairment risk. In 2013, the results were as follows: a 5.9-percentage point increase in the discount rate, a3.9-percentage point increase in the combined ratio and a 1.6-percentage point decrease in net investment returncompared with forecasts throughout the testing period, would have entailed an impairment risk.
Goodwill of Pohjola Group originates entirely from the acquisition of the business operations of Pohjola Group Plc,Pohjola Finance Ltd and Excenta Oy. Goodwill was determined by the so-called Purchase Price Allocation process(PPA). The resulting goodwill was allocated to the cash-generating units (CGUs), which were either business segmentsor entities included in them. Impairment testing of goodwill was carried out in accordance with IAS 36 on those CGUsfor which acquisition cost calculations in accordance with PPA were made, i.e. Non-life Insurance, Asset Managementand finance company services. During the financial year, Pohjola Health Ltd merged into Pohjola Insurance Ltd. Fortesting goodwill of wellbeing-at-work services, the Group no longer determine a separate CGU, which is why saidgoodwill has been tested as part of the goodwill of Non-life Insurance.
The testing period was determined to be five years under IAS 36, including residual values.
110

In the autumn of 2014, OP Financial Group Central Cooperative's Supervisory Board decided to put Non-life Insurancetogether with Banking and Wealth Management under the OP brand. The Pohjola brand will be used mainly in thehealthcare and wellbeing business and the closely related non-life products. As part of testing the Pohjola brand forimpairment, the Group assessed the effect of the abovementioned change on the useful life and the length of thetesting period, the discount rate, risk premium and royalty rate used in testing- As a result, the Group stated that thebrand is in accordance with IAS 36, an intangible asset with indefinite useful life. Because the brand will be used in thenew business that is expected to grow strongly in the initial stage, the testing period was extended to 15 years. TheGroup did not make any major changes in parameters because the new healthcare and wellbeing business is closelyrelated to Non-life Insurance. In the testing of the brand, the Group took account of the cash flows comparable with thenet sales of the businesses that will operate under the brand.
The value of the brands was determined by using the 'Relief from Royalty' method. Accordingly, their value wasdetermined to be royalty savings accrued in the future from owning the brands, discounted to the present. The discountrate used in the calculations was the market-based equity cost defined for Non-life Insurance, plus an asset-specificrisk premium. Pohjola decreased the discount rate for Non-life Insurance by 0.9 percentage points to correspond to thediscount rate based on market information. In addition, the same risk premium and the corresponding royaltypercentages were applied in 2014 as in the PPA procedure and in previous years’ tests.
Pohjola Group's brands originate entirely from the acquisition of Pohjola Group plc's business operations. Impairmenttesting was carried out separately for the Pohjola, Eurooppalainen, A-Vakuutus (A-Insurance) and Seesam brands, inaccordance with IAS 36.
Impairment testing of brands
As a result of testing brands for any impairment, Pohjola did not recognise any impairment loss on brands in itsfinancial statements 2014. An impairment loss of EUR 1 million related to the Seesam brand was recognised in the2011 and EUR 3 million in the 2009 and 2008 financial statements.
Impairment testing of other essential intangible assetsPohjola Group's customer relationships and a significant part of computer software were acquired as part of theacquisition of the business operations of Pohjola Group plc. Intangible assets originating from customer relationshipsare charged to expenses using straight-line amortisation over their estimated economic lives, and no indications of theneed for their impairment recognition have been discovered. Intangible assets originating from computer software usedby Non-life Insurance and Asset Management were charged to expenses in full in prior financial years.
The testing period of brands was mainly determined to be five years under IAS 36. The testing period of the Pohjolabrand was determined to be an exceptional period of 15 years because the use of the brand will be extended to cover acompletely new business that will grow in the next few years. The forecasts used in cash flow statements are based onstrategy figures for 2015-17 updated for Non-life Insurance and post-strategy-period expectations derived from themregarding the business line's future developments. A 2% inflationary expectation was used as growth in cash flows forpost-forecast periods.
The discount rate, growth rate (%) of the loan portfolio and a growth rate (%) of expenses were used as keyparameters in Leasing and Factoring Service's sensitivity analysis. The parameters used were the same as in theprevious year. The results of the sensitivity analysis did not change significantly on a year earlier. A 11-percentagepoint increase in the discount rate, a 16-percentage point decrease in the loan portfolio and a 23-percentage pointincrease in expenses compared with forecasts throughout the testing period, with other parameters remainingunchanged, would entail an impairment risk. In 2013, the results were as follows: a 7.5-percentage point increase in thediscount rate, a 9.7-percentage point decrease in the loan portfolio and a 10-percentage point increase in expensescompared with forecasts throughout the testing period would have entailed an impairment risk.
111

EUR million 31 Dec. 2014 31 Dec. 2013*
Property in own useLand and water areas 6 6Buildings 43 42Total 49 48
Machinery and equipment 3 4Other tangible assets 3 3Leased-out assets 17 27Total property, plant and equipment 72 82
of which construction in progress 0 0
* Comparative figures have been restated as a result of the adoption of IFRS 10 Consolidated Financial Statements.
Property inown use
Machineryand
equipment
Othertangible
assetsLeased-
out assets Total PPE
Acquisition cost 1 Jan. 2014 58 39 3 51 151Increases 3 0 1 2 6Decreases -1 -1 -1 -17 -19Transfers to assets distributed to owners -1Transfers between items 0 0
Acquisition cost 31 Dec. 2014 60 37 3 36 137
-10 -35 0 -24 -69Depreciation during the financial year -1 -1 0 -8 -10Impairments for the financial year 0 0Reversals of impairments for the financial year 0 0Decreases 0 0 0 12 13Depreciation on assets distributed to owners 1Other changes 0 0 0
-10 -34 0 -20 -66Carrying amount 31 Dec. 2014 49 3 3 17 72
Accumulated depreciation and impairments 31 Dec.2014
Accumulated depreciation and impairments 1 Jan.2014
Note 26. Property, plant and equipment
Changes in property, plant and equipment (PPE),EUR million
112

Property inown use
Machineryand
equipment
Othertangible
assetsLeased-
out assets Total PPE
Acquisition cost 1 Jan. 2013* 28 38 3 68 137Increases 13 1 0 8 22Decreases -3 0 0 -25 -29Transfers between items 20 20
Acquisition cost 31 Dec. 2013* 58 39 3 51 151
-8 -34 0 -28 -70Depreciation during the financial year -2 -1 0 -11 -14Impairments for the financial year -2 -2Reversals of impairments for the financial year 0 0Decreases 2 0 0 15 18Other changes 0 0
-10 -35 0 -24 -69Carrying amount 31 Dec. 2013* 48 4 3 27 82
* Comparative figures have been restated as a result of the adoption of IFRS 10 Consolidated Financial Statements.
EUR million 31 Dec. 2014 31 Dec. 2013*
Payment transfer receivables 7 35Pension assets 0 5Accrued income and prepaid expenses
Interest 642 711Other accrued income and prepaid expenses 9
Margin receivables related to derivative contracts 104 54Other 1,036 554Total 1,789 1,369
* Comparative figures have been restated as a result of the adoption of IFRS 10 Consolidated Financial Statements.
The item Other includes eg EUR 29 million (70) in accounts receivable from securities and EUR 862 million (408) inCSA collateral receivables.
Depreciation, impairment losses and their reversals are charged to Other operating expenses.
Changes in property, plant and equipment (PPE),EUR million
Accumulated depreciation and impairments 31 Dec.2013*
Note 27. Other assets
A breakdown of PPE leased out under operating lease can be found in Note 81.
Pohjola Group primarily offers passenger cars through operating leases. The Group has leased out office facilities itdoes not need and such facilities are classified as investment property in the financial statements.
Accumulated depreciation and impairments 1 Jan.2013*
113

EUR million 31 Dec. 2014 31 Dec. 2013*
Income tax assets 10 2Deferred tax assets 24 14Total tax assets 34 15
Breakdown of tax assets and liabilities, EUR million 31 Dec. 2014 31 Dec. 2013*
Deferred tax assetsDue to available-for-sale financial assets 0 0Due to depreciation and impairment losses 0 1Due to provisions and impairment losses on receivables 9 3Due to timing difference of securities issued to the public 13 18Due to defined-benefit pension plans 12 3Due to consolidation of Group accounts 0 1Due to other items 6 3Set-off against deferred tax liabilities -18 -16Total 24 14
Deferred tax liabilitiesDue to appropriations 208 212Due to available-for-sale financial assets 54 37Due to cash flow hedging 4 3Due to elimination of equalisation provision 43 50Due to fair value measurement of investment 7 13Due to allocation of sale price of business combinations 49 54Due to defined benefit pension plans 0 1Due to consolidation of Group accounts 0Due to other items 6 6Set-off against deferred tax assets -18 -16Total 354 360
Note 28. Tax assets
114

Changes in deferred taxes, EUR million 31 Dec. 2014 31 Dec. 2013*
Deferred tax assets/liabilities 1 Jan. -347 -397Effect of changes in accounting policies 1 -1
Deferred tax assets/liabilities 1 Jan. -346 -398Recognised on the income statement
Effect of losses 0Provisions and impairments on receivables 10 -1Appropriations 0 -22Elimination of equalisation provision 7 6Fair value changes in and sale of investments 3 -4Depreciation/amortisation and impairments 4 7Timing difference of securities issued to the public -5 -4Defined benefit pension plans 1 1Change in tax rate 1 Jan. 2014 65Other 2 -8
Recognised in statement of comprehensive incomeFair value reserve
Fair value measurement -30 -10Cash flow hedges -1 4Transfers to the income statement 16 10Change in tax rate 1 Jan. 2014 9
Actuarial gains/losses on post-employment benefit obligations 10 0Change in tax rate 1 Jan. 2014 -2
Other 1Total deferred tax assets/liabilities 31 Dec. -330 -347Income tax assets/liabilities -27 -16Total tax assets/liabilities -357 -362
* Comparative figures have been restated as a result of the adoption of IFRS 10 Consolidated Financial Statements.
Tax losses for which a deferred tax asset was not recognised came to EUR 1 million (7) at the end of 2014. The losseswill expire before 2024.
A deferred tax liability has not been recognised for the EUR 38 million (31) of undistributed profits of the Balticsubsidiaries, since the assets have been permanently invested in these countries.
115

EUR million 31 Dec. 2014 31 Dec. 2013
Liabilities to central banks* 250 73Liabilities to credit institutions
Repayable on demandDeposits
With OP Financial Group institutions 350 233With other credit institutions 54 130
Other liabilitiesWith OP Financial Group institutions 494 361
Total 898 725Other than repayable on demand
DepositsWith OP Financial Group institutions 2,822 3,270With other credit institutions 1,271 722
Total 4,094 3,992Total liabilities to credit institutions and central banks 5,241 4,789
EUR million 31 Dec. 2014 31 Dec. 2013
Financial liabilities held for tradingShort selling of securities 4 4
Total financial liabilities at fair value through profit or loss 4 4
Note 30. Financial liabilities at fair value through profit or loss
* Deposits from non-euro-area central banks
Note 29. Liabilities to credit institutions
116

EUR million 31 Dec. 2014 31 Dec. 2013
Held for tradingInterest rate derivatives 4,752 2,910Currency derivatives 686 193Equity and index derivatives 25 32Other 52 52Total 5,516 3,186
Hedging derivative contractsFair value hedging
Interest rate derivatives 373 220Currency derivatives 13
Cash flow hedgeInterest rate derivatives 0 1Total 373 234
Total derivative contracts 5,889 3,420
EUR million 31 Dec. 2014 31 Dec. 2013*
DepositsRepayable on demand
Private 63 34Companies and public sector entities 7,437 5,800Total 7,500 5,834
OtherPrivate 0Companies and public sector entities 1,680 1,665Total 1,680 1,665
Other financial liabilitiesRepayable on demand
Private 8 10Total 8 10
OtherCompanies and public sector entities 2,254 2,674Total 2,254 2,674
Total liabilities to customers 11,442 10,183
* Comparative figures have been restated as a result of the adoption of IFRS 10 Consolidated Financial Statements.
Note 31. Derivative contracts
The derivative contracts balance-sheet item includes negative changes in fair value and premiums received.
Note 32. Liabilities to customers
117

EUR million
Insurance liabilities 2,737 2,593Direct insurance liabilities 203 134Reinsurance liabilities 9 9Derivative contracts 2 0Other 21 10Total Non-life Insurance liabilities 2,972 2,746
Non-life Insurance contract liabilities and reinsurers’ share
EUR million Gross Net Gross Net
Provision for unpaid claims for annuities 1,316 -7 1,308 1,253 -4 1,249Other provisions by case 188 -65 124 160 -55 105Special provision for occupational diseases 22 22 25 25Collective liability (IBNR) 612 -7 605 603 -6 597Reserved loss adjustment expenses 63 63 60 60Provision for unearned premiums 523 -13 511 493 -12 481Interest rate hedge for insurance liabilities 12 12Total Non-life Insurance insurance liabilities 2,737 -92 2,645 2,593 -77 2,517
EUR million Gross Net Gross Net
Provision for unpaid claimsProvision for unpaid claims 1 Jan. 2,100 -65 2,035 1,993 -62 1,932Claims paid in financial year -913 29 -884 -866 39 -827Change in liability/receivable 974 -44 930 931 -42 889
Current period claims 931 -34 897 908 -46 862Increase (decrease) from previous financial years -16 -10 -27 -14 4 -10Change in discount rate 60 60 38 38
Unwinding of discount 40 40 42 42Value change in interest rate hedges 12 12Foreign exchange gains (losses) 0 0 0 -1 -1Provision for unpaid claims 31 Dec. 2,213 -79 2,134 2,100 -65 2,035
Provision for unearned premiumsProvision for unearned premiums 1 Jan. 493 -12 481 455 -15 440Increase 483 -13 470 451 -9 442Decrease -456 12 -444 -415 12 -404Change in discount rate 2 2 1 1Unwinding of discount 1 1 1 1Provision for unearned premiums 31 Dec. 523 -13 511 493 -12 481Total Non-life Insurance insurance liabilities 2,737 -92 2,645 2,593 -77 2,516
Reinsurers'share
Reinsurers'share
31 Dec. 2014 31 Dec. 2013
31 Dec. 2013
Note 33. Non-life insurance liabilities
31 Dec. 2014
The provision for unearned premiums represents obligations relating to insurance cover which has not yet expired atthe year-end.
Changes in insurance liabilities arising from insurance contracts and in receivables arising from reinsurancecontracts
Reinsurance Reinsurance
2014 2013
118

The provision for unpaid claims includes asbestos liabilities which arise from occupational diseases coverable understatutory workers' compensation insurance. The forecasted cash flow of these claims is based on an analysis whichtakes account of to what extent asbestos was used annually as raw material in Finland and how the latency periods ofdifferent asbestos diseases are distributed. Trends in asbestos-related claims are monitored annually and the outcomehas corresponded well to the forecast.
Determining collective liability is based on different statistical methods: Bornhuetter-Ferguson, Cape Cod and ChainLadder. When applying these methods, other selections must also be made, in addition to the selection of the method,such as deciding on how many occurrence years' statistics the methods will be applied.
When estimating the collective liability for medical expenses and rehabilitation expenses benefits in statutory workers'compensation and motor liability insurance, the Group has taken account of the fact claims paid for losses occurredmore than 10 years ago are financed through the pay-as-you-go system.
The Bornhuetter-Ferguson (BF) method is based on the assumption that, in each development year, a certain portionof claims is paid of the measure of exposure of the occurrence year. This measure of exposure can, for instance, bethe number of policy years or insurance premium revenue adjusted by the loss ratio assumption. BF reacts slowly tochanges in the development triangle of claims. In addition, BF is sensitive to the selection of the measure of exposure.
Cape CodThe Cape Cod method corresponds to the BF method in such a way that the portion of claims paid out in adevelopment year relative to the measure of exposure is evened out between the occurrence years. In the traditionalCape Cod method, the claims’ proportion of the measure of exposure is the same evened constant for all occurrenceyears. In the generalised Cape Cod method, the claims’ proportion of the measure of exposure for the year ofoccurrence is evened out on the basis of the observations made in the occurrence year and close to the occurrenceyear.
Chain LadderIn the Chain Ladder (CL) method, the total claims expenditure for each occurrence year is determined by annualdevelopment factors. A development factor describes the relation between the successive development years in thecumulative claims development triangle. CL is sensitive to the observations in the first development years.
In the valuation of collective liability, the largest risks relate to
- Estimating the future rate of inflation (excl. indemnities for loss of income payable on the basis of statutory insurance)- Adjustment of changes due to changed compensation practices and legislation in the development triangle of claims(i.e. whether history provides a correct picture of the future)- Adequacy of historical information over dozens of years.
Of the collective liability, only the liability for annuities has been discounted.
For the assessment of collective liability, the Group's non-life insurance portfolio is divided into several categories byrisk and eg maturity of the cash flow applying to compensation paid. In each category, collective liability is firstcalculated using each statistical method stated above, and the method that best suits the category under review ischosen. The selection criteria used includes how well the model would have predicted developments in prior years ofoccurrence and the sensitivity of the estimate generated by the model with respect to the number of statistical yearsused. The safety margin of 2 10% is added to the expected value generated by the selected model. The safety marginis determined by the uncertainty associated with future cash flows and duration, as well as the quality of historical data.
Bornhuetter-Ferguson
Determination of insurance liabilities arising from non-life insurance contracts
a) Methods and assumptions usedThe amount of insurance liability has been estimated in such a way that it is, in reasonable probability, sufficient tocover the liabilities arising from insurance contracts. This has been performed by estimating an expected value for theinsurance liability and, after that, by determining a safety margin based on the degree of uncertainty related to theliability.
The provision for unearned premiums arising from insurance contracts has mainly been determined in accordance withthe pro rata parte temporis rule for each contract.
The provision for unpaid claims for annuities corresponds to the discounted present value of cash flow ofcompensation for loss of income payable as continuous annuity. The discount rate is determined taking account of thecurrent interest rate, security required by law and the maximum discount rate set by the authorities and expectedreasonable return on assets covering insurance liabilities. On 31 December 2014, the discount rate used was 2.5% (31Dec. 2013: 2.8%). The mortality model applied is the cohort mortality model which is based on Finnish demographicstatistics and which assumes the current trend of an increase in life expectancy to continue.
119

Effect of changes in methods and assumptions on amount of liability 2014 2013
EUR million (increase +/decrease - in liability)Change in discount rate 62 38Total 62 38
Claims triangles, gross business, EUR million
Occurrence year 2005 2006 2007 2008 2009 2010 2011 2012 2013 2014
Estimated total claims expenditure0* 540 603 638 707 666 738 784 815 903 931 7,325n+1 540 611 633 693 633 746 751 802 879n+2 535 591 627 691 640 744 752 805n+3 529 594 622 689 641 743 757n+4 532 594 622 704 651 750n+5 532 587 647 726 653n+6 529 587 657 734n+7 536 591 661n+8 536 594n+9 540Current estimate of total claims expenditure
540 594 661 734 653 750 757 805 879 931 7,304Accumulated claims paid
-516 -561 -615 -669 -576 -684 -662 -696 -704 -484Provision for unpaid claims for2005 2014 24 33 46 66 76 66 95 109 175 447
Provision for unpaid claims for previous years 155
-6,167
Total
* = at the end of the occurrence year
b) Changes in assumptionsAs a result of a reduction in the lower discount rate, the provision for unpaid claims for annuities rose by EUR 62 million(38).
c) Claims developmentThe claims triangle compares the actual claims incurred with previous estimates. The triangles describing claimsdevelopment have been drawn up by occurrence year.
With the exception of long-term liabilities, claims development for the gross business is presented over a period of tenyears. The claims triangle does not monitor the shares of pools and the trends in the rights of recourse related tostatutory workers' compensation insurance. The capital value of finalised annuities is treated as if the annuities hadbeen paid equalling the capital amount in connection with confirmation as final. For long-term liabilities, i.e. annuitiesconfirmed as final and asbestos-related claims, information on the adequacy of insurance liabilities is provided.
1,136
120

Development of claims due to latent occupational diseases, EUR million
Financial year
2005 45 39 -4 -2 1 -12006 43 40 -4 -3 -32007 41 40 -4 -2 -1 -22008 40 41 -4 -4 3 -22009 42 43 -4 -8 4 -42010 38 44 -3 0 02011 35 50 -3 -6 5 -22012 32 53 -4 -4 2 -12013 28 53 -4 -1 1 02014 22 53 -4 -2 2 0
Development of annuities confirmed as final, EUR million
Financial year
2006 681 731 77 26 12007 731 745 60 28 -15 32008 745 766 55 30 42009 763** 771 42 32 22010 771 794 60 34 32011 794 895 66 35 77 72012 895 940 66 34 31 182013 940 965 51 37 23 122014 965 1,010 54 40 36 5
Year-start Year-endNew annuity
capital Annuities paid
Changes inreserving
basis* Adequacy
Adequacy
Changes inreserving
basis*Claims
incurred
* Effect of changes in the discount rate and the mortality model on final annuity capital.
** A small amount of healthcare and senior housing provisions was eliminated from 2009 figures.
Claims paid
Knownliabilities for
annuitiesCollective
liability
121
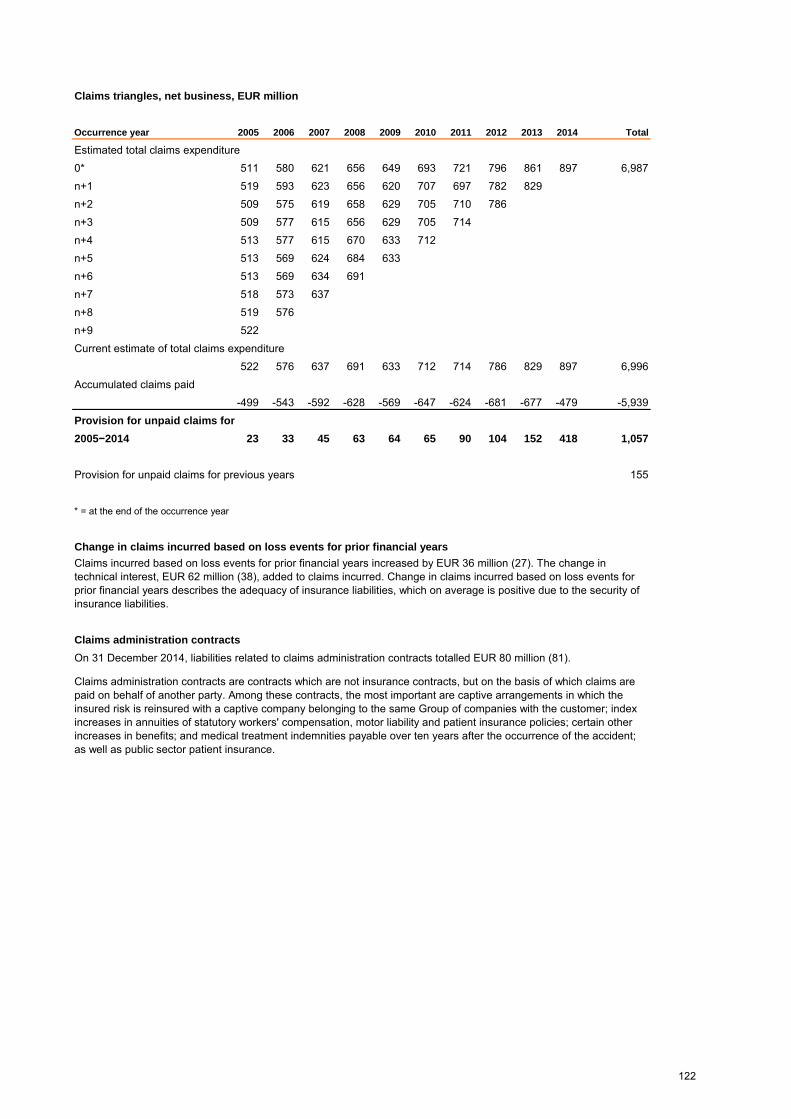
Claims triangles, net business, EUR million
Occurrence year 2005 2006 2007 2008 2009 2010 2011 2012 2013 2014
Estimated total claims expenditure0* 511 580 621 656 649 693 721 796 861 897 6,987n+1 519 593 623 656 620 707 697 782 829n+2 509 575 619 658 629 705 710 786n+3 509 577 615 656 629 705 714n+4 513 577 615 670 633 712n+5 513 569 624 684 633n+6 513 569 634 691n+7 518 573 637n+8 519 576n+9 522Current estimate of total claims expenditure
522 576 637 691 633 712 714 786 829 897 6,996Accumulated claims paid
-499 -543 -592 -628 -569 -647 -624 -681 -677 -479Provision for unpaid claims for2005 2014 23 33 45 63 64 65 90 104 152 418
Provision for unpaid claims for previous years 155
On 31 December 2014, liabilities related to claims administration contracts totalled EUR 80 million (81).
Claims administration contracts are contracts which are not insurance contracts, but on the basis of which claims arepaid on behalf of another party. Among these contracts, the most important are captive arrangements in which theinsured risk is reinsured with a captive company belonging to the same Group of companies with the customer; indexincreases in annuities of statutory workers' compensation, motor liability and patient insurance policies; certain otherincreases in benefits; and medical treatment indemnities payable over ten years after the occurrence of the accident;as well as public sector patient insurance.
* = at the end of the occurrence year
Change in claims incurred based on loss events for prior financial yearsClaims incurred based on loss events for prior financial years increased by EUR 36 million (27). The change intechnical interest, EUR 62 million (38), added to claims incurred. Change in claims incurred based on loss events forprior financial years describes the adequacy of insurance liabilities, which on average is positive due to the security ofinsurance liabilities.
Claims administration contracts
-5,939
Total
1,057
122

EUR million
Averageinterestrate, % 31 Dec. 2014
Averageinterestrate, % 31 Dec. 2013
Bonds 1.57 10,808 1.91 9,322
-195Other
Certificates of deposit 0.14 828 0.21 1,775Commercial papers 0.37 6,198 0.28 4,994Other 1.71 14 0.57 101
Included in own portfolio in trading (–)* -66 -95Total debt securities issued to the public 17,587 16,097
Long-term loans and interest rate basesNominalamount Maturity
50.0 9 Feb. 2015
49.413 March2015
750.025 March2015
220.028 June2015
50.0 7 Oct. 2015
321.0 9 Nov. 2015
10.019 Nov.2015
JPY 2,000,000,000 Term Loan Facility 13.830 Nov.2015
123.518 Dec.2015
500.012 Jan.2016
110.615 Feb.2016
145.324 June2016
Pohjola Bank plc Issue of EUR 10,000,000 2.62 per cent, Fixed RateInstruments due 19 November 2015 under the EUR 15,000,000,000Programme for the Issuance of Debt Instruments
USL3M + 0.17%
Pohjola Bank plc Issue of USD 150,000,000 Floating Rate Instrumentsdue 18 December 2015 under the EUR 15,000,000,000 Programme forthe Issuance of Debt Instruments USL3M + 0.13%
Fixed 1.706 %
Pohjola Bank plc Issue of GBP 250,000,000 Floating Rate Notes dueNovember 2015 under the EUR 15,000,000,000 Programme for theIssuance of Debt Instruments GBL3M + 0.55%
OKO Osuuspankkien Keskuspankki Oyj ("OKO BANK") Issue of NOK1,000,000,000 Fixed Rate Notes Due 15 February 2016 under the EUR8,000,000,000 Programme for the Issuance of Debt Instruments Fixed 4.185 %
Fixed 0.519%
Pohjola Bank plc Issue of EUR 500,000,000 3.125 per cent. Instrumentsdue 12 January 2016 under the EUR 15,000,000,000 Programme for theIssuance of Debt Instruments Fixed 3.125 %
Fixed 2.62 %
Pohjola Bank plc Issue of EUR 50,000,000 Floating Rate Notes due 7October 2015 under the EUR 15,000,000,000 Programme for theIssuance of Debt Instruments
Pohjola Bank plc Issue of USD 60,000,000 Floating Rate Instruments due13 March 2015 under the EUR 15,000,000,000 Programme for theIssuance of Debt Instruments
* Own bonds held by Pohjola Group have been set off against liabilities.
Note 34. Debt securities issued to the public
EUB3M
EUB3M + 0.05%
Pohjola Bank plc Issue of EUR 750,000,000 3.125 per cent. Instrumentsdue 25 March 2015 under the EUR 15,000,000,000 Programme for theIssuance of Debt Instruments
EUB3M + 0.65%
Pohjola Bank plc Issue of EUR 50,000,000 Floating Rate Instruments due9 February 2015 under the EUR 15,000,000,000 Programme for theIssuance of Debt Instruments
Interest rate
Pohjola Bank plc Issue of EUR 220,000,000 Floating Rate Instrumentsdue 28 June 2015 under the EUR 15,000,000,000 Programme for theIssuance of Debt Instruments
Fixed 3.125 %
Pohjola Bank Plc Japanese Yen Bonds JPY 21,100,000,000 - First Series(2013)
Liabilities allocated to assets for distribution toowners as part of demerger
123

34.426 Sept.2016
750.03 March2017
750.020 March2017
60.030 May2017
121.216 June2017
750.08 Sept.2017
13.828 March2018
500.014 May2018
47.526 June2018
13.826 June2018
750.029 Aug.2018
10.020 Sept.2018
20.016 Nov.2018
750.017 June2019
292.018 June2019
13.527 June2019
79.816 Sept.2019
10.019 Nov.2020
55.1 3 Dec. 2020
750.03 March2021
249.514 July2021
Pohjola Bank plc Issue of EUR 750,000,000 Floating Rate Instrumentsdue 3 March 2017 under the EUR15,000,000,000 Programme for the Issuance of Debt Instruments
Pohjola Bank Plc Japanese Yen Bonds JPY 6,900,000,000 - SecondSeries (2013)
Pohjola Bank Plc Japanese Yen Floating Rate Bonds JPY 2,000,000,000 -Second Series (2013)
Fixed 1.405 %
EUB3M + 0.39%
Pohjola Bank plc Issue of EUR 10,000,000 1.965 per cent. Instrumentsdue 19 November 2020 under the EUR 15,000,000,000 Programme forthe Issuance of Debt Instruments
Fixed 1.25%
Pohjola Bank plc Issue of CHF 300,000,000 1.000 per cent. Instrumentsdue 14 July 2021 under the EUR 15,000,000,000 Programme for theIssuance of Debt Instruments
Pohjola Bank plc Issue of EUR 500,000,000 1.25 per cent. Instrumentsdue 14 May 2018 under the EUR 15,000,000,000 Programme for theIssuance of Debt Instruments
Fixed 1.965 %
Pohjola Bank plc Issue of EUR 750,000,000 1.750 per cent. Instrumentsdue 29 August 2018 under the EUR 15,000,000,000 Programme for theIssuance of Debt Instruments Fixed 1.750%
Fixed 2.000%
Pohjola Bank plc Issue of EUR 10,000,000 Floating Rate Instruments due20 September 2018 under the EUR 15,000,000,0000 Programme for theIssuance of Debt Instruments
EUB3M + 0.35%
Fixed 2.000 %
Pohjola Bank plc Issue of EUR 750,000,000 2.625 per cent. Instrumentsdue 20 March 2017 under the EUR 15,000,000,000 Programme for theIssuance of Debt Instruments Fixed 2.625 %
Pohjola Bank Plc Japanese Yen Bonds JPY 17,600,000,000 - ThirdSeries (2014)
Pohjola Bank plc Issue of JPY 8,000,000,000 Fixed Rate Instruments dueDecember 2020 under the EUR 15,000,000,000 Programme for theIssuance of Debt Instruments
Pohjola Bank plc Issue of EUR 750,000,000 3.00 per cent. Instrumentsdue 8 September 2017 under the EUR 15,000,000,000 Programme for theIssuance of Debt Instruments
Pohjola Bank Plc Japanese Yen Bonds JPY 42,400,000,000 - FourthSeries (2014) Fixed 0.434%
Pohjola Bank plc Issue of EUR 20,000,000 1.50 per cent. Fixed RateNotes due 16 November 2018 under the EUR 15,000,000,000 Programmefor the Issuance of Debt Instruments Fixed 1.50%Pohjola Bank plc Issue of EUR 750,000,000 1.125 per cent. Instrumentsdue 17 June 2019 under the EUR 15,000,000,000 Programme for theIssuance of Debt Instruments Fixed 1.125%
JPL3M + 0.20%
Pohjola Bank plc Issue of EUR 60,000,000 Floating Rate Instruments due30 May 2017 under the EUR 15,000,000,000 Programme for the Issuanceof Debt Instruments
Pohjola Bank plc Issue of EUR 750,000,000 2 per cent. Instruments due 3March 2021 under the EUR 15,000,000,000 Programme for the Issuanceof Debt Instruments
Fixed 0.835 %
Fixed 3.00 %
JPL3M + 0.27%
Pohjola Bank plc Issue of JPY 5,000,000,000 Fixed Rate Instrumentsunder the EUR 15,000,000,000 Programme for the Issuance of DebtInstruments
Fixed 0.698%
Fixed 0.303%
Pohjola Bank plc Issue of AUD 20,000,000 3.925 per cent Fixed RateNotes due 27 June 2019 under the EUR 15,000,000,000 Programme forthe Issuance of Debt Instruments Fixed 3.925 %
EUB3M + 0.90%
Pohjola Bank plc Issue of JPY 2,000,000,000 Floating Rate Instrumentsdue 28 March 2018 under the EUR 15,000,000,000 Programme for theIssuance of Debt Instruments
Pohjola Bank plc Issue of SEK 750,000,000 Floating Rate Note dueSeptember 2019 under the EUR 15,000,000,000 Programme for theIssuance of Debt Instruments SES3M+0.52%
124

60.01 March2022
50.023 Aug.2027
22.127 May2029
30.021 March2034
30.031 March2034
40.011 Apr.2034
Fixed 3.800%
Fixed 3.068 %
Fixed 3.086 %
The interest rate is the rate according to the issue currency. The euro equivalents are calculated using the averagerate of the European Central Bank on the balance sheet date. The nominal amount of structured bonds issued byPohjola Bank plc was EUR 1,303 million (1,448). The bonds' interest rate is determined on the basis of interest, equity,equity index or similar underlying instruments. Any possible additional return on the bonds to the investor is hedgedusing a corresponding derivative structure.
Fixed 3.015 %
Fixed 3.000 %
Pohjola Bank plc Issue of EUR 40,000,000 Fixed Rate Notes due 2034under the EUR 15,000,000,000 Programme for the Issuance of DebtInstruments
Pohjola Bank plc Issue of EUR 60,000,000 3.75 per cent. Instruments due1 March 2022 under the EUR 15,000,000,000 Programme for theIssuance of Debt Instruments
Pohjola Bank plc Issue of EUR 50,000,000 3.086 per cent. Instrumentsdue 23 August 2027 under the EUR 15,000,000,000 Programme for theIssuance of Debt Instruments
Pohjola Bank plc Issue of NOK 200,000,000 3.80 per cent. Instrumentsdue 27 May 2029 under the €15,000,000,000 Programme for DebtInstruments
Pohjola Bank plc Issue of EUR 30,000,000 3.068 per cent. Instrumentsdue 21 March 2034 under the EUR 15,000,000,000 Programme for theIssuance of Debt Instruments
Pohjola Bank plc Issue of EUR 30,000,000 Fixed Rate Notes due 2034under the EUR 15,000,000,000 Programme for the Issuance of DebtInstruments
Fixed 3.75 %
125

EUR million 31 Dec. 2014 31 Dec. 2013*
Provisions 0 1Other liabilities
Payment transfer liabilities 819 869Accrued expenses
Interest payable 665 712Other accrued expenses 56 64
Pension liabilities 68 20Margin liabilities related to derivative contracts 0 0Other 870 408
Total provisions and other liabilities 2,479 2,076
* Comparative figures have been restated as a result of the adoption of IFRS 10 Consolidated Financial Statements.
Changes in provisionsEUR million Total
1 Jan. 2014 1 1Provisions used -1 -131 Dec. 2014 0 0
Changes in provisionsEUR million Total
1 Jan. 2013 7 7Provisions used -7 -731 Dec. 2013 1 1
Pohjola Group has funded assets of its pension schemes through OP Bank Group Pension Fund, OP Bank GroupPension Foundation and insurance companies. Schemes related to supplementary pensions in the PensionFoundation and insurance company, as well as the TyEL (Employees’ Pensions Act) funded old-age and disabilitypension schemes managed by the Pension Fund are treated as defined benefit plans. Contributions to the TyEL pay-as-you-go system are treated as defined contribution plans. The amount of the Group’s pension liabilities is notsubstantial.
The item Other under Other liabilities includes EUR 29 million (15) in accounts payable on securities and EUR 722million (359) in CSA collateral liabilities.
Note 35. Provisions and other liabilities
Reorganisation
Reorganisation
Defined benefit pension plans
Reorganisation
The reorganisation provision derives from expenses arising from personnel reduction. This provision was mainlyrealised during 2013.
126

OP Bank Group Pension Fund manages statutory pension insurance for the employees of Pohjola Group employers asthe Fund’s members.
The statutory pension scheme under TyEL (Employees Pensions Act) provides pension benefits based on the years ofemployment and earnings as prescribed in the Act. Benefits under the employees pension scheme comprise old-agepension, part-time pension, disability pension, survivor’s pension and rehabilitation benefits. The retirement age of theold-age pension under TyEL is 63–68 years.
The TyEL pension scheme is based on a system that is partly a funded system and partly a pay-as-you go system. Apension insurance institution, which has insured each employment, manages funding for each employee. The fundedportion of the pension benefits disbursed annually by the Pension Fund accounts for an average of a quarter.
The most significant actuarial risks of OP Bank Group Pension Fund are associated with interest rate and market risks,future increases in pension benefits and systematically increasing life expectancy. A change in the discount rate forpension liabilities has a substantial effect on the amount of pension liabilities.
The most significant associated risk relates to the possibility of the actual return on investment assets being lower thanthe target set for the minimum return. If such a risk materialises in several consecutive years, this would result incharging contributions.
OP-Bank Group Pension Foundation manages supplementary pension cover for employees provided by the employerswithin Pohjola Group. The purpose of the Pension Foundation is to grant old-age and disability pension benefits andsickness benefits to employees covered by the Pension Foundation activities, and survivors’ pension benefits to theirbeneficiaries, and burial grant. In addition, the Pension Foundation may grant said employees benefits related torehabilitation. Given that providing supplementary pension is voluntary, not all employers belonging to the PensionFund belong automatically to the Pension Foundation. Supplementary pension cover provided by the PensionFoundation is fully funded.
OP Bank Group Pension Foundation
The Pension Fund aims to manage statutory pension insurance in such a way that the level of contributions will remainsteady year after year and be below the average contribution level of the employees pension scheme. The mostsignificant associated risk relates to the possibility of the actual return on investment assets being lower than the actualaverage investment return under the pension scheme. If such a risk materialises in several consecutive years, thiswould result in increasing the level of insurance contributions.
The Pension Foundation covers every employee who has reached the age of 20 years and who has been employed,as specified by TyEL, for two consecutive years by the employer within the Pension Foundation and whoseemployment has begun before 1 July 1991. The salary/wage serving as the basis for the calculation of pension refersto pensionable pay based on one and the same employment and calculated under the Finnish Employees’ PensionsAct, TEL, in force until 31 December 2006. The retirement age of those covered by the Pension Foundation varies from60 to 65 years, depending on the personnel group to which the employee belongs under the Pension Foundation rules.
OP Bank Group Pension Fund
Under the Employee Benefit Funds Act, the Pension Fund shall invest its assets securely and profitably and in view ofits liquidity. The Pension Fund must cover the insurance liability arising from pension obligations. When covering theinsurance liability, the Pension Fund must consider what type of insurance business it conducts and, accordingly, mustensure the security of, return on and cashability of its assets and that they are appropriately versatile and properlydiversified. The Employee Benefit Funds Act specifies in greater detail the assets and commitments with which theinsurance liability must cover. As prescribed by law, the Pension Fund has a specific solvency limit which is must coverthrough its solvency capital.
Responsible for investment, the Board of Trustees of the Pension Fund approves the Pension Fund’s investment planrelated to its assets. A pension institution’s chief actuary prepares annually a forecast for developments in insuranceliabilities and pension costs. On this basis, investment asset allocation takes account of the requirements set by thenature of insurance liabilities for investment operations with respect to the level of security, productivity and liquidity, aswell as the Pension Fund’s risk-bearing capacity.
127

2014 2013 2014 2013 2014 2013
186 184 -171 -172 15 12
4 5 4 56 6 -6 -6 0 0
0 -4 4 00 0 0 0
10 8 -6 -2 4 6
64 2 64 2
1 1 -1 -112 -3 12 -3
-26 0 -26 077 0 -27 -1 50 0
-1 -2 -1 -2-6 -5 6 5-6 -5 5 3 -1 -2
267 186 -199 -171 68 15
Balance sheet value of defined benefitplans, EUR million
Opening balance 1 Jan.
Defined benefit pension costsrecognised
Responsible for investment, the Board of Trustees of the Pension Foundation approves the Foundation's investmentplan related to its assets. A pension institution’s chief actuary prepares annually a forecast for developments ininsurance liabilities and pension costs. On this basis, investment asset allocation takes account of the requirements setby the nature of insurance liabilities for investment operations with respect to the level of security, productivity andliquidity, as well as the Pension Foundation’s risk-bearing capacity.
Defined benefitobligations
Fair value of pensionassets
Return on plan assets, excludingamount (–) of netdefined benefit liability (asset)
Closing balance 31 Dec.
Net liabilities (assets)
Effect of plan curtailment or fulfilmentof obligation
Actuarial losses (gains) arising fromchanges in economic expectations
Experience adjustments
Current service cost
Administrative expenses
Losses (gains) recognised in othercomprehensiveincome arising from remeasurement
Total
Total
Other
Total
Employer contributionsBenefits paid
The most significant actuarial risks of OP Bank Group Pension Foundation are associated with interest rate and marketrisks, systematically increasing life expectancy and inflation risk. A change in the discount rate for pension liabilities hasa substantial effect on the amount of pension liabilities.
Interest expense (income)
Actuarial losses (gains) arising fromchanges in demographic expectationsReturn on TyEL interest rate differenceand growth in old-age pensionliabilities (net)
128

31 Dec. 2014 31 Dec. 2013
Net liabilities/assets (Pension Foundation) 3 -5Net liabilities/assets (Pension Fund) 46 5Net liabilities/assets (Other pension plans) 20 15Total net liabilities/assets* 68 15
Level 1 Level 2 Level 3 Total
Shares and participations 4 2 4 10Notes and bonds 17 28 1 46Real property 14 14Mutual funds 59 32 90Structured investment vehicles 1 1Derivatives 0 0Other assets 11 1 12Total 91 31 52 173
Level 1 Level 2 Level 3 Total
Shares and participations 9 0 6 16Notes and bonds 18 26 1 45Real property 16 16Mutual funds 48 3 29 80Structured investment vehicles 1 1Derivatives 0 0 0Other assets 7 1 7Total 82 30 53 166
The fair value of Level 1 assets is determined on the basis of the quotes in markets.
The fair value of Level 2 assets means value derived from the market price of a financial instrument's components orsimilar financial instruments; or value which can be determined using commonly used valuation models and techniquesif the inputs significant to the fair value measurement are based on observable market data.
Pension Fund and Pension Foundation assets, grouped by valuationtechnique, 31 Dec. 2013, EUR million
The fair value Level 3 assets is determined using a pricing model whose input parameters involve uncertainty.
Liabilities and assets recognised in the balance sheet,EUR million
Pension Fund and Pension Foundation assets, grouped by valuationtechnique, 31 Dec. 2014, EUR million
*) The figures include EUR 42 thousand (78) in defined benefit pension costs of the portion of Pohjola AssetManagement as discontinued operations, EUR 183 thousand (-147) in losses (profits) arising from the remeasurementthat were recognised in other comprehensive income and EUR 596 thousand (382) in pension liabilities recognised inthe balance sheet.
129

31 Dec. 2014 31 Dec. 2013
Shares and participations 6 10Financial sector 5Forest 3 3Real estate 0 1Other 3 1
Notes and bonds 26 27Government bonds 1 6Other 25 21
Real property 8 10Mutual funds 52 48
Equity funds 33 27Bond funds 8 11Real estate funds 5 6
Hedge funds 7 5Derivatives 0 0
Interest rate derivatives 0 0Currency derivatives 0 0Other 0 0
Structured investment vehicles 1 1Other 7 4Total 100 100
Pension plan assets include, EUR million 31 Dec. 2014 31 Dec. 2013
Pohjola Bank plc shares 9Securities issued by OP Financial Group companies 3 2Other receivables from OP Financial Group companies 15 6Real property in Pohjola Group’s use 1 2Total 19 18
Contributions payable under the defined benefit pension plan in 2015 are estimated at EUR 3 million.
Proportion of the most significant assets of total fair value of plan assets, %
The duration of the defined benefit pension obligation in the Pension Fund on 31 December 2014 was 24.3 years andin the Pension Foundation 15.3 years.
130

Key actuarial assumptions used, 31 Dec. 2014Pension
FundPension
Foundation Other
Discount rate, % 2.0 1.8 1.9Future pay increase assumption, % 2.5 2.5 2.5Future pension increases, % 2.1 2.0 2.0 2.1Turnover rate, % 3.0 0.5Inflation rate, % 2.0 2.0 2.0Life expectancy for 65-year old people
Men 19.0 19.0 19.0Women 24.7 24.7 24.7
Life expectancy for 45-year old people after 20 yearsMen 20.6 20.6 20.6Women 26.4 26.4 26.4
Key actuarial assumptions used, 31 Dec. 2013Pension
FundPension
Foundation Other
Discount rate, % 3.5 3.4 3.3Future pay increase assumption, % 3.0 3.0 3.0Future pension increases, % 2.1 2.0 2.0 2.1Turnover rate, % 3.0 0.5 0.0Inflation rate, % 2.0 2.0 2.0Life expectancy for 65-year old people
Men 19.0 19.0 19.0Women 24.7 24.7 24.7
Life expectancy for 45-year old people after 20 yearsMen 20.6 20.6 20.6Women 26.4 26.4 26.4
EUR million % EUR million %
Discount rate0.5 pp increase -17 -10.3 -4 -6.80.5 pp decrease 20 12.2 4 7.7
Pension increases0.5 pp increase 19 11.4 4 6.90.5 pp decrease -17 -10.3 -4 -6.4
Mortality1-year increase in life expectancy 7 3.9 2 3.01-year decrease in life expectancy -6 -3.8 -2 -2.9
Change in defined benefit pension obligation
Sensitivity analysis of key actuarial assumptions, 31 Dec. 2014
Pension Fund Pension Foundation
131
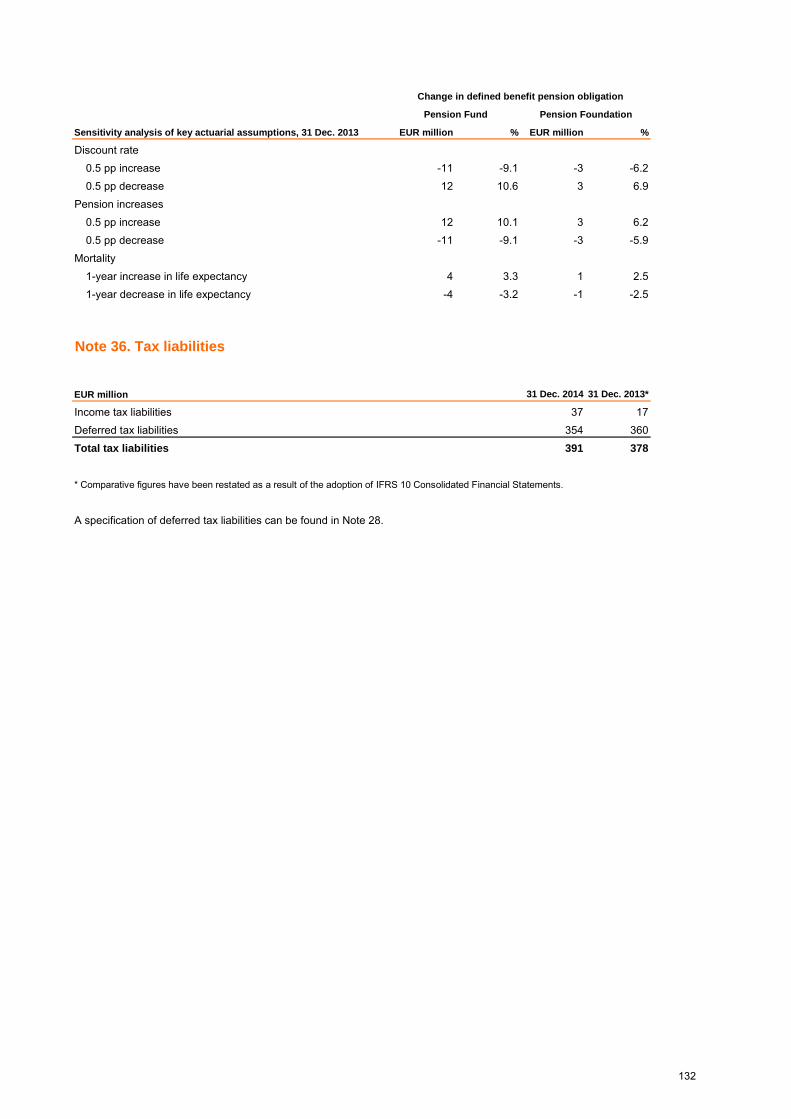
EUR million % EUR million %
Discount rate0.5 pp increase -11 -9.1 -3 -6.20.5 pp decrease 12 10.6 3 6.9
Pension increases0.5 pp increase 12 10.1 3 6.20.5 pp decrease -11 -9.1 -3 -5.9
Mortality1-year increase in life expectancy 4 3.3 1 2.51-year decrease in life expectancy -4 -3.2 -1 -2.5
EUR million 31 Dec. 2014 31 Dec. 2013*
Income tax liabilities 37 17Deferred tax liabilities 354 360Total tax liabilities 391 378
* Comparative figures have been restated as a result of the adoption of IFRS 10 Consolidated Financial Statements.
Change in defined benefit pension obligation
Sensitivity analysis of key actuarial assumptions, 31 Dec. 2013
Note 36. Tax liabilities
A specification of deferred tax liabilities can be found in Note 28.
Pension Fund Pension Foundation
132

Averageinterestrate, %
31 Dec. 2014,EUR million
Averageinterestrate, %
31 Dec. 2013,EUR million
Subordinated loans 2.55 315 2.75 303Other
Debentures 5.39 769 5.39 681Total subordinated liabilities 1,084 984
This perpetual bond carries a variable interest rate based on 3-month Euribor + 0.65% payable quarterly on 28February, 30 May, 30 August and 30 November. If interest cannot be paid for a given interest period, the obligation topay interest for the period in question will lapse. It is possible to call in the loan at the earliest on 30 November 2015,subject to authorisation by the Financial Supervisory Authority, and thereafter on the interest due dates. After 2015, theloan carries a variable interest rate based on 3-month Euribor +1.65% (step up). The entire loan principal must berepaid in one instalment.
Note 37. Subordinated liabilities
1 Subordinated loan of 10 billion Japanese yen (equivalent of EUR 68.9 million)
This perpetual loan carries a variable interest rate based on 3-month Euribor + 1.25% payable quarterly on 28February, 30 May, 30 August and 30 November. If interest cannot be paid for a given interest period, the obligation topay interest for the period in question will lapse. Subject to authorisation by the Financial Supervisory Authority, theloan may be called in on the due date of interest payment of 30 November 2010. The entire loan principal must berepaid in one instalment.
This is a perpetual loan without interest-rate step-ups, but with an 8% interest rate cap. The loan was issued on 31March 2005 and its interest rate for the first year was 6.5% and thereafter CMS 10 years + 0.1%.Interest payments aremade annually on 11 April. If interest cannot be paid for a given interest period, the obligation to pay interest for theperiod in question will lapse. The loan can be called in on the interest due date as of 11 April 2010 at the earliest,subject to authorisation by the Financial Supervisory Authority. The loan's entire principal must be repaid in oneinstalment.
Hybrid bonds/subordinated loansHybrid bonds included in Tier 1
This is a perpetual loan (a loan without a due date) carrying a fixed interest rate of 4.23% until 18 June 2034 andsubsequently a variable 6-month Yen Libor + 1.58% (step up). Interest will be annually payable on 18 June and 18December. If interest cannot be paid for a given interest period, the obligation to pay interest for the period in questionwill lapse. The loan can be called in at the earliest in 2014 and can be annually repaid after 2014 on the interest duedate on 18 June or 18 December. The loan's entire principal must be repaid in one instalment.
2 Subordinated loan of EUR 50 million
4 Subordinated loan of EUR 40 million
Pohjola Insurance Ltd's perpetual capital bond of EUR 50 million. Issued on 17 June 2008, the bond carries a variableinterest rate based on 3-month Euribor + 3.20%, payable on a quarterly basis. Interest which cannot be paid on theinterest payment date and interest which Pohjola Insurance Ltd could not have paid for previous interest paymentdates constitute 'Unpaid interest'. Interest will accrue on unpaid interest in accordance with the interest rate applicableto the bonds and this additional interest accrued until each interest payment date will be added to unpaid interest onthe interest payment date in question. The issuer agrees not to distribute dividends or other profit or to buy back ownshares until unpaid interest has been paid in its entirety. The bond may be called in at the earliest in 2013 and itsprincipal can be paid back only if the statutory terms and conditions are fulfilled. The bond will not be taken into accountin the capital adequacy measurement under the Act on Credit Institutions but can be fully utilised in the capitaladequacy measurement of the insurance company.
6 Pohjola Insurance Ltd's capital bond
3 Hybrid bond of EUR 60 million
Perpetual bond of EUR 50 million, issued on 17 June 2008, carries a variable interest rate based on 3-month Euribor +3.05%, payable on a quarterly basis on 17 March, 17 June, 17 September and 17 December. If interest cannot be paidfor a given interest period, the obligation to pay interest will lapse. Subject to authorisation by the Financial SupervisoryAuthority, the bond may be called in at the earliest on 17 June 2013 and thereafter on the due dates of interestpayment. The entire loan principal must be repaid in one instalment.
5 Hybrid bond of EUR 50 million
133

1
2
3
Loans 1 and 3 are included in hybrid instruments.
Pohjola Bank plc has no breaches of the terms and conditions of the loan contracts with respect to principal, interestand other conditions. The financial statements include EUR 0 million recognised for the price difference of the loans(0).
A debenture loan of EUR 100 million, which is a ten-year bullet loan, will mature on 14 September 2021. The loancarries a fixed interest rate of 5.25% p.a.
The difference between the nominal value and carrying amount is due to the fair value hedge related to interest raterisk measurement.
A debenture loan of EUR 500 million, which is a 10-year bullet loan, will mature on 28 February 2022. Under theterms and conditions of the loan, the issuer will have the opportunity for early redemption in case the principal cannotbe counted as part of the bank’s Tier 2 capital. The loan carries a fixed interest rate of 5.75% p.a.
Loans 1–3 were issued in international capital markets.
DebenturesA debenture loan of CHF 100 million (euro equivalent 83 million), which is a ten-year bullet loan, will mature on 14July 2021. The loan carries a fixed interest rate of 3.375% p.a.
134

EUR million 31 Dec. 2014 31 Dec. 2013* 1 Jan. 2013*
Capital and reserves attributable to owners of the ParentShare capital 428 428 428Reserves
Restricted reservesShare premium account 519 519 519Reserve fund 204 204 204Reserves provided for by Articles of AssociationFair value reserve
From fair value measurementNotes and bonds 102 44 50Shares and participations 112 113 97
From cash flow hedging 17 11 23Other restricted reserves 1 1 1
Non-restricted reservesReserve for Invested non-restricted equity 298 298 298Other non-restricted reserves 72 72 72
Retained earningsProfit (loss) for previous periods 1,104 933 796Profit (loss) for the period 461 426 283
Capital and reserves attributable to owners of the Parent 3,316 3,047 2,771Non-controlling interest 92 103 69Total shareholders’ equity 3,408 3,150 2,841
* Comparative figures have been restated as a result of the adoption of IFRS 10 Consolidated Financial Statements.
As a result of the completion of OP Cooperative's public voluntary bid for Pohjola Bank plc, the shares of Pohjola Bankplc were removed from the book-entry system on 28 November 2014, and Series A and K shares were combined into asingle share class. The number of shares remained unchanged, 319,551,415. The shares have no nominal value andtheir stated value (not an exact figure) is 1.34 euros per share. All of the shares issued have been paid in full.
The Board proposes to the Annual General Meeting that a dividend of EUR 0.43 be distributed per share, totalling EUR137 million.
Share capital and shares
Note 38. Shareholders’ equity
Proposed distribution of dividend
135

Fair value reserve after income tax
EUR millionNotes and
bonds
Shares,partici-
pations andmutual funds
Cash flowhedging Total
Opening balance 1 Jan. 2013 restated* 50 97 23 171
Fair value changes -12 51 -2 37
Transfers to net interest income -15 -15
Capital gains transferred to income statement -42 -42
Impairment loss transferred to income statement 3 3
Deferred tax 5 3 5 13
Closing balance 31 December 2013 44 113 11 168
*Comparative figures have been restated as a result of the adoption of IFRS 10 Consolidated Financial Statements.
Fair value reserve
The reserve fund consists of profits transferred to it during previous periods and the loan loss provisions transferred toit in 1990. The reserve fund may be used to cover losses for which the non-restricted equity is not sufficient. Thereserve fund may also be used to increase the share capital and it may be reduced in the same way as the sharecapital. Since 1 September 2006, it has no longer been possible to increase the reserve fund.
The share premium account may be lowered in compliance with the regulations governing the reduction of sharecapital and may be used to increase the share capital. The amount of the subscription price exceeding the stated valueof shares subscribed in September and November 2006, based on stock options, was entered in the share premiumaccount, because the General Meeting had made the decision on issuing stock options before the entry into force ofthe new Companies Act. Otherwise, it has no longer been possible to increase the share premium account since 1September 2006.
The share premium account was formed during the validity of regulations in force before 1 September 2006. Itemsentered in the share premium account include amounts exceeding the stated value paid for shares in a rights issue andamounts exceeding the stated value of a share and paid for share subscription based on stock options.
Available-for-sale financialassets
Share premium account
Reserve fund
The fair value reserve includes the change in the fair value of available-for-sale financial assets. Items included in thisreserve will be derecognised and recorded in the income statement when an available-for-sale financial asset isdisposed of or is subject to impairment. The reserve also includes the net fair value change of interest rate derivativesas cash flow hedges verified as effective and adjusted for deferred tax. Fair value changes are included in the incomestatement in the period when hedged cash flows affect net income.
136

EUR millionNotes and
bonds
Shares,partici-
pations andmutual funds
Cash flowhedging Total
Opening balance 1 Jan. 2014 44 113 11 168
Fair value changes 73 77 18 168
Transfers to net interest income -12 -12
Capital gains transferred to income statement -78 -78
Impairment loss transferred to income statement 0 0
Deferred tax -15 0 -1 -16
Closing balance 31 December 2014 102 112 17 231
Fair value reserve after tax is as follows:Continuing operations 231
Discontinued operations 0
Total 231
The fair value reserve before tax totalled EUR 288 million (210) and the related deferred tax liability EUR 57 million(42). On 31 December, positive mark-to-market valuations of equity instruments before tax in the fair value reservetotalled EUR 149 million (154) and negative mark-to-market valuations EUR 8 million (13). In January-December,impairment losses recognised through profit or loss in the fair value reserve totalled EUR 1 million (1), of wich equityinstruments accounted for EUR 0 million (1).
Other non-restricted reserves
Reserve for Invested non-restricted equity
These reserves consist of retained earnings based on decisions by the General Meeting.
The negative fair value reserve may recover by means of asset appreciation, capital losses and recognisedimpairments.
Available-for-sale financialassets
Retained earnings also contain untaxed reserves (voluntary provisions and accelerated depreciation) included in thestatutory financial statements of Group companies, and the equalisation provision and actuarial gains/losses ofinsurance companies, which have been recognised in retained earnings less deferred tax in the IFRS financialstatements.
These reserves consist of retained earnings based on the Articles of Association or rules which describe their purpose.
Retained earnings
Capital raised through the rights offering in 2009 was entered in the reserve for invested non-restricted equity.
Other restricted reserves
137

Exposure split by geographic region 31 Dec. 2014, EUR million
Exposure tocentral
governmentsand central
banks
Expo-sures to
creditinsti-
tutions
Exposuresto
corporatesRetail
exposuresEquity
investments*
Collate-ralised notesand bonds** Other Total
Finland 5,273 18,349 23,759 1,968 279 461 25 50,114
189 2 775 4 0 971
0 483 504 23 4 1,165 0 2,180Germany 1,569 182 32 106 4 424 2,316France 220 494 58 39 22 894 1,726
15 23 126 1 16 362 544
1,256 1,190 263 192 220**** 639 2 3,763Rest of Europe 157 57 14 5 87 320USA 194 61 81 48 385
79 37 0 1 117Asia 381 74 15 24 494Other countries 1 64 12 28 204**** 515 824Total 8,524 21,598 25,759 2,472 828 4,547 28 63,755
GIIPScountries***Other EUcountries
Note 2 covers risk management and capital adequacy management principles. Notes 40–56 present the risk exposurewithin Banking and the Group Functions, Pohjola Group's capital adequacy information is disclosed as part of OPFinancial Group's financial statements. Pohjola Group's capital base, minimum capital requirements, derivativecontracts and counterparty risk are presented in Notes 57–60 and Non-life Insurance risk exposure in Notes 61–72.
Baltic countries
Russia
The majority of Pohjola Group's country exposure is in EU countries. The exposures cover all balance-sheet and off-balance-sheet items and are based on values used in capital adequacy.
Other Nordiccountries
Geographicregion
Note 39. Pohjola Group's exposure split by geographic region and exposure class
NOTES TO RISK MANAGEMENT
** Consist of RMBS, ABS and Covered Bond investments.*** Exposures to Spain totalled EUR 148 million and to Italy EUR 142 million.
**** Consist mainly of investments in European funds in Other EU countries and Emerging Markets and Global funds in Other countries.
* Also include €160 million in bond funds.
138

Exposure split by geographic region 31 Dec. 2013, EUR million
Exposure tocentral
governmentsand central
banks
Expo-sures to
creditinsti-
tutions
Exposuresto
corporatesRetail
exposuresEquity
investments*
Collate-ralised notesand bonds** Other Total
Finland 3,334 16,446 22,085 1,935 327 493 56 44,675
214 5 627 0 846
52 534 441 7 19 1,164 8 2,225Germany 1,420 194 118 0 4 338 2,074France 101 373 78 0 25 779 1,355
26 27 17 0 17 379 466
896 1,283 303 0 305**** 514 3,301Rest of Europe 305 83 0 44 37 468USA 181 60 0 68 14 324Asia 259 57 0 52 369Other countries 1 52 61 153**** 247 515Total 6,045 19,658 23,931 1,942 1,014 3,950 78 56,619
31 Dec. 2014 31 Dec. 2013
EUR million
Impair-ment
losses
Impair-ment
losses
Loans and other receivablesLoans granted 240 257
Guarantee receivables 12 1
Total 252 259
GIIPScountries***Other EUcountries
Geographicregion
Baltic countriesOther Nordiccountries
* Also include €231 million in bond funds.
Risk exposure by Banking and the Group Functions
The classification by Statistics Finland is used in these notes, deviating partly from the classification used in the riskexposure section presented in the Report by the Board of Directors.
Note 40. Loans and receivables and cumulative impairment losses recognised onthem
** Consist of RMBS, ABS and Covered Bond investments.*** EUR 33 million of exposures to the GIIPS countries will mature in 2014. Exposures to Spain totalled EUR 157 million and to ItalyEUR 159 million.
**** Consist mainly of investments in European funds in Other EU countries and Emerging Markets and Global funds in Other countries.
139

31 Dec. 2014, EUR million
Balancesheetvalue
Impair-ments
Accruedinterest
Balancesheetvalue
Impair-ments
Accruedinterest
AssetsReceivables from credit institutions 9,638 10 618 4
Receivables from customers 13,107 238 41 1,244 14 1
Finance leases 1,136 26
Notes and bonds 1,210 17 7,076 68
Other 114 879
Total 25,205 238 68 9,843 14 73Off-balance-sheet commitmentsUnused standby credit facilities 3,822 543
Guarantees and letters of credit 2,139 610
Derivative contracts 1,230 5,138
Other 87 249
Total 7,278 6,540Total exposure 32,484 238 68 16,383 14 73
31 Dec. 2013, EUR million*
Balancesheetvalue
Impair-ments
Accruedinterest
Balancesheetvalue
Impair-ments
Accruedinterest
AssetsReceivables from credit institutions 9,074 10 824 4
Receivables from customers 12,420 240 33 943 19 1
Finance leases 1,129 19
Notes and bonds 1,408 22 6,345 63
Other 111 366
Total 24,143 240 65 8,497 19 68Off-balance-sheet commitmentsUnused standby credit facilities 4,501 227
Guarantees and letters of credit 2,112 617
Derivative contracts 858 2,636
Other 114 246
Total 7,585 3,725Total exposure 31,728 240 65 12,221 19 68
* Comparative figures have been restated as a result of the adoption of IFRS 10 Consolidated Financial Statements.
Note 41. Exposure
The tables show the recognised positive market value of derivative contracts.
Finland Other countries
Other countriesFinland
140

31 Dec. 2014, EUR million Finnish Foreign Finnish Foreign
Non-banking corporate sector 12,595 1,191 6,241 697 20,723
Financial institutions and insurance companies 10,924 5,492 264 5,675 22,354
Households 1,202 22 247 0 1,471
Non-profit organisations 176 210 8 394
Public sector entities 378 3,003 518 167 4,066
Total 25,274 9,916 7,278 6,540 49,008
31 Dec. 2013, EUR million Finnish Foreign Finnish Foreign
Non-banking corporate sector 12,446 869 6,441 625 20,381
Financial institutions and insurance companies 9,890 5,622 380 3,075 18,967
Households 1,098 22 235 0 1,355
Non-profit organisations 224 482 14 719
Public sector entities 550 1,571 514 24 2,659
Total 24,208 8,564 7,585 3,725 44,081
* Comparative figures have been restated as a result of the adoption of IFRS 10 Consolidated Financial Statements.
31 Dec. 2014, EUR million
Notimpaired
(gross)Impaired
(gross) TotalImpair-ments
Balancesheetvalue
Receivables from credit institutions 10,257 10,257 10,257
Receivables from customers, of which 14,338 266 14,603 252 14,351
Bank guarantee receivables 0 12 12 12 1
Finance leases 1,162 1,162 1,162
Total 25,756 266 26,022 252 25,770
Non-banking corporate sector 12,661 265 12,926 242 12,683
Financial institutions and insurance companies 11,341 11,341 11,341
Households 1,233 1,233 9 1,223
Non-profit organisations 177 0 177 0 177
Public sector entities 345 345 345
Total 25,756 266 26,022 252 25,770
The balance sheet values are carrying amounts including impairments and accrued interest income.
Off-balance-sheet
Off-balance-sheet
Total
Total
Receivables from credit institutions andcustomers by sector
Note 43. Receivables from credit institutions and customers, and doubtfulreceivables
Balance sheet values
Balance sheet values
Note 42. Exposure by sector
Receivables from credit institutions andcustomers
141

31 Dec. 2013, EUR million*
Notimpaired
(gross)Impaired
(gross) TotalImpair-ments
Balancesheetvalue
Receivables from credit institutions 9,899 9,899 9,899
Receivables from customers, of which 13,333 289 13,622 259 13,363
Bank guarantee receivables 1 1 3 1 1
Finance leases 1,148 1,148 1,148
Total 24,379 289 24,668 259 24,409
Non-banking corporate sector 12,619 289 12,908 253 12,655
Financial institutions and insurance companies 10,047 10,047 10,047
Households 1,125 1,125 6 1,119
Non-profit organisations 223 0 223 0 223
Public sector entities 365 365 365
Total 24,379 289 24,668 259 24,409
* Comparative figures have been restated as a result of the adoption of IFRS 10 Consolidated Financial Statements.
31 Dec. 2014, EUR million
Notimpaired
(gross)Impaired
(gross) Total ArrearsIndividually
assessedCollectively
assessed
Doubtful receivablesReceivables from customers, of which 227 266 493 13 230 22
Bank guarantee receivables 0 12 12 12Finance leases 0Total 227 266 493 14 230 22Doubtful receivables by sectorNon-banking corporate sector 215 265 480 12 230 13
0 0Households 11 11 2 9Non-profit organisations 1 0 2 0 0Public sector entities 0Total 227 266 493 14 230 22
Receivables from credit institutions andcustomers
Receivables from credit institutions andcustomers by sector
Impairments
Collectively assessed impairments on receivables are allocated to Non-banking Corporate Sector. Their amount cameto EUR 22 million (17).
Financial institutions and insurancecompanies
142
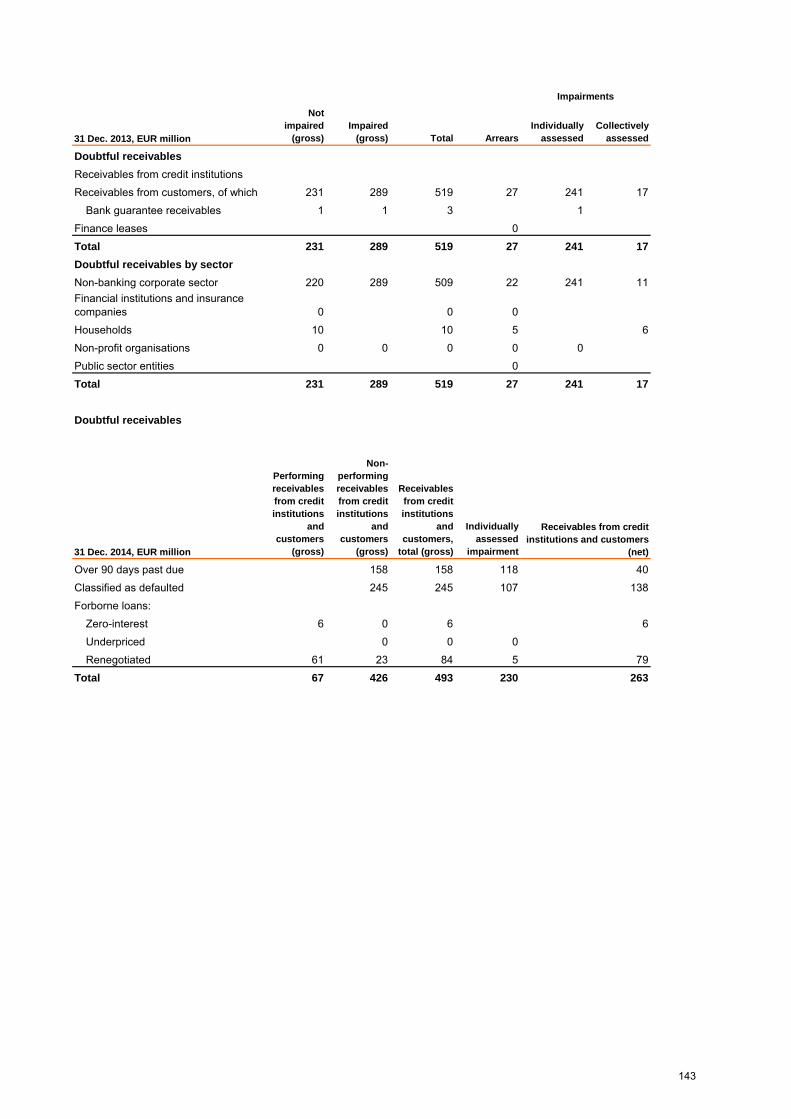
31 Dec. 2013, EUR million
Notimpaired
(gross)Impaired
(gross) Total ArrearsIndividually
assessedCollectively
assessed
Doubtful receivablesReceivables from credit institutionsReceivables from customers, of which 231 289 519 27 241 17
Bank guarantee receivables 1 1 3 1Finance leases 0Total 231 289 519 27 241 17Doubtful receivables by sectorNon-banking corporate sector 220 289 509 22 241 11
0 0 0Households 10 10 5 6Non-profit organisations 0 0 0 0 0Public sector entities 0Total 231 289 519 27 241 17
Doubtful receivables
31 Dec. 2014, EUR million
Performingreceivablesfrom creditinstitutions
andcustomers
(gross)
Non-performingreceivablesfrom creditinstitutions
andcustomers
(gross)
Receivablesfrom creditinstitutions
andcustomers,
total (gross)
Individuallyassessed
impairment
158 158 118 40245 245 107 138
Forborne loans:6 0 6 6
Underpriced 0 0 0Renegotiated 61 23 84 5 79
Total 67 426 493 230 263
Receivables from creditinstitutions and customers
(net)
Classified as defaultedOver 90 days past due
Impairments
Zero-interest
Financial institutions and insurancecompanies
143
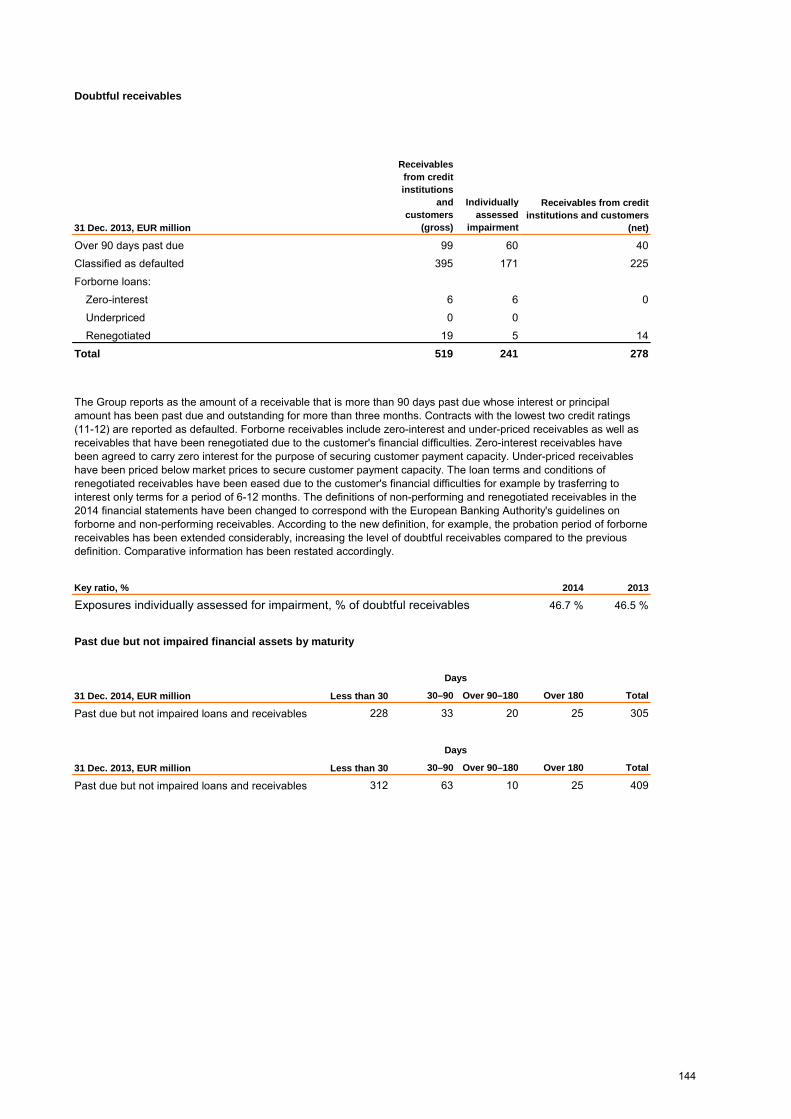
Doubtful receivables
31 Dec. 2013, EUR million
Receivablesfrom creditinstitutions
andcustomers
(gross)
Individuallyassessed
impairment
99 60 40395 171 225
Forborne loans:Zero-interest 6 6 0Underpriced 0 0Renegotiated 19 5 14
Total 519 241 278
Key ratio, % 2014 2013
Exposures individually assessed for impairment, % of doubtful receivables 46.7 % 46.5 %
Past due but not impaired financial assets by maturity
31 Dec. 2014, EUR million Less than 30 30–90 Over 90–180 Over 180 Total
Past due but not impaired loans and receivables 228 33 20 25 305
31 Dec. 2013, EUR million Less than 30 30–90 Over 90–180 Over 180 Total
Past due but not impaired loans and receivables 312 63 10 25 409
Days
Days
Classified as defaulted
The Group reports as the amount of a receivable that is more than 90 days past due whose interest or principalamount has been past due and outstanding for more than three months. Contracts with the lowest two credit ratings(11-12) are reported as defaulted. Forborne receivables include zero-interest and under-priced receivables as well asreceivables that have been renegotiated due to the customer's financial difficulties. Zero-interest receivables havebeen agreed to carry zero interest for the purpose of securing customer payment capacity. Under-priced receivableshave been priced below market prices to secure customer payment capacity. The loan terms and conditions ofrenegotiated receivables have been eased due to the customer's financial difficulties for example by trasferring tointerest only terms for a period of 6-12 months. The definitions of non-performing and renegotiated receivables in the2014 financial statements have been changed to correspond with the European Banking Authority's guidelines onforborne and non-performing receivables. According to the new definition, for example, the probation period of forbornereceivables has been extended considerably, increasing the level of doubtful receivables compared to the previousdefinition. Comparative information has been restated accordingly.
Over 90 days past due
Receivables from creditinstitutions and customers
(net)
144
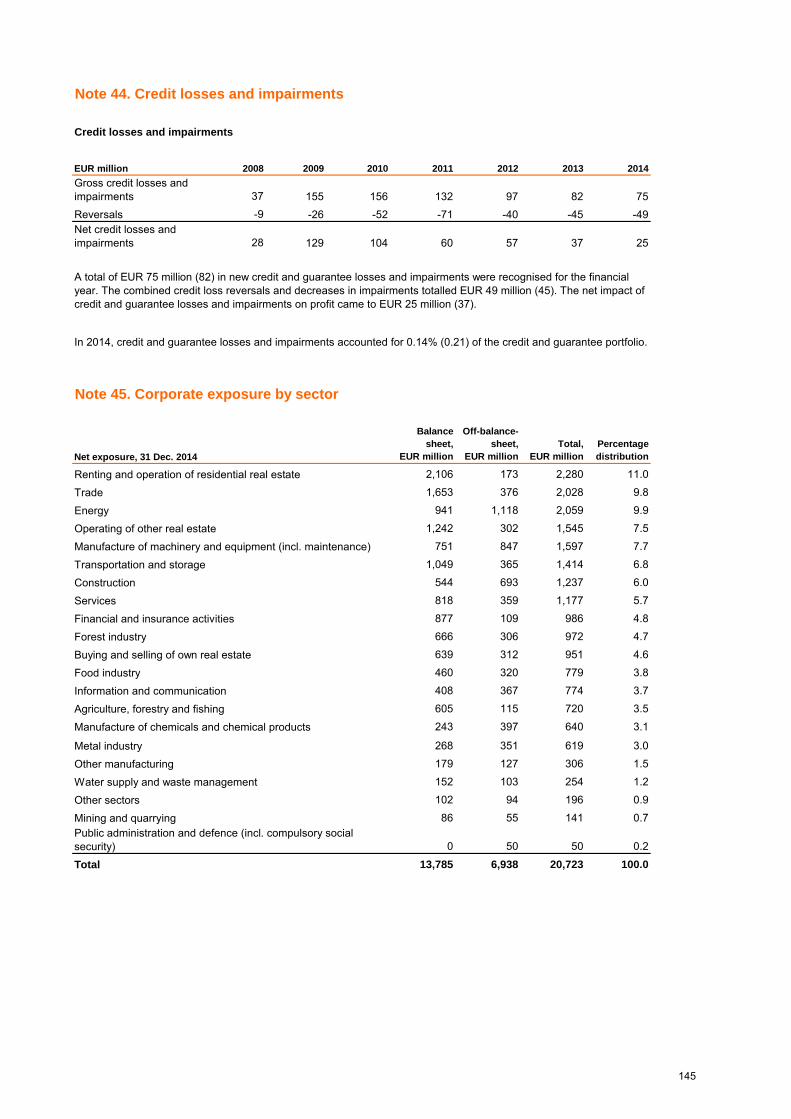
Credit losses and impairments
EUR million 2008 2009 2010 2011 2012 2013 2014
37 155 156 132 97 82 75-9 -26 -52 -71 -40 -45 -49
28 129 104 60 57 37 25
Net exposure, 31 Dec. 2014
Balancesheet,
EUR million
Off-balance-sheet,
EUR millionTotal,
EUR millionPercentagedistribution
Renting and operation of residential real estate 2,106 173 2,280 11.0
Trade 1,653 376 2,028 9.8
Energy 941 1,118 2,059 9.9
Operating of other real estate 1,242 302 1,545 7.5
Manufacture of machinery and equipment (incl. maintenance) 751 847 1,597 7.7
Transportation and storage 1,049 365 1,414 6.8
Construction 544 693 1,237 6.0
Services 818 359 1,177 5.7
Financial and insurance activities 877 109 986 4.8
Forest industry 666 306 972 4.7
Buying and selling of own real estate 639 312 951 4.6
Food industry 460 320 779 3.8
Information and communication 408 367 774 3.7
Agriculture, forestry and fishing 605 115 720 3.5
Manufacture of chemicals and chemical products 243 397 640 3.1
Metal industry 268 351 619 3.0
Other manufacturing 179 127 306 1.5
Water supply and waste management 152 103 254 1.2
Other sectors 102 94 196 0.9
Mining and quarrying 86 55 141 0.7
0 50 50 0.2
Total 13,785 6,938 20,723 100.0
Reversals
Note 44. Credit losses and impairments
In 2014, credit and guarantee losses and impairments accounted for 0.14% (0.21) of the credit and guarantee portfolio.
Public administration and defence (incl. compulsory socialsecurity)
A total of EUR 75 million (82) in new credit and guarantee losses and impairments were recognised for the financialyear. The combined credit loss reversals and decreases in impairments totalled EUR 49 million (45). The net impact ofcredit and guarantee losses and impairments on profit came to EUR 25 million (37).
Gross credit losses andimpairments
Note 45. Corporate exposure by sector
Net credit losses andimpairments
145

Net exposure, 31 Dec. 2013
Balancesheet,
EUR million
Off-balance-sheet,
EUR millionTotal,
EUR millionPercentagedistribution
Renting and operation of residential real estate 2,003 100 2,104 10.3
Trade 1,541 469 2,010 9.9
Operating of other real estate 1,401 345 1,746 8.6
Manufacture of machinery and equipment (incl. maintenance) 698 952 1,650 8.1
Energy 787 728 1,515 7.4
Construction 588 778 1,365 6.7
Transportation and storage 1,023 273 1,296 6.4
Buying and selling of own real estate 762 299 1,062 5.2
Services 675 388 1,062 5.2
Financial and insurance activities 863 191 1,054 5.2
Forest industry 549 410 959 4.7
Information and communication 489 418 907 4.4
Food industry 450 299 749 3.7
Manufacture of chemicals and chemical products 215 498 713 3.5
Metal industry 320 379 699 3.4
Agriculture, forestry and fishing 436 67 502 2.5
Other manufacturing 212 207 418 2.1
Water supply and waste management 179 89 268 1.3
Mining and quarrying 88 92 181 0.9
Other sectors 39 87 126 0.6
0 0 0.0
Total 13,320 7,066 20,386 100.0
Rating
Netexposure,
EUR million %
Netexposure,
EUR million %
1.0–2.0 1,176 5.7 1,391 6.8
2.5–5.0 11,036 53.3 10,264 50.3
5.5–7.0 6,079 29.3 6,186 30.3
7.5–8.5 1,946 9.4 1,842 9.0
9.0–10.0 259 1.2 361 1.8
11.0–12.0 228 1.1 343 1.7
Total 20,723 100.0 20,386 100.0
31 Dec. 2014
Note 46. Corporate exposure by rating category
31 Dec. 2013
Public administration and defence (incl. compulsory socialsecurity)
146
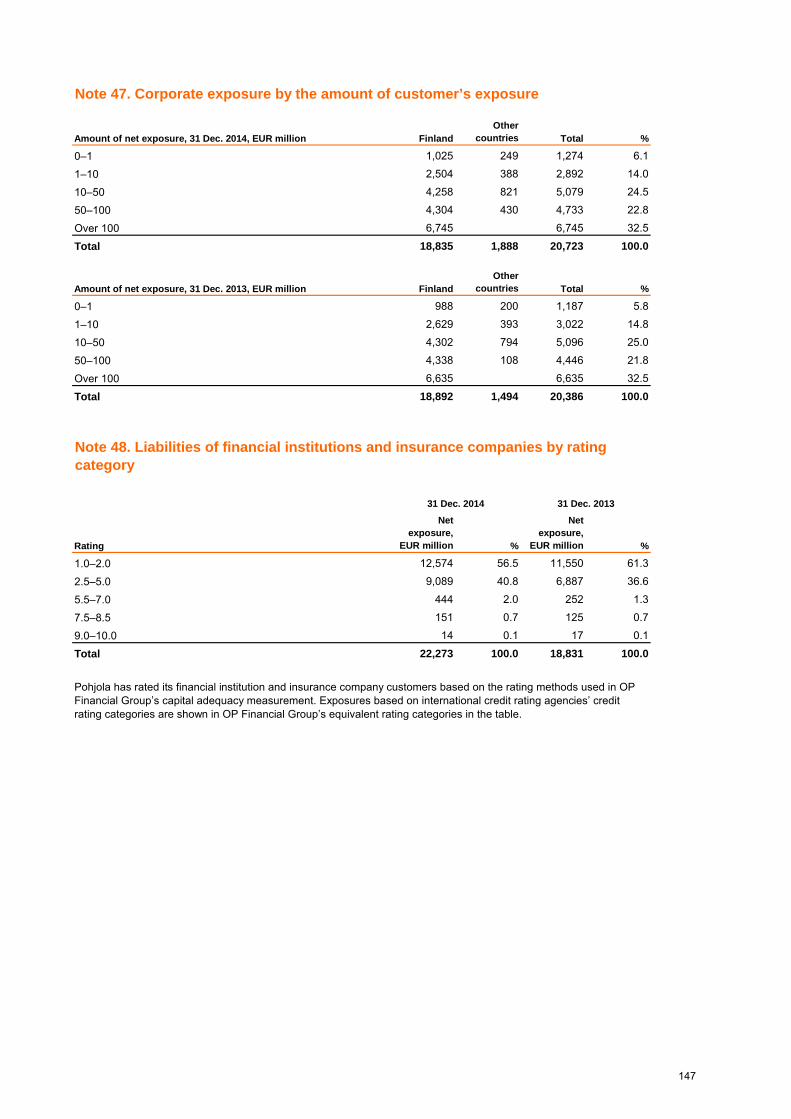
Amount of net exposure, 31 Dec. 2014, EUR million FinlandOther
countries Total %
0–1 1,025 249 1,274 6.1
1–10 2,504 388 2,892 14.0
10–50 4,258 821 5,079 24.5
50–100 4,304 430 4,733 22.8
Over 100 6,745 6,745 32.5
Total 18,835 1,888 20,723 100.0
Amount of net exposure, 31 Dec. 2013, EUR million FinlandOther
countries Total %
0–1 988 200 1,187 5.8
1–10 2,629 393 3,022 14.8
10–50 4,302 794 5,096 25.0
50–100 4,338 108 4,446 21.8
Over 100 6,635 6,635 32.5
Total 18,892 1,494 20,386 100.0
Rating
Netexposure,
EUR million %
Netexposure,
EUR million %
1.0–2.0 12,574 56.5 11,550 61.3
2.5–5.0 9,089 40.8 6,887 36.6
5.5–7.0 444 2.0 252 1.3
7.5–8.5 151 0.7 125 0.7
9.0–10.0 14 0.1 17 0.1
Total 22,273 100.0 18,831 100.0
31 Dec. 2014
Pohjola has rated its financial institution and insurance company customers based on the rating methods used in OPFinancial Group’s capital adequacy measurement. Exposures based on international credit rating agencies’ creditrating categories are shown in OP Financial Group’s equivalent rating categories in the table.
Note 47. Corporate exposure by the amount of customer’s exposure
31 Dec. 2013
Note 48. Liabilities of financial institutions and insurance companies by ratingcategory
147

EUR million 31 Dec. 2014 % 31 Dec. 2013 %
Public-sector guarantees 2,249 28.9 1,613 23.4
Object of financing as collateral 2,011 25.8 1,870 27.11,692 21.7 1,655 24.0
Shares and participations, other 595 7.6 614 8.9
428 5.5 332 4.8
Property or lease mortgage on residential property 288 3.7 164 2.4
Business mortgage 202 2.6 258 3.7
Factoring 153 2.0 142 2.1
Bank guarantee 94 1.2 89 1.3
Other collateral 76 1.0 157 2.3
Total 7,789 100.0 6,893 100.0
EUR million 31 Dec. 2014 % 31 Dec. 2013* %
Liabilities to credit institutions 5,241 12.7 4,789 12.8
Financial liabilities at fair value through profit or loss 4 0.0 4 0.0
Liabilities to customersDeposits 9,180 22.3 7,504 20.1
Other 2,262 5.5 2,678 7.2
Debt securities issued to the publicCertificates of deposit and ECPs 7,026 17.0 6,769 18.2
Bonds 10,561 25.6 9,328 25.0
Other liabilities 2,479 6.0 2,075 5.6
Subordinated liabilities 1,084 2.6 984 2.6
Shareholders' equity 3,408 8.3 3,150 8.4
Total 41,246 100.0 37,281 100.0
* Comparative figures have been restated as a result of the adoption of IFRS 10 Consolidated Financial Statements.
Received collateral by type of collateral has been calculated on the basis of the values of collateral held by the bankallocated to liabilities. The collateral's fair value is used as the basis for calculating the collateral value which is derivedfrom the fair value on the basis of valuation percentages, based on conservative estimates, by type of collateral.
Note 50. Funding structure
Property or lease mortgage on office or industrial property
Shares in housing corporations, and housing associations andproperty companies in residential use
Note 49. Collateral received by type of collateral
148

31 Dec. 2014, EUR millionLess than3 months
3–12months
1–5years
5–10years
More than10 years Total
Liquid assets 3,774 3,774
Notes and bonds 29 56 211 62 1 360
Receivables from credit institutions 5,181 809 3,709 536 22 10,257
Receivables from customers 2,919 1,850 7,858 1,382 1,504 15,513
Available-for-sale financial assetsNotes and bonds 193 447 3,050 4,068 24 7,782
50 36 36 22 144
Total assets 12,145 3,198 14,865 6,070 1,552 37,829
Liabilities to credit institutions 2,637 592 1,781 232 5,241
4 4
Liabilities to customers 10,159 784 205 265 30 11,4425,199 4,174 6,666 1,375 172 17,587
Subordinated liabilities 150 201 733 1,084
Total liabilities 17,998 5,701 8,852 2,605 202 35,359
Guarantees 24 213 598 1 38 874Other guarantee liabilities 220 339 383 37 599 1,578Loan commitments 4,365 4,365
72 170 56 297Other 259 1 2 74 336
4,939 723 1,039 112 637 7,450
Notes and bonds
Financial assets at fair value throughprofit or loss
Financial liabilities at fair value throughprofit or loss
Held-to-maturity financial assets
Debt securities issued to the public
Total off-balance-sheetcommitments
Commitments related to short-termtrade transactions
Note 51. Maturity of assets and liabilities by residual term to maturity
149

31 Dec. 2013, EUR million*Less than3 months
3–12months
1–5years
5–10years
More than10 years Total
Liquid assets 2,046 2,046
Notes and bonds 37 34 293 73 6 443
Receivables from credit institutions 5,399 672 3,303 500 24 9,899
Receivables from customers 2,344 1,755 7,593 1,347 1,472 14,510
Available-for-sale financial assetsNotes and bonds 82 375 3,453 3,177 21 7,108
64 22 115 0 202
Total assets 9,973 2,858 14,757 5,098 1,523 34,209
Liabilities to credit institutions 2,148 537 1,692 412 4,789
4 4
Liabilities to customers 9,055 372 209 280 267 10,1835,694 3,910 6,029 414 50 16,097
Subordinated liabilities 40 169 94 681 984
Total liabilities 16,941 4,988 8,023 1,788 317 32,056
Guarantees 77 67 540 21 210 914Other guarantee liabilities 257 402 473 25 410 1,568Loan commitments 4,728 4,728
80 79 73 15 247Other 251 1 4 104 359
5,392 549 1,090 165 619 7,816
* Comparative figures have been restated as a result of the adoption of IFRS 10 Consolidated Financial Statements.
Debt repayable on demand, included in the shortest maturity category, totalled EUR 8.4 billion (6.6).
Financial assets at fair value throughprofit or loss
Notes and bonds
Total off-balance-sheetcommitments
Financial assets at fair value through profit or loss consist of notes and bonds which may be sold anytime. Notes andbonds included in available-for-sale financial assets may be sold whenever necessary. Notes and bonds included infinancial assets at fair value through profit or loss and those included in available-for-sale financial assets are,however, presented within the sub-category determined on the basis of the remaining term to maturity in the table.Nominal amounts of debt are presented under categories by maturity. Financial liabilities held for trading are presentedunder the shortest maturity category. In its financial risk management, Pohjola Group uses forward exchange contractsand interest-rate and currency swaps. Since their net effect on the financial risk in euro countervalue is insignificant,they are not specifically presented.
Held-to-maturity financial assets
Financial liabilities at fair value throughprofit or loss
Debt securities issued to the public
Commitments related to short-termtrade transactions
150

Year(s) 0–1 1–3 3–5 5–7 7–10 10– Total Proportion, %
Aaa* 4,146 543 1,488 1,981 965 24 9,145 55.1Aa1 Aa3 109 33 437 556 469 0 1,605 9.7A1 A3 223 268 42 13 10 1 557 3.4Baa1 Baa3 38 116 32 59 52 1 298 1.8Ba1 or lower 14 95 24 1 11 0 146 0.9
712 1,736 1,349 460 176 414 4,848 29.2Total 5,243 2,791 3,371 3,069 1,684 440 16,598 100.0
31 Dec. 2014, EUR million1 month
or less>1–3
months>3–12
months>1–2
years>2–5
years >5 years Total
Cash and cash equivalents 3,774 3,774
Notes and bonds 6 115 47 15 114 62 360
4,849 2,561 1,870 375 479 122 10,257
Receivables from customers 6,049 5,573 1,919 169 976 828 15,513
Notes and bonds 277 287 279 511 2,382 4,046 7,782
Notes and bonds 95 39 10 144
Total assets 15,050 8,576 4,115 1,080 3,950 5,059 37,829
2,338 1,198 673 237 633 162 5,241
4 4
Liabilities to customers 8,835 1,794 772 40 11,442
1,625 5,714 3,395 994 4,603 1,255 17,587200 50 65 769 1,084
Total liabilities 12,803 8,907 4,890 1,296 5,236 2,226 35,359
Financial assets at fair valuethrough profit or loss
Liquidity buffer by maturity and credit rating on 31 December 2014, EUR million
Liabilities to credit institutions
Note 53. Maturities of assets and liabilities by maturity or repricing
* incl. deposits with the central bank
** PD </= 0.40%
Financial liabilities at fair valuethrough profit or loss
The liquidity buffer’s (excl. deposits with the central bank) residual term to maturity averages 4.6 years.
Subordinated liabilities
Held-to-maturity financialassets
Available-for-sale financialassets
Debt securities issued to thepublic
Note 52. Liquidity buffer
Debt repayable on demand totalled EUR 8.4 billion, consisting mainly of public deposits.
Receivables from creditinstitutions
Internallyrated**
151

31 Dec. 2013, EUR million*1 month
or less>1–3
months>3–12
months>1–2
years>2–5
years >5 years Total
Cash and cash equivalents 2,046 2,046
Notes and bonds 18 96 48 28 176 76 443
4,924 2,816 1,171 268 542 177 9,899
Receivables from customers 4,919 5,282 2,079 441 1,006 784 14,510
Notes and bonds 404 348 296 544 2,351 3,165 7,108
Notes and bonds 139 63 202
Total assets 12,451 8,605 3,595 1,281 4,075 4,202 34,209
2,113 1,064 535 183 643 251 4,789
4 4
Liabilities to customers 8,414 1,364 364 0 40 10,183
1,659 5,853 3,150 1,001 4,112 322 16,097184 119 681 984
Total liabilities 12,190 8,465 4,169 1,183 4,755 1,294 32,056
* Comparative figures have been restated as a result of the adoption of IFRS 10 Consolidated Financial Statements.
Subordinated liabilities
Debt securities issued to thepublic
Financial assets at fair valuethrough profit or loss
Financial liabilities at fair valuethrough profit or loss
Debt repayable on demand totalled EUR 6.6 billion, consisting mainly of public deposits.
Available-for-sale financialassets
Receivables from creditinstitutions
Held-to-maturity financialassets
Liabilities to credit institutions
152

EUR million ChangeEffect on
results
Effect onshare-
holders'equity
Effect onresults
Effect onshare-
holders'equity
1 pp 18 39
10% 7 3
Volatility10 basis
points 1 2
Volatility 10 pps 1 10.1 pps 1 36 1 31
10% 0 0
10% 1 2 1 2
10% 3 3
Market value
Private equity fundsReal estate risk
31 Dec. 2014
On 31 December 2014, capital invested in property holdings amounted to EUR 88 million (91), with properties in ownuse representing EUR 3 million (3).
Credit spread
Market value
Note 56. Real estate risk
Credit risk premium*
Equity portfolio
On 31 December 2014, market risks accounted for 6.8% (6.0) of the risk-weighted assets.
On 31 December 2014, the market value of equity and private equity funds totalled EUR 24 million (31), of which theequity portfolio accounted for EUR 1 million (1) and the private equity funds including their investment commitmentsEUR 23 million (30). The year-end equity portfolio was divided into two sectors: information technology 89% (87) andtelecommunication services 11% (13).
Market value
31 Dec. 2013
Investments in private equity funds totalled EUR 16 million (21) and binding unexecuted investment commitments EUR7 million (9).
Note 55. Equity risk
Note 54. Sensitivity analysis of market risk
Risk parameter
Volatility riskCurrency risk
Market value
Interest rate volatility
Note 22 and Note 26 (Property in own use) provide detailed information on changes in investment property during thefinancial year.
Interest rateInterest-rate risk
In 2014, the Group obtained an external appraisal's estimates of the fair value of property holdings, on the basis ofwhich their combined fair value corresponds to capital tied to the property holdings. It is estimated that real estate risksare low.
Currency volatility
Price risk
153

EUR million
CRR31 Dec.
2014
CRR1 Jan. 2014
CRD331 Dec.
2013
Shareholders' equity 3,408 3,150 3,150
-183 -137 -137
Fair value reserve, cash flow hedging -17 -11 -11
Common Equity Tier 1 (CET1) before deductions 3,209 3,001 3,001Intangible assets -195 -193 -193
-1 -8 -4
Dividend distribution proposed by Board of Directors -141 -212 -212-50 -31 -31
Investments in insurance companies and financial institutions -703
Shortfall of impairments – expected losses -122 -115 -50
Common Equity Tier 1 (CET1)* 2,700 2,441 1,808Subordinated loans to which transitional provisions applies 219 219 274
Shortfall of Tier 2 capital -38
Additional Tier 1 capital (AT1) 219 219 235Tier 1 capital (T1) 2,919 2,660 2,043Debenture loans 663 683 683
50 31 31
Investments in insurance companies and financial institutions -703
Shortfall of impairments – expected losses -50
Reclassification into AT1 38
Tier 2 capital (T2) 713 714
Total capital base 3,633 3,375 2,043
Pillar III disclosures
* The row of CET1 based on CRD III figures shows Core Tier as defined by the EBA
Unrealised gains under transitional provisions
Elimination of insurance companies' effect in equity capital (equity capital andGroup eliminations)
The consolidation group that forms the basis of Pohjola Bank plc’s capital adequacy comprises Pohjola Groupcompanies excluding insurance companies and their subsidiaries.
Note 57. Capital base
Pohjola has applied transitional provisions regarding old capital instruments to subordinated loans. A total of 80% ofthe amounts outstanding on 31 December 2012 are included in the capital base.
Negative unrealised valuations are included in common equity tier 1 capital. Positive unrealised valuations are includedin tier 2 capital according to a statement issued by the Financial Supervisory Authority.
Excess funding of pension liability, valuation adjustments and indirect holdings
Pohjola has applied the Internal Ratings Based Approach (IRBA) to retail, credit institution and corporate exposuresand equity investments. The Standardised Approach (SA) is used for other exposure categories.
Notes 57–60 disclose a summary of information on the capital adequacy of the consolidation group, as specified in theCapital Requirements Regulation of the European Parliament and of the Council (Pillar III disclosures). Figures for theprevious year have been calculated in accordance with the rules in force on 31 December 2013. Capital base, risk-weighted assets and capital adequacy ratios are also presented as estimates in compliance with regulation in forcesince 1 January 2014. Given that this information is based on the consolidated capital adequacy, it is not directlycomparable with other information disclosed on Pohjola Group. Complete Pillar III information can be found in OPFinancial Group’s financial statements.
Unrealised gains under transitional provisions
The Group has presented its capital base of 31 December 2014 in accordance with the EU capital requirementregulation and directive (EU 575/2013) (CRR) entered into force on 1 January 2014. Comparatives for 2013 arepresented according to CRD III in force on 31 December 2013. In addition, an estimate of the figures a year ago underCRR is presented in column CRR 1 Jan. 2014.
154

EUR millionCapital
requirement*
Risk-weighted
assetsCapital
requirement*
Risk-weighted
assets
Credit and counterparty risk 1,506 18,829 1,121 14,007Standardised Approach (SA) 102 1,271 65 814Exposures to central government and central banks 1 11 7 82
Exposures to regional government or local authorities 1 15
Exposures to institutions 5 61 3 44
Exposures to corporates 83 1,043 48 598
Retail exposures 6 72 5 67
Other items 6 69 2 24
Internal Ratings Based Approach (IRB) 1,405 17,559 1,055 13,192Exposures to institutions 100 1,245 88 1,096
Exposures to corporates 863 10,788 829 10,367
Retail exposures 75 938 70 874
Exposures secured by mortgages on immovable property 0 1 0 2
Other retail exposures 75 936 70 873
Equity investments 331 4,132 16 195
PD/LGD method 326 4,072 5 59
Basic Indicator Approach 5 61 11 136
Private equity investments 4 49 4 54
Listed equity investments 0 4 0 3
Other 1 8 6 79
Securitisation positions 35 436 51 636
Other non-credit obligations 2 21 2 23
Clearing/settlement risk 0 1
Pohjola has used the Standardised Approach to measure capital requirement for operational risks.
Pohjola has applied the Internal Ratings Based Approach (IRBA) to retail, credit institution and corporate exposuresand equity investments. The Standardised Approach (SA) is used for other exposure categories. Investments inPohjola Group’s insurance companies have been deducted from the capital base. Pohjola has used the FoundationInternal Ratings Based Approach (FIRBA) to measure capital requirement for corporate and credit institutionexposures. This approach uses internal credit ratings to determine a customer’s probability of default (PD), whereasloss given default (LDG) and credit conversion factor (CF) are standard estimates supplied by the authorities. Pohjolahas used the Internal Ratings Based Approach (IRBA) to measure capital requirement for retail exposures. Thisapproach uses internal credit ratings to determine a customer’s PD, and LGD and CF are estimated internally.
31 Dec. 2013
Note 58. Minimum capital requirement
It is possible to use various methods to measure capital adequacy requirement for equity investments. In the PD/LGDmethod, investments’ risk-weighted exposure is calculated using PD, based on internal credit rating, and the officialLGD. According to the Simple Risk Weight Approach, investments’ risk-weighted exposure amount derives frommultiplying each investment by the risk-weight determined by the type of investment.
31 Dec. 2014
155

117 1,467 77 957106 1,327 71 889
Equities 0 5
Foreign currency 7 90 4 49
Commodities 4 45 2 20
Operational risk 91 1,137 87 1,083Risk associated with exposure value adjustment 32 405Total risk 1,747 21,839 1,284 16,048
31 Dec. 2014 1 Jan. 2014 31 Dec. 2013
Ratios, %CET1 ratio 12.4 11.9 11.3Tier 1 ratio 13.4 13.0 12.7Capital adequacy ratio 16.6 16.5 12.7
Notes and bonds
Capital requirement for counterparty risk amounts to EUR 59 million (42).
Market risk (Standardised Approach)
The risk weight of equity investments includes EUR 3.9 billion in insurance holdings within OP Financial Group. Basedon permission from the Financial Supervisory Authority, OP Financial Group treats insurance holdings as risk-weightedassets according to the PD/LGD method.
EUR 46 million of Other exposures represent deferred tax assets that are treated with a risk weight of 250% instead ofa deduction from common equity tier 1 capital.
* Capital requirement = Risk-weighted assets * 0.08
Total risk-weighted asset on 31 December 2013 would have amounted to EUR 20,499 million in accordance withregulation that entered into force on 1 January 2014. Risk-weighted assets were increased by treatment of insuranceholdings in equity investments instead of deduction from CET1. Risk-weighted assets and capital requirement in thetable are shown as exposure categories in compliance with new regulation, which is why comparatives do notcorrespond to new exposure categories in all respects.
Note 59. Capital ratios
156

Grossexposure
Benefitsfrom netting
Presentnetted credit
riskCollateral
heldNet credit
risk
Derivative contracts 8,733 5,415 3,318 722 2,596
Interest rate derivatives 6,423 4,146 2,277 445 1,831
Currency derivatives 2,063 1,189 874 261 613
Equity and index derivatives 147 80 68 16 52
Other 100 100 100
Total 8,733 5,415 3,318 722 2,596
Credit risk arising from derivative contracts is defined as a credit equivalent based on the daily market valuation ofderivative contracts.
The size of customer limits are defined on the basis of assets included in derivative contracts and the estimated validityof the contracts.
Counterparty risk associated with derivative contracts arises from receivables which Pohjola Bank plc may have fromits counterparties in case they default. Pohjola Group measures counterparty risk using a fair value model, whereby theamount of liability comprises the contract market value and the expected potential future exposure.
Pohjola Bank plc manages counterparty risks associated with derivative contracts through master agreements whichenables netting of contractual obligations in counterparty defaults as well as through collaterals and optional earlytermination clauses. There are legal opinions ensuring the enforceability of netting provisions of the masteragreements in each derivative counterparty’s national legislation. Pohjola Group uses netting for counterparty exposurearising from derivative contracts in both capital adequacy measurement and the monitoring of credit risk limits. Withrespect to credit institutions as counterparties, Pohjola also always uses credit support annex to derivative masteragreements, in which case the received collateral reduces counterparty risk.
The Group confirms corporate counterparty exposure limits once a year and in this connection also checks the statusof collateral applying to the limits for derivative transactions.
If S&P had downgraded Pohjola's credit rating from AA– to A on 31 December 2014, an additional collateral worth EUR4 million would have been required. Downgrading credit rating a year ago would not have required additional collateral.
Credit risk arising from bank counterparties is through collateral, which means the use of ISDA Credit Support Annex(CSA) contract associated with the ISDA general agreement. In the collateral system, the counterparty provides cashor securities in security for the receivable. Matching between counterparties are performed on a daily basis.
Note 60. Derivative contracts and counterparty risk
Capital adequacy requirement due to counterparty risk may arise from items related to financing operations and thetrading book. Capital adequacy requirement due to counterparty risk is calculated, for example, on OTC derivativesand sale and repurchase agreements.
Counterparty risk contract types, 31 Dec.2014, EUR million
157

Grossexposure
Benefitsfrom netting
Presentnetted credit
riskCollateral
heldNet credit
risk
Derivative contracts 4,935 2,844 2,091 408 1,683
Interest rate derivatives 3,893 2,404 1,489 318 1,171
Currency derivatives 742 363 379 36 343
Equity and index derivatives 198 76 122 54 68
Other 101 101 101
Total 4,935 2,844 2,091 408 1,683
EURmillion
Risk-bearingcapacity, %
EURmillion
Risk-bearingcapacity, %
Solvency capital 988 913Claims incurred* 930 106 882 104Insurance premium revenue* 1,310 75** 1,249 73**Insurance liabilities* 2,645 37 2,517 36Investment portfolio 3,534 28 3,219 28
On 31 December 2014, the solvency capital of Non-life Insurance amounted to EUR 988 million (913) and the solvencyratio stood at 75% (73). The financial strength rating of Pohjola Insurance affirmed by Standard & Poor's is AA-. TheBoard of Directors has confirmed A as the targeted rating.
Note 79 presents the positive gross fair value of contracts.
The risk-bearing capacity describes the proportion of a company's solvency capital to various income statement andbalance sheet items. Solvency capital proportioned to claims incurred and insurance premium revenue describes thecompany's ability to cope with underwriting risks. Solvency capital proportioned to insurance liabilities describes thecompany's ability to cope with risks related to the estimation of insurance liabilities. Similarly, solvency capitalproportioned to the investment portfolio describes the company's ability to cope with the risks related to investments.
31 Dec. 2013
** Solvency ratio
Counterparty risk contract types, 31 Dec.2013, EUR million
* Reinsurers' share (net business) deducted
Risk exposure by Non-life Insurance
31 Dec. 2014
Non-life Insurance must fulfil all capital adequacy requirements set by regulatory authorities mainly at company level.All non-life insurance companies are governed by the same requirement set for their minimum solvency margin basedon EU directives. In addition, Finnish legislation also lays down capital adequacy requirements for Finnish insurancecompanies.
Note 61. Risk-bearing capacity
158

Risk parameter
Change inrisk
parameter
Effect onshare-
holders'equity,
EUR million
1,310Up
by 1% 13
Claims incurred* 930Up
by 1% -9
Large claim, over EUR 5 million 1 loss -5
Personnel costs* 102Up
by 8% -8
Expenses by function*/** 320Up
by 4% -13
603Up by 0.25
pps -4
1,658 Up 1 year -40
1,658Down by 0.1
pps -21
EUR million 5–20 20–50 50–100 100–300
14 14 11 1113 14 14 9
EUR million 2–4 4–10 10–30 30–90
3 6 7 33 6 8 3
2013
Note 63. Premiums written and sums insured by class
Premiums written by EML* class in corporate property insurance
2014
2013
* Moving 12-month
Insurance portfolio or insurancepremium revenue*
2014
The degree of risk in property insurance can be evaluated by dividing risks into classes by their EML* amounts. Thetable below shows premiums written calculated for each risk class.
* TSI = Total Sum Insured
Note 62. Sensitivity analysis of Non-life insurance
Down by 0.3 pps
Down by 3.0 pps
Down by 1.6 pps
Premiums written by TSI* class in corporate liability insurance
Inflation for collective liability
The degree of risk in liability insurance can be evaluated by dividing risks into classes by their TSI* amounts. The tablebelow shows premiums written calculated for each risk class.
Total in 2014,EUR million
Down by 0.7 pps
Down by 0.6 pps
Effect on combined ratio
Discount rate for discountedinsurance liabilities
The table below shows the effect of various risk parameters on profit and solvency capital
Life expectancy for discountedinsurance liabilities
Down by 0.4 pps
Up by 0.9 pps
Down by 1.0 pps
** Expenses by function in Non-life Insurance excluding expenses for investment management and expenses for other servicesrendered.
* EML = Estimated Maximum Loss per object of insurance
159
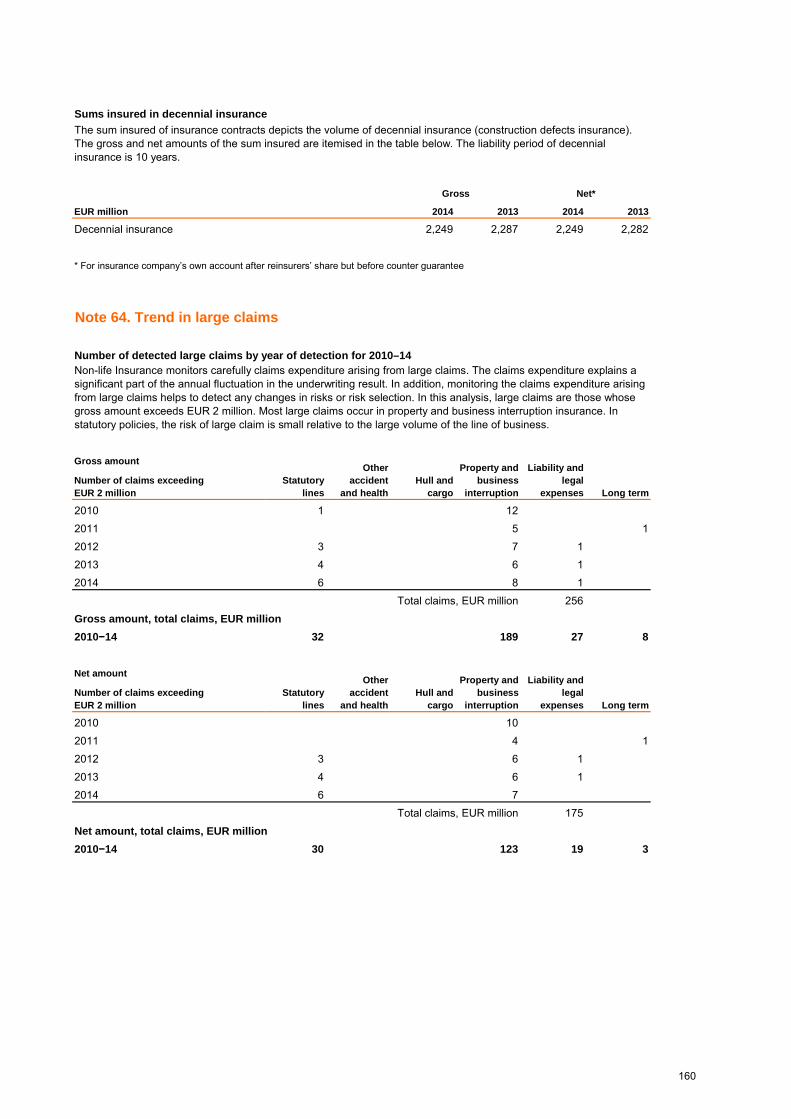
EUR million 2014 2013 2014 2013
Decennial insurance 2,249 2,287 2,249 2,282
Gross amount
2010 1 122011 5 12012 3 7 12013 4 6 12014 6 8 1
256Gross amount, total claims, EUR million2010 14 32 189 27 8
Net amount
2010 102011 4 12012 3 6 12013 4 6 12014 6 7
175Net amount, total claims, EUR million2010 14 30 123 19 3
Total claims, EUR million
Net*
Total claims, EUR million
Property andbusiness
interruption
The sum insured of insurance contracts depicts the volume of decennial insurance (construction defects insurance).The gross and net amounts of the sum insured are itemised in the table below. The liability period of decennialinsurance is 10 years.
Liability andlegal
expensesNumber of claims exceedingEUR 2 million
Otheraccident
and health
Gross
Sums insured in decennial insurance
Long term
Number of claims exceedingEUR 2 million Long term
Non-life Insurance monitors carefully claims expenditure arising from large claims. The claims expenditure explains asignificant part of the annual fluctuation in the underwriting result. In addition, monitoring the claims expenditure arisingfrom large claims helps to detect any changes in risks or risk selection. In this analysis, large claims are those whosegross amount exceeds EUR 2 million. Most large claims occur in property and business interruption insurance. Instatutory policies, the risk of large claim is small relative to the large volume of the line of business.
Hull andcargo
Statutory lines
* For insurance company’s own account after reinsurers’ share but before counter guarantee
Hull andcargo
Liability andlegal
expenses
Note 64. Trend in large claims
Number of detected large claims by year of detection for 2010–14
Otheraccident
and health
Statutory lines
Property andbusiness
interruption
160

2014, EUR millionGross
IP revenueNet
IP revenueNetCR*
Net**CR*
Statutory lines 457 455 96 % 82 %Other accident and health 180 180 86 % 86 %Hull and cargo 287 285 81 % 81 %Property and business interruption 353 312 89 % 89 %Liability and legal expenses 83 76 97 % 97 %Long-term 5 4 1 % 1 %Total 1,364 1,310 89 % 85 %
2013, EUR millionGross
IP revenueNet
IP revenueNetCR*
Net**CR*
Statutory lines 459 458 93 % 85 %Other accident and health 158 158 88 % 88 %Hull and cargo 264 261 90 % 90 %Property and business interruption 343 296 89 % 88 %Liability and legal expenses 80 73 82 % 82 %Long-term 5 4 15 % 15 %Total 1,309 1,249 90 % 87 %
** One-off changes affecting the balance on technical account have been eliminated.
Trends in insurance premium revenue (gross and net) and combined ratio (net)
* The combined ratio is calculated by dividing the sum of claims incurred (net) and operating expenses of insurance business byinsurance premium revenue (net). Amortisation on intangible rights is excluded from the calculation.
Note 65. Insurance profitability
Insurance premium revenue describes the volume of an insurance class, enabling the evaluation of the importance ofthe insurance class in relation to the whole portfolio. Similarly, the combined ratio (CR) is used to evaluate fluctuationsin the results of the insurance class and the profitability of the class. The combined ratio is presented separatelyadjusted for one-off items relating to previous insurance periods.
161
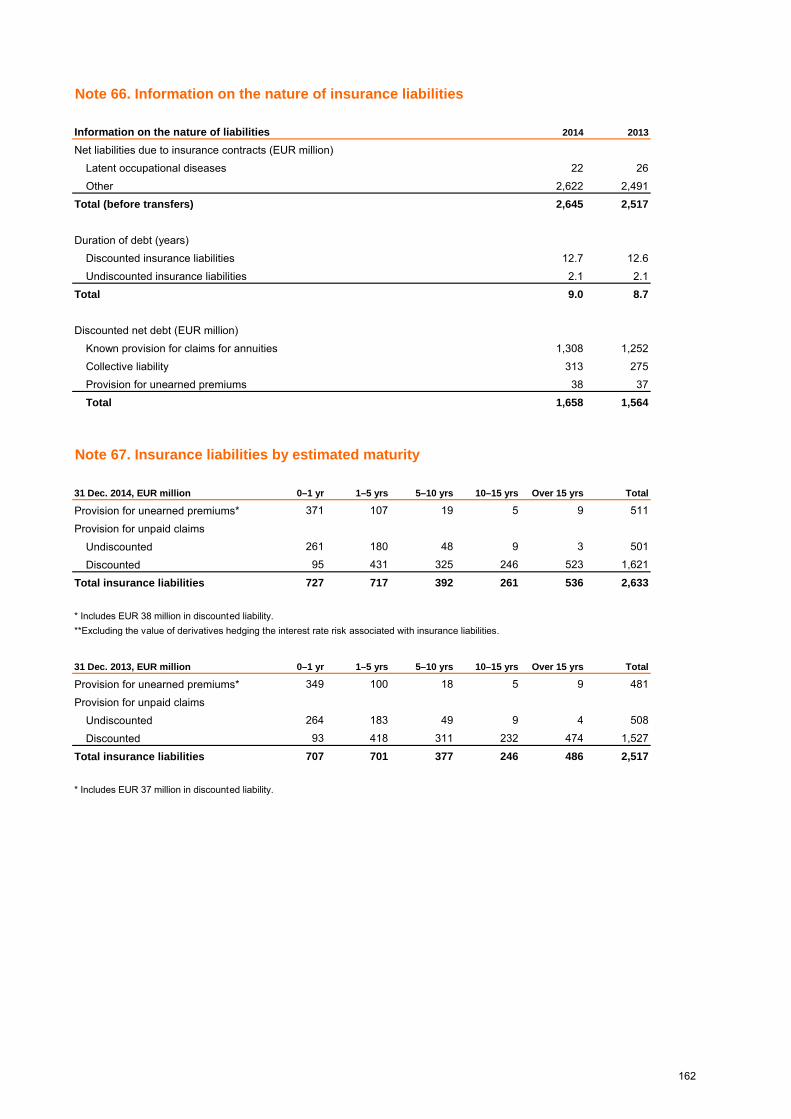
Information on the nature of liabilities 2014 2013
Net liabilities due to insurance contracts (EUR million)Latent occupational diseases 22 26Other 2,622 2,491
Total (before transfers) 2,645 2,517
Duration of debt (years)Discounted insurance liabilities 12.7 12.6Undiscounted insurance liabilities 2.1 2.1
Total 9.0 8.7
Discounted net debt (EUR million)Known provision for claims for annuities 1,308 1,252Collective liability 313 275Provision for unearned premiums 38 37Total 1,658 1,564
31 Dec. 2014, EUR million 0–1 yr 1–5 yrs 5–10 yrs 10–15 yrs Over 15 yrs Total
Provision for unearned premiums* 371 107 19 5 9 511
Provision for unpaid claimsUndiscounted 261 180 48 9 3 501
Discounted 95 431 325 246 523 1,621
727 717 392 261 536 2,633
31 Dec. 2013, EUR million 0–1 yr 1–5 yrs 5–10 yrs 10–15 yrs Over 15 yrs Total
Provision for unearned premiums* 349 100 18 5 9 481
Provision for unpaid claimsUndiscounted 264 183 49 9 4 508
Discounted 93 418 311 232 474 1,527
707 701 377 246 486 2,517
* Includes EUR 37 million in discounted liability.
Note 67. Insurance liabilities by estimated maturity
**Excluding the value of derivatives hedging the interest rate risk associated with insurance liabilities.
Total insurance liabilities
* Includes EUR 38 million in discounted liability.
Total insurance liabilities
Note 66. Information on the nature of insurance liabilities
162

Allocation of investment portfolioFair value,
EUR million* %Fair value,
EUR million* %
Money market total 173 5 113 4Money market instruments and deposits** 173 5 113 3Derivative instruments*** -1 0 1 0
Total bonds and bond funds 2,557 73 2,309 72Governments 507 14 471 15Inflation-indexed bonds 46 1 90 3Investment Grade 1,779 51 1,485 46Emerging markets and High Yield 200 6 236 7Structured investments 24 1 27 1
Total equities 373 11 426 13Finland 67 2 88 3Developed markets 143 4 191 6Emerging markets 43 1 47 1Fixed assets and unlisted equities 3 0 4 0Private equity investments 117 3 95 3Equity derivatives*** 0 0
Total alternative investments 35 1 41 1Hedge funds 23 1 23 1Commodities 4 0 5 0Convertible bonds 7 0 13 0
Total property investments 386 11 329 10Direct property investments 230 7 219 7Indirect property investments 156 4 110 3
Total 3,522 100 3,219 100
31 Dec. 2014 31 Dec. 2013
** Includes settlement receivables and liabilities and market value of derivatives
Note 68. Risk exposure of insurance investments
* Includes accrued interest income
*** Effect of derivatives on the allocation of the asset class (delta-weighted equivalents)
163

Non-life Insurance31 Dec.
2014 Change 31 Dec. 2014 31 Dec. 2013
Bonds and bond funds* 2,564 1 pp 101 72Equities** 276 10% 28 35
120 10% 12 10Commodities 4 10% 0 1Real property 386 10% 39 33Currency 157 10% 16 14Credit risk premium*** 2,729 0.1 pp 11 8Derivatives 10 pps 0 2
Portfolio at fairvalue, EUR million
Market value
Capital investments and unquotedequities
Volatility
Effect on solvency capital,EUR million
The table below shows the sensitivity of investment risks by investment category. The discount rate sensitivity analysisrelated to the calculation of insurance liabilities is presented in Note 62. Effects of changes in investments andinsurance liabilities offset one another.
** Include hedge funds and equity derivatives
Market value
Interest rate
Credit spread
Risk parameter
Market value
*** Includes bonds and convertible bonds and money-market investments, excluding government bonds issued by developed countries
Note 69. Sensitivity analysis of investment risks
Currency value
Market value
* Include money-market investments, convertible bonds and interest-rate derivatives
164

Fair value by duration or repricing date, EUR million* 31 Dec. 2014 31 Dec. 2013
0–1 year 332 331>1–3 years 618 568>3–5 years 699 761>5–7 years 700 358>7–10 years 281 225>10 years 70 141Total 2,700 2,384Modified duration 4.3 3.7Effective interest rate, % 1.1 2.0
Year(s) 0–1 1–3 3–5 5–7 7–10 10– Total Proportion, %
Aaa 62 181 87 266 57 47 698 25.9Aa1 Aa3 179 66 70 82 34 15 445 16.5A1 A3 27 215 269 165 111 0 786 29.1Baa1 Baa3 26 88 246 159 75 4 600 22.2Ba1 or lower 38 68 28 28 4 4 170 6.3
1 0 0 1 0.0Total 332 618 699 700 281 70 2,700 100.0
The term to maturity of the Non-life Insurance fixed-income portfolio averages 4.5 years (calculated on the basis of thecall date and the maturity date).
Fixed-income portfolio by maturity and credit rating on 31 Dec. 2014*, EUR million
* Excludes credit derivatives.
Internally rated
The maturity is presented until the end of the term to maturity. If the paper includes a call option, the maturity ispresented until the first possible Call date.
The market risk arising from changes in interest rates is monitored by classifying investments by instrument, inaccordance with duration. The table below does not indicate the balancing effect which the insurance liabilities have onthe interest-rate risk, because only some insurance liabilities have been discounted using an administrative interestrate (Note 33).
Note 70. Interest-rate risk
* Includes money-market investments and deposits, bonds, convertible bonds and bond funds.
The average credit rating of the Non-life Insurance fixed-income portfolio is Moody's A3.
165

Foreign currency exposure, EUR million 31 Dec. 2014 31 Dec. 2013
USD 40 54SEK 5 -3JPY 1 2GBP 21 14Other 89 62Total* 157 136
Credit rating, consistent with Moody's, EUR million Investment* Insurance** Investment* Insurance**
Aaa 698 872Aa1 Aa3 445 14 308 8A1 A3 786 38 585 23Baa1 Baa3 600 0 402 0Ba1 or lower 170 189Internally rated 1 41 27 49Total 2,700 93 2,384 80
31 Dec. 2013
* Include money-market investments and deposits, bonds and bond funds
Note 72. Counterparty risk
Note 71. Currency risk
** Includes the reinsurers' share of insurance liabilities, and receivables from reinsurers
31 Dec. 2014
* The currency exposure was 4.4% (4.2) of the investment portfolio. It is calculated as the sum total of individual currencies' intrinsicvalues.
166

Held tomaturity
At fair valuethroughprofit or
loss*Available
for saleHedging
derivativesCarrying
amount total
3,774 3,774
10,257 10,2575,637 309 5,946
15,513 15,513658 180 3,016 3,854
144 360 7,781 8,2850 101 101
1,698 85 1,783Financial assets 31,899 144 6,263 10,898 309 49,513Other than financial instruments 985Total 31,899 144 6,263 10,898 309 50,498
Held tomaturity
At fair valuethroughprofit or
loss*Available
for saleHedging
derivativesCarrying
amount total
2,046 2,046
9,899 9,8993,171 273 3,444
14,510 14,510539 162 2,800 3,502
202 443 7,108 7,7541 175 176
1,255 88 1,344Financial assets 28,251 202 3,865 10,084 273 42,675Other than financial instruments 1,149Total restated***** 28,251 202 3,865 10,084 273 43,824
Other financial assets
Cash and balances with central banks
Note 73. Classification of financial assets and liabilities
Receivables from credit institutionsand central banks
Non-life Insurance assets**
Shares and participations
Assets 31 Dec. 2013, EURmillion
Loans andreceivables
Derivative contracts
Shares and participations
Notes and bonds***
Receivables from customers
Assets 31 Dec. 2014, EURmillion
OTHER NOTES TO THE BALANCE SHEET
Other financial assets
Receivables from credit institutionsand central banks
Receivables from customers
Derivative contracts
Loans andreceivables
Notes and bonds***Non-life Insurance assets**
Cash and balances with central banks
167

Otherliabilities
Hedgingderivatives
Carryingamount total
Liabilities to credit institutions 5,241 5,241Financial liabilities held for trading (excl. derivatives) 4 4Derivative contracts 5,516 373 5,889Liabilities to customers 11,442 11,442Non-life Insurance liabilities**** 2 2,970 2,972Debt instruments issued to the public 17,587 17,587
1,084 1,084Other financial liabilities 2,257 2,257Financial liabilities 5,522 40,582 373 46,478Other than financial liabilities 612Total 5,522 40,582 373 47,090
Otherliabilities
Hedgingderivatives
Carryingamount total
Liabilities to credit institutions 4,789 4,789Financial liabilities held for trading (excl. derivatives) 4 4Derivative contracts 3,186 234 3,420Liabilities to customers 10,183 10,183Non-life Insurance liabilities**** 0 2,746 2,746Debt instruments issued to the public 16,097 16,097
984 984Other financial liabilities 1,971 1,971Financial liabilities 3,190 36,768 234 40,192Other than financial liabilities 483Total restated***** 3,190 36,768 234 40,675
Liabilities 31 Dec. 2013, EUR million
**** Non-life Insurance liabilities are specified in Note 33.
Subordinated liabilities
Bonds included in debt securities issued to the public are carried at amortised cost. On 31 December 2014, the fairvalue of these debt instrument was EUR 232 million (147) higher than their carrying amount, based on informationavailable in markets and employing commonly used valuation techniques. Subordinated liabilities are carried atamortised cost. Their fair values are higer than their amortised costs, but determining reliable fair values involvesuncertainty.
*** The notes as of 31 December 2014 did not include notes recognised in accordance with the Fair Value Option. The notes as of 31December 2013 regonised in accordance with the Fair Value Option totalled EUR 9 million.
** Non-life Insurance assets are specified in Note 21.
Liabilities 31 Dec. 2014, EUR millionAt fair value
through profit or loss
At fair valuethrough profit or loss
***** Comparative figures have been restated as a result of the adoption of IFRS 10 Consolidated Financial Statements.
* Assets at fair value through profit or loss include financial assets held for trading, financial assets at fair value through profit or loss atinception and investment property.
Subordinated liabilities
168

Level 1 Level 2 Level 3 Total
Recognised at fair value through profit or lossBanking 183 178 360Non-life Insurance 7 7
Derivative financial instrumentsBanking 7 5,737 202 5,946Non-life Insurance 1 11 12
Available-for-saleBanking 5,899 1,968 15 7,882Non-life Insurance 1,579 1,156 281 3,016
Total financial instruments 7,668 9,057 499 17,224Investment property
Banking 85 85Non-life Insurance 161 161
Total Investment property 246 246Total 7,668 9,057 745 17,470
Level 1 Level 2 Level 3 Total
Recognised at fair value through profit or lossBanking 152 292 444Non-life Insurance 6 6
Derivative financial instrumentsBanking 10 3,222 212 3,444Non-life Insurance 4 0 4
Available-for-saleBanking 5,632 1,631 21 7,283Non-life Insurance 1,670 917 214 2,800
Total financial instruments 7,468 6,067 446 13,981Investment property
Banking 88 88Non-life Insurance 152 152
Total Investment property 241 241Total 7,468 6,067 687 14,222
Note 74. Recurring fair value measurements by valuation technique
* Comparative figures have been restated as a result of the adoption of IFRS 10 Consolidated Financial Statements.
Financial assets recognised at fair value on 31 Dec. 2014, EURmillion
Financial assets recognised at fair value on 31 Dec. 2013, EURmillion*
169

Level 1 Level 2 Level 3 Total
Recognised at fair value through profit or lossBanking 4 4
Derivative financial instrumentsBanking 57 5,703 130 5,889Non-life Insurance 2 0 2
Total 59 5,707 130 5,896
Level 1 Level 2 Level 3 Total
Recognised at fair value through profit or lossBanking 4 4
Derivative financial instrumentsBanking 35 3,254 131 3,420
Total 35 3,258 131 3,423
OP Financial Group’s Risk Management Control is responsible for approval of new fair value measurement models andtechniques and supervision of the fair value measurement process. Verifying fair values is based, for example, onvaluation using alternative sources for market prices and other input data. In this verification process, valuation pricescan be compared with prices supplied by CSA counterparties and central counterparties. In addition, it is possible touse valuation services provided by third parties.
Level 1: Quoted prices in active markets
Fair value measurement
Pohjola obtains the price of listed derivatives directly from markets. In the fair value measurement of OTC derivatives,Pohjola uses models and techniques commonly used in markets. These are needed, for instance, to create yieldcurves and currency conversion charts and volatility surfaces as well as for option valuation. The input data of thesemodels can generally be derived from markets. In the fair value measurement of some contracts, however, Pohjola hasto use models where input data cannot be observed in the market and therefore they must be assessed. Suchcontracts are included in Level 3.
Banking derivatives
The prices of securities are primarily obtained from market information sources and valued on a daily basis. Somesecurities are subject to less frequent pricing, such as once a month. In such a case, pricing is based on officialvaluations published by brokers, issuers or other market participants or their estimates. Such contracts are included inLevel 3.
This level includes equities listed on major stock exchanges, quoted corporate debt instruments, bonds issued bygovernments and financial institutions with credit rating of at least A-, and exchange-traded derivatives. The fair valueof these instruments is determined on the basis of quotes in active markets.
Pohjola Bank’s Middle Office is responsible for the fair value measurement of Banking derivatives and the quality andreliability of market data, valuation curves and volatility surfaces used in them, as part of its daily fair valuemeasurement process, including the measurement of Level 3 hierarchy. Middle Office compares regularly at contractlevel valuation prices with valuations supplied by CSA counterparties and central counterparties and, whenevernecessary, determine any possible significant valuation differences.
Non-life Insurance’s available-for-sale financial investments
The fair value measurement of OTC derivatives takes account of the credit risk of the parties to a transaction. Creditrisk is adjusted with a Credit Valuation Adjustment (CVA) and with a Debt Valuation Adjustment (DVA). CVA and DVAvaluation adjustments are calculated for each counterparty.
Financial liabilities recognised at fair value on 31 Dec. 2014, EURmillion
Financial liabilities recognised at fair value on 31 Dec. 2013, EURmillion*
170
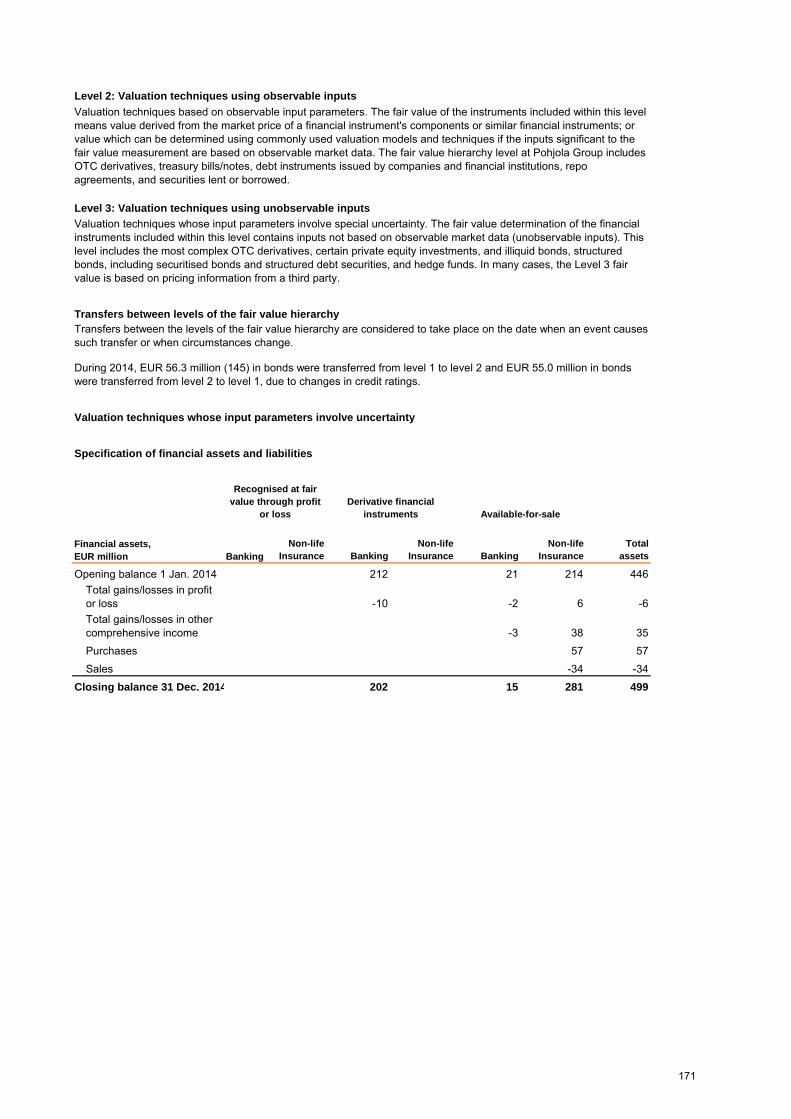
Specification of financial assets and liabilities
BankingNon-life
Insurance BankingNon-life
Insurance BankingNon-life
InsuranceTotal
assets
Opening balance 1 Jan. 2014 212 21 214 446
-10 -2 6 -6
-3 38 35Purchases 57 57Sales -34 -34
Closing balance 31 Dec. 2014 202 15 281 499
Available-for-sale
Level 3: Valuation techniques using unobservable inputs
Recognised at fairvalue through profit
or loss
Level 2: Valuation techniques using observable inputs
Valuation techniques whose input parameters involve special uncertainty. The fair value determination of the financialinstruments included within this level contains inputs not based on observable market data (unobservable inputs). Thislevel includes the most complex OTC derivatives, certain private equity investments, and illiquid bonds, structuredbonds, including securitised bonds and structured debt securities, and hedge funds. In many cases, the Level 3 fairvalue is based on pricing information from a third party.
During 2014, EUR 56.3 million (145) in bonds were transferred from level 1 to level 2 and EUR 55.0 million in bondswere transferred from level 2 to level 1, due to changes in credit ratings.
Financial assets,EUR million
Total gains/losses in othercomprehensive income
Transfers between the levels of the fair value hierarchy are considered to take place on the date when an event causessuch transfer or when circumstances change.
Transfers between levels of the fair value hierarchy
Valuation techniques whose input parameters involve uncertainty
Valuation techniques based on observable input parameters. The fair value of the instruments included within this levelmeans value derived from the market price of a financial instrument's components or similar financial instruments; orvalue which can be determined using commonly used valuation models and techniques if the inputs significant to thefair value measurement are based on observable market data. The fair value hierarchy level at Pohjola Group includesOTC derivatives, treasury bills/notes, debt instruments issued by companies and financial institutions, repoagreements, and securities lent or borrowed.
Derivative financialinstruments
Total gains/losses in profitor loss
171

BankingNon-life
Insurance BankingNon-life
Insurance BankingNon-life
InsuranceTotal
assets
Opening balance 1 Jan. 2013 16 6 190 16 229 457
-16 22 -1 -5 0
6 14 20Purchases 17 17Sales -41 -41Settlements -6 -6
Closing balance 31 Dec. 2013* 212 21 214 446
Financial liabilities, EUR million BankingNon-life
Insurance BankingNon-life
InsuranceTotal
liabilities
Opening balance 1 Jan. 2014 131 131-1 -1
Closing balance 31 Dec. 2014 130 130
Financial liabilities, EUR million BankingNon-life
Insurance BankingNon-life
InsuranceTotal
liabilities
Opening balance 1 Jan. 2013 159 159-28 -28
Closing balance 31 Dec. 2013 131 131
Recognised at fair valuethrough profit or loss
Derivative financialinstruments
Total gains/losses in othercomprehensive income
Financial assets,EUR million
Total gains/losses in profit or loss
Recognised at fair valuethrough profit or loss
Recognised at fairvalue through profit
or loss
Derivative financialinstruments
Total gains/losses in profit or loss
Derivative financialinstruments
Available-for-sale
* Comparative figures have been restated as a result of the adoption of IFRS 10 Consolidated Financial Statements.
Total gains/losses in profitor loss
172

Total gains/losses included in profit or loss by item for the financial year on 31 Dec. 2014
Net interestincome or
net tradingincome
Netinvestment
income
Net incomefrom Non-life
Insurance
Statement ofcomprehensi
ve income/Change infair value
reserve
Realised net gains (losses) 6 6Unrealised net gains (losses) -8 -2 35 24Total net gains (losses) -8 -2 6 35 31
Total gains/losses included in profit or loss by item for the financial year on 31 Dec. 2013*
Net interestincome or
net tradingincome
Netinvestment
income
Net incomefrom Non-life
Insurance
Statement ofcomprehensi
ve income/Change infair value
reserve
Realised net gains (losses) -16 2 -5 -19Unrealised net gains (losses) 50 -3 20 67Total net gains (losses) 34 -1 -5 20 48
No major changes occurred in valuation techniques in 2014.Changes in the levels of hierarchy
Net gains/losses onassets and liabilities
held at year-end
Net gains/losses onassets and liabilities
held at year-endEUR million
EUR million
* Comparative figures have been restated as a result of the adoption of IFRS 10 Consolidated Financial Statements.
Derivatives included in Level 3 comprise structured derivatives for customer needs, whose market risk is covered by acorresponding derivatives contract. The uncovered market risk does not have any effect on earnings. Level 3derivatives relate to structured bonds issued by Pohjola, whose return is determined by the value performance of anembedded derivative instrument. The fair value change of these embedded derivatives is not presented in the abovetable.
173

Liabilities Net balanceSensitivity
analysis
Derivatives
202 -130 72 7.7 11 %Available-for-sale
Illiquid investments 92 92 13.7 15 %Private equity funds** 156 156 15.6 10 %Real estate funds*** 49 49 9.8 20 %
Investment property*** 246 246 49.2 20 %
Balance sheet value, EUR million 31 Dec. 2014 31 Dec. 2013
Given on behalf of own liabilities and commitmentsMortgages 1 1Pledges 4 5Other 981 485
Other collateral givenPledges* 6,273 5,705Total 7,259 6,196
Total collateral givenMortgages 1 1Pledges 6,277 5,711Other 981 485
Total 7,259 6,196
Total collateralised liabilities 474 490
Index-linked bond hedges andstructured derivatives*
* Of which EUR 2,000 million in intraday settlement collateral.
Note 75. Collateral given
Sensitivity analysis of input parameters involving uncertainty
Type of instrument 31 Dec.2014, EUR million
*** In the valuation of real estate funds and investment property, Pohjola mainly uses the income approach whose main components areyield requirement and net rent. A +/– 1 percentage point change in the yield requirement leads on average to around 20% change in thefair value.
** The value of private equity funds depends mainly on the profit performance of portfolio companies and the PE ratios of similar listedcompanies. The Total Value to Paid-in (TVPI) multiple is used to monitor the progress of the fair value of private equity funds. It isestimated that the fair value sensitivity of private equity funds is 10%.
* Following stress scenarios: the combined value change of volatility of shares (30%), dividends of shares (30%), credit risk premiums(30%) and significant correlation changes.
ReceivablesReasonably possible
change in fair value
174

EUR million 31 Dec. 2014 31 Dec. 2013
Fair value of collateral receivedOther 722 359
Total 722 359
The credit risk arising from derivatives is mitigated through collateral, which means the use of ISDA Credit SupportAnnex (CSA) contract associated with the ISDA general agreement. In the collateral system, the counterparty providessecurities or cash in security for the receivable. The amount of CSA-related collateral received in cash totalled EUR722 million on the balance sheet date (359). The Group had no securities received as collateral on the balance sheetdate.
Note 76. Financial collateral held
175

EUR million 31 Dec. 2014 31 Dec. 2013
Guarantees 874 914Other guarantee liabilities 1,578 1,568Loan commitments 4,365 4,728Commitments related to short-term trade transactions 297 247Other 336 359Total off-balance-sheet commitments 7,450 7,816
Derivatives held for trading 31 Dec. 2014
EUR million <1 year 1–5 years >5 years Assets Liabilities
Interest rate derivativesInterest rate swaps 24,618 71,169 39,382 135,169 4,113 4,144 5,037
4,207 21,163 11,936 37,305 697 665 980OTC interest rate options
Call and capsPurchased 3,731 4,555 2,441 10,727 398 2 464Written 2,669 4,022 3,617 10,308 360 6
Put and floorsPurchased 5,480 4,505 2,506 12,492 195 8 275Written 5,903 5,787 1,812 13,503 7 102 51
42,402 90,039 49,759 182,200 4,713 4,617 5,833Interest rate futures 12,461 4,602 17,063 3 14Interest rate options
CallWritten 500 500 0
PutPurchased 2,000 2,000 0
14,961 4,602 19,563 3 15
57,363 94,641 49,759 201,763 4,716 4,632 5,833
Fair values*
Note 77. Off-balance-sheet commitments
Potentialfuture
exposure
Total interest rate derivatives
Total
Note 78. Derivative contracts
Total exchange tradedderivatives
NOTES TO CONTINGENT LIABILITIES AND DERIVATIVES
Nominal values/residual term to maturity
Total OTC interest ratederivatives
Cleared by the centralcounterparty
176

Currency derivatives
13,535 307 65 13,908 276 168 432
360 7,728 5,164 13,252 669 697 1,447Currency options
CallPurchased 188 17 205 4 7Written 226 17 243 5
PutPurchased 496 8 504 11 17Written 426 9 436 8
15,233 8,086 5,229 28,548 961 878 1,90315,233 8,086 5,229 28,548 961 878 1,903
Equity and index derivativesEquity options
CallPurchased 266 271 537 35 0 73
Equity index optionsCall
Purchased 9 9 2 3Written 2 2 0
PutPurchased 2 2 0 0Written 2 2 0
266 285 551 37 1 76
266 285 551 37 1 76
Credit derivativesCredit default swaps 9 73 102 184 12 5 12
9 73 102 184 12 5 12Total credit derivatives
Interest rate and currencyswaps
Total OTC currencyderivatives
Total equity and indexderivatives
Total OTC equity and indexderivatives
Total currency derivatives
Forward exchangeagreements
177

OtherOther swaps 70 794 56 920 67 29 153Other options
CallPurchased 17 11 28 0 3Written 17 17 0
PutPurchased 10 10 2 3Written 10 10 2
123 805 56 984 69 31 159
109 70 0 179 4 36 0Total other derivatives 233 874 56 1,163 73 67 160
73,103 103,959 55,146 232,209 5,800 5,582 7,984
Derivatives held for trading 31 Dec. 2013
EUR million <1 year 1–5 years >5 years Assets Liabilities
Interest rate derivativesInterest rate swaps 19,446 68,860 30,033 118,339 2,231 2,288 3,022
2,350 9,295 4,419 16,065 70 51 183OTC interest rate options
Call and capsPurchased 3,113 5,351 2,119 10,584 173 4 237Written 2,324 5,807 3,099 11,230 0 137 5
Put and floorsPurchased 2,909 6,655 1,667 11,232 230 1 302Written 3,318 7,306 1,094 11,717 0 145 27
31,111 93,979 38,011 163,101 2,634 2,575 3,593Interest rate futures 3,966 6,624 10,591 7 3Interest rate options
PutPurchased 2,000 2,000 0Written 4,000 4,000 1
9,966 6,624 16,591 8 3
41,077 100,603 38,011 179,692 2,642 2,578 3,593
Cleared by the centralcounterparty
Total derivatives held fortrading
Total interest rate derivatives
Total exchange tradedderivatives
Nominal values/residual term to maturity
Total other OTC derivatives
Total
Fair values*
Total OTC interest ratederivatives
Potentialfuture
exposure
Other forward agreementsand futures
178

Currency derivatives
13,644 338 84 14,067 132 143 291
344 1,353 1,303 3,001 160 177 329Currency options
CallPurchased 178 11 189 3 5Written 208 8 217 0 8 0
PutPurchased 167 8 175 1 3Written 101 0 101 1
14,643 1,719 1,387 17,750 296 328 62914,643 1,719 1,387 17,750 296 328 629
Equity and index derivativesEquity index options
CallPurchased 194 582 776 77 135
194 582 776 77 135
194 582 776 77 135
Credit derivativesCredit default swaps 4 99 15 118 13 0 13
4 99 15 118 13 0 13
OtherOther swaps 227 523 166 917 56 30 145Other options
CallPurchased 18 11 29 0 3Written 18 18 0
PutPurchased 9 9 0 1Written 9 9 0
281 534 166 981 56 30 150
109 118 6 233 9 34 1Total other derivatives 390 652 172 1,214 65 64 151
56,307 103,656 39,586 199,549 3,092 2,971 4,521
Forward exchangeagreements
Total OTC currencyderivatives
Total OTC equity and indexderivativesTotal equity and indexderivatives
Total derivatives held fortrading
Other forward agreementsand futures
Interest rate and currencyswaps
Total credit derivatives
Total currency derivatives
Total other OTC derivatives
179

Derivative contracts for hedging purposes – fair value hedge 31 Dec. 2014
EUR million <1 year 1–5 years >5 years Assets Liabilities
Interest rate derivativesInterest rate swaps 1,597 10,671 5,754 18,022 473 564 612
163 2,964 3,072 6,199 165 202 226
1,597 10,671 5,754 18,022 473 564 612Total interest rate derivatives 1,597 10,671 5,754 18,022 473 564 612
Currency derivatives
1,044 942 410 2,396 75 97 163
1,044 942 410 2,396 75 97 1631,044 942 410 2,396 75 97 163
2,642 11,613 6,163 20,418 548 661 776
Derivative contracts for hedging purposes – cash flow hedge 31 Dec. 2014
EUR million <1 year 1–5 years >5 years Assets Liabilities
Interest rate derivativesInterest rate swaps 200 700 900 26 29
400 400 14 16
200 700 900 26 29Total interest rate derivatives 200 700 900 26 29
200 700 900 26 29
2,842 12,313 6,163 21,318 574 661 805
Fair values*
Total OTC interest ratederivatives
Potentialfuture
exposure
Cleared by the centralcounterparty
Potentialfuture
exposure
Total derivative contracts,cash flow hedge
Nominal values/residual term to maturity
Total
Interest rate and currencyswaps
Fair values*
Total OTC currencyderivatives
Total OTC interest ratederivatives
Cleared by the centralcounterparty
Total currency derivatives
Total derivative contracts,fair value hedge
Total
Total derivative contractsheld for hedging
Nominal values/residual term to maturity
180

Derivative contracts for hedging purposes – fair value hedge 31 Dec. 2013
EUR million <1 year 1–5 years >5 years Assets Liabilities
Interest rate derivativesInterest rate swaps 2,248 11,378 5,060 18,686 335 242 453
40 1,139 601 1,779 5 17 20
2,248 11,378 5,060 18,686 335 242 453Total interest rate derivatives 2,248 11,378 5,060 18,686 335 242 453
Currency derivatives
1,628 803 137 2,567 46 83 113
1,628 803 137 2,567 46 83 1131,628 803 137 2,567 46 83 113
3,876 12,181 5,197 21,254 381 325 565
Derivative contracts for hedging purposes – cash flow hedge 31 Dec. 2013
EUR million <1 year 1–5 years >5 years Assets Liabilities
Interest rate derivativesInterest rate swaps 200 800 1,000 21 1 25
200 200 0 1 1
200 800 1,000 21 1 25Total interest rate derivatives 200 800 1,000 21 1 25
200 800 1,000 21 1 25
4,076 12,981 5,197 22,254 402 326 590
Total OTC interest ratederivatives
Total derivative contractsheld for hedging
Total derivative contracts,fair value hedge
Total
Total
Nominal values/residual term to maturity
Cleared by the centralcounterparty
Cleared by the centralcounterparty
Nominal values/residual term to maturity
Fair values*
Fair values*
Total OTC interest ratederivatives
Total OTC currencyderivatives
Potentialfuture
exposure
Potentialfuture
exposure
Interest rate and currencyswaps
Total currency derivatives
Total derivative contracts,cash flow hedge
181

EUR million <1 year 1–5 years >5 years Assets Liabilities
Interest rate derivatives 59,160 106,012 55,513 220,684 5,215 5,196 6,475
4,370 24,526 15,008 43,904 876 867 1,222Currency derivatives 16,277 9,028 5,639 30,944 1,036 975 2,066
266 285 551 37 1 76Credit derivatives 9 73 102 184 12 5 12Other derivatives 233 874 56 1,163 73 67 160Total derivatives 75,945 116,272 61,310 253,527 6,374 6,243 8,788
EUR million <1 year 1–5 years >5 years Assets Liabilities
Interest rate derivatives 43,525 112,782 43,071 199,378 2,997 2,821 4,071
2,390 10,634 5,020 18,044 76 69 204Currency derivatives 16,270 2,522 1,524 20,317 342 412 742
194 582 776 77 135Credit derivatives 4 99 15 118 13 0 13Other derivatives 390 652 172 1,214 65 64 151Total derivatives 60,383 116,637 44,783 221,803 3,494 3,297 5,112
* Fair values include accrued interest which is shown under other assets or provisions and other liabilities. In addition, the fair value ofderivatives for central counterparty clearing is offset in the balance sheet.
Cleared by the centralcounterparty
Equity and index-linkedderivatives
Fair values*
Interest rate derivatives for central counterparty clearing are offset in the balance sheet. Note 79 below presents theeffects of netting. Other derivative contracts are presented on a gross basis in the balance sheet. In capital adequacymeasurement, Pohjola Group also applies netting of derivatives. Note 60 above presents the effects of netting. Nettingwould reduce the credit equivalent of Pohjola Bank plc’s derivative contracts by EUR 6,233 million (3,381).
Total
Potentialfuture
exposure
Cleared by the centralcounterparty
Total derivative contracts 31 Dec. 2013
Total derivative contracts 31 Dec. 2014
Nominal values/residual term to maturity
Equity and index-linkedderivatives
Total
Potentialfuture
exposure
Nominal values/residual term to maturity Fair values*
182

Net amountpresented inthe balance
sheet**Financialassets***
Collateralreceived Net amount
Banking derivatives 6,817 -871 5,946 -4,008 -722 1,216
12 12 -1 11Total derivatives 6,829 -871 5,958 -4,009 -722 1,227
Net amountpresented inthe balance
sheet**Financialassets***
Collateralreceived Net amount
Banking derivatives 3,515 -71 3,444 -2,393 -359 691
4 4 4Total derivatives 3,518 -71 3,447 -2,393 -359 695
Net amountpresented inthe balance
sheet**Financial
liabilities***Collateral
given Net amount
Banking derivatives 6,751 -862 5,889 -4,008 -862 1,019
2 2 -1 2Total derivatives 6,753 -862 5,892 -4,009 -862 1,020
Gross amountof financial assets
deducted fromfinancial liabilities*
Note 79. Financial assets and liabilities offset in the balance sheet or subject toenforceable master netting arrangements or similar agreements
31 Dec. 2014,EUR million
Financial assets not set offin the balance sheet
Gross amountof financial liabilities
Gross amountof financial assets
Financial assets not set offin the balance sheet
Financial liabilities offset in the balance sheet or subject to enforceable master netting arrangements orsimilar agreements
Financial assets offset in the balance sheet or subject to enforceable master netting arrangements or similaragreements
Gross amountof financial liabilities
deducted fromfinancial assets*
Gross amountof financial liabilities
deducted fromfinancial assets*
Non-life Insurancederivatives
31 Dec. 2013,EUR million
Gross amountof financial assets
Non-life Insurancederivatives
Non-life Insurancederivatives
Financial liabilities not setoff in the balance sheet
31 Dec. 2014,EUR million
183

Net amountpresented inthe balance
sheet**Financial
liabilities***Collateral
given Net amount
Banking derivatives 3,484 -64 3,420 -2,393 -408 619Total derivatives 3,484 -64 3,420 -2,393 -408 619
*** It is Pohjola Bank plc’s practice to enter into master agreements for derivative transactions with all derivative counterparties.
Insurance companies belonging to the Group underwrite insurance policies through pools. Pool members are primarilyresponsible for their own proportionate share of the risk. Proportionate shares are based on contracts confirmedannually. In certain pools, pool members are responsible for an insolvent member's liabilities in proportion to theirshares in the pool. Group insurance companies recognise liabilities and receivables based on joint liability if jointliability is likely to materialise.
Central counterparty clearing for OTC derivatives
Note 80. Contingent liabilities and assets
* Incl. daily cleared derivatives on a net basis included in cash and cash equivalents, totalling 9 million euros (8).
Financial liabilities not setoff in the balance sheet
31 Dec. 2013,EUR million
Gross amountof financial liabilities
Gross amountof financial assets
deducted fromfinancial liabilities*
** Fair values excluding accrued interest.
In anticipation of entry into force of central counterparty clearing required by the European Market InfrastructureRegulation (Regulation (EU) No. 648/2012), Pohjola Bank plc adopted in February 2013 central counterparty clearingin London Clearing House for new interest rate derivatives covering standardised OTC derivative transactions enteredinto with financial counterparties. Bassed on this model, the central counterparty will become the derivativescounterparty at the end of the daily clearing process, with whom daily payments for derivatives are netted. In addition,collateral is paid or received daily, which corresponds to the change in the fair value of open positions (variationmargin). Interest rate derivatives cleared by the central counterparty are presented on a net basis in the balance sheet.
The ISDA Master Agreement or the Master Agreement of the Federation of Finnish Financial Services or Pohjola Bankplc will apply to derivative transactions between Pohjola Bank plc and other clients and to derivative transactions towhich central counterparty clearing in accordance with the Regulation does not pertain. On the basis of theseagreements, derivative payments may be netted per transaction on each payment date and in the event ofcounterparty default and bankruptcy. It is also possible to agree on collateral on a counterparty-specific basis in theterms and conditions of the agreement. Such derivatives are presented on a gross basis in the balance sheet.
Other bilaterally cleared OTC derivative contracts
184
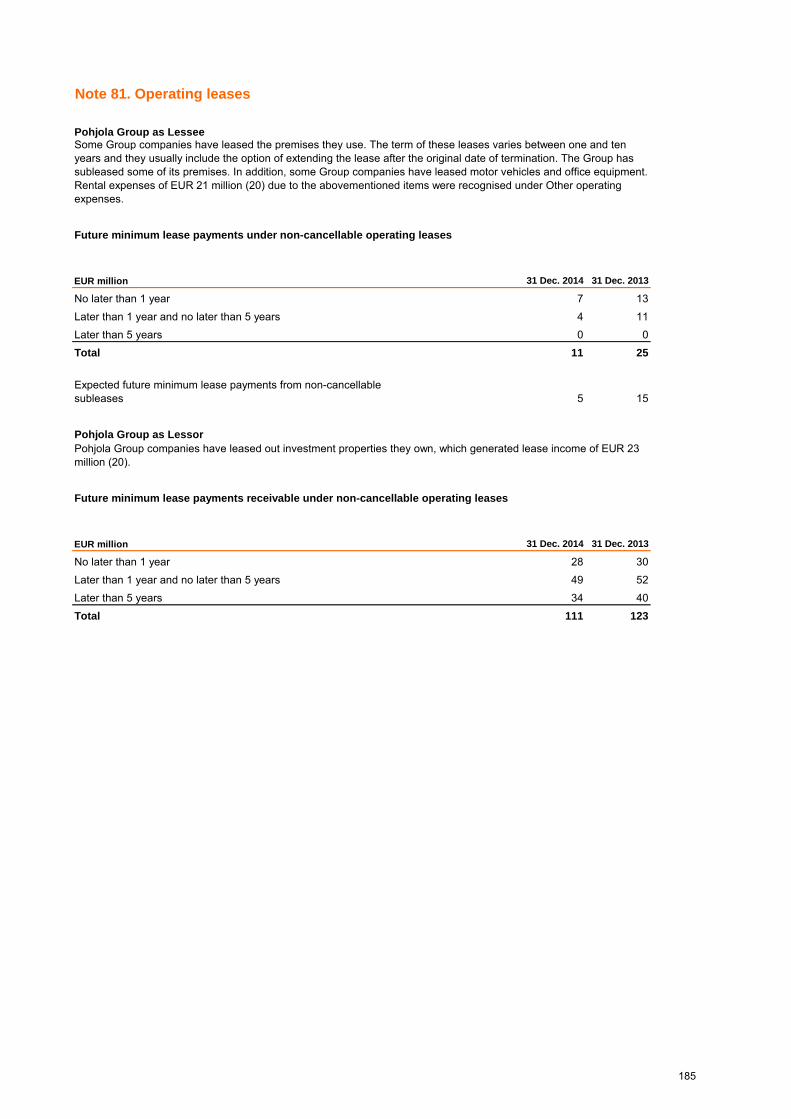
Future minimum lease payments under non-cancellable operating leases
EUR million 31 Dec. 2014 31 Dec. 2013
No later than 1 year 7 13Later than 1 year and no later than 5 years 4 11Later than 5 years 0 0Total 11 25
5 15
Future minimum lease payments receivable under non-cancellable operating leases
EUR million 31 Dec. 2014 31 Dec. 2013
No later than 1 year 28 30Later than 1 year and no later than 5 years 49 52Later than 5 years 34 40Total 111 123
Pohjola Group as Lessee
Pohjola Group companies have leased out investment properties they own, which generated lease income of EUR 23million (20).
Pohjola Group as Lessor
Some Group companies have leased the premises they use. The term of these leases varies between one and tenyears and they usually include the option of extending the lease after the original date of termination. The Group hassubleased some of its premises. In addition, some Group companies have leased motor vehicles and office equipment.Rental expenses of EUR 21 million (20) due to the abovementioned items were recognised under Other operatingexpenses.
Note 81. Operating leases
Expected future minimum lease payments from non-cancellablesubleases
185

Material subsidiaries included in the consolidated financial statements in 2014 and 2013
Company (2014) Domicile% of share-
holding % of votes
A-Insurance Ltd Helsinki 100 100Eurooppalainen Insurance Company Ltd Helsinki 100 100Omasairaala Oy Helsinki 100 100Pohjola Asset Management Ltd* Helsinki 100 100 xPohjola Finance Estonia AS Estonia 100 100 xPohjola Finance SIA Latvia 100 100 xPohjola Insurance Ltd Helsinki 100 100Pohjola Property Management Ltd* Helsinki 100 100Seesam Insurance AS Estonia 100 100UAB Pohjola Finance Lithuania 100 100 x
* Discontinued operation
Company (2013) Domicile% of share-
holding % of votes
A-Insurance Ltd Helsinki 100 100Eurooppalainen Insurance Company Ltd Helsinki 100 100Omasairaala Oy Helsinki 100 100Pohjola Asset Management Ltd Helsinki 100 100 xPohjola Finance Estonia AS Estonia 100 100 xPohjola Finance SIA Latvia 100 100 xPohjola Health Ltd Helsinki 100 100Pohjola Insurance Ltd Helsinki 100 100Pohjola Property Management Ltd Helsinki 100 100Seesam Insurance AS Estonia 100 100UAB Pohjola Finance Lithuania 100 100 x
The number of other subsidiaries included in the consolidated financial statements was 14, in addition to materialsubsidiaries.
The number of other subsidiaries included in the consolidated financial statements was 13, in addition to materialsubsidiaries.
Pohjola Health Ltd merged into Pohjola Insurance Ltd. Pohjola Property Management Ltd established a new subsidiary,Suomi Toimitilakiinteistöt GP Oy. The financial year saw no reductions in the ownership interests in subsidiaries.
Material subsidiaries include companies whose business is subject to licence and other companies relevant tobusiness operations. All major consolidated subsidiaries are wholly owned and accordingly they have no material non-controlling interests.
Company belongs to theconsolidation group with
respect to capital adequacy
Note 82. Ownership interests in subsidiaries, structured entities and jointoperations
Changes in subsidiaries and associates in 2014
Company belongs to theconsolidation group with
respect to capital adequacy
186

Structured entities included in the consolidated financial statements
NamePlace of
businessInterest, %
2014Interest, %
2013
Non-controlling
interests, %
Real Estate Funds of Funds II Ky Helsinki 22.2 22.2 77.8Real Estate Fund Finland III Ky Helsinki 33.3 33.3 66.7
Balance sheet in summary
EUR million 2014 2013 2014 2013
Cash and cash equivalents 6 0 2 5Investments 65 80 53 55Total assets 72 81 55 60Financial liabilitiesTotal liabilitiesNet assets (100%) 72 81 55 60Accrued share of non-controlling interests 55 62 37 40
Statement of comprehensive income in summary
Net sales 11 4 5 3Profit or loss of continuing operations after tax 10 3 1 3Other comprehensive income 1 2Comprehensive income (100%) 11 5 1 3Comprehensive income attributable to non-controlling interests 8 4 1 2Share of profit paid to non-controlling interests 5 2 4
Real Estate Funds of FundsII Ky
Real Estate Fund Finland IIIKy
Real estate fund
Pohjola Group acts as an investor in various mutual funds in order to gain investment income. The consolidatedfinancial statements of Pohjola Group include the accounts of two (2) real estate funds. These funds that have beenclassified as structured entities because Pohjola Group's control is not based on votes but the control of significantoperations, exposure to variable returns from the fund, and organising the fund's management. These funds alsoinvolve non-controlling interests.
The table below presents a summary of financial information on subsidiaries with a significant proportion of non-controlling interests. The financial information corresponds to the figures presented in the financial statements of thesubsidiaries to which, for example, fair value adjustments have been made to correspond to Pohjola Group'saccounting policies. The figures below are before the elimination of internal transactions.
Main line of business
Real estate fund
Pohjola Group companies have no agreements on giving financial support to structured entities included in theconsolidated financial statements. Such support was not given during the financial year.
Summary of financial information on subsidiaries with a significant proportion of non-controlling interests
The table below shows companies with non-controlling interests.
187
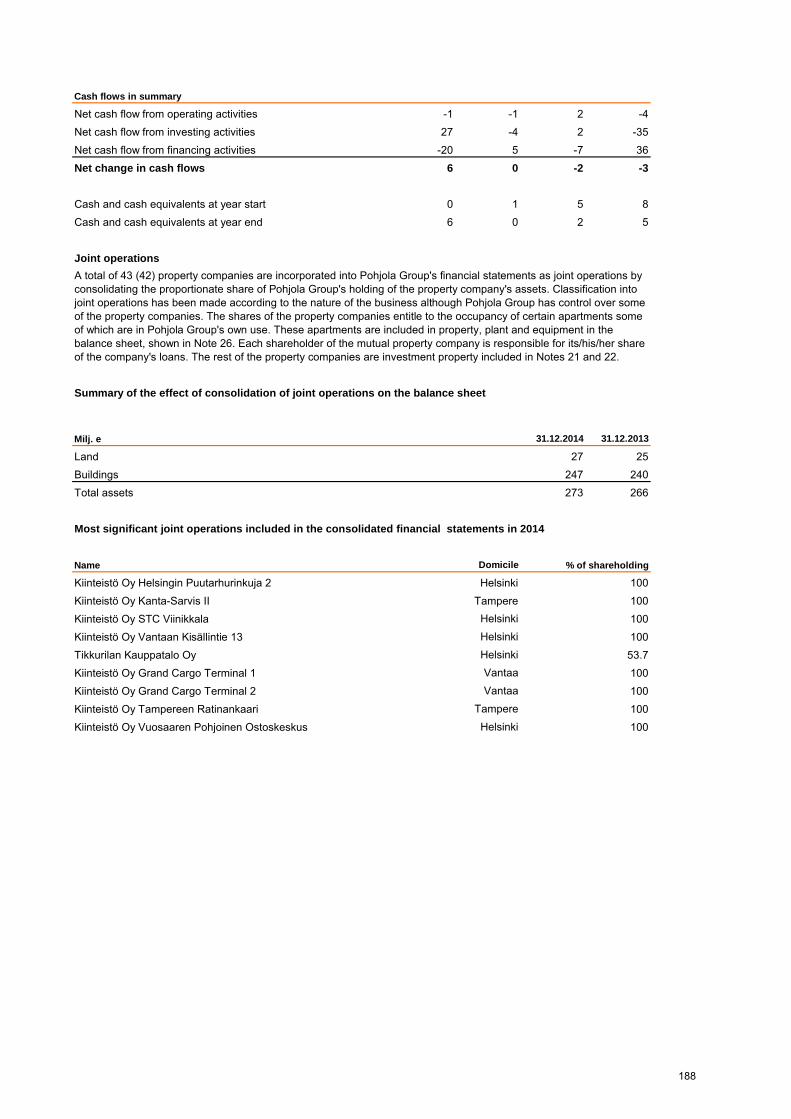
Cash flows in summary
Net cash flow from operating activities -1 -1 2 -4Net cash flow from investing activities 27 -4 2 -35Net cash flow from financing activities -20 5 -7 36Net change in cash flows 6 0 -2 -3
Cash and cash equivalents at year start 0 1 5 8Cash and cash equivalents at year end 6 0 2 5
Joint operations
Milj. e 31.12.2014 31.12.2013
Land 27 25Buildings 247 240Total assets 273 266
Most significant joint operations included in the consolidated financial statements in 2014
Name Domicile
Kiinteistö Oy Helsingin Puutarhurinkuja 2 Helsinki 100Kiinteistö Oy Kanta-Sarvis II Tampere 100Kiinteistö Oy STC Viinikkala Helsinki 100Kiinteistö Oy Vantaan Kisällintie 13 Helsinki 100Tikkurilan Kauppatalo Oy Helsinki 53.7Kiinteistö Oy Grand Cargo Terminal 1 Vantaa 100Kiinteistö Oy Grand Cargo Terminal 2 Vantaa 100Kiinteistö Oy Tampereen Ratinankaari Tampere 100Kiinteistö Oy Vuosaaren Pohjoinen Ostoskeskus Helsinki 100
A total of 43 (42) property companies are incorporated into Pohjola Group's financial statements as joint operations byconsolidating the proportionate share of Pohjola Group's holding of the property company's assets. Classification intojoint operations has been made according to the nature of the business although Pohjola Group has control over someof the property companies. The shares of the property companies entitle to the occupancy of certain apartments someof which are in Pohjola Group's own use. These apartments are included in property, plant and equipment in thebalance sheet, shown in Note 26. Each shareholder of the mutual property company is responsible for its/his/her shareof the company's loans. The rest of the property companies are investment property included in Notes 21 and 22.
% of shareholding
Summary of the effect of consolidation of joint operations on the balance sheet
188

Most significant joint operations included in the consolidated financial statements in 2013
Name Domicile
Kiinteistö Oy Helsingin Puutarhurinkuja 2 Helsinki 100Kiinteistö Oy Kanta-Sarvis II Tampere 100Kiinteistö Oy STC Viinikkala Helsinki 100Kiinteistö Oy Vantaan Kisällintie 13 Helsinki 100Tikkurilan Kauppatalo Oy Helsinki 53.7Kiinteistö Oy Grand Cargo Terminal 1 Vantaa 100Kiinteistö Oy Grand Cargo Terminal 2 Vantaa 100Kiinteistö Oy Tampereen Ratinankaari Tampere 100
Interests in unconsolidated structured entities
EUR million 2014 2013
Non-life Insurance assets 294 329Total investments in mutual funds 294 329
% of shareholding
OP Fund Management Company Ltd within OP Financial Group manages OP Mutual Funds. OP Fund ManagementCompany Ltd uses Pohjola Asset Management Ltd as the portfolio manager for many of the mutual funds it manages.In addition, Pohjola Property Management Ltd within OP Financial Group manages several real estate funds. In manyfunds, the fund management company controls significant operations by making investment decisions in accordancewith the fund rules. OP Financial Group companies have no interests in the funds managed by the abovementionedcompanies that would significantly expose OP Financial Group to the variable returns on the investment and wouldthereby cause a consolidation obligation.
Pohjola Group's investments in OP Mutual Funds and the funds of Pohjola Property Management Ltd have beenrecognised in Non-life Insurance assets and investment property in the balance sheet. Pohjola Group's risk of loss islimited to the investment's balance sheet value.
The consolidated financial statements include the share of assets and related liabilities under joint control.
189

Related-party transactions in 2014
EUR millionParent
company Associates
Adminis-trative
personnel Others*
Loans 2 2,535Other receivables 11 207Deposits 191 0 800Other liabilities 0 461
Interest income 0 0 205Interest expenses 3 290Dividend income 0 14Net income from Non-life Insurance 4Net commissions and fees 7 0 17Net trading income -108Other operating income 0 8Operating expenses 16 150
Contingent liabilities and derivativesOff-balance-sheet commitments
Guarantees 79Other guarantee liabilities 7Loan commitments
Derivative contractsNominal values 2 20,227Credit equivalents 0 154
.Salaries, other short-term benefits and performance-based pay 1
Related-party holdingsNumber of shares
Pohjola Group's related parties comprise its parent company OP Financial Group Central Cooperative, subsidiariesconsolidated into the Group, associates and administrative personnel and other related-party entities. The list ofPohjola Group's associates can be found in Note 24. Pohjola Group's administrative personnel comprises PohjolaBank plc's President and CEO, members of the Board of Directors and their close family members. Related partiesalso include companies over which a person among administrative personnel or his close family member exercisessignificant influence. Other related-party entities include OP Pension Fund, OP Pension Foundation and sistercompanies within OP Financial Group Central Cooperative Consolidated.
OTHER NOTES
Normal loan terms and conditions apply to loans granted to related parties. These loans are tied to generally usedreference rates.
Salaries, other short-term benefits and performance-basedpay
Note 83. Related-party transactions
319,551,415
190

Related-party transactions in 2013
EUR millionParent
company Associates
Adminis-trative
personnel Others*
Loans 3 4,335Other receivables 7 215Deposits 71 0 664Other liabilities 0 436
Interest income 0 0 183Interest expenses 3 250Dividend income 0 6Net income from Non-life Insurance 5Net commissions and fees 0 0 0 15Net trading income 119Other operating income 0 7Operating expenses 17 131
Contingent liabilities and derivativesOff-balance-sheet commitments
Guarantees 74Other guarantee liabilities 6Loan commitments 20 171
Derivative contractsNominal values 3 16,884Credit equivalents 0 94
.Salaries, other short-term benefits and performance-based pay 2
Related-party holdingsNumber of shares 150,359 6,612,043
Salaries, other short-term benefits and performance-basedpay
118,992,151
* Other related-party entities include OP Bank Group Pension Fund, OP Bank Group Pension Foundation and their sister companieswithin OP Cooperative Consolidated.
191

Reijo Karhinen, Chairman EUR 90,150Tony Vepsäläinen, Vice Chairman EUR 70,950Board members:Jukka Hienonen ( until 7 Oct. 2014) EUR 56,450Jukka Hulkkonen (until 7 Oct. 2014) EUR 54,250Mirja-Leena Kullberg (until 7 Oct. 2014) EUR 53,700Marjo Partio (until 7 Oct. 2014) EUR 52,050Harri Sailas (until 7 Oct. 2014) EUR 55,350Tom von Weymarn (until 7 Oct. 2014) EUR 64,350Harri Luhtala (since 8 Oct. 2014) EUR 0Erik Palmén (since 8 Oct. 2014) EUR 0
Jouko Pölönen, President and CEO EUR 450,491*
Mikael Silvennoinen, President and CEO (until 14 Nov. 2013) EUR 175,716**
* Includes salaries and bonuses paid to the President and CEO for 2014. Includes a portion of the amount paid in 2014 and earned in2013 based on the short-term remuneration scheme. Of the remaining portion of the 2013 bonus, EUR 33,600 has been deferred forpayment between 2015 and 2016. Payment of deferred amounts requires a Board decision. Detailed information on the defermentprocedure can be found in Note 84 below.
In the financial year 2014, the members of the Board of Directors did not receive any share-based payments from theCompany.
Salaries and performance-based bonuses paid to the President and CEO and his deputy in the financial year ending31 December 2014 were as follows:
Board member fees 2014
Monthly fees and attendance allowance paid to Board members in 2014 totalled EUR 497,250 The Chairman’s monthlyemoluments totalled EUR 8,000, the Vice Chairman’s EUR 5,500 and other members’ EUR 4,500. An additionalmonthly emolument of 1,000 euros is paid to a Board committee chair who is not the Chairman or Vice Chairman of theBoard. All Board members received an attendance allowance of EUR 550 for each meeting. Monthly Boardemoluments are treated as pensionable salary.
The period of notice applicable under the President and CEO’s executive contract is six months. According to thiscontract, the Company must pay the President and CEO severance pay equalling his 12-month total salary, in additionto compensation for loss of office, if the Company dismisses him or he has to resign or terminate the contract due to areason attributable to the Company. In case the executive contract terminates due to reasons attributable to theCompany, the President and CEO will be entitled to bonuses under the short- and long-term incentive schemes for theyear of contract termination, provided that the schemes’ performance criteria and the criteria for payment under theschemes’ terms and conditions are fulfilled and his executive contract has been effective throughout the performanceyear. In addition, the President and CEO belongs to the long-term management incentive scheme (2014–16), underwhich bonuses will be paid from 2018 until 2020. He has unlimited company car benefit.
** Includes salaries and bonuses earned by the President and CEO that were paid in 2014. Includes the amounts earned for theperformance period of 2011–12 under the short-term incentive scheme and paid in 2014.
The Annual General Meeting approved the following Board emoluments:
192

EUR 1,000 2014 2013 2014 2013
Jouko Pölönen, President and CEO 60 49
Mikael Silvennoinen, President and CEO (until 14 Nov. 2013) 3 87 68 62
* IFRS expense has been used for the portion of the TyEL defined benefit plan and the equalisation portion of an employee’scontribution less the employee’s portion of the contribution has been used for the defined contribution plan.
The Group’s previous long-term management incentive scheme (2008–10) applied to Pohjola Bank plc’s President andCEO, Senior Vice Presidents, Executive Vice Presidents, heads of departments and those in charge of separatelydefined managerial, supervisory and expert duties. On 31 December 2010, the scheme covered 136 people. TheBoard of Directors confirmed the inclusion of the President and CEO and members of the Executive Committee in thescheme, and the selection principles with respect to other people in the scheme. Pohjola Group’s Executive Committeeconfirmed the selection of the other people in the scheme.
Those included in the long-term management incentive scheme had the opportunity to receive Pohjola Bank plc sharesas annual bonuses, provided that the Company achieved the targets based on its strategy set for the year in question.Those covered by the scheme will receive shares (after tax) they have earned in three years’ time following thebeginning of the performance year.
Terminated long-term management incentive scheme in 2010 and before
Pension obligations regarding President and CEO and Board members
Pension costs under TyELplan*
Note 84. Variable remuneration
Personnel fund
Equity-settled and cash-settled bonus payments were recognised as personnel cost over the performance period until2013. Expenses charged under the scheme for 2013 amounted to EUR 1.2 million (1.4).
IFRS expense of voluntarysupplementary pension
Payment of profit-based bonuses to OP Personnel Fund in 2014 was based on the achievement of the followingtargets: OP Financial Group's EBT and CET1, both having a weight of 30%, and growth in the number of loyalcustomers with a weight of 40%. Profit-based bonuses for 2014 transferred to the Fund account for about 4.2% (4.6%)of the combined salaries and wages earned by the Fund’s members. The bonuses recognised in 2014 totalled EUR 2.9million (5.9).
On 26 October 2004, Pohjola Bank plc joined OP Personnel Fund. On 31 December 2014, the Fund had some 1,990Pohjola Group employees. The Personnel Fund covers all those not included in the management incentive scheme orBaltic operations.
The CEO employment contract does not stipulate any specific retirement age for the President and CEO. ThePresident and CEO is covered by TyEL (the Finnish Employees Pensions Act) which provides pension benefits basedon the years of employment and earnings as prescribed in the Act. The retirement age is 63–68 years, depending onhis choice. In addition to the statutory pension scheme, President and CEO Mikael Silvennoinen was covered by OPBank Group Pension Foundation’s supplementary pension scheme. Under that scheme, the retirement age applied tothe President and CEO is 64 years. Pension accrued under the supplementary pension scheme may begin to be paidout as a paid-up pension before the old-age pension, if employment with OP Financial Group terminates. In such acase, the minimum retirement age for men is 57 years. No supplementary pension scheme applies to President andCEO Pölönen. Board members’ attendance allowances are treated as pensionable salary. More detailed information onPohjola Group’s pension arrangements can be found in Note 35 Provisions and other liabilities.
193

Valid long-term management incentive schemes
- Growth in the number of customers using OP as the main bank and insurer
The Supervisory Board of OP Cooperative shall determine the performance metrics for the scheme and targets set forthem separately for each performance period. The targets for the 2011–2013 scheme were based on the followingcriteria:
Pohjola Bank plc’s directors and designated persons in key positions are included in the long-term management share-based incentive scheme whom the Supervisory Board of OP Cooperative has appointed. The 2011–13 schemecovered a total of 52 (59) persons and the 2014–16 42 persons.
- Return on economic capital- Change in the market share of corporate customer business
The bonus is determined by the management position. If the set targets are annually achieved at 100%, themanagement and key employees will be entitled to a bonus equalling their regular 2–12-month salary subject to PAYEtax.
Pohjola belongs to the long-term incentive scheme within OP Financial Group, which has OP Financial Group leveltargets. These targets conform to those of OP Personnel Fund for all of the Group’s personnel.
OP Financial Group’s variable remuneration principles take account of the Group’s risk exposure and risk managementmethods. The performance indicator targets have been set at a level that does not encourage excessive risk-taking.Long-term variable remuneration is based on reaching OP Financial Group’s targets, whereas short-term variableremuneration is based on how an individual Group company or business unit reaches its targets. The maximumamount of remuneration is limited in all schemes.
The scheme consists of consecutive three-year performance periods, the first of which is 1 January 2011–31December 2013. The bonus for the 2011–13 performance period will be paid after a deferral period in three equalinstalments by the end of each June in 2015–17. The second performance period is 1 January 2014–31 December2016 and the bonuses will be paid after a deferall period in three equal instalments by the end of June in 2018–20.
The target bonus was determined at the beginning of the 2011–13 scheme, i.e. the maximum remuneration in terms ofPohjola Bank plc Series A shares. This target bonus for the 2011–13 performance period was 1.2 million shares whichwould be partly based on cash-settled payments (the amount of tax withheld) and equity-settled payments. OPCooperative executed a public voluntary bid for all Series A and K shares issued by Pohjola Bank plc and not held byOP Cooperative. As a result, the bonus payout for the performance period of 2011–13 applies the scheme’s conditionunder which bonuses will be fully paid in cash if any of Pohjola’s shareholders has the right, under Chapter 18, Section1 of the Limited Liability Companies Act, to redeem (right of squeeze-out) the shares on the grounds that theshareholder has more than 90% of the company’s shares and of the votes conferred by the shares. Bonuses that wereto be paid as a combination of Pohjola’s series A shares and cash will be paid in cash in 2015, 2016 and 2017according to the original payout schedule. The bonus was converted into cash by multiplying the number of shares bythe redemption price.
Long-term scheme
Pohjola belongs to the long-term incentive scheme within OP Financial Group, which has OP Financial Group leveltargets. These targets conform to those of OP Personnel Fund for all of the Group’s personnel.
Provided that the targets are achieved at the maximum levels set for them for the 2014–16 scheme, those included inthe scheme have the opportunity to receive annually a bonus equalling their 2–8-month regular salary subject to PAYEtax. The bonus amount depends on the achievement of the target after the performance period and will be paid in threeequal instalments in 2018–20. Bonuses that may be paid under the scheme will be paid in terms of debentures issuedby OP. The earned euro bonus will be converted into the number of debentures once the outcome of thescheme is known. An amount paid in cash will be deducted from the bonus to cover related taxes and fiscal charges.
194

Identified staff in Pohjola Group include managing directors and other key management personnel, other people with amajor impact on the company’s risk exposure, Internal Control and other designated persons or special groups.
Bonuses will be paid to their beneficiaries provided that OP Group’s capital adequacy ratio under the Act on theSupervision of Financial and Insurance Conglomerates is 1.3 or higher on the bonus payout date and that the personwithin the scheme is employed by OP Financial Group up to the payout date.
In the 2011–13 scheme, shares were accounted for as equity-settled payments in Pohjola Group. Due to the change inthe method of payment under the scheme, the scheme's accounting treatment has been changed to correspond totreatment of employee benefits under IAS 19. Expenses for both schemes are recognised from the beginning of theperformance period up to the date of payment (vesting period) as personnel costs, and the equivalent liability isrecognised under deferred expenses. A liability recognised under the scheme amounted to EUR 5.6 million on 31December 2014.
The payment of variable remuneration has been prescribed in the Act on Credit Institutions (610/2014). If a person iscategorised on the basis of his duties as belonging to a group that may cause considerable risk (identified staff) to hiscompany, the company may defer the payment of variable remuneration over three years under certain conditions.
In short-term schemes, the performance period is one calendar year and the bonus is primarily paid in cash. The short-term incentive schemes are based on performance and other business targets specified for each business unit,covering all Pohjola Group’s staff.
OP Cooperative's Supervisory Board manages the long-term scheme and supervises compliance with it. TheSupervisory Board may exercise discretion to change the terms and conditions of the scheme and postpone bonuspayments for compelling reasons.
Short-term incentive schemes
Deferral of variable remuneration
If the euro maximum for deferral is exceeded, some bonus is paid immediately, while the rest is deferred and thedeferred bonus will be paid in equal instalments within the next three years. In such a case of deferral, any short-termscheme bonuses are always paid half in cash and half as debenture loans issued by OP.
In setting targets for the 2014–16 scheme, OP has taken account of the Capital Requirements Directive IV (CRD IV) ofthe European Parliament and of the Council, which will limit the maximum variable remuneration to the amount of aperson’s annual fixed remuneration. The targets for the 2014–16 are based on the following criteria:- OP Financial Group's earnings before taxes- OP Financial Group's CET1- Growth in the number of customers using OP as their main bank and insurer
The deferment of variable remuneration payment applies to identified staff if their variable remuneration for a 12-monthperformance period exceeds EUR 50,000 – the maximum recommended by the Financial Supervisory Authority – ortwo months’ fixed gross salary above this amount. The remuneration of the identified staff is reviewed up to the EUR50,000 deferment limit as a whole, considering both long- and short-term remuneration.
Expenses for the schemes are recognised from the beginning of the performance period up to the date of payment(vesting period) as personnel costs, and the equivalent liability is recognised under deferred expenses.
195

Expenses recognised for variable remuneration*
EUR million 2014 2013
Personnel fund 3 6Short-term schemes 14 12Previous long-term schemes
Schemes for 2008–10 1Revamped long-term schemes
Scheme for 2011 13 1 1Scheme for 2014 16 1
Total 18 20
The figures in the table above includes expenses relating to discontinued operations of 3 million euro (3).
* Excl. social expenses
196

Parent Company Financial Statements, FAS
EUR million 2014 2013Interest income 1 903 1 740Net lease income 27 27Interest expenses -1 680 -1 545Net interest income 249 222Income from equity investments 237 184
From subsidiaries 195 158From affiliates 3 3From other companies 38 23
Commissions and fees 152 133Commission expenses -46 -43Net income from securities and foreign exchange trading 83 102
Net income from securities trading 47 76Net income from foreign exchange trading 36 26
Net income from available-for-sale financial assets 13 15Net income from hedge accounting -2 -1Net income from investment property -1 0Other operating income 21 21Administrative expenses -137 -128
Personnel costs -62 -62Wages and salaries -51 -51Social expenses -11 -11
Pension costs -8 -8Other social expenses -3 -2
Other administrative expenses -75 -66Depreciation/amortisation and write-downs on tangible and intangible assets -11 -11Other operating expenses -46 -40Impairment losses on loans and other commitments -25 -38Operating profit 486 417Appropriations -3 -86Income taxes -58 -52
Taxes for the financial year -41 -38Taxes for previous financial years -23 0Change in deferred taxes 6 -14
Profit from operations after taxes 425 279Profit for the financial year 425 279
Financial Statements
Income statement
197

Assets
EUR million 31 Dec. 2014 31 Dec. 2013Cash and cash equivalents 3 774 2 046Notes and bonds eligible for refinancing with central banks 7 825 7 368
Treasury bills Other 7 825 7 368
Receivables from credit institutions 10 066 9 676Repayable on demand 481 620Other 9 584 9 056
Receivables from the public and public sector entities 14 393 13 398Repayable on demand Other 14 393 13 398
Lease assets 1 152 1 153Notes and bonds 714 695
From public sector entities 29 4From other 685 691
Shares and participations 63 82Shares and participations in affiliates 32 32Shares and participations in subsidiaries 1 250 1 249Derivative contracts 5 395 3 332Intangible assets 51 49Tangible assets 15 17
Investment property and shares and participations in investment property 9 10Other property and shares and participations in property companies 3 3Other tangible assets 3 3
Other assets 1 879 847Deferred income and advances paid 659 722Deferred tax assets 8 8
Total assets 47 274 40 675
Balance sheet
198

Liabilities
31 Dec. 2014 31 Dec. 2013LiabilitiesLiabilities to credit institutions 5 241 4 789
Central banks 250Credit institutions 4 991 4 716
Repayable on demand 898 725Other 4 094 3 992
Liabilities to the public and public sector entities 11 668 10 343Deposits 9 406 7 660
Repayable on demand 7 726 5 995Other 1 680 1 665
Other liabilities 2 262 2 683Repayable on demand 8 10Other 2 254 2 674
Debt securities issued to the public 17 980 16 255Bonds 10 941 9 384Other 7 040 6 870
Derivative contracts and other liabilities held for trading 5 268 3 256Other liabilities 2 317 1 452
Other liabilities 2 317 1 452Statutory provisions 0 0
Deferred expenses and advances received 727 762Subordinated liabilities 948 934
Subordinated loans 265 253Other 683 681
Total liabilities 44 150 38 940
Appropriations 1 032 1 029Depreciation difference 141 138Voluntary provisions 891 891
Shareholders' equityShare capital or cooperative capital 428 428
Share capital 428 428Share premium account 524 524Other restricted reserves 225 200
Reserve fund 164 164Fair value reserve 61 36
Cash flow hedging 17 12Fair value measurement 44 24
Non-restricted reserves 331 331Reserve for invested non-restricted equity 308 308Other reserves 23 23
Retained earnings 159 93Profit for the financial year 425 279Total shareholders' equity 2 092 1 855
Total liabilities and shareholders' equity 47 274 40 675
Off-balance-sheet commitments 7 379 7 725Commitments given to a third party on behalf of customers 2 749 2 727
Guarantees and pledges 2 451 2 479Other 297 247
Irrevocable commitments given on behalf of customers 4 630 4 999Securities repurchase commitments 7 9Other 4 622 4 989
EUR million
199

31 Dec. 2014 31 Dec. 2013
425 279-222 1
-1 685 -4 047-200 -2 255-528 -1 092
-1 000 -6416 -78
399 -2606 4
31 260
-398 2492 136 -2 004
447 -1 0311 325 -496
32 -22332 -454
-54 -28107 99708 -5 700
Increases in held-to-maturity financial assets Decreases in held-to-maturity financial assets 69 129
0 -4
-12 -160 0
47 109
0 -27134 663 24 340
-33 616 -21 833-212 -145
0 0835 2 092
1 589 -3 499
2 666 6 1654 255 2 666
1 974 1 758-1 726 -1 585
Cash flow statement
EUR million
Lease assets
Liabilities to credit institutions and central banks
Cash flow from operating activities
Notes and bondsShares and participations
Receivables from financial institutionsReceivables from the public and public sector entities
Profit for the financial yearAdjustments to profit for the financial yearIncrease (-) or decrease (+) in operating assetsNotes and bonds eligible for refinancing with central banks
Derivative contractsInvestment propertyOther assetsIncrease (+) or decrease (-) in operating liabilities
Proceeds from sale of tangible and intangible assetsB. Net cash used in investing activitiesCash flow from financing activities
Other monetary decreases in equity itemsC. Net cash used in financing activities
Liabilities to the public and public sector entitiesDerivative contracts and other liabilities held for tradingOther liabilities
Income tax paidDividends receivedA. Net cash from operating activitiesCash flow from investing activities
Acquisition of subsidiaries and associatesDisposal of subsidiaries and associatesPurchase of tangible and intangible assets
Increases in subordinated liabilitiesDecreases in subordinated liabilities
Cash and cash equivalents at year-startCash and cash equivalents at year-end
Increases in debt securities issued to the publicDecreases in debt securities issued to the public
Cash and cash equivalents transferred due to combination
Dividends paid
Interest receivedInterest paid
200

169 -166Unrealised net gains on foreign exchange operations 79 2
-454 85
9 9026 41
-50 -52
0 00
0-222 1
Cash and cash equivalentsLiquid assets 3 774 2 046Receivables from credit institutions payable on demand 481 620Total 4 255 2 666
Gains/losses on merger, portion of cash flow from investing activitiesTotal adjustments
Depreciation/amortisation, change in depreciation/amortisation difference and voluntary provisions
Non-cash itemsChange in fair value for trading
Change in fair value of investment assets
Adjustments to profit for the financial year
Items presented outside cash flow from operating activitiesCapital gains, share of cash flow from investing activitiesCapital losses, share of cash flow from investing activities
Impairment losses on receivablesOther
201

Parent Company’s (Pohjola Bank plc) Accounting Policies
General
Pohjola Bank plc is a Finnish credit institution whose businesses comprise Corporate Banking, Markets, Central Banking and Group Treasury. In addition, the Company includes Other Operations involving administrative functions.
Pohjola Bank plc (hereinafter Pohjola or the Company) is part of OP Financial Group which currently consists of 181 independent cooperative banks and their central institution OP Cooperative and other member credit institutions. OP Financial Group's member credit institutions comprise Pohjola, Helsinki OP Bank Plc, OP Card Company Plc, OP Mortgage Bank and OP Cooperative's member cooperative banks.
OP Cooperative completed its public voluntary bid announced in February 2014 and gained ownership of all Pohjola Bank plc shares by decision of the Arbitral Tribunal in accordance with Chapter 18, Section 6 of the Finnish Limited Liability Companies Act. As a result of the decision of the Arbitration Court, trading in the series A shares of Pohjola Bank plc ceased on 29 September 2014, and the shares were removed from the Helsinki Stock Exchange on 30 September 2014. On 7 October 2014, OP Cooperative was entered as the only shareholder in Pohjola Bank plc's shareholder register.
Pohjola Bank plc's parent company is OP Cooperative and Pohjola's consolidated accounts are included in its consolidated financial statements. Copies of the financial statements of OP Cooperative are available at the following address: Vääksyntie 4, FI-00510 Helsinki, Finland. The accounts of Pohjola Bank plc are also consolidated into those of Pohjola Group. A copy of Pohjola’s consolidated financial statements is available at www.pohjola.com or the Company’s head office whose street address is Vääksyntie 4, FI-00510 Helsinki.
In accordance with the Laki talletuspankkien yhteenliittymästä Act (Act on the amalgamation of deposit banks), the member credit institutions, Pohjola included, and OP Cooperative are ultimately jointly and severally liable for each other’s debts and commitments. If a member credit institution’s own capital is depleted to such a low level owing to losses that the criteria, specified in the Act, for being placed in liquidation are fulfilled, OP Cooperative has the right to collect from its member credit institutions extra contributions on the basis of the combined balance sheets previously adopted.
Pohjola is domiciled in Helsinki and the street address of its registered office is Teollisuuskatu 1 B, FI-00510 Helsinki, Finland,
Basis of preparation
Pohjola Bank plc's financial statements based on national regulation are prepared and presented according to the Act on Credit Institutions, the Ministry of Finance Decree on the Financial Statements and Consolidated Financial Statements of a Credit Institution and Investment Firm, the Accounting Act and the set of the Financial Supervisory Authority’s regulations and guidelines governing financial sector account, financial statements and the report of board of directors. In addition, the central institution of the amalgamation of cooperative banks, OP Cooperative, issues instructions for compliance with unified accounting principles and the preparation of the financial statements.
Pohjola Bank plc’s financial statements are presented in millions of euros and have been prepared on the basis of historical costs, with the exception of financial assets and liabilities held for trading, financial assets at fair value through profit or loss at inception, available-for-sale financial assets, derivative contracts and hedged items (for hedged risk) in fair value hedging and derivative instruments measured at fair value.
The preparation of financial statements requires the management to make assessments and estimates and exercise its judgement in the process of applying the accounting policies.
Foreign currency translation
Pohjola Bank plc's financial statements are prepared in euros, which is the presentation currency. Non-euro transactions are recognised in euros at the exchange rate quoted on the transaction date or at the average exchange rate of the month of recognition. On the balance sheet date, non-euro monetary balance sheet items are translated into euros at the exchange rate quoted on the balance sheet date. Non-monetary balance sheet items measured at cost are presented at the exchange rate quoted on the transaction date.
The exchange rate differences arising from the translation of non-euro transactions and monetary balance sheet items into euros are recognised as foreign exchange gains or losses under “Net income from foreign exchange trading” in the income statement.
202

Financial instruments
Fair value determination
Fair value is the price that would be received to sell an asset or paid to transfer a liability in an orderly transaction between market participants at the measurement date.
The fair value of financial instruments is determined using either prices quoted in an active market or the Company’s own valuation techniques where no active market exists. Markets are deemed to be active if price quotes are easily and regularly available and reflect real and regularly occurring market transactions on an arm's length basis. The current bid price is used as the quoted market price of financial assets.
If the market has a commonly used valuation technique applied to a financial instrument to which the fair value is not directly available, the fair value is based on a commonly used valuation technique and market quotations of the inputs used by the technique.
If the valuation technique is not a commonly used technique in the market, a valuation model created for the instrument in question will be used to determine the fair value. Valuation models are based on widely used measurement techniques, incorporating all factors that market participants would consider in setting a price, and are consistent with accepted economic methodologies for pricing financial instruments.
The valuation techniques used include prices of market transactions, the discounted cash flow method and reference to the current fair value of another instrument that is substantially the same. The valuation techniques take account of estimated credit risk, applicable discount rates, the possibility of early repayment and other factors affecting the reliable measurement of the fair value of financial instruments.
The fair value of financial instruments is divided into the following three levels of hierarchy of valuation techniques:
Quoted prices (unadjusted) in active markets for identical assets or liabilities (Level 1); Inputs other than quoted prices included within Level 1 that are observable for the asset or liability, either directly (i.e.
as prices) or indirectly (i.e. derived from prices) (Level 2); and Inputs for the asset or liability that are not based on observable market data (Level 3).
If the inputs used to measure fair value are categorised into different levels of the fair value hierarchy, the fair value measurement is categorised in its entirety at the same level as the lowest level input that is significant to the entire measurement. The significance of inputs has been assessed on the basis of the fair value measurement in its entirety.
It is typical of illiquid instruments that their price calculated using a pricing model differs from the actual transaction price. However, the actual transaction price is the best evidence of the instrument’s fair value. The Day 1 profit/loss, based on the difference between the actual transaction price and the price deriving from the pricing model that uses market prices, is recognised in the income statement over the term of the contract or a shorter period taking account of the product's structure and counterparty. However, the non-recognised amount will be recognised as soon as there is a genuine market price for the instrument or a well-established pricing practice is created in the market. The amount of illiquid financial assets is insignificant in the balance sheet.
Impairment of financial assets
At the end of each reporting period, the Group assesses whether there is objective evidence that a financial asset other than that carried at fair value through profit or loss is impaired. A financial asset is impaired and impairment losses are incurred if there is objective evidence of impairment as a result of one or more events that occurred after the initial recognition of the asset and that the loss event has an impact on the estimated future cash flows of the financial asset that can be reliably estimated.
The criteria used to determine whether there is objective evidence of an impairment loss include:
significant decline in the issuer’s financial results, credit rating, balance sheet, payment status or business plans, and unfavourable changes in the issuer’s economic and operating environment;
a bona fide bid for the same or similar investment from the market below acquisition value; events or circumstances that significantly weaken the issuer’s ability to operate on a going concern basis, such as
negative cash flows resulting from operations, insufficient capital and shortage of working capital 203

debtor's bankruptcy or other reorganisation becomes probable. debtor’s breach of contract; a concession granted to the debtor; impairment recognised earlier; and the disappearance of an active market for the financial asset.
In addition, a significant or prolonged decline in the equity instrument’s fair value below its cost constitutes objective evidence of impairment.
A more detailed description of recognition of impairments can be found under the various financial instruments below.
Securities sale and repurchase agreements
The purchase price of securities bought under ‘resell conditions’ binding on both parties is recognised as a receivable under the balance sheet item determined by the counterparty. The difference between the purchase price and resale price is treated as interest income and accrued over the term of the agreement.
The selling price of securities sold under ‘resell conditions’ binding on both parties is recognised as a financial liability under the balance sheet item determined by the counterparty. The difference between the selling price and repurchase price is treated as interest expenses and accrued over the term of the agreement. Securities sold under the repurchase obligation and the corresponding securities provided as maintenance margin are included in the original balance sheet item despite the agreement.
Classification and recognition
Upon initial recognition, financial assets and liabilities are classified as follows: financial assets and liabilities at fair value through profit or loss, loans and receivables, held-to-maturity investments, available-for-sale financial assets and other financial liabilities. The classification depends on the purpose for which the financial assets and liabilities were acquired. Financial assets at fair value through profit or loss are subdivided into financial assets held for trading and financial assets at fair value through profit or loss at inception. Financial liabilities at fair value through profit or loss are financial liabilities held for trading.
The purchase and sale of financial assets and liabilities at fair value through profit or loss, held-to-maturity investments and available-for-sale financial assets are recognised in the balance sheet on the transaction date, or the date on which the Company agrees to buy or sell the asset or liability in question. Notes and bonds classified as loans and receivables are recognised as financial assets on the transaction date and loans granted on the date on which the customer draws down the loan.
Financial assets and liabilities are offset in the balance sheet if Pohjola currently has a legally enforceable right of set-off in the normal course of business and in the event of default, insolvency or bankruptcy, and intends to settle the asset and liability on a net basis. OTC interest rate derivatives for central counterparty clearing are offset in the balance sheet, which are cleared in the daily clearing process with London Clearing House.
The Company derecognises a financial asset when the contractual rights to the cash flows from the financial asset expire, or when it transfers the financial asset in a transaction in which substantially all the risks and rewards of ownership of the financial asset are transferred. Financial liabilities are derecognised when they are extinguished, i.e. when the obligation is discharged, cancels or expires.
Financial assets and liabilities held for trading
All financial assets and liabilities that are expected to generate short-term profits arising from fluctuations in interest rates, prices and quotations or in which an embedded derivative contract cannot be separated from the host contract are classified as held for trading. Liabilities held for trading refer to the obligation to deliver securities which have been sold but which have not been owned at the time of selling (short selling).
Financial assets and liabilities held for trading include derivatives other than those used for hedging purposes.
Financial assets and liabilities held for trading are recognised at fair value in the balance sheet, and subsequent changes in the fair value are recognised under “Net income from securities trading” in the income statement.
Financial assets at fair value through profit or loss at inception
204

Financial assets at fair value through profit or loss at inception include financial assets which are designated as at fair value through profit or loss upon their initial recognition. These financial assets are measured at fair value and any change in their fair value and any capital gains and losses, interest income and expenses as well as dividend income are recognised in the income statement.
Financial assets recognised at fair value through profit or loss at inception comprise bonds which the Company, in accordance with its risk management principles, manages and assesses performance at fair value in order to receive a true and real-time picture of investment operations. Reporting to the Group's management is based on fair values.
Since the business involves investment on a long-term basis, financial assets are presented separately from those held for trading.
Financial assets at fair value through profit or loss also include hybrid instruments in which the fair value of an embedded derivative cannot be determined separately. These financial assets are measured at fair value in the balance sheet, and any subsequent changes in the fair value are recognised under “Net income from securities trading” in the income statement.
Loans and receivables
Financial assets classified as loans and receivables are non-derivative financial assets with fixed or determinable payments that are not quoted in an active market.
Loans and receivables are initially recognised at cost, which is the fair value of consideration given plus directly attributable transaction costs. Loans and receivables are carried at amortised cost after their initial recognition, using the effective interest method.
Impairment losses on loans and receivables are recognised on an individual or collective basis. Impairments will be assessed on an individual basis if the debtor’s total exposure is significant. In other respects, impairments are assessed on a collective basis.
Impairment is recognised when impairment loss is incurred and there is objective evidence that the receivable cannot be collected in full. The receivable has impaired if its present value of the estimated future cash flows – collateral included – is lower than the aggregate carrying amount of the loan and the related unpaid interest. Estimated future cash flows are discounted at the loan's original effective interest rate. If the loan carries a variable interest rate, the discount rate for measuring any impairment is the current effective interest rate determined under the agreement. Impairment loss recognised in profit or loss equals the difference between the loan carrying amount and the lower present value of future cash flows.
Impairment assessment is a two-phase process. Impairment is assessed individually for significant loans and receivables. If loans and receivables are not assessed individually, they will be assessed collectively for impairment. Collectively assessed impairment includes losses incurred but not yet reported, which cannot yet be allocated to a certain loan. Collectively assessed impairment provisions are based on a statistical model used in the measurement of economic capital requirement. In the model, receivables are classified into groups with similar credit risk by rating category. Collectively assessed impairment is measured based on the expected loss by rating category, and the measurement also takes account of the discounted present values of collateral and the average past loss experience.
If the contractual payment terms of a loan are modified, the reason for such modification and the severity class are documented using an internally defined scale. Loans may also be modified for reasons related to the management of customer relationships, not to the financial difficulties of the customer. Such modifications do not affect loan impairment assessment. In some cases, the central cooperative may, due to the customer’s financial difficulties, modify the loan terms and conditions, such as in terms of repayment holiday for a limited period or another loan modification, which are aimed at securing the customer’s repayment capacity and limiting credit risk associated with liabilities. Such renegotiated credit is reported as doubtful receivables. Modifications in the contractual payment terms that are due to the customer’s financial difficulties are forbearance measures and together with other criteria reduce the customer’s credit rating and thereby increase collective impairment allowance. Modifications with the highest severity class are also forbearance measures that will have an effect on the loan being assessed for impairment on an individual basis. If the customer has adhered to the new payment terms and no impairment allowance has been recognised for the customer’s exposure, it will be removed from troubled debt classification. Modifications in payment terms are subject to regular monitoring and reporting to the management as an indicator anticipating customer solvency.
Both receivable-specific and collectively assessed impairments are recognised by means of separate account, presenting as a reduction under receivables. Impairment losses on loans are presented in the balance sheet under “Impairment losses on receivables”. Recognition of interest on the reduced amount continues after the recognition of impairment.
The loan is derecognised after the completion of debt-collection measures if the loan terms are materially changed (such as refinancing) or otherwise based on the management's decision. Following the derecognition, payments received are recognised 205

as an adjustment to impairment losses on receivables. If there is subsequent objective evidence of the debtor’s improved solvency, the amount of the impairment loss recognised earlier will be reassessed and any change in the recoverable amount will be recorded in the income statement.
Investments held to maturity
Investments held to maturity are non-derivative financial assets with fixed or determinable payments that the Group has the positive intention and ability to hold to maturity. Held-to-maturity investments are initially recognised at fair value to which transaction costs are added. These investments are subsequently carried at amortised cost after their initial recognition, using the effective interest method.
Impairment of investments held to maturity is reviewed on the basis of the same principles as that of loans and receivables. The difference between the carrying amount of notes and bonds and a lower present value of future cash flows is recognised as an impairment loss in the income statement.
Investments included in the financial assets held to maturity category are sold before their maturity only in exceptional cases mentioned in IAS 39.
Available-for-sale financial assets
Available-for-sale financial assets include non-derivative assets which are not classified as the abovementioned financial assets but which may be sold before their maturity, comprising notes and bonds, shares and participations.
At the time of their acquisition, available-for-sale financial assets are recognised at cost, which equals the fair value of the consideration paid plus transaction costs directly attributable to their acquisition. Available-for-sale financial assets are subsequently measured at fair value.
If the fair value cannot be determined reliably, shares and participations necessary for operations and other unquoted shares and participations are measured at cost. Any changes in their fair value are recognised in the “Fair value reserve” under shareholders’ equity, from where they, including any capital gain or loss, are transferred to “Net income from available-for-sale financial assets” in the income statement when the asset is derecognised or impaired. Interest income and dividends are recorded in the income statement.
In the case of available-for-sale financial assets, for example, a significant downgrade of the credit rating of the issuer of bonds and notes, or a significant or prolonged decline in the equity instrument’s fair value below its cost, constitutes objective evidence.
If an equity instrument’s market value continues to fall following impairment recognition, the impairment loss will be recognised in the income statement.
If the fair value of impaired notes and bonds classified as available-for-sale financial assets increases subsequently and this increase can be objectively regarded as being related to an event after their impairment loss recognition, the impairment loss will be reversed and recorded in the income statement. If the fair value of an impaired equity instrument increases subsequently, this increase will be recognised in equity.
Interest income and dividends related to available-for-sale financial assets are recognised in the income statement.
The difference between the nominal value and the acquisition cost of fixed-rate bonds is recognised in interest income over the estimated residual term to maturity, using the effective interest method.
Participating interests, and shares and holdings in Group companies
Participating interests, and shares and holdings and other equity investments in Group companies are recognised at cost or, if the item's value on the balance sheet date is found to be lower than the acquisition cost due to impairment, at cost less impairment loss.
Impairment losses are recognised under “Impairment losses on other financial assets” in the income statement.
Cash and cash equivalents
Cash and cash equivalents consist of cash and receivables from credit institutions repayable on demand. 206

Other assets
Other assets comprise receivables repayable on demand arising from payment transfers, receivables in various clearing accounts, marginal account receivables related to derivative contracts and all other receivables that cannot be presented under any other suitable balance sheet item, such as various accounts receivable and rental receivables.
Other financial liabilities
Other financial liabilities include financial liabilities other than those at fair value through profit or loss, comprising deposits and other liabilities to credit institutions and customers, debt securities issued to the public and other financial liabilities. Other financial liabilities are recognised in the balance sheet on the settlement date and carried at amortised cost after initial recognition.
The difference between the nominal value and the acquisition cost of fixed-rate bonds is recognised in interest expenses over the estimated residual term to maturity, using the effective interest method.
Other liabilities
Other liabilities consist mainly of payment transfer liabilities, accounts payable and liabilities related to securities trading.
Derivative contracts
Derivatives are divided into hedging and non-hedging contracts. Both hedging and non-hedging derivatives are recognised at fair value in the balance sheet. Accrued interest on non-hedging interest rate swaps is recognised in interest income and interest carried forward corresponding to them in deferred income and deferred expenses. Changes in the fair value of non-hedging interest-rate, loan, currency, equity and commodity derivatives are recognised under “Net income from securities trading” in the income statement. Positive fair value changes and premiums paid for derivative contracts are recognised as assets under “Derivative contracts” while negative fair value changes and premiums received from derivative contracts are recognised under “Derivative contracts and other liabilities held for trading”.
The Group’s Risk Management has prepared methods and internal principles used for hedge accounting, whereby a financial instrument can be defined as a hedging instrument.
In accordance with the hedging principles, the Group’s Parent Company, Pohjola Bank plc, can hedge against interest rate risk, currency risk and price risk by applying fair value hedge or cash flow hedge. Cash flow hedge refers hedging against changes in the fair value of future cash flows. Fair value hedge refers to hedging against changes in the fair value of a hedged asset/liability.
Pohjola Bank plc enters into derivative contracts which are in fact used to hedge against financial risks but which do not fulfil these criteria.
Embedded derivatives associated with structured bonds issued are separated from the host contract and measured at fair value in the balance sheet, and changes in the fair value of these embedded derivatives and derivatives designated as hedging instruments are recognised in "Net interest income".
The fair value of OTC interest rate derivatives for central counterparty clearing is cleared in cash on a daily basis. In the balance sheet, these cleared derivatives are netted and shown as a net change in cash. Other derivatives are presented in the balance sheet on a gross basis, in which case positive value changes are presented as Derivative contracts under assets and negative value changes as Derivative contracts under liabilities.
Hedge accounting
Hedge accounting is used to verify that changes in the fair value of a hedging instrument fully or partially offset changes in the fair value or cash flows of a hedged item. The relationship between hedging and hedged instruments is formally documented, containing information on risk management principles, hedging strategy and the methods used to demonstrate hedge effectiveness. Hedge effectiveness is tested at the inception of the hedge and in subsequent periods by comparing respective changes in the fair value or cash flows of the hedging and hedged instrument. The hedge is considered highly effective if the change in the fair value of the hedging instrument or in cash flows offsets the change in the fair value of the hedged contract or portfolio or in cash flows within a range of 80–125%.
207

Fair value hedges
Fair value hedging against interest rate risk involves long-term fixed-rate debt instruments (Pohjola’s own issues), individual bond and loan portfolios, as well as individual loans. Pohjola uses forward exchange contracts and interest-rate and currency swaps as hedging instruments.
Changes in the fair value of derivative contracts that are documented as hedging the fair value and are highly effective hedges are recognised in the income statement. Hedged assets and liabilities are also measured at fair value during the period for which the hedge is designated, and any fair value changes are recognised through profit or loss. In fair value hedge accounting, changes in the fair value of the hedging and hedged instrument are recorded under “Net interest income”.
Cash flow hedges
A cash flow hedge is a hedge of the exposure to the variability attributable to a particular risk associated with variable-rate debt or other variable-rate assets and liabilities. In addition, cash flow hedging is used to hedge the future interest flows of the loans defined on the basis of reference interest rate linkage. Interest rate swaps are among those used as hedging instruments.
Derivative contracts which are documented as cash flow hedges and provide effective hedges are measured at fair value. The effective portion of changes in the fair value of the hedging instrument is recognised in other comprehensive income. Any ineffective portion of changes in the fair value is recognised immediately in profit or loss. Fair value changes recognised in equity are included in the income statement in the period when hedged items affect net income.
Lease assets
Leased out assets and lease assets’ advance payments are recognised at non-depreciated cost and presented under “Lease assets” in the balance sheet. As a rule, lease assets are depreciated according to the annuity depreciation method.
Lease income from leased out assets based on lease contracts less planned depreciation on the lease assets are recognised under “Net lease income”. In addition, the item includes impairment losses on lease assets, capital gains and losses on the disposal of lease assets, commissions charged from customers and other income and expenses directly attributable to lease contracts. Other income and expenses due to leases are included in the income statement item that corresponds to the nature of the income or expense item.
Intangible assets
Intangible assets are stated at cost less amortisation and write-downs. These assets are amortised over their estimated useful lives, which is 2–10 years for computer software and licences and 5 years in general for other intangible assets. The useful lives of assets are reviewed on each balance sheet date.
Planned amortisation and write-downs on intangible assets are recognised under “Depreciation/amortisation and write-downs on tangible and intangible assets” in the income statement.
Tangible assets
Investment property
Investment property is land and/or building or part thereof held to earn rental income and/or for capital appreciation. Property, a minor part of which (less than five per cent of the area) is used by the owner company or its personnel, is also accounted for as investment property.
Investment property is stated at cost less planned depreciation and write-downs. Land and shares and holdings in property companies can be subject to revaluation if their probable selling price on the balance sheet date is permanently higher than the original acquisition cost. Expenses incurred after the original acquisition will be capitalised only if it is probable that the resulting economic benefit from the property will be higher than initially estimated.
If the probable selling price of investment property is permanently lower than the carrying amount, the difference between the carrying amount and probably selling price is expensed during the financial year when the impairment is detected.
The fair value of business, office and industrial premises classified as investment property holdings and presented in the related note to the financial statements is primarily determined using the income approach based on direct capitalisation. The fair value of investment property under construction can be presented only if its fair value can be determined reliably. The fair value of
208

land, water and forest areas and residential buildings is primarily determined using the market approach. Recognition of write-downs is based on their consistency and materiality.
Income, expenses, capital gains and losses, planned depreciation and write-downs related to investment property are recognised under “Net income from investment property” in the income statement.
Other property holdings By other property holdings we refer to property in own use as an office, storage or other such facility, or for the personnel’s accommodation, recreation or other such purpose, as well as shares in housing corporations that entitle holding in these facilities. Also, property in own use comprises partly-leased properties in direct ownership of which the leased share cannot be sold separately and in which the Bank occupies more than 5% of the floor space. The shares of an ordinary property company are considered to be in own use if the Company uses over five per cent of the premises. When determining the balance sheet value of property in own use, the company's starting point is the value of the asset in terms of expected income of ordinary operations. The buildings are recognised on the balance sheet at acquisition cost deducted by depreciation according to plan. Holdings in property companies and land, water and forest areas are recognised at cost. Property modernisation costs are capitalised and recognised as depreciation according to plan. Income from and capital gains on property in the Company’s own use are recognised under “Other operating income and expenses” and capital losses under “Other operating expenses” in the income statement. Planned depreciation and write-downs are recognised under “Depreciation/amortisation and write-downs on tangible and intangible assets” in the income statement.
Other tangible assets
Tangible assets are stated at cost less accumulated depreciation and any write-downs. Assets are depreciated on a straight-line basis over their estimated useful lives. Planned depreciation is not applicable to land and shares in property companies.
Subsequent expenditures are capitalised at the asset’s carrying amount only if it is probable that the asset will generate greater economic benefits than initially estimated.
The estimated useful lives are mainly as follows:
Buildings 30–50 years Machinery and equipment 4–10 years IT equipment 3–5 years Cars 6 years Other PPE assets 5–10 years
The assets’ residual value and useful lives are reviewed on each balance sheet date and adjusted as appropriate if expectations differ from previous estimates with respect to economic benefits.
Assets’ planned depreciation and write-downs are recognised under “Depreciation/amortisation and write-downs on tangible and intangible assets” in the income statement. Income from and capital gains on property in the Company’s own use are recognised under “Other operating income and expenses” and capital losses under “Other operating expenses” in the income statement.
Employee benefits
Pension benefits
The statutory pension cover for Pohjola Bank plc's employees is managed through payments to OP Bank Group Pension Fund and supplementary pension cover through OP Bank Group Pension Foundation. The Pension Foundation has been closed to new employees since 1 July 1991. Expenses arising from pension plans are recognised under “Personnel costs” in the income statement. Pension liabilities are fully covered. Long-term incentive scheme
Pohjola Bank plc has short-term and long-term management incentive schemes in place, on the basis of which the person covered by the schemes may receive the related compensation for services rendered during each performance period fully in cash or a reward settled as a combination of cash and debenture loan issued by OP. The maximum amount of the incentive 209

scheme is calculated on the date when it is granted. and the amount charged to expenses is recognised in personnel costs and deferred expenses over the vesting period.
The amount of compensation corresponding to the objectives reached is reviewed quarterly. Any effects resulting from checking the original estimates are recognised in personnel costs and the corresponding adjustment is made in deferred expenses.
Personnel fund
Pohjola Bank plc belongs to OP Financial Group’s OP Personnel Fund. into which bonuses are paid on the basis of pre-agreed principles, depending on the achievement of targets. Bonuses transferred to the Fund are recognised under “Wages and salaries” in the income statement and the counterpart as “Deferred expenses” in the balance sheet.
Statutory provisions
A statutory provision is recognised for an obligation in the income statement and balance sheet if the obligation is based on a past event and it is probable that an outflow of resources will be required to settle the obligation, but there is uncertainty about the timing or amount required in settlement. In addition, an entity must have a present legal or constructive obligation towards a third party as a result of past events. If it is possible to receive compensation for part of the obligation from a third party, the compensation is recognised as a separate asset, but only at the time when receipt of the compensation is actually certain.
Bank levy
Pohjola Bank plc is subject to the Laki väliaikaisesta pankkiverosta Act (Act on Temporary Bank Levy), according to which it shall annually pay a bank levy accounting for 0.125% of its risk-weighted assets. The bank levy is recognised in other operating expenses during the calendar year.
Hybrid capital
Hybrid capital instruments are recorded as a separate balance-sheet item under “Subordinated liabilities”. In capital adequacy measurement, these instruments are included in Tier 1 capital. Interest on these instruments may be paid only within the limits of distributable funds.
Appropriations
The depreciation difference under appropriations in the balance sheet includes the accumulated difference between depreciation made and planned depreciation. Voluntary provisions contain voluntary appropriations made which are appropriations permitted by tax law. Such a provision is eg the loan loss provision permitted for deposit banks by the Business Income Tax Act. According to this Act, a deposit bank may deduct a credit loss provision made during the tax year, the amount of which accounts for a maximum of 0.6% of the total amount of receivables at the end of the tax year.
The total amount of non-reversed credit loss provisions made during the tax year and earlier may account for a maximum of 5% of the total amount of receivables at the end of the tax year.
An increase and decrease in depreciation made and planned depreciation as well as voluntary provisions are recognised under appropriations in the income statement. Appropriations in the income statement and balance sheet also include deferred tax liabilities. The amount of and change in voluntary provisions do not reflect Pohjola's calculated risks.
Income taxes
Income taxes shown in the income statement include current tax, based on the taxable income of Pohjola Bank plc, income tax for prior financial years and deferred tax expense or income.
Deferred tax liabilities are recognised for all temporary differences between the book value and tax base of assets and liabilities. Deferred tax assets are calculated on tax-deductible temporary differences between the carrying value and taxable value included in the financial statements, and on losses confirmed for tax purposes. Deferred tax assets are recognised to the extent that it is probable that taxable profits will be available against which deductible temporary differences can be utilised.
The Company offsets deferred tax assets and liabilities. Deferred tax assets and liabilities are measured at the tax rate that is expected to apply to the period when the asset is realised or the liability is settled, based on tax rates enacted or substantively
210

enacted by the balance sheet date. If deferred tax originates from balance sheet items not recognised in the income statement, any change in deferred tax is recognised in shareholders' equity, not in the income statement.
Revenue recognition
Interest income and expenses for interest-bearing assets and liabilities are recognised on an accrual basis. Interest on receivables with non-settled, due payments is also recognised as revenue and this interest receivable is tested for impairment. The difference between the receivable's acquisition cost and its nominal value is allocated to interest income and that between the amount received and nominal value of the liability to interest expenses.
Commission income and expenses for services are recognised when the service is rendered. For one-off commissions covering several years that may have to be refunded at a later date, only the portion of their revenue related to the period is recognised.
Dividends are primarily recognised when they are approved by the General Meeting of Shareholders by the distributing entity.
Offsetting income statement items
Income and expense items in the income statement are presented separately without offsetting them unless there is a justified reason for offsetting them in order to give a true and fair view.
Off-balance-sheet commitments
Off-balance-sheet commitments include commitments made for a third party on behalf of customers, such as guarantees and various guarantee engagements, and irrevocable commitments made for customers, such as binding supplementary loan arrangements, loan commitments, standby credit facilities and underwritings.
Commitments made for a third party on behalf of customers are recognised as off-balance-sheet commitments to the guaranteed amount at the balance sheet date. Irrevocable commitments made for customers are recognised to the maximum amount which may have to be paid on the basis of them.
211

1.2.3.4.5.6.7.8.9.
10.11.12.13.14.
15.16.17.18.19.20.21.22.23.24.25.26.27.28.29.30.31.32.
33a.33b.33c.34.
35.36.37.38.39.40.41.42.43.
Notes to the Income Statement
Shareholders’ equitySubordinated liabilities
Net income from hedge accountingNet income from investment property
Income from equity investments
Intangible assets and tangible assets and changes during the financial year
Other operating income
Other operating expenses
Interest income and expenses
Income, operating profit or loss and assets and liabilities by Division
Commissions and fees
Impairment losses on loans and other commitments and other financial assets
Net income from available-for-sale financial assets
Net lease income
Depreciation/amortisation and write-downs on tangible and intangible assets
Net income from securities and foreign exchange trading
Other assets
Lease and other rental liabilities
Assets leased out under finance leases
Holdings in other companies 31 December 2014
Other notes
Derivative contracts
Financial assets and liabilities by residual term to maturityRestricted and non-restricted equity and distributable funds
Statutory provisionsOther liabilities
Contents
Notes to Parent Company Financial Statements
Receivables from the public and public sector entities
Notes to the Balance Sheet
Income taxes
Debt securities issued to the public
Variable remuneration
Off-balance-sheet commitments
Classification of assets and liabilities
Shares and participations
Deferred expenses and advances received
Assets pledged as collateral Pension liabilities
Receivables from credit institutions
Other contingent liabilities and commitments at the year-endPersonnel and members of administrative bodies, and related parties
Reclassified notes and bondsNotes and bonds
Assets and liabilities denominated in euros and foreign currenciesFinancial instruments measured at fair value, grouped by valuation technique
Deferred income and advances paidDeferred tax assets and liabilities
Trustee services
212

2014 2013Interest incomeReceivables from credit institutions 68 65Receivables from the public and public sector entities 290 278Notes and bonds 171 157Derivative contracts 1 362 1 239
Trading items 1 463 1 329Hedge accounting -102 -90
of which cash flow hedge 12 13Other 11 2Total 1 903 1 740
Of which interest income from impaired receivables 1 2
Interest expensesLiabilities to credit institutions 59 68Liabilities to the public and public sector entities 26 27Debt securities issued to the public 254 187
1 289 1 215Subordinated liabilities 43 48Other 9 1Total 1 680 1 545
Interest income received from Group and associated companies and interest expenses paid to them
Subsidiaries Associates Subsidiaries AssociatesInterest income 3 0 2 0Interest expenses 2 2
2014 2013
Lease income 293 285Planned depreciation -262 -254Capital gains and losses (net) on the disposal of lease assets 2 2Commissions and fees 1 1Other income 0 1Other expenses -7 -6Total 27 27
2014 2013Available for sale 38 23Subsidiaries 195 158Affiliates 3 3Total 237 184
2014
EUR million
EUR million
Notes to the Income Statement
Note 1. Interest income and expenses
Note 2. Net lease income
EUR million
Notes concerning an entity under the Group’s control
EUR million
2013
Derivative contracts and other liabilities held for trading
Note 3. Income from equity investments
213

2014 2013Commissions and fees Lending 52 45Deposits 0 0Payment transfers 36 31Asset management 12 11Legal services 0 0Securities brokerage 22 21Securities issuance 10 7Guarantees 15 16Other 4 2Total 152 133
Commission expenses Service fees paid 20 15Securities brokerage and issuance 8 8Refunds of fees for shares 6 6Other 12 15Total 46 43
Capital gains and losses
Due to fair value changes Other income Total
Notes and bonds 3 1 - 4Fair value option 0 -1 - -1
Shares and participations 0 0 - 0Other -1 21 - 20Derivative contracts - 43 -20 22Liabilities held for trading 0 0 - 0Total net income from securities trading 3 64 -20 47
Net income from foreign exchange trading 36
Total net income from securities and foreign exchange trading 83
Capital gains and losses
Due to fair value changes Other income Total
Notes and bonds 2 -2 - 0Fair value option - 0 - 0
Shares and participations 0 0 - 0Other -4 -2 - -6Derivative contracts - -2 83 82Liabilities held for trading 0 0 - 0Total net income from securities trading -2 -5 83 76
Net income from foreign exchange trading 26
Total net income from securities and foreign exchange trading 102
EUR million
Net income from securities and foreign exchange trading 2014
Note 4. Commissions and fees
EUR million
Note 5. Net income from securities and foreign exchange trading
EUR million
Net income from securities and foreign exchange trading 2013
214

2014 2013Notes and bonds
Capital gains and losses 11 14Transferred from fair value reserve during the financial year 0 1
Total 11 14Shares and participations
Capital gains and losses 1 0Impairment losses -1 0Transferred from fair value reserve during the financial year 2 1
Total 2 1Total net income from available-for-sale financial assets 13 15
2014 2013Net income from hedging instruments -185 -14Net income from hedged items 183 13Total -2 -1
2014 2013Rental and dividend income 1 1Other income 0 0Rental expenses -1 -1Capital losses -1 -Other expenses 0 0Total -1 0
2014 2013Rental income from property in own use 0 0Capital gains on property in own use 0 0Income from central banking services 8 8Other 13 13Total 21 21
2014 2013Planned depreciation 11 11Write-down 0 0Total 11 11
EUR million
EUR million
EUR million
Note 9. Other operating income
Note 7. Net income from hedge accounting
EUR million
Note 10. Depreciation/amortisation and write-downs on tangible and intangible assets
Note 8. Net income from investment property
Note 6. Net income from available-for-sale financial assets
EUR million
215

2014 2013Rental expenses 7 6Expenses for property in own use 0 0Bank levy 20 19Merger loss - 1Other 19 14Total 46 40
Reductions
Entered in income
statement
Receivables from credit institutions 69 5 -49 38
OtherTotal 69 5 -49 38Impairment losses on other financial assets
Held-to-maturity debt securitiesShares and interests in group entitiesParticipating interests
TotalTotal impairment losses 69 5 -49 38
Reductions
Entered in income
statement
Receivables from credit institutions 80 2 -45 38
OtherTotal 80 2 -45 38Impairment losses on other financial assets
Held-to-maturity debt securitiesShares and interests in group entitiesParticipating interests
TotalTotal impairment losses 80 2 -45 38
2014 2013Income taxes from operations 58 52Total income taxes 58 52
Guarantees and other off-balance-sheet items
Gross impairmentlosses on individually
assessed receivable
Note 12. Impairment losses on loans and other commitments and other financial assets
Gross impairmentlosses on collectively
assessed receivable
31 Dec 2013, EUR million
Gross impairmentlosses on individually
assessed receivable
Gross impairmentlosses on collectively
assessed receivableImpairment losses on loans and other commitments
Impairment losses on loans and other commitments
Note 11. Other operating expenses
EUR million
EUR million
31 Dec 2014, EUR million
p psector entities
p psector entitiesGuarantees and other off-balance-sheet items
Note 13. Income taxes
216

Markets Baltics Other TotalIncome* 327 153 46 10 215 751Operating profit 195 77 30 -4 189 486Assets 15 056 6 845 23 165 791 1 418 47 274Liabilities 8 242 8 678 26 663 528 39 44 150Personnel 344 184 30 56 31 644
Markets Baltics Other TotalIncome* 289 139 71 7 172 677Operating profit 154 63 51 -4 153 417Assets 14 599 4 457 19 584 590 1 444 40 675Liabilities 7 087 4 383 25 852 338 131 37 790Personnel 352 182 33 60 5 631
31 Dec. 2014 31 Dec. 2013Repayable on demand
Deposits 293 333Other 189 287
Total 481 620Other than those repayable on demand
Deposits - 1From OP-Pohjola Group institutions 7 818 6 855Other 1 766 2 201
Total 9 584 9 056Total receivables from credit institutions 10 066 9 676
of which subordinated receivables 42 42
Pohjola Bank plc has only receivables repayable on demand from central banks.
31 Dec 2014, EUR
Note 14. Income, operating profit or loss and assets and liabilities by Division
EUR million
Notes to the Balance Sheet
* Income consists of the following items in the income statement: interest income, income from equity investments, commissions and fees, net income from securities and foreign exchange trading, net income from available-for-sale assets, net income from hedge accounting, net income from investment property and other operating income.
Group Treasury
Note 15. Receivables from credit institutions
Corporate Banking31 Dec 2013, EUR Group Treasury
Corporate Banking
217

31 Dec. 2014 31 Dec. 2013Receivables from the public and public sector entities by sector
Non-banking corporate sector and housing corporations 10 620 10 876Financial institutions and insurance companies 941 23Public sector entities 230 168Non-profit organisations serving households 160 212Households 1 206 1 099Foreign 1 257 1 036Collective impairments -21 -17
Total 14 393 13 398of which subordinated receivables 30 35
The balance-sheet item includes EUR 6.3 million in loans for which interest income is not recognised (6.3).
Write-downs on loans Write-downs at year-start 258 244+ Write-downs on individually assessed receivables during the financial year 35 53+/- Write-downs on collectively assessed receivables during the financial year 5 2- Write-downs reversed for individually assessed receivables during the financial year -18 -22- Actual impairment losses recorded during the financial year
of which write-downs on individually assessed receivables were made previously -28 -19Exchange rate difference on write-downs on loans 0 0
Write-downs at year-end 251 258
31 Dec. 2014 31 Dec. 2013Advance payments 23 37Machinery and equipment 793 811Real property and buildings 262 245Other assets 74 59Total 1 152 1 153
Note 17. Asset leased out under finance leases
EUR million
Final loan losses of EUR 35 million (27) were recognised from receivables.
Note 16. Receivables from the public and public sector entities
EUR million
218

Eligible for refinancing with central
banksOther notes and bonds Total
Of which subordinated
Financial assets at fair value through profit or loss 205 221 426 19Available for sale 7 302 479 7 782 -Held to maturity 130 14 144 -Held in another portfolio 188 - 188 -Total 7 825 714 8 539 19
Eligible for refinancing with central
banksOther notes and bonds Total
Of which subordinated
Financial assets at fair value through profit or loss 234 306 540 11Available for sale 6 725 375 7 100 -Held to maturity 187 15 202 -Held in another portfolio 222 - 222 -Total 7 368 695 8 064 11
Other TotalFinancial assets at fair value through profit or loss 369 56 426Available for sale 7 700 82 7 782Held to maturity 144 - 144Held in another portfolio - 188 188Total 8 213 326 8 539
Other TotalFinancial assets at fair value through profit or loss 493 47 540Available for sale 7 047 53 7 100Held to maturity 202 - 202Held in another portfolio - 222 222Total 7 743 321 8 064
The Financial assets through profit or loss at fair value category includes EUR 0 (9,4) million in financial assets at fair value through profit or loss at inception, all of them quoted publicly.
EUR million
EUR million
Notes and bonds eligible for refinancing with central banks and other notes and bonds 31 December 2014
Publicly-quoted and other notes and bonds 31 December 2013
Publicly quoted
Notes and bonds eligible for refinancing with central banks and other notes and bonds 31 December 2013
EUR million Publicly quoted
Publicly-quoted and other notes and bonds 31 December 2014
EUR million
Note 18. Notes and bonds
219

31 Dec. 2014 31 Dec. 2013Financial assets at fair value through profit or loss
Treasury bills - -Local authority papers 29 4Commercial papers - -Certificates of deposit - -Convertible bonds - 7Other bonds 396 529
Total 426 540Available for sale
Convertible bonds 1 1Other bonds 7 781 7 099
Total 7 782 7 100Held to maturity
Other bonds 144 202Total 144 202Held in another portfolio
Other bonds 188 222Total 188 222
Carrying amount Fair value
Effective interest rate
Impairments arising from
credit riskLoans and other receivables 219 233 5,5 0Investments held to maturity 59 56 4,3 0Available-for-sale financial assets 45 45 4,2 0Total 324 335 0
Carrying amount Fair value
Effective interest rate
Impairments arising from
credit riskLoans and other receivables 285 292 5,3 0Investments held to maturity 99 89 4,2 0Available-for-sale financial assets* 42 42 4,2 0Total 426 423 0
Income statement
Fair value reserve
Income statement
Fair value reserve
Banking 2 -1Group Functions 12 -1 29 -3Total 13 -1 28 -3
Notes and bonds by type, EUR million
Note 19. Reclassified notes and bonds
Value changes as shown below, if notes and bonds were not reclassified and had been measured at fair value:
By 31 December 2014, all Pohjola Bank plc's notes and bonds accrued interest recognised in accounting.
31 Dec 2013, EUR million
31 Dec 2014, EUR million
Loans and receivables and held-to-maturity investments were reclassified in 2008. Available-for-sale financial assets were reclassified in 2012.
* Of the held-to-maturity investments, Pohjola sold Irish RMBS with a carrying amount of EUR 36 million in the third quarter of 2012, due to a probable local legislative amendment. In this connection, Pohjola reclassified EUR 38 million in Irish RMBS within held-to-maturity investments to available-for-sale financial assets.
Q1–4/2014 Q1–4/2013
EUR million
The table below shows the carrying amounts and fair values of the reclassified notes and bonds.
220

Publicly quoted Other Total
Shares and participationsAvailable for sale 1 93 94Shares in subsidiaries 1 250 1 250Total 1 1 343 1 344
Publicly quoted Other Total
Shares and participationsAvailable for sale 1 109 110Shares in subsidiaries 1 249 1 249Total 1 1 358 1 360
EUR million 31 Dec. 2014 31 Dec. 2013Shares and participations by sectorNon-banking corporate sector and housing corporations 9 20Financial institutions and insurance companies 1 286 1 293Foreign entities 49 50Total 1 344 1 363
<1 year 1–5 years >5 years Total Positive NegativeInterest rate derivatives 1 597 10 671 5 754 18 022 473 564Interest rate swaps 1 597 10 671 5 754 18 022 473 564Currency derivatives 1 044 942 410 2 396 75 97Interest rate and currency swaps 1 044 942 410 2 396 75 97
<1 year 1–5 years >5 years Total Positive NegativeInterest rate derivatives 200 700 - 900 26 -Interest rate swaps 200 700 - 900 26 -
Nominal values/residual term to maturity Fair values
Nominal values/residual term to maturity
Note 21. Derivative contracts
Fair values
EUR million
Derivative contracts for hedging purposes – cash flow hedge in 2014
EUR 3,9 (19) million in shares and participations other than those quoted publicly was measured at fair value and the rest at cost.
31 Dec 2014, EUR million
31 Dec 2013, EUR million
Derivative contracts for hedging purposes – fair value hedge in 2014
Interest accrued on reclassified notes and bonds in January–December totalled EUR 8 million (9). The price difference between the nominal value and acquisition value recognised in the income statement totalled EUR 2 million (3). Capital losses on bonds and notes totalled EUR 1 million (2) and impairment loss amounted to EUR 0 million (0). Pohjola used derivatives to hedge against interest rate risks, applying hedge accounting from 1 October 2008. Positive mark-to-market valuations recognised on hedging derivative contracts amounted to EUR 3 million (6).
EUR million
Note 20. Shares and participations
221

<1 year 1–5 years >5 years Total Positive NegativeInterest rate derivatives 57 730 95 736 49 758 203 224 4 732 4 640Futures and forwards 10 196 4 602 - 14 798 2 12Options 22 916 19 455 10 430 52 801 606 480
Called 12 808 9 584 4 948 27 340 599 11Put 10 108 9 871 5 482 25 461 7 469
Interest rate swaps 24 618 71 239 39 287 135 144 4 103 4 144Other swap contracts - 441 41 481 20 4Currency derivatives 15 274 8 086 5 229 28 589 962 878Futures and forwards 13 576 307 65 13 948 277 168Options 1 337 51 0 1 388 15 13
Called 685 25 - 710 15 -Put 653 26 - 678 - 13
Interest rate and currency swaps 360 7 728 5 164 13 252 669 697Equity derivatives 266 285 0 551 37 1Futures and forwards - - - - - -Options 266 285 0 551 37 1
Called 266 281 - 547 37 0Put - 4 - 4 - 1
Other derivatives 242 507 117 866 66 68Futures and forwards 109 70 0 179 4 36Options 53 11 0 64 2 2
Called 26 11 - 37 2 -Put 26 - - 26 - 2
Other swap contracts 70 353 15 439 47 25Credit derivatives 9 73 102 184 12 5
Nominal values/residual term to maturity
The underlying value for interest rate derivative contracts is the nominal value, for currency derivative contracts the euro-denominated stated value of the purchased currency on the balance sheet date, and for equity derivative contracts the probable value of equities on the balance sheet date. The values are expressed in gross amounts. Interest from market value is presented in deferred income and deferred expenses.
Derivative contracts held for trading in 2014
Fair valuesEUR million
222

Fair value hedge
Cash flow hedge
Interest rate derivatives 612 29 5 908Futures and forward contracts - - -Options - - 812
Called - - 752Put - - 60
Interest rate swaps 612 29 5 037Other swap contracts - - 58Currency derivatives 163 - 1 904Futures and forwards - - 433Options - - 23
Called - - 23Put - - -
Interest rate and currency swaps 163 - 1 447Equity derivatives - - 76Futures and forwards - - -Options - - 76
Called - - 76Put - - -
Other derivatives - - 113Futures and forwards - - 0Options - - 6
Called - - 6Put - - -
Other swap contracts - - 94Credit derivatives - - 12
<1 year 1–5 years >5 years Total Positive NegativeInterest rate derivatives 2 248 11 378 5 060 18 686 335 242Interest rate swaps 2 248 11 378 5 060 18 686 335 242Currency derivatives 1 628 803 137 2 567 46 83Interest rate and currency swaps 1 628 803 137 2 567 46 83
<1 year 1–5 years >5 years Total Positive NegativeInterest rate derivatives 200 800 - 1 000 21 1Interest rate swaps 200 800 - 1 000 21 1
EUR million
Derivative contracts for hedging purposes – fair value hedge in 2013
EUR million
Made for hedging purposes
Fair values
Credit equivalents of contracts in 2014
Derivative contracts for hedging purposes – cash flow hedge in 2013
Nominal values/residual term to maturityEUR million
Held for trading
Nominal values/residual term to maturity Fair values
223

<1 year 1–5 years >5 years Total Positive NegativeInterest rate derivatives 41 842 104 754 38 194 184 790 2 657 2 600Futures and forward contracts 3 680 6 624 - 10 304 3 3Options 18 669 28 742 7 979 55 390 412 295
Called 8 828 14 312 3 786 26 926 411 5Put 9 842 14 430 4 192 28 464 1 289
Interest rate swaps 19 446 69 110 30 082 118 638 2 231 2 291Other swap contracts 46 278 134 458 10 12Currency derivatives 14 684 1 719 1 387 17 791 296 329Futures and forwards 13 686 338 84 14 108 132 144Options 654 28 - 682 4 8
Called 345 19 - 365 4 -Put 309 8 - 318 0 8
Interest rate and currency swaps 344 1 353 1 303 3 001 160 177Equity derivatives 194 582 - 776 77 -Futures and forwards - - - - - -Options 194 582 - 776 77 -
Called 194 582 - 776 77 -Put - - - - -
Other derivatives 348 473 54 874 67 53Futures and forwards 109 118 6 233 9 34Options 53 11 - 64 0 0
Called 27 11 - 38 0 -Put 27 - - 27 - 0
Other swap contracts 181 245 32 459 46 18Credit derivatives 4 99 15 118 13 0
Derivative contracts held for trading in 2013
Fair valuesEUR million
Nominal values/residual term to maturity
The underlying value for interest rate derivative contracts is the nominal value, for currency derivative contracts the euro-denominated stated value of the purchased currency on the balance sheet date, and for equity derivative contracts the probable value of equities on the balance sheet date. The values are expressed in gross amounts. Interest from market value is presented in deferred income and deferred expenses.
224

Fair value hedge
Cash flow hedge
Interest rate derivatives 453 25 3 668Futures and forward contracts - - 0Options - - 595
Called - - 560Put - - 35
Interest rate swaps 453 25 3 025Other swap contracts - - 49Currency derivatives 113 - 630Futures and forwards - - 292Options - - 9
Called - - 9Put - - 0
Interest rate and currency swaps 113 - 329Equity derivatives - - 135Futures and forwards - - -Options - -
Called - - 135Put - - -
Other derivatives - - 115Futures and forwards - - 1Options - - 4
Called - - 4Put - - -
Other swap contracts - - 96Credit derivatives - - 13
31 Dec. 2014 31 Dec. 2013Goodwill 0 2IT costs 35 39Other long-term expenditure 15 9Total 51 49
In own use Book value Fair valueProperty holdingsLand and water 0 0 0Buildings 0Shares and holdings in property companies 3 9 32Total 3 9 32
3
Tangible assets
EUR million
Other tangible assets
Credit equivalents of contracts in 2013
31 Dec 2014, EUR million
Intangible assets
Note 22. Intangible assets and tangible assets and changes during the financial year
Made for hedging purposes
Pohjola Bank plc’s derivatives business adopted netting of derivatives during 2011. However, derivative contracts are presented in gross amounts in this note. Netting would reduce the credit equivalent of Pohjola Bank plc’s derivative contracts by EUR 6,233 million (3,381).
EUR million
Held for trading
Investment property
225
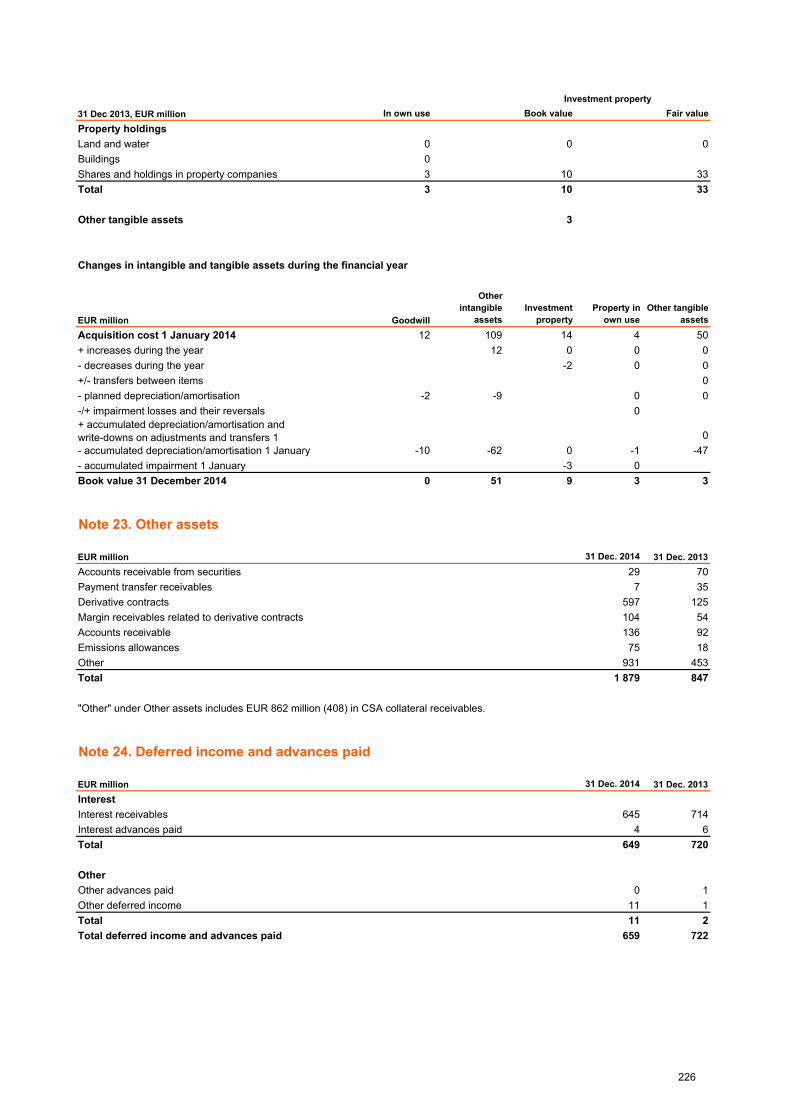
In own use Book value Fair valueProperty holdingsLand and water 0 0 0Buildings 0Shares and holdings in property companies 3 10 33Total 3 10 33
3
Goodwill
Other intangible
assetsInvestment
propertyProperty in
own useOther tangible
assetsAcquisition cost 1 January 2014 12 109 14 4 50+ increases during the year 12 0 0 0- decreases during the year -2 0 0+/- transfers between items 0- planned depreciation/amortisation -2 -9 0 0-/+ impairment losses and their reversals 0
0-10 -62 0 -1 -47
-3 0Book value 31 December 2014 0 51 9 3 3
31 Dec. 2014 31 Dec. 2013Accounts receivable from securities 29 70Payment transfer receivables 7 35Derivative contracts 597 125Margin receivables related to derivative contracts 104 54Accounts receivable 136 92Emissions allowances 75 18Other 931 453Total 1 879 847
31 Dec. 2014 31 Dec. 2013InterestInterest receivables 645 714Interest advances paid 4 6Total 649 720
OtherOther advances paid 0 1Other deferred income 11 1Total 11 2Total deferred income and advances paid 659 722
+ accumulated depreciation/amortisation and write-downs on adjustments and transfers 1
Other tangible assets
EUR million
- accumulated impairment 1 January
"Other" under Other assets includes EUR 862 million (408) in CSA collateral receivables.
EUR million
EUR million
Note 23. Other assets
Changes in intangible and tangible assets during the financial year
- accumulated depreciation/amortisation 1 January
31 Dec 2013, EUR million
Note 24. Deferred income and advances paid
Investment property
226

NetFrom timing differences 23 0 23From other temporary differences 0 16 -15Total 24 16 8
NetFrom timing differences 41 24 17From other temporary differences 0 9 -9Total 41 33 8
31 Dec 2014, EUR million NetDepreciation difference 141 28 113Voluntary provisions 891 178 713Total 1 032 206 826
31 Dec 2013, EUR million NetDepreciation difference 138 28 110Voluntary provisions 891 178 713Total 1 029 206 823
Book value 31 Dec. 2014
Nominal value 31 Dec. 2014
Book value 31 Dec. 2013
Nominal value 31 Dec. 2013
Certificates of deposit 828 828 1 775 1 776Bonds 10 954 10 953 9 486 9 430Other 6 198 6 204 4 994 4 997Total 17 980 17 985 16 255 16 203
31 Dec. 2014 31 Dec. 2013Payment transfer liabilities 819 869Accounts payable on securities 29 15Margin liabilities related to derivative contracts 0 0Other 1 468 567Total 2 317 1 452
Appropriations
31 Dec 2013, EUR million Deferred tax assets Deferred tax liabilities
Deferred tax liabilities
Deferred tax assets and liabilities arising from other temporary differences comprise deferred tax assets and liabilities based on revaluations of available-for-sale financial assets recognised in the fair value reserve under equity and of derivatives designated as cash flow hedges.
Depreciation difference and voluntary provisions have been entered in the balance sheet to the amount of non-deducted deferred tax.
EUR million
Balance sheet value Deferred tax liability
EUR million
Deferred tax assets include a total of EUR 0.00 in deferred tax assets recognised on losses confirmed in taxation (-).
Other' includes EUR 675 million in equity and derivative liabilities (183) and EUR 722 million (359) in CSA collateral liabilities.
Revaluations 31 December 2014
Deferred tax liability
Deferred tax assets
Note 25. Deferred tax assets and liabilities
31 Dec 2014, EUR million
The balance sheet does not include any revaluation (-).
Balance sheet value
Note 26. Debt securities issued to the public
Note 27. Other liabilities
227

1 Jan. 2014 0 0Decrease in provisions 0 031 Dec. 2014 0 0
1 Jan. 2013 2 2Increase in provisions 2 231 Dec. 2013 0 0
31 Dec. 2014 31 Dec. 2013InterestInterest liabilities 672 717Interest advances received 0 0Total 672 717
OtherOther advance payments received 1 1Vacation pay liabilities 8 8Tax liabilities 19 10Other deferred expenses 28 26Total 55 45Total deferred expenses and advances received 727 762
Bookvalue
Nominalvalue
265 269
- -683 683948 952
1.
2.
3.
EUR million
A debenture loan of EUR 100 million, which is a ten-year bullet loan, will mature on 14 September 2021. The loan carries a fixed interest rate of 5.25% p.a.
Other
Note 28. Statutory provisions
A debenture loan of CHF 100 million (euro equivalent 83 million), which is a ten-year bullet loan, will mature on 14 July 2021. The loan carries a fixed interest rate of 3.375% p.a.
Perpetual loans and debentures
EUR million
Note 29. Deferred expenses and advances received
EUR million
Total
Perpetual loans
Subordinated loans
Reorganisation
Note 30. Subordinated liabilities
Total
ReorganisationEUR million Total
Loans were issued in international capital markets.
The reorganisation provision derives from expenses arising from personnel reduction. This provision was mainly realised during 2013.
Debenture loans
A debenture loan of EUR 500 million, which is a 10-year bullet loan, will mature on 22 August 2022. Under the terms and conditions of the loan, the issuer will have the opportunity for early redemption in case the principal cannot be counted as part of the bank’s Tier 2 capital. The loan carries a fixed interest rate of 5.75% p.a.
228

Perpetual bond of EUR 50 million, issued on 17 June 2008, carries a variable interest rate based on 3-month Euribor + 3.05%, payable on a quarterly basis on 17 March, 17 June, 17 September and 17 December. If interest cannot be paid for a given interest period, the obligation to pay interest will lapse. Subject to authorisation by the Financial Supervisory Authority, the bond may be called in on 17 June 2013 at the earliest and thereafter on the due dates of interest payment. The entire loan principal must be repaid in one instalment.
4) Subordinated loan of EUR 40 million
3) Hybrid bond of EUR 60 million
5) Hybrid bond of EUR 50 million
Hybrid bonds/subordinated loans
1) Subordinated loan of 10 billion Japanese yen (equivalent of EUR 68.9 million)
The difference between the nominal value and carrying amount is due to the fair value hedge related to interest rate risk measurement.
This perpetual bond carries a variable interest rate based on 3-month Euribor + 0.65% payable quarterly on 28 February, 30 May, 30 August and 30 November. If interest cannot be paid for a given interest period, the obligation to pay interest for the period in question will lapse. It is possible to call in the loan at the earliest on 30 November 2015, subject to authorisation by the Financial Supervisory Authority, and thereafter on the interest due dates. After 2015, the loan carries a variable interest rate based on 3-month Euribor +1.65% (Step up). The entire loan principal must be repaid in one instalment.
2) Subordinated loan of EUR 50 million
Loans 1 and 3 are included in hybrid instruments.
This perpetual loan carries a variable interest rate based on 3-month Euribor + 1.25% payable quarterly on 28 February, 30 May, 30 August and 30 November. If interest cannot be paid for a given interest period, the obligation to pay interest for the period in question will lapse. Subject to authorisation by the Financial Supervisory Authority, the loan may be called in on the due date of interest payment of 30 October 2010. The entire loan principal must be repaid in one instalment.
Hybrid bonds included in Tier 1
This is a perpetual loan without interest-rate step-ups, but with an 8% interest rate cap. The loan was issued on 31 March 2005 and its interest rate for the first year was 6.5% and thereafter CMS 10 years + 0.1%. Interest payments are made annually on 11 April. If interest cannot be paid for a given interest period, the obligation to pay interest for the period in question will lapse. The loan can be called in on the interest due date as of 11 April 2010 at the earliest, subject to authorisation by the Financial Supervisory Authority. The loan's entire principal must be repaid in one instalment.
This is a perpetual loan (a loan without a due date) carrying a fixed interest rate of 4.23% until 18 June 2034 and subsequently a variable 6-month Yen Libor + 1.58% (Step up). Interest will be annually payable on 18 June and 18 December. If interest cannot be paid for a given interest period, the obligation to pay interest for the period in question will lapse. The loan can be called in at the earliest in 2014 and can be annually repaid after 2014 on the interest due date on 18 June or 18 December. The loan's entire principal must be repaid in one instalment.
Pohjola Bank plc has no violations of the terms and conditions of the loan contracts with respect to principal, interest and other conditions. The financial statements include EUR 0 million recognised for the price difference of the loans (0).
229

Shareholder's equity
1 Jan. 2014 Increases DecreasesTransfers
between itemsTotal shareholders’ equity 1 855 0 0 0 2 092Share capital 428 0 0 0 428Share premium account 524 0 0 0 524Other restricted reserves 200 0 0 0 225
Reserve fund 164 0 0 0 164Fair value reserve 36 25 0 0 61
Fair value measurement 24 20 20 0 44Cash flow hedge 12 5 5 0 17
Non-restricted funds 331 0 0 0 331308 0 0 0 308
Other funds 23 0 0 0 23372 0 213 0 159
Profit or loss for the financial year 0 425 0 0 425
EUR millionAt year-start1 Jan. 2014 Increases Decreases
Transferred to income
statementAt year-end
31 Dec. 2014Notes and bonds 8 40 8 0 40
Deferred tax -2 0 8 0 -10Shares and participations 16 3 13 -2 4
Deferred tax -4 3 0 0 -1Other 12 6 1 0 17
Cash flow hedge 15 6 0 0 21Deferred tax -3 0 1 0 -4
Total 36 49 22 -2 67
Increases DecreasesTransfers
between itemsTotal shareholders’ equity 1 720 1 855Share capital 428 428Share premium account 524 524Other restricted reserves 197 200
Reserve fund 164 164Fair value reserve 34 13 11 36
Fair value measurement 11 13 24Cash flow hedge 23 11 12
Non-restricted funds 331 331308 308
Other funds 23 23239 146 93
Profit or loss for the financial year 279 279
gadjustments
Shareholder's equity1 Jan. 2013
Changes in fair value reserve
restricted equity
EUR million
Shareholder's equity31 Dec. 2013
Note 31. Shareholders’ equity
Shareholder's equity31 Dec. 2014
restricted equity
gadjustments
EUR million
Changes in fair value reserve
230

EUR million Increases Decreases
Transferred to income
statementAt year-end
31 Dec. 2013Notes and bonds -15 29 6 -1 8
Deferred tax 5 7 -2Shares and participations 26 4 13 -1 16
Deferred tax -8 4 -4Other 23 4 15 12
Cash flow hedge 31 15 15Deferred tax -7 4 0 -3
Total 34 38 34 -1 36
31 Dec. 2014 31 Dec. 2013Shareholders' equity Restricted equity 1 177 1 152Non-restricted equity 915 704Total shareholders’ equity 2 092 1 855
31 Dec. 2014 31 Dec. 2013Distributable fundsAccumulated earnings 584 372Total distributable funds 584 372
Less than3 months 3–12 months 1–5 years 5–10 years
over10 years
253 476 3 027 4 045 24Receivables from credit institutions 5 178 788 3 542 528 30Receivables from the public and public sector entities 2 847 1 674 7 262 1 256 1 353Notes and bonds 22 94 489 107 1Total assets 8 300 3 031 14 321 5 937 1 409
Liabilities to credit institutions and central banks 2 637 592 1 781 227 5Liabilities to the public and public sector entities 10 384 784 205 232 62Debt securities issued to the public 5 206 4 383 6 841 1 376 175
- 150 115 683 -Total liabilities 18 226 5 909 8 941 2 519 242
Less than3 months 3–12 months 1–5 years 5–10 years
over10 years
170 392 3 672 3 110 25Receivables from credit institutions 5 380 664 3 109 499 24Receivables from the public and public sector entities 2 403 1 498 6 932 1 260 1 304Notes and bonds 45 58 447 142 2Total assets 7 999 2 613 14 160 5 011 1 355
Liabilities to credit institutions and central banks 2 148 537 1 692 406 6Liabilities to the public and public sector entities 9 215 372 209 258 289Debt securities issued to the public 5 742 3 933 6 110 420 50
40 119 94 681 -Total liabilities 17 145 4 962 8 104 1 765 345
31 Dec 2013, EUR million
Notes and bonds eligible for refinancing with central banks
Subordinated liabilities
Subordinated liabilities
31 Dec 2014, EUR million
At year-start1 Jan. 2013
EUR million
Note 33a. Financial assets and liabilities by residual term to maturity
EUR million
Notes and bonds eligible for refinancing with central banks
Deposits other than fixed-term deposits are included in the maturity class 'less than 3 months'.
Note 32. Restricted and non-restricted equity and distributable funds
231

Loans and receivables
Held to maturity
At fair valuethroughprofit or
loss*Available for
saleHedging
derivativesCarrying
amount total3 774 3 774
10 254 10 2545 086 309 5 395
14 939 14 939144 426 7 782 8 351
1 312 1 3122 643 605 3 248
31 610 144 6 117 9 094 309 47 274
At fair valuethroughprofit or
loss Other liabilitiesHedging
derivativesCarrying
amount total5 241 5 241
4 44 890 373 5 264
11 668 11 66817 980 17 980
948 9484 076 4 076
4 895 39 914 373 45 182
Loans and receivables
Held to maturity
At fair valuethroughprofit or
loss*Available for
saleHedging
derivativesCarrying
amount total2 046 2 046
9 898 9 8983 059 273 3 332
13 860 13 860202 540 7 100 7 842
1 331 1 3312 230 135 2 365
28 034 202 3 734 8 431 273 40 675
At fair valuethroughprofit or
loss Other liabilitiesHedging
derivativesCarrying
amount total4 789 4 789
4 43 018 234 3 252
10 343 10 34316 255 16 255
934 9343 243 3 243
3 022 35 564 234 38 820
Other receivables
31 Dec 2013, EUR million
Shares and participationsNotes and bonds**
Receivables from customers
31 Dec 2014, EUR million
Debt instruments issued to the public
Cash and balances with central banks
Derivative contracts
Notes and bonds**
Liabilities to customers
Total liabilities
Liabilities to credit institutions
Shares and participations
Total assets
Derivative conctracts
Other liabilitiesSubordinated liabilities
Other receivables
Cash and balances with central banksReceivables from credit institutions and central banksDerivative contracts
Subordinated liabilities
** On 31 December 2013, notes and bonds included EUR 9 million (9) in notes and bonds recognised using the fair value option.
* Assets at fair value through profit or loss include financial assets held for trading, financial assets at fair value through profit or loss at inception and investment property.
Note 33b. Classification of assets and liabilities
Financial liabilities held for trading (excl. derivatives)
31 Dec 2013, EUR million
31 Dec 2014, EUR million
Debt instruments issued to the public
Derivative contracts
Other liabilities
Liabilities to credit institutions
Total liabilities
Total assets
Receivables from customers
Receivables from credit institutions and central banks
Liabilities to customers
Financial liabilities held for trading (excl. derivatives)
232

Level 1 Level 2 Level 3 TotalAssets
Recognised at fair value through profit or loss 183 243 426Derivative contracts 7 5 186 202 5 395Available-for-sale 5 899 3 180 15 9 094
Total assets 6 088 8 609 218 14 915
LiabilitiesRecognised at fair value through profit or lossDerivative contracts 57 5 078 130 5 264
Total liabilities 57 5 078 130 5 264
Level 1 Level 2 Level 3 TotalAssets
Recognised at fair value through profit or loss 152 388 540Derivative contracts 10 3 110 212 3 332Available-for-sale 5 632 2 787 12 8 431
Total assets 5 794 6 285 224 12 303
LiabilitiesRecognised at fair value through profit or loss 4 4Derivative contracts 35 3 086 131 3 252
Total liabilities 35 3 090 131 3 256
31 Dec. 2014 31 Dec. 2013Net income for the financial year from Level 3Realised net income -2 -14Unrealised net income -11 46Total net income -13 33
Debt securities issued to the public are carried at amortised cost. On 31 December 2013, the fair value of these debt instruments was EUR 232 million (147) higher than their carrying amount, based on information available in markets and employing commonly used valuation techniques. Subordinated liabilities are carried at amortised cost. Their fair values are higher than their carrying amount, but determining reliable fair values involves uncertainty.
Financial instruments measured at fair value in the balance sheet, 31 Dec. 2014, EUR million
Valuation techniques whose input parameters involve special uncertainty. The fair value determination of the financial instruments included within this level contains inputs not based on observable market data (unobservable inputs). This level includes the most complex OTC derivatives, certain private equity investments, and illiquid bonds, structured bonds, including securitised bonds and structured debt securities, and hedge funds. In many cases, the Level 3 fair value is based on pricing information from a third party.
Financial instruments measured at fair value in the balance sheet, 31 Dec. 2013, EUR million
Liite 33c. Financial instruments measured at fair value, grouped by valuation technique
EUR million
This level includes equities listed on major stock exchanges, quoted corporate debt instruments, bonds issued by governments and financial institutions with credit rating of at least A-, and exchange-traded derivatives. The fair value of these instruments is determined on the basis of quotes in active markets.
Level 2: Valuation techniques using observable inputs
Level 3: Valuation techniques using unobservable inputs
Valuation techniques based on observable input parameters. The fair value of the instruments included within this level means value derived from the market price of a financial instrument's components or similar financial instruments; or value which can be determined using commonly used valuation models and techniques if the inputs significant to the fair value measurement are based on observable market data. The fair value hierarchy level at Pohjola Bank plc includes OTC derivatives, treasury bills/notes, debt instruments issued by companies and financial institutions, repo agreements, and securities lent or borrowed.
Level 1: Quoted prices in active markets
233

31 Dec 2014, EUR million EurosForeign
currencies Subsidiaries AssociatesReceivables from credit institutions 9 687 378 - -Receivables from the public and public sector entities 13 633 760 272 -
8 539 1 - -Derivative contracts 4 784 612 15 -Other assets 8 376 505 1 392 32Total assets 45 019 2 256 1 680 32
Liabilities to credit institutions and central banks 4 740 502 - -Liabilities to the public and public sector entities 10 616 1 051 226 -Debt securities issued to the public 11 628 6 352 46 -
4 701 567 14 -796 152 - -
Other liabilities 2 907 137 2 -Total liabilities 35 389 8 761 289 -
31 Dec 2013, EUR million EurosForeign
currencies Subsidiaries AssociatesReceivables from credit institutions 9 264 412 - -Receivables from the public and public sector entities 12 586 811 232 -
8 050 14 - -Derivative contracts 2 988 345 13 -Other assets 6 149 57 1 351 32Total assets 39 036 1 639 1 597 32
Liabilities to credit institutions and central banks 4 371 418 - -Liabilities to the public and public sector entities 9 426 917 156 -Debt securities issued to the public 11 301 4 953 62 -
2 942 314 15 -784 151 - -
Other liabilities 2 152 62 2 -Total liabilities 30 975 6 816 236 -
Derivative contracts and liabilities held for trading
Notes and bonds
Subordinated liabilities
Note 34. Assets and liabilities denominated in euros and foreign currencies
On 26 October 2004, Pohjola Bank plc joined OP Personnel Fund. Personnel fund
Payment of profit-based bonuses to OP Personnel Fund in 2014 was based on the achievement of the following targets: OP Financial Group's pre-tax earnings and OP Financial Group's Common Equity Tier (CET 1), both weighted at 30% and the change in the number of loyal customers weighted at 40%. Profit-based bonuses for 2014 transferred to the Fund account for some 4.2 % (4.6 %) of the combined salaries and wages earned by the Fund’s members. The bonuses recognised in 2014 totalled EUR 1.0 (2.1) million.
Remuneration schemes
Notes and bonds
Derivative contracts and liabilities held for trading
OP Financial Group’s remuneration comprises short-term company-specific remuneration and long-term Group-wide remuneration. The maximum amount of remuneration is limited in all schemes.
Note 35. Variable remuneration
Subordinated liabilities
Of which
Other notes
Of which
In the short-term incentive scheme, the performance period is one calendar year and the bonus is primarily paid in cash. This short-term scheme covers all personnel.
234

2014 20131 28 7
0 1
0 010 10
Expenses charged for variable remuneration *)
The long-term scheme consists of consecutive three-year performance periods. The amount of remuneration depends on how well the targets have been reached at the end of the performance period. The bonus for the first performance period from 2011 to 2013 will be paid after a deferment period in three equal instalments by the end of each June in 2015–2017. Owing to the tender offer made by OP Cooperative for Pohjola shares, the entire target bonus is paid in cash under the terms of the remuneration system.
People who may affect the company’s risk profile will have their variable remuneration payment deferred if their variable remuneration for a 12-month performance period exceeds EUR 50,000 – the maximum recommended by the Financial Supervisory Authority – or two months’ fixed gross salary above this amount. The remuneration of the person affecting the company’s risk profile is viewed up to the EUR 50,000 deferral limit as a whole, considering both long- and short-term remuneration.
*) Excluding social expenses
Total
Deferred payment of variable remuneration
Long-term scheme underway
EUR million
Schemes for 2007–2010
If the euro maximum for deferral is exceeded, some bonus is paid immediately, while the rest is deferred and the deferred bonus will be paid in equal instalments within the next three years. In such a case of deferral, any short-term scheme bonuses are paid half in cash and half as debenture loans issued by OP.
Scheme for 2011–2013
The payment of variable remuneration has been prescribed in the Act on Credit Institutions (610/2014). If a person is categorised on the basis of his duties as belonging to a group that may cause considerable risk (person affecting risk profile) to his company, the company may defer the payment of variable remuneration over three years under certain conditions.
Personnel fund
Previous long-term schemesShort-term schemes
Bonuses that may be paid under the remuneration scheme for performance period 2014–2016 will be paid as debentures issued by OP. The earned euro bonus will be converted into the number of debentures once the outcome of the scheme is known. An amount will be deducted from the bonus to cover related taxes and fiscal charges. The bonus will be paid in three equal instalments between 2018 and 2020.
Separately defined executives and key employees, appointed by the Executive Board, are included in the long-term management incentive scheme. OP Cooperative's Supervisory Board shall determine OP's Group-level performance metrics for the scheme and targets set for them separately for each performance period.
235

31 Dec. 2014 31 Dec. 2013Given on behalf of own debts and commitments
MortgagesPledgesOther 981 485
Total 981 485Other given on own behalf
MortgagesPledges* 6 273 5 705Other
Total 6 273 5 705Total assets pledged as collateral 7 254 6 190
Secured liabilities totalled EUR 473 (489) million.
31 Dec. 2014 31 Dec. 20133 3
Assets pledged as collateral
Note 36. Assets pledged as collateral
EUR million
EUR million
Share of the excess margin of pension liabilities on the pension fund and on other liabilities
* of which EUR 2,000 million in intraday settlement collateral and the rest pledged but unencumbered.
Material contract terms and conditions regarding termination and redemption
Repayment of the excess margin of the pension fund recorded as pension cost adjustment
The statutory pension cover for Pohjola Bank plc employees is managed through the OP Bank Group Pension Fund and the supplementary pension cover through the OP Bank Group Pension Foundation. The Foundation has not accepted new beneficiaries since 30 June 1991. Pohjola Bank plc's pension liabilities are fully covered.
Note 38. Lease and other rental liabilities
Pohjola Bank plc has no significant lease or other rental liabilities. The contracts primarily cover personnel car leases with a maturity of three years.
Other collateral given on own behalf consists of collateral required for the maintenance of liquidity.
Direct liabilities from pension commitments
Note 37. Pension liabilities
236

On behalf of subsidiaries
On behalf of affiliates
On behalf of others Total
Off-balance-sheet commitments 31 December 2014 0 7 378 7 3792 749 2 749
Guarantees and pledges 2 451Other 297
0 4 629 4 630Loan commitments 0 4 365Other 264
On behalf of subsidiaries
On behalf of affiliates
On behalf of others Total
Off-balance-sheet commitments 31 December 2013 12 7 713 7 7252 727 2 727
Guarantees and pledges 2 479Other 247
12 4 986 4 999Loan commitments 12 4 728Other 258
Commitments given to a third party on behalf of customers
Client assets related to brokerage amounted to EUR -0.5 (0.3) million included in 'Liabilities to the public and public sector entities'.
Commitments given to a third party on behalf of customers
EUR million
Accounts payable related to brokerage totalled EUR 26.6 (53.3) million and accounts receivable EUR 27.1 (53.1) million.
EUR million
On 31 December 2013, Pohjola Bank plc's commitments to private equity funds amounted to EUR 7.4 (9.5) million and relate to those presented in Note 41.
Note 40. Other contingent liabilities and commitments at the year-end
Note 39. Off-balance-sheet commitments
Irrevocable commitments given on behalf of customers
Irrevocable commitments given on behalf of customers
237

Average no.592 -1619 246 7
657 7
Members of the Board of Directors, President and CEO, and Deputy CEO 1
Reijo Karhinen, Chairman EUR 90,150Tony Vepsäläinen, Vice Chairman EUR 70,950
Members of the Board of Directors:Jukka Hienonen (member until 7 October 2014) EUR 56,450Jukka Hulkkonen (member until 7 October 2014) EUR 54,250Mirja-Leena Kullberg (member until 7 October 2014) EUR 53,700Marjo Partio (member until 7 October 2014) EUR 52,050Harri Sailas (member until 7 October 2014) EUR 55,350Tom von Weymarn (member until 7 October 2014) EUR 64,350Harri Luhtala (member since 8 October 2014) EUR 0Erik Palmén (member since 8 October 2014) EUR 0
Mikael Silvennoinen, President and CEO until 14 November 2013, EUR 175,716.
Permanent part-time personnel
The period of notice applicable under the President and CEO's executive contract is six months. According to this contract, the Company must pay the President and CEO severance pay equalling his 12-month total salary, in addition to compensation for loss of office, if the Company dismisses him or he has to resign or terminate the contract due to a reason attributable to the Company. In case the executive contract terminates due to reasons attributable to the Company, the President and CEO will be entitled to bonuses under the short- and long-term incentive schemes for the year of contract termination, provided that the schemes' performance criteria and the criteria for payment under the schemes' terms and conditions are fulfilled and his executive contract has been effective throughout the performance year. In addition, the President and CEO belongs to the long-term incentive scheme (2011-2013), under which bonuses will be paid from 2015 until 2017. He has unlimited company car benefit.
The Annual General Meeting approved the following Board emoluments:
The CEO executive contract does not stipulate any specific retirement age for the President and CEO. The President and CEO is covered by TyEL (the Finnish Employees Pensions Act) which provides pension benefits based on the years of employment and earnings as prescribed in the Act. The retirement age is 63–68 years, depending on his choice. In addition to the statutory pension scheme, President and CEO Mikael Silvennoinen was covered by OP Bank Group Pension Foundation’s supplementary pension scheme. Under that scheme, the retirement age applied to the President and CEO is 64 years. Pension accrued under the supplementary pension scheme may begin to be paid out as a paid-up pension before the old-age pension, if employment with OP-Pohjola Group terminates. In such a case, the minimum retirement age for men is 57 years. No supplementary pension scheme applies to President and CEO Pölönen. Attendance fees payable to Board members for each meeting do not accrue pension.
Change during the year
Fixed-term personnel
Wages and salaries, EUR million
Average personnel in 2014Permanent full-time personnel
Remuneration paid to members of administrative bodies in 2014
Salaries and performance-based bonuses paid to the President and CEO in the financial year ending 31 December 2014 were as follows:
* Includes salaries and bonuses paid to the President and CEO for the year 2014. Includes a portion of the amount paid in 2014 and earned in 2013 based on the short-term incentive scheme. Of the remaining portion of the 2013 bonus, EUR 33,600 has been deferred for payment between 2015 and 2017. Payment of deferred amounts requires a Board decision. Detailed information on the deferment procedure can be found in Note 36.
In the financial year 2014, the members of the Board of Directors did not receive any share-based bonuses from the Company.
Monthly emoluments and attendance allowance paid to Board members in 2014 totalled EUR 497,250 until 30.9.2014. The Chairman’s monthly emoluments totalled EUR 8,000, the Vice Chairman’s EUR 5,500 and other members’ EUR 4,500. An additional monthly emolument of EUR 1,000 is paid to a Board committee chair who is not the Chairman or Vice Chairman of the Board. All Board members received an attendance allowance of EUR 550 for each meeting. Monthly Board emoluments are treated as pensionable salary. Starting 1 October 2014 monthly emoluments nor attendance allowance were no longer paid.
Jouko Pölönen, President and CEO, EUR 450,491.*
Total
Note 41. Personnel and members of administrative bodies, and related parties
238

2014 2013EUR 135,212 EUR 136,308
EUR 117,676 EUR 131,120
EUR 8,072 EUR 102,784EUR 99,804 EUR 304,601
Total EUR 360,764 EUR 674,813
2014
11 7192 72
-2 -207
Net other operating income -8 -9
20 20
Transactions based on ownership, EUR million
Audit
Related parties
* Assignments as referred to in sub-paragraph 2, paragraph 1, Section 1 of the Auditing Act.
No impairments have been recognised for the items.
Other services based on legislation*
Auditors' remuneration
2013
Other services
Dividend income
Loans, guarantees and collateral granted to members of the administrative bodies on 31 December 2014
Net commissions and fees
As at 31 December 2014 and 31 December 2013, Pohjola Bank plc had not granted loans or guarantees to members of the Board of Directors.
Tax counselling
Loans and other receivablesDeposits and other debts
The related parties also include entities and foundations over which the aforementioned persons have control, alone or together with the other person.
Pension commitments
Members of the administrative and supervisory bodies are not covered by any pension commitments. Furthermore, no pension commitments have been made for previous members of these bodies.
Pohjola Bank plc's related parties include the President and CEO, deputy CEO, members of the Board of Directors, the auditor and deputy auditor or the chief auditor representing the firm of authorised public accountants, and the abovementioned persons' spouses or persons living in a spousal-type relationship with them and their underage children.
Net interest income
Guarantees and other off-balance-sheet commitments
239

Subsidiaries Holding, % Equity capital85 38 27
Helsinki100 441 228
Helsinki100 77 14
Helsinki100 4 3
Helsinki100 5 0
Helsinki100 0 0
Helsinki100 11 2
Helsinki100 0 0
Helsinki100 7 2
Helsinki100 3 1
Estonia100 8 1
Latvia100 5 1
Lithuania
Holding, %Equity capital
29,41 4 0Helsinki
45 6 1Belgium
49,49 2 0Helsinki
Profit or loss for the financial year
Note 42. Holdings in other companies 31 December 2014
Promotion Equity I KyParticipating interests
Vakuutuspalvelu Otava Oy
Conventum Venture Finance Ltd.
Northclaims Oy
Pohjola Insurance Ltd
Pohjola Finance Estonia AS
Profit or lossfor the financial year
Pohjola Bank plc's parent company is OP-Pohjola Group Central Cooperative and Pohjola's consolidated accounts are included in its consolidated financial statements. Copies of the financial statements of OP-Pohjola Group Central Cooperative are available at OP-Pohjola, Vääksyntie 4, Vallila, Helsinki.
Pohjola Asset Management Ltd
Pohjola Property Management Ltd
Kaivokadun PL-hallinto Oy
UAB Pohjola Finance
Pohjola Finance SIA
Access Capital Partners Group SA
Note 43. Trustee Services
VH-Holding 1 Oy
Finnmezzanine Rahasto III B Ky
The accounts of Pohjola Bank plc are consolidated into those of Pohjola Group. Copies of the financial statements of Pohjola Group are available at www.pohjola.com or OP-Pohjola, Vääksyntie 4, Vallila, Helsinki.
A-Insurance Ltd
Pohjola Bank plc provides the general public with investment services and asset management and custodian services. Pohjola Bank plc holds no assets based on discretionary investment management or on another agreement.
Pohjola Bank plc has no shareholdings in companies in which it would have unlimited liability.
Notes concerning an entity under the Group’s control
240

Helsinki, 5 February 2015
The Report by the Board of Directors and the Financial Statements signed by:
Reijo Karhinen Tony Vepsäläinen
Harri Luhtala Erik Palmén
Jouko Pölönen President and CEO
A report on the audit performed has been issued today. Helsinki, 10 February 2015 KPMG Oy Ab Authorized Public Accountants Raija-Leena Hankonen Authorized Public Accountant
241

242

243