policies to create and destroy human capital in europe.ftp.iza.org/dp4680.pdf · policies to create...
TRANSCRIPT

DI
SC
US
SI
ON
P
AP
ER
S
ER
IE
S
Forschungsinstitut zur Zukunft der ArbeitInstitute for the Study of Labor
Policies to Create and Destroy Human Capital in Europe
IZA DP No. 4680
December 2009
James J. HeckmanBas Jacobs

Policies to Create and Destroy
Human Capital in Europe
James J. Heckman University of Chicago, University College Dublin,
American Bar Foundation and IZA
Bas Jacobs Erasmus University Rotterdam
Discussion Paper No. 4680 December 2009
IZA
P.O. Box 7240 53072 Bonn
Germany
Phone: +49-228-3894-0 Fax: +49-228-3894-180
E-mail: [email protected]
Any opinions expressed here are those of the author(s) and not those of IZA. Research published in this series may include views on policy, but the institute itself takes no institutional policy positions. The Institute for the Study of Labor (IZA) in Bonn is a local and virtual international research center and a place of communication between science, politics and business. IZA is an independent nonprofit organization supported by Deutsche Post Foundation. The center is associated with the University of Bonn and offers a stimulating research environment through its international network, workshops and conferences, data service, project support, research visits and doctoral program. IZA engages in (i) original and internationally competitive research in all fields of labor economics, (ii) development of policy concepts, and (iii) dissemination of research results and concepts to the interested public. IZA Discussion Papers often represent preliminary work and are circulated to encourage discussion. Citation of such a paper should account for its provisional character. A revised version may be available directly from the author.

IZA Discussion Paper No. 4680 December 2009
ABSTRACT
Policies to Create and Destroy Human Capital in Europe*
Trends in skill bias and greater turbulence in modern labor markets put wages and employment prospects of unskilled workers under pressure. Weak incentives to utilize and maintain skills over the life-cycle become manifest with the ageing of the population. Reinvention of human capital policies is required to avoid increasing welfare state dependency among the unskilled and to reduce inefficiencies in human capital formation. Policy makers should acknowledge strong dynamic complementarities in skill formation. Investments in the human capital of children should expand relative to investment in older workers. There is no trade-off between equity and efficiency at early ages of human development but there is a substantial trade-off at later ages. Later remediation of skill deficits acquired in early years is often ineffective. Active labor market and training policies should therefore be reformulated. Skill formation is impaired when the returns to skill formation are low due to low skill use and insufficient skill maintenance later on in life. High marginal tax rates and generous benefit systems reduce labor force participation rates and hours worked and thereby lower the utilization rate of human capital. Tax-benefit systems should be reconsidered as they increasingly redistribute resources from outsiders to insiders in labor markets which is both distortionary and inequitable. Early retirement and pension schemes should be made actuarially fairer as they entail strong incentives to retire early and human capital is thus written off too quickly. JEL Classification: H2, H5, I2, I3, J2, J3 Keywords: skill formation, human capital, labor supply, retirement, training, dynamic
complementarity, inequality, returns to education, (non)cognitive skills, family policy, training policy, active labor market policy, tax policy, benefit systems, pension policy, welfare state
Corresponding author: Bas Jacobs Erasmus School of Economics Erasmus University Rotterdam P.O. Box 1738 3000 DR Rotterdam The Netherlands E-mail: [email protected]
* This paper was generously supported by the National Science Foundation (SES-0241858, SES-0099195, SES-0452089); the National Institute of Child Health and Human Development (R01HD43411); a grant to the Committee on Economic Development PAES Group from the PEW Foundation; support from the J.B. Pritzker Consortium on Early Childhood Development at the Harris School of Public Policy, University of Chicago; and Vidi Grant No. 452-07-013 ('Skill Formation in Distorted Labour Markets') from the Netherlands Organisation for Scientific Research. An extended version of this paper was presented at the joint conference of CESifo and Center on Capitalism and Society, "Perspectives on the Performance of the Continent's Economies," Venice International University, San Servolo, 21-22 July 2006. We especially thank Dennis Snower, Edmund Phelps, Hans-Werner Sinn and the participants for their useful comments and suggestions. In addition we thank Lans Bovenberg, George Gelauff, Coen Teulings and participants of the Netspar-SER-CPB conference, "Reinventing the Welfare State," April 27-28, 2006, The Hague, The Netherlands, for their comments and suggestions.

1 Introduction
The labor market prospects of unskilled workers are jeopardized by skill-biased
technical changes and the globalization of the world’s production activities
(see, e.g., Katz and Autor, 1999). Moreover, some argue that the position
of unskilled workers has become more vulnerable in recent, more turbulent
labor markets (Ljungqvist and Sargent, 1998; 2002). As the relative demand
for unskilled labor diminishes, and governments or unions attempt to protect
workers with low skills through labor market regulations or minimum wages,
non-employment among the unskilled will increase (Bertola, 2003). Raising
payroll taxes to support such efforts also reduces demand. Reinvention of
human capital policy is required to combat the emergence of an underclass.
All available evidence shows that welfare state dependency in Europe is
heavily concentrated among unskilled persons. For example, unskilled per-
sons have higher unemployment rates, higher take-up rates of welfare benefits
and larger participation rates in active labor market programs (OECD 2005a;
2006a; 2006b). In addition, many social problems are associated with lack
of skill, such as deviant social behavior (drug use), working in the unoffi-
cial economy, criminal behavior, teenage pregnancies, and so on (European
Commission, 2005). Social cohesion may be undermined further as migrant
populations are predominantly low skilled and their welfare dependency rates
are high.
Another feature of European labor markets is that European human capital
stocks remain idle during large parts of the life-cycle due to non-employment
and early retirement. Human capital needs be utilized and maintained over
4

the life-cycle for human capital investments to earn a sufficiently high re-
turn. High levels of taxation, generous social benefits and strong labor market
regulations reduce labor force participation rates, hours worked and employ-
ment and thereby lower the utilization rates of human capital. Generous early
retirement and pension schemes make older people retire many years before
statutory retirement ages (Gruber and Wise, 1999). Low labor force participa-
tion rates of older workers imply that the time-horizons over which investments
in human capital are harvested are short. In addition, there are often weak
economic incentives to maintain skills through training on-the-job. Insurance
schemes for disability, unemployment, and sickness create important moral
hazard problems. Once out of work, older workers will often never be able to
find a new job. Due to population ageing, the utilization rate of European hu-
man capital falls and substantial parts of human capital stocks will be written
off as workers retire.
Reinvention of human capital policies is required for both efficiency and eq-
uity reasons. In order to address the challenges imposed by skill-biased labor
demand shifts resulting in larger wage-premiums for skilled workers, invest-
ments in human capital should expand. Such a policy also helps to contain
the growing divide between the skilled and the unskilled. Governments should
put a strong emphasis on interventions early on in the life-cycle. Once indi-
viduals drop out of secondary school, labor market institutions or government
policies often prevent them from finding employment at established wage min-
imums. If one wishes to maintain high levels of minimum income support and
redistribution towards the poor, human capital policy is more urgent than
5

ever to avoid increasing dependency on welfare states. Only when individuals
acquire sufficient human capital at the beginning of their life-cycles, they can
avoid getting stuck in poverty and productivity traps later on in life.
In addition, policies to foster human capital cannot be seen in isolation from
labor market policies, tax and benefit systems and pension schemes. Current
welfare state arrangements often create substantial implicit tax burdens on
human capital investments because the incentives for investments in human
capital are undermined by low utilization rates of human capital and short time
horizons over which investments in skill materialize. Labor force participation,
hours worked, training on-the-job and later retirement are all complementary
to human capital investments. Reforms in labor markets, pension systems and
tax-benefit systems may not only have beneficial static effects on labor market
performance, but also have important dynamic efficiency gains by lowering
implicit tax wedges on skill formation over the life-cycle.
We ground our policy analysis in insights from previous research on the
technology of skill formation (Cunha, Heckman, Lochner and Masterov, 2006;
Cunha and Heckman, 2007; Heckman, 2007). Human capital accumulation
is a dynamic process. The skills acquired in one stage of the life-cycle affect
both the initial conditions and the technology of learning at the next stage.
Human capital is produced over the life-cycle by families, schools, and firms.
Different stages of the life-cycle are critical to the formation of different types
of abilities. When the opportunities for formation of these abilities are missed,
remediation is costly, and full remediation is often prohibitively costly. These
findings highlight the need to take a comprehensive view of skill formation
6

over the life-cycle so that effective policies for increasing the low level of skills
in the workforce can be devised.
The present paper extends this line of reasoning to the entire life-cycle.
We argue that, due to the same dynamic complementarities in skill formation
over the life-cycle, skill formation is impaired when the returns to skill for-
mation are low due to low skill use and insufficient skill maintenance later on
in life. We develop a theory of earnings, schooling, training and retirement
which is capable of describing some stylized features of Europe’s labor markets
and illustrates the impact of various policies. The consequences of low skill
formation both in the Anglo-Saxon world and mainland Europe are equally
present. However, when it comes to skill use and skill maintenance, we show
that mainland Europe differs markedly from the Anglo-Saxon world due to low
skill use and poor skill maintenance. Europe’s future problems with low skills
are therefore exacerbated by labor market institutions and government policies
that lower utilization rates of human capital and promote steep depreciation
of human capital over the life-cycle.
The rest of this paper is organized as follows. Section 2 gives some stylized
facts on trends and developments that are crucial for devising an appropriate
human capital policy for Europe. Section 3 summarizes the evidence on the
technology of skill formation. Section 4 of develops a theory of skill formation,
skill utilization and skill maintenance. Section 5 summarizes and gives the
policy conclusions of our analysis.
7

2 Stylized facts on skill formation, skill use
and skill maintenance in Europe
This section describes in detail some salient stylized facts on inequality, skill-
formation, skill use and skill maintenance, between countries and developments
over time. Wherever possible we distinguish among the Anglo-Saxon countries
(United Kingdom, Australia, New Zealand, Canada and the United States),
the Nordic countries (Denmark, Norway, Sweden, and Finland), Continen-
tal European countries (Netherlands, Belgium, France, and Germany) and
Mediterranean countries (Portugal, Spain, Italy, and Greece).
2.1 Economic environment
2.1.1 Growing earnings and income inequality
Davis (1992), Gottschalk and Smeeding (1996), Katz and Autor (1999) and
Brandolini and Smeeding (2006) analyze trends in earnings inequality and
conclude that inequality has been steadily increasing in Western countries
during the last decades of the twentieth century although the rapid growth
in the 80’s appears to level off in the 90’s.1 The increase in inequality is
most notable in the Anglo-Saxon countries. The Nordic countries appear to
have contained the increase in inequality. As noted by Bertola (2003) and
Atkinson (2008), the rise in inequality countries is mainly concentrated in the
upper part of the earnings distribution and not so much in the lower part of
the earnings distribution. Gottschalk and Smeeding (1996) and Brandolini
and Smeeding (2006) have shown that inequality in net disposable household
8

income did increase as well but to a much lesser extent than labor earnings.
Piketty and Saez (2003), and Atkinson and Salverda (2005) document large
increases in earnings inequality at the very top of the income distribution for
the US and the UK. Piketty (2003) and Atkinson and Salverda (2005) show
that the income distribution at the top did not change much in France and
the Netherlands.
2.1.2 Minimum wages, inequality and trade-off between equality
and incentives in the labor market
Falling real minimum wages appear to have caused growing inequality at the
bottom of the earnings distribution in the US, see also Autor, Katz and Kearny
(2008). Minimum wages reduce inequality for workers at the cost of lower em-
ployment. Indeed, inequality at the bottom of the earnings distribution did
not increase much for European countries but unemployment rates among low
income earners have been increasing instead (Davis, 1992). Bertola (2003)
shows that employment declines (unemployment rates increase) especially in
those countries where inequality in the lower part of the earnings distribution
remained rather constant. Increases in unemployment rates are disguised to
an important extent by enrolling unemployed workers in active labor mar-
ket and training programmes. Figure 1 from Heckman, Ljunge and Ragan
(2006) shows that many European countries and especially corporatist coun-
tries (Denmark, Finland, Norway, and the Netherlands) almost halve their
open unemployment rates by placing more unemployed workers in Active La-
bor Market (ALM)-programmes, where they are no longer counted as unem-
9

ployed workers. Adding these trainees back to the unemployed substantially
boosts the unemployment rate.
2.1.3 Trade-off between equality and incentives for human capital
investment
Low inequality may not only be a virtue, but may also be a vice when low
inequality reflects weak economic incentives. Figure 2 plots higher educa-
tional attainment rates of 25-34 year old cohorts against earnings inequality
as measured by the 90/10 percentile ratio. Both variables are taken from the
OECD Labor Force Database. A clear positive correlation emerges between
earnings inequality and higher educational attainment. This positive correla-
tion remains robust using tertiary educational attainment rates of 25-65 year
old cohorts, employing 90/50 or 50/10 percentile ratios for inequality or doing
panel regressions that allow for country-specific fixed effects. There is not only
a trade-off between the quantity of employment and equality but also between
the quality of employment and inequality. More compressed wage distribu-
tions imply weaker incentives for skill formation. Frederiksson (1997) is one
of the few studies that directly estimates the effect of a larger skill-premium
on enrollment and finds very substantial effects for Sweden. The empirical
general equilibrium model for the US of Heckman, Lochner, and Taber (1998)
also predicts a quite elastic response of investments in human capital to larger
skill premia.2
10

2.1.4 Rising returns to education
Income inequality is increasing in part because the returns to education dis-
play an upward trend. Studies for the US have documented a strong and
steady increase in the college-premium during the 80’s and 90’s (Katz and
Autor, 1999; Autor, Katz and Kearny, 2008). Peracchi (2006) reviews a large
number of country studies and shows that in general skill premia have been
constant or increasing in recent years for most Western countries. Gottschalk
and Smeeding (1996) in their cross country comparison find that an important
driving force behind growing earnings inequality is the growing skill-premium.
Using a panel of selected OECD countries, Nahuis and De Groot (2003) show
that rising skill-premia during the 80’s and 90’s are not only present in the US
but in the whole of the Western world.3
By now there is a firmly established consensus that the mean rate of return
to a year of schooling, as of the 1990’s, exceeds 10 percent and may be as high
as 17 to 20 percent (see Heckman, Lochner and Todd, 2006). This return
is higher for more able people (Taber, 2001; Carneiro and Heckman, 2003)
and for children from better backgrounds (Altonji and Dunn, 1996, present
some evidence in support of this claim but their own interpretation is more
equivocal). Those from better backgrounds and with higher ability are also
more likely to attend college and earn a higher rate of return from doing
so. This evidence is robust to alternative choices of instrumental variables
and to the use of alternative methods for controlling for self-selection. Both
cognitive and noncognitive skills raise earnings through promoting schooling
and through their direct effects on earnings (see the evidence in Taber 2001;
11

Heckman, Hsee, and Rubinstein 2001; Carneiro, Hansen, and Heckman 2001;
2003; Cunha, Heckman, Lochner, and Masterov, 2006; Heckman, Stixrud and
Urzua, 2006; Borghans et al., 2008).4
2.2 Skill creation
2.2.1 Slowing down of the growth in supply of skills
Educational attainment has grown enormously in most of the Western world.
Figure 3 plots higher educational attainment rates (as a fraction of each birth-
cohort) over the 1960-1995 period for various countries from the De la Fuente
and Domenech (2006) data set.5 Enrollment rates doubled virtually every-
where. The development in the average number of years of education is similar
(not shown). A striking feature is the large heterogeneity between countries in
higher educational attainment. The Mediterranean countries lag miles behind
the Nordic and Anglo-Saxon countries. The Continental European countries
are somewhere in the middle. We have to note here that institutional differ-
ences between countries make good comparisons difficult due to, for example,
differences in the duration of higher educational programmes. Literacy scores
indicate that high levels of educational attainment in some countries do not
necessarily match with high levels of literacy (Heckman and Jacobs, 2006).
Education systems differ across different countries and these comparable tests
may provide a better measure of the stock of skills of a country, at least for
the purpose of international comparisons. Hanushek and Kimko (2000) use
these tests as a measure of the quality of the labor force and argue that these
are an important determinant of economic growth.
12

The massive increase in the level of education of Europe’s workforces prob-
ably cannot be maintained indefinitely. Figure 4 shows that there are strongly
decreasing returns to raising education levels as the growth rate of in educa-
tion levels during 1960-1995 is negatively correlated with the initial level of
education in 1960. Therefore, one can expect that the returns to education
will be rising in the years to come because the demand for college educated
workers outstrips supply.
2.2.2 Resources invested in human capital are not increasing
Resources invested in human capital in Europe also remain rather stagnant
despite the rising returns. Overall investment levels as a fraction of GDP do
not change much over time in Continental and Mediterranean countries, see
Figure 5. Notable are the decreases in some countries (Finland and Norway).
The financial resources per student in higher education invested are again
roughly constant in Continental European and Mediterranean countries. In
Anglo-Saxon and Nordic countries, resources invested in higher education have
increased in recent years (see OECD, 2005a).
Figure 6 plots the share of private contributions to the direct costs of
education for different countries. Virtually all European countries heavily rely
on state funding for education and that is probably also the reason why public
budgets haven’t kept pace with increasing enrollment rates in some countries.
Primary and secondary education are generally free everywhere. As regards
higher education, tuition is subsidized and students receive (means tested)
grants and study loans with interest subsidies. Again, only the Anglo-Saxon
13

countries have a non-trivial share private investments whereas especially the
Nordic and Mediterranean countries almost exclusively rely on state funding
for education.
Although larger skill premia would naturally give stronger incentives to in-
vest in more human capital, it is by no means certain that this will also happen
in the stiffly regulated higher education sectors in Europe. Due to the ageing
of the population and the EMU-criteria for deficits and debts, most govern-
ment budgets are under pressure. There is currently not much hope for extra
public funding whereas there are good reasons for more private investments
in higher education. Nevertheless, most governments obstruct private funding
by repeatedly raising accessibility issues and failing to understand the basic
incentive issues facing schools and students (see Jacobs and Van der Ploeg,
2006).
Private funding of education should expand if governments do not free
up enough resources for investment in human capital, especially in higher
education. There is a strong efficiency case for public support in primary
education in well-developed welfare states. Poverty traps create not only large
tax burdens on work effort but also on skill formation; if it does not pay work it
does not pay to invest in skills either. If governments do not want to dismantle
welfare states and income support programs for the poor, they should ensure
that sufficient investments in human capital lift vulnerable groups above the
minimum income floors. This public support may come in the form of public
funding for primary and secondary education, but also in the form of minimum
school leaving ages and outlawing child labor (Bovenberg and Jacobs, 2003).
14

2.2.3 Skill-biased demand for labor
The sharp increase in educational attainment in some countries in Europe
has put downward pressures on skill-premia. That is probably why returns to
education have not been rising so much in some European countries as opposed
to the US where growth in the supply of skilled workers choked off already in
the 90’s (Carneiro and Heckman, 2003; Autor, Katz, and Kearney, 2008).
Nevertheless, overall wage inequality did increase and returns to education
certainly did not decrease to a large extent. Gottschalk and Smeeding (1996)
and Peracchi (1996) show that skill-premia remained rather constant in most
countries and generally increased in recent years. Everywhere in Europe labor
markets have absorbed the enormous influx of skilled workers without large
reductions in skill-premia. In other words, the demand for skilled workers has
been increasing at the same or even higher speed than the supply of skilled
workers. Many explanations have been put forward for these labor demand
shifts but skill-biased technical changes appears to be the most important
one. Increasing international trade and capital-skill complementarities could
be supplementary explanations for this phenomenon, see also Katz and Autor
(1999).
The outward shift of relative demand for skilled workers is radically trans-
forming labor markets and economies. To get an impression of its quanti-
tative importance one may ask the counterfactual question how much wage
differentials would have increased had the supply for skilled workers remained
constant. In the US wage differentials between skilled and unskilled workers
would have increased at a rate of 3% per year (Katz and Murphy, 1992) and
15

about the same is found for Canada (Murphy, Riddell and Romer, 1998). Ja-
cobs (2004) documents a skill-bias of about 2% per year in the Netherlands.
A skill-bias of a 1% increase in college premium per year is found in Sweden
by Edin and Holmlund (1995).
2.2.4 Low skilled workers have weak incentives to train
Unskilled individuals receive little training on the job, either because they
opt out of it when it is offered to them, or because employers choose to offer
training to workers with better skills. This is illustrated in Figure 7, from
OECD (2003), which shows the proportion of people at each literacy level who
receive job training. A low score signifies a low level of literacy. As emphasized
by Carneiro and Heckman (2003), there are strong complementarities between
early human capital investments and adult human capital investments. Low
skilled workers have difficulty in benefiting from adult training because they
have a low stock of human capital on which adult investments can build on
and be productive. Remediation investments in adulthood are very costly
and ineffective for low skilled individuals (Knudsen, Heckman, Cameron and
Shonkoff, 2006; Cunha, Heckman, Lochner and Masterov, 2006). Preventive
investments that take place earlier in the life-cycle of individuals generate
much larger returns.
2.2.5 Large spending active labor market programmes
Many European governments spend large amounts of resources on active and
passive labor market programmes, as demonstrated in Figure 8. Continental
16

European countries lead in total spending, followed by the Nordics. Mediter-
ranean countries have some labor market programmes, especially Spain. Anglo-
Saxon countries have virtually no labor market programmes compared to the
rest. Below we will argue that these programmes are largely ineffective in
lifting individuals out of poverty and raising their standards of living.
2.2.6 Taxes, subsidies and the incentives to acquire skills
Flat labor income taxes do not harm skill formation as long as all costs are
subsidized or deductible at the flat income tax rate. Direct costs and the
opportunity costs of education – forgone labor earnings while in education –
are then taxed at the same rate as the future labor earnings (Heckman, 1976).
Only if marginal costs are taxed at lower rates than the marginal benefits, tax
distortions on skill formation emerge. If marginal tax rates on labor incomes
are increasing with income, future earnings are taxed at higher rates than
forgone labor earnings and taxation discourages investment in human capital.
This is the case in most European countries, see also Figure 16 which shows
that Musgrave and Musgrave’s coefficient of residual income progression is
generally below one.6
Also, if education requires non-deductible expenses or effort costs, labor
taxation reduces investment in human capital. Education expenses for formal
schooling or training are generally not deductible for the income tax. Some
exceptions occur in Italy, the Netherlands and Portugal (see also Gordon and
Tchilinguirian, 1998). Large subsidies on education and training do however
correct for tax disincentives on skill formation (Bovenberg and Jacobs, 2005).
17

Indeed, many governments seem to over-subsidize higher education from a
fiscal perspective, i.e., there is a net subsidy rather than a net tax on education
and training (De la Fuente and Jimeno-Serrano, 2005; Bovenberg and Jacobs,
2005). Costs of training on-the-job are generally deductible by firms.
Non-pecuniary costs and benefits escape the tax system and cannot be sub-
sidized either. Given the high returns on human capital investments, one is
tempted to conclude that non-pecuniary costs of education appear to be empir-
ically more important than the non-pecuniary benefits. Findings by Carneiro
et al. (2001, 2003) and Cunha, Heckman and Navarro (2005) surveyed in
Cunha, Heckman, Lochner and Masterov (2006) suggest that non-pecuniary
costs can be very important indeed. Therefore, it can still be the case that tax-
ation distorts skill formation even though direct costs are heavily subsidized.
Additionally, large subsidies on observable inputs in human capital formation
(like years enrolled in education) will crowd out non-subsidized complementary
inputs in human capital formation like study effort (see Bovenberg and Jacobs,
2005; Jacobs, 2007). High subsidies on education may then go hand in hand
with long study durations, high drop-out rates and low student performance.
Finally labor income taxation depresses labor supply and thereby the uti-
lization rate of human capital. Consequently, labor income taxation indirectly
depresses human capital investments, even if all costs are deductible and labor
taxes are flat, see also Jacobs (2005, 2007).
18

2.2.7 Slowing growth in skills lowers productivity growth
Researchers have established a robust, causal relation between education and
earnings at the microeconomic level (see for example Card, 1999; Harmon,
Oosterbeek and Walker, 2003; Heckman, Lochner and Todd, 2006) although
there is a debate about the magnitude of the relationship. A growing body of
evidence suggests that the macroeconomic returns are of the same magnitude
as the conventional microeconomic estimates (Heckman and Klenow, 1998;
Sianesi and Van Reenen, 2002; Krueger and Lindahl, 2001; De la Fuente and
Domenech, 2006; Ciccone and Peri, 2006). The fact that education appears to
be roughly equally productive at the macroeconomic level as at the micro-level
largely disqualifies the ‘signalling-hypothesis’ as put forward by Arrow (1973).7
Skills are crucial determinants of labor productivity. These findings can also
be taken as evidence that — at current levels of public spending — external
effects of education are absent. Figure 9 gives the average annualized growth
rates of labor productivity during the last 20 years. This graph shows that the
Continental European and Mediterranean Countries have witnessed the lowest
rates of productivity growth. Unsurprisingly, the countries with large levels of
investment in human capital (Nordics and Anglo-Saxon countries) appear to
generate the highest levels of productivity growth. A slowdown in the rate of
skill acquisition therefore appears to threaten the standards of living of future
generations.
19

2.3 Skill utilization
2.3.1 Small labor force attachment reduces the utilization rate of
human capital
A possible reason for low average returns to education is that labor force par-
ticipation rates are low. This causes acquired human capital to remain idle.
Hence, a lower utilization rate of human capital reduces the returns to invest-
ments in schooling and training.8 Figure 10 shows that labor force participa-
tion rates are lowest in Mediterranean and Continental European countries.
Nordic and Anglo-Saxon countries have higher participation rates. However,
labor force attainment has been increasing in recent years in many countries
as women started to participate in especially the Nordic and Continental Eu-
ropean countries. Growth in participation rates was more modest in Anglo-
Saxon countries where participation rates were already high. Mediterranean
countries seem to be stuck in a trap of low participation rates.
Labor force attachment strongly increases with the level of education as
can be seen from Figure 11. This patterns holds across all countries. Al-
though often overlooked in the human capital literature, an important benefit
of higher skills is therefore the increased labor force attachment of more ed-
ucated workers, especially in Europe where employment rates are low. The
mirror image is that there is a strong dependence of unemployment on the
level of education (graph not shown). As already noted before, official unem-
ployment statistics are misleading because many countries enroll unemployed
workers in ALM programmes, see Figure 1 from Heckman, Ljunge and Ragan
20

(2006). The latter authors show that real unemployment rates can be twice
as high as official statistics suggest. Some corporatist countries may just be
good in hiding unemployment.
European countries have also hidden a lot of unemployment in sickness
and disability benefits. Figure 12 gives the non-employment rates of disabled
workers as a fraction of the population aged 20-64. This depressing picture
shows that a fraction of around 8% of the population aged 20-64 receives a
sickness or disability benefit and does not work. Large fractions of workforces
are disabled or sick and not participating in the labor market especially in the
Netherlands, Germany, Portugal, Denmark, Sweden and the UK where the rate
of sickness/disability is around 10% or higher. Disability related expenditures
are especially high in the Netherlands and some Nordic countries (between
4-5% GDP). The other Continental European countries and the Anglo-Saxon
countries do not have a lot of disability spending: between 1-2% of GDP
(OECD, 2005c).
2.3.2 Falling working hours lower utilization rates of human capital
Not only is the employment rate of European workforces low in comparison to
the Anglo-Saxon world, but also hours worked. This fact is documented many
times and one of the suggested reasons is the high level of taxation. How-
ever, also unionization of labor markets and collective labor agreements on
reductions in working hours and holidays matter (see, for example, Prescott,
2004; Alesina, Glaeser and Sacerdote, 2005). The average number of hours
worked is falling quite steadily over time in many countries in the last two
21

decades (OECD, 2006a). The only exception is Sweden where average hours
worked actually increased. Anglo-Saxon countries featured rather stable pat-
terns of hours worked over time with the exception of the UK. Part of this
development is the mirror image of increasing labor force participation rates
by female workers who tend to work more in part-time jobs (OECD, 2006a).
This pattern cannot readily be explained by increasing tax rates everywhere
because tax rates have been falling in recent years in many countries, see also
Figure 16.
2.3.3 Generous benefit entitlements reduce employment
Replacement incomes when unemployed can be high as indicated in Figure
13. Replacement incomes for the pool of the unemployed in Nordic and Conti-
nental European countries are around 50-60% of earned income. Anglo-Saxon
countries have much lower replacement rates in the order of 20% of earned in-
come or even less on average. The Mediterranean countries are in the middle
with replacement rates of about 30% with a notable exception of Italy. Figure
14 shows how eligibility for unemployment benefits changes over time. Individ-
uals quickly loose their benefits in the Anglo-Saxon, Nordic and Mediterranean
countries. Only in the Continental European countries unemployment benefits
often extend to 5 years or more without large reductions in benefit levels.
Theoretical work by Layard et al. (1991), Bovenberg and van der Ploeg
(1994), Pissarides (1998), Sørensen (1999) and others, shows that larger re-
placement benefits reduce employment in both competitive and non-competitive
labor markets characterized by unions, efficiency wages or matching frictions.
22

In a neoclassical world, unemployment benefits lower labor supply through
income effects and act as subsidies on leisure. In labor markets with unions,
higher replacement rates raise unions’ wage demands and this lowers employ-
ment. In labor markets with frictions or efficiency wages, higher replacement
incomes increase reservation wages for workers and thereby lower employment
as workers receive higher wages. So both in competitive and non-competitive
labor markets, higher (unemployment) benefits reduce employment (or in-
crease unemployment).
Generous benefit entitlements are probably one of main the reasons why
unemployment rates are high, but also contributing are extensive duration
of benefits, strict labor market regulations with respect to hiring and firing
of workers and large union coverage. See Layard et al. (1991) and Nickell
(1997). The main problem however with these macroeconomic studies is that
the time-series variation within countries is rather limited and identification
of effects heavily relies on the cross-country dimension. Adding country fixed
effects often destroys the cross-country correlations found, see also Van Ours
and Belot (2001) and Blanchard (2006).
In contrast to the macroeconomic literature, a pile of microeconomic stud-
ies suggests that employment sharply decreases with the generosity and dura-
tion of benefits because workers search less actively for work both in the US
and in European countries, see the overview in Lalive et al. (2006) and the
estimates they present. Abbring et al. (2005) and Lalive et al. (2005) and the
numerous papers they cite, find that sanctions on benefit levels and durations
may be highly effective in getting unemployed workers back to work.
23

Some recent studies document strong cohort effects in the take-up rates
of benefits (Lindbeck and Nyberg, 2006; Ljunge, 2006). Younger generations
are more likely to collect some benefit than older generations which can be
due to the erosion of work ethic.9 These arguments provide an alternative
explanation for the high level on which European unemployment rates have
been stuck since the end of the 1980’s.
2.3.4 Labor market protection harms labor market performance
Figure 15 gives the OECD summary statistic on labor market regulations.
This statistic summarizes the severity of legal restrictions on hiring and firing,
flexibility in labor contracts, working time restrictions, minimum wages, and
employees’ representation rights (work councils, company boards). Mediter-
ranean countries have the least flexible labor markets, followed by the Conti-
nental European countries. Nordic countries, and especially Denmark, appear
to have more flexible labor markets. It goes without saying that the Anglo-
Saxon countries have most flexible labor markets in the world.
Measures of labor market protection appear to be associated with bad labor
market performance in macroeconomic studies (see Layard et al. 1991; Nick-
ell, 1997). Again, time-series variation in these cross-country panel analyses
is often too limited and solid conclusions cannot be drawn in general. Heck-
man and Pages (2003, 2004) present evidence from microeconomic studies for
Latin American countries to assess the impact of labor market regulations.
They find that job security regulations indeed have large efficiency costs. In
addition, the distributional consequences appear to be perverse. Insiders gain
24

from labor market regulations at the expense of outsiders: young and unskilled
workers. However, using a panel of both Latin American and OECD coun-
tries and exploiting exogenous variation induced by various policy reforms, the
macroeconomic evidence on the impact of labor market regulations remains
fragile. Payroll taxes are the only really robust variable in explaining lower
employment and higher unemployment rates.
2.3.5 Large tax burdens weaken labor market performance
Figure 16 gives the average and marginal tax burdens on earned income includ-
ing the value added or sales taxes. Large average and marginal tax burdens
suggest that labor supply is distorted substantially (Prescott, 2004; Alesina et
al. 2005). Marginal tax rates are generally in the order of 60–70% in Conti-
nental European and Nordic Countries. Marginal tax rates are substantially
lower in the Mediterranean countries and the Anglo-Saxon world. Here, the
Continental European Countries have the steepest graduation in tax rates.
The other countries are relatively close in terms of tax rate progression.
A huge micro literature shows that high levels of taxation depresses la-
bor supply in terms of hours worked. See Pencavel (1986), Killingsworth and
Heckman (1986), and Blundell and MaCurdy (1999), for extensive overviews.
Substitution effects in labor supply are dominant (especially for women) and
income effects appear to be modest. Much less empirical evidence can be
found on the effects of taxation on other choice margins than hours worked.
As stressed by Heckman (1993) and Saez (2002), the participation (‘extensive’)
margin is more elastic than the hours worked (‘intensive’) margin. Taxation
25

potentially also affects human capital formation, search efforts of the unem-
ployed and wage setting institutions.
The effects of higher taxes on labor earnings are not clear-cut in non-
competitive, European style labor markets. Typically, in non-competitive la-
bor markets the wage level and the unemployment rate increase if marginal tax
rates are lower, average tax rates are higher, and benefit levels/replacement
incomes are higher – ceteris paribus.
Higher marginal taxes generally increase employment for given average
taxes and labor supply. See Bovenberg and van der Ploeg (1994), Sørensen
(1999), Pissarides (1998), Bovenberg (2006), and Van der Ploeg (2006). Unions
are punished when seeking higher wages in response to higher marginal tax
rates as the government taxes away wage increases at higher rates. This force
moderates wage demands, labor demand expands and unemployment falls. In
labor markets characterized by search frictions, marginal tax rates can boost
employment. Since workers and firms Nash-bargain over the surplus of firm-
worker matches, workers capture less of the surplus when marginal tax rates
increase. Firms need to pay a higher gross wage to provide a given net wage
to the worker. And, conversely, workers need to accept a lower net wage
to maintain a given level of profits for the firm. Hence, the negotiated wage
falls, labor demand expands, labor market tightness increases, and equilibrium
unemployment falls. In market environments characterized by efficiency wages,
firms find it harder to recruit, retain or motivate workers by increasing wages
when governments tax away these wage increases at higher rates. Therefore,
firms pay lower wages, labor demand expands and equilibrium unemployment
26

falls.
Higher average income taxes – for given marginal tax rates – may also
have opposite effects in comparison with neoclassical models, depending on the
response of the net replacement rate to higher taxes. See Bovenberg and van
der Ploeg (1994), Sørensen (1999), Pissarides (1998), Bovenberg (2006) and
Van der Ploeg (2006). A higher average income tax increases net replacement
rates (net benefit divided by the net wage rate) if benefits are untaxed. In
response to higher average taxes, unions will demand higher wages as the
position of their working members worsens in comparison with the non-working
members, so that unemployment rates go up. Firms paying efficiency wages
see that it becomes more difficult to recruit, retain or motivate workers because
net replacement rates increase. As a result, labor costs rise and equilibrium
unemployment increases. With search frictions, higher average tax rates on
wage income increase wage demands of workers, which pushes up wage costs
for firms, labor market tightness falls and unemployment increases. However,
when benefits are indexed to net wages, replacement rates remain fixed and
unions, firms or workers do not change wage setting behavior (a lot) and
there are much smaller (or even zero) effects of higher average tax rates on
unemployment.
Most of the theoretical papers cited above analyze non-competitive labor
markets where labor supply is treated as exogenous, thereby overstating the
case for tax progression. Sørensen (1999, p.449) demonstrates that the wel-
fare gains of tax progression in union and efficiency wage models are virtually
negligible when the compensated wage elasticity of labor supply approaches
27

lower bounds found in the empirical literature (around .20/.25). See Browning,
Hansen and Heckman (1999) and Blundell and MaCurdy (1999) for evidence
on this question. Indeed, Sørensen’s findings suggest that deviations from a
flat rate income tax to cushion labor market distortions are quite costly in
terms of reduced labor supply. Sørensen (1997) develops a CGE-model for
Denmark. He analyzes larger tax credits for low wage earners, financed by
raising marginal tax rates on all labor incomes. This policy, which makes the
tax system more progressive, has ambiguous welfare effects, depending criti-
cally on elasticities of the wage equation with respect to marginal and average
tax rates on wages. Bovenberg et al. (2000) develop a detailed CGE-model for
the Netherlands, which incorporates labor supply on the intensive and exten-
sive margins, on-the-job training, search frictions and wage-setting by unions.
They demonstrate that the negative (positive) effects of high marginal (aver-
age) tax burdens on labor supply and training are outweighed by the small
positive effects arising from wage moderation and reductions in labor market
frictions.
The possibility of setting wages above the market clearing level depends
on the ability of consumers or workers to shift taxes to firms. Most theories
of wage determination in non-competitive labor markets show that the wage
mark-up over the market clearing wage declines if the labor demand elasticity
increases, i.e. when it is more difficult to shift taxes towards firms, see for ex-
ample Bovenberg (2006) and Van der Ploeg (2006). In small open economies
with perfect capital mobility and perfectly competitive goods markets, it is
not possible to shift the tax burden to firms; labor demand would be per-
28

fectly elastic at the world wage rate. Thus, the distortions created by unions,
search frictions, and efficiency wages could be less relevant for many small
open European countries.
Finally, to fully understand the effects of taxes in distorted labor markets,
one should not only focus on changes in tax-rate progression for given levels
of benefits and average tax rates, as most of the aforementioned papers do.
Empirically, larger marginal tax rates are strongly associated with higher non-
employment benefits and higher average tax burdens. See Figure 13 and Figure
16. A policy of increasing marginal taxes, while using tax revenues to finance
benefits or larger levels of public spending (so that average tax rates increase)
generally reduces labor supply and employment in both competitive and non-
competitive labor markets.
To conclude, it is not clear that taxation is always less harmful in non-
competitive than in competitive labor markets. This depends on how respon-
sive labor supply is, how much of the incidence of taxes can be shifted to firms,
and how tax revenues are spent.
2.4 Skill maintenance
2.4.1 Decreasing retirement ages causes quicker depreciation of
skills
Apart from labor force participation and hours worked, the age of retirement
also constitutes an important element of the utilization of human capital over
the life-cycle. At retirement, human capital is written off completely. If work-
ers retire later, they will have larger returns on their investments in education
29

and training on-the-job as the time-horizon over which the investments mature
expands.
Figure 17 shows that that labor force attachment of the average worker
is rapidly declining with age. This development is also carefully documented
by Gruber and Wise (1999). Labor force participation rates of 55-64 year old
workers are only in the order of 1/2 or even less. Especially the Continental
European and Mediterranean countries have low participation rates of older
workers. Nordic countries outperform the Anglo-Saxon countries as regards
the labor force participation rates of 55-59 year old workers, but the Anglo-
Saxon countries do better in the 60-64 year cohorts.
Figure 18 shows the development of labor force participation rates of co-
horts of workers aged 55-59 year. Generally the labor force participation rates
have been falling and show a turn around in recent decades. However, if there
has been an increase in overall labor force participation rates of 55-59 year old
cohorts, it is mainly driven by the general increases in female force participa-
tion rates. Belgium (slightly), Denmark, Finland and the Netherlands are the
only four countries who have witnessed both an increase in male and female
labor force participation rates and in recent years which is probably due to
policy changes in early retirement schemes.10
Figure 19 plots the effective age of retirement, conditional upon being in the
labor force. There has been a landslide in effective retirement ages. Over the
last 40 years effective retirement ages went down massively everywhere in the
Western world, including the Anglo-Saxon countries. Again, the Continental
European countries have witnessed the largest decreases in the retirement ages
30

(see also Gruber and Wise, 1999). In recent years we see that the decrease in
effective retirement ages has come to a halt at a low plateau.
Figure 20 shows that labor force participation rates of 55-59 and 60-64
year old cohorts are much higher when individuals have more initial education.
Better skilled workers retire much later. This graph reinforces our notion that
labor supply and skill formation over the life-cycle are strongly complementary
activities.
2.4.2 Generous pensions and early retirement schemes reduce labor
force participation of older workers
Pension benefits can be generous as is clear from Figure 21. Pension replace-
ment incomes in Continental European are quite high and about 60-80% of pre-
retirement earnings for an average worker. Mediterranean countries have ex-
ceptionally generous pension schemes which entail pension benefits of 80-100%
of last earnings (up to 100% in Greece). The Nordics, on the contrary, have
much more modest pension benefits in the order of 40-60% of pre-retirement
earnings. The Anglo-Saxon countries have on average the lowest pension ben-
efits which are around 40-50% of final earnings. Another interesting feature is
that pension systems are PAYG state pensions almost everywhere. Exceptions
are the Anglo-Saxon countries, the Netherlands, Sweden and Denmark that
also heavily rely on substantial private funding, either through DB/DC occu-
pational pensions or individual saving schemes see also OECD (2005d). Note
finally that net pension incomes are always larger than gross pension incomes.
The reason is that all governments give tax-deductions or subsidies on pension
31

savings.
Many workers retire long before statutory retirement ages via all kinds of
early-retirement schemes. It is not easy to make international comparisons
because the institutional details vary from country to country. However, we
can summarize the impact of early retirement schemes on the labor market
by the implicit marginal tax rates imposed on an additional year of work (see
also Gruber and Wise, 1999). Figure 22 shows that early retirement schemes
do indeed cause very high marginal tax rates on pre-retirement incomes.11
Moreover retirement ages and benefit generosity are very negatively related.
Gruber and Wise (1999) present strong evidence that this is a causal relation.
It should therefore not come as a surprise that the Continental European and
Mediterranean countries have low labor force participation rates of elderly
workers because they have the most generous early retirement schemes. In
recent years some countries have reformed their pension schemes. The Nether-
lands, Germany, France, and Italy are examples. Labor force participation of
older workers appears to be picking up in recent years in some countries due
to reforms, general trends such as rising female labor force participation, or
because workers anticipate future reforms.
3 The technology of skill formation12
Figure 23 summarizes the major theme of Heckman (2000) and Carneiro and
Heckman (2003). It plots the rate of return to human capital at different
stages of the life-cycle for a person of given abilities. The horizontal axis
32

represents age, which is a surrogate for the agent’s position in the life-cycle.
The vertical axis represents the rate of return to investment assuming the same
amount of investment is made at each age. Ceteris paribus the rate of return
to a dollar of investment made while a person is young is higher than the
rate of return to the same dollar made at a later age. Early investments are
harvested over a longer horizon than those made later in the life-cycle (Becker,
1964). In addition, because early investments raise the productivity (lower
the costs) of later investments, human capital is synergistic. Learning begets
learning; skills (both cognitive and noncognitive) acquired early on facilitate
later learning. Early deficits make later remediation difficult. Finally, young
children’s cognition and behavior are more easily malleable than cognition and
behavior in adults. For an externally specified opportunity costs of funds r, an
optimal investment strategy is to invest relatively less in the old and relatively
more in in the young. A central empirical conclusion of their analysis is that at
current investment levels, efficiency in public spending would be enhanced if
human capital investment were directed more toward the disadvantaged young
who do not receive enriched early environments, and less toward older, less-
skilled, and illiterate persons for whom human capital is a poor investment.
Abilities are multiple in nature. They are both cognitive and noncognitive.
Both cognitive and noncognitive abilities matter in determining participation
in crime, teenage pregnancy, drug use and other deviant activities. These
abilities are themselves produced by the family and by personal actions. Both
genes and environments are involved in producing these abilities. Environ-
ments affect genetic expression mechanisms (see, e.g., Turkheimer, Haley, Wal-
33

dron, D’Onofrio and Gottesman, 2003; Bjorklund, Lindahl and Plug, 2006).
This interaction has important theoretical and empirical implications for skill
policies. It suggests an important role for environment-enriching policies in
fostering human skills. Differences in cognitive ability across family types ap-
pear early and persist over time (Carneiro and Heckman, 2003; Cunha and
Heckman, 2007). Measured cognitive ability is susceptible to environmental
influences, including in utero experiences. Education barely affects test score
gaps by family income or socioeconomic status after the early years of school-
ing (Carneiro and Heckman, 2003; Cunha, Heckman, Lochner and Masterov,
2006; Raudenbush, 2006).13
Noncognitive abilities such as motivation, self-discipline, and time pref-
erence — associated with the development of the prefrontal cortex — are also
affected by environmental influences. Noncognitive abilities and cognitive abil-
ities affect schooling attainment and performance, and a wide array of behav-
iors. Using a novel empirical approach, Heckman, Stixrud, and Urzua (2006)
identify a low dimensional vector of latent cognitive and noncognitive skills
which explains a diverse array of social and labor market outcomes. For many
dimensions of social performance, cognitive and noncognitive skills are equally
important. Heckman and Rubinstein (2001) and Heckman, Hsee and Rubin-
stein (2001) and Heckman and LaFontaine (2006) study the GED program14
and show that the cognitive ability of GED participants is on average equal
to that of high school graduates who do not enroll in college and even higher
than the ability of high school drop-outs. However, GED recipients earn less
than high-school drop-outs once the analyst controls for cognitive abilities.
34

Consequently, noncognitive ability appears to be an important determinant
of earnings which GED recipients lack. As is true for cognitive skills, gaps
in noncognitive skills (motivation, trustworthiness, behavioral skills) emerge
early and are substantially reduced once long-run family factors influencing
the child’s early years are controlled for (Carneiro and Heckman, 2003). I.Q.
is fairly well set by age ten. Noncognitive abilities are more malleable over the
life-cycle than cognitive abilities.
Much of the effectiveness of early childhood interventions comes in boosting
noncognitive skills and fostering motivation (see, e.g., Heckman, Malofeeva,
Pinto, and Savelyev, 2009). Short-term increases in cognitive skills (test-
scores) fade out over time. Successful programs increase noncognitive skills
and result in more social behavior and less crime. Programs are more suc-
cessful if parents are part of the treatment, which bolsters the notion that im-
provements in the home environment have long-lasting effects. For overviews
of the literature and evidence on a diverse array of early intervention pro-
grams, see Heckman (2000), Cunha, Heckman, Lochner and Masterov (2006),
Carneiro and Heckman (2003) and Cunha, Heckman, Lochner and Masterov
(2006). Given the quantitative importance of noncognitive traits, social policy
should be more active in attempting to alter them especially for children from
disadvantaged environments who receive little encouragement and discipline
at home.
Interventions in adolescent years partially remediate but do not remedy
insufficient early childhood investments at current levels of investment. Just
as early intervention programs have a high payoff primarily because of the
35

social skills and motivation they impart to the child and the improved home
environment they produce, so do interventions that operate during the adoles-
cent years, and for many of the same reasons. The impacts they achieve are
modest, but positive.
One cannot expect substantial benefits from public job training programs
which primarily targeted to disadvantaged workers. Surveying mainly microe-
conomic studies, Heckman, Lalonde and Smith (1999); Martin and Grubb
(2001); and Calmfors, Forslund and Hemstrom (2001) conclude that these
programs are largely ineffective.15 The comparison of job training programs
suggests a few important lessons. First, you get what you pay for. The re-
cently terminated JTPA program in the U.S. cost very little but produced
very few results. An exception to the rule is classroom training, for which the
returns are substantial (Heckman, Hohmann, Khoo and Smith, 2000). Sec-
ond, the effects of treatment vary substantially among subgroups (Heckman,
LaLonde, and Smith, 1999). Third, job training programs also have effects on
behavior beyond schooling and work that should be considered in evaluating
their full effects. Reductions in crime may be an important effect of programs
targeted at male youth. The evidence summarized in Heckman, LaLonde, and
Smith (1999) indicates that the rate of return to most U.S. and European
training programs is far below 10 percent, although the benefits to certain
groups may be substantial. Some programs survive a cost-benefit test, but
many do not. And even the most successful programs have only small impacts
on poverty rates and few are lifted out of it. The study by Calmfors, Forslund
and Hemstom (2001), presents an extensive overview of the Swedish experi-
36

ence with active labor market policies and they conclude that ALMP have
been inefficient. Europe’s skill policy should not look to public job training to
remedy or alleviate substantially skill deficits that arise at early ages.
The wisest long term investment policy is to invest in the young. Returns
are highest for investments in children from disadvantaged families where chil-
dren receive inadequate parental resources (Heckman, 2006; Heckman and
Masterov, 2006). Universal programs generate dead weight because children
from advantaged families receive substantial parental investment. Politicians
face a practical problem of the transition. Older persons and disadvantaged
younger persons are unemployable at current wage minimums. Investing in
them has a low economic return. A better policy is to subsidize their employ-
ment to give them dignity and social inclusion, and to benefit from what they
can offer society at large. The essays in Phelps et al. (2003) argue strongly for
carefully constructed wage subsidies. Such subsidies should be cohort-specific
and phased out over time. Otherwise newer generations will have weak in-
centives to develop skills and the problem of poverty will perpetuate across
generations.
4 A theory of skill formation, skill use and
skill maintenance
How can we reconcile the empirical findings of the European experience with
theory? In this section we develop a partial equilibrium life-cycle model of
schooling, on-the-job training, labor supply, saving and retirement. By simul-
37

taneously analyzing schooling, training labor supply and retirement decisions,
the model allows us to spell out various complementarities over the life-cycle.
First, we show that human capital investments feature dynamic complemen-
tarities over the life-cycle even after initial education. Both initial schooling
and later on-the-job training are complementary activities. The returns to ini-
tial schooling are larger when individuals engage more in on-the-job training
later on during their working careers. And, individuals will invest more in
on-the-job training when they have more initial schooling. Second, comple-
mentarities exist between skill formation and labor market participation in its
broadest sense. That is, the more individuals work and the later they retire,
the larger will be the returns to investments in initial schooling and on-the-job
training. The reason is that the costs of leisure and retirement increase when
individuals become better skilled. Also the reverse holds. Later retirement
and more hours of work boost skill formation by increasing its financial re-
wards. Our model builds on Mincer (1974) and Ben-Porath (1967) and adds
an endogenous retirement decision. We focus on labor supply on the intensive
(hours) margin and retirement.16
We maintain the assumption of full employment as labor markets are per-
fectly competitive and frictionless. We acknowledge at the outset that this is
probably not the best description of the labor markets in Europe, but eco-
nomic theory does not provide us yet with useful models that allow for the
joint determination of labor supply, human capital formation and wages in
non-competitive labor markets.17
38

4.1 Model
We assume that a representative individual is born at time t = 0 and has
a life-span T which is exogenously given. This individual undergoes S years
of initial education at the beginning of his life. Then the individual works.
After the working career the individual retires at date R. The life-time time
constraint states that total time in school S, in the labor market (R− S) and
in retirement (T −R) should equal the life-span T of the individual:
T = S + (R− S) + (T −R) . (1)
At each date, the individual derive instantaneous utility U(Ct) from con-
sumption Ct. To simplify the analysis we assume that only when the individual
is in the labor market (S < t ≤ R) does he derive utility form leisure Lt, i.e.,
V (Lt). Similarly, the individual does not engage in training-on-the-job before
entering the labor market and stops with on-the-job training when he leaves
the labor market. The time constraint while working states that the fraction
of time working Lt, plus the fraction of time invested in training It plus the
fraction time of time consumed as leisure Lt should be equal to the total time
endowment – which is normalized to one:
1 = Lt + It + Lt, S < t ≤ R. (2)
Alternatively, one could interpret Lt as the labor force participation rate, It
as aggregate training efforts, and Lt as the non-employment rate in this rep-
39

resentative agent setting.
Individuals derive utility X(T − R) from the years they are retired T −
R where R denotes the retirement age. Retirement is a discrete decision to exit
the labor market completely. The individual does not derive direct (dis-)utility
from being in school.
Life-time utility of the individual is a time-separable function of instanta-
neous consumption and leisure felicities and retirement utility
∫ T
0
U(Ct) exp(−ρt)dt+
∫ R
S
V (Lt) exp(−ρt)dt+X(T −R), (3)
with U ′(Ct) > 0, U ′′(Ct) < 0, V ′(Lt) > 0, V ′′(Lt) < 0, X ′(T − R) > 0
and X ′′(T − R) < 0 where ρ is the subjective rate of time preference. These
preferences simplify our analysis. The costs of forgone labor time are measured
by forgone labor earnings. The value of retirement leisure is governed by
X(T −R).18
The representative individual optimally decides the number of years S in
education. W (S) is the rental rate of human capital of type S. This rental
rate is assumed to be constant over time and differs between individuals with
different skill levels. W (S) features positive but diminishing marginal returns
of additional initial schooling: W ′(S) > 0, W ′′(S) < 0. Alternatively, one
may interpret W (S) as the production function of human capital. The costs
of education are the forgone earnings W (S) while not working and the direct
costs P per year of education (we ignore the utility or disutility of education).
Without loss of generality, we keep the direct costs of education fixed. We
40

assume here that the government can affect decision on the optimal years of
schooling only through the tax system and education subsidies. In the real
world, governments affect the education choices of individuals through a host of
other mechanisms, for example, by outlawing child labor, by setting minimum
school leaving ages, and so on. These alternative instruments can be regarded
as implicit rather than explicit subsidies on education. As such, our model is
still suited to capture the main incentive issues and we do not think that this
undermines our main story of the various complementarities over the life-cycle.
Nevertheless, some of these policies may require fewer public resources than
education subsidies and could be preferred for that reason.
The individual starts his life with A0 in financial assets which are normal-
ized to zero for convenience (A0 = 0). He borrows in a perfect capital market
at constant real interest rate r to finance the costs of living and the costs of
education in the periods when he is enrolled in initial education. The flow
budget constraint of the individual while still in school (t ≤ S) is therefore
given by
At = (1− τA)rAt − Ct − (1− s)P, 0 ≤ t ≤ S, (4)
where a dot denotes a time-derivative. Since A0 = 0, and Ct and P are both
positive, the individual accumulates debt in the first periods of his life. τA is
the tax on interest income. Interest payments of education loans are deductible
for the interest tax. s is the subsidy rate on direct educational costs.
After graduation, the individual starts earning gross labor incomeW (S)HtLt.
Ht is the stock of human capital which is gathered through training on-the-
job in a manner that is made precise below. The flow budget constraints after
41

graduation until retirement (S < t ≤ R) state that the increase in financial
assets should equal total interest income (which is negative when individu-
als repay debts), net labor income (1 − τL)W (S)HtLt (where τL is the labor
income tax rate), minus consumption Ct:
At = (1− τA)rAt + (1− τL)W (S)HtLt − Ct, S < t ≤ R. (5)
After retirement, until death (R < t ≤ T ), the representative individual
does not work anymore and runs down his accumulated assets for consumption
purposes:
At = (1− τA)rAt +B − Ct, R < t ≤ T, (6)
where B is the net retirement benefit in each year spent in retirement. One
should interpret the pension benefit B as that part of pension benefits that
is actuarially completely non-neutral, since individuals only receive retirement
benefits conditional upon full retirement. Any actuarially fair pension savings
are covered by the voluntary saving decision. The individual has no bequest
motive and ends his life with zero wealth: AT = 0.
The representative individual can increase his human capital by allocating
time It to learning activities, while foregoing labor earnings or leisure time. It’s
assumed that on-the-job training does not require direct costs. The individual
has one unit of on-the-job human capital when he enters the labor market, i.e.,
HS ≡ 1. On-the-job human capital accumulates according to a Ben-Porath
42
(1967) type of production function
Ht = G(S)F (It, Ht)− δHt, S < t ≤ R, (7)
where FI(It, Ht) > 0, FH(It, Ht) > 0, FII(It, Ht) < 0, FHH(It, Ht) < 0 and
FIH(It, Ht) > 0. G(S) denotes the productivity of on-the-job-training, which
increases with the initial level of education at a diminishing rate: G′(S) > 0
and G′′(S) < 0. This captures the main idea of dynamic complementarity in
skill-formation. Larger levels of initial education increase the productivity of
investments in on-the-job training. Furthermore, there is dynamic complemen-
tarity in human capital formation on-the-job because the marginal product of
training investments G(S)FI(It, Ht) increases with the level of human capital
Ht as indicated by the positive cross-derivative FIH(It, Ht) > 0. Larger levels
of human capital increase the productivity of later human capital investments.
δ denotes the rate of depreciation of human capital. Browning, Hansen, and
Heckman (1999) survey empirical estimates of Ben-Porath earnings functions.
Specification ((7)) is consistent with estimates reported by Heckman, Lochner,
and Taber (1998).19
Integrating the asset accumulation constraints and imposing the initial and
terminal conditions on financial wealth gives the life-time budget constraint of
the individual
∫ T
0
Ct exp(−r∗t)dt+
∫ S
0
(1− s)P exp(−r∗t)dt
=
∫ R
S
(1− τL)W (S)HtLt exp(−r∗t)dt+
∫ T
R
B exp(−r∗t)dt, (8)
43

where r∗ ≡ (1− τA)r is the net discount rate.
The individual maximizes life-time utility by choosing consumption, labor
supply, leisure, on-the-job training, education, and retirement subject to the
household budget constraint, the time constraints and the accumulation equa-
tion for on-the-job human capital. The appendix contains the derivation.20
Using standard results we obtain the Euler equation for consumption
CtCt
= θt (r∗ − ρ) , 0 ≤ t ≤ T, (9)
where θt ≡(−U ′′(Ct)Ct
U ′(Ct)
)−1
is the inter-temporal elasticity of substitution in
consumption. If the rate of time preference is lower than the real after-tax
return on financial saving, consumption features an upward sloping profile
over the life-cycle. A larger intertemporal elasticity of substitution results in
a stronger upward sloping consumption profile and a stronger sensitivity of
savings with respect to after-tax returns.21
The labor supply equation is governed by the first order condition:
V ′(Lt)U ′(Ct)
= (1− τL)W (S)Ht, S < t ≤ R. (10)
The marginal willingness to demand leisure time decreases with the net wage
rate and increases with the level of taxation. The gross wage rate increases with
education S and on-the-job human capital Ht. Hence, better skilled workers
supply more labor if the substitution effect dominates the income effect in labor
supply (which is the empirically plausible case; see Browning, Hansen, and
Heckman, 1999). Therefore, this equation implies that labor supply and skill
44

formation are complementary activities. Indeed, the data previously discussed
show that more highly educated workers have higher participation rates and
lower unemployment rates.
The optimal number of years in initial education follows from the first-order
conditions for education, leisure demand, labor supply and training22
∫ R
S
(1− τL)W ′(S)HtLt exp(−r∗(t− S))dt+G′(S)
G(S)
F (IS, 1)
FI(IS, 1)(1− τL)W (S)
= (1− s)P + (1− τL)W (S)
(LS +
LSεS
), (11)
where εt ≡ V ′(Lt)Lt
V (Lt)> 0 is the elasticity of the leisure sub-utility function at
time t.
This is a modified Mincer equation stating that the net present value of
marginal returns to initial education (evaluated at the time of graduation S)
should be equal to net marginal costs on additional year of schooling. The
latter comprise direct, subsidized expenditures and net forgone labor earn-
ings. Years spent in initial education increase when the returns to human
capital investments are larger. This is the case when the working life is longer
and individuals retire later (R larger). We note here that the returns at later
ages are more heavily discounted, so that expanding the retirement age has
only small effects when the discount rate is sufficiently large. The feedback
between retirement and education may gain in strength due to training on-the-
job. On-the-job training becomes more profitable when individuals retire later,
(see below), and this in turn enhances initial investment in education. Returns
increase when individuals invest more in on-the-job training during their work-
45

ing lives (Ht larger) and supply more labor (Lt larger). The standard Mincer
equation ignores the interaction with labor supply and training on-the-job. In
addition, the time horizon is finite and direct costs of education are not neg-
ligible as also noted by Heckman, Lochner and Todd (2006).23 Furthermore,
individuals with a higher level of education have a larger return on investments
in on-the-job human capital as indicated by G′(S)G(S)
F (IS ,1)FI(IS ,1)
(1 − τL)W (S) which
denotes the discounted value of larger human capital investments in training
due to more initial education.
All these results underscore the second important complementarity. Edu-
cational investments increase when the utilization of human capital is larger
and when skills are better maintained through on-the-job training. Initial
schooling is therefore complementary to later retirement, hours worked and
on-the-job training. Again, this is in conformity with the data presented ear-
lier.
Labor taxation directly reduces investments in initial education as long
as the subsidy rate is smaller than the tax rate (τL > s). If the subsidy
rate s equals the tax rate on labor τL taxation is neutral with respect to
human capital investments because then all costs and benefits of human capital
formation are symmetrically affected by the tax and subsidy rates. Capital
income taxation (as reflected in a lower r∗) boosts initial education. The reason
is that higher capital income taxation lowers the net discount rate at which
marginal benefits of education are discounted. Alternatively, one can say that
higher taxes on capital income induce substitution in household life-time asset
portfolio’s from financial towards human assets (see Heckman, 1976). Labor
46

taxation nevertheless reduces labor supply and lower the retirement age (shown
below), hence labor taxation still discourages investments in initial education
by lowering the utilization rate of human capital.
Optimal retirement is given by
X ′(T −R)
λR= (1− τL)W (S)HR
((1− %)LR +
1− LRεR
), (12)
where λt ≡ U ′(C0) exp(−r∗t) is the marginal value of income at time t, and
% ≡ B(1−τL)W (S)HRLR
is the implicit marginal tax rate on additional years of work
due to the presence of (early) retirement incomes.24 The marginal willingness
to pay for an additional year in retirement should be equal to the marginal
costs of an extra year in retirement. The marginal benefit is the marginal
rate of substitution between retirement utility and consumption at the date of
retirement. The marginal costs are given by the value of net the forgone labor
earnings in the last year on the labor market.25
The individual has stronger incentives to retire later if the individual has
more initial education S, has accumulated a higher stock of on-the-job human
capital HR, and supplies more labor effort LR in the retirement year R. The
labor tax directly distorts retirement decisions, because retirement utility is
not taxed, whereas continued work is. This direct impact of labor taxation
on retirement is not often discussed in the literature on retirement (e.g. Gru-
ber and Wise, 1999). Indeed, this literature mainly focuses on the implicit
marginal tax rate on additional years of work, %, due to the presence of ac-
tuarially unfair (early) retirement incomes. The implicit tax % on continued
47

work exacerbates the impact of the labor tax τL on the decision to exit the
labor market. λR ≡ U ′(C0) exp(−r∗R) captures wealth effects in the retire-
ment decision. Richer individuals, with a lower marginal utility of income,
retire earlier – ceteris paribus. The third complementarity is therefore that
retirement is delayed when individuals utilize and maintain their skills better
through working life. Hence, more skilled workers retire later when the income
effect of higher skills are outweighed by the substitution effects of higher skills.
Again, this is in conformity with the data.
Investment in on-the-job training is governed by the following equation
µtλtG(S)FI(It, Ht) = (1− τL)W (S)Ht, (13)
where µt
λtis the shadow value – expressed in monetary units – of one unit
of human capital at time t. This equation states that the marginal costs
of on-the-job human capital investment (right-hand side) should be equal to
the discounted value of marginal benefits in terms of higher wages (left-hand
side). The benefits and costs of OJT investments increase when schooling
levels are higher and when the individual has a higher stock of human capital.
The benefits also increase when the shadow value µt
λtof human capital is large.
Now we see that higher levels of initial education both increase the opportunity
costs of training on-the-job and the marginal benefits of training on the job.
The same holds for a higher stock of on-the-job human capital.
We assume that F (It, Ht) ≡ [Φ(It, Ht)]φ, where 0 < φ < 1 and σ ≡
ΦI(It,Ht)ΦH(It,Ht)ΦIH(It,Ht)Φ(It,Ht)
. φ is a returns to scale parameter and σ is the elasticity of
48

substitution between I and H in the homothetic constant returns to scale sub-
production function Φ(It, Ht). We then find an arbitrage equation between
on-the-job human capital investments and financial saving:
G(S)FH(It, Ht) +G(S)FI(It, Ht)Lt
Ht
+ (14)(1− ωH
σ+ (1− φ)ωH
) Ht
Ht
+(ωHσ
+ (1− φ)(1− ωH)) ItIt
= r∗ + δ,
where ωH ≡ ΦH(It,Ht)Ht
Φ(It,Ht).26 The left-hand-side gives the total returns of one
extra unit of human capital. The right-hand-side gives the required rate of
return on investments in OJT; the net returns on financial savings plus the
rate of depreciation.
The fourth complementarity in skill formation follows from the last equa-
tion. First, individuals with more initial education S will engage in more
on-the-job training because the productivity of OJT investments is enhanced
by higher initial education. This is again in conformity with the data; more
educated workers engage more in training. Second, if labor supply increases
and human capital is more heavily utilized, the marginal returns to invest-
ments in on-the-job training increase. Therefore, individuals who work more
hours or participate more in the labor market have higher returns on train-
ing. Third, if individuals maintain their skills though their working career,
later investments in human capital become more profitable. σ measures the
dynamic complementarity of on-the-job human capital investments. If σ = 0,
it is not possible to remedy neglect of on-the-job training in the early years
of the working career. Early and late investments are perfect complements.
49

If σ > 0 it is to some extent possible to remedy poor skill maintenance early
in working careers. If σ = ∞ initial and later investments are perfect sub-
stitutes. ωH then measures the plasticity of investments in human capital. If
ωH > 1/2 plasticity is smaller at later ages than at early ages. If ωH is close
to 1 it may be very costly to remediate deficient early career investment in
on-the-job training. When ωH = 1, it is impossible.27
The tax rate on labor incomes is absent in the training arbitrage equation.
Linear income taxes affect marginal costs and benefits of training equally and
therefore do not directly reduce training investment.28 Note, however, that la-
bor supply and retirement are distorted by higher taxes. So taxes do indirectly
affect the returns to training by lowering the marginal benefits as the utiliza-
tion rate of the stock of on-the-job human capital falls and the payback-time
of investments decreases. Capital income taxes boost training by lowering the
required rate of return on training investments. Intuitively, a higher capital in-
come tax increases the net present value of additional labor earnings resulting
from larger training efforts.
4.2 Policy impacts
In general, explicit analytical solutions to the model can be found only if one
imposes (strong) functional form restrictions on preferences or technologies. To
illustrate some of the important interactions described in the previous section,
we present some numerical simulations of the model where it is either assumed
that OJT-investments are fixed (Ht ≡ 1, It ≡ 0) and labor supply, initial
investment and retirement are endogenous, or where training and retirement
50

are endogenous, but labor supply and initial investment in human capital are
fixed (i.e, Lt ≡ 1, and S = constant).
In the simulations, the uncompensated labor supply elasticity is set at 0.18
(if endogenous), the uncompensated retirement elasticity is set at 0.2, and
the elasticities of the human capital production function are based on findings
from the literature. The baseline policy variables are τL = 0.5, s = 0.75,
and % = 0.3. These values match (unweighted) averages for the sample of 16
continental European and Anglo-Saxon countries we analyzed in Section 2.
Total marginal tax wedges on labor income (including employer contributions
and local taxes) are 51% for a single household without dependents which earns
the average production wage (OECD, 2007a). 79% is the average of subsidies
on higher education, which probably corresponds better to a marginal subsidy
than the average subsidy on all levels of education (OECD, 2007b). Gruber
and Wise (1999), OECD (2004c), and Duval (2004) show that the implicit tax
on work after age 55 amounts to around 30% for an older worker aged between
55–65, although there are substantial cross-country differences.29 In order
to abstract from various complications in determining effective marginal tax
rates on capital income, we set capital income taxes to zero in the simulations
(τA = 0).30 None of our conclusions depend on this particular assumption.
Jacobs (2009a) and Jacobs (2009b) provide more details on the calibration of
the models and provide extensive sensitivity analyses.
Figure 24 plots the simulated life-cycle labor supply patterns for various
policy experiments for the model where investments in OJT are fixed through-
out the life-cycle. Each panel shows that individuals are enrolled in initial
51

education for the first years of their life-cycle, then labor is supplied during
working life, and the final years of life are spent in retirement. The time path
of labor supply during working lives is downward sloping over the life-cycle
due to income effects as the consumption profile rises with age (not shown).
In the baseline simulation, labor supply at the end of the life cycle is around
60%. If labor supply is interpreted as the employment rate, the downward
sloping path matches falling labor force participation rates over the life cycle
quite well (OECD, 2006a). All figures show that various decisions over the
life-cycle are affected by policy.
As expected, panel A of Figure 24 shows that higher labor taxes result in
less education, lower labor supply and earlier retirement. The model yields an
uncompensated wage elasticity of labor supply of approximately 0.18, which
is not extreme. Although taxes directly distort labor supply, human capital
investment and retirement, life-cycle interactions between labor supply and
human capital decisions reinforce the impact of taxes. As a result, very sub-
stantial declines in labor supply, retirement ages and years of education are
found as labor taxes increase. Indeed, the uncompensated elasticity of the
tax base is 0.46, which more than twice as large as the simple labor supply
elasticity (Jacobs, 2009a). Panel B of Figure 24 shows the impact of educa-
tion policy. This graph most clearly illustrates the importance of the dynamic
interactions over the life-cycle. The subsidy only directly increases human cap-
ital investments, not labor supply and retirement. However, higher education
subsidies indirectly boost labor supply and the retirement age as individuals
become better educated. The costs of leisure and retirement increase with the
52

level of human capital and quite strong effects of higher education subsidies
on labor supply and retirement decisions are found in the simulations. Sim-
ilarly, a larger retirement wedge also shows that human capital investments
and retirement decisions are interacting, see panel C of Figure 24. A lower re-
tirement wedge directly results in later retirement and indirectly also in larger
investment in human capital. The effects are not very large because returns to
education at later points in the life-cycle are heavily discounted. Labor supply
responds marginally to a lower retirement wedge. Substitution effects in wages
– due to a higher education level – are relatively small and income effects –
due to a longer working life – are relatively large. Both effects roughly cancel
out.
Life-cycle interactions only gain in importance when on-the-job training
is allowed to be endogenous. Jacobs (2009b) analyzes a model with exoge-
nous labor supply and initial investment in human capital (i.e, Lt ≡ 1, and
S = constant), but with endogenous retirement and OJT. Figure 25 plots the
effects of labor taxes and retirement policies on investments in OJT, retire-
ment ages, and lifetime earnings profiles. Labor earnings drop to zero at the
retirement age. Investment in OJT is high at the beginning of the working
career, and declines until the retirement age is reached. The reason is that
the payback-time of investments continuously decreases. The life-cycle profile
of labor earnings steadily increases until it peaks and then decreases slightly
afterwards. This reflects both the investment in OJT before the peak and the
depreciation of human capital after the peak. There would be no decline in
labor earnings at the end of the life-cycle in the absence of depreciation of
53

human capital. Labor productivity (not shown) peaks before earnings, since
individuals are still investing some of their time endowment in OJT at the
peak in labor productivity, cf. Ben-Porath (1967) and Heckman (1976). The
individual also has a valuable time endowment after retirement, although it
is steadily depreciating over time. Investment in human capital drops to zero
at retirement, since the marginal value of investment in human capital has
become zero then.
Life-cycle investments in OJT are affected by the labor tax. However, the
labor tax impacts human capital investments only indirectly, since all costs
of OJT are deductible and labor supply is exogenous. A higher (explicit)
tax on retirement reduces OJT-investments to a considerable extent, since
the payback period of investment in human capital falls. Since retirement
is distorted by the presence of the positive implicit tax on retirement, the
effect is substantial. Consequently, life-cycle earnings profiles shift towards
the origin, and earnings peak earlier. Since less time will be invested in OJT,
earnings when young increase slightly. However, lower growth of human capital
stocks implies that earnings at later ages will be (much) lower. This, in turn,
promotes earlier retirement as the opportunity costs of retirement decrease if
wages are lower. A higher implicit tax on retirement gives similar results as
a higher labor tax, since it also gives stronger incentives to retire early. As
a result, investment in human capital declines at all ages. Since less human
capital will be accumulated, workers end up with lower wages at the end of
their careers and they retire earlier. Thus, actuarially very unfair retirement
schemes seriously impair investments in OJT over the life-cycle. This finding
54

confirms the notion that individuals do not invest in skills because they retire
early, and they retire early because they do not invest in skills.
The model simulations clearly demonstrate that the policy environment is
very important to understand life-cycle interactions between education, labor
supply, OJT, and retirement. Human capital formation, labor supply, invest-
ment in OJT, and later retirement are complementary. In panel D of Figure
24 we have simulated the model with exogenous OJT with a set of policy
parameters that correspond with the unweighted averages of the policies of
Anglo-Saxon, Continental European, Mediterranean and Nordic countries, see
also Section 2. We can infer from these simulations that America’s labor sup-
ply is larger than in Europe due to the high marginal taxes on work effort in
Europe. Moreover, the main driver behind the earlier retirement of Europeans
is the larger total tax wedge on retirement. Early retirement in turn depresses
skill maintenance in OJT and lowers wage growth over the life-cycle. The sim-
ulations illustrate the vital importance of human capital policy for Europe.
Indeed, many European countries subsidize initial education much more than
the US, especially in the Nordic countries. Human capital policy is needed
to offset the strong disincentives on skill formation created by various welfare
state arrangements. Without sufficient skill formation, explicit and implicit
taxes on human capital formation would generate too much dependence on
welfare states as skill formation, skill utilization, and skill maintenance would
be retarded. In other words, there is not only a trade-off between equity and
efficiency in the quantity of labor supply, but also a trade-off between equity
and the quality of labor supply.
55

5 Policy conclusions
European welfare states that attempt to protect incomes and labor market
prospects for persons with low skills face important policy challenges. Labor
demand has shifted towards the skilled workers as can be witnessed from in-
creasing earnings inequality and the rising returns to education. The growth
in the supply of human capital is likely to choke off in years to come. Despite
increasing enrollment rates at higher levels of education, resources invested in
Europe remain rather stagnant at all levels (except for the Nordic countries)
and often more targeted on higher education than pre-school and primary ed-
ucation. A substantial fraction of immigrant youths have literacy problems,
drop out from secondary education, do not assimilate and end up dispropor-
tionally in crime or welfare state arrangements. Poverty traps not only result
in insufficient incentives to work, but also insufficient incentives to invest in
human capital. As relative demand for unskilled labor decreases, low skill
workers become increasingly dependent on welfare state arrangements such as
unemployment benefits, public training and labor market policies. In the end,
social cohesion is undermined with a growing divide on labor markets between
the skilled and the unskilled and a larger dependency of low skill workers on
welfare state arrangements.
European welfare states do not only affect skill creation, but also Europe’s
skill utilization is low for a variety of reasons. Hours worked are low and
decreasing. Labor force participation rates are relatively low – especially in
Continental Europe and Mediterranean countries – but increasing which is in
part due to larger female participation rates. Take up rates of benefits for un-
56

employment, sickness, and disability are very substantial. Many unemployed
workers appear to be hidden in generally ineffective active labor market and
training policies. Generous social benefits and high levels of taxation lower la-
bor force participation and hours worked and thereby lower returns on human
capital investments. Generous welfare states create substantial implicit taxes
on the returns to human capital investments through the interaction with the
labor market.
Not only is the utilization rate of European human capital low, also the
maintenance of human capital is worrisome. Effective retirement ages have
fallen dramatically and have landed on a low plateau in recent years. Declining
labor force participation rates of older workers are showing signs of a trend
reversal in some countries (after controlling for the increase in female labor
force participation rates). Individuals spend about one third of their life-time
in retirement. Incentives to retire long before statutory retirement ages are
strong due to generous pension and early retirement schemes. Short payback
times of investments in human capital and steep depreciation rates of skills
undermine the incentives to create and maintain skills through education and
on-the-job training.
In order to maintain welfare states, human capital policies need to be
reinvented. The economic returns to initial investments in human capital are
very high. The economic return to investment at older ages is, however, lower.
Human capital investment is self productive and investments at different ages
are complementary. Self-productivity and complementarity are the reasons
why skill begets skill and learning begets learning. Complementarity implies
57

that early investments need to be followed by later investments if the early
investments are to pay off. Investments in the human capital of children should
expand for both equity and efficiency reasons. The returns to human capital
are high and rising. There is no trade-off between equity and efficiency at early
ages of human development but a substantial trade-off at later ages. Once
skills are crystallized, complementarity implies that the returns are highest
for investment in the most able. At the youngest ages, it is possible to form
ability and create the stock of skills that enrich late adolescent and early
adult human capital investment. Thus early interventions targeted toward the
disadvantaged can be highly effective. Later investments are not.
Policy should therefore focus heavily on early childhood interventions for
children from disadvantaged families. At later ages policies are generally too
costly and ineffective. Given public spending constraints, resources should
be shifted away from higher education to pre-school and primary education.
Private funding for higher education should expand, possibly through income
contingent loans to warrant access. Labor market and training programmes
for older workers should be reformed or abolished in their current form as
their benefits are doubtful and the costs are high. Successful policies focus on
both noncognitive and cognitive skills. The benefits of lower crime rates and
socially more acceptable behavior are substantial. A greater emphasis needs
to be placed on family policy. Early cognitive and noncognitive deficits can
be partially remedied.
Dynamic complementarities are not only important for initial investments
in life, but also for the utilization and the maintenance of skills during working
58

life. Returns to investments early in life will not materialize if early invest-
ments are not followed up by later investments. A precondition for sufficient
returns to investments during working life is a sufficient level of investment
early in life. European human capital policy should take into account the im-
pact of tax-benefit and pension systems and the functioning of labor markets.
European labor markets are distorted due to severe labor market regulations,
high taxes, generous benefit schemes and insider-outsider problems in wage
setting institutions. Eligibility for various types of benefits should become
stricter and perverse income redistribution from the outsiders towards the in-
siders through all kinds of benefit schemes should be reduced. This is both
efficient and equitable, since the outsiders on labor markets are hurt by the
privileged insiders. Reducing distortions in labor markets increases the uti-
lization rates of human capital and enlarges the benefits of initial education
and skill maintenance over the life-cycle. Retirement is heavily subsidized via
early retirement schemes and pension subsidies. These policies create perverse
incentives to utilize and maintain human capital over the life-cycle. Therefore,
early-retirement schemes and pension plans should be made actuarially fairer.
59

Appendix
The Hamiltonian for maximizing life-time utility is given by
H ≡∫ T
0
U(Ct) exp(−ρt)dt+
∫ R
S
V (Lt) exp(−ρt)dt+X(T −R) (15)
+ λ
[∫ R
S
(1− τL)W (S)HtLt exp(−r∗t)dt+
∫ T
R
B exp(−r∗t)dt]
− λ
[∫ T
0
Ct exp(−r∗t)dt+
∫ S
0
(1− s)P exp(−r∗t)dt]
+ µt [G(S)F (It, Ht)− δHt] + νt [1− Lt − It − Lt] ,
where λ is the marginal utility of life-time income, µt is the co-state variable
at time t associated with the on-the-job human capital accumulation equation,
and νt is the shadow value of the time-constraint at time t.
First-order conditions for a maximum are given by
∂H∂Ct
= U ′(Ct) exp(−ρt)− λ exp(−r∗t) = 0, 0 ≤ t ≤ T, (16)
∂H∂Lt
= V ′(Lt) exp(−ρt)− νt = 0, S < t < R, (17)
∂H∂Lt
= λ(1− τL)W (S)Ht exp(−r∗t)− νt = 0, S < t < R, (18)
∂H∂S
= −V (LS) exp (−ρS)− λ(1− s)P exp(−r∗S) (19)
− λ(1− τL)W (S)HSLS exp(−r∗S)
+ λ
∫ R
S
(1− τL)W ′(S)HtLt exp(−r∗t)dt+ µSG′(S)F (IS, HS) = 0,
60

∂H∂R
= V (LR) exp (−ρR)−X ′(T −R) (20)
+ λ ((1− τL)W (S)HRLR −B) exp(−r∗R) = 0,
∂H∂It
= µtG(S)FI(It, Ht)− νt = 0, S < t < R, (21)
∂H∂Ht
= λ(1− τL)W (S)Lt exp(−r∗t) (22)
+ µt [G(S)FH(It, Ht)− δ] = −µt. S < t < R,
In addition, we have to impose a transversality condition on the co-state vari-
able that µR = 0.
The equations in the main text are derived as follows. Note that λ =
U ′ (C0) from the first-order condition for C0. Totally differentiating the first-
order condition for Ct with respect to time gives the Euler equation for con-
sumption in equation (9). Combining the first-order conditions for Ct, Lt, and
Lt yields equation (10). Equation (13) can be found by substituting the first-
order condition for Lt into the first-order condition for It. To derive equation
(11), we obtain from the first-order conditions for Lt and Lt:
V (Lt)λt
exp(−ρt) =1
εt(1− τL)W (S)HtLt, (23)
where λt ≡ U ′ (C0) exp(−r∗t), and εt ≡ V ′(Lt)Lt
V (Lt). Substituting (13) and (23)
in the first-order condition for S and using HS ≡ 1 yields equation (11).
Similarly, substitute (23) in the retirement equation to find (12). Finally,
61

totally differentiate equation (13) to find
− µtµt
=FIIItFI
ItIt
+
(FIHHt
FI− 1
)Ht
Ht
+ r∗. (24)
Substitute this result and equation (13) in the first-order condition for Ht:
G(S)FH(It, Ht) +G(S)FI(It, Ht)Lt
Ht
− FIIItFI
ItIt
+
(1− FIHHt
FI
)Ht
Ht
= r∗ + δ.
(25)
Homogeneous functions of degree φ have the property that its partial deriva-
tives are homogeneous of degree φ − 1. Consequently, we can substitute
FIIIt = (φ− 1)FI − FIHHt into the last equation:
G(S)FH(It, Ht) +G(S)FI(It, Ht)Lt
Ht
(26)
+
(1− φ+
FIHF
FIFH
FHHt
F
)ItIt
+
(1− FIHF
FIFH
FHHt
F
)Ht
Ht
= r∗ + δ.
We assume that F (It, Ht) ≡ [Φ(It, Ht)]φ, which has the following derivatives: FI =
φΦφ−1ΦI , FH = φΦφ−1ΦH , FIH = φΦφ−1ΦIH (1 + (φ− 1)σ). Therefore, we
find FHHF
= φωH and FIHFFIFH
= 1+(φ−1)σφσ
. Substitution of these results yields
equation (14).
62

Notes
1This finding is also reported for the US by Autor, Katz and Kearney
(2008).
2Numerous studies find only small impacts of larger tuition rates on enroll-
ment (Kane, 1994, 1995; Hilmer, 1998; Heckman et al. 1998; Dynarski, 2003;
Card and Lemieux, 2001; Cameron and Heckman, 2001). Part of the expla-
nation is that tuition costs are a relatively minor fraction of the total costs
of education since forgone labor earnings are by far the most important part
(Becker, 1964). Another explanation is that psychic costs play a substantial
role in explaining college choices (Cunha, Heckman and Navarro, 2005).
3Carneiro and Lee (2006) show that standard measures for skill-premia
between higher and lower educated workers are even biased downwards due to
selection into higher education on non-observed characteristics.
4Cunha and Heckman (2008) and Heckman, Lochner and Todd (2006) sur-
vey a large number of studies that show that nonpecuniary factors (associated
with psychic costs, motivations and the like) play a major role in explaining
why minorities and persons from low-income families do not attend college
even though it is financially profitable to do so. Returns to schooling for
marginal entrants attracted into college by changes in tuition are below those
of the average participant. Returns to schooling are lower for people less likely
to attend college.
63

5De la Fuente and Domenech (2006) have constructed a panel data set
for OECD countries of educational attainment for various education levels
and average years of education based on data from national statistical offices
which are supplemented by data from the OECD.
6This coefficient gives the ratio (1 – marginal tax rate)/(1 – average tax
rate) and is smaller than one if the marginal taxes are higher than average
taxes.
7This was first noted by Heckman and Klenow (1998).
8Standard measures for the returns to education or the skill premium rarely
allow for the utilization rate of human capital, however.
9These findings are consistent with a ‘social multiplier’ for leisure demand
as hypothesized by Alesina et al. (2005).
10All countries have witnessed declines of labor force participation rates of
60-64 year old cohorts (not shown). Dramatic declines are found in Finland,
France, Germany, Netherlands, and Spain. In Australia, Canada, Denmark,
Norway, Sweden, and the United States the decline is to an important extent
offset by increases in female force participation. In the other countries this off-
setting effect has been largely absent as female participation rates were falling
too. However, recent increases in Canada, Netherlands and Sweden (as from
1990) are the result of increasing male and female labor force participation
rates. This is, again, likely to be the result of changes in early retirement
schemes.
64

11We have to note that some countries have started to reform their early
retirement schemes in recent years, for example in the Netherlands. The graph
may therefore give a too pessimistic view of the adverse incentives to retire
early.
12This section draws upon research by Heckman (2000); Carneiro and Heck-
man (2003); Cunha, Heckman, Lochner and Masterov (2006); Carneiro, Cunha
and Heckman (2005); and Cunha and Heckman (2007, 2008) that develops the
economic foundation for skill acquisition in modern economies.
13In the popular literature, achievement tests and IQ tests are often con-
fused. Achievement test scores are affected by IQ, schooling inputs, and
noncognitive skills, and are malleable over a much greater range of ages than is
IQ (see Hansen, Heckman, and Mullen, 2004; Cunha and Heckman, 2008; and
Cunha, Heckman and Schennach, 2010). Abilities have an acquired character
although they differ in their malleability at different ages.
14The General Educational Development (GED) program allows secondary-
school individuals to obtain certification through an equivalency exam admin-
istered to dropouts which is comparable to a high-school degree.
15Some macroeconomic cross-country studies by Layard, Nickell and Jack-
man (1991) and Nickell (1997) suggest that active labor market programmes
can be effective in reducing unemployment rates, but these studies do not
control for country-specific effects.
16For simplicity of exposition we do not work with the more general model of
65

skill formation developed and estimated by Cunha, Heckman, and Schennach
(2010)
17One should bear this qualifier in mind at our discussion of the model
simulations. These simulations are only meant to stress the importance of
various complementarities over the life-cycle and these complementarities are
in our view relevant in both competitive and non-competitive labor markets.
18The separability between leisure and retirement from consumption in the
utility function avoids discontinuities in the marginal utility of consumption.
19Initial education is acquired in both families and schools. Our current
formulation lumps human capital formation in families and schools together
during the initial phase. However, human capital formation in schools and
families are by no means perfect substitutes, see for example Cunha, Heck-
man, Lochner and Masterov (2006) for more on this. Investment in on-the-job
human capital takes place mainly in firms. The degree of complementarity be-
tween human capital formation through schools/families and firms is captured
by the productivity of learning in the on-the-job human capital production
function.
20We assume that first-order conditions are necessary and sufficient. The
latter condition is not necessarily fulfilled due to the feedbacks between labor
supply and human capital accumulation. In order to guarantee an interior
solution, elasticities of human capital decisions (schooling and training) and
labor supply decisions (work effort, retirement) should not be too high. Oth-
66

erwise higher investments in human capital (schooling and training) will boost
labor supply (work effort and retirement), which, in turn, increases the return
to human capital investments. This increases human capital investment and
labor supply expands in a second round, which again increases human capital
investments, etc. Only sufficiently strong decreasing returns in schooling and
training and a sufficiently concave leisure and retirement sub-utility functions
ensure an interior solution. We assume that these conditions are met. See
Arrow and Kurz (1970), Blinder and Weiss (1976), and Heckman (1975) for
discussions of sufficiency conditions.
21Browning, Hansen, and Heckman (1999) survey the estimates of θt ob-
tained from micro and macro data.
22Note that HS ≡ 1, since individuals do not train if they are not in the
labor market yet.
23The term LS + LS
εSoriginates from the fact that more time spent on initial
education lowers the time-span over which labor can be supplied or leisure can
be consumed, see the utility function. LS is associated with the marginal loss
of forgone labor earnings, and LS
εSis associated with marginal forgone leisure
time when individuals invest more time in initial education. In the absence of
endogenous leisure demand during working-life, LS = 0, and LS + LS
εSequals
(1− IS). The same is true if the sub-utility function over leisure V (LS) is
linear, i.e., when εS = 1. In that case, more time spent in initial education
reduces the marginal value of working and leisure time during working life
equally.
67

24Note that IR = 0 at the end of the working life.
25Again, there is a term (1 − %)LR + 1−LR
εRrepresenting the impact of re-
tirement on the time-span over which individuals enjoy labor earnings and
ordinary leisure. (1 − %)LR corresponds with the marginal loss of forgone
labor earnings, which are reduced one-for-one with the implicit tax on retire-
ment due to actuarially unfair pensions. 1−LR
εRmeasures the marginal value
of forgone leisure time when individuals retire earlier. In the absence of an
endogenous leisure demand decision and actuarially fair pensions (LR = 1 and
% = 0) this term would vanish. Similarly, the last term cancels out if the leisure
sub-utility function V (LR) is linear (εR = 1), and pensions are actuarially fair
(% = 0). Later retirement then augments the marginal value of working and
leisure time equally.
26Ben-Porath (1967) is a special case of the current model.
27This analysis mirrors those of Cunha and Heckman (2007) and Heckman
(2007).
28Note that direct costs of training are absent.
29Gruber and Wise (1999) report the so-called ‘tax force’ statistic, which
corresponds to the sum of marginal tax wedges on retirement while work-
ing during ages 55–69. Dividing the ‘tax force’ by 15 gives a yearly average
marginal tax wedge on retirement during working ages 55–69. OECD (2004c)
computes marginal tax wedges on retirement which are around 20% (40%) on
average for 55-59 (60-64) year old workers. Duval (2004, p.33) calculates that
68

average implicit tax rates in OECD countries are equal to 30%.
30Good measures of marginal effective tax rates on savings are difficult to
obtain as institutional details are crucial. Taxes on savings may easily be
shifted to labor (consumption) which we cannot account for since we use a
partial equilibrium setup. And, corporate income taxes play a role as well in
determining the effective tax burden on savings. See, for example, Carey and
Rabesona (2004).
69

References
Abbring, Jaap H., Gerard J. van den Berg, and Jan C. van Ours (2005), “The
Effect of Unemployment Insurance Sanctions on the Transition Rate
from Unemployment to Employment”, Economic Journal, 115, 602–630.
Alesina, Alberto F., Edward L. Glaeser, and Bruce Sacerdote (2005), “Work
in the US and Europe: Why so Different?”, NBER Macroeconomic An-
nuals, 2, 1-64.
Altonji, Joseph, and Thomas Dunn (1996), “The Effects of Family Character-
istics on the Return to Education”, Review of Economics and Statistics,
78, (4), 692-704.
Arrow, Kenneth J. (1973), “Higher Education as a Filter”, Journal of Public
Economics, 2, 193-216.
Arrow, Kenneth J., and Kurz, Mordecai (1970), Public Investment, the Rate
of Return, and Optimal Fiscal Policy, Baltimore: Johns Hopkins Press.
Atkinson, Anthony B. (2008), The Changing Distribution of Earnings in
OECD Countries, Oxford: Oxford University Press.
Atkinson, Anthony B., and Wiemer Salverda (2005), “Top Incomes in the
Netherlands and the United Kingdom over the Twentieth Century”,
Journal of the European Economic Association, 3, (4), 883-913.
Autor, David H., Lawrence F. Katz, and Meslissa S. Kearny (2008), “Trends
70
in U.S. Wage Inequality: Re-Assessing the Revisionists”, Review of Eco-
nomics and Statistics, 90, (2), 300–323.
Becker, Gary S. (1964), Human Capital: A Theoretical and Empirical Anal-
ysis with Special Reference to Education. Third edition 1993, Chicago:
Chicago University Press.
Ben-Porath, Yoram (1967), “The Production of Human Capital and the Life
Cycle of Earnings”, Journal of Political Economy, 75, (4), 352-365.
Bertola, Giuseppe (2003), “Earnings Disparities in OECD Countries: Struc-
tural Trends and Institutional Influences”, paper prepared for the joint
OECD/NDRC Understanding China’s Income Disparities seminar, Paris,
20-21 October, 2003.
Bjorklund, Anders, Mikael Lindahl, and Erik J.S. Plug (2006), “The Ori-
gins of Intergenerational Associations: Lessons from Swedish Adoption
Data”, Quarterly Journal of Economics, 121, (3), 999-1028.
Blanchard, Olivier J. (2006), “European Unemployment: The Evolution of
Facts and Ideas”, Economic Policy, 21, (45), 5-59.
Blinder, Alan S. and Yoram Weiss (1976), “Human Capital and Labor Sup-
ply: A Synthesis”, Journal of Political Economy, 84, (3), 449–72.
Blundell, Richard and Thomas MaCurdy (1999), “Labor Supply: A Review of
Alternative Approaches”, in: Orley Ashenfelter and David Card (eds.),
Handbook of Labor Economics – Vol 3A, Amsterdam: Elsevier-North
Holland, 1559-1695.
71

Borghans, Lex, Angela L. Duckworth, James J. Heckman, and Bas ter Weel
(2008), “The Economics and Psychology of Personality Traits”, Journal
of Human Resources, 43, (4), 972–1059.
Bovenberg, A. Lans (2006), “Tax Policy and Labor Market Performance”, in:
Jonas Agell and Peter B. Sørensen (eds.), Tax Policy and Labor Market
Performance, Cambridge-MA: CESifo and MIT-Press, 3-74.
Bovenberg, A. Lans, Johan J. Graafland, and Ruud A. de Mooij (2000), “Tax
Reform and the Dutch Labor Market”, Journal of Public Economics, 78,
193-214.
Bovenberg, A. Lans, and Bas Jacobs (2003), “On the Optimal Distribution
of Income and Education”, unpublished manuscript: University of Am-
sterdam/Tilburg.
Bovenberg, A. Lans, and Bas Jacobs (2005), “Redistribution and Education
Subsidies are Siamese Twins”, Journal of Public Economics, 89, 2005-
2035.
Bovenberg, A. Lans, and Frederick van der Ploeg (1994), “Effects of the Tax
and Benefit System on Wage Formation and Unemployment”, unpub-
lished manuscript: University of Amsterdam/Tilburg.
Brandolini, Andrea, and Timothy M. Smeeding (2008), “Inequality: Interna-
tional Evidence”, in: Steven N. Durlauf and Lawrence E. Blume (eds),
The New Palgrave Dictionary of Economics – Second Edition, Palgrave
Macmillan.
72
Browning, Martin, Lars Peter Hansen, and James J. Heckman (1999), “Micro
Data and General Equilibrium Models”, in: John B. Taylor and Michael
Woodford (eds.), Handbook of Macroeconomics– Vol 1A, Amsterdam:
Elsevier-North Holland, 543-633.
Calmfors, Lars, Anders Forslund, and Maria Hemstrom (2001), “Does Active
Labour Market Policy Work? Lessons from the Swedish Experiences”,
Swedish Economic Policy Review, 85, 61-124.
Cameron, Stephen V., and James J. Heckman (2001), “The Dynamics of
Educational Attainment for Blacks, Hispanics, and Whites”, Journal of
Political Economy, 109, (3), 455-499.
Card, David (1999), “The Causal Effect of Education on Earnings”, in: Orley
Ashenfelter and David Card (eds.), Handbook of Labor Economics – Vol
3A, Amsterdam: Elsevier-North Holland, 1801-1863.
Card, David, and Thomas Lemieux (2001), “Dropout and Enrollment Trends
in the Post-War Period: What Went Wrong in the 1970’s?”, in Jonathan
Gruber (ed.) An Economic Analysis of Risky Behavior Among Youth,
Chicago: University of Chicago Press for NBER, 439-482.
Carey, David, and Josette Rabesona (2004), “Tax Ratios on Labour and
Capital Income and on Consumption”, in: Peter Birch Sørensen (ed.),
Measuring the Tax Burden on Capital and Labor, CESifo Seminar Series,
Cambridge-MA: MIT Press, 213-262.
Carneiro, Pedro, Flavio Cunha, and James J. Heckman (2005), “Human Cap-
73

ital Policy for Europe”, unpublished manuscript: University College Lon-
don/University of Chicago.
Carneiro, Pedro, and James J. Heckman, (2003), “Human Capital Policy,” in
James J. Heckman and Alan B. Krueger (eds.), Inequality in America:
What Role for Human Capital Policy? Cambridge, MA: MIT Press,
77-240.
Carneiro, Pedro, James J. Heckman, and Edward Vytlacil (2006), “Estimat-
ing the Rate of Return to Education When It Varies among Individuals”,
revised version, unpublished manuscript: University of Chicago.
Carneiro, Pedro, Karsten Hansen, and James J. Heckman (2001), “Removing
the Veil of Ignorance in Assessing the Distributional Impacts of Social
Policies”, Swedish Economic Policy Review, 8, 273-301.
Carneiro, Pedro, Karsten Hansen, and James J. Heckman (2003), “Estimat-
ing Distributions of Treatment Effects with an Application to the Re-
turns to Schooling”, International Economic Review, 44, (2), 361-422.
Carneiro, Pedro, and Sokbae Lee (2006), “Changes in College Enrollment
and Wage Inequality: Distinguishing Price and Composition Effects”,
unpublished manuscript: University College London.
Ciccone, Antonio and Giovanni Peri (2006), “Identifying Human Capital Ex-
ternalities: Theory with an Application to US Cities”, Review of Eco-
nomic Studies, 73, 381–412.
74

Cunha, Flavio and James J. Heckman (2007), “Identifying and Estimating
the Distributions of Ex Post and Ex Ante Returns to Schooling”, Labour
Economics, 14, (6), 870-893.
Cuhna, Flavio, and James J Heckman (2007), “The technology of Skill For-
mation. ”, American Economic Review, 97, (2), 31–47.
Cunha, Flavio, and James J. Heckman (2008), “Formulating, Identifying and
Estimating the Technology of Cognitive and Noncognitive Skill Forma-
tion”, Journal of Human Resources, 43, (4), 738-782.
Cunha, Flavio, James J. Heckman, Lance J. Lochner, and Dimitriy V. Mas-
terov (2006), “Interpreting the Evidence on Life Cycle Skill Formation”,
in: Eric Hanushek and Finis Welch (eds), Handbook of Economics of
Education, Amsterdam: Elsevier-North Holland, 697-812.
Cunha, Flavio, James J. Heckman, and Salvador Navarro (2005), “Sepa-
rating Uncertainty from Heterogeneity in Life Cycle Earnings”, Oxford
Economic Papers, 57, (2), 191-261.
Cunha, Flavio, James J. Heckman, and Susanne M. Schennach (2010), “Esti-
mating the Technology of Cognitive and Noncognitive Skill Formation”,
Econometrica, forthcoming.
Davis, Steven J. (1992), “Cross-Country Patterns of Changes in Relative
Wages”, in: Blanchard, Oliver J. and Stanley Fischer (eds), NBER
Macroeconomic Annuals 1992, 239-400.
75

De la Fuente, Angel, and Rafael Domenech (2006), “Human Capital in Growth
Regressions: How Much Difference Does Data Quality Make?”, Journal
of the European Economic Association, 4, (1), 1-36.
De la Fuente, Angel, and Juan Francisco Jimeno-Serrano (2005), “The Private
and Fiscal Returns to Schooling and the Effect of Public Policies on
Private Incentives to Invest in Education: A General Framework and
Some Results for the EU”, CESifo Working Paper 1392, Munich: CESifo.
Duval, Romain (2004), “Retirement Behavior in OECD Countries: Impact
of Old-Age Pension Schemes and Other Social Transfer Programmes”,
OECD Economic Studies, 37, 2003/2, 7-50.
Dynarski, Susan (2003), “Does Aid Matter? Measuring the Effect of Stu-
dent Aid on College Attendance and Completion”, American Economic
Review, 93, (1), 279-288.
Edin, Per-Anders, and Bertil Holmlund (1995), “The Swedish Wage Struc-
ture: The Rise and Fall of Wage Policy?”, in: Richard B. Freeman
and Lawrence F. Katz, Differences and Changes in Wage Structures,
Chicago: Chicago University Press, 307-343.
European Commission (2005), “Study on Access to Education and Training,
Basic Skills and Early School Leavers (Ref. DG EAC 38/04); Lot 3:
Early School Leavers Final Report”, Brussels: European Commission
DG EAC.
76

Frederiksson, Peter (1997), “Economic Incentives and the Demand for Higer
Education”, Scandinavian Journal of Economics, 99, (1), 129-142.
Gordon, Kathryn, and Henry Tchilinguirian (1998), “Marginal Effective Tax
Rates on Physical, Human and R&D Capital”, OECD Working Paper
No. ECO/WKP(98)12, Paris: OECD.
Gottschalk, Peter, and Timothy M. Smeeding (1996), “Cross-National Com-
parisons of Earnings and Income Inequality”, Journal of Economic Lit-
erature, 35, (2), 633-687.
Gruber, Jonathan, and David Wise (1999), Social Security and Retirement
around the World, Chicago: Chicago University Press.
Hanushek, Eric, and Dennis D. Kimko (2000), “Schooling, Labor Force Qual-
ity, and the The Growth of Nations”, American Economic Review, 90,
(5), 1184-1208.
Hansen, Karsten, James J. Heckman, and K.J. Kathleen Mullen (2004), “The
Effect of Schooling and Ability on Achievement Test Scores”, Journal of
Econometrics, 121, (1-2), 39-98.
Harmon Colm, Hessel Oosterbeek, and Ian Walker (2003), “The Returns to
Education: Microeconomics”, Journal of Economic Surveys, 17, 115-155.
Heckman, James J. (1975), “Estimates of a Human Capital Production Func-
tion Embedded in a Life-Cycle Model of a Labor Supply”, in N. E. Ter-
leckyj (ed), Household Production and Consumption, New York: National
Bureau of Economic Research.
77

Heckman, James J. (1976), “A Life Cycle Model of Earnings, Learning and
Consumption”, Journal of Political Economy, 4, S11-S44.
Heckman, James J. (1993), “What Has Been Learned about Labor Supply in
the Past Twenty Years?”, American Economic Review, 83, 116–121.
Heckman, James J. (2000), “Policies to Foster Human Capital”, Research in
Economics 54, (1), 3-56.
Heckman, James J. (2006), “Skill Formation and the Economics of Investing
in Disadvantaged Children”, Science, 312, (5782), 1900–1902.
Heckman, James J. (2007), “The Economics, Technology, and Neuroscience
of Human Capability Formation”, Proceedings of the National Academy
of Sciences, 104, (3), 13250–13255.
Heckman, James J., Neil Hohmann, Michael Khoo, and Jeffrey Smith (2000),
“Substitution and Dropout Bias in Social Experiments: A Study of an
Influential Social Experiment”, Quarterly Journal of Economics, 115,
(2), 651-694.
Heckman, James J., and Bas Jacobs (2006), “Reinventing Human Capital
Policy”, paper prepared for the Netspar-SER-CPB conference, Reinvent-
ing the Welfare State, April 27-28, 2006, The Hague, The Netherlands.
Browning, Martin, Lars Peter Hansen, and James J. Heckman (1999), “Micro
Data and General Equilibrium Models”, in John B. Taylor and Michael
Woodford (eds.), Handbook of Macroeconomics – Vol 1A, Amsterdam:
Elsevier, 543–633.
78
Heckman, James J., Jingjing Hsee, and Yona Rubinstein (2001), “The GED
is a ‘Mixed Signal’: The Effect of Cognitive and Noncognitive Skills on
Human Capital and Labor Market Outcomes”, unpublished manuscript:
University of Chicago.
Heckman, James J., and Peter J. Klenow (1998), “Human Capital Policy”,
in: Michael Boskin (ed), Policies to Promote Human Capital Formation,
Hoover Institution.
Heckman, James J., and Paul LaFontaine (2006), “Bias Corrected Estimates
of GED Returns”, Journal of Labor Economics, in press.
Heckman, James J., Robert J. Lalonde, and Jeffrey A. Smith (1999), “The
Economics and Econometrics of Active Labor Market Programs”, in Or-
ley Ashenfelter and David Card (eds.), Handbook of Labor Economics –
Vol 3A, Amsterdam: Elsevier-North Holland, 1865-2097.
Heckman, James J., Martin Ljunge, and Kelly S. Ragan (2006), “What
are the Key Employment Challenges and Policy Priorities for OECD
Countries”, University of Chicago Department of Economics unpublished
manuscript, presented at the “Boosting Jobs and Incomes” conference,
Toronto, Ontario, Canada, June, 2006.
Heckman, James J., Lance J. Lochner, and Christopher Taber (1998), “Ex-
plaining Rising Wage Inequality: Explorations with a Dynamic General
Equilibrium Model of Labor Earnings with Heterogeneous Agents”, Re-
view of Economic Dynamics, 1, 1-58.
79

Heckman, James J., Lance J. Lochner, Petra E. Todd (2006), “Earnings
Functions, Rates of Return and Treatment Effects: The Mincer Equation
and Beyond”, in Eric Hanushek, and Finis Welch (eds), Handbook of
Economics of Education, Amsterdam: Elsevier-North Holland, 307-458.
Heckman, James J., Lena Malofeeva, Rodrigo Pinto, and Peter A. Save-
lyev (2009), “The Powerful Role of Noncognitive Skills in Explaining
the Effect of the Perry Preschool Program”, unpublished manuscript:
University of Chicago, Department of Economics.
Heckman, James J., and Dimitriy V. Masterov (2006), “The Productivity
Argument for Investing in Young Children”, discussion paper: Early
Childhood Research Collaborative, University of Minnesota.
Heckman, James J., and Carmen Pages (2003), “Law and Unemployment:
Lessons from Latin America and the Carribbean”, NBER Working Paper
10129, Cambridge MA: NBER.
Heckman, James J., and Carmen Pages (2004), Law and Employment: Lessons
from Latin American and the Caribbean, Chicago: University of Chicago
Press.
Heckman, James J., and Yona Rubinstein (2001), “The Importance of Noncog-
nitive Skills: Lessons from the GED Testing Program”, American Eco-
nomic Review, 91, (2), 145-149.
Heckman, James J., Jora Stixrud, and Sergio Urzua (2006), “The Effects of
Cognitive and Noncognitive Abilities on Labor Market Outcomes and
80
Social Behavior”, Journal of Labor Economics, 24, (3), 411-482.
Hilmer, Michael J. (1998), “Post-Secondary Fees and the Decision to Attend
a University or a Community College”, Journal of Public Economics, 67,
329–348.
Jacobs, Bas (2004), “The Lost Race between Schooling and Technology”, De
Economist, 152, 1, 47-78.
Jacobs, Bas (2005), “Optimal Income Taxation with Endogenous Human
Capital”, Journal of Public Economic Theory, 7, (2), 295-315.
Jacobs, Bas (2007), “Optimal Tax and Education Policies and Investments
in Human Capital”, in: Hartog, Joop, and Henriette Maassen van den
Brink, Human Capital: Moving the Frontier, Cambrige: Cambridge Uni-
versity Press, 212-232.
Jacobs, Bas (2009a), “Is Prescott Right? Welfare State Policies and the
Incentives to Work, Learn and Retire”, International Tax and Public
Finance, 16, 253-280.
Jacobs, Bas (2009b), “Human Capital, Retirement and Pension Saving”, in:
A. Lans Bovenberg and Arthur van Soest (eds) (2010), Ageing, Health
and Pensions in Europe – Forward Looks 2006 ESF, Strasbourg: Euro-
pean Science Foundation, forthcoming.
Jacobs, Bas, and Frederick van der Ploeg (2006), “Guide to Reform of Higher
Education: A European Perspective”, Economic Policy, 21, (47), 536-
592.
81

Kane, Thomas J. (1994), “College Entry by Blacks since 1970: The Role
of College Costs, Family Background and the Returns to Education”,
Journal of Political Economy, 102, (5), 878-911.
Kane, Thomas J. (1995), “Rising Public Tuition and College Entry: How well
do Public Subsidies Promote Access to College”, NBER Workingpaper,
5164, Cambridge MA: NBER.
Katz, Lawrence F., and Kevin M. Murphy (1992), “Changes in Relative
Wages 1963-1987: Supply and Demand Factors”, Quarterly Journal of
Economics, 107, 35-78.
Katz, Lawrence F., and David H. Autor (1999), “Changes in the Wage Struc-
ture and Wage Inequality”, in: Orley Ashenfelter and David Card (eds.),
Handbook of Labor Economics Vol. 3A, Amsterdam: Elsevier-North Hol-
land, 1463-1555.
Killingsworth, Mark R., and James J. Heckman (1986), “Female labor Sup-
ply: A Survey”, in: Ashenfelter, Orley and Richard Layard (eds), Hand-
book of Labor Economics - Vol. I, Amsterdam: Elsevier-North Holland,
103-204.
Knudsen, Eric, James J. Heckman, Judy Cameron, and Jack Shonkoff (2006),
“Economic, Neurobiological and Behavioral Perspectives on Building
America’s Future Workforce”, Proceedings of the National Academy of
Sciences, 103, (27), 10155-10162.
82

Krueger, Alan B., and Mikael Lindahl (2001), “Education for Growth: Why
and for Whom?”, Journal of Economic Literature, 39, 1101-1136.
Lalive, Rafael, Jan C. van Ours, and Josef Zweimuller (2005), “The Effects
of Benefit Sanctions on the Duration of Unemployment”, Journal of the
European Economic Association, 3, 1386-1417.
Lalive, Rafael, Jan C. van Ours, and Josef Zweimuller (2006), “How Changes
in Financial Incentives Affect the Duration of Unemployment”, Review
of Economic Studies, 73, (4), 1009-1038.
Layard, Richard, Stephen Nickell and, Richard Jackman (1991), Unemploy-
ment, Oxford: Oxford University Press.
Lindbeck, Assar, and Sven Nyberg (2006), “Raising Children to Work Hard:
Altruism, Work Norms and Social Insurance”, Quarterly Journal of Eco-
nomics, 121, (4), 1473-1503.
Ljunge, Martin (2006), “Half the Job Is Showing Up: Returns to Work, Taxes,
and Sick Leave Choices”, Ph.D. Dissertation, University of Chicago, June
2006.
Ljungqvist, Lars and Thomas J. Sargent (1998), “The European Unemploy-
ment Dilemma”, Journal of Political Economy, 106, (3), 514–550.
Ljungqvist, Lars and Thomas J. Sargent (2002), “The European Employment
Experience”, CEPR Discussion Paper 3543, London: CEPR.
83

Martin, John, and David Grubb (2001), “What Works and for Whom: A Re-
view of OECD Countries’ Experience with Active Labour Market Poli-
cies”, Swedish Economic Policy Review, 8, (2), 9-56.
Mincer, Jacob (1974), Schooling, Experience, and Earnings, Cambridge MA:
NBER, distributed by Columbia University Press, New York.
Murphy, Kevin M., W. Craig Riddell, and Paul M. Romer (1998), “Wages,
Skills, and Technology in the United States and Canada”, in: Elhanan
Helpman (ed.) (1998), General Purpose Technologies and Economic
Growth, Cambridge MA: MIT Press, 283-309.
Nahuis, Richard, and Henri L.F. de Groot (2003), “Rising Skill Premia: You
Ain’t Seen Nothing Yet?”, CPB Discussion Paper No 20: The Hague:
CPB Netherlands Bureau for Economic Policy Analysis.
Nickell, Stephen (1997), “Unemployment and Labor Market Rigidities: Eu-
rope versus North America”, Journal of Economic Perspectives, 11, (3),
55-74.
Nickell, Stephen (2003), “Poverty and Worklessness in Britain”, Economic
Journal, 114, C1-C25.
OECD (2003), Education at a Glance, Paris: OECD.
OECD (2004a), Learning for Tomorrow’s World First Results from PISA
2003, Paris: OECD.
OECD (2004b), Benefits and Wages, Paris: OECD.
84

OECD (2004c), The Labor Force Participation of Older Workers: The Ef-
fects of Pension and Early Retirement Schemes, Working Paper, OECD
Economics Department, May 2004.
OECD (2005a) Education at a Glance, Paris: OECD.
OECD (2005b), OECD Factbook, Paris OECD.
OECD (2005c), OECD Social Indicators, Paris: OECD.
OECD (2005d), Pensions at a Glance, Paris: OECD.
OECD (2005e), OECD Tax Database, Paris: OECD.
OECD (2006a), OECD Labor Force Statistics Database, Paris: OECD.
OECD (2006b), OECD Social Indicators, Paris: OECD.
OECD (2006c), OECD Education Database, Paris: OECD.
Ours, Jan C. van, and Michele Belot (2001), “Unemployment and Labor
Market Institutions: An Empirical Analysis”, Journal of Japanese and
International Economies, 15, (4), 403-418.
Pencavel, John (1986), “Labor Supply of Men: A Survey”, in: Ashenfelter,
Orley, and Richard Layard (eds), Handbook of Labor Economics - Vol I,
Amsterdam: Elsevier-North Holland, 3-102.
Peracchi, Franco (2006), “Educational Wage Premia and the Distribution of
Earnings: An International Perspective”, in: Eric Hanushek and Finis
85

Welch (eds), Handbook of Economics of Education, Amsterdam: Elsevier-
North Holland, 189-254.
Piketty, Thomas (2003), “Income Inequality in France, 1901-1998”, Journal
of Political Economy, 111, 1004–1042.
Piketty, Thomas, and Emmanuel Saez (2003), “Income Inequality in the
United States 1913-1998”, Quarterly Journal of Economics, 118, (1),
1-39.
Pissarides, Cristopher A. (1998), “The Impact of Employment Tax Cuts on
Unemployment and Wages: The Role of Unemployment Benefits and
Tax Structure”, European Economic Review, 42, 155–183.
Phelps, Edmund S. (ed) (2003), Designing Social Inclusion: Tools to Raise
Low-End Pay and Employment in Private Enterprise, Cambridge: Cam-
bridge University Press.
Ploeg, Frederick van der (2006), “Do Social Policies Harm Employment?
Second-Best Effects of Taxes and Benefits on Labor Markets”, in: Jonas
Agell and Peter B. Sørensen (eds.), Tax Policy and Labor Market Per-
formance, Cambridge-MA: CESifo and MIT-Press, 97-144.
Prescott, Edward C. (2004), “Why Do Americans Work So Much More Than
Europeans?” Federal Reserve Bank of Minneapolis Quarterly Review, 28,
(1), 2-13.
Raudenbush, Stephen W. (2006), “Schooling, Statistics and Poverty: Mea-
suring School Improvement and Improving Schools”, Inaugural Lecture,
86

Division of Social Sciences, University of Chicago.
Saez, Emmanuel (2002), “Optimal Income Transfer Programs: Intensive
Versus Extensive Labor Supply Responses”, Quarterly Journal of Eco-
nomics, 117, 1039-1073
Sianesi, Barbara, and John van Reenen (2002), “The Returns to Education:
Macroeconomics”, Journal of Economic Surveys, 17, 2, 1-114.
Sørensen, Peter B. (1997), “Public Finance Solutions to the European Un-
employment Problem”, Economic Policy, 12, (25), 221-264.
Sørensen, Peter B. (1999), “Optimal Tax Progressivity in Imperfect Labour
Markets”, Labour Economics, 6, (3), 435-452.
Taber, Christopher (2001). “The Rising College Premium in the Eighties:
Return to College or Return to Unobserved Ability?”, Review of Eco-
nomic Studies, 68, (3), 665-691.
Turkheimer, Eric, Andreana Haley, Mary Waldron, Brian D’Onofrio, and
Irving I. Gottesman (2003), “Socioeconomic Status Modifies Heritability
of IQ in Young Children”, Psychological Science, 14, 6, 623-628.
87

Fig
ure
1:H
idden
unem
plo
ym
ent
inA
LM
P
Diff
eren
ces
betw
een
Ope
n an
d Fu
ll U
nem
ploy
men
t, 19
98-2
004
aver
ages
0.0
1.0
2.0
3.0
4.0
5.0
6.0
7.0
8.0
9.0 Norw
ayCze
chGree
ce
UKAus
tralia
German
y Switzerl
and
Finlan
dIre
land Den
markSwed
en Netherl
ands
Belgium
% points
Key
:T
he
grap
hsh
ows
the
diff
eren
ceb
etw
een
the
true
(‘fu
ll’)
unem
plo
ym
ent
rate
and
the
rep
orte
d(‘
open
’)unem
plo
ym
ent
rate
due
todis
guis
ing
unem
plo
yed
per
sons
astr
ainee
s.Sou
rce:
Hec
km
an,
Lju
nge
and
Rag
an(2
006)
.
88
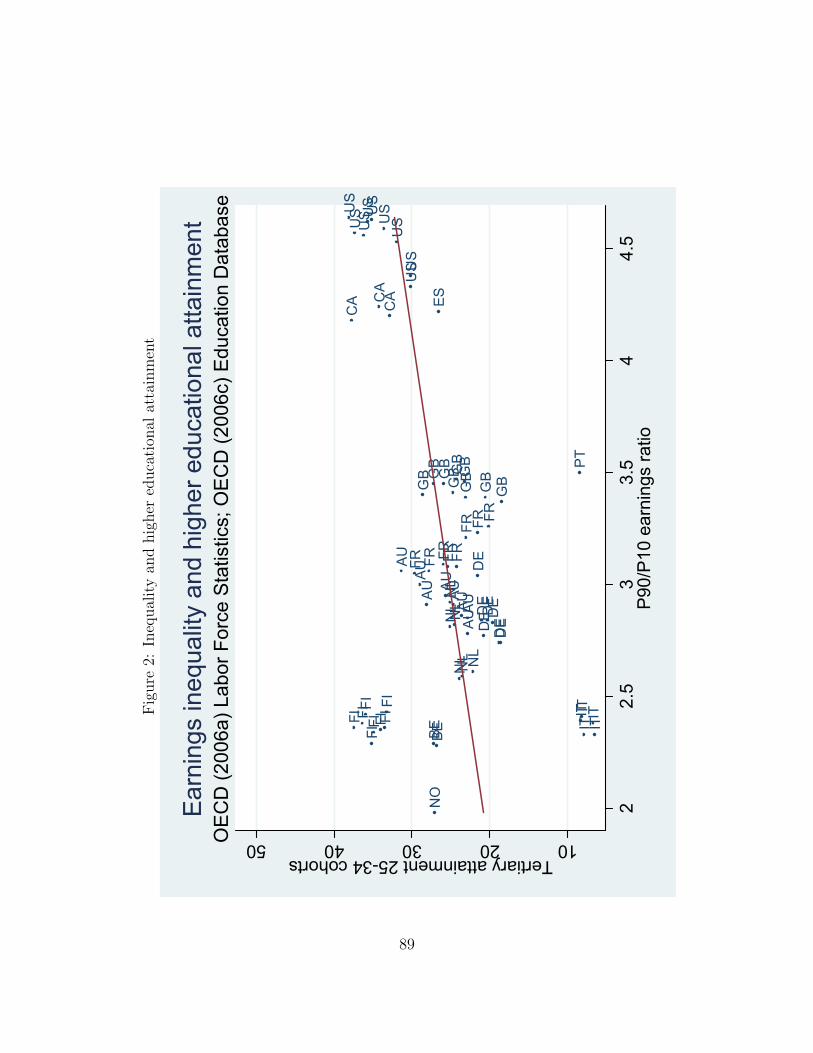
Fig
ure
2:In
equal
ity
and
hig
her
educa
tion
alat
tain
men
t
AU
AUA
UAUA
UA
UA
UAU
BEBE
CAC
A
CA
DE
DE
DEDE D
ED
ED
E
ES
FIFIFIFI
FIFI F
IFI
FRFRFRFRFRF
RFRFR
GBGB
GBG
BGB
GBG
BG
BG
B
ITIT
ITITIT
NL
NL
NL
NL
NL
NL
NO
PT
USU
SU
SUSU
SU
SU
SUSU
S
1020304050Tertiary attainment 25-34 cohorts
22.
53
3.5
44.
5P
90/P
10 e
arni
ngs
ratio
OE
CD
(200
6a) L
abor
For
ce S
tatis
tics;
OE
CD
(200
6c) E
duca
tion
Dat
abas
eE
arni
ngs
ineq
ualit
y an
d hi
gher
edu
catio
nal a
ttain
men
t
89
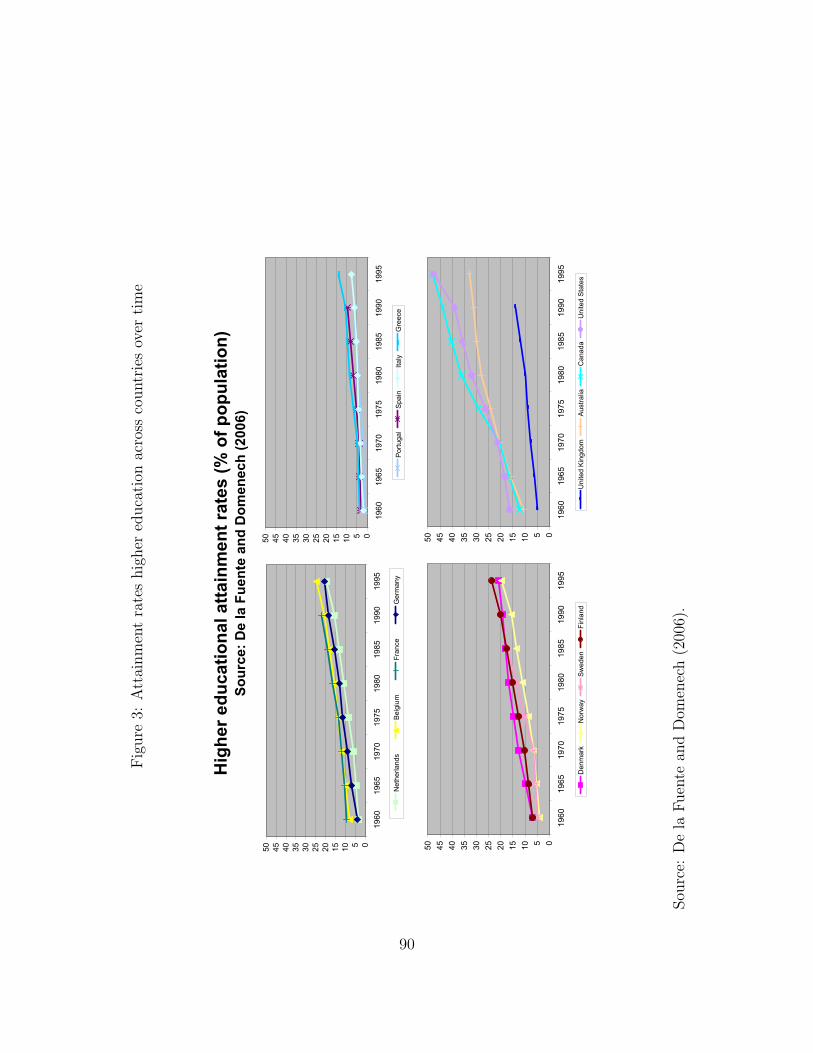
Fig
ure
3:A
ttai
nm
ent
rate
shig
her
educa
tion
acro
ssco
untr
ies
over
tim
e
Hig
her e
duca
tiona
l atta
inm
ent r
ates
(% o
f pop
ulat
ion)
Sour
ce: D
e la
Fue
nte
and
Dom
enec
h (2
006)
05101520253035404550
1960
1965
1970
1975
1980
1985
1990
1995
Net
herla
nds
Bel
gium
Fran
ceG
erm
any
05101520253035404550
1960
1965
1970
1975
1980
1985
1990
1995
Por
tuga
lS
pain
Italy
Gre
ece
05101520253035404550
1960
1965
1970
1975
1980
1985
1990
1995
Den
mar
kN
orw
ayS
wed
enFi
nlan
d
05101520253035404550
1960
1965
1970
1975
1980
1985
1990
1995
Uni
ted
Kin
gdom
Aus
tralia
Can
ada
Uni
ted
Sta
tes
Sou
rce:
De
laF
uen
tean
dD
omen
ech
(200
6).
90

Fig
ure
4:G
row
thin
year
sof
educa
tion
and
init
ial
leve
lsof
educa
tion
Gro
wth
rate
hum
an c
apita
l sto
cks
1960
-199
0/95
Sour
ce: D
e la
Fue
nte
and
Dom
enec
h (2
006)
US
SW
PT
NZ
NO
NL
JP
IT
IE
GR
GB
FR
FIE
S
DK
DE
CH
CA
BE
AT
AU
grow
th(1
960-
1995
) = -0
.001
*sto
ck(1
960)
+ 0
.015
R2 =
0.8
17
0.00
%
0.20
%
0.40
%
0.60
%
0.80
%
1.00
%
1.20
%
45
67
89
1011
12
Ave
rage
yea
rs o
f ini
tial e
duca
tion
1960
Average growth rate per year
91

Fig
ure
5:C
han
gein
tota
lre
sourc
esin
vest
edin
pri
mar
y,se
condar
yan
dte
rtia
ryed
uca
tion
acro
ssco
untr
ies
over
tim
e
Tota
l exp
endi
ture
on
educ
atio
n (%
GD
P)So
urce
: OEC
D (2
005b
) Fac
tboo
k, O
ECD
(200
6c) E
duca
tion
Dat
a B
ase
4.00
%
4.50
%
5.00
%
5.50
%
6.00
%
6.50
%
7.00
%
7.50
%
8.00
%
8.50
%
9.00
%
1992
1993
1994
1995
1996
1997
1998
1999
2000
2001
2002
neth
erla
nds
franc
ege
rman
ypo
rtuga
lsp
ain
italy
4.00
%
4.50
%
5.00
%
5.50
%
6.00
%
6.50
%
7.00
%
7.50
%
8.00
%
8.50
%
9.00
%
1992
1993
1994
1995
1996
1997
1998
1999
2000
2001
2002
denm
ark
norw
aysw
eden
finla
ndau
stra
liaca
nada
unite
d st
ates
92

Fig
ure
6:Shar
eof
pri
vate
fundin
gin
educa
tion
acro
ssco
untr
ies
Shar
e of
pub
lic e
xpen
ditu
res
in to
tal d
irect
exp
endi
ture
s on
edu
catio
n (2
002)
Sour
ce: O
ECD
(200
5a) E
duca
tion
at a
Gla
nce
(Can
ada:
val
ues
1995
)
40.0
50.0
60.0
70.0
80.0
90.0
100.
0
Netherl
ands
Belgium
France
German
y
Portug
al
Spain
Italy
Greece
Denmark
Norway
Sweden
Finlan
d United
Kingdo
m
Austra
lia
Canad
a United
States
Percent
Pre
-prim
ary
educ
atio
nP
rimar
y, s
econ
dary
and
po
st-s
econ
dary
non
-terti
ary
educ
atio
nTe
rtiar
y ed
ucat
ion
93

Fig
ure
7:T
rain
ing
by
educa
tion
leve
lac
ross
countr
ies
Tot
al
Leve
l 1
Leve
l 2
Leve
l 3
Leve
l 4/5
LITE
RA
CY
AN
DA
DU
LTE
DU
CA
TIO
NPA
RTI
CIP
ATI
ON
Per
cen
t of
pop
ulat
ion
aged
16-
65 p
artic
ipat
ing
in a
dult
educ
atio
n an
d tr
aini
ng d
urin
g th
e ye
arpr
eced
ing
the
inte
rvie
w a
t ea
ch l
itera
cy l
evel
and
in
tota
l, do
cum
ent
scal
e, 1
994-
1998
Cou
ntri
es a
re r
anke
d by
the
tot
al p
arti
cipa
tion
rat
e.S
ou
rce:
Inte
rnat
iona
l A
dult
Lit
erac
y S
urve
y, 1
994-
1998
.
Finland
Norway
Netherlands
Australia
New Zealand
Denmark
United States
Poland
Hungary
Slovenia
Chile
Czech Republic
Ireland
United Kingdom
Belgium (Flanders)
Canada
Switzerland
100 80
60
40
20 0
100
80
60
40
20 0
Tota
lpa
rtic
ipat
ion
rate
Leve
l 1
Leve
l 2
Leve
l 3
Portugal
Sweden
Per
cent
Leve
l 4/
5
Not
e:D
ocu
men
tlite
racy
mea
sure
sth
eknow
ledge
and
skills
requir
edto
loca
tean
duse
info
rmat
ion
conta
ined
inva
riou
sfo
rmat
s,in
cludin
gjo
bap
plica
tion
s,pay
roll
form
s,tr
ansp
orta
tion
sched
ule
s,m
aps,
table
san
dgr
aphic
s.T
rain
ing
ism
easu
red
asen
rollm
ent
inso
me
form
ofor
ganiz
edad
ult
educa
tion
ortr
ainin
gduri
ng
the
year
pre
cedin
gth
ein
terv
iew
.Sou
rce:
OE
CD
(200
3).
94

Fig
ure
8:Sp
endin
gon
lab
orm
arke
tpro
gram
sac
ross
countr
ies
Tota
l exp
endi
ture
on
trai
ning
and
pas
sive
/act
ive
labo
r mar
ket
prog
ram
mes
(%G
DP)
Sour
ce: O
ECD
(200
6a) L
abor
For
ce S
tatis
tics
0
0.51
1.52
2.53
3.54
4.55
Netherl
ands
Belgium
France
German
y Portug
alSpa
in
Italy
Greece
Denmark
Norway
Sweden
Finlan
d
United
King
dom
Austra
liaCan
ada
United
States
%GDP
2001
2002
2003
2004
95

Fig
ure
9:L
abor
pro
duct
ivit
ygr
owth
Ann
ualiz
ed p
erce
ntag
e in
crea
se in
labo
r pro
duct
ivity
(199
3-20
06)
Sour
ce: O
ECD
(200
5b) F
actb
ook
0
0.51
1.52
2.53
Netherl
ands
Belgium
France
German
yPort
ugal
Spain
Italy
Greece
Denmark
Norway
Sweden
Finlan
dUnit
ed K
ingdo
mAus
tralia
Canad
aUnit
ed Stat
es
%
96
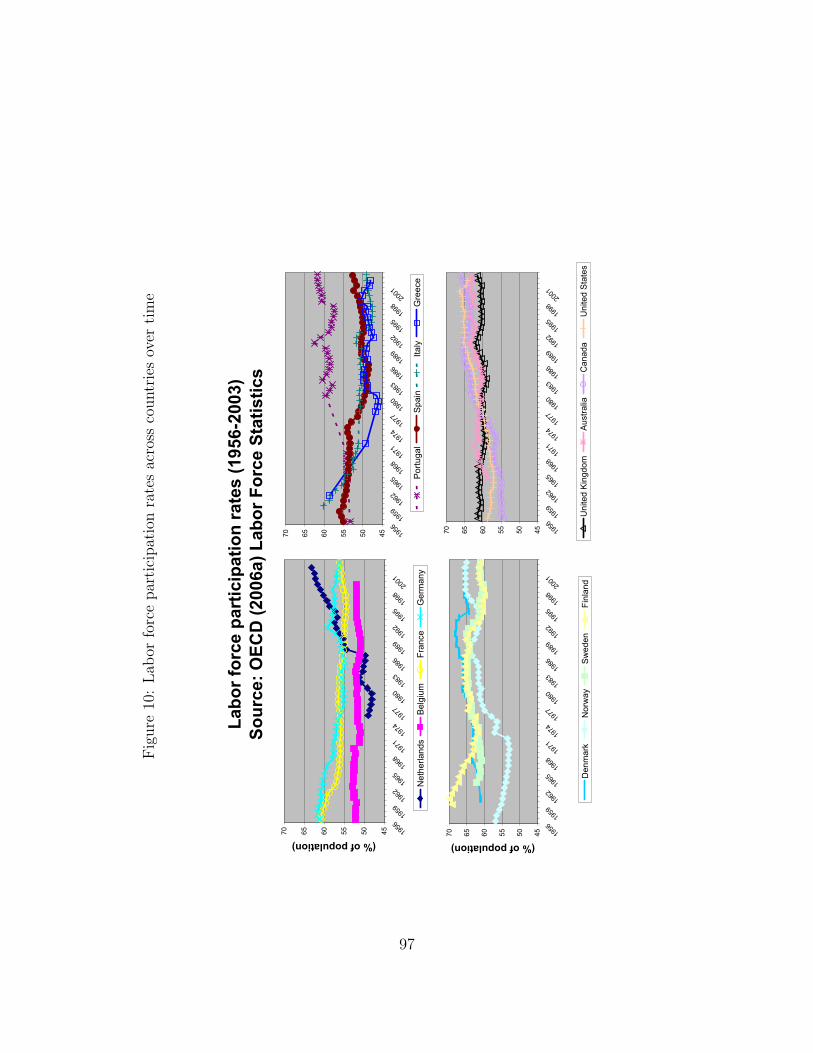
Fig
ure
10:
Lab
orfo
rce
par
tici
pat
ion
rate
sac
ross
countr
ies
over
tim
e
Labo
r for
ce p
artic
ipat
ion
rate
s (1
956-
2003
)So
urce
: OEC
D (2
006a
) Lab
or F
orce
Sta
tistic
s
455055606570 1956
1959
1962
1965
1968
1971
1974
1977
1980
1983
1986
1989
1992
1995
1998
2001
Uni
ted
Kin
gdom
Aus
tralia
Can
ada
Uni
ted
Sta
tes
455055606570 1956
1959
1962
1965
1968
1971
1974
1977
1980
1983
1986
1989
1992
1995
1998
2001
(% of population)
Den
mar
kN
orw
ayS
wed
enFi
nlan
d
455055606570 1956
1959
1962
1965
1968
1971
1974
1977
1980
1983
1986
1989
1992
1995
1998
2001
Por
tuga
lS
pain
Italy
Gre
ece
455055606570 1956
1959
1962
1965
1968
1971
1974
1977
1980
1983
1986
1989
1992
1995
1998
2001
(% of population)
Net
herla
nds
Bel
gium
Fran
ceG
erm
any
97

Fig
ure
11:
Par
tici
pat
ion
rate
sby
leve
lof
educa
tion
acro
ssco
untr
ies
Empl
oym
ent r
ates
by
leve
l of e
duca
tion
(200
3)So
urce
: OEC
D (2
005a
) Edu
catio
n at
a G
lanc
e
0102030405060708090100
Netherl
ands
1
Belgium
France
Germ
any
Portug
al
Spain
Italy
Greece
Denmark
Norway
Sweden
Finlan
d United
Kingdo
m
Austra
lia
Canad
a United
States
Employment rate (%)
Prim
ary
educ
atio
n or
low
erLo
wer
sec
onda
ry e
duca
tion
Hig
her s
econ
dary
voc
atio
nal (
shor
t)H
ighe
r sec
onda
ry v
ocat
iona
l (lo
ng)
Hig
her s
econ
dary
gen
eral
Hig
her e
duca
tion
(sho
rt)H
ighe
r edu
catio
n (lo
ng)
98

Fig
ure
12:
Non
-em
plo
yed
dis
able
dan
dsi
ckw
orke
rsac
ross
countr
ies
Non
-em
ploy
ed s
ick
and
disa
bled
wor
kers
(% o
f lab
or fo
rce)
Sour
ce: O
ECD
(200
5c) S
ocia
l Ind
icat
ors
0.0
2.0
4.0
6.0
8.0
10.0
12.0 Neth
erlan
ds
Belgium
France
German
y
Portug
al
Spain
Italy
Denmark
Norway
Sweden Unit
ed King
dom
Austra
lia
Canad
aUnit
ed Stat
es
99
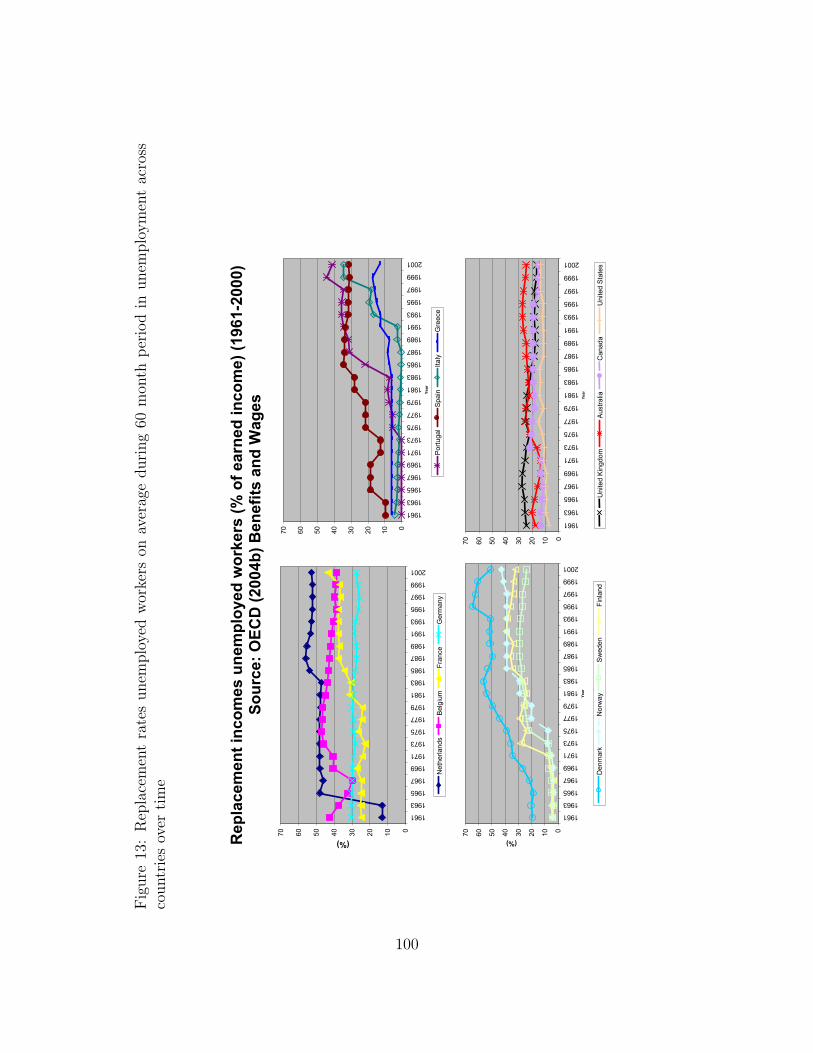
Fig
ure
13:
Rep
lace
men
tra
tes
unem
plo
yed
wor
kers
onav
erag
eduri
ng
60m
onth
per
iod
inunem
plo
ym
ent
acro
ssco
untr
ies
over
tim
e
Rep
lace
men
t inc
omes
une
mpl
oyed
wor
kers
(% o
f ear
ned
inco
me)
(196
1-20
00)
Sour
ce: O
ECD
(200
4b) B
enef
its a
nd W
ages
010203040506070
1961
1963
1965
1967
1969
1971
1973
1975
1977
1979
1981
1983
1985
1987
1989
1991
1993
1995
1997
1999
2001
(%)
Net
herla
nds
Bel
gium
Fran
ceG
erm
any
010203040506070
1961
1963
1965
1967
1969
1971
1973
1975
1977
1979
1981
1983
1985
1987
1989
1991
1993
1995
1997
1999
2001
Year
Por
tuga
lS
pain
Italy
Gre
ece
010203040506070
1961
1963
1965
1967
1969
1971
1973
1975
1977
1979
1981
1983
1985
1987
1989
1991
1993
1995
1997
1999
2001
Year
(%)
Den
mar
kN
orw
ayS
wed
enFi
nlan
d
010203040506070
1961
1963
1965
1967
1969
1971
1973
1975
1977
1979
1981
1983
1985
1987
1989
1991
1993
1995
1997
1999
2001
Year
Uni
ted
Kin
gdom
Aus
tralia
Can
ada
Uni
ted
Sta
tes
100

Figure 14: Development of eligibility to replacement incomes over 60-monthperiod across countries
Source: OECD, 2004, Benefits and Wages: OECD Indicators.
Net Replacement Rates over a five year period2002, no entitlement to social assistance, one-earner married couple with 2 children, in percent (1)
1. Month one refers to the first month of benefit receipt, i.e. following any waiting period. Previous in-work earnings are equal to APW. Children are aged 4 and 6 and neither childcare benefits nor childcare costs are considered.
www.oecd.org/els/social/workincentives
0
20
40
60
80
100
0 5 10 15 20 25 30 35 40 45 50 55 60Time (months)
0
20
40
60
80
100AUS AUT BEL CAN CZE DNK FIN
0
20
40
60
80
100
0 5 10 15 20 25 30 35 40 45 50 55 60Time (months)
0
20
40
60
80
100FRA DEU GRC HUN ISL IRL ITA
0
20
40
60
80
100
0 5 10 15 20 25 30 35 40 45 50 55 60Time (months)
0
20
40
60
80
100JPN KOR LUX NLD NZL NOR POL
0
20
40
60
80
100
0 5 10 15 20 25 30 35 40 45 50 55 60Time (months)
0
20
40
60
80
100PRT SVK ESP SWE CHE GBR USA
Source: OECD (2004b).101

Fig
ure
15:
Sev
erit
yof
lab
orm
arke
tre
gula
tion
sac
ross
countr
ies
over
tim
e
OEC
D In
dica
tor -
I La
bor M
arke
t Reg
ulat
ions
Sour
ce: O
ECD
(200
6a) L
abor
For
ce S
tatis
tics
0
0.51
1.52
2.53
3.54
4.5 Neth
erlan
ds
Belgium
France
German
y
Portug
al
Spain
Italy
Greece
Denmark
Norway
Sweden
Finlan
d United
Kingdo
m
Austra
lia
Canad
a United
States
1990
1998
2003
Not
e:T
he
indic
ator
mea
sure
sth
est
ringe
ncy
ofnat
ional
legi
slat
ion
onem
plo
ym
ent
pro
tect
ion
(EP
L)
whic
har
ea
card
inal
sum
mar
yof
ase
tof
indic
ator
sco
nve
rted
toca
rdin
alsc
ores
and
nor
mal
ized
tora
nge
from
0to
6,w
ith
hig
her
scor
esre
pre
senti
ng
stri
cter
regu
lati
on.
Incl
uded
are
indic
ator
sfo
rin
div
idual
dis
mis
sals
for
regu
lar
emplo
ym
ent,
tem
por
ary
emplo
ym
ent,
collec
tive
dis
mis
sals
,re
gula
rpro
cedura
lin
conve
nie
nce
s,not
ice
and
seve
rance
pay
for
dis
mis
sals
by
tenure
cate
gori
es,
diffi
cult
yof
dis
mis
sal
for
regu
lar
contr
acts
,le
gisl
atio
non
fixed
-te
rmco
ntr
acts
,te
mp
orar
yw
ork
agen
cyco
ntr
acts
,th
edefi
nit
ion
ofco
llec
tive
dis
mis
sal,
addit
ional
not
ifica
tion
requir
emen
ts,
addit
ional
del
ays
invo
lved
,an
dot
her
spec
ial
cost
sto
emplo
yers
.
102

Figure 16: Taxation across OECD countries over time
Marginal tax and average tax wedges and income progressionSource: OECD (2005e) Tax Data Base
Total marginal tax wedge on labor income including consumption taxes (% of income)
0.0%
20.0%
40.0%
60.0%
80.0%
Netherl
ands
Belgium
France
German
y
Portug
alSpa
inIta
ly
Greece
Denmark
Norway
Sweden
Finlan
d
United
King
dom
Austra
lia
Canad
a
United
Stat
es
20002003
Total average tax wedge on labor income including consumption taxes (% of income)
0.0%
20.0%
40.0%
60.0%
80.0%
Netherl
ands
Belgium
France
German
y
Portug
alSpa
inIta
ly
Greece
Denmark
Norway
Sweden
Finlan
d
United
King
dom
Austra
lia
Canad
a
United
Stat
es
20002003
Musgrave and Musgrave's coeffcient of residual income progression
0.5
0.6
0.7
0.8
0.9
1
1.1
Netherl
ands
Belgium
Fran
ce
German
y
Portug
alSpa
inIta
ly
Greece
Denmark
Norway
Sweden
Finlan
d
United
King
dom
Austra
lia
Canad
a
United
Stat
es
20002003
Notes: All tax rates apply to a single worker earning the average productionwage without children. For the US no consumption tax data were available.We assumed a US-consumption tax of 5%.
103

Fig
ure
17:
Lab
orfo
rce
atta
chm
ent
older
wor
kers
acro
ssco
untr
ies
Labo
r for
ce p
artic
ipat
ion
rate
s by
age
(200
2)So
urce
: OEC
D (2
006a
) Lab
or F
orce
Sta
tistic
s
0102030405060708090100
15-1
920
-24
25-2
930
-34
35-3
940
-44
45-4
950
-54
55-5
960
-64
Age
gro
up
Participation rate (%)
Net
herla
nds
Bel
gium
Fran
ceG
erm
any
Por
tuga
lS
pain
Italy
Gre
ece
Den
mar
kN
orw
ayS
wed
enU
nite
d K
ingd
omA
ustra
liaC
anad
aU
nite
d S
tate
s
104

Fig
ure
18:
Lab
orfo
rce
par
tici
pat
ion
55-5
9ye
arol
der
wor
kers
acro
ssco
untr
ies
over
tim
e
.2.4.6.81 .2.4.6.81 .2.4.6.81 .2.4.6.81
1960
1970
1980
1990
2000
1960
1970
1980
1990
2000
1960
1970
1980
1990
2000
1960
1970
1980
1990
2000
1960
1970
1980
1990
2000
Aus
tral
iB
elgi
umC
anad
aD
enm
ark
Fin
land
Fra
nce
Ger
man
yG
reec
eIta
lyN
ethe
rla
Nor
way
Por
tuga
lS
pain
Sw
eden
Uni
ted
K
Uni
ted
SW
est G
er
part
icip
atio
n ra
te a
llpa
rtic
ipat
ion
rate
men
part
icip
atio
n ra
te w
omenye
ar
Labo
r fo
rce
part
icip
atio
n ra
tes
55−
59 y
ear
old
coho
rts
Sou
rce:
OE
CD
(200
6a)
Lab
orF
orce
Sta
tist
ics
105

Fig
ure
19:
Dev
elop
men
tre
tire
men
tag
eac
ross
countr
ies
over
tim
e
Ave
rage
effe
ctiv
e re
tirem
ent a
ge m
en (1
960-
2001
)So
urce
: OEC
D (2
005c
) Soc
ial I
ndic
ator
s
565860626466687072
1960
1962
1964
1966
1968
1970
1972
1974
1976
1978
1980
1982
1984
1986
1988
1990
1992
1994
1996
1998
2000
2002
Age
Net
herla
nds
Bel
gium
Fran
ceG
erm
any
565860626466687072
1960
1962
1964
1966
1968
1970
1972
1974
1976
1978
1980
1982
1984
1986
1988
1990
1992
1994
1996
1998
2000
2002
Por
tuga
lS
pain
Italy
Gre
ece
565860626466687072
1960
1962
1964
1966
1968
1970
1972
1974
1976
1978
1980
1982
1984
1986
1988
1990
1992
1994
1996
1998
2000
2002
Age
Den
mar
kN
orw
ayS
wed
enFi
nlan
d
565860626466687072
1960
1962
1964
1966
1968
1970
1972
1974
1976
1978
1980
1982
1984
1986
1988
1990
1992
1994
1996
1998
2000
2002
Uni
ted
Kin
gdom
Aus
tralia
Can
ada
Uni
ted
Sta
tes
106

Figure 20: Labor force participation older workers and education level acrosscountries
Labor force participation rates 55-59 year old cohorts by level of education (2002)
Source: OECD (2006a) Labor Force Statistics
0
10
20
30
40
50
60
70
80
90
100
Netherl
ands
Belgium
France
Portug
alSpa
inIta
ly
Greece
Denmark
Norway
Sweden
Finlan
d
United
King
dom
Austra
lia
Canad
a
United
Stat
es
Perc
ent
Less than upper secondary level Upper and post-secondary levelTertiary non-university level Levels that correspond to both ISCED 5A and 6
Labor force participation rates 60-64 year old cohorts by level of education (2002)
Source: OECD (2006a) Labor Force Statistics
0
10
20
30
40
50
60
70
80
90
Netherl
ands
Belgium
France
Portug
alSpa
inIta
ly
Greece
Denmark
Norway
Sweden
Finlan
d
United
King
dom
Austra
lia
Canad
a
United
Stat
es
Perc
ent
Less than upper secondary level Upper and post-secondary levelTertiary non-university level Levels that correspond to both ISCED 5A and 6
107

Fig
ure
21:
Pen
sion
ben
efits
asa
frac
tion
ofpre
-ret
irem
ent
earn
ings
acro
ssco
untr
ies
Gro
ss a
nd n
et p
ensi
on re
plac
emen
t inc
omes
for w
orke
rs w
ith a
vera
ge
earn
ings
(% o
f fin
al e
arni
ngs)
Sour
ce: O
ECD
(200
5d) P
ensi
ons
at a
Gla
nce
0.0
20.0
40.0
60.0
80.0
100.
0
120.
0
Netherl
ands
Belgium
France
German
y
Portug
al
Spain
Italy
Greece
Denmark
Norway
Sweden
Finlan
d United
Kingdo
m
Austra
lia
Canad
a United
States
(%)
Gro
ssN
et
108

Figure 22: Implicit tax rates (pre-)retirement schemes across countries
Panel A.
Panel B.
1. Implicit tax rates are calculated for a single worker with average earnings in 1999. In some cases, the results differ from those presented in Figure 4, which refer to currently legislated systems. These differences reflect either policy changes that took placeafter 1999 (e.g. Finland, France) or the future implementation of measures that were already legislated but had not yet come into effect in 1999 (e.g. the future maturation of the Superannuation Guarantee Scheme in Australia, the transition from the "old" to the"new" pension sytem in Italy).2. (Pr55-59 - Pr50-54) / Pr50-54, per cent.3. (Pr60-64 - Pr55-59) / Pr55-59, per cent.
Source: OECD.
Fall in male labour participation between two consecutive age groups and implicit tax rates on continued work, 1999 1
AUT
AUS
BEL
CAN
FINFRA
DEU
ISL
IRL
ITA
JAP
LUX
NLD
NOR
NZL
PRT ESP
SWE
CHE
GBR
USA
-40
-35
-30
-25
-20
-15
-10
-5
0
0 10 20 30 40 50 60 70 80 90 100
Percentage change in labour force participation between 50-54 and 55-592
Implicit tax on continued work, 55-59, per cent
AUT
AUS
BEL
CAN
FIN
FRA
DEU
ISL
IRL
ITA
JAPKOR
LUXNLD
NORNZL
PRT
ESP
SWE
CHE
GBRUSA
-80
-70
-60
-50
-40
-30
-20
-10
0
0 10 20 30 40 50 60 70 80 90 100 110 120
Percentage change in labour force participation between 55-59 and 60-643
Implicit tax on continued work, 60-64, per cent
Source: OECD (2004c).
109

Fig
ure
23:
Presch
ool
Scho
olPo
stScho
ol
Presch
oolProgram
s
Scho
oling
JobTraining
Age
Rate
ofRe
turn
toInvestmen
tin
Hum
anCa
pital
Ratesof
Return
toHum
anCa
pitalInv
estm
entInitia
llySettingInvestmen
ttobe
Equa
lAcrossallA
ges
0r
Ratesof
Return
toHum
anCa
pitalInv
estm
entInitia
llySettingInvestmen
ttobe
Equa
lAcrossallA
ges
Sou
rce:
Car
nei
roan
dH
eckm
an(2
003)
.
110
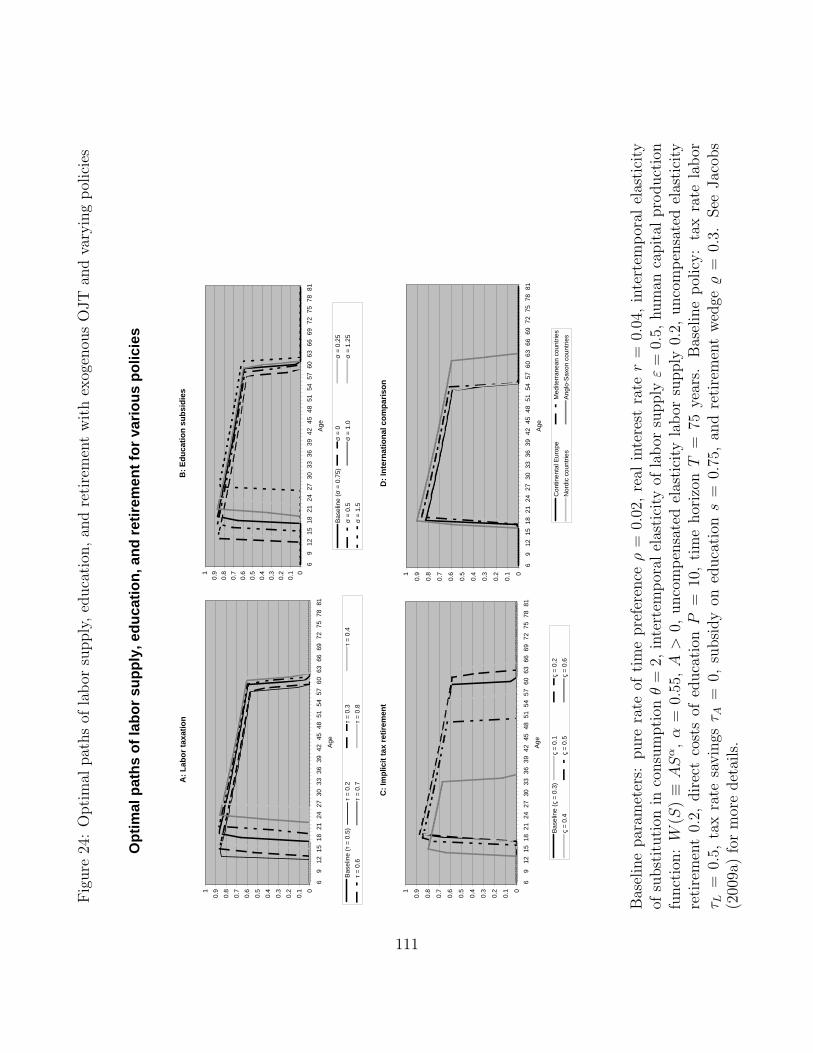
Fig
ure
24:
Opti
mal
pat
hs
ofla
bor
supply
,ed
uca
tion
,an
dre
tire
men
tw
ith
exog
enou
sO
JT
and
vary
ing
pol
icie
s
Opt
imal
pat
hs o
f lab
or s
uppl
y, e
duca
tion,
and
retir
emen
t for
var
ious
pol
icie
s
B: E
duca
tion
subs
idie
s
00.
10.
20.
30.
40.
50.
60.
70.
80.
91
69
1215
1821
2427
3033
3639
4245
4851
5457
6063
6669
7275
7881
Age
Bas
elin
e (σ
= 0
.75)
σ =
0σ
= 0.
25σ
= 0.
5σ
= 1.
0σ
= 1.
25σ
= 1.
5
C: I
mpl
icit
tax
retir
emen
t
0
0.1
0.2
0.3
0.4
0.5
0.6
0.7
0.8
0.91
69
1215
1821
2427
3033
3639
4245
4851
5457
6063
6669
7275
7881
Age
Bas
elin
e (ς
= 0
.3)
ς =
0.1
ς =
0.2
ς =
0.4
ς =
0.5
ς =
0.6
D: I
nter
natio
nal c
ompa
rison
0
0.1
0.2
0.3
0.4
0.5
0.6
0.7
0.8
0.91
69
1215
1821
2427
3033
3639
4245
4851
5457
6063
6669
7275
7881
Age
Con
tinen
tal E
urop
eM
edite
rran
ean
coun
tries
Nor
dic
coun
tries
Ang
lo-S
axon
cou
ntrie
s
A: L
abor
taxa
tion
00.
10.
20.
30.
40.
50.
60.
70.
80.
91
69
1215
1821
2427
3033
3639
4245
4851
5457
6063
6669
7275
7881
Age
Bas
elin
e (τ
= 0
.5)
τ =
0.2
τ =
0.3
τ =
0.4
τ =
0.6
τ =
0.7
τ =
0.8
Bas
elin
epar
amet
ers:
pure
rate
ofti
me
pre
fere
nceρ
=0.
02,
real
inte
rest
rater
=0.
04,
inte
rtem
por
alel
asti
city
ofsu
bst
ituti
onin
consu
mpti
onθ
=2,
inte
rtem
por
alel
asti
city
ofla
bor
supplyε
=0.
5,hum
anca
pit
alpro
duct
ion
funct
ion:W
(S)≡ASα,α
=0.
55,A>
0,unco
mp
ensa
ted
elas
tici
tyla
bor
supply
0.2,
unco
mp
ensa
ted
elas
tici
tyre
tire
men
t0.
2,dir
ect
cost
sof
educa
tion
P=
10,
tim
ehor
izon
T=
75ye
ars.
Bas
elin
ep
olic
y:
tax
rate
lab
orτ L
=0.
5,ta
xra
tesa
vin
gsτ A
=0,
subsi
dy
oned
uca
tion
s=
0.75
,an
dre
tire
men
tw
edge
%=
0.3.
See
Jac
obs
(200
9a)
for
mor
edet
ails
.
111

Fig
ure
25:
Opti
mal
pat
hs
ofO
JT
-inve
stm
ent,
earn
ings
,an
dre
tire
men
tfo
rva
ryin
gp
olic
ies
OJT
-inve
stm
ent a
s a
frac
tion
of to
tal t
ime
over
the
life-
cycl
e fo
r var
ying
labo
r tax
rate
s
0.0
0.1
0.2
0.3
0.4
0.5
0.6
0.7
0.8
2025
3035
4045
5055
6065
Age
tl=0
tl=0.
2tl=
0.4
tl=0.
6tl=
0.8
Labo
r ear
ning
s ov
er th
e lif
e-cy
cle
for v
aryi
ng la
bor t
ax ra
tes
05101520253035404550
2025
3035
4045
5055
6065
7075
80
Age
tl=0
tl=0.
2tl=
0.4
tl=0.
6tl=
0.8
OJT
-inve
stm
ent a
s a
frac
tion
of to
tal t
ime
over
the
life-
cycl
e fo
r var
ying
impl
icit
tax
rate
s on
retir
emen
t
0.0
0.1
0.2
0.3
0.4
0.5
0.6
0.7
0.8
0.9
2025
3035
4045
5055
6065
7075
80
Age
tr=-0
.4tr=
-0.2
tr=0
tr=0.
2tr=
0.4
tr=0.
6
Labo
r ear
ning
s ov
er th
e lif
e-cy
cle
for v
aryi
ng im
plic
it ta
x ra
tes
on
retir
emen
t
0102030405060
2025
3035
4045
5055
6065
7075
80
Age
tr=-0
.4tr=
-0.2
tr=0
tr=0.
2tr=
0.4
tr=0.
6
Opt
imal
pat
hs o
f OJT
-inve
stm
ent a
nd re
tirem
ent f
or ta
x an
d re
tirem
ent p
olic
ies
Bas
elin
epar
amet
ers:
pure
rate
ofti
me
pre
fere
nceρ
=0.
02,
real
inte
rest
rater
=0.
04,
inte
rtem
por
alel
asti
city
ofsu
bst
ituti
onθ
=1.
25,
unco
mp
ensa
ted
elas
tici
tyre
tire
men
t=
0.2,
Cob
b-D
ougl
aspro
duct
ion
funct
ion
for
OJT
:F
(It,Ht)≡
(ItH
t)α,α
=0.
6,ti
me
hor
izon
T=
60ye
ars.
Bas
elin
ep
olic
y:
tax
rate
lab
orτ L
=0.
5,ta
xra
tesa
vin
gsτ A
=0,
and
reti
rem
ent
wed
ge%
=0.
3.See
Jac
obs
(200
9b)
for
mor
edet
ails
.
112