political agenda-setting in cable news as a possible...
TRANSCRIPT
POLITICAL AGENDA-SETTING IN CABLE NEWS AS A POSSIBLE
TECHNIQUE FOR SECURING AN AUDIENCE NICHE
W.E. Mott, IV
Thesis Prepared for the Degree of
MASTER OF SCIENCE
UNIVERSITY OF NORTH TEXAS
August 2007
APPROVED: Alan B. Albarran, Major Professor and Chair
of the Department of Radio, Television and Film
James D. Meernik, Committee Member and Chair of the Department of Political Science
Phyllis Slocum, Committee Member Sandra L. Terrell, Dean of the Robert B.
Toulhouse School of Graduate Studies
Mott IV, W.E. Political Agenda-Setting in Cable News as a Possible Technique
for Securing an Audience Niche. Master of Science (Radio, Television, and Film),
August 2007, 53 pp., 17 figures, references, 40 titles.
In an effort to better understand the motivations behind perceived biases in the
US cable news industry, 72 hours of CNN, FOX, and MSNBC during the week
preceding the 2006 congressional election were analyzed. First- and second-level
agenda-setting theories are used to examine how long and in what way federal
politicians are portrayed. The results indicate distinct differences in political
presentations between the three networks.

ii
Copyright 2007
by
W.E. Mott, IV
iii
TABLE OF CONTENTS Page
LIST OF FIGURES..........................................................................................................iv Chapter
1. INTRODUCTION OF BIAS AND AGENDA-SETTING............................... 1 Bias Agenda-Setting Theory Review of Literature
Applicable Agenda-Setting Attributes Agenda-Setting’s Negative and Positive Variables Agenda-Setting Shortcomings
Hypotheses 2. METHODOLOGY ................................................................................... .18
The Intended Datasat Coding Variables Omissions Reliability
3. RESULTS ................................................................................................ 24 CNN MSNBC FOX Comparison
4. DISCUSSION .......................................................................................... 33 Hypotheses 1 and 2 Hypotheses 3 and 4 Hypotheses 5 Disparity in Time Allocation and Portrayal Scandals Individual Anchors Conclusion
REFERENCES.............................................................................................................. 51

iv
LIST OF FIGURES
Page 1. Recording Equipment ......................................................................................... 19 2. CNN Time Allotted.............................................................................................. 25 3. CNN Average Portrayal ...................................................................................... 25 4. CNN Anchors Time Allotted................................................................................ 26 5. CNN Anchors Average Portrayal ........................................................................ 26 6. MSNBC Time Allotted......................................................................................... 27 7. MSNBC Average Portrayal ................................................................................. 27 8. MSNBC Anchors Time Allotted........................................................................... 28 9. MSNBC Anchors Average Portrayal................................................................... 28 10. FOX Time Allotted .............................................................................................. 29 11. FOX Average Portrayal ...................................................................................... 29 12. FOX Anchors Time Allotted ................................................................................ 30 13. FOX Anchors Average Portrayal ........................................................................ 30 14. Time Allotted Comparison .................................................................................. 31 15. Average Portrayal Comparison........................................................................... 31 16. Time Allotted (Minus Bush and Kerry) ................................................................ 36 17. Ted Haggard Time Allotted................................................................................. 46

1
CHAPTER 1
INTRODUCTION OF BIAS AND AGENDA-SETTING
Television news audiences have so many choices these days. In national news
alone, 3 broadcast networks, PBS, and a handful of 24-hour cable news organizations
all compete in the business of acquiring audiences – audiences that are already
shrinking in size due to a shift in interest to other forms of media (Livingstone, 1999).
Further audience fragmentation has coincided with a rise in technological
advancements used to consume media (e.g., Internet streaming, satellite television,
DVR), as well as with the recent increase in content choice offered to audience
members. Among news organizations, the ever-growing challenge regarding the
acquisition and preservation of an audience has presumably led to niche marketing as a
way to maintain survival in a highly competitive broadcast journalism industry.
A news source’s content that is marketed to a particular audience niche can
easily be perceived by the audience as biased. A portion of every audience inevitably
perceives content in such a way, as the injection of bias by the news media is a
commonly held notion, which in turn commonly renders complaint. Audience members
on each side of the political isle are convinced that the media is controlled by, and
panders to, their adversary. The right claims, and has for decades, that the mainstream
media is liberal; and the left, particularly since the consolidation movement of the 1980s
and 1990s, claims that the media is conservative. There are numerous accusations,
which span both ends of the political spectrum, that uphold the notion that certain cable
news channels add a biased slant to the presentation of seemingly objective content.
2
The published perception that the media is liberally biased, specifically, is not a
new phenomenon. During the presidency of Richard Nixon, the first texts that alleged a
liberal bias in the media surfaced. Efron’s (1972) The News Twisters broadly accuses
the national media of inserting a liberal bias into the news; and the American Institute
for Political Communication (1972) also published a study in which network television
news was deemed similarly liberal. One of the more commercially successful sources,
Bias by Goldberg (2002), primarily accuses CBS, but also points to CNN, as being
subjectively in favor of the viewpoints most commonly associated with left-wing
ideology. Olaski (1988) goes as far as to accuse the American news media of being
anti-Christian.
Scholarly studies, such as Groseclose and Milyo (2004), also claim the U.S.
media, and specifically CNN, have a liberal bias. Many materials that claim a liberal
bias in the media point to the notion that journalists themselves lean left, and in turn
slant the actual news content. Elusive is the citing of content analysis research in
many, if not most, of the published materials which allege a liberal bias in the media;
nevertheless, the belief that there is a liberal bias in the American news media is widely
held and well documented.
Conversely, there is also a growing number of published arguments that claim
that the U.S. news media is in fact conservatively biased. Alterman’s (2003) What
Liberal Media? directly addresses the accusations of media liberalism and concludes
that the mass media lean predominantly right. By title alone, Brock (2004) brands the
media The Republican Noise Machine, and claims such a machine is corrupting
democracy. A dominant argument for the mass media being conservatively biased
3
stems from the practice of media consolidation and the coinciding belief that a handful
of conservative network owners dictate the nature of content that is distributed to a
majority of outlets (McChesney, 1999). As with the liberal-bias argument, there are
many sources that illustrate the commonly held notion that the American news media
contain a conservative bias.
Bias
For the present study, it is important to discuss the concept of bias. There have
been a great number of debates regarding the definition of the term, bias, as it relates to
journalism. Defined by the Oxford English Dictionary (1989), biased is an adjective,
which describes something that is “influenced; inclined in some direction; [or]
prejudiced.” Within the industry of journalism, bias is a dirty word. Potential reporters in
journalism schools are taught to avoid bias at all costs, and encouraged to seek
objectivity – the opposite.
However, some argue that objectivity in journalism is a lofty, even impossible,
goal to achieve – implying that there is no such thing as objectivity; only lesser degrees
of subjectivity. In formulating the present study, objectivity is believed to be in the eye
of the beholder, which causes individuals to present and perceive events uniquely.
Because individuals hold unique preconceived ideals regarding public policy - and other
political issues commonly discussed in the U.S. journalism industry – every journalist
will interpret a political object differently, subsequently reporting on it uniquely.
Individual audience members will in turn perceive the reported news in a unique way as
well. Therefore, the present study does not attempt to label a certain news organization
4
biased or objective – the act in doing so is believed to be a practice in futility. The
present study attempts to compare the content of different news organizations in the
hopes of better understanding possible niche marketing.
A recurring theme, which stems from the dichotomy of arguments for a liberally
and conservatively biased media, is that, regarding political ideology, CNN generally
leans left and FOX News generally leans right - but, compared to what? Each other?
Furthermore, what would be the motivation or agenda in doing so? The present study
builds upon the extensive body of published material which claims that certain cable
news stations are biased; however, instead of only attempting to identify indicators that
point to subjectivity, this study compares the general practice of news presentation
among different news providers.
Also, the present study ignores the belief that there is a political conspiracy within
a certain cable news network to affect public policy or oust an elected official, as some
of the sources previously mentioned suggest. Instead, as Collins (2004) points out in
regard to FOX, the present study adheres to the assumption that the cable news
industry has become fragmented to the point at which niche audiences must be
identified and targeted in order for a network to stay competitive. Going beyond this
profit-driven theory in a capitalistic society provokes over-complicated speculation as to
why a free press in a free market behaves as it does. Hypothesizing complicated
motives, such as attempting to alter political occurrences, rather than an organization’s
straightforward need to protect their bottom line, yield methodologies that are
unrealistic.
5
By avoiding this struggle to determine if a certain cable network has an
independent political bias or not, and by simply comparing the analyzed content of
numerous networks, a more practical model is used to determine if different cable news
channels target different audience segments. Indisputably, the agenda of CNN and
FOX is to acquire and keep a loyal audience for the purpose of making money. It could
be argued that the transference of this fiscal agenda is interpreted by the audience as a
desire to watch. Obtaining a target audience, by presenting content that might coincide
with the desired political-agenda of such an audience-segment, creates an agenda-
setting effect of heightened political-issue salience within the audience. This increase in
salience transforms the target-audience into a loyal, profit producing entity, as the
audience members identify with the perceived agenda of the news organization.
Agenda-setting theory provides a framework that helps explain the media’s ability
to transfer issue salience to an audience (McCombs & Shaw, 1972); therefore, it is an
appropriate theory to guide the present study in facilitating a better understanding of
how, and if, cable news caters content to political niche audiences. Additionally,
because of this framework, a news organization’s unilateral changing of an audience’s
agenda to consume certain media content is a phenomenon that agenda-setting theory
is capable of embracing.
Agenda-Setting Theory
There are two levels of agenda-setting theory. First-level agenda-setting focuses
on the dominance of an object in the media. This level assumes that the amount of time
objects (e.g., words, images, audio clips) are displayed in the media directly correlates

6
with the level of salience the audience grants such objects. The dominant belief
regarding first-level agenda-setting is that the more time an object is displayed in the
media, the more salience the audience grants the object. In other words, according to
Cohen (1963), the creator of the theory, “the press may not be successful much of the
time in telling people what to think, but it is stunningly successful in telling its readers
what to think about” (p. 13).
Second-level agenda setting deals with how the media displays an object. This
theorized media practice is assumed to alter how the audience perceives the object,
and, ultimately, what the audience thinks about the object. The theory of framing is
associated with this level and can be applied to the present study in an attempt to
determine if, and how, different cable news channels cater content to a particular niche.
In other words, according to McCombs (2005, p. 546), “the media can not only be
successful in telling us what to think about, they can also be successful in telling us how
to think about it.”
Cohen first proposed the theory of agenda-setting in 1963; but the theory was not
utilized in empirical research until 1972 by McCombs and Shaw. Since its inception, the
theory has been applied to numerous studies in the attempt to identify a relationship
between the agenda of the media and the agenda of the audience. The theory of
agenda-setting has since become a globally relevant theoretical model used in
understanding the media and audiences in many developed, as well as lesser
developed, nation states (Al-Haqeel & Melkote, 1995; Anokwa & Salween, 1988;
Ghanem & Wanta, 2001; Kwansah-Aidoo, 2003; Peter, 2003; Wilke, 1995; etc.). The

7
practices used in association with agenda-setting research are widely used and well
documented, and they yield effective results.
One negative attribute of agenda-setting theory is that it was created in
association with, and has all but recently been applied to, a three-network universe.
Because the creation of 24-hour news is a somewhat new broadcast model, agenda-
setting research has been rarely utilized in such an environment. However, as
previously mentioned the theory has been practiced and found successful in widely
diverse settings; therefore, the present study assumes that the relatively recent era of
24-hour news will yield an applicable setting for agenda-setting theory as well.
The present study utilizes both first- and second-level agenda-setting theories
and the applicable methods carried out by selected previous agenda-setting studies.
The present study’s goal is to build on the assumption that a cable news organization is
producing politically leaning content, when compared to another cable news
organization, for the purpose of securing a politically niche-oriented audience.
Review of Literature
Applicable Agenda-Setting Attributes
McCombs (2005) discusses a self-produced agenda-setting study that was
conducted in Chapel Hill, NC, and was the first applied practice of the theory in
empirical research. The author reflects upon the 33-year-old inaugural implementation
of agenda-setting theory while also giving a synopsis of the implications of the
groundbreaking study. Most beneficial to the understanding of the area in which the
present study intends to focus is the author’s explanation of the first and second levels

8
of agenda-setting theory. In essence, the first level of agenda setting deals with an
object’s public presence (or lack there of), and the second level deals with the framing
of an object. The source’s substantial contribution is that almost every facet of agenda-
setting theory is comprehensively explained from the valuable perspective of hindsight.
Agenda-setting theory was first used in empirical research in 1972; and since its
adoption by media researchers, there has been an abundance of varying types of
studies which utilize the theory. Dearing and Rogers (1996) give a comprehensive
overview of the inner workings of agenda-setting theory, identify the specific
contributions of the Chapel Hill study, and provide a history of the theory by citing
numerous studies. The contributions of McCombs and Shaw, as indicated by the
authors, are in naming the media-public relationship, agenda-setting. The authors
explain the term, “agenda,” and attempt to independently define it: “a set of issues that
are communicated in a hierarchy of importance at a point in time” (p. 2).
In the spring of 1975, Weaver, Graber, McCombs, and Eyal (1981) began a
yearlong endeavor that would be at the time one of the most intensive agenda-setting
studies. The study is hybridized regarding methodology, incorporating practices in
audience reception and in content analysis research pertaining to various mediums. A
key finding in the study is that the media-agenda effect, the transferring of issue
salience from media to their audience, does indeed exist. “Newspapers (…) had a
major influence on which issues were discussed with others and which were considered
important by voters” (p. 196). The conclusion is that the more exposure an object
receives in a newspaper, the more the object resonates in the daily discussions and
9
thought-processes of voters – verifying the legitimacy of first-level agenda-setting
theory.
McCombs and Shaw (1977) elaborate on the use of agenda-setting theory by
indicating an ideal place in which to apply the practice. “A political campaign is a key
place to study mass communication influence because media behavior is intimately
connected with how our political environment is perceived, how our agenda of public
issues is shaped, and how we cast our votes” (p. 150). The authors’ explanation
regarding this environment for agenda-setting theory leads to a great number of studies
that focus on political campaigns and the news that surround them.
Kiousis and McCombs (2004) use a simple yet revealing model to focus on
political figures during the 1996 Presidential election. The study counts news stories
that focus on 11 politicians over the course of five months and then compares the level
of coverage with public opinion polls aimed at each politician. Ultimately, the study finds
correlations between polled approval ratings for politicians and the amount of coverage
major news outlets allotted such politicians. Typically, a politician who received more
media coverage had a higher approval rating when compared to a politician who
received less media coverage. This finding substantiates the assumptions associated
with first-level agenda-setting. The authors also identify a phenomenon regarding the
time lag aspect in agenda-setting research. The longer a period of time content is
sampled, the more reliable the results will be. In other words, broad time frames
provide a more accurate depiction of what a certain media outlet regularly exhibits.
Weaver (1991) continues the practice of combining campaign coverage and
agenda-setting theory. One of the author’s key findings is that the media agenda-
10
setting effect increases with the nearing of an election date, and an issue’s salience
within the public, as well as in the media, is inversely correlated with the amount of time
remaining before an election. In other words, the closer an election nears, the more
attention the media and the audience grant politicians and political issues. Conversely,
the study concludes that when an election is not in the immediate future, political
objects weakly resonate in both the media and public.
One way of conducting agenda-setting research is to fabricate fictional news
stories and, in the hopes of creating a more controlled environment, exhibit the content
to an audience. Kiousis, Bantimaroudis, and Ban (1999) conduct this kind of
experiment by showing a group of audience members a series of stories that focus on
fictional politicians’ attributes (i.e., personality traits, educational background, habits).
The study attempts to identify which attributes most keenly resonate in the perceptions
of audiences. In determining what kind of personal attributes audiences find more
salient, one conclusion is that corruption outweighs education. A major conclusion is
that the manipulation of a certain politician’s attributes influenced the subjects’
perception of that fictional politician, verifying the authors’ assumptions in second-level
agenda-setting theory.
Agenda-Setting’s Negative and Positive Variables
Research that includes content analysis brings forth the potential of subjectivity
on the part of the researcher; subjectivity is difficult to avoid. A common approach in
conducting content analysis research within the theoretical framework of second-level
agenda-setting, which has both succeeded and failed in preventing supplementary
11
subjectivity, is the incorporation of labeling objects positive, negative, and neutral within
the context of framing. Chaudhary (2001) examined the slant of a week’s worth of
stories found in two newspapers, The Washington Post and the Daily Times of Nigeria.
Two coders were used and were given definitions of negative, positive, and neutral
news.
Negative news was defined as that which would be interpreted as unpleasant, critical, conflicting, unhealthy, unwholesome, gruesome, representing disagreement, antisocial, deceitful, destructive, painful, injurious, or indicative of social or individual problems or troubles. Positive was defined as news that would be generally interpreted as pleasant, humorous, uncritical, agreeable, prosocial, healthy, wholesome, constructing, healing, favorable, sharing helping cooperative, altruistic, expressing affection, sympathetic, reassuring, or news about an improving trend or anything else normally perceived as pleasing. Neutral news was defined as that which involved neither negative nor positive aspects of anything or that involved both negative and positive aspects equally. (p. 247)
In order to apply Chaudhary’s definitions to actual content, interpretation is a must when
coding for positive, negative, or neutral news. For example, an audience member’s
perception of humor might coincide with another audience member’s perception of
injurious; thus, this particular model, when applied to reality, lends itself to a high
potential for irregularities. The study ultimately concluded that newspapers, The
Washington Times and the Daily Times of Nigeria, both exhibit news that was about
30% positive and 30% negative.
In a previous study that focuses on televised sound bites in which commentators
refer to political candidates, Lowry and Shidler (1998) also attempt to utilize the
variables of positive, negative, and neutral when analyzing content from ABC, CBS,
NBC, and CNN. However, the authors also fall victim to models that are riddled with the
potential for subjectivity. “Positive sound bites were defined as those in which the biter

12
was saying favorable or supportive things about a candidate, (…) [and] negative bites
were defined as those in which the biter was saying unfavorable or critical things about
a candidate” (p. 273). The authors’ failure to define “favorable,” “supportive,”
“unfavorable,” and “critical” is a shortcoming in this particular study. Regardless of the
shortcoming, the authors conclude that political incumbents and challengers are not
framed in unique ways.
McCombs, Llamas, Lopez-Escobar, and Rey (1997) examine second-level
agenda-setting by employing positive and negative variables as well. In various
newscasts, remarks made about a candidate are coded as negative, positive, or neutral
based on a multitude of, albeit general, indicators. The authors further label any phrase
that does not favor or harm a candidate as neutral. The study draws noteworthy
conclusions: a direct link is found between how a political candidate is represented in
the media and how the voters ultimately view that candidate. Specifically, candidates
who receive more favorable coverage in the media, when compared to their opponent,
usually receive better approval ratings. The authors essentially prove that effects of
second-level agenda-setting do, indeed, exist.
Fictional news, used for better understanding an audience’s perception of issue
saliency, is branded with the positive and negative variables by Knobloch-Westerwick,
Carpentier, Blumhoff, and Nickel (2005). In the hopes of determining if issue salience is
affected by greater or lesser degrees of applied attributes to objects, the authors
calculate the magnitude of intensity regarding fabricated negative and positive news
stories. An example of varying magnitude levels in a negative story’s headline is “Minor
Reduction in Library Hours,” for a low magnitude of intensity, and “Drastic Reduction in

13
Library Hours,” for high magnitude (p. 188). Although the magnitude of intensity for a
positive or negative story might be a valid variable in determining issue salience among
audience members, the subjective quality pertaining to the definition of positive and
negative is still an unresolved issue. For example, in the negative case involving the
library previously cited, an overworked employee of the library might read the same
headline and perceive the statement as not negative in any magnitude, but positive.
This study is able to confidently conclude that the magnitude of intensity regarding a
message did indeed affect the level of salience an audience granted the message. In
other words, the more intense a message was, the more salient the audience found it.
In this particular study, whether the message was positive or negative did not
substantially affect the issue salience within an audience. The studies, which rely on
rhetoric to determine if an object is positive, negative, or neutral, all appear to be
subjective in nature to the point of being unreliable.
One exception by Chen (2005) makes use of 16 transitive verbs by affixing the
positive, negative, and neutral variables to each specific verb. The study looks at a
journalist’s choice when deciding which verb to use in describing the actions of a
politician. The author presumes that journalists do indeed have choices when choosing
certain words, and that the choices might be made based on a preconceived bias,
unconsciously or consciously. With a great amount of explanation, “pointed out,”
“announced,” “explained,” “declared,” “indicated,” and “urged” are labeled “positive;”
“denied,” “claimed,” “admitted,” “insisted,” and “complained” are labeled “negative;” and
“said,” “told,” “described,” “asked,” and “commented” are labeled “neutral” (p. 40). The
findings indicate that there is strong evidence that the usage of certain transitive verbs
14
were used, “consciously or unconsciously,” to connote a positive, negative, or neutral
attitude. Most applicable to the current study, the author concludes by suggesting that
the word choices reporters and/or news organizations make when describing a
politician’s action represents an agenda that is attempting to be transferred to the
audience.
Coleman and Banning (2006) refrain from using the ever-popular positive,
negative, and neutral verbiage analysis to determine second-level agenda-setting.
Instead, the authors apply positive and negative variables to a candidate’s nonverbal
gestures. Nonverbal gestures are divided into five categories – activity, posture, arms,
hands, and eyes – and a positive or negative variable is assigned to each category
depending on what the candidate is physically doing. For example, if a subject’s hands
were gesturing or doing something, they were coded as positive. If a subject’s hands
were at rest, they were coded as negative. The results indicate that there is a
significant correlation between a candidate’s nonverbal behavior and the way audience
members perceive the candidate. If news coverage of a candidate’s body gestures is
mainly positive, the audience typically receives a more favorable impression of that
candidate. Conversely, if the candidate’s gestures were predominately negative, the
audience’s saliency toward that candidate was comparatively less favorable.
Agenda-Setting Shortcomings
Regardless of perceived successes of diverse agenda-setting studies of the past,
Protess and McCombs (1991) suggest that innovative, heterogeneous approaches to
agenda-setting research is ultimately harming the practice. Despite more than 200

15
empirical studies, the authors claim that “the diversity of this research has fragmented
our efforts to build a comprehensive theory of the agenda-setting role of mass
communication” (p. 43). Careful replication in constructing theoretical models is
advocated more so than the drive for innovation.
Hill (1985) finds that model complexity creates the parameters for a conclusion
that might also consist of unwanted results of a complex nature. The author concludes
that the weak indications of agenda-setting are consistent with the concept that it is
more challenging to reveal the phenomenon in cross sectional surveys. The author
attempts to address the possibility that viewers with a prior awareness of an issue might
have a different perception of salience than viewers with no prior experience. Again,
because of the overly complex theoretical model used, the findings were sketchy; thus,
reinforcing the belief that in agenda-setting research, model simplicity usually provides
the most sound results. Despite the doubtful method used in obtaining the results, the
author’s conclusion that the education level attained by the audience member directly
affects issue salience. The more educated an individual is, the more likely an issue will
be more salient, when compared to a less-educated individual.
Implicit in agenda-setting theory is a rather convenient assumption. Burd
(1991) points out that agenda-setting theory is a “linear, one-dimensional, assembly-line
model for the production and manufacture of public opinion and policy” (p. 291). The
author elaborates that the theory essentially rules out the possibility that the public’s
independent agenda might in turn affect the media’s agenda, and that the theory
wrongly supposes that an audience is inactive – and strictly acted upon. However, the
author’s observation pertaining to agenda-setting neatly fits into the present study’s
16
assumption that cable news is the facilitator regarding the altering (or setting) of the
public’s agenda in choosing which cable news channel to watch. Because the
audience’s agenda is assumed to be essentially at the will of the media within the theory
of agenda-setting, the notion that a profit-driven mass medium framing its content for a
targeted segment of the audience warrants believability in this type of research. Thus,
the concept, that CNN and FOX News target different audiences with a unique brand of
news content, is used in forming hypotheses in the present method of agenda-setting
research.
A plethora of former studies provide insight regarding possible behavioral trends
in which the media interacts with the audience. These former analyses of agenda-
setting effects help facilitate the hypothesizing of future measurements of both levels of
agenda-setting. The present study utilizes methods drawing from both levels, and
resulting from these two approaches will be an index of variables that will hopefully
create a better understanding of what political ideology three cable channels (CNN,
FOX, and MSNBC) want us to think about, and provide comprehension as to how these
three cable channels want us to think about a certain political ideology. The present
study’s preconceived notion, which assumes that CNN and FOX present differently
slanted news in order to create an ideologically aligned audience, allows for the
following hypotheses to be investigated.
Hypotheses
Hypothesis 1: Compared to FOX, CNN will display video images of Democrats for a longer duration of time.
17
Hypothesis 2: Compared to CNN, FOX will display video images of Republicans for a longer duration of time.
Hypothesis 3: Compared to FOX, CNN will display video images of Democrats that are more positive.
Hypothesis 4: Compared to CNN, FOX will display video images of Republicans that are more positive. Hypothesis 5: The data that represents the analyzed content of MSNBC will act as the medium between the two data sets that represent the analyzed content of CNN and FOX.

18
CHAPTER 2
METHODOLOGY
The present study analyzed a portion of the content produced by CNN, the FOX
News Channel, and MSNBC. These three channels were chosen because of the
relatively new level of trust in breaking news on cable, which now outweighs network
news (Project for Excellence in Journalism, 2006), and also because of the
preconceived notions pertaining to the channels regarding political leaning (Brock,
2004; Goldberg, 2002; etc.). It is generally assumed, and exemplified in many of the
sources mentioned in Chapter 1, that FOX News has a conservative slant and that CNN
has a liberal slant in their presentation of news. MSNBC does not necessarily have the
reputation of a partisan news organization; and therefore, the network was considered
for the present study a moderate regarding political news presentation. This
consideration of MSNBC as a moderate entity forced the hypothesis that the network’s
content would most likely be coded as such when compared to the content on CNN and
FOX.
In order to accurately demonstrate first- and second-level agenda-setting effects,
it is best to replicate methods from previous studies (Protess & McCombs, 1991). The
present study drew elements from the methods used in Kiousis and McCombs (2004) in
addition to Coleman and Banning (2006). Kiousis and McCombs’ (2004) method of
simply quantifying news stories that focus on certain politicians was used in determining
a first-level agenda-setting effect of the three cable news networks. Coleman and
Banning’s method of coding the nonverbal gestures of featured politicians as positive or
19
negative was used in determining a second-level agenda-setting effect for the three
cable news networks.
The Intended Dataset
The sample intended to obtain 72 hours of cable news; 24 hours of CNN, 24
hours of MSNBC, and 24 hours of The Fox News Channel. However, a recording error
on the last day of sampling forced 90 minutes to be omitted from each channel’s total.
As a result, 22.5 hours were successfully recorded for each news network, totaling 67.5
hours. Specifically, each channel was recorded from 2pm to 5pm CST for the eight
days preceding the 2006 congressional election, Monday, October 30th through
Monday, November 6th 2006. These dates were chosen primarily because of Weaver’s
(2004) finding, which places on political news content a greater or lesser significance
based on the content’s proximity (in time) to an election.
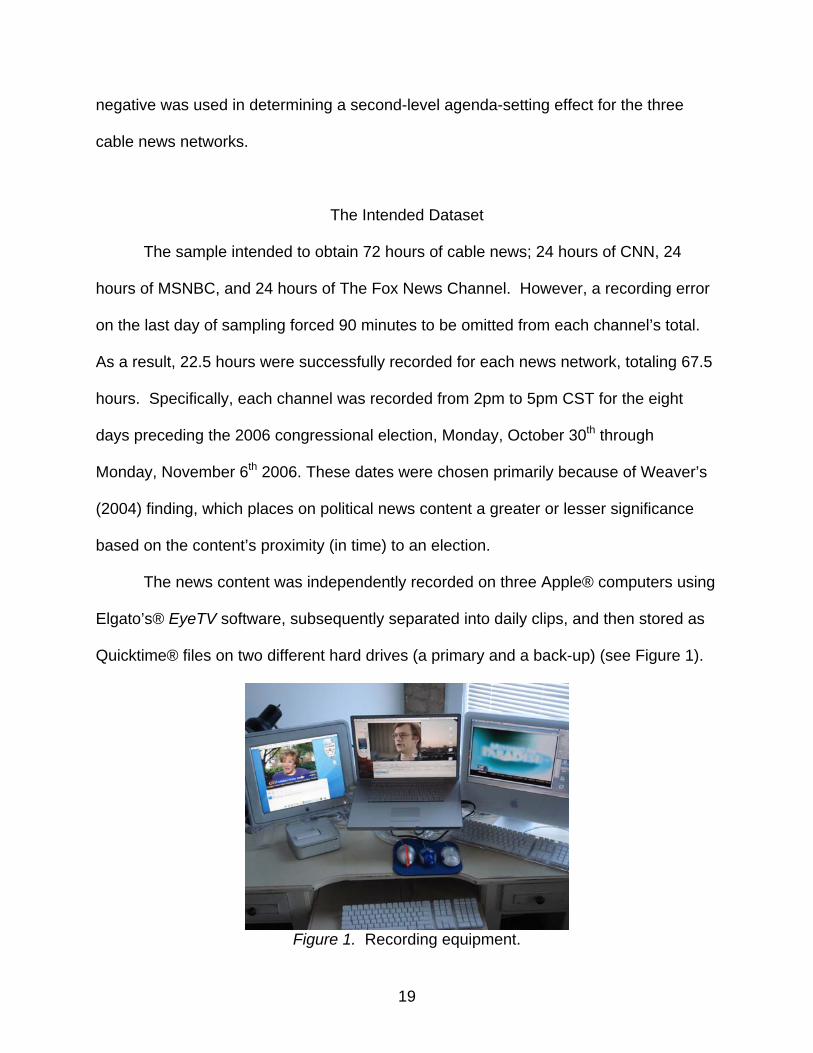
The news content was independently recorded on three Apple® computers using
Elgato’s® EyeTV software, subsequently separated into daily clips, and then stored as
Quicktime® files on two different hard drives (a primary and a back-up) (see Figure 1).
Figure 1. Recording equipment.
20
Coding Variables
In studying first-level agenda-setting in this sample, the displayed image of any
applicable politician by the three cable channels was coded using 6 variables. The
name of the featured politician was noted as the first variable, and the date on which the
image appears was noted as the second variable. The time, as it was displayed on
screen by the network, was coded as the third variable. The fourth variable, the duration
of time that the image of the politician is displayed without interference, was noted –
rounded to the nearest second. The political party of the featured politician (Republican
or Democrat) was coded as the fifth variable. A Republican politician was coded as a “1”
and a Democratic politician as a “2.” Politicians not belonging to either the Republican
or Democratic party (e.g., Libertarians and independents) were coded as a “3.”
In studying second-level agenda-setting (framing), the nonverbal behaviors of the
previously coded politicians were analyzed using the same methods used by Coleman
and Banning (2006):
Activity was coded as dynamic, and was later rated positive, if the candidate was speaking, shaking hands, kissing babies, or exhibiting similar highly active behavior; it was coded as not dynamic, and thus negative, if the candidate was shown passively listening, reading, dozing, or engaged in other non-active behavior. Posture was coded as either standing tall and upright (positive), or as bowed, slumped, or leaning on something (negative). Arms were coded as either held at shoulder height or higher (positive), or held at rest, at the side, or folded (negative). Hands were coded as gesturing or doing something (positive), or being at rest (negative). Eyes were coded as looking directly at the camera or someone (positive), or as looking indirectly, up, or down, or being closed (negative). The five nonverbal measures were indexed by summing all the positive nonverbal behaviors into one index, and all the negative nonverbal behaviors into another. (p. 318)
Omissions
The actual method for capturing and analyzing images of politicians featured on
21
one of the three news channels was very specific. No still-photographs were used in
the sample; only live video of politicians were used. When the three channels
presented a photograph of a politician, it was usually displayed next to a photograph of
another politician, or to a cluster of many photographs for the utility of comparison. It
was rare that a single photograph of a politician was solely used in the three networks
sampled; thus, this study omitted photos entirely.
Only current elected officials and candidates seeking office were counted; no
bureaucrats or former elected officials were included in this study. Also, only federal
and state level politicians were counted, leaving out in this study any locally elected
officials.
Video footage of politicians found in teasers were omitted. In other words,
whenever an on-air personality stated, “coming up after the commercial break,” or
something similar, and then described what stories would be featured at a later time, it
was common for the network to show video of a politician to be featured in the
upcoming story. Such video featuring politicians were omitted in these circumstances.
The reason behind this particular method was to eliminate redundancy, as the same
footage would commonly be teased numerous times before the actual story took place
on any given network.
In an attempt to enrich the data, a decision was made to note the on-air anchor
at the time of the displayed image of a politician. It has long been speculated that
anchors have immense influence, and use such an influence, on the content that is
displayed by a news organization. In the past, a news anchor was essentially a reader
of news – and nothing else. But recently, the role of an anchor has increased in the

22
production of broadcast journalism. Goldberg describes this phenomenon well in
Anchors:
Over the years, as the anchor position has evolved from news reader to celebrity, as marketing concerns have made the anchor a bigger and bigger presence, the job holders have branched out into many roles, and assumed more and more executive powers in almost every facet of the network news organization. With the clout they have as living logos, mixed with the demands of a fragile ego…When logo meets ego, something a little scary is born. (331)
Incorporating this particular method was thought to possibly identify disparities
between what a channel predominantly displays and what an anchor of the same
channel predominantly displays. If this phenomenon was to surface, conclusions could
be drawn that point to an agenda of an anchor, as opposed to an agenda of a cable
news channel. The 4 most-present anchors for each network were used in this
comparison.
Reliability
The primary coder and author of this study analyzed the sample in its entirety.
For the purpose of satisfying the argument for a need of inter-coder reliability in content
analysis research, a secondary coder examined approximately 10 percent of the
content. A qualified individual with an M.A. in journalism was chosen to check for
reliability by surveying 6 hours of the total 67.5 hours of content. The results were then
compared to the original coded sample using Holsti’s formula for determining reliability
of nominal data (Wimmer & Dominick, 2006). Holsti’s formula is as follows:
Reliability = ___2M__ N1 + N2

23
“M” is equal to the agreed coding decisions between the two coders. And N1 and
N2 are equal to the total number of coding decisions between the first and second
coder, respectively. Generally speaking, any result falling between .7 and 1.0 is
accepted as reliable. The applied formula and outcome are as follows:
___2(700)__ = 1400_ = 89.62 781 + 781 1562 Because the variables determining first-level agenda-setting are fairly difficult to
erroneously code (i.e., date, time, name of politician), it was deemed responsible to
isolate the second-level agenda-setting variables and check for reliability within. These
variables pertained to the positive and negative attributes applied to the framing of
politicians, and they could be viewed in a more subjective manner when coding.
__2(272)__ = _544_ = 81.19 335 + 335 670 The results of Holsti’s applied reliability formula demonstrated that the method by
which this study examined the first- and second-level agenda-setting of FOX, CNN, and
MSNBC is reliable. The measures of reliability calculated in this study both exceed the
required .70 specified by Holsti.
The methods used for the present study were not inventive, as they were
replicated from previous studies. They are believed to be sufficient in being able to
identify the phenomenon of targeting political niche audiences by CNN and FOX, if this
phenomenon does indeed exist. The primary coder and author of the present study
approached this analysis with the utmost integrity in an attempt to be as close to
objective as possible (regardless of the notion that objectivity is an impossible goal to
achieve). The author believes that the results are sound.

24
CHAPTER 3
RESULTS
The results at face value represent the appearance that all three networks favor
Republicans over Democrats, which is significant in itself. However, again, the present
study is only attempting to compare the coverage of politicians by the three cable news
networks – not examine them independently. In this chapter, the results for each
network will be presented first, and then the compared results for all three networks will
follow. To restate the five hypotheses, CNN was expected to present more video
images of Democrats than that of FOX, and present them in a more positive light as
well. FOX, on the other hand, was expected to present more video images of
Republicans than that of CNN, and present them in a more positive light. The results of
MSNBC were expected to act as a medium between the results pertaining to CNN and
FOX.
CNN
Time (in seconds) devoted to airing video images of Republicans significantly
outweighed the time devoted to airing video images of Democrats and 3rd party
politicians (see Figure 2). On CNN, time allotted to Republican video images (6,649
seconds) more than doubled the time allotted to Democratic images (2,922 seconds).

25
CNN Time Alloted
36
6,649
2,922
0
1000
2000
3000
4000
5000
6000
7000
Republicans Democrats 3rd Parties
Sec
onds
Figure 2. CNN time allotted.
Based on the 5 criteria (activity, posture, arms, hands, and eyes) used to
determine framing and second-level agenda-setting, CNN proved to cast 3rd party
politicians as most positive (.2), followed by Republicans (.297), and ultimately
Democrats as the least positive (.376) (see Figure 3). All three groups were framed as
generally positive as the index accounted for an average of 1.0 as being a completely
negative portrayal, as well as 0.0 as being a completely positive portrayal.
Figure 3. CNN average portrayal.
0.297
0.376
0.2
0
0.1
0.2
0.3
0.4
0.5
Republicans Democrats 3rd Parties
Ave
rage
26
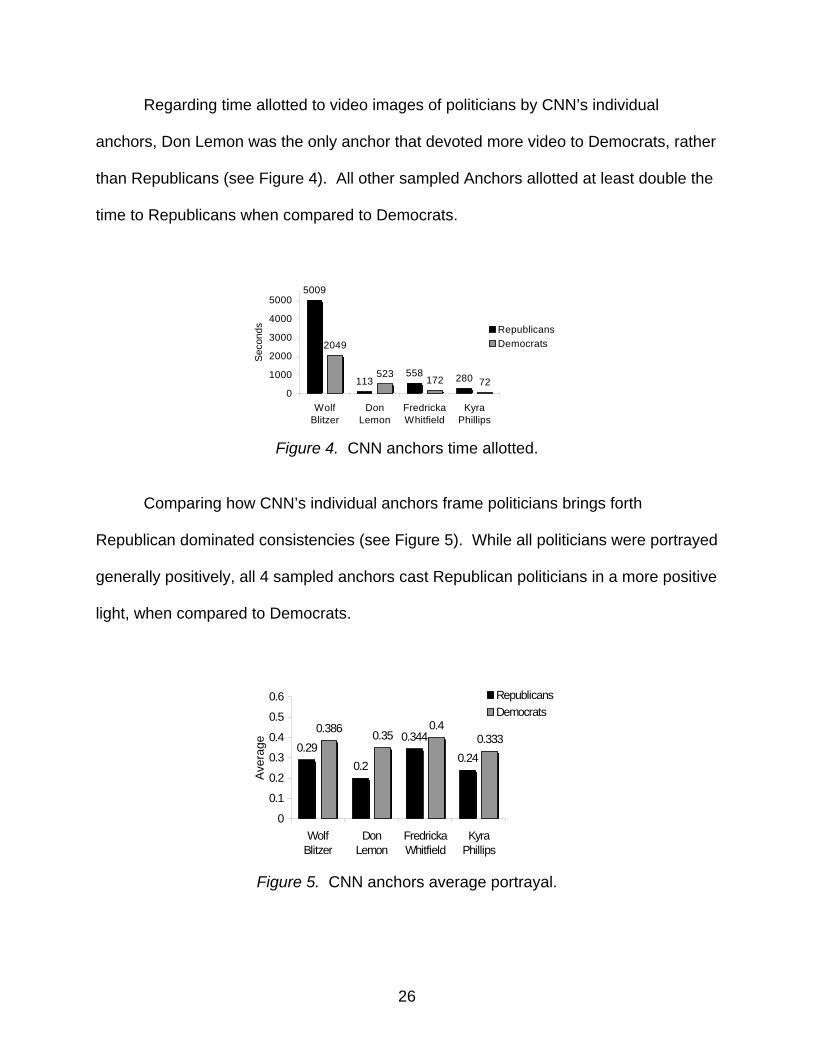
Regarding time allotted to video images of politicians by CNN’s individual
anchors, Don Lemon was the only anchor that devoted more video to Democrats, rather
than Republicans (see Figure 4). All other sampled Anchors allotted at least double the
time to Republicans when compared to Democrats.
Figure 4. CNN anchors time allotted.
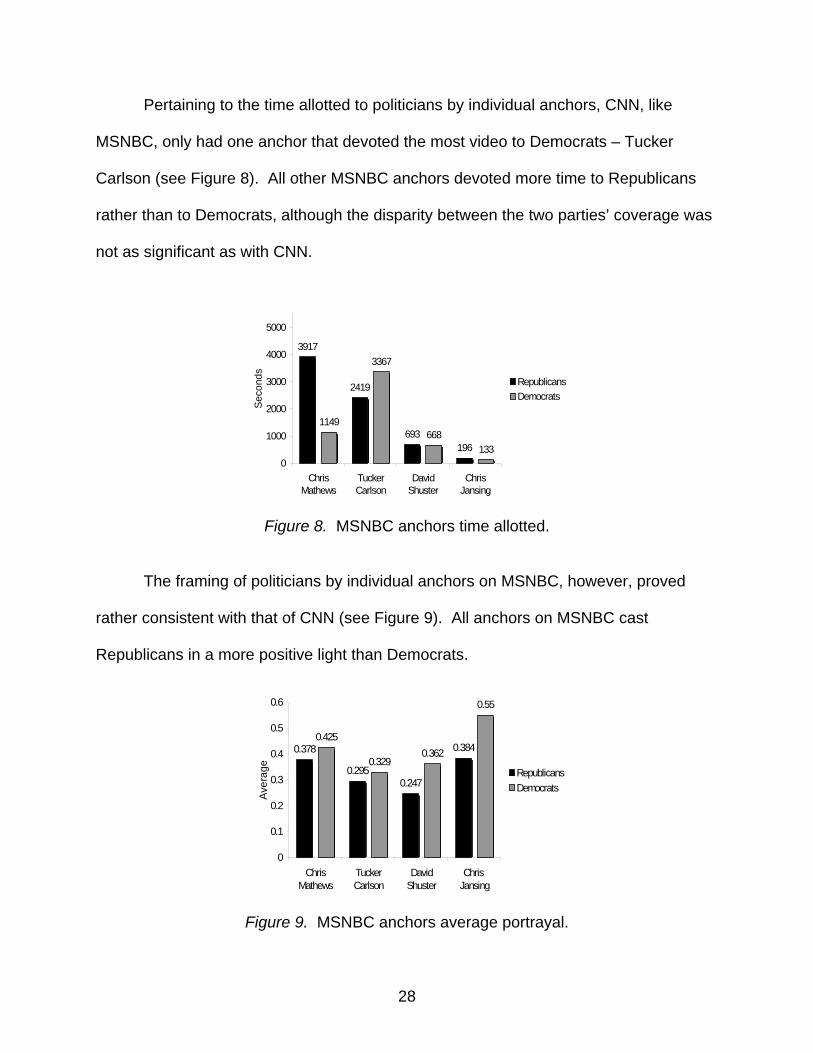
Comparing how CNN’s individual anchors frame politicians brings forth
Republican dominated consistencies (see Figure 5). While all politicians were portrayed
generally positively, all 4 sampled anchors cast Republican politicians in a more positive
light, when compared to Democrats.
Figure 5. CNN anchors average portrayal.
5009
113558 280
2049
523 172 720
1000
2000
3000
4000
5000
WolfBlitzer
DonLemon
FredrickaWhitfield
KyraPhillips
Sec
onds Republicans
Democrats
0.290.2
0.344
0.24
0.386 0.350.4
0.333
0
0.1
0.2
0.3
0.4
0.5
0.6
WolfBlitzer
DonLemon
FredrickaWhitfield
KyraPhillips
Aver
age
RepublicansDemocrats

27
MSNBC
While disparity between allotted time for the different political parties was not as
significant as with CNN, MSNBC still devoted more seconds of video to Republicans
(8,305) than to Democrats (6,502) (See Figure 6). 3rd party candidates received but a
small fraction of all devoted video on MSNBC (but still substantially more than aired by
CNN).
Figure 6. MSNBC time allotted.
In determining second-level agenda-setting, MSNBC also framed 3rd Party
politicians and candidates in the most favorable light (.3) (see Figure 7). Republicans
scored a .313, which indicates that they were framed more positive than the Democrats,
who scored a .377.
Figure 7. MSNBC average portrayal.
554
8,305
6,502
0
1000
2000
3000
4000
5000
6000
7000
8000
9000
Republicans Democrats 3rd Parties
Sec
onds
0.313
0.377
0.3
0
0.1
0.2
0.3
0.4
0.5
Republicans Democrats 3rd Parties
Ave
rage
28
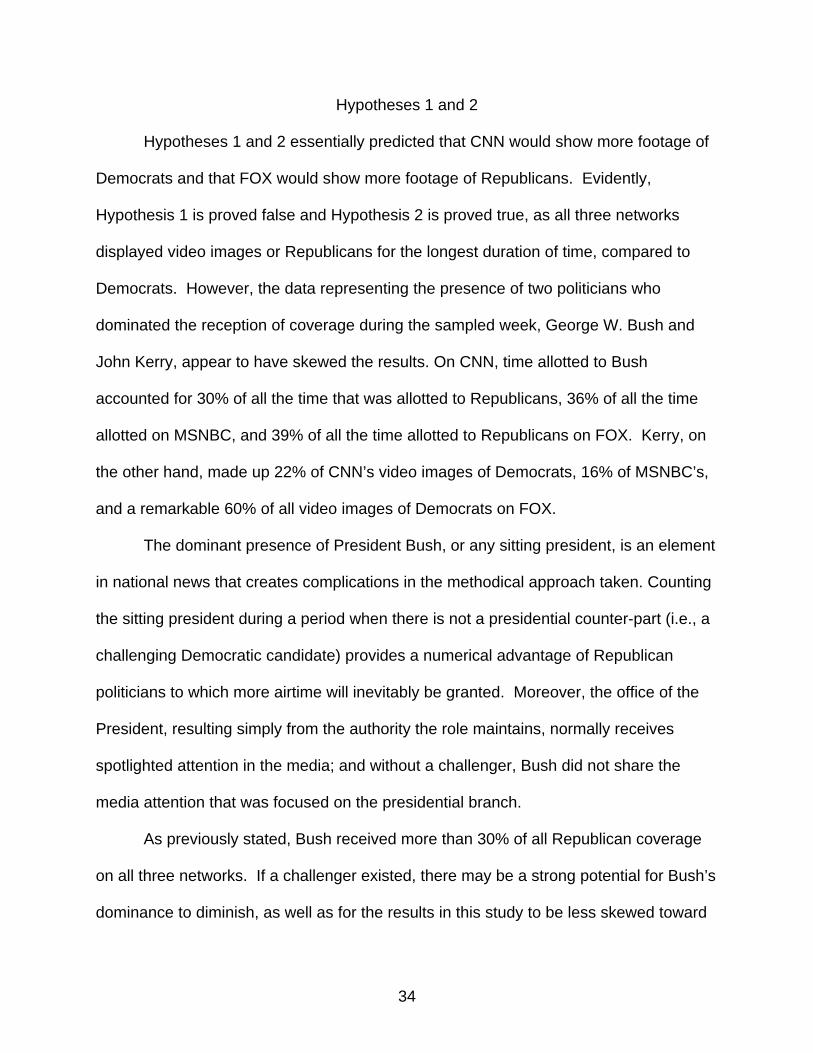
Pertaining to the time allotted to politicians by individual anchors, CNN, like
MSNBC, only had one anchor that devoted the most video to Democrats – Tucker
Carlson (see Figure 8). All other MSNBC anchors devoted more time to Republicans
rather than to Democrats, although the disparity between the two parties’ coverage was
not as significant as with CNN.
Figure 8. MSNBC anchors time allotted.
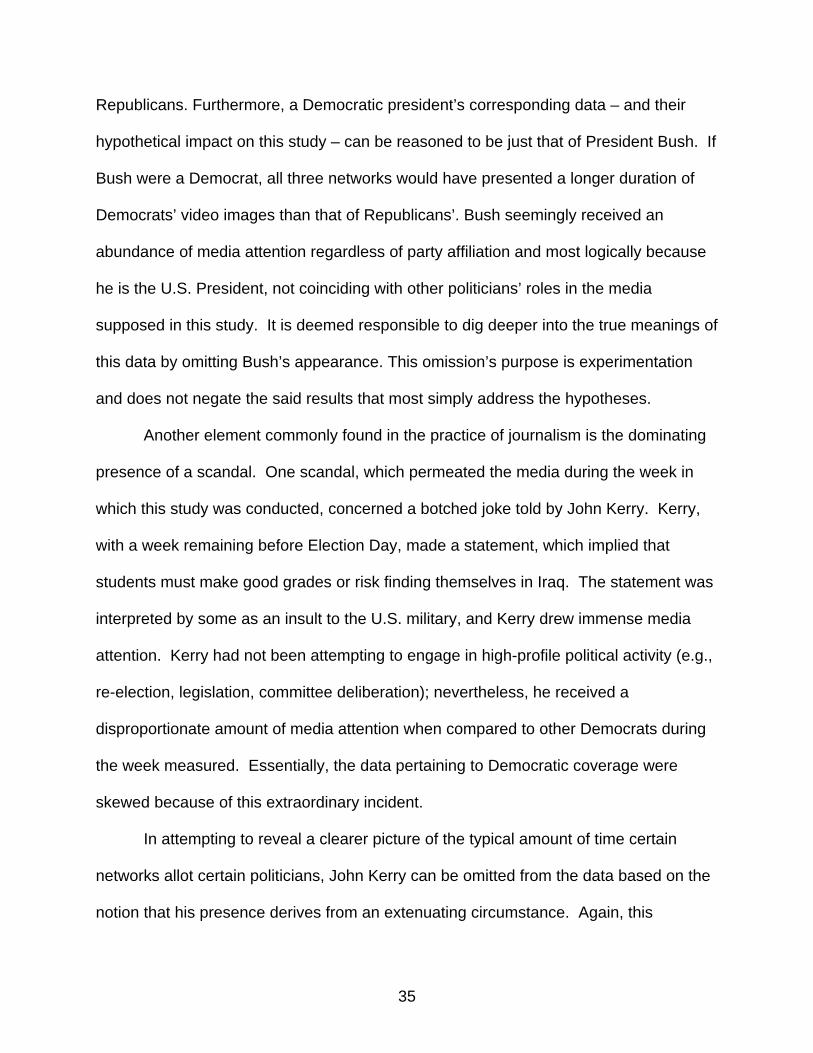
The framing of politicians by individual anchors on MSNBC, however, proved
rather consistent with that of CNN (see Figure 9). All anchors on MSNBC cast
Republicans in a more positive light than Democrats.
Figure 9. MSNBC anchors average portrayal.
3917
2419
693196
1149
3367
668133
0
1000
2000
3000
4000
5000
ChrisMathews
TuckerCarlson
DavidShuster
ChrisJansing
Sec
onds Republicans
Democrats
0.378
0.2950.247
0.3840.425
0.3290.362
0.55
0
0.1
0.2
0.3
0.4
0.5
0.6
ChrisMathews
TuckerCarlson
DavidShuster
Chris Jansing
Aver
age
RepublicansDemocrats

29
FOX FOX matched the trend of showing more video images (in seconds) of
Republicans (8,792) than Democrats (4,316) (see Figure 10). 3rd party politicians scored
weakest with 212 seconds.
Figure 10. FOX time allotted.
Third party politicians received a completely positive score (0.0) when
measuring second-level agenda-setting (see Figure 11). Democrats scored the least
positive with .439 (although still generally positive), and Republicans faired slightly
better with .33.
Figure 11. FOX average portrayal.
8,792
4,316
2120
1000
2000
3000
4000
5000
6000
7000
8000
9000
Republicans Democrats 3rd Parties
Sec
onds
0.33
0.439
00
0.1
0.2
0.3
0.4
0.5
0.6
Republicans Democrats 3rd Parties
Aver
age

30
Individual anchors on FOX all devoted about the same amount of time to
politicians based on party, proportionately (see Figure 12). Republicans far outweighed
Democrats in devoted time individual anchors allotted.
Figure 12. FOX anchors time allotted.
All sampled anchors on FOX cast Republicans in a more positive light than
Democrats (see Figure 13). John Gibson was, by far, the most distinct in his disparity
between the ways he framed politicians of different political parties.
Figure 13. FOX anchors average portrayal.
Comparison Regarding the amount of video (in seconds) devoted to politicians on each
channel, Republicans received the most attention on FOX (8,792 seconds) and the
least amount of attention on CNN (6,649 seconds) (see Figure 14). Democrats
498907 716
101
13662074
4168
1854
0
1000
2000
3000
4000
5000
JohnGibson
NeilCavuto
ShepardSmith
JulieBanderas
Sec
onds
RepublicansDemocrats
g y
0.266
0.3890.306 0.333
0.5260.446
0.3520.422
0
0.1
0.2
0.3
0.4
0.5
0.6
JohnGibson
NeilCavuto
ShepardSmith
JulieBanderas
Aver
age
RepublicansDemocrats

31
8,7928,305
6,649
4,316
6,502
2,922
0100020003000400050006000700080009000
CNN MSNBC FOX
Sec
onds
RepublicansDemocrats
received the most attention on MSNBC (6,502 seconds) and least amount of attention
on CNN (2,922 seconds). Republicans received the most attention on all three sampled
networks, when compared to Democrats.
Figure 14. Time allotted comparison.
Regarding second-level agenda-setting, Republicans received the most positive
portrayal on CNN (.297). Democrats also received the most positive portrayal on CNN
(.376). In general, FOX portrayed politicians, regardless of political ideology, in the
most negative of light, while CNN generally portrayed all politicians in a more positive
fashion (see Figure 15). For all three networks, Democrats were portrayed in a more
negative light than Republicans. However, all three networks generally portrayed all
politicians more positively than negatively (that is, all scores registered less than .50).
Figure 15. Average portrayal comparison.
0.297 0.313 0.330.376 0.377
0.439
0
0.1
0.2
0.3
0.4
0.5
CNN MSNBC FOX
Ave
rage Republicans
Democrats

32
Based on the results at face value, Hypothesis 1 was proved false – CNN did not
display video images of Democrats for a longer duration of time than that of Fox.
Hypothesis 2 was proved true, as FOX did, indeed, present video images of
Republicans for a longer period of time than that of CNN. Hypothesis 3 was also
proved true, as the representation of Democrats by CNN was more positive than that of
FOX. However, Hypothesis 4 was proved false – FOX did not represent Republicans in
a more positive light than that of CNN. Hypothesis 5 was almost justified as completely
true, as MSNBC’s results did act as the medium between FOX and CNN in all cases
except for the time allotted to video images of Democrats – in which the network
presented to most.
Based on the exact methodology used, 3 out of the 5 hypotheses were proved
true. These results are sound; but, as discussed in the subsequent chapter, quantifying
elements in broadcast news is a complicated practice that requires a more complicated
methodology

33
CHAPTER 4
DISCUSSION
As advised by Hill (1985), the five hypotheses proposed prior to the data
acquisition and analyses were of a simple, straightforward method. While the results do
grant some legitimate foresight to the predictions, grasping a solid meaning of the data
proved to be anything but simple and straightforward. Certain elements found in cable
news content, both common and uncommon, added unforeseen complexities to this
particular agenda-setting model. The three networks sometimes shared a similar
complex-inducing element, while on occasion a particular channel, due to its specific
format or style, would contain a practice that complicated the seemingly simple research
method used. Still, upon face value, the results ring provocative – the sheer lop-
sidedness of the data incites a hunger for deeper analysis and explanation.
As detailed in Chapter 3, Republicans dominated Democrats in the amount of
video presented on all three networks, as well as by receiving a more positive visual
portrayal. Not only did Republican images receive more allotted time compared to
Democrats, they did so with vast disparities. On both FOX and CNN, a more than 2:1
ratio was found when comparing the duration of video of Republicans to Democrats.
However, the purpose of this particular agenda-setting study is not to scrutinize the
general content of individual networks (regardless of significance), but to compare
specific content of all observed networks in the hopes of finding key differences that
might point to possible target marketing.
34
Hypotheses 1 and 2
Hypotheses 1 and 2 essentially predicted that CNN would show more footage of
Democrats and that FOX would show more footage of Republicans. Evidently,
Hypothesis 1 is proved false and Hypothesis 2 is proved true, as all three networks
displayed video images or Republicans for the longest duration of time, compared to
Democrats. However, the data representing the presence of two politicians who
dominated the reception of coverage during the sampled week, George W. Bush and
John Kerry, appear to have skewed the results. On CNN, time allotted to Bush
accounted for 30% of all the time that was allotted to Republicans, 36% of all the time
allotted on MSNBC, and 39% of all the time allotted to Republicans on FOX. Kerry, on
the other hand, made up 22% of CNN’s video images of Democrats, 16% of MSNBC’s,
and a remarkable 60% of all video images of Democrats on FOX.
The dominant presence of President Bush, or any sitting president, is an element
in national news that creates complications in the methodical approach taken. Counting
the sitting president during a period when there is not a presidential counter-part (i.e., a
challenging Democratic candidate) provides a numerical advantage of Republican
politicians to which more airtime will inevitably be granted. Moreover, the office of the
President, resulting simply from the authority the role maintains, normally receives
spotlighted attention in the media; and without a challenger, Bush did not share the
media attention that was focused on the presidential branch.
As previously stated, Bush received more than 30% of all Republican coverage
on all three networks. If a challenger existed, there may be a strong potential for Bush’s
dominance to diminish, as well as for the results in this study to be less skewed toward
35
Republicans. Furthermore, a Democratic president’s corresponding data – and their
hypothetical impact on this study – can be reasoned to be just that of President Bush. If
Bush were a Democrat, all three networks would have presented a longer duration of
Democrats’ video images than that of Republicans’. Bush seemingly received an
abundance of media attention regardless of party affiliation and most logically because
he is the U.S. President, not coinciding with other politicians’ roles in the media
supposed in this study. It is deemed responsible to dig deeper into the true meanings of
this data by omitting Bush’s appearance. This omission’s purpose is experimentation
and does not negate the said results that most simply address the hypotheses.
Another element commonly found in the practice of journalism is the dominating
presence of a scandal. One scandal, which permeated the media during the week in
which this study was conducted, concerned a botched joke told by John Kerry. Kerry,
with a week remaining before Election Day, made a statement, which implied that
students must make good grades or risk finding themselves in Iraq. The statement was
interpreted by some as an insult to the U.S. military, and Kerry drew immense media
attention. Kerry had not been attempting to engage in high-profile political activity (e.g.,
re-election, legislation, committee deliberation); nevertheless, he received a
disproportionate amount of media attention when compared to other Democrats during
the week measured. Essentially, the data pertaining to Democratic coverage were
skewed because of this extraordinary incident.
In attempting to reveal a clearer picture of the typical amount of time certain
networks allot certain politicians, John Kerry can be omitted from the data based on the
notion that his presence derives from an extenuating circumstance. Again, this
36
subsequent method of omission can be considered impromptu experimentation as a
means of better understanding the results – it does not nullify the results at face value.
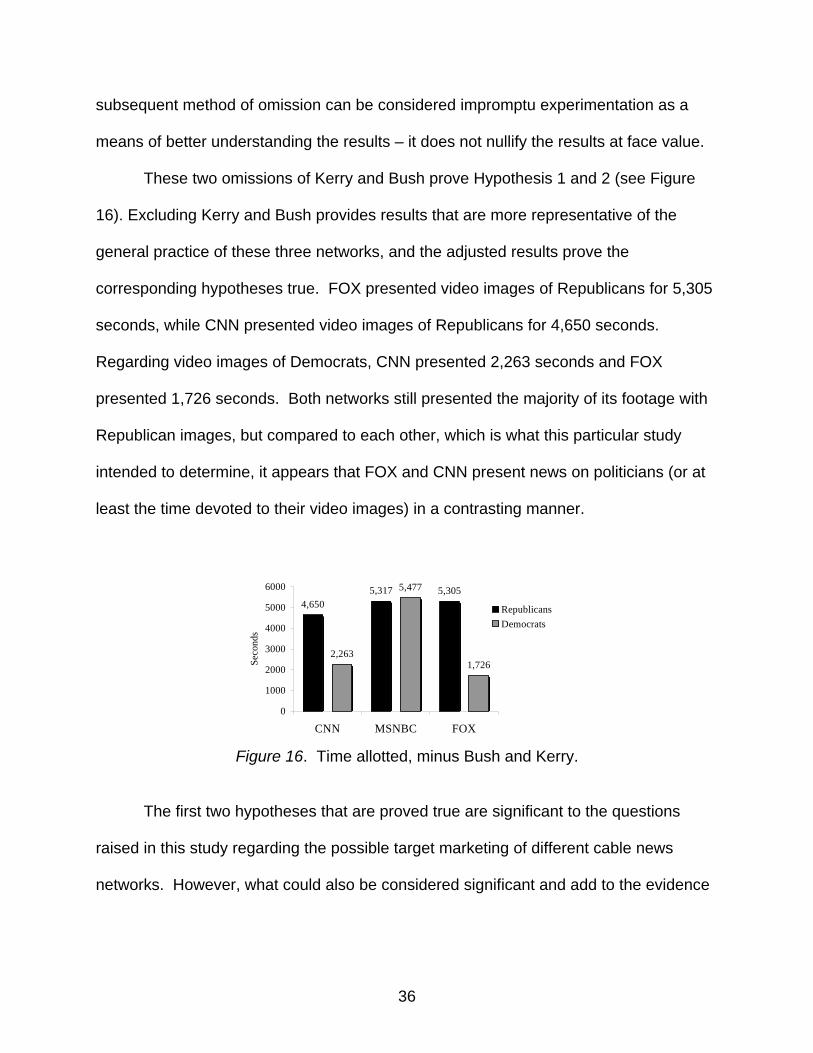
These two omissions of Kerry and Bush prove Hypothesis 1 and 2 (see Figure
16). Excluding Kerry and Bush provides results that are more representative of the
general practice of these three networks, and the adjusted results prove the
corresponding hypotheses true. FOX presented video images of Republicans for 5,305
seconds, while CNN presented video images of Republicans for 4,650 seconds.
Regarding video images of Democrats, CNN presented 2,263 seconds and FOX
presented 1,726 seconds. Both networks still presented the majority of its footage with
Republican images, but compared to each other, which is what this particular study
intended to determine, it appears that FOX and CNN present news on politicians (or at
least the time devoted to their video images) in a contrasting manner.
Figure 16. Time allotted, minus Bush and Kerry.
The first two hypotheses that are proved true are significant to the questions
raised in this study regarding the possible target marketing of different cable news
networks. However, what could also be considered significant and add to the evidence
4,6505,317 5,305
2,263
5,477
1,726
0
1000
2000
3000
4000
5000
6000
CNN MSNBC FOX
Seco
nds
Republicans Democrats
37
for differential agenda-setting practices in cable news is the variation of the removed
data, which corresponded to Bush and Kerry.
During the timeframe in which this study was carried out, video images of
President Bush aired for 1,999 seconds by CNN and 4,316 seconds by FOX. First-level
agenda-setting considers time-duration an object attribute that can affect the
transferring of issue salience from media to audience. The disparity (in seconds) of the
networks’ displayed video image of Bush indicates that different agendas are attempting
to be set.
Based on the information that went into formulating Hypothesis 2, it makes sense
that FOX would exhibit the greatest number of images of Bush – Bush is a Republican.
Conversely, CNN, exhibiting the least amount of images of Bush, completes the implied
truth of Hypotheses 2 – that CNN will exhibit Republicans for the least amount of time.
Furthermore, FOX’s dominant focus on the president maintains the attention of their
audience on that which has been politically successful (The re-elected President Bush);
and, the lessened attention on Bush by CNN indicates an attempt to shift the focus from
a dominant figure to something else. If FOX and CNN are indeed attempting to target
conservatives and liberals, respectively, the significant by-product of this study
regarding the varying attention allotted to Bush is an indication.
The varying attention allotted to Kerry, too, does not directly answer any
hypotheses, but is still significant in terms of indicating the setting of different first-level
agendas. During the week in which this study was conducted, John Kerry was
displayed by CNN for a total of 659 seconds and by FOX for 2,590 seconds. What
makes this dominance of a figure different than that of Bush is that Kerry was not being

38
presented because of his leadership, like Bush, but because of his gaffe. Kerry’s
comment regarding educational success and military personnel is what kept him
illuminated by the media spotlight. However, the vast disparity in attention between the
networks indicates diverse agendas.
Because Kerry’s negative blunder was the basis of the dominating news story, it
can be assumed that FOX devoted the most attention as a means of highlighting a
perceived negative attribute of a Democratic leader. With an agenda of obtaining and
keeping a niche conservative audience, it makes sense that FOX would overwhelmingly
showcase the shortcomings of its viewers’ opposing team – liberals. In contrast, CNN
presenting but a quarter of the video images of Kerry, when compared to FOX, signifies
the desire to not focus on the perceived mistakes of Democratic leadership.
By using the exact methods presented in Chapter 2, the results attest to FOX
indeed displaying video images of Republicans for a longer period of time than CNN,
proving Hypothesis 2. However, under this method, Hypothesis 1 is not supported, as
CNN did not display more video images of Democrats than FOX. These conclusions to
the first two hypotheses, attained from the original methodology, should be considered
the recognized conclusion to Hypotheses 1 and 2. The undeniable significance in these
specific results is the dominance of time allotted to Republicans.
However, as outlined above, it appears that the methodology for testing
Hypotheses 1 and 2 was oversimplified, indicated by the disproportionate presence of
President Bush and Senator Kerry. The adjusted conclusions to Hypotheses 1 and 2,
sans Bush and Kerry, prove the predictions true and should be considered somewhat
valid (or, at the very least, noteworthy and deserving of further study).
39
Hypotheses 3 and 4
In determining second-level agenda-setting, or framing, all networks portrayed all
politicians generally positive. That is to say, in the established spectrum where a
completely positive portrayal of a politician equals an index of 0.0 and a completely
negative portrayal equals an index of 1.0, the average portrayal for both Republicans
and Democrats on all three networks was less than .49. Repeating the theme found in
this study’s examination of first-level agenda-setting, Republicans scored much more
favorably than Democrats on all three networks. Republicans scored about 7.5% more
positive than Democrats on CNN, 6% more positive than Democrats on MSNBC, and
11% more positive than Democrats on FOX.
Different presentation practices appear evident when comparing the general
portrayal of politicians on all three networks. FOX was generally more negative in their
news presentation regardless of party affiliation, as the network portrayed both
Democrats and Republicans more negatively than did CNN and MSNBC. Conversely,
CNN was generally more positive in their news presentation, portraying both
Republicans and Democrats in the most positive of light. These specific results,
regarding the framing of politicians by FOX and CNN, indicate a possible phenomenon
that FOX is generally a more negative and/or critical exhibiter of politicians, while CNN
is generally a more positive and/or accepting exhibiter of politicians. Of course, more
research and data are needed to fully make such an assumption. However, this study
is not making an effort to compare the overall presentation by each network, but is
attempting to compare the specialized presentation of individual politicians in way that
could justify a theory of political niche marketing
40
Regarding Hypothesis 3, which states that CNN would display more positive
video images of Democrats than would FOX, the data proved true. CNN portrayed
Democrats as an index of .376, and FOX portrayed them as an index of .439. This
particular conclusion reflects the assumption that CNN is targeting a more liberal
audience, as they portray Democrats in a more positive light when compared to FOX.
However, Hypothesis 4, which states that FOX would show Republicans in a
more positive light than would CNN, does not conclude as presumed. FOX portrayed
Republicans as a .33 index, and CNN portrayed them as a .297 index; thus, Hypothesis
4 is proved false. However, as with Hypotheses 1 and 2, the true significance of the
data is complicated with various elements found in journalistic practices.
In television news, video footage is paramount. There are many occasions when
the only footage to which a network has access is consequently (and obviously) the only
footage that the network will air. A news network is limited to the extent of its B-roll
library. This practice creates complications for the second-level agenda-setting portion
in the current study. The framing of a politician might not be dictated by a certain
network, but by the finite video footage the certain network possesses.
The corresponding results to Hypotheses 3 and 4 are difficult to validate, as the
footage on each network was predominantly proprietary and looped on a regular basis,
insinuating that each network lacked a diverse catalogue of video that disparately
portrayed each presented politician. Furthermore, if a network only had video footage
of a politician that framed him/her negatively, then that is how the network would
ultimately frame that politician. For example, the state of a politician’s eyes was coded
as positive if visibly looking directly at the camera or at someone, and negatively if
41
indirectly looking around, closed, or not visible. Not taken into account in this
methodology is the element of camera angles, or the lack there of. Many times a
politician would be looking directly at someone, but because the videographeor was
forced to film from behind the subject, the eyes were invisible to the viewer, rendering a
negative variable when coding for the eyes. Is it possible that the network purposely
filmed the politician from the rear for the purpose of negatively framing the subject?
Yes, but it is highly unlikely. It is more plausible that the camera operator had no choice
but to film from a location that negatively portrayed such a politician.
In addition to this phenomenon of a networks’ limited supply of diverse footage,
politicians themselves are diverse – and their mannerisms can be just as sundry. The
specific variables in this study, which attempted to identify second-level agenda-setting,
coded as positive or negative the various body movements, which correspond to
posture, hand-activity, arm-activity, and general activity. It was found in analyzing the
data that some politicians naturally act negative or positive. For example, some
politicians wave their arms and hands about when they publicly speak, and some don’t.
A certain politician’s mannerisms haphazardly coinciding with this study’s definition of
negative does not necessarily indicate that the presenting network is actively attempting
to frame the politician as such. This methodic shortcoming also presents a difficulty in
validating the results concerning Hypotheses 3 and 4.
In furthering the awareness of complications that seemingly invalidate the
methodology used for testing second-level agenda-setting, it is important to discuss the
observed perception that, in many instances, the rhetoric describing the actions or
platform of politicians did not coincide with the video footage that was being presented.
42
For example, the extensive amount of video footage that featured John Kerry contained
many gestures that were coded as positive, yet the rhetoric accompanying the video
was arguable negative. Kerry would look into the camera, move his arms and hands,
and display good posture – seemingly indicating a positive framing on the part of the
networks; however, the accompanying commentary would relate to the possibility that
Kerry might have ruined the chances for the Democrats in the upcoming elections –
language that could easily be perceived as negative. There were many instances such
as this one in which the video footage and the accompanying commentary of a politician
were not consistent. This phenomenon pertaining to the methodology used in
determining second-level agenda-setting, as well as others discuss, lend credence to
the notion that this particular portion of the study might be faulty.
It is also important to note that the data corresponding to Hypotheses 3 and 4
were altered in experimenting with the Bush/Kerry dominance. Upon removing the data
that represented Bush and Kerry from the data that represented the second-level
agenda-setting results, no significant change in the general framing of Republicans and
Democrats was found in the remaining data. In other words, it was determined that the
portrayal of Bush and Kerry by all three networks was in no way different than the
general portrayal of Democrats and Republicans. This finding prompted the allowance
of Bush and Kerry’s data when determining second-level agenda-setting.
Hypothesis 5
Even though the preliminary results rendered two out of the first 4 hypotheses
false, specifically Hypotheses 1 and 4, Hypothesis 5 was proved true in almost every
43
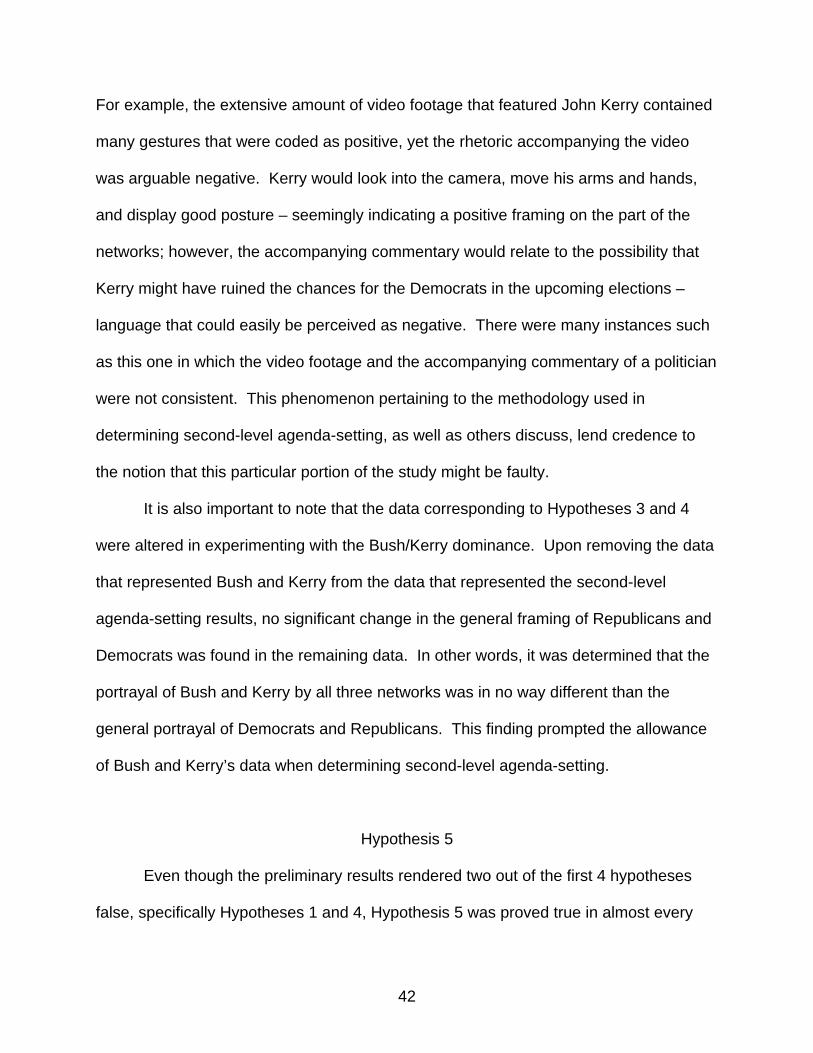
tested account. In the amount of video images allotted to Republicans, FOX displayed
the most with 8,792 seconds; CNN displayed the least with 6,649 seconds, and
MSNBC, as predicted by Hypothesis 5, scored in the middle by displaying 8,305
seconds. However, in the amount of video images allotted to Democrats, MSNBC did
not score in the middle, but scored as the network that presented the most video
images of Democrats with 6,502 seconds.
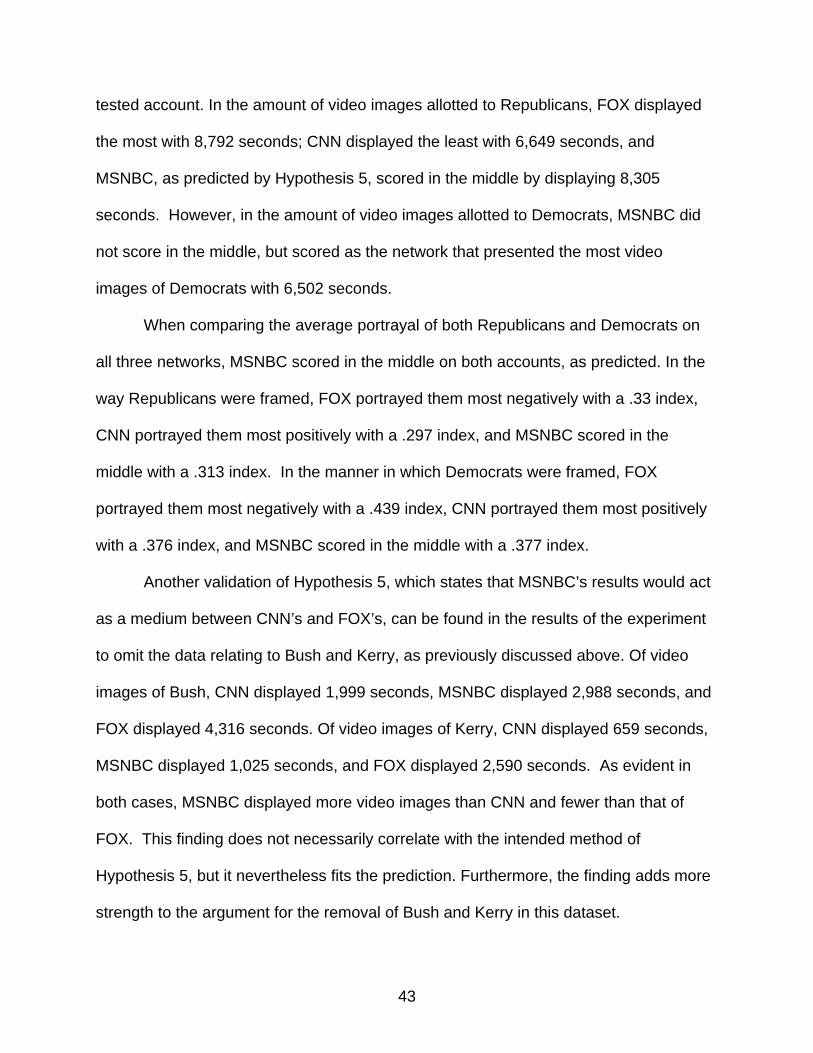
When comparing the average portrayal of both Republicans and Democrats on
all three networks, MSNBC scored in the middle on both accounts, as predicted. In the
way Republicans were framed, FOX portrayed them most negatively with a .33 index,
CNN portrayed them most positively with a .297 index, and MSNBC scored in the
middle with a .313 index. In the manner in which Democrats were framed, FOX
portrayed them most negatively with a .439 index, CNN portrayed them most positively
with a .376 index, and MSNBC scored in the middle with a .377 index.
Another validation of Hypothesis 5, which states that MSNBC’s results would act
as a medium between CNN’s and FOX’s, can be found in the results of the experiment
to omit the data relating to Bush and Kerry, as previously discussed above. Of video
images of Bush, CNN displayed 1,999 seconds, MSNBC displayed 2,988 seconds, and
FOX displayed 4,316 seconds. Of video images of Kerry, CNN displayed 659 seconds,
MSNBC displayed 1,025 seconds, and FOX displayed 2,590 seconds. As evident in
both cases, MSNBC displayed more video images than CNN and fewer than that of
FOX. This finding does not necessarily correlate with the intended method of
Hypothesis 5, but it nevertheless fits the prediction. Furthermore, the finding adds more
strength to the argument for the removal of Bush and Kerry in this dataset.

44
As detailed above, MSNBC was found to be the medium in a number of
measurements, some of which were not hypothesized. Overall, the hypothesis that
MSNBC would offer a medium presentation proved to be generally true.
Disparity in Time Allocation and Portrayal
Comparing the disparity in the manner each network allotted time and portrayed
different politicians proved significant. While all three networks allotted more time to
Republicans and portrayed them more positively when compared to Democrats,
MSNBC did so with the least amount of disparity.
In measuring the video images allotted to both Republicans and Democrats,
CNN had a dispersion range of 3,727 seconds, FOX had a dispersion range of 4,476
seconds, and MSNBC had the smallest dispersion range of 1,803 seconds. These
differences are significant in that they could represent a varying level of favoritism, or
bias, directed toward a particular party. FOX and CNN both have very lop-sided figures
in the representation of both parties, plainly favoring Republicans; but MSNBC presents
a more balanced allotment of video images toward both political parties.
Taking into consideration the Bush/Kerry factor, and by using the data that
correspond to the adjusted measure of allotted video images, the dispersion ranges
become more distinct. After removing the data of Bush and Kerry, CNN had a
dispersion range of 2,387 seconds, FOX had a dispersion range of 3,579 seconds, and
MSNBC had a dispersion range of just 160 seconds – with more time going toward the
Democrats. Based on these measurements from the adjusted data, it appears that FOX
slants its content the most, favoring the Republicans. CNN also seems to favor the

45
Republicans, but not by as much as FOX. And MSNBC appears to be almost perfectly
balanced.
In comparing the disparity between the portrayal of Republicans and Democrats,
MSNBC appears to be the most balanced as well. CNN’s portrayal index had a
dispersion range of .079, while FOX’s portrayal index had a dispersion range of .109.
MSNBC’s portrayal index had a dispersion range of just .064. While all three networks
portrayed Republicans in a more positive light, FOX appears to be the most slanted
toward the Republican Party, and MSNBC comes closest to portraying both parties
evenly.
Scandals
As previously discussed, the John Kerry scandal that played out during the week
in which this study was conducted made an impact on the entire data. Consequently,
measurements were made pertaining to the different presentations carried out by the
networks, and valuable insight was acquired as to possible agendas that were specific
to each news organization. To recap, during this study’s timeframe, John Kerry was
presented for 659 seconds on CNN, 1,025 seconds on MSNBC, and 2,590 seconds on
FOX. Referring to the previous portion of this chapter, which discusses the differences
in these presentation periods and their significance to possible target marketing, will
yield understanding as to why the analysis of political scandals is essential in agenda-
setting research.
Another scandal that implied different networks were setting different agendas
was the incident involving Reverend Ted Haggard. On November 3rd, four days before

46
Election Day, a man who admitted to being a gay prostitute alleged to have had sexual
relations with Haggard, while also facilitating an illegal methamphetamine purchase for
the esteemed reverend. Haggard ultimately confessed to the allegations. Haggard was
not a politician; however he did hold immense political power. Haggard held a weekly
phone conversation with President Bush and was believed to be the pastor with the
most influence over the political direction of evangelicalism (Sharlet, 2005). He was
also a champion for Republican agendas, such as legislation regarding pro-life positions
and the sanctity of marriage between a man and a woman.
The manner in which the three networks presented this story was very diverse.
During the week in which this study was carried out, video images of Ted Haggard were
displayed by CNN for 1,252 seconds, by MSNBC for 794 seconds, and by FOX for 117
seconds (see Figure 17). Upon comparing the different ways the three networks
presented this story, it is easy to distinguish the different agendas that are attempting to
be set.
Figure 17. Ted Haggard time allotted.
For all intent and purposes, Haggard pushed the Republican agenda. It makes
sense that CNN would show the most video footage of Haggard if indeed the network
were trying to target a more liberal niche. As with FOX’s dominant presentation of
794
117
1,250
0
200
400
600
800
1000
1200
1400
CNN MSNBC FOX
Seco
nds

47
Kerry’s tribulation, CNN, by displaying a disproportionate amount of Haggard, was trying
to highlight the flaws of a Republican leader. Conversely, FOX showing less than two
minutes of Haggard is a blatant exclusion of a harmful story to the Republican Party.
Bill Maher best described this dichotomy of opposing methods of presenting the Ted
Haggard story on his weekly political talk show, Real Time with Bill Maher:
Last week, one of the biggest evangelical leaders in America, the Reverend Ted Haggard, was outed for drugs and extramarital gay sex with a male prostitute. Or, as FOX News reported it, John Kerry hates our troops. (2006)
Based on the results and analysis of the present study, Maher, even though he was
attempting to be humorous, was correct in the assessment of the way FOX presented
these two scandals, as well as in the motivations in doing so. However, Maher did
exclude the fact that CNN was similarly biased in their presentation of the Kerry and
Haggard scandals – only in the opposite manner.
Individual Anchors
The recent growth in personality-driven shows on cable news in the last decade
deems it important to isolate the activity of anchors in this study. Cable news anchors
such as Bill O’Reilly, Glenn Beck, Lou Dobbs, Neil Cavuto, Keith Olbermann, Nancy
Grace, Chris Mathews, Tucker Carlson, John Gibson, Michelle Malkin, etc. all have
personalities that are very distinct – injecting a level of entertainment that derives from
individualism. Some of these mentioned personas, as well as others not mentioned, are
speculated to be partisan characters; and because of this notion, it was deemed
responsible to isolate the activity of such anchors as a means to better understand if
and how these individuals were skewing the data for an entire network.

48
For the most part, the activity of the individual anchors for each network match
the activity of the individual networks themselves. Only the activity of two anchors did
not match that of their corresponding networks: Don Lemon and Tucker Carlson.
Don Lemon, who is an anchor on CNN, presented 523 seconds of Democrats
and 113 seconds of Republicans. This does not coincide with the overall coverage of
both Republicans and Democrats on CNN, as video images of Republicans completely
dominated. One could speculate that Don Lemon had an agenda of his own, which was
to aid in the facilitation of pushing a Democratic agenda, but it is doubtful. Lemon was
not a producer of his news segment, and he was not featured as a selling point in co-
hosting the show by CNN. Lemon is a nominal on-air figure at CNN and most likely
does not make the decisions regarding what stories he himself will cover. Speculation
that Lemon had an agenda apart from CNN’s is unfounded, regardless of evidence.
Tucker Carlson, who is an anchor at MSNBC, presented 3,367 seconds of
Democrats and 2,419 seconds of Republicans. Again, this presentation by Carlson
does not coincide with the general presentation of MSNBC. However, unlike Lemon,
Carlson is a featured anchor; he does not read from a teleprompter for the entire
duration of his appearance – speaking off the cuff and injecting his opinion regularly.
Also, Carlson most likely plays a larger role than Lemon in choosing the content that is
presented on his segment.
Based on the manner in which Carlson presented Democrats and Republicans,
and taking into account his credentials and tenure as an on-air personality, one could
reasonably presume that Carlson did play a role in breaking from the general practice of
MSNBC by allotting the most video images to Democrats. However, Carlson is known
49
to be a conservative. A former job of Carlson was that of a right-wing champion on the
CNN debating show, Crossfire. He has played the role of a conservative pundit on
numerous occasions, and this fact of the matter lends complications to the notion that
Carlson was pushing a Democratic agenda on MSNBC.
Conclusion
By Republican video images dominating the coverage and positive framing on
every network, two hypotheses were proved wrong – CNN did not show more
Democratic video images than FOX, and CNN did not portray Democrats in a more
positive light than did FOX. However, as outlined above, the two scandals during the
week sampled coupled with the shortcomings in the methodology pertaining to second-
level agenda-setting, specifically, played a major role in convoluting the results. By
digging deeper into the obtained data, however, it was clear that in some cases FOX
and CNN were targeting different political niche audiences. Mainly in the analysis of the
individual presentations of George W. Bush, John Kerry, and Ted Haggard was the
evidence clearest.
Much more research is needed to better understand this identified phenomenon
– that the distinct presentation of key individuals and/or events is what separates the
methods by which different cable news networks exhibit seemingly objective facts.
However, the methodology used in this study needs to be altered in future research
endeavors, as it appears oversimplified and insufficient to handle the complexities that
is cable news. It is advised that future researchers abandon the effort to measure the
general practice of news presentation on certain networks, and instead compare the
50
exhibition of certain people and events. The limitations for this study were definitely in
determining the presence of second-level agenda-setting. Many similar studies were
discussed in the present study’s Literature Review, and most were deemed to be flawed
in their methodology. This study, too, was also flawed in its methodology, as it did not
account for scandals, which dominated the coverage. Creating a method to accurately
identify second-level agenda-setting is far more difficult than creating a method for the
identification of first-level.
Agenda-setting theory, overall, provided a helpful framework in attempting to
identify branded cable news content. With the theory’s help, the present study was able
to present quantitative evidence that certain cable news organizations, in an effort to
target a political niche audience, set unique agendas by presenting a distinct brand of
news. However, much more measurable evidence is needed to further the
understanding of this phenomenon.

51
REFERENCES
Al-Haqeel, A.S. & Melkote, S.R. (1995). International agenda-setting effects of Saudi Arabian media: A case study. Gazette, 55(1), 17-37.
Alterman, E. (2003). What liberal media? New York: Basic.
American Institute for Political Communication. (1972). Liberal bias as a factor in network television news reporting. Washington DC: GPO.
Anokwa, K. & Salwen, M.B. (1988). Newspaper agenda-setting among elites in Ghana. Gazette, 41(3), 201-214.
Brock, D. (2004). The Republican noise machine. New York: Three Rivers Press.
Burd, G. (1991). A critique of two decades of agenda-setting research. In D.L. Protess & M. McCombs (Eds.), Agenda setting: Readings on media, public opinion, and policymaking (pp. 291-294). Hillsdale, NJ: Lawrence Erlbaum Associates.
Chaudhary, A.G. (2001). International news selection: A comparative analysis of negative news in the Washington Post and the Daily Times of Nigeria. Howard Journal of Communications, 12, 241-254.
Chen, L. (2005). Transitivity in media texts: Negative verbal process sub-functions and narrator bias. International Review of Applied Linguistics in Language Teaching, 43, 33-51.
Cohen, B. C. (1963). The press and foreign policy. Princeton, NJ: Princeton University Press.
Coleman, R. & Banning, S. (2006). Network TV news’ affective framing of the presidential candidates: Evidence for a second-level agenda-setting effect through visual framing. Journalism and Mass Communication Quarterly, 83(2), 313-328.
Collins, S. (2004). Crazy like a fox: The inside story of how fox news beat CNN. New York: Portfolio.
Dearing, J.W. & Rogers, E.M. (1996). Agenda setting. Thousand Oaks, CA: Sage.
Efron, E. (1972). The news twisters. New York: Manor.
Ghanem, S.I. & Wanta, W. (2001). Agenda-setting and Spanish cable news. Journalism and Mass Communication Quarterly, 78(1), 26-44.
Goldberg, B. (2002). Bias. New York: Regency.
Goldberg, R. (1990). Anchors. New York: Carol Publishing Group.
52
Groseclose, T. & Milyo, J. (2004). A measure of media bias. Unpublished study, UCLA and University of Missouri.
Hill, D. B. (1985). Viewer characteristics and agenda setting by television news. Public Opinion Quarterly, 49(3), 340-350.
Kiousis, S., Bantimaroudis, P., & Ban H. (1999). Candidate image attributes: Experiments on the substantive dimension of second level agenda setting. Communication Research, 26(4), 414-428.
Kiousis, S. & McCombs, M. (2004). Agenda-setting effects and attitude strength: Political figures during the 1996 presidential election. Communication Research, 31(1), 36-57.
Knobloch-Westerwick, S., Carpentier, F.D., Blumhoff, A., & Nickel, N. (2005). Selective exposure effects for positive and negative news: Testing the robustness of the informational utility model. Journalism and Mass Communication Quarterly, 82(1), 181-195.
Kwansah-Aidoo, K. (2003). Events that matter: Specific incidents, media coverage, and agenda setting in a Ghanaian context. Canadian Journal of Communication, 28(1), 43-66.
Livingstone, S. (1999). New media, new audiences? New Media and Society, 1(1) 59-66.
Lowry, D.T. & Shidler, J.A. (1998). The sound bites, the biters, and the bitten: A two-campaign test of the anti-incumbent bias hypothesis in network news. Journalism and Mass Communication Quarterly, 75(4), 719-729.
Maher, B. (Writer), & Grant, H. (Director). (2006). November, 10, 2006. In Carter, S., Grey, B., Griffiths, S., & Gurvitz, M (Producers), Real time with Bill Maher. Los Angeles: HBO.
McChesney, R. (1999). The new global media: It’s a small world of big conglomerates. The Nation, 269, 11-15.
McCombs, M. (2005). A look at agenda-setting: Past, present and future. Journalism Studies, 6, 543-557.
McCombs, M., Llamas, J.P., Lopez-Escobar, E., & Rey, F. (1998). Candidate images in Spanish elections: Second-level agenda-setting effects. Journalism and Mass Communication Quarterly, 74(4), 709-717.
McCombs, M.E., & Shaw, D.L. (1972). The agenda-setting function of mass media. Public Opinion Quarterly, 36(17), 176-187.

53
McCombs, M.E. & Shaw, D.L. (1977). Agenda setting and the political process. In M.E. McCombs & D.L. Shaw (Ed.), The emergence of American political Issues: The agenda-setting function of the press (pp. 149-156). St. Paul, MN: West.
Olaski, M. (1988). Prodigal press: The anti-Christian bias of the American news media. Westchester, IL: Crossway.
Peter, J. (2003). Country characteristics as contingent conditions of agenda setting: The moderating influences of polarized elite opinion. Communication Research, 30, 683-712.
Project for Excellence in Journalism. (2006). State of the news media. Retrieved 14 Mar 2007 from http://www.stateofthenewsmedia.org/2005/narrative_cabletv_intro.asp?m%20dia=5
Protess, D.L. & McCombs, M. (1991). Measuring agenda-setting effects. In D.L. Protess & M. McCombs (Eds.), Agenda setting: Readings on media, public opinion, and policymaking (pp. 43-45). Hillsdale, NJ: Lawrence Erlbaum Associates.
Sharlet, J. (2005, May). Soldiers of Christ: Inside America’s most powerful megachurch. Harper’s Magazine, 42-43.
Weaver, D.H., Graber, D.A., McCombs, M.E., & Eyal, C.H. (1981). Media agenda-setting in a presidential election: Issues, images, and interest. New York: Praeger.
Weaver, David H. (1991). Political issues and voter need for orientation. In D.L. Protess & M. McCombs (Eds.), Agenda setting: Readings on media, public opinion, and policymaking (pp. 131-139). Hillsdale, NJ: Lawrence Erlbaum Associates.
Wilke, J. (1995). Agenda-setting in a historical perspective: The coverage of the American Revolution in the German press. European Journal of Communication, 10(1), 63-86.
Wimmer, R. & Dominick, J. (2006). Mass media research: An introduction. Belmont, CA: Thomson Wadsworth.