political freedom and economic growth andrei illarionov, cato institute, institute of economic...
TRANSCRIPT

POLITICAL FREEDOM POLITICAL FREEDOM AND ECONOMIC GROWTHAND ECONOMIC GROWTH
Andrei IllarionovAndrei Illarionov,,
CATO Institute, Institute of Economic Analysis CATO Institute, Institute of Economic Analysis
Seminar “Relationship Between Growth and Freedom”Seminar “Relationship Between Growth and Freedom”Center on Democracy, Development, and the Rule of Law,Center on Democracy, Development, and the Rule of Law,
Stanford UniversityStanford University, , November 13, 2006November 13, 2006
© © CATO InstituteCATO Institute, , Institute of Economic AnalysisInstitute of Economic Analysis
www.cato.orgwww.cato.org, , www.cato.ruwww.cato.ru, , www.iea.ruwww.iea.ru

© ИЭА2
Prof. F. Fukuyama’s main question:Prof. F. Fukuyama’s main question:
What is Optimal Political System What is Optimal Political System for a developing country for a developing country
seeking rapid economic growth?seeking rapid economic growth?

© ИЭА3
Prof. F. Fukuyama main conclusions:Prof. F. Fukuyama main conclusions:
1. No such thing exists as an Optimal Political System (an 1. No such thing exists as an Optimal Political System (an optimal system of formal political institutions).optimal system of formal political institutions).
2.2. Implicitly, Strong (Decisive) political system is more Implicitly, Strong (Decisive) political system is more preferable than Weak (Resolute) one.preferable than Weak (Resolute) one.

© ИЭА4
Prof. F. Fukuyama’s other conclusions:Prof. F. Fukuyama’s other conclusions: Institutions come in complex, interdependent Institutions come in complex, interdependent
packages.packages. Good institutions heavily dependent on local Good institutions heavily dependent on local
context and traditions.context and traditions. Need to invest in local knowledge of institutions.Need to invest in local knowledge of institutions. Leadership matters.Leadership matters. Formal institutions matter less the current literature Formal institutions matter less the current literature
suggests.suggests. Political culture matters.Political culture matters. Better to work with imperfect existing institutions Better to work with imperfect existing institutions
than to spend political capital on long-term than to spend political capital on long-term institutional reform.institutional reform.
International donors have only limited influence International donors have only limited influence over translation of demand for good institutions into over translation of demand for good institutions into political power. political power.

© ИЭА5
The main answer seems not quite convincing because of:The main answer seems not quite convincing because of:
Number of controversial logical issues:Number of controversial logical issues: Permanent struggle for particular types and forms Permanent struggle for particular types and forms
of political institutions all over the world for whole of political institutions all over the world for whole human history means that they are perceived to be human history means that they are perceived to be different and they are different.different and they are different.
Prof. F. Fukuyama’s personal numerous assertions Prof. F. Fukuyama’s personal numerous assertions “institutions matter” (p. 2), “undesirable “institutions matter” (p. 2), “undesirable institutions” (p. 27), “good” institutions (p. 28) institutions” (p. 27), “good” institutions (p. 28) imply existence of “desirable” as well as “bad” imply existence of “desirable” as well as “bad” institutions.institutions.
Since “institutions themselves remain proximate Since “institutions themselves remain proximate causes for growth” (p. 3), the author himself agrees causes for growth” (p. 3), the author himself agrees that there are different outcomes in growth as a that there are different outcomes in growth as a result of different political institutions.result of different political institutions.

© ИЭА6
Matrix of Political Systems (A. Lijphardt, 1991).Matrix of Political Systems (A. Lijphardt, 1991).Presidential/Parliamentary and Electoral Systems.Presidential/Parliamentary and Electoral Systems.Annual GDP per capita growth rates in 1950−2001Annual GDP per capita growth rates in 1950−2001
Plurality PR
Presidential
Parliamentary Westminster (UK, New Zealand)
1,27
US, Philippines1,87
Latin America1,66
Continental Europe2,96

© ИЭА7
Political Systems’ ranking by aggregate number Political Systems’ ranking by aggregate number of veto players (F. Fukuyama, 2006, p. 13):of veto players (F. Fukuyama, 2006, p. 13):
Classic Westminster (New Zealand pre-1994).Classic Westminster (New Zealand pre-1994). Parliamentary/PR with strong parties (Austria, Belgium, Parliamentary/PR with strong parties (Austria, Belgium,
Netherlands, Thailand).Netherlands, Thailand). Premier-presidential, no federalism (France 5Premier-presidential, no federalism (France 5thth Republic, Republic,
Finland).Finland). Presidential with plurality voting, with federalism (USA, Presidential with plurality voting, with federalism (USA,
Philippines).Philippines). Parliamentary with fragmented parties (French 4Parliamentary with fragmented parties (French 4thth
Republic, Italy pre-1994).Republic, Italy pre-1994). Presidential with PR and fragmented parties (Colombia, Presidential with PR and fragmented parties (Colombia,
Brazil).Brazil).

© ИЭА8
CriteriaCriteria ““Strong”Strong” ““Weak”Weak”
Form of GovernmentForm of Government PresidentialPresidential ParliamentaryParliamentary
Number of Veto GatesNumber of Veto Gates FewFew: : DictatorshipDictatorship ManyMany: : Perfect Perfect Consensual Consensual DemocracyDemocracy
Electoral SystemElectoral System PluralityPlurality Proportional Proportional RepresentationRepresentation
Party DisciplineParty Discipline StrongStrong WeakWeak
BicameralismBicameralism One chamberOne chamber Two chambersTwo chambers
FederalismFederalism CentralizationCentralization DecentralizationDecentralization
Judiciary IndependenceJudiciary Independence Interpretation of Interpretation of legislative intentlegislative intent
Initiation policies on its Initiation policies on its ownown
Components of “Strong” and “Weak” political systems Components of “Strong” and “Weak” political systems (macro-political institutions):(macro-political institutions):

© ИЭА9
ParametersParameters ““Strong”Strong” ““Weak”Weak”Legislative coherenceLegislative coherence CoherentCoherent IncoherentIncoherent
Effectiveness of Effectiveness of decisionsdecisions
Lower CostLower Cost Higher CostHigher Cost
Speed of decision-Speed of decision-makingmaking
HigherHigher LowerLower
ResolutenessResoluteness HigherHigher LowerLower
LegitimacyLegitimacy InternalInternal ExternalExternal
Character of political Character of political activityactivity
““To get things done”To get things done” ““To sink in miasma of To sink in miasma of everyday politics”everyday politics”
Political systemPolitical system ““Decisive”Decisive” ““Resolute”Resolute”, , but but LegitimateLegitimate
ExamplesExamples New ZealandNew Zealand, , UKUK USAUSA
Policy outcomes of “Strong” (“Decisive”) and Policy outcomes of “Strong” (“Decisive”) and “Weak” (“Resolute/Legitimate”) political systems:“Weak” (“Resolute/Legitimate”) political systems:

© ИЭА10
Checking theory against realityChecking theory against reality

© ИЭА11
New Zealand
USA
50
60
70
80
90
100
11019
50
1952
1954
1956
1958
1960
1962
1964
1966
1968
1970
1972
1974
1976
1978
1980
1982
1984
1986
1988
1990
1992
1994
1996
1998
2000
2002
2004
Per
cen
tsGDP perGDP per capita in New Zealand ascapita in New Zealand as % % of USA, 1950−2005of USA, 1950−2005

© ИЭА12
Political Systems and Economic Growth, 1950−1994Political Systems and Economic Growth, 1950−1994
1,4
3,0
3,5
2,8
2,0 1,9
0,0
0,5
1,0
1,5
2,0
2,5
3,0
3,5
4,0
ClassicalWestminster
Parliamentarywith cohesive
parties
Parliamentarywith
fragmentedparties
Premier-Presidential
Presidentialwith PR,
fragmentedparties
Presidentialwith plurality
voting
Political systems by their "decisiveness"
GD
P p
er
ca
pit
a g
row
th r
ate
, 19
50
-19
94

© ИЭА13
Which political systemWhich political system– either “strong” or “weak” one – – either “strong” or “weak” one –
is more conducive for economic growthis more conducive for economic growth??

© ИЭА14
Forms of Government and Economic Growth, 1951−2004Forms of Government and Economic Growth, 1951−2004
2,23
1,19
0,0
0,5
1,0
1,5
2,0
2,5
Parliament Regime (84) Presidential Republic (48)
GD
P p
er
ca
pit
a g
row
th r
ate
s, 1
95
1-2
00
4

© ИЭА15
Origin of Legal System and Economic Growth, 1951−2004Origin of Legal System and Economic Growth, 1951−2004
1,61,9
3,4
0,0
0,5
1,0
1,5
2,0
2,5
3,0
3,5
4,0
French Law (91 ) English Law (68) German & Scandinavian Law(11)
GD
P p
er
ca
pit
a g
row
th r
ate
s, 1
95
1-2
00
4

© ИЭА16
Political Competition/Political Monopolization Political Competition/Political Monopolization and Economic Growth, 1990−2004and Economic Growth, 1990−2004
1,6
1,4
0,9
0,0
0,2
0,4
0,6
0,8
1,0
1,2
1,4
1,6
1,8
Less 60%(89 countries)
From 60 to 85%(22 countries)
More 85%(48 countries)
Number of votes collected by largest party
GD
P p
er
ca
pit
a g
row
th r
ate
s, 1
99
0-2
00
4

© ИЭА17
Federalism/Centralization and Economic GrowthFederalism/Centralization and Economic Growth
2,62,4
0,8
2,8
0,0
0,5
1,0
1,5
2,0
2,5
3,0
3,5
Less 65%(19 countries)
From 65 to 80%(18 countries)
From 80 to 99%(43 countries)
From 99 to 100%(80 countries)
Central Government Expenditure as % of General Government
GD
P p
er
ca
pit
a g
row
th r
ate
s, 1
98
0-2
00
4

© ИЭА18
Some conclusions:Some conclusions:
Political institutions matter.Political institutions matter. Optimal political system does exist.Optimal political system does exist. Following political institutions are conducive for faster Following political institutions are conducive for faster
economic growth : parliamentary form of government economic growth : parliamentary form of government rather than presidential one, German/Scandinavian rather than presidential one, German/Scandinavian law system rather than French one, political law system rather than French one, political competition rather than political monopolization, competition rather than political monopolization, federalism rather than centralization of government, federalism rather than centralization of government, political and civil freedoms rather their lack or political and civil freedoms rather their lack or absence, larger than smaller number of “veto players” absence, larger than smaller number of “veto players” in the political system. in the political system.
In the long-run “Strong”, or “Decisive”, political system In the long-run “Strong”, or “Decisive”, political system seems less effective than “Weak” seems less effective than “Weak” (“Resolute/Legitimate”) one. The latter leads to much (“Resolute/Legitimate”) one. The latter leads to much more tangible economic results.more tangible economic results.

© ИЭА19
Political Freedom in the WorldPolitical Freedom in the World, 1972−2005, 1972−2005
Developed countries
Developing countries
World
Free
Not Free
2
3
4
5
6
7
8
9
101
97
21
97
31
97
41
97
51
97
61
97
71
97
81
97
91
98
01
98
1/8
21
98
2/8
31
98
3/8
41
98
4/8
51
98
5/8
61
98
6/8
71
98
7/8
81
98
8/8
91
99
01
99
11
99
21
99
31
99
41
99
51
99
61
99
71
99
81
99
92
00
02
00
12
00
22
00
32
00
42
00
5

© ИЭА20
Political FreedomPolitical Freedom by Country Groupsby Country Groups, 1972−2005, 1972−2005
World
Nations in Transition
OPEC
Free
Not Free
1
2
3
4
5
6
7
81
97
21
97
31
97
4
19
75
19
76
19
77
19
78
19
79
19
80
19
81
/82
19
82
/83
19
83
/84
19
84
/85
19
85
/86
19
86
/87
19
87
/88
19
88
/89
19
90
19
91
19
92
19
93
19
94
19
95
19
96
19
97
19
98
19
99
20
00
20
01
20
02
20
03
20
04
20
05

© ИЭА21
Political Freedom in Nations in TransitionPolitical Freedom in Nations in Transition,, 1 1999911−2005−2005
CIS
The Balkans
Central Europe and BalticFree
Not Free
2
3
4
5
6
7
8
9
10
1991 1992 1993 1994 1995 1996 1997 1998 1999-2000
2001 2002 2003 2004 2005
© ИЭА22
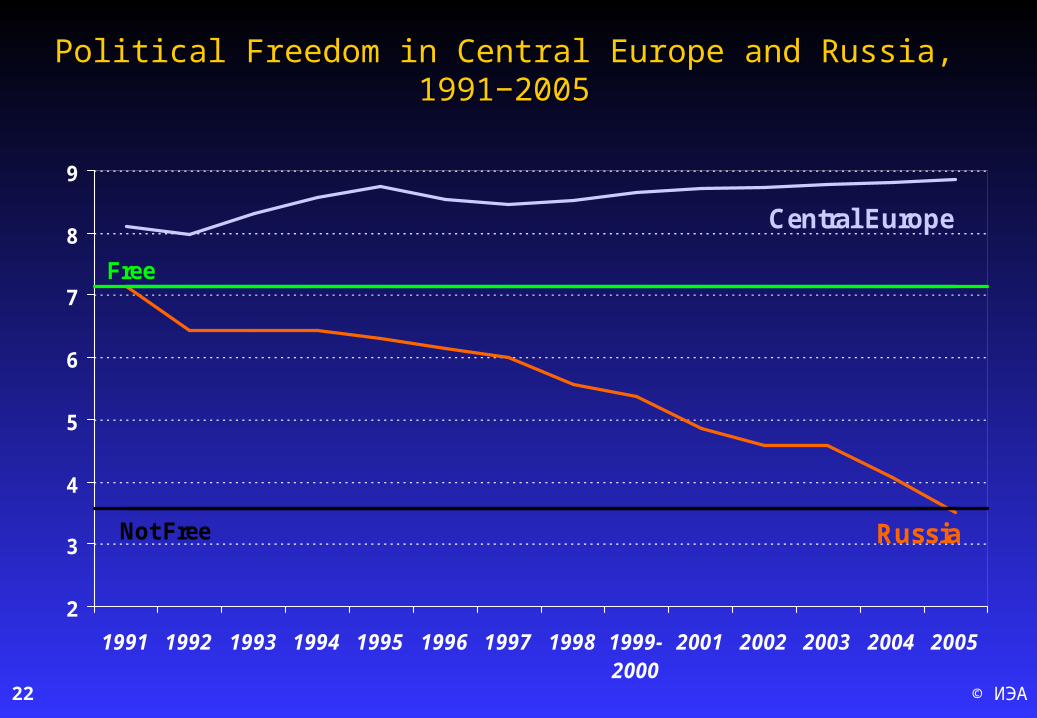
Political Freedom in Central Europe and RussiaPolitical Freedom in Central Europe and Russia, 199, 19911−2005−2005
Central Europe
Russia
Free
Not Free
2
3
4
5
6
7
8
9
1991 1992 1993 1994 1995 1996 1997 1998 1999-2000
2001 2002 2003 2004 2005

© ИЭА23
Political Freedom in the Balkans and RussiaPolitical Freedom in the Balkans and Russia, 199, 19911−2005−2005
Russia
The Balkans
Free
Not Free
2
3
4
5
6
7
8
1991 1992 1993 1994 1995 1996 1997 1998 1999-2000
2001 2002 2003 2004 2005

© ИЭА24
Political Freedom in the Baltic Countries and RussiaPolitical Freedom in the Baltic Countries and Russia, , 19919911−2005−2005
Russia
Baltic countries
Free
Not Free
2
3
4
5
6
7
8
9
10
1991 1992 1993 1994 1995 1996 1997 1998 1999-2000
2001 2002 2003 2004 2005

© ИЭА25
Political Freedom in the CIS and RussiaPolitical Freedom in the CIS and Russia, 199, 19911−2005−2005
Russia
CIS
Free
Not Free
2
3
4
5
6
7
8
1991 1992 1993 1994 1995 1996 1997 1998 1999-2000
2001 2002 2003 2004 2005

© ИЭА26
Political Freedom in the GUM (Georgia, Ukraine, Moldova) Political Freedom in the GUM (Georgia, Ukraine, Moldova) countries and Russiacountries and Russia, 199, 19911−2005−2005
Russia
GUM
Free
Not Free
2
3
4
5
6
7
8
1991 1992 1993 1994 1995 1996 1997 1998 1999-2000
2001 2002 2003 2004 2005

© ИЭА27
Political Freedom in the CIS-8 and RussiaPolitical Freedom in the CIS-8 and Russia,, 1 1999911−2005−2005
Russia
CIS-8
Free
Not Free
2
3
4
5
6
7
8
1991 1992 1993 1994 1995 1996 1997 1998 1999-2000
2001 2002 2003 2004 2005

© ИЭА28
Political Freedom in the Former USSR and RussiaPolitical Freedom in the Former USSR and Russia, , 19919911−2005−2005
Russia
GUM
CIS-8
Baltic countries
Free
Not Free
2
3
4
5
6
7
8
9
10
1991 1992 1993 1994 1995 1996 1997 1998 1999-2000
2001 2002 2003 2004 2005

© ИЭА29
The most important factor of the short- and medium- term The most important factor of the short- and medium- term
economic success is economic freedomeconomic success is economic freedom..
But in the long run it is not enough.But in the long run it is not enough.
The necessary condition of the society’s The necessary condition of the society’s
long run success is political freedomlong run success is political freedom..

© ИЭА30
Politically free countries are richer Politically free countries are richer than politically non free onesthan politically non free ones. .
GDP per capita by level of political freedomGDP per capita by level of political freedom, 2005, 2005..
27828
58294100
0
5000
10000
15000
20000
25000
30000
Non Free Partly free Free
GD
P p
er
ca
pit
a b
y P
PP
in
20
02
$

© ИЭА31
Economic growth in politically free countries is faster than in Economic growth in politically free countries is faster than in politically non free onespolitically non free ones. .
GDP per capita indices by level of political freedomGDP per capita indices by level of political freedom (1972=100%). (1972=100%).
Free
Non Free
Partly Free
40
60
80
100
120
140
160
180
200
220
19
72
19
73
19
74
19
75
19
76
19
77
19
78
19
79
19
80
19
81
/82
19
82
/83
19
83
/84
19
84
/85
19
85
/86
19
86
/87
19
87
/88
19
88
/89
19
90
19
91
19
92
19
93
19
94
19
95
19
96
19
97
19
98
19
99
20
00
20
01
20
02
20
03
20
04
20
05
Pe
r c
en
ts

© ИЭА32
Transition from political freedom to political non freedom leads Transition from political freedom to political non freedom leads to economic degradationto economic degradation, , transition in opposite direction transition in opposite direction
accelerates economic growthaccelerates economic growth.. GDP per capita annual average growth ratesGDP per capita annual average growth rates, 1972-2005, 1972-2005..
-0,6
1,7
2,1
-1,0
-0,5
0,0
0,5
1,0
1,5
2,0
2,5
Transition from freedomto non freedom (10
cases)
World Transition from nonfreedom to freedom (17
cases)
Pe
r c
en
ts

© ИЭА33
Political non freedom creates insurmountable barrierPolitical non freedom creates insurmountable barrierto economic growthto economic growth. .
In countries where political freedom was replaced with non freedom GDP In countries where political freedom was replaced with non freedom GDP per capita does not exceed 15000 $ by PPP in 2002 prices.per capita does not exceed 15000 $ by PPP in 2002 prices.
0
3
6
9
12
15
18
21
24
271
97
21
97
31
97
41
97
51
97
61
97
71
97
81
97
91
98
01
98
11
98
21
98
31
98
41
98
51
98
61
98
71
98
81
98
91
99
01
99
11
99
21
99
31
99
41
99
51
99
61
99
71
99
81
99
92
00
02
00
12
00
22
00
32
00
42
00
5
GD
P p
er
ca
pit
a b
y P
PP
in 2
00
2 $
Economic barrier of political non freedom

© ИЭА34
There is no insurmountable barrier to economic growth There is no insurmountable barrier to economic growth in the countries that moved from political non freedom in the countries that moved from political non freedom
to political freedomto political freedom..
"Barrier"
0
3
6
9
12
15
18
21
24
271
97
21
97
31
97
41
97
51
97
61
97
71
97
81
97
91
98
01
98
11
98
21
98
31
98
41
98
51
98
61
98
71
98
81
98
91
99
01
99
11
99
21
99
31
99
41
99
51
99
61
99
71
99
81
99
92
00
02
00
12
00
22
00
32
00
42
00
5
GD
P p
er
ca
pit
a b
y P
PP
in 2
00
2 p
ric
es

© ИЭА35
A barrier to economic growth does exist even A barrier to economic growth does exist even for rich energy-exporters that are politically non freefor rich energy-exporters that are politically non free..
As a rule, their GDP per capita does not exceed As a rule, their GDP per capita does not exceed $15000 by PPP in 20$15000 by PPP in 2002 02 pricesprices..
Algeria
IranIraq
Lybia
Saudi Arabia
Syria
Congo
"Barrier"
0
3
6
9
12
15
18
21
24
2719
7219
7319
7419
7519
7619
7719
7819
7919
8019
8119
8219
8319
8419
8519
8619
8719
8819
8919
9019
9119
9219
9319
9419
9519
9619
9719
9819
9920
0020
0120
0220
0320
0420
05
GD
P p
er
ca
pit
a b
y P
PP
in
20
02
pri
ce
s.

© ИЭА36
The barrier to economic growth does exist The barrier to economic growth does exist for energy exporters that are politically partly free.for energy exporters that are politically partly free.Their GDP per capita does not exceeds $Their GDP per capita does not exceeds $1515000, too.000, too.
Argentina
ColombiaEcuador
Egypt
MalaysiaMexico Tunisia
Venezuela
Barrier
0
3
6
9
12
15
18
21
24
2719
7219
7319
7419
7519
7619
7719
7819
7919
8019
8119
8219
8319
8419
8519
8619
8719
8819
8919
9019
9119
9219
9319
9419
9519
9619
9719
9819
9920
0020
0120
0220
0320
0420
05
GD
P p
er c
apit
a b
y P
PP
in 2
002
pri
ces
.

© ИЭА37
There is no insurmountable barrier to economic growth for There is no insurmountable barrier to economic growth for energy exporters that are free politically.energy exporters that are free politically.
Canada
Norway
Trinidad
UK
Barrier
0
3
6
9
12
15
18
21
24
27
30
33
36
39
1972
1973
1974
1975
1976
1977
1978
1979
1980
1981
1982
1983
1984
1985
1986
1987
1988
1989
1990
1991
1992
1993
1994
1995
1996
1997
1998
1999
2000
2001
2002
2003
2004
2005
GD
P p
er
ca
pit
a i
n t
ho
us
$ b
y P
PP
in
20
02
pri
ce
s

© ИЭА38
Russia
0
5
10
15
20
25
30
35
40
0 1 2 3 4 5 6 7 8 9 10 11
Political Freedom Index, 2005
GD
P p
er c
apit
a in
th
ou
s $
by
PP
P in
200
2 p
rice
s, 2
005
Basic regularity (118 countries) Other path (15 countries)Non Freedom Barrier Non FreeFree
Economic barrier of political non-freedom политической несвободы
Georgia
Non Free Partly Free Free
Economic barrier of political non freedomEconomic barrier of political non freedom..Political Freedom Index and Level of economic development Political Freedom Index and Level of economic development
((countries with population more than countries with population more than 3 3 mln.mln.), 2005.), 2005.

© ИЭА39
Different political institutions Different political institutions defend political freedom in different ways defend political freedom in different ways
and have different impact on economic growthand have different impact on economic growth..

© ИЭА40
CriteriaCriteria StrongStrong WeakWeak
Forms of governmentForms of government PresidentialPresidential ParliamentaryParliamentary
Legal systemLegal system French lawFrench law GermanicGermanic--Scandinavic Scandinavic lawlaw
Electoral systemElectoral system MajoritarianMajoritarian Proportional Proportional representationrepresentation
Power resource of the Power resource of the largest partylargest party
Political monopolizationPolitical monopolization Political competitionPolitical competition
FederalismFederalism CentralizationCentralization DecentralizationDecentralization
Independence of justice Independence of justice systemsystem
WeakWeak StrongStrong
Basic characteristicsBasic characteristics of of ««strongstrong» » andand « «weakweak»» political systems. political systems.

© ИЭА41
Freedom vs. Non FreedomFreedom vs. Non Freedom::historical cases.historical cases.

© ИЭА42
North Korea
South Korea
World
0
25
50
75
100
125
150
175
200
225
25019
50
1952
1954
1956
1958
1960
1962
1964
1966
1968
1970
1972
1974
1976
1978
1980
1982
1984
1986
1988
1990
1992
1994
1996
1998
2000
2002
2004
Per
cen
tsGDP per capita in South Korea and North Korea GDP per capita in South Korea and North Korea
as % of the world averageas % of the world average, 1950–2005, 1950–2005

© ИЭА43
Austria
Czech Republic
World100
125
150
175
200
225
250
275
300
325
350
375
40019
50
1952
1954
1956
1958
1960
1962
1964
1966
1968
1970
1972
1974
1976
1978
1980
1982
1984
1986
1988
1990
1992
1994
1996
1998
2000
2002
2004
Per
cen
tsGDP per capita in Austria and Czech Republic GDP per capita in Austria and Czech Republic
as % to the world averageas % to the world average, 1950–2005, 1950–2005

© ИЭА44
Puerto Rico
Cuba
World
0
25
50
75
100
125
150
175
200
225
25019
50
1952
1954
1956
1958
1960
1962
1964
1966
1968
1970
1972
1974
1976
1978
1980
1982
1984
1986
1988
1990
1992
1994
1996
1998
2000
2002
2004
Per
cen
tsGDP per capita in Puerto Rico and Cuba GDP per capita in Puerto Rico and Cuba as % of the world averageas % of the world average, 1950–2005, 1950–2005

© ИЭА45
Georgia
Greece
World
0
25
50
75
100
125
150
175
200
225
25019
50
1952
1954
1956
1958
1960
1962
1964
1966
1968
1970
1972
1974
1976
1978
1980
1982
1984
1986
1988
1990
1992
1994
1996
1998
2000
2002
2004
Per
cen
tcGDP per capita in Greece and Georgia GDP per capita in Greece and Georgia as % of the world averageas % of the world average, 1950–2005, 1950–2005

© ИЭА46
Main World TrendsMain World Trends

© ИЭА47
World Political Rights and Civil Liberties IndicesWorld Political Rights and Civil Liberties Indices, , 1972−20051972−2005
Political Rights
Civil Liberties
Free
Non Free
3,0
3,5
4,0
4,5
5,0
5,5
6,0
6,5
7,0
7,5
8,01
97
21
97
31
97
41
97
51
97
61
97
71
97
81
97
91
98
01
98
1/8
21
98
2/8
31
98
3/8
41
98
4/8
51
98
5/8
61
98
6/8
71
98
7/8
81
98
8/8
91
99
01
99
11
99
21
99
31
99
41
99
51
99
61
99
71
99
81
99
92
00
02
00
12
00
22
00
32
00
42
00
5

© ИЭА48
Politically Free, Partly Free and Non Free countries as % of all Politically Free, Partly Free and Non Free countries as % of all countries of the worldcountries of the world, 1975−2005, 1975−2005
25
34
41
34 34 33
40
33
28
46
30
23
0
5
10
15
20
25
30
35
40
45
50
Free Partly Free Non Free
Per
cen
ts
1975 1985 1995 2005

© ИЭА49
World GDP per capitaWorld GDP per capita,, 1870−20051870−2005
0
1
2
3
4
5
6
7
8
9
10
1870
1875
1880
1885
1890
1895
1900
1905
1910
1915
1920
1925
1930
1935
1940
1945
1950
1955
1960
1965
1970
1975
1980
1985
1990
1995
2000
2005
GD
P p
er
ca
pit
a i
n t
ho
us
. $
by
PP
P i
n 2
00
2 p
ric
es
© ИЭА50
The most important law The most important law of the modern social development: of the modern social development:
an increase in economic and political freedoms leads to an increase in economic and political freedoms leads to growth of prosperity and well-beinggrowth of prosperity and well-being..
Humanity becomes freer.Humanity becomes freer. World becomes richer and saferWorld becomes richer and safer..

© ИЭА51
Formula of prosperity is not puzzle anymoreFormula of prosperity is not puzzle anymore..
Formula of prosperity Formula of prosperity is defense, support, sustaining and expanding of is defense, support, sustaining and expanding of
economic and political freedomseconomic and political freedoms..

© ИЭА52
Political Freedom in the World, OPEC and RussiaPolitical Freedom in the World, OPEC and Russia, , 1991−20051991−2005
World
OPEC
Free
Not Free
2
3
4
5
6
7
8
19
91
19
92
19
93
19
94
19
95
19
96
19
97
19
98
19
99
20
00
20
01
20
02
20
03
20
04
20
05
Russia

© ИЭА53
By change in PF Index in 1991−2005 in 193 countries By change in PF Index in 1991−2005 in 193 countries Russia occupies 190Russia occupies 190thth place place
-6
-4
-2
0
2
4
6
8
Gh
an
aK
en
ya
Ma
liB
os
nia
-He
rze
go
vin
aL
es
oth
oL
ibe
ria
Me
xic
oA
fgh
an
ista
nT
an
zan
iaE
sto
nia
Ira
qM
oza
mb
iqu
eS
lov
en
iaM
au
rita
nia
Alb
an
iaS
ou
th K
ore
aM
old
ov
aK
uw
ait
El
Sa
lva
do
rIs
rae
lO
ma
nA
rme
nia
Ch
ina
Ha
iti
Mo
ng
oli
aS
ao
To
me
& P
rin
cip
eB
ah
rain
Ye
me
nD
om
inic
aK
irib
ati
Nig
eri
aU
kra
ine
Arg
en
tin
aB
arb
ad
os
Bru
ne
iC
an
ad
aC
os
ta R
ica
De
nm
ark
Gre
na
da
Ice
lan
dJ
ap
an
Lib
ya
Ma
ldiv
es
Ma
uri
tiu
sN
eth
erl
an
ds
No
rth
Ko
rea
Ph
ilip
pin
es
Sa
ud
i A
rab
iaS
t. K
itts
& N
ev
isS
we
de
nT
og
oU
nit
ed
Sta
tes
Bo
liv
iaJ
ord
an
An
go
laT
un
isia
Ira
nB
ots
wa
na
Pa
kis
tan
To
ng
aG
ab
on
Uzb
ek
ista
nZ
imb
ab
we
Ru
ss
iaN
ep
al
Russia

© ИЭА54
The G8, world leaders by speed of political freedom The G8, world leaders by speed of political freedom destruction,destruction, 1991−2005 1991−2005 ::
RankRank CountryCountryChange in Change in
PF IndexPF Index11 NepalNepal -4,29-4,29
22 BelarusBelarus -4,00-4,00
33 TajikistanTajikistan -3,86-3,86
44 RussiaRussia -3,64-3,64
5 5 GambiaGambia -3,57-3,57
66 VenezuelaVenezuela -2,86-2,86
77 ZimbabweZimbabwe -2,86-2,86
88 Solomon IslandsSolomon Islands -2,86-2,86

© ИЭА55
««Zimbabwean diseaseZimbabwean disease». ». Political Freedom in Zimbabwe and RussiaPolitical Freedom in Zimbabwe and Russia, 199, 19911−2005−2005
Free
Not Free
Russia
Zimbabwe2
3
4
5
6
7
8
1991 1992 1993 1994 1995 1996 1997 1998 1999 2000 2001 2002 2003 2004 2005

© ИЭА56
Some conclusions: Institutions matter.Institutions matter. For faster economic growth are conducive following political For faster economic growth are conducive following political
institutions: parliamentary rather than presidential form of government, institutions: parliamentary rather than presidential form of government, German/Scandinavian law system rather than French one, political German/Scandinavian law system rather than French one, political competition rather than political monopolization, federalism rather than competition rather than political monopolization, federalism rather than centralization of government, political and civil freedoms, larger number centralization of government, political and civil freedoms, larger number of “veto players” in the political system. of “veto players” in the political system.
In the long-run “Strong”, or “Decisive” political system is less effective In the long-run “Strong”, or “Decisive” political system is less effective than “Weak”, or “Resolute/Legitimate” one.than “Weak”, or “Resolute/Legitimate” one.
There is such thing as an Optimal Political System.There is such thing as an Optimal Political System. Political institutions are subject to evolution.Political institutions are subject to evolution. Optimal political system can be achieved through natural evolution and Optimal political system can be achieved through natural evolution and
efforts from within society as well as from outside. efforts from within society as well as from outside. Through their financial assistance international donors can substantially Through their financial assistance international donors can substantially
hinder positive evolution of political institutions and economic growth of hinder positive evolution of political institutions and economic growth of a recipient country. a recipient country.
Effective destruction of political institutions and economic growth goes Effective destruction of political institutions and economic growth goes through non-market inflow and non-market (government) distribution of through non-market inflow and non-market (government) distribution of economic resources.economic resources.

© ИЭА57
And finally:And finally:
“Democracy is the worst form of government “Democracy is the worst form of government except all those others that have been tried from except all those others that have been tried from time to time”. time to time”.
W. Churchill.W. Churchill.