political institutions and human development
TRANSCRIPT

Policy ReseaRch WoRking PaPeR 4818
Political Institutions and Human Development
Does Democracy Fulfill its 'Constructive' and 'Instrumental' Role?
Sebastian VollmerMaria Ziegler
The World BankDevelopment Research GroupMacroeconomics and Growth TeamJanuary 2009
WPS4818

Produced by the Research Support Team
Abstract
The Policy Research Working Paper Series disseminates the findings of work in progress to encourage the exchange of ideas about development issues. An objective of the series is to get the findings out quickly, even if the presentations are less than fully polished. The papers carry the names of the authors and should be cited accordingly. The findings, interpretations, and conclusions expressed in this paper are entirely those of the authors. They do not necessarily represent the views of the International Bank for Reconstruction and Development/World Bank and its affiliated organizations, or those of the Executive Directors of the World Bank or the governments they represent.
Policy ReseaRch WoRking PaPeR 4818
Institutions are a major field of interest in the study of development processes. The authors contribute to this discussion concentrating our research on political institutions and their effect on the non-income dimensions of human development. First, they elaborate a theoretical argument why and under what conditions democracies compared to autocratic political systems might perform better with regards to the provision of public goods. Due to higher redistributive concerns matched to the needs of the population democracies should show a higher level of human development.
This paper—a product of the Growth and the Macroeconomics Team, Development Research Group—is part of a larger effort in the department to understand the contribution of institutions to human welfare and economic growth. Policy Research Working Papers are also posted on the Web at http://econ.worldbank.org. The authors may be contacted at [email protected] and [email protected].
In the following they analyze whether our theoretical expectations are supported by empirical facts. The authors perform a static panel analysis over the period of 1970 to 2003. The model confirms that living in a democratic system positively affects human development measured by life expectancy and literacy rates even controlling for GDP. By analyzing interaction effects they find that the performance of democracy is rather independent of the circumstances. However, democracy leads to more redistribution in favor of health provision in more unequal societies.

Political Institutions and Human DevelopmentDoes Democracy Fulfill its ’Constructive’ and ’Instrumental’ Role?
Sebastian Vollmer∗
Maria Ziegler†
This draft: January 2009
Abstract
Institutions are a major field of interest in the study of development processes. Wecontribute to this discussion concentrating our research on political institutionsand their effect on the non-income dimensions of human development. First, weelaborate a theoretical argument why and under what conditions democraciescompared to autocratic political systems might perform better with regards tothe provision of public goods. Due to higher redistributive concerns matchedto the needs of the population democracies should show a higher level of humandevelopment. In the following we analyze whether our theoretical expectations aresupported by empirical facts. We perform a static panel analysis over the periodof 1970 to 2003. The model confirms that living in a democratic system positivelyaffects human development measured by life expectancy and literacy rates evencontrolling for GDP. By analyzing interaction effects we find that the performanceof democracy is rather independent of the circumstances. However, democracyleads to more redistribution in favor of health provision in more unequal societies.
JEL classification: I10, I20, H11Keywords: human development, democracy, political institutions, life expectancy,literacy, panel analysis.
Acknowledgements The authors would like to thank participants of the AmericanEconomic Association’s annual conference 2009 in San Francisco, Stephan Klasen, MarkDincecco, Dierk Herzer, Tatyana Krivobokova, Inmaculada Martınez-Zarzoso, StefanSperlich, Walter Zucchini, and participants of the International Economic Association’sconference 2008 in Istanbul for their helpful comments. Maria Ziegler acknowledgesfinancial support from the German National Merit Foundation.
∗University of Gottingen, Platz der Gottinger Sieben 3, 37073 Gottingen. Phone: +49551398171,Fax: +49551397302, Email: [email protected].†University of Gottingen, Platz der Gottinger Sieben 3, 37073 Gottingen. Phone: +49551397242,Fax: +49551397302, Email: [email protected].
1

1 Introduction
Since Sen (1983, 1988, 1991, 1999, 2000, 2003 etc.) we are aware that development
is a very encompassing and broad concept. Development as a whole depends on each
individual’s capabilities. Capabilities define the freedoms to choose a valuable life in
accordance with individual preferences. This approach inspired the emergence of the
pluralist and integrative conception of ”human development” and the operationalization
in form of UNDP’s Human Development Index. It is not only income but also health
and education that enable people to shape their life in line with their desires. The aim
of this paper is to discuss the contribution that can be made by political institutions
to enhance human development.
Political institutions are an appealing topic of research as they organize social, eco-
nomic and political life. Hence, it is not surprising to ask what kinds of institutions do
this job best. From an ideological perspective democracy seems to be the right political
system because at the end of the day the people are politically free and those who de-
cide. Therefore democracy is also considered as an end of the development process and
a piece of the puzzle of the more comprehensive picture of human development (Sen
1999a: 147-159, Sen 1999b, Sen 2000: 23). But whether democracy1 has a positive
impact on economic and human development is not a trivial question - neither from a
theoretical nor from an empirical perspective. For this reason, it is worth to ask this
question. Moreover, it seems to be a necessary question in the light of a, besides reli-
gious cleavages, world-wide separation into democracies and autocracies and observable
autocratization tendencies.
1 Democracy is conceived as a political system whose structures and procedures permit the ruleof the people. Of importance are free and repeated elections, political competition, rule of law,political and civil liberties. These component parts frame public debate and deliberation thatdeal with the management of society.
1

Regarding theory, three major debates circle around the instrumental value of
democracy for economic development:
First, there is the controversy about the contradictory effects of property rights pro-
tection and redistribution in a democracy on growth and well-being. There might be a
trade-off between growth-enhancing property rights protection and equalizing, market-
correcting redistribution. On the one hand, property rights protection is a necessary
condition for an increase in the overall wealth of a nation (Acemoglu/Johnson/Robinson
2001, 2002). But whether all can benefit depends on redistribution as well. On the other
hand, one can think of the probably adverse effects of redistribution on the savings rate,
growth and the labour market and the related effects on the overall living standard of
the population including non-income human development. Moreover, in democracy
corporatism may lead to lock-in effects and decreasing reform capacity. This together
with the fact that elites in democracies tend to produce inefficient policies supports
positions like the Lee-Hypothesis2. These positions state that autocratic regimes are
the more efficient systems to tackle market failures, stimulate economic growth and as
a consequence improve human development (Alesina/Rodrik 1994, Barro 1996, Ace-
moglu/Robinson 2008).
A second debate relates to causation. The causal direction is not clear: Is democ-
racy cause or consequence of the development process? Third and linked to this second
point are discussions that focus on factors that impede or foster democratic system to
work well. It is not obvious under what conditions democracies will display a positive
effect - if they are supposed to have one. Candidates of these enhancing or imped-
ing factors are the level of economic development itself, inequality, country-specific
and historical factors, education and social fragmentation (Lipset 1959, Barro 1999,
Alesina/Baqir/Easterly 1999, Bourguignon/Verdier 2000, Acemoglu/Johnson/Robinson
2 The hypothesis that authoritarian rule is beneficial to economic growth is named after the formerpresident of Singapore Lee Kuan Yew (Sen 1999b: 5).
2

2005, Alesina/Ferrara 2005, Acemoglu/Robinson/Yared 2007, Acemoglu/Johnson/Robinson/
Yared 2008, Acemoglu/Robinson 2008, Miguel/Gugerty 2005, Keefer/Khemani 2005,
Collier 2001: 137).
Empirical research studies give no clear answer. Persson and Tabellini (2006) and Ro-
drik and Wacziarg (2005) show that for the case of economic growth the efficiency
argument in favour of autocratic regimes does not withstand empirical investigations.
Others, on the contrary, find a moderately negative or nonlinear relationship between
democracy and growth (Barro 1996, Tavares/Wacziarg 2001, Minier 1998). When stud-
ies center on redistribution, i.e. the effect of political systems on income inequality or on
the provision of public goods and the size of the public sector, results are less ambiguous
(Boix 2001, Gradstein/Milanovic 2004, Persson 2002, Stasavage 2005, Persson/Roland/
Tabellini 2000). In general, they support the view that redistribution might be higher
under a democratic regime. But if this is the case, the question still remains whether
this redistribution is beneficial to economic and non-income human development.
For the non-income dimensions of human development there again is uncertainty
about the effects of democracy. There are only a very few studies empirically investi-
gating the links between political systems and measures for the non-income dimensions
of human development. Whereas some find a positive relationship between democracy
and human development (Besley/Kudamatsu 2006, Franco/Alvarez-Dardet/Ruiz 2004,
Tsai 2006), others find less evidence for this influence (Ross 2006). These research
efforts are either confined to the subsample of developing countries (Tsai 2006), to only
one of the non-income dimensions of human development (Besley/Kudamatsu 2006,
Franco/ Alvarez-Dardet/Ruiz 2004, Ross 2006) or to a cross-sectional focus leaving
out developments over time (Tsai 2006, Franco/Alvarez-Dardet/Ruiz 2004). Moreover,
the investigations, while having in mind potential conditions influencing democracy’s
performance, only include these requisites as simple controls in their regression models
3

and not interacted with some institutional measure.
Our paper does not claim to answer all these questions, theoretically and empirically.
What we want to do is to extend the latter strand of research in the following ways:
First, we theoretically discuss why we believe democracy has a positive impact on
human development. Linked to this is the question whether democracies besides their
intrinsic importance for the developmental process fulfill a constructive and instrumen-
tal role giving people the opportunity to express, to form and aggregate their preferences
and thus to steer public action in an efficient and effective manner (Sen 1999: 157). Par-
ticularly, we base our argumentation on the redistributive side including public goods
provision and not the property rights side of democracy. We argue that with respect to
the quantitative as well as the qualitative dimension of redistribution and public goods
provision democracy performs better than an otherwise equal autocracy; thereby we
rely on implications of the median voter theory and arguments made by Sen. Although
redistribution often is seen as a disturbing factor leading to inefficiencies we want to
clarify why it is redistribution in democracies that makes a difference in non-income
human development outcomes compared to autocratic regimes. We also empirically try
to find evidence on whether living in a democratic or autocratic political system makes
a difference for the level of education and health that we take as proxies for non-income
human development, keeping in mind that questions of causality are hard to tackle.
Second, we theoretically identify and empirically investigate the prerequisites for
the functioning of democracy with respect to the provision of public goods and services
that foster human development.3 This allows us to account for heterogeneity in human
development over democratic regimes.
Third, we include the time dimension of the data and all countries on that data is
available into our empirical analysis to fully exploit all the information which is available
3 Consequently, we do not try to explain democratization but the dependence of democracy’s per-formance upon other factors once it is in place.
4

in the data.
In the next section 2, we want to clarify why redistribution is the major angle in
investigating the relationship between political institutions and human development.
Furthermore, we point out why there should be quantitatively more and qualitatively
better redistribution in democracies. Then we discuss why this might only be true if
certain other factors are present like a certain level of education, economic development,
inequality or unity in the people. In section 3 we examine whether there is empirical
evidence for this relationship. First, we estimate the distribution of life expectancy and
literacy for selected years. Second, we perform a panel analysis of a more sophisticated
model including interaction effects between democracy and the main determinants of
its functioning.
Our results indicate that democracy is good for human development even control-
ling for the level of economic development. But, except from inequality, democracy’s
performance - in terms of an improvement in human development -, contrary to the-
oretical reasoning seems not to depend on the other factors that are highlighted by
the literature. It is democracy itself - rather independent from the circumstances -
which has a positive effect on human development. While this result is encouraging for
low-income democracies, it also leaves some questions for future research.
2 The Political Economy of Democracy and Human
Development
The following remarks serve to clarify the relationship between political institutions
and human development. Recurrence on institutionalist theories provides a link from
political institutions to the living standard of the population. This link is given, fore-
most, by the redistributive policies institutional system produces. The median voter
5

theory predicts that democratic systems are characterized by a higher level of redistri-
bution than autocracies. Consequently, the median voter theory gives insights into the
quantitative dimension of redistribution. Arguments made by Amartya Sen capture
the qualitative part of redistribution and permit to extend the median voter theory by
stating that democratic institutions make redistribution more responsive to the needs
of the society, i.e. that redistribution translates into a public spending for transfers,
goods and services that increase the wealth of the society. To complete our theoreti-
cal discussion we address the issue that the fulfillment of the predictions made by the
median voter theory and Sen depends on several requisites that influence democracy’s
performance.
2.1 How can political institutions influence human develop-
ment?
Institutions attract a lot of attention in the mostly, interdisciplinary study of the dif-
ferences in the wealth of nations. Questions range from institutional effects on the
one-dimensional perspective of economic development to the multidimensional one of
human development. However, there still seems to be a bias towards the economic side
of the coin (Knack/Keefer 1995, Hall/Jones 1999, Acemoglu/Johnson/Robinson 2001,
Acemoglu/Johnson/Robinson 2002, La Porta et al. 2004).4 This reflects the probably
justified preference for the economy as the major driver of the development process and
the resulting focus on the property rights angle of institutions. We, on the contrary,
want to complete this picture and center on the redistributive side of institutions and
the non-monetary components of human development.
With regards to institutions, the existing literature leaves the impression that there
4 A famous controversy in this context is the Geography vs. Institutions debate in the explanationand prediction of economic development.
6
is not enough precision about the term ”institution” itself. There is a big use of per-
formance indicators measuring how certain institutional systems function, e.g. when it
comes to political stability or governance issues (Gradstein/Milanovic 2004: 516).5 Such
performance indicators then are often mixed up with public policies. But, the perfor-
mance and the policies together are the outputs of underlying structures and procedures
as well as contextual factors. These underlying (formal) structures and procedures can
be subsumed under the heading political system. This is what we understand under
political institutions.
According to the rational choice strand of the new institutionalism in political sci-
ence or the field of new institutional economics and political economy, political institu-
tions are the rules which govern the political game (e.g. Peters 1999, Hall/Taylor 1996,
Persson/Tabellini 2000). They not only determine via electoral rules which actors and
preferences can access the political arena and get heard. They also provide the means
to aggregate those preferences by establishing procedures for decision-making and dis-
tributing political power, i.e. the right to decide (Persson 2002: 886). The common
output of institutions and preferences are policies. Although actors and other environ-
mental constellations may change over time, policies in general will reflect the political
institutions that produced them (Persson/Tabellini 2006: 321, Peters 1999). We dis-
tinguish between two types of policies that may be favorable to human development:
policies for the protection of property rights and policies for redistribution. Policies
for the protection of property rights encourage economic investment and contribute to
economic development and economic growth (e.g. Acemoglu/Johnson/Robinson 2002).
Growth is assumed, under certain conditions, to increase the welfare of the population
by reducing poverty (Klasen 2004). Policies for redistribution have an equalizing impact
on the distribution of wealth in a society. Especially through broad-based programs
5 See for example the Worldwide Governance Indicators (Kaufmann/Krayy/Mastruzzi 2007).
7

and the provision of public goods and services, market failures shall be compensated
and normative, social optima be arrived. The matching of society’s and individual
needs with an adequate redistribution scheme and an appropriate public provision of
goods and services provides a more direct link between political institutions and hu-
man development than property rights protection. Of course, one might argue as it is
already mentioned in the introduction, that there might be a trade-off between growth-
enhancing property rights protection and equalizing, market-correcting redistribution.
Nevertheless, the focus of this paper will be on policies with redistributing character
which aim at better health and education for the population as a whole and especially
for those groups - the poor - having otherwise disadvantaged access to these goods as
they are not sufficiently provided by markets. If we assume that via these channels
policies affect the level of human development, if we especially focus on redistributive
policies and moreover, if policies mirror the political system in which society is steered
according to certain political decisions, then the following question emerges: What po-
litical systems are more appropriate to produce market-correcting redistributive policies
that likewise match the needs of the society and therefore advance human development?
The answer is democracy. Democracy is conceived as a political system whose structures
and procedures permit the rule of the people. Of importance are free and repeated elec-
tions, political competition, rule of law, political and civil liberties. These component
parts frame public debate and deliberation that deal with the management of society.
Carrying forward our reasoning, democratic political systems are assumed to be the
most appropriate systems to ensure a redistribution that fulfils societal demands.6 Al-
though redistribution from the rich to the poor and vice versa exists in both autocratic
and democratic systems, the following theoretical arguments make us believe that re-
6 Democracies are considered to perform best on both dimensions: property rights protection andredistribution. Whether the one or the other is more important depends on people’s preferencesand the formal and informal face of the considered democracy.
8
distribution from the rich to the poor is more pronounced and at a higher level in
democracies.7 One of the most famous theoretical arguments is the model of Meltzer
and Richard (1981). The median-voter hypothesis states that in democratic govern-
ments the median voter is the decisive voter. The more his income falls short of the
average income of all voters, the higher the tax rate, i.e. redistribution he will decide.
Therefore government spending should be larger and social services more extensive in
democratic regimes - if the majority of the voting public lives at the bottom of the
income distribution and only a small part enjoys richness (Keefer/Khemani 2005: 2).
In contrast, in authoritarian systems the distribution of wealth does not play a decisive
role. All or a substantial part of the electorate is excluded from the decision-making
process, and this precisely to avoid the redistributive consequences of democracy. As a
result the size of the public sector on average remains small (Boix 2001: 2), although
there might be examples of autocracies with relatively large public sectors such as Cuba
and Venezuela. As mentioned later, autocrats implement redistributive policies not be-
cause of institutional structures but either due to ideological reasons and/or only to
the level that serves them to remain in power and to increase their own wealth.
The fact that there is more redistribution in democratic regimes does not mean that
the redistribution is aligned with societal demands. That means voting alone does not
help to solve the aggregation problem resulting from different individual preferences.
Thus, a second question relating to the qualitative dimension of redistribution emerges:
Why are democratic governments compared to autocratic ones more responsive to the
needs of the citizenry? Talking with Sen (1999a: 157, 1999b), democracy - behind its
”intrinsic” value - is of eminent importance for the process of development because of
the ”constructive” and ”instrumental” role it plays in the formation and aggregation of
values, needs and preferences and their translation into well-designed policies benefit-
7 See for example Gradstein and Milanovic (2004) for an empirical study finding evidence for thislinkage.
9
ing the society. Political and civil liberties - for example those relating to free speech,
public debate and criticism, as constituent parts of a democratic regime - permit the
formation of preferences and values as well as access to the relevant information. Con-
sequently a better understanding of societal needs is possible. Democratic procedures
then facilitate the transmission of these needs into the political arena where decision
power is distributed amongst legitimate representatives of the society as a whole. The
latter means that otherwise disadvantaged groups, whether they are minorities or only
a broad mass of poor people in a developing country, get a voice and the opportunity
to be heard and represented. In cases of direct democracy or democracy at the local
level they even decide themselves.
But, in the ”pursuit of political objectivity” and through the facilitation of ”pub-
lic reasoning”, democracy not only helps to construct policies that are matched to the
needs of the citizens (Sen 2004: 9). It is also instrumental and protective because control
mechanisms like free and repeated, competitive elections and the compliance with the
rule of law principle reduce discretionary and corrupt behavior of those representatives
who hold political power. Democracy provides the incentives to create responsibility
and accountability that induce political-administrative leaders to listen and to act on
behalf of the society they represent (Sen 1999a: 147ff., Sen 1999b: 9f.). In an autocratic
regime the usually small, ruling elite dictates the will of the people from above. This is
frequently accompanied by the repression of the political opposition and the prohibition
of free expression and opinion impeding the conceptualization of the volonte generale.
The state apparatus is (mis-)used in favor of the welfare of the ruling elite. Political
measures with redistributing character increasing the welfare of the bottom quintile of
society are only implemented if they assure political power to the autocratic leaders
and/or increase their welfare (Olson 1993, McGuire/Olson 1996). Responsiveness, rep-
resentation, accountability and the selection of competent political and administrative
10
staff thus are uncommon in autocratic regimes (Besley/Kudamatsu 2006:313f.). Sum-
marizing, whereas democracies quantitatively and qualitatively perform better than
autocracies in terms of redistribution that in our terminology encompasses the public
provision of goods and services, there is no clear relation between inequality and soci-
etal needs on the one hand and redistribution on the other in autocracies. In general
this leads to a lower level of human development in autocratic systems.
2.2 What determines public service provision especially in
democracies?
The formal existence of democracy does not guarantee that it functions in the ideal-
ized manner described above. Democratic regimes might display a lot of heterogeneity
concerning the benefits for human development. This is the case when certain fac-
tors impede or enable that the relationships predicted by the median voter theory or
Sen’s theory can be observed. These factors then hamper or foster the performance
of democracy with regards to the satisfaction of societal needs. Problems could arise
if for certain reasons - located either at the agenda setting, the policy formulation,
the implementation or evaluation phase - the allocation of public expenditures is ineffi-
cient.8 What are the reasons for an ineffective allocation of public resources especially
in democracies? Or more general, what are those factors that change the operation of
a democratic regime either in a positive or in a negative direction?
Our approach to explain heterogeneity in democracies’ performance follows the one
from Keefer and Khemani (2005) and hence differs from other studies that focus on the
pre-conditions for democracy or democratization (e.g. Lipset 1959, Glaeser/Ponzetto/
Shleifer 2007). We do not consider the question whether a country has to be prepared
8 Because poor people are highly dependent on public action as they cannot invest their own(nonexistent) private resources, they suffer the most from ineffective government in terms ofredistribution and service provision (Keefer/Khemani 2005: 1).
11

for democracy or whether it is democracy which lifts the country up to a certain level
of development.9 Following our theoretical reasoning, the necessary timing of the pres-
ence of the respective factors is treated here as simultaneous. Their interaction with
democracy at one point in time influences the output, the policies in form of public
goods’ provision, and the outcome, the level of human development.
First, as redistribution and the provision of public goods depends upon the fact
whether there is something to redistribute and to invest in public goods the performance
of democratic system will be the better the higher the level of economic development.
So the positive effect of democracies on public goods provision will be intensifed by the
level of economic development.
Second, imperfect information of the citizens may lead to insufficient participation
that is necessary for public reasoning and ’qualified’ needs’ expression. As a result
the quality of responsive government manifesting itself in policies that reflect society’s
demands and needs decreases. Moreover, accountability suffers from information con-
straints because voters cannot control politicians’ behavior. Education10 is one of the
important factors11 having the potential to alleviate the information problem. Educa-
tion in this context is not taken as an intrinsic component of human development that
we want to explain, but as a means to human development. It is not only in itself a
9 In contrast to Sen (1999: 4) we do not follow his statement ”A country does not have to be deemedfit for democracy; rather, it has to become fit through democracy.” It is certainly a question ofpoint of view to answer this question in the one or the other direction.
10 We leave out cultural factors here because they are hard to measure. Inglehart and Welzel (2005)emphasize people’s values as equally important as socioeconomic resources and civil and politicalrights. According to them, culture provides the link between economic development and demo-cratic freedom. Without certain values like ”human autonomy” or ”self-expression values”, foster-ing a priority on self-made choices human development might not be possible (Inglehart/Welzel2005: 286f). Moreover such values are dependent upon a certain level of socioeconomic develop-ment. We assume, although this is to be questioned, that the more education people have themore enlightened they are and the more freedom they demand to live the life they value.
11 Other factors might be a well developed media sector and accountable and institutionalized partiesthat overtake political education tasks (see Keefer/Khemani 2005: 5-9). But it can easily beargued that without education a media sector will not develop because of missing demand (forthe role of the media see Besley and Burgess (2002)). The same is supposed to hold for theinstitutionalization of parties and the accountability issues.
12

precondition for a higher living standard because it positively affects earnings, health
and so on. It is also found to be a requirement for democracies to develop and to per-
sist. Moreover one can suppose that education leading to conscientious participation
raises the quality of democracy. The latter may come to the fore in a more efficient
and effective provision of public goods (Lipset 1959, Glaeser/Ponzetto/Shleifer 2007,
Keefer/Khemani 2005: 5-9).
Social fragmentation can be another factor disturbing the functioning of a demo-
cratic system measured by the public goods it provides. Research has found that
social fragmentation or more concretely ethnic diversity leads to collective action prob-
lems, increased patronage as well as clientelism and in the end to an under-provision
of public goods (Alesina/Baqir/Easterly 1999, Alesina/Ferrara 2005, Miguel/Gugerty
2005). For democratic systems social fragmentation may pose problems because mech-
anisms to hold the government accountable and responsible are undermined. In socially
heterogeneous settings, governments are rewarded on basis of identity and not govern-
mental performance (Keefer/Khemani 2005: 10). Moreover social fragmentation leads
to political fragmentation that from a certain threshold value can result in increasing
co-operation problems (Collier 2001: 137).
The last factor that is the one in line with the quantity-redistribution argument is
income inequality characterized by a distribution of income where the median income is
a lot smaller than the average income.12 Hence, the majority of people live at the lower
bound of the distribution whereas only a few benefit from being rich. The reasoning
behind the effects of inequality on human development can be twofold. First, such in-
come inequality can induce inequalities in human development because in more unequal
societies more people cannot afford to live a healthy life and to spend on education.
12 The argument, that the median voter is farther away from the mean when a society is moreunequal, is true for right-skewed distributions. This is usually the case for the national incomedistributions, which are quite close to log-normal distributions.
13

This effect should even be higher in autocracies where service provision according to our
argumentation does not function well. Democratic political systems should compensate
the negative effect of income inequality. The higher the income inequality is the larger
is the distance of the median voter’s income to the average income. Following the me-
dian voter hypothesis, more redistribution will be demanded. Thus, with higher income
inequality the redistribution effect of democracy increases. Public service provision will
be at a higher level that may result in better human development outcomes.
2.3 Summary and Working Hypotheses
Summarizing the theoretical arguments above, democratic regimes in comparison to
autocratic ones are expected to lead to higher redistribution and thus higher public
expenditures. Additionally, public spending priorities in democracies reflect the needs of
the society more than in autocracies. Execution of public budgets will be in those sectors
where public demand is most obvious. Moreover, democratic control mechanisms will
assure the implementation of policies so that a high degree of compliance with laws,
directives and orders is reached. Hence, public action can translate into the wished
human development outcomes, for example a better health status of the population
or a lower illiteracy rate. But the performance of democracies will vary according
to the specific circumstances. We assume that the level of income, education, social
fragmentation and the level of income inequality affect the level of the provision of
public goods and human development in a democratic system. Therefore the following
general hypotheses can be derived:
a) Democratic political systems will yield better results in human development than
autocracies and this independently from the level of economic development.
b) The positive effect of democracies on public goods provision will be intensified by
14
the level of economic development. When there is nothing to redistribute, public
goods provision will be disturbed.
c) Education has a positive effect on the performance of democracy. Therefore the
positive effect of democracy on human development will be higher the higher the
level of education in a society.
d) Social fragmentation lowers the positive impact of democracies on human devel-
opment. The more socially diverse a country is the more difficult it is to provide
broad-based services even in democracies.
e) The redistribution effect of democracy compensates the negative effect of income
inequality on human development. Furthermore, the higher the level of inequality
and the more right skewed the distribution of income is, the bigger is the positive
effect of democracy on human development.
3 Empirical Links between Democracy and Human
Development
Does our theoretical argumentation withstand empirical evidence? In the next para-
graphs, we present the data and variables we use as well as our empirical analysis.
We rely on descriptive statistics like kernel density estimates and a more sophisticated
panel analysis.
3.1 Empirical Implementation
To quantify human development we focus on the non-income components of UNDP’s
Human Development Index and consequently use UNDP’s data on life expectancy and
15

literacy. Life expectancy is measured in years and literacy is an index value ranging
from 0 to 100. We choose education and health as both are direct determinants of
capabilities and influence the freedom to choose the kind of life one likes. Education
as well as health raises productivity and the ability to convert income and resources
into the favored way of life (Sen 2003: 55). The third dimension of human develop-
ment, namely income, is not of interest for this paper, since there is much work on the
relation between democracy and economic development already available. Our data
on political institutions, especially democracy comes from the Polity IV Project of the
Center for International Development and Conflict Management at the University of
Maryland. This dataset includes the Polity2 score ranging from 10 (highly democratic)
to -10 (highly autocratic), while a zero score indicates a state between autocracy and
democracy which we consider as not democratic.13 Following Besley and Kudamatsu
(2006) we calculate the fraction of democratic years over the past five years as our mea-
sure for democracy. The consideration of a period of five years captures the effect of
democratic experience and reduces the uncertainty concerning the length of the delay
until a change in the political system affects human development.
Other variables that we expect to have an impact on human development or that
describe possible conditions under which democracy affects human development are the
following: GDP per capita PPP in constant prices14 from the Penn World Tables 6.2;
Gini coefficients15 from the WIDER dataset with improvements in terms of compara-
13 According to the Polity2 measure, a system can be classified as democratic if three interdependentelements exists: 1) competitiveness of participation, institutions and procedures allow citizens toexpress their political preferences; 2) openness and competitiveness of executive recruitment andconstraints on the chief executive, so that the executive power is institutionally constraint; 3)civil liberties. The last element as well as rule of law, system of checks and balances, freedom ofthe press etc. is not coded in the index as the latter are performance indicators of democraticregimes. Autocracies are defined vice versa. For more details see Marshall and Jaggers (2005:13f.).
14 US$, base year: 2000.15 Gini coefficients are not available for every year. We therefore use a simple moving average
between available observations to complete the dataset.
16

bility across countries and across time by Grun and Klasen (2008); a measure of ethnic
fractionalization16 as proxy for social fragmentation from Alesina et al. (2003) which
is constant over time17. Since education is also a factor influencing the performance of
democracy, literacy rates are also used as an explanatory variable in our panel analy-
sis for life expectancy. As control variables we consider as most important whether a
country experienced some conflict in the period under observation and whether the pop-
ulation suffers from HIV/AIDS. To measure war we take data from the UCDP/PRIO
intrastate conflict onset dataset, 1946-2006. We choose the variable warinci2 that mea-
sures the incidence of intrastate war and is coded 1 in all country years with at least
one active war.18 For HIV/AIDS we take HIV/AIDS adult infections prevalence rates
estimated by UNAIDS. Data coverage over time and countries leads us to the decision
to create a variable that takes the value 1 when a country has a prevalence rate over 10
per cent in the year 1999. Taking the availability of all variables as criteria, we decide
to analyze the period from 1970 to 2003, though some of the variables are available for
longer time spans.
Unfortunately, the available data on public expenditures were not sufficient for our
purposes. Such data would have enriched our analysis as we could have examined
the channels that democracy takes to affect human development. We suspect that
democracy causes different priorities in public expenditures compared to autocracies.
Therefore increases in public expenditures on health and education can be decomposed
into two components: An increase due to higher total expenditures and an increase due
16 The ethnic fractionalization measure renders the probability that two individuals selected atrandom from a population are members of different groups. It is calculated with data on languageand race using the following formula FRACj = 1 − ∑N
i=1 s2ij , where sij is the proportion of
group i = 1, . . . , N in country j going from complete homogeneity (an index of 0) to completeheterogeneity (in index of 1). For more details see Alesina et al. (2003: 159f.).
17 According to Alesina et al. (2003: 160f) the assumption of stable group shares is not a problem,as examples of changes in ethnic fractionalization are rare. At least over the time-horizon of 20to 30 years time persistence can be assumed.
18 War is defined by more than 1000 battle deaths. As intrastate wars are more frequent thaninterstate wars we decide to take the intrastate war variable.
17

to different priorities in government spending. While the first source is mainly driven
by economic growth, we expect democracy to be a main driver of the second source.
As mentioned, we were unable to gather good data for relative government spending
for the given period. Only for more recent years the Government Finance Statistics of
the IMF include sufficient information on these issues.
Neither the public expenditures’ path of causation nor the channel of private spend-
ing can be investigated here due to data restrictions. We presume that increases of
private expenditures on health or education can be decomposed into increases of in-
come and increases due to different priorities as well. There are different possible
explanations for changes in priorities: It certainly plays a crucial role how much income
remains after the satisfaction of basic requirements such as housing and nourishment.
Moreover a high level of education might foster expenditures on health and education,
and additionally the returns of health and education spending partly determine the level
of the spending. Without sufficient expenditure data, we must rely on the use of proxies
like income itself or literacy and on the theoretical argumentation that underpins our
empirical analysis.
3.2 Descriptive statistics
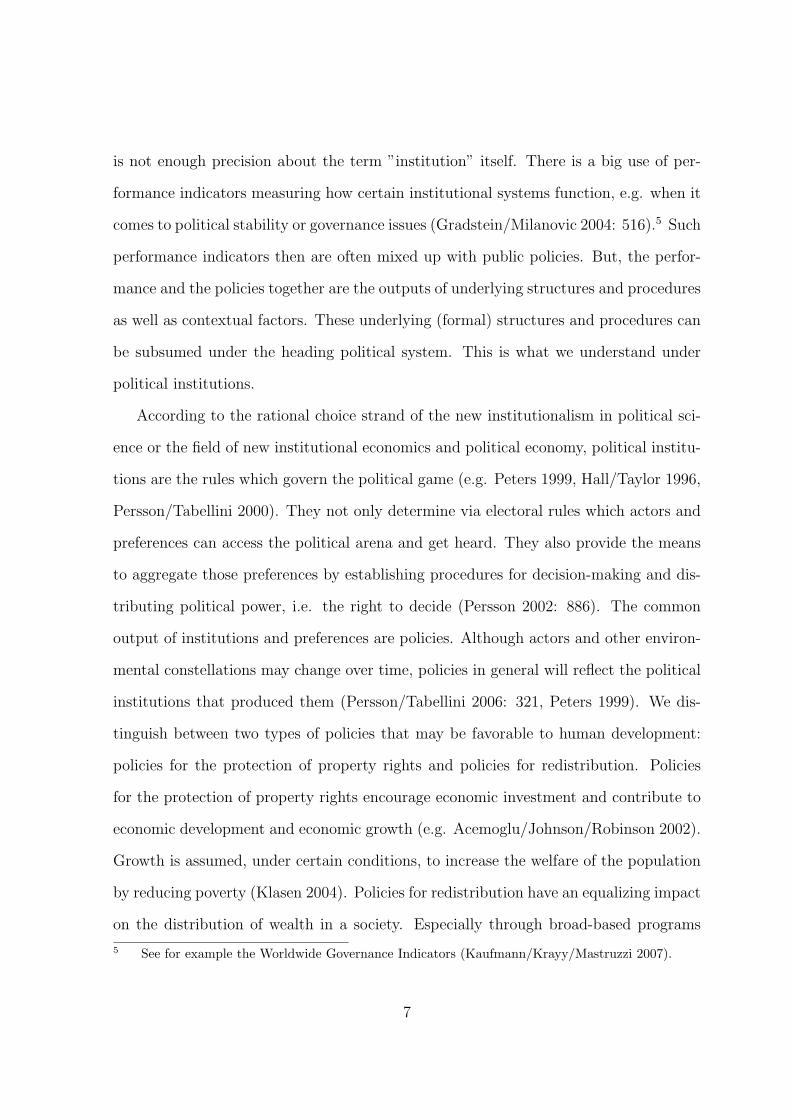
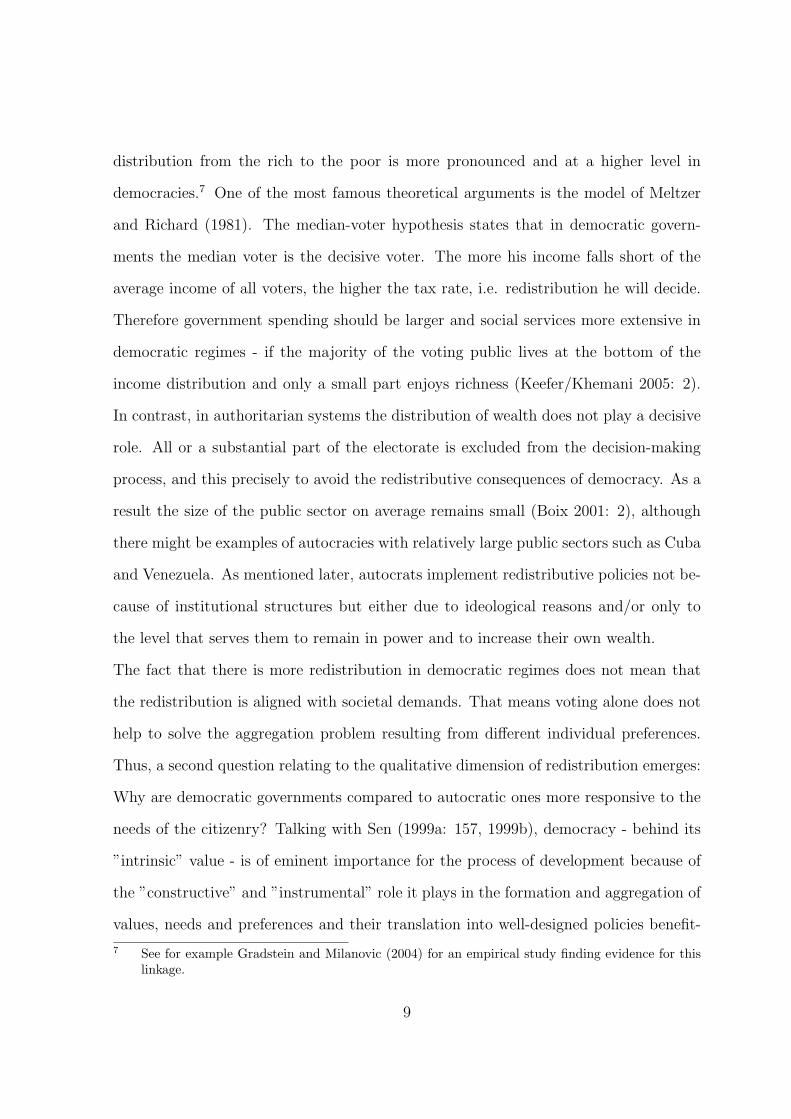
First, it is worthwhile to take a look at the densities of life expectancy and literacy
for democracies and autocracies separately (Figures 1 and 2). We use kernel density
estimators for this purpose and apply boundary corrections at 0 and 100 in the case
of the literacy rate and at the minimum and maximum values in the case of the life
expectancy. While for democracies both for life expectancy and literacy the mass of
the distribution tends to the right hand side, there seems to be a group of autocracies
with a low level and another one with a high level of life expectancy and literacy each.
The same pattern can be observed in Tables 7 to 14 in the appendix where we classified
18
countries according to three categories: low, middle and high income; autocracy and
democracy; low, middle and high life expectancy or literacy rates.19 On average we
observe that democracies have a higher life expectancy and a higher literacy rate than
autocracies. Exceptions are democracies with low life expectancies. This is mainly due
to the HIV/AIDS tragedy in big parts of Sub-Saharan Africa or to the fact that there
are no economic means to provide public goods or to redistribute in such democratic
countries. Considering the rich group of autocracies especially in 2000, it is striking
that virtually all of them are oil states. This indicates, at least to some extent, that
autocracies have problems to catch up with the top of the income distribution, as long
as they do not control a large amount of such an important resource as oil. But what
is more important for our study is the fact that although these countries show a high
level of income whether caused by natural resources or not, they display lower life
expectancies and literacy rates than their democratic counterparts.
3.3 Panel Analysis
In a simple model we try to explain life expectancy and literacy with our measure of
democracy controlling for GDP. GDP is lagged for one period to reduce the apparent
problem of endogeneity. Additionally to the measures of democracy and economic
development we include step by step the literacy rate as a proxy of the population’s
ability to articulate their needs in the political arena, to control politicians’ activities
and as a proxy of the people’s priority for private spending on education and health.
We as well lag literacy for one period to reduce endogeneity problems. We only include
education and its interaction with democracy in the model with life expectancy as
dependent variable. In line with our theoretical reasoning, we incorporate the Gini
19 To define the groups of low, middle and high life expectancy or literacy rates we computedquantiles of life expectancy and literacy. The income groups are defined according to Holzmann,Vollmer and Weisbrod (2008).
19

coefficient to measure the effect of income inequality and ethnic fractionalization as a
proxy for social fragmentation.
As pointed out all variables describe conditions, which hamper or foster the func-
tioning of democracy in terms of addressing the needs of the population. Thus, we are
interested in their interaction with democracy on the one hand. On the other hand, we
want to know whether they have an effect on human development independently from
the political system. Following Cronbach (1987)20, we center the variables used for the
modeling of the interaction terms to deal with problems of multicollinearity.
Furthermore, we add a set of dummies for global regions (leaving out Sub-Saharan
African as reference category) and year dummies to all regression. The inclusion of
period effects allows us to capture overall upward trends in literacy and life expectancy
that for example could be explained by technological improvements in the health sector
(Pritchett/Summers 1996: 846). Moreover, we control in both regression for war, be-
cause it destroys lives as well as infrastructure to provide health and education services.
Additionally we control for HIV/AIDS in the life expectancy regressions. The dummy
variable identifying the countries with high HIV/AIDS prevalence is interacted with the
time dummies because HIV/AIDS was more of a problem for the more recent years in
the sample compared to the earlier ones. The period under study is 1970 through 2003,
and instead of annual data we use five year averages of the variables. Pre-estimation
diagnostics indicate that heteroscedasticity and autocorrelation are important issues
for our dataset and cause estimation problems. We therefore find the estimation of our
model with a cross-sectional time-series FGLS regression with panel specific AR(1) to
be the most appropriate, addressing both issues simultaneously.
In case of life expectancy we run separate regressions for non-OECD countries and
the entire sample, however we will find similar results for both samples which also
20 See also Jaccard et al. (1990).
20
underpins their robustness. For literacy only the regression for the sub-sample of non-
OECD makes sense because firmly all OECD countries have a constant level of literacy
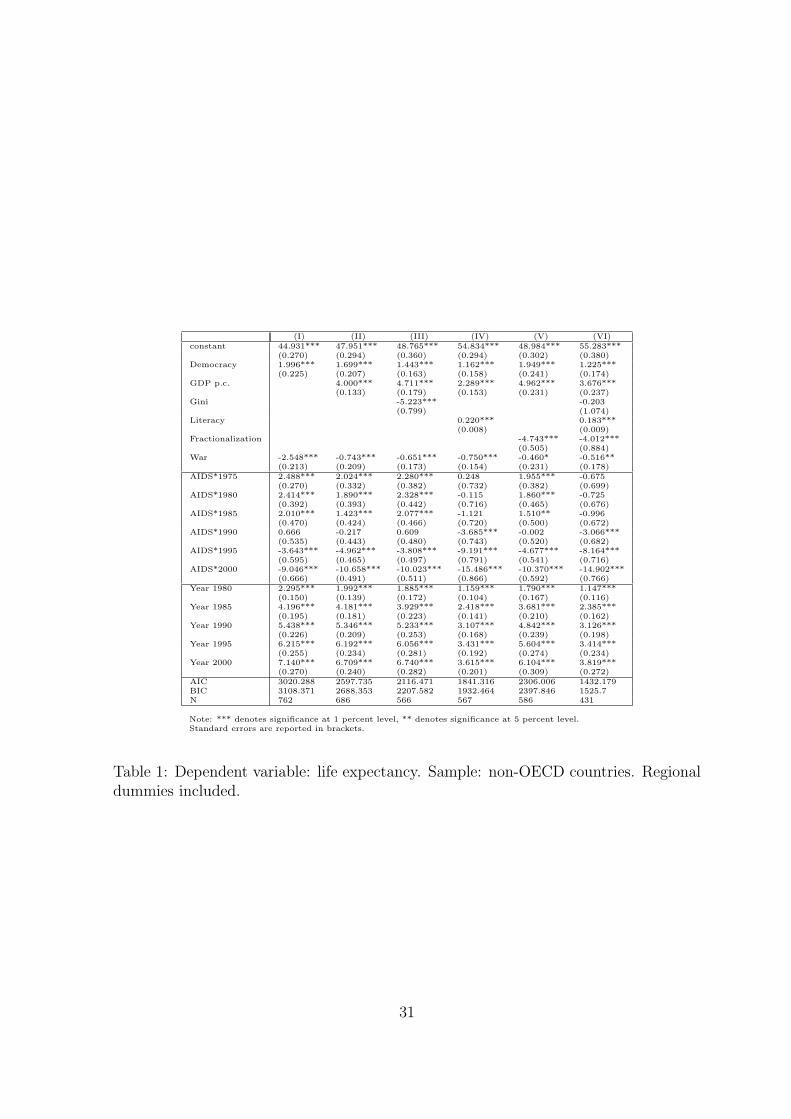
of exactly 99 percent in the UNDP data. The results are presented in Tables 1 to 6.
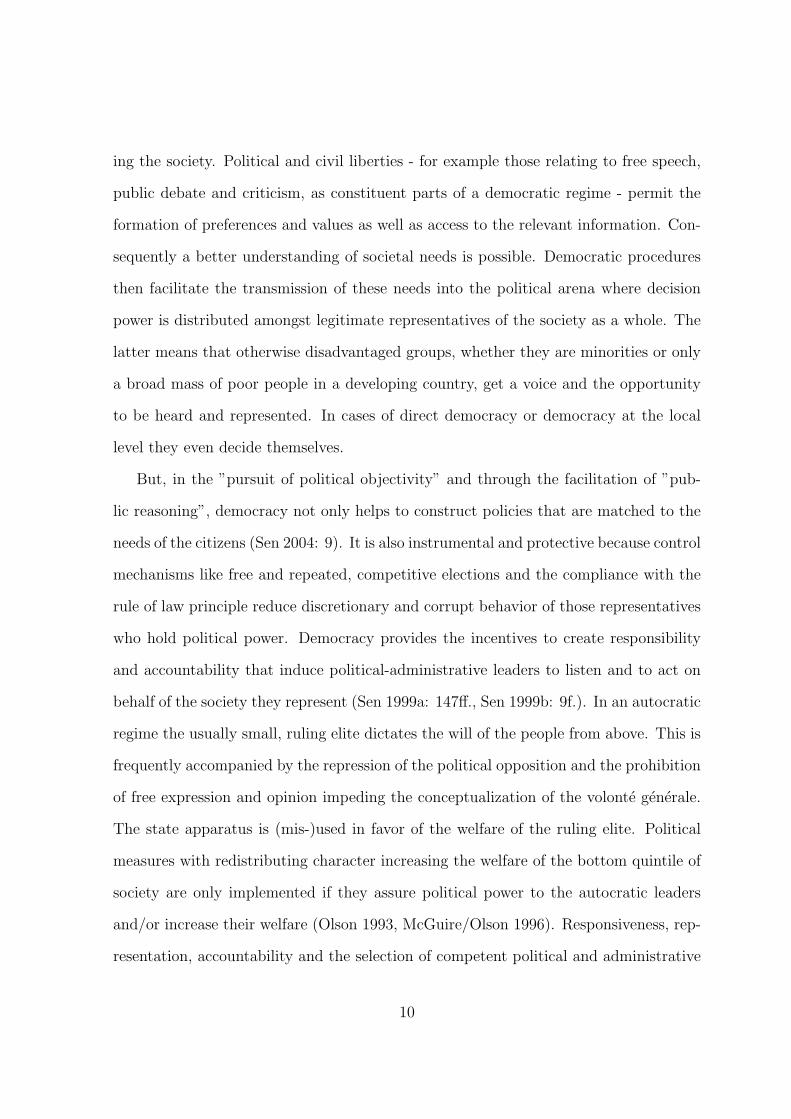
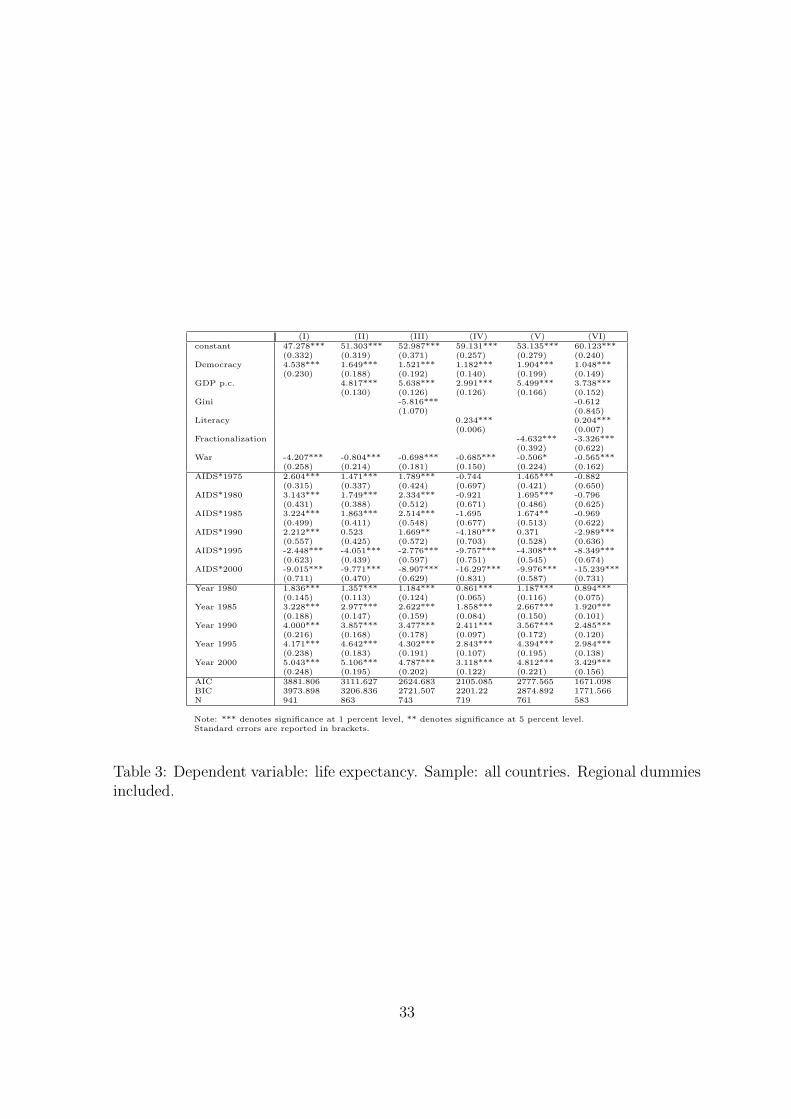
Let us start the discussion of the results with our analysis for life expectancy, both
for non-OECD countries and the complete sample. We start with a regression including
democracy and a full set of dummies and then step by step include the other explanatory
variables (Tables 1 and 3). The impact of democracy on life expectancy is positive and
in all specifications highly significant. The HIV/AIDS dummy carries the expected
negative sign for the more recent years 1990, 1995 and 2000. The positive sign of the
time dummies captures the overall upward trend in the level of life expectancy. As
expected, war has a negative and significant impact on life expectancy.
The results for our other main explanatory variables are as expected from the the-
oretical reasoning. GDP and education in all specifications have a positive and highly
significant impact on life expectancy. Ethnic fractionalization in contrast is negatively
linked to life expectancy. Although the latter result mainly confirms theoretical expec-
tations it must be taken with caution because of the critical assumption of homogeneity
over years. Inequality carries a negative coefficient, however it is not significant in the
final specification with all control variables.
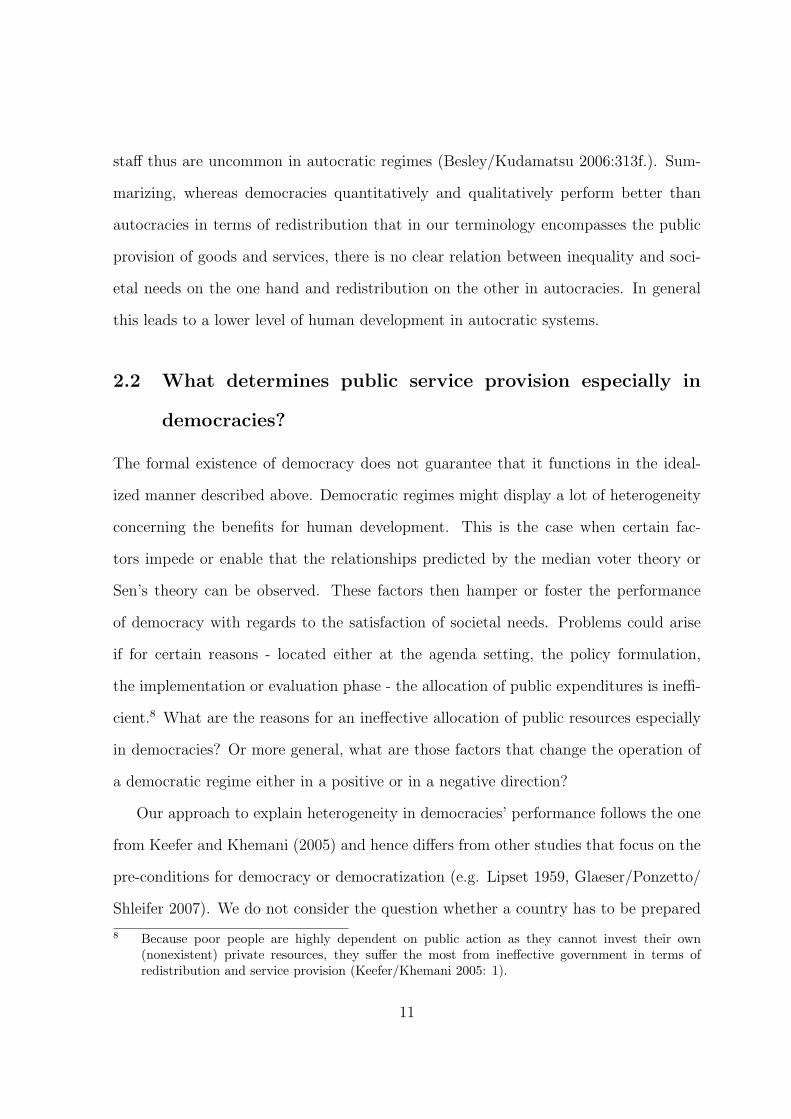
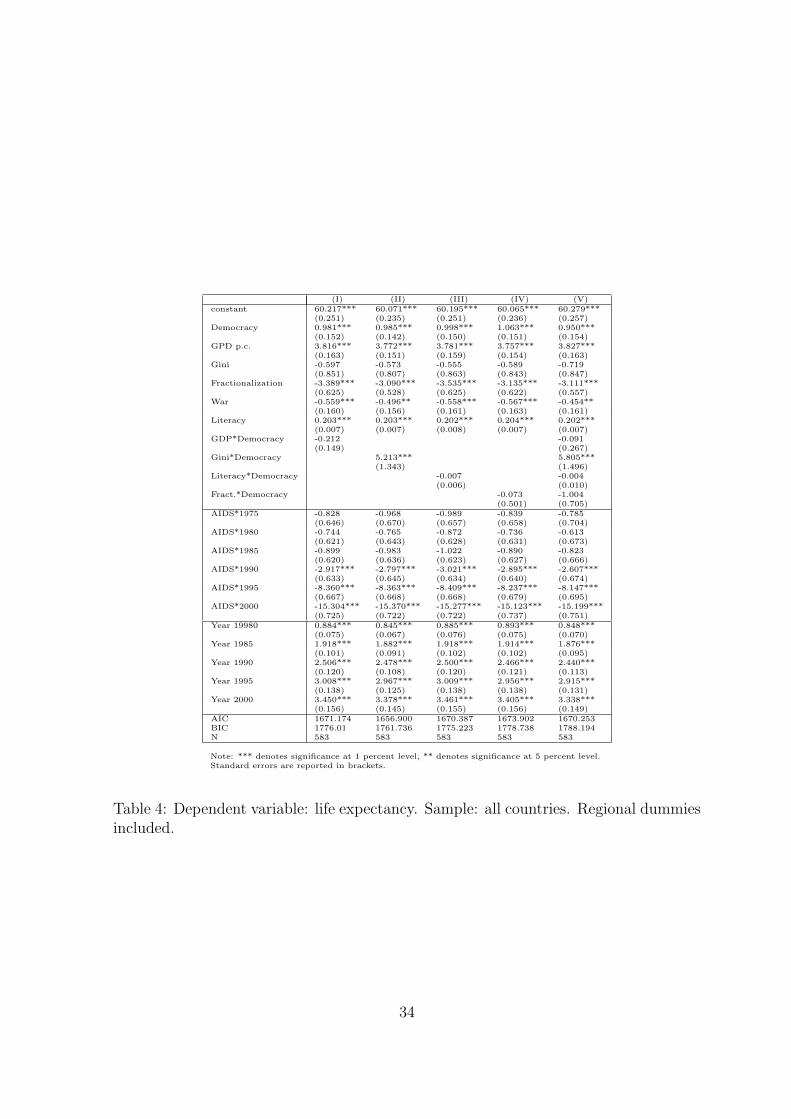
In Tables 2 and 4 we proceed with the final specification including all variables and
step by step include the different interaction effects of the conditioning variables with
democracy. What do the interaction effects tell us? Whereas inequality alone carries a
negative sign, its interaction with democracy indicates that increases of life expectancy
due to democracy are stronger in more unequal societies compared to more equal ones
confirming in part the median voter hypothesis and the need for more redistribution
in more unequal societies. The other interaction effects turn out to be statistically
insignificant. This leads us to the conclusion that despite the fact that GDP per capita,
21

education and ethnic fractionalization are important for human development, they do
not hamper or foster the ability of a democracy to increase life expectancy. Hence, it
is democracy itself what is important and to a smaller extent the circumstances under
which it occurs. This stands in contrast to what we would expect from theory, however
it can be considered as good news for promoting democracy in poor, uneducated and
diverse societies.
Table 5 and 6 show the results of the panel analysis for literacy. Overall, the picture
is quite similar to the one for life expectancy. Both GDP and democracy are important
determinants of literacy, while ethnic fractionalization has a negative impact. Inequality
is not significant, the same is true for all interaction effects. While this again stands
in contrast to the expectations from theory it again confirms, that also for our second
dimension of human development it is democracy itself that is important.
4 Conclusion
We believe that our study has its associated merits explaining the linkage between
democracy and human development. In the theoretical section we clarify the causal
channels of democracy influencing human development. In contrast to earlier studies
which have their focus on property rights we emphasize the importance of the redis-
tributive effects and effects of public goods provision in democracy. The influence of
democracy on human development is investigated descriptively and analytically, the
statistical analysis includes both the cross-sectional and the time dimension. Extend-
ing the existing literature we not only measure the influence of democracy on human
development, but we further theoretically and empirically identify conditions which are
important for the functioning of democracy in terms of improving the level of human
development. In particular, we find some evidence for the median voter theory.
22

Empirically, we have shown that there is a strong and robust link between democ-
racy and human development measured as life expectancy and literacy, even if one is
controlling for the level of economic development and other important variables. We
have constructed our model in such a way, that to the best of our knowledge we can
be quite certain, that this is a causal relation and not just a spurious correlation. This
result is rather robust no matter what specification we used.
Furthermore, we found empirical evidence for conditions and requirements that in-
crease or decrease the impact of democracy on human development. In very unequal
societies the median voter that is the decisive voter in democracies, is farther away
from the mean income than in more equal societies, therefore inequality combined with
democracy accelerates the redistributive effects of democracy. Redistribution in favor
of the bottom part of the distribution increases average life expectancy and literacy,
because the poor are in general farther away from the technological (or say medical)
frontier of life expectancy and can thus obtain higher improvements than people closer
to the frontier with the same amount of money. The interaction of democracy and
its other presumed conditions of functioning turned out to be insignificant. One could
therefore conclude that the functioning of democracy - in terms of non-income human
development improvements - is independent of GDP per capita, ethnic fractionalization
and even education. Nevertheless, these factors influence non-income human develop-
ment levels directly.
The positive effect of education on life expectancy could be caused by priority
changes in private spending, by more efficient private spending on education or by
changes in private behavior. Social fragmentation, as proxied by ethnic fractionaliza-
tion, and corresponding differences in preferences possibly split the population in sub-
populations and could therefore weaken the power of each sub-group to articulate and
to assert its needs. This is confirmed by our empirical findings. Ethnic fractionalization
23

negatively affects life expectancy and literacy.
Controlling for economic development, we can be quite certain, that democracy
has an impact on human development which goes beyond its linkage with economic
development. However, we can be less certain, that the influence comes directly from
a democratic system or whether it comes from other social and political factors which
are very well proxied by democracy. In the background of democracy other factors
might be at work as well. Future studies could incorporate social capital as well as
the degree of decentralization of the political-administrative system. Moreover it would
be interesting to investigate whether the distribution of our non-income dimensions of
human development is more equal in democracies than in autocracies. In addition, it
would certainly be useful and an improvement of our analysis to empirically identify
and model the channels that democracy takes before it affects human development, for
example via the public expenditures. Unfortunately, the data for this endeavor have
not been available.
In the end, we can derive two conclusions from our analysis on the relationship
between political institutions and human development. First, democracy is good for
human development and this independently from its effect on economic development.
This strengthens both the median voter theory and Sen’s democracy argument. Hence,
the main question whether democracy fulfils its ”constructive” and ”instrumental” role
deserves an affirmative answer. Second, even if the picture here is more ambiguous, the
positive impact of democracy on human development seems to be rather independent
from the circumstances. However, democracy leads to more redistribution in favor of
health provision in more unequal societies.
24

References
Acemoglu, D., S. Johnson, J. A. Robinson and P. Yared (2008): Income and Democ-racy, in: American Economic Review, Vol. 98, No. 3, pp. 808-842.
Acemoglu, D. and J. A. Robinson (2008): Persistence of Power, Elites, Institutions, in:American Economic Review, Vol. 98, No. 1, pp. 267-293.
Acemoglu, D., S. Johnson, and J. A. Robinson (2002): Reversal of Fortune: Geographyand Institutions in the Making of the Modern World income Distribution, in: QuarterlyJournal of Economics, Vol. 117, pp. 1231-1294.
Acemoglu, D., S. Johnson, and J. A. Robinson (2001): The Colonial Origins of Com-parative Advantage, in: American Economic Review, Vol. 91, No. 5, pp. 1369-1401.
Alesina, A. and E. La Ferrara (2005): Ethnic Diversity and Economic Performance, in:Journal of Economic Literature (43)3: 762-800.
Alesina, A., A. Devleeschauwer, W. Easterly, S. Kurlat, and R. Wacziarg (2003): Frac-tionalization, in: Journal of Economic Growth, Vol. 8, No.2, pp. 155-194.
Alesina, A., R. Baquir, and W. Easterly (1999): Public Goods and Ethnic Divisions,in: The Quarterly Journal of Economics, Vol. 114, No. 4, pp. 1243-1284.
Alesina, A. and R. Rodrik (1994): Distributive Politics and Economic Growth, in: TheQuarterly Journal of Economics, Vol. 109, No. 2, pp. 465-490.
Barro, R. J. (1996): Democracy and Growth, in: Journal of Economic Growth, Vol. 1,pp. 1-27.
Barro, R. J. (1999): Determinants of Democracy, in: Journal of Political Economy,Vol. 107, No. 6, pp.158-183.
Besley, T. and R. Burgess (2002): The Political Economy of Government Responsive-ness: Theory and Evidence from India, in: Quarterly Journal of Economics, Vol. 117,pp. 1415-1451.
Besley, T. and M. Kudamatsu (2006): Health and Democracy, in: AEA Papers andProceedings, Vol. 96, No. 2, pp. 313-315.
Boix, C. (2001): Democracy, Development, and the Public Sector, in: American Jour-nal of Political Science, Vol. 45, No. 1, pp. 1-17.
Bourguignon, F. and T. Verdier (2000): Oligarchy, democracy, inequality and growth,in: Journal of Development Economics, Vol. 62, pp. 285-313.
Collier, P. (2001): Implications of ethnic diversity, in: Economic Policy Analysis, Vol.16, No. 32, pp. 129-166.
Cronbach, L. (1987): Statistical tests for moderator variables: Flaws in analysis re-cently proposed, in: Psychological Bulletin, Vol. 102, pp. 414-417.
Franco, A., C. Alvarez-Dardet, and M. T. Ruiz (2004): Effect of democracy on health:
25

ecological study, in: BMJ (British Medical Journal), Vol. 329, pp. 1421-1423.
Glaeser, E. L., G. A. M. Ponzetto and A. Shleifer (2007): Why does democracy neededucation?, in: Journal of Economic Growth, Vol. 12, pp.77-99.
Gradstein, M. and B. Milanovic (2004): Does Liberte = Egalite? A Survey of the Em-pirical Links between Democracy and Inequality with some Evidence on the TransitionEconomies, in: Journal of Economic Surveys, Vol. 18, No. 4, pp. 515-537.
Grun, C. and S. Klasen (2008): Growth, Inequality, and Well-Being: Comparisonsacross Space and Time, in: Oxford Economic Papers, Vol. 60, No. 2, pp. 212-236.
Hall, P. A., and R. C. R. Taylor (1996): Political Science and the Three New Institu-tionalisms, Koln: Max-Planck Institut fur Gesellschaftsforschung.
Hall, R., and C. Jones (1999): Why Do Some Countries Produce So Much More OutputPer Worker Than Others?, in: Quarterly Journal of Economics, Vol. 114, No. 1, pp.83-116.
Holzmann, H., S. Vollmer and J. Weisbrod (2008): Twin Peaks or Three Components?- Analyzing the World’s Cross-Country Distribution of Income. Working Paper, Uni-versity of Gottingen.
Inglehart, R. and C. Welzel (2005): Modernization, Cultural Change and Democracy.The Human Development Sequence. New York: Cambridge University Press.
Jaccard, J., C. K. Wan, and R. Turrisi (1990): The Detection and Interpretation of In-teraction Effects between Continuous Variables in Multiple Regression, in: MultivariateBehavioral Research, Vo. 25, No. 4, pp. 467-478.
Kaufmann, D., A. Kraay, and M. Mastruzzi (2007): Governance Matters VI: Gover-nance Indicators for 1996-2006, in: World Bank Research Working Paper No. 4280.
Keefer, P. (2005): Democratization and Clientelism: Why are young democracies badlygoverned?, in: World Bank Policy Research Working Paper 3594.
Keefer, P. and S. Khemani (2005): Democracy, Public Expenditure, and the Poor:Understanding Political Incentives for Providing Public Services, in: The World BankResearch Observer, Vol. 20, No. 1, pp. 1-27.
Klasen, S. (2004): In Search of the Holy Grail: How to Achieve Pro Poor Growth?,in: Tungodden, B., N. Stern, and I. Kolstad (eds.): Toward Pro Poor Policies - Aid,Institutions, and Globalization. New York: Oxford University Press, pp. 63-94.
Knack, S. and P. Keefer (1995): Institutions and Economic Performance: Cross Coun-try Tests Using Alternative Institutional Measures, in: Economics and Politics, Vol.7,No. 3, pp. 207-27.
La Porta, R., F. Lopez-de-Silanes, C. Pop-Eleches, and A. Shleifer (2004): JudicialChecks and Balances, in: Journal of Political Economy, Vol. 112, pp. 445-470.
Lipset, S. M. (1959): Some Social Requisites of Democray: Economic Development and
26
Political Legitimacy, in: The American Political Science Review, Vol. 53, No. 1, pp.69-105.
Marshall, M. G. and K. Jaggers (2005): Polity IV Project. Dataset User’s Manual.Center for Global Policy. George Mason University. Martyn, C. (2004): Commen-tary: Politics as a determinant of health, in: BMJ (British Medical Journal), Vol. 329,pp.1423-1424.
McGuire M. C. and O. Mancur (1996): The Economics of Autocracy and MajorityRule: The Invisible Hand and the Use of Force, in: Journal of Economic Literature,Vol. 34, No. 1., pp. 72-96.
Miguel, Edward und Mary K. Gugerty (2005): Ethnic Diversity, Social Sanctions, andPublic Goods in Kenya, in: Journal of Public Economics, Vol. 89, No.11/12, pp. 2325-2368.
Minier, J. A. (1998): Democracy and Growth: Alternative Approaches, in: Journal ofEconomic Growth, Vol. 3, No. 3, pp. 241-66.
Meltzer, A. H. and S. F. Richard (1981): A Rational Theory of the Size of Government,in: Journal of Political Economy, Vol. 89, No. 5, pp. 914-927.
Olson, M. (1993): Dictatorship, Democracy, and Development, in: The American Po-litical Science Review, Vol. 87, No. 3, pp. 567-576. Persson, T. (2002): Do PoliticalInstitutions Shape Economic Policy, in: Econometrica, Vol. 70, No. 3, 883-905.
Persson, T., G. Roland, and G. Tabellini (2000): Comparative Politics and Public Fi-nance, in: The Journal of Political Economy, Vol. 108, No. 6, pp. 1121-1161.
Persson, T. and G. Tabellini (2006): Democracy and Development: The Devil in De-tails, in: AEA Papers and Proceedings, Vol. 96, No. 2, pp. 319-320.
Persson, T. and G. Tabellini (2000): Political Economics. Explaining Economic Policy.Cambridge, Massachusetts, London: MIT Press. Peters, G. B. (2005): InstitutionalTheory in Political Science, London, New York: Continuum.
Pritchett, L. and L. H. Summers (1996): Wealthier is Healthier, in: The Journal ofHuman Resources, Vol. 31, No. 4, pp. 841-868.
Rodrik. D. and R. Wacziarg (2005): Do Democratic Transitions produce Bad EconomicOutcomes, in: AEA Papers and Proceedings, Vol. 95, No. 2, pp. 50-54.
Ross, M. (2006): Is Democracy Good for the Poor, in: American Journal of PoliticalScience, Vol. 50, No. 4, pp. 860-874.
Sen, A. K. (2004): What’s the Point of Democracy?, in: American Academy of Artsand Sciences Bulletin, LVII, 3, pp. 8-11.
Sen, A. K. (2003): Development as Capability Expansion, in: S. Fukuda-Parr and A.K.Shiva Kumar (eds.): Readings in Human Development, New Delhi and New York: Ox-
27

ford University Press, pp. 41-58.
Sen, A. K. (2000): A Decade of Human Development, in: Journal of Human Develop-ment, Vol. 1, No. 1, pp. 17-23.
Sen, A. K. (1999a): Development as Freedom. Oxford: Oxford University Press.
Sen, A. K. (1999b): Democracy as a Universal Value,in: Journal of Democracy, Vol.10, No. 3, pp. 3-17.
Sen, A. K. (1991): Capability and Well-Being, in: M. Nussbaum and A. K. Sen (eds.):The Quality of Life, Oxford: Clarendon Press. 1991.
Sen, A. K: (1988): The Concept of Development, in: H. Chenery and T.N. Srinivasan(eds.): Handbook of Development Economics, Amsterdam: North Holland, pp. 9-26.
Sen, A. K. (1983): Development: Which Way Now?, in: Economic Journal, Vol. 93,No. 372, pp.745-762.
Stasavage, D. (2005): Democracy and Education Spending in Africa, in: AmericanJournal of Political Science, Vol. 49, No. 2, pp. 343-358.
Subramanian, S. V. and I. Kawachi (2004): Income Inequality and Health: What havewe learned so far?, in: Epidemiologic Reviews, Vol. 26, pp. 78-91.
Tavares, J. and R. Wacziarg (2001): How democracy affects growth, in: European Eco-nomic Review, Vol. 45, pp. 1341-1378.
Tsai, M.-C. (2006): Does Political Democracy Enhance Human Development in Devel-oping Countries, in: American Journal of Economics and Sociology, Vol. 65, No. 2,pp. 233-268.
UCDP/PRIO intrastate conflict onset dataset, 1946-2006.
UNAIDS estimates of AIDS/HIV adult infections prevalence in per cent. UN statisticsdivision.
28

30 40 50 60 70 80 90
0.00
0.02
0.04
1970
Life Expectancy
Den
sity
30 40 50 60 70 80 90
0.00
0.02
0.04
1980
Life Expectancy
Den
sity
30 40 50 60 70 80 90
0.00
0.02
0.04
1990
Life Expectancy
Den
sity
30 40 50 60 70 80 90
0.00
0.01
0.02
0.03
0.04
2000
Life Expectancy
Den
sity
Figure 1: Kernel density estimates for life expectancy. Solid line: democratic countries.Dashed line: autocractic countries.
Solid line: Kernel density estimator for countries being democratic in the given year. Dashed line: Kernel density estimator for
countries being autocratic in the given year. 1970: 41 democracies and 97 autocracies; 1980: 44 democracies and 107 autocracies; 1990:
67 democracies and 85 autocracies; 2000: 97 democracies and 58 autocracies.
29

0 20 40 60 80 100
0.00
00.
010
0.02
0
1970
Literacy Rate
Den
sity
0 20 40 60 80 100
0.00
00.
010
0.02
0
1980
Literacy Rate
Den
sity
0 20 40 60 80 100
0.00
0.01
0.02
0.03
1990
Literacy Rate
Den
sity
0 20 40 60 80 100
0.00
0.01
0.02
0.03
2000
Literacy Rate
Den
sity
Figure 2: Kernel density estimates for literacy. Solid line: democratic countries. Dashedline: autocractic countries.
Solid line: Kernel density estimator for countries being democratic in the given year. Dashed line: Kernel density estimator for
countries being autocratic in the given year. 1970: 23 democracies and 77 autocracies; 1980: 25 democracies and 87 autocracies; 1990: 44
democracies and 68 autocracies; 2000: 70 democracies and 45 autocracies.
30
(I) (II) (III) (IV) (V) (VI)constant 44.931*** 47.951*** 48.765*** 54.834*** 48.984*** 55.283***
(0.270) (0.294) (0.360) (0.294) (0.302) (0.380)Democracy 1.996*** 1.699*** 1.443*** 1.162*** 1.949*** 1.225***
(0.225) (0.207) (0.163) (0.158) (0.241) (0.174)GDP p.c. 4.000*** 4.711*** 2.289*** 4.962*** 3.676***
(0.133) (0.179) (0.153) (0.231) (0.237)Gini -5.223*** -0.203
(0.799) (1.074)Literacy 0.220*** 0.183***
(0.008) (0.009)Fractionalization -4.743*** -4.012***
(0.505) (0.884)War -2.548*** -0.743*** -0.651*** -0.750*** -0.460* -0.516**
(0.213) (0.209) (0.173) (0.154) (0.231) (0.178)AIDS*1975 2.488*** 2.024*** 2.280*** 0.248 1.955*** -0.675
(0.270) (0.332) (0.382) (0.732) (0.382) (0.699)AIDS*1980 2.414*** 1.890*** 2.328*** -0.115 1.860*** -0.725
(0.392) (0.393) (0.442) (0.716) (0.465) (0.676)AIDS*1985 2.010*** 1.423*** 2.077*** -1.121 1.510** -0.996
(0.470) (0.424) (0.466) (0.720) (0.500) (0.672)AIDS*1990 0.666 -0.217 0.609 -3.685*** -0.002 -3.066***
(0.535) (0.443) (0.480) (0.743) (0.520) (0.682)AIDS*1995 -3.643*** -4.962*** -3.808*** -9.191*** -4.677*** -8.164***
(0.595) (0.465) (0.497) (0.791) (0.541) (0.716)AIDS*2000 -9.046*** -10.658*** -10.023*** -15.486*** -10.370*** -14.902***
(0.666) (0.491) (0.511) (0.866) (0.592) (0.766)Year 1980 2.295*** 1.992*** 1.885*** 1.159*** 1.790*** 1.147***
(0.150) (0.139) (0.172) (0.104) (0.167) (0.116)Year 1985 4.196*** 4.181*** 3.929*** 2.418*** 3.681*** 2.385***
(0.195) (0.181) (0.223) (0.141) (0.210) (0.162)Year 1990 5.438*** 5.346*** 5.233*** 3.107*** 4.842*** 3.126***
(0.226) (0.209) (0.253) (0.168) (0.239) (0.198)Year 1995 6.215*** 6.192*** 6.056*** 3.431*** 5.604*** 3.414***
(0.255) (0.234) (0.281) (0.192) (0.274) (0.234)Year 2000 7.140*** 6.709*** 6.740*** 3.615*** 6.104*** 3.819***
(0.270) (0.240) (0.282) (0.201) (0.309) (0.272)AIC 3020.288 2597.735 2116.471 1841.316 2306.006 1432.179BIC 3108.371 2688.353 2207.582 1932.464 2397.846 1525.7N 762 686 566 567 586 431
Note: *** denotes significance at 1 percent level, ** denotes significance at 5 percent level.Standard errors are reported in brackets.
Table 1: Dependent variable: life expectancy. Sample: non-OECD countries. Regionaldummies included.
31

(I) (II) (III) (IV) (V)constant 55.291*** 55.130*** 55.294*** 55.505*** 55.565***
(0.384) (0.365) (0.380) (0.392) (0.394)Democracy 1.188*** 1.240*** 1.189*** 1.326*** 1.332***
(0.177) (0.170) (0.178) (0.182) (0.182)GDP p.c. 3.763*** 3.598*** 3.683*** 3.473*** 3.426***
(0.245) (0.232) (0.244) (0.240) (0.242)Gini -0.141 -0.373 -0.236 -0.120 -0.573
(1.082) (1.082) (1.090) (1.071) (1.113)Fractionalization -3.934*** -4.062*** -4.097*** -4.465*** -4.604***
(0.879) (0.871) (0.885) (0.825) (0.766)Literacy 0.182*** 0.181*** 0.183*** 0.185*** 0.183***
(0.009) (0.009) (0.010) (0.010) (0.010)War -0.492** -0.579*** -0.522** -0.508** -0.517**
(0.179) (0.168) (0.176) (0.180) (0.169)GDP*Democracy -0.255 -0.389
(0.197) (0.302)Gini*Democracy 4.794** 6.337**
(1.861) (1.975)Literacy*Democracy -0.005 0.002
(0.007) (0.010)Fract.*Democracy -0.881 -2.059*
(0.710) (0.951)AIDS*1975 -0.480 -0.543 -0.647 -0.783 -0.846
(0.697) (0.714) (0.696) (0.689) (0.735)AIDS*1980 -0.548 -0.508 -0.689 -0.909 -0.879
(0.677) (0.691) (0.673) (0.670) (0.705)AIDS*1985 -0.827 -0.882 -0.956 -1.274 -1.236
(0.675) (0.684) (0.668) (0.672) (0.698)AIDS*1990 -2.935*** -2.841*** -3.056*** -3.335*** -3.131***
(0.684) (0.690) (0.675) (0.691) (0.706)AIDS*1995 -8.126*** -8.107*** -8.186*** -8.439*** -8.454***
(0.719) (0.719) (0.708) (0.741) (0.739)AIDS*2000 -14.944*** -14.980*** -14.911*** -15.246*** -15.394***
(0.776) (0.773) (0.755) (0.813) (0.804)Year 1980 1.128*** 1.100*** 1.139*** 1.168*** 1.140***
(0.117) (0.118) (0.119) (0.116) (0.119)Year 1985 2.384*** 2.353*** 2.385*** 2.407*** 2.392***
(0.162) (0.163) (0.163) (0.162) (0.164)Year 1990 3.155*** 3.167*** 3.152*** 3.108*** 3.151***
(0.199) (0.196) (0.200) (0.198) (0.199)Year 1995 3.444*** 3.433*** 3.454*** 3.376*** 3.418***
(0.235) (0.231) (0.235) (0.235) (0.235)Year 2000 3.838*** 3.873*** 3.861*** 3.819*** 3.844***
(0.272) (0.269) (0.272) (0.273) (0.275)AIC 1434.673 1444.435 1433.425 1437.844 1453.905BIC 1532.259 1542.022 1531.012 1535.431 1563.689N 431 431 431 431 431
Note: *** denotes significance at 1 percent level, ** denotes significance at 5 percent level.Standard errors are reported in brackets.
Table 2: Dependent variable: life expectancy. Sample: non-OECD countries. Regionaldummies included.
32
(I) (II) (III) (IV) (V) (VI)constant 47.278*** 51.303*** 52.987*** 59.131*** 53.135*** 60.123***
(0.332) (0.319) (0.371) (0.257) (0.279) (0.240)Democracy 4.538*** 1.649*** 1.521*** 1.182*** 1.904*** 1.048***
(0.230) (0.188) (0.192) (0.140) (0.199) (0.149)GDP p.c. 4.817*** 5.638*** 2.991*** 5.499*** 3.738***
(0.130) (0.126) (0.126) (0.166) (0.152)Gini -5.816*** -0.612
(1.070) (0.845)Literacy 0.234*** 0.204***
(0.006) (0.007)Fractionalization -4.632*** -3.326***
(0.392) (0.622)War -4.207*** -0.804*** -0.698*** -0.685*** -0.506* -0.565***
(0.258) (0.214) (0.181) (0.150) (0.224) (0.162)AIDS*1975 2.604*** 1.471*** 1.789*** -0.744 1.465*** -0.882
(0.315) (0.337) (0.424) (0.697) (0.421) (0.650)AIDS*1980 3.143*** 1.749*** 2.334*** -0.921 1.695*** -0.796
(0.431) (0.388) (0.512) (0.671) (0.486) (0.625)AIDS*1985 3.224*** 1.863*** 2.514*** -1.695 1.674** -0.969
(0.499) (0.411) (0.548) (0.677) (0.513) (0.622)AIDS*1990 2.212*** 0.523 1.669** -4.180*** 0.371 -2.989***
(0.557) (0.425) (0.572) (0.703) (0.528) (0.636)AIDS*1995 -2.448*** -4.051*** -2.776*** -9.757*** -4.308*** -8.349***
(0.623) (0.439) (0.597) (0.751) (0.545) (0.674)AIDS*2000 -9.015*** -9.771*** -8.907*** -16.297*** -9.976*** -15.239***
(0.711) (0.470) (0.629) (0.831) (0.587) (0.731)Year 1980 1.836*** 1.357*** 1.184*** 0.861*** 1.187*** 0.894***
(0.145) (0.113) (0.124) (0.065) (0.116) (0.075)Year 1985 3.228*** 2.977*** 2.622*** 1.858*** 2.667*** 1.920***
(0.188) (0.147) (0.159) (0.084) (0.150) (0.101)Year 1990 4.000*** 3.857*** 3.477*** 2.411*** 3.567*** 2.485***
(0.216) (0.168) (0.178) (0.097) (0.172) (0.120)Year 1995 4.171*** 4.642*** 4.302*** 2.843*** 4.394*** 2.984***
(0.238) (0.183) (0.191) (0.107) (0.195) (0.138)Year 2000 5.043*** 5.106*** 4.787*** 3.118*** 4.812*** 3.429***
(0.248) (0.195) (0.202) (0.122) (0.221) (0.156)AIC 3881.806 3111.627 2624.683 2105.085 2777.565 1671.098BIC 3973.898 3206.836 2721.507 2201.22 2874.892 1771.566N 941 863 743 719 761 583
Note: *** denotes significance at 1 percent level, ** denotes significance at 5 percent level.Standard errors are reported in brackets.
Table 3: Dependent variable: life expectancy. Sample: all countries. Regional dummiesincluded.
33
(I) (II) (III) (IV) (V)constant 60.217*** 60.071*** 60.195*** 60.065*** 60.279***
(0.251) (0.235) (0.251) (0.236) (0.257)Democracy 0.981*** 0.985*** 0.998*** 1.063*** 0.950***
(0.152) (0.142) (0.150) (0.151) (0.154)GPD p.c. 3.816*** 3.772*** 3.781*** 3.757*** 3.827***
(0.163) (0.151) (0.159) (0.154) (0.163)Gini -0.597 -0.573 -0.555 -0.589 -0.719
(0.851) (0.807) (0.863) (0.843) (0.847)Fractionalization -3.389*** -3.090*** -3.535*** -3.135*** -3.111***
(0.625) (0.528) (0.625) (0.622) (0.557)War -0.559*** -0.496** -0.558*** -0.567*** -0.454**
(0.160) (0.156) (0.161) (0.163) (0.161)Literacy 0.203*** 0.203*** 0.202*** 0.204*** 0.202***
(0.007) (0.007) (0.008) (0.007) (0.007)GDP*Democracy -0.212 -0.091
(0.149) (0.267)Gini*Democracy 5.213*** 5.805***
(1.343) (1.496)Literacy*Democracy -0.007 -0.004
(0.006) (0.010)Fract.*Democracy -0.073 -1.004
(0.501) (0.705)AIDS*1975 -0.828 -0.968 -0.989 -0.839 -0.785
(0.646) (0.670) (0.657) (0.658) (0.704)AIDS*1980 -0.744 -0.765 -0.872 -0.736 -0.613
(0.621) (0.643) (0.628) (0.631) (0.673)AIDS*1985 -0.899 -0.983 -1.022 -0.890 -0.823
(0.620) (0.636) (0.623) (0.627) (0.666)AIDS*1990 -2.917*** -2.797*** -3.021*** -2.895*** -2.607***
(0.633) (0.645) (0.634) (0.640) (0.674)AIDS*1995 -8.360*** -8.363*** -8.409*** -8.237*** -8.147***
(0.667) (0.668) (0.668) (0.679) (0.695)AIDS*2000 -15.304*** -15.370*** -15.277*** -15.123*** -15.199***
(0.725) (0.722) (0.722) (0.737) (0.751)Year 19980 0.884*** 0.845*** 0.885*** 0.893*** 0.848***
(0.075) (0.067) (0.076) (0.075) (0.070)Year 1985 1.918*** 1.882*** 1.918*** 1.914*** 1.876***
(0.101) (0.091) (0.102) (0.102) (0.095)Year 1990 2.506*** 2.478*** 2.500*** 2.466*** 2.440***
(0.120) (0.108) (0.120) (0.121) (0.113)Year 1995 3.008*** 2.967*** 3.009*** 2.956*** 2.915***
(0.138) (0.125) (0.138) (0.138) (0.131)Year 2000 3.450*** 3.378*** 3.461*** 3.405*** 3.338***
(0.156) (0.145) (0.155) (0.156) (0.149)AIC 1671.174 1656.900 1670.387 1673.902 1670.253BIC 1776.01 1761.736 1775.223 1778.738 1788.194N 583 583 583 583 583
Note: *** denotes significance at 1 percent level, ** denotes significance at 5 percent level.Standard errors are reported in brackets.
Table 4: Dependent variable: life expectancy. Sample: all countries. Regional dummiesincluded.
34

(I) (II) (III) (IV) (V)constant 31.643*** 42.315*** 44.758*** 43.105*** 42.667***
(0.915) (1.004) (0.964) (0.833) (0.937)Democracy 1.271*** 1.687*** 1.509*** 1.019** 1.321***
(0.386) (0.334) (0.334) (0.387) (0.395)GDP p.c. 9.420*** 11.740*** 9.786*** 11.791***
(0.358) (0.468) (0.530) (0.555)Gini -2.320 -0.927
(1.736) (2.460)Fractionalization -15.246*** -14.030***
(1.899) (2.222)War -0.414 0.329 -0.234 0.499 0.433
(0.399) (0.319) (0.323) (0.379) (0.402)Year 1980 4.236*** 3.331*** 2.881*** 3.006*** 2.725***
(0.240) (0.262) (0.279) (0.277) (0.285)Year 1985 8.265*** 7.505*** 6.418*** 6.697*** 6.358***
(0.322) (0.344) (0.364) (0.367) (0.384)Year 1990 12.044*** 10.909*** 9.324*** 9.864*** 9.117***
(0.386) (0.407) (0.428) (0.435) (0.462)Year 1995 15.044*** 13.763*** 11.799*** 12.755*** 11.542***
(0.451) (0.470) (0.502) (0.507) (0.546)Year 2000 17.822*** 16.007*** 13.936*** 15.244*** 13.441***
(0.499) (0.499) (0.512) (0.575) (0.598)AIC 3404.857 3093.600 2576.279 2680.587 2360.993BIC 3463.909 3155.795 2640.541 2745.071 2428.005N 694 628 536 544 487
Note: *** denotes significance at 1 percent level, ** denotes significance at5 percent level. Standard errors are reported in brackets.
Table 5: Dependent variable: literacy. Sample: non-OECD countries. Regional dum-mies included.
(I) (II) (III) (IV)constant 44.742*** 41.945*** 42.436*** 42.127***
(0.984) (1.033) (0.918) (0.966)Democracy 1.536*** 1.049 0.967 0.871
(0.437) (0.409) (0.407) (0.403)GDP p.c. 13.192*** 10.694*** 11.446*** 11.376***
(0.552) (0.574) (0.550) (0.537)Gini 1.585 -1.647 -0.980 -2.026
(2.724) (2.467) (2.481) (2.432)Fractionalization -11.436*** -14.555*** -14.232*** -12.928***
(2.299) (2.379) (2.159) (2.239)War 0.465 0.217 0.418 0.318
(0.412) (0.401) (0.429) (0.404)GDP*Democracy -0.695 -1.289*
(0.540) (0.530)Gini*Democracy -4.891 -3.450
(3.654) (3.623)Fract.*Democracy 2.973 0.728
(1.644) (1.905)Year 1980 2.726*** 2.910*** 2.668*** 2.737***
(0.315) (0.289) (0.288) (0.287)Year 1985 6.405*** 6.690*** 6.333*** 6.627***
(0.423) (0.388) (0.388) (0.386)Year 1990 9.147*** 9.535*** 9.125*** 9.498***
(0.506) (0.467) (0.467) (0.465)Year 1995 11.262*** 12.089*** 11.511*** 11.885***
(0.592) (0.549) (0.546) (0.543)Year 2000 12.747*** 14.122*** 13.458*** 13.837***
(0.613) (0.604) (0.606) (0.596)AIC 2393.163 2347.701 2358.355 2359.821BIC 2464.364 2418.901 2429.556 2439.398N 487 487 487 487
Note: *** denotes significance at 1 percent level, ** denotes significance at5 percent level. Standard errors are reported in brackets.
Table 6: Dependent variable: literacy. Sample: non-OECD countries. Regional dum-mies included.
35

A Appendix
36
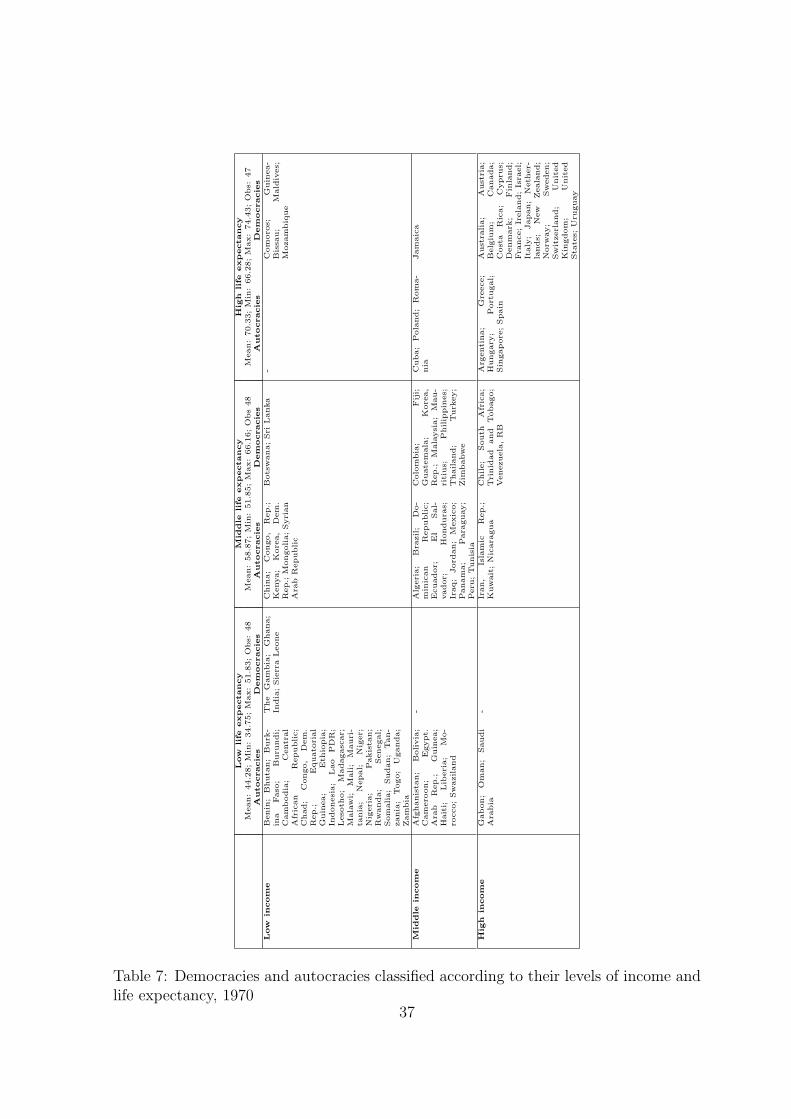
Low
life
expectancy
Mid
dle
life
expectancy
Hig
hlife
expectancy
Mean:
44.2
8;M
in:
34.7
5;M
ax:
51.8
3;O
bs:
48
Mean:
58.8
7;M
in:
51.8
5;M
ax:
66.1
6;O
bs
48
Mean:
70.3
3;M
in:
66.2
8;M
ax:
74.4
3;O
bs:
47
Autocracie
sD
em
ocracie
sA
utocracie
sD
em
ocracie
sA
utocracie
sD
em
ocracie
sLow
incom
eB
enin
;B
huta
n;
Burk
-in
aFaso
;B
uru
ndi;
Cam
bodia
;C
entr
al
Afr
ican
Republic;
Chad;
Congo,
Dem
.R
ep.;
Equato
rial
Guin
ea;
Eth
iopia
;In
donesi
a;
Lao
PD
R;
Leso
tho;
Madagasc
ar;
Mala
wi;
Mali;
Mauri
-ta
nia
;N
epal;
Nig
er;
Nig
eri
a;
Pakis
tan;
Rw
anda;
Senegal;
Som
alia;
Sudan;
Tan-
zania
;Togo;
Uganda;
Zam
bia
The
Gam
bia
;G
hana;
India
;Sie
rra
Leone
Chin
a;
Congo,
Rep.;
Kenya;
Kore
a,
Dem
.R
ep.;
Mongolia;Syri
an
Ara
bR
epublic
Bots
wana;Sri
Lanka
-C
om
oro
s;G
uin
ea-
Bis
sau;
Mald
ives;
Mozam
biq
ue
Mid
dle
incom
eA
fghanis
tan;
Bolivia
;C
am
ero
on;
Egypt.
Ara
bR
ep.;
Guin
ea;
Hait
i;Lib
eri
a;
Mo-
rocco;Sw
aziland
-A
lgeri
a;
Bra
zil;
Do-
min
ican
Republic;
Ecuador;
El
Sal-
vador;
Hondura
s;Ir
aq;
Jord
an;
Mexic
o;
Panam
a;
Para
guay;
Peru
;Tunis
ia
Colo
mbia
;Fiji;
Guate
mala
;K
ore
a,
Rep.;
Mala
ysi
a;
Mau-
riti
us;
Philip
pin
es;
Thailand;
Turk
ey;
Zim
babw
e
Cuba;
Pola
nd;
Rom
a-
nia
Jam
aic
a
Hig
hin
com
eG
abon;
Om
an;
Saudi
Ara
bia
-Ir
an,
Isla
mic
Rep.;
Kuw
ait
;N
icara
gua
Chile;
South
Afr
ica;
Tri
nid
ad
and
Tobago;
Venezuela
,R
B
Arg
enti
na;
Gre
ece;
Hungary
;Port
ugal;
Sin
gapore
;Spain
Aust
ralia;
Aust
ria;
Belg
ium
;C
anada;
Cost
aR
ica;
Cypru
s;D
enm
ark
;Fin
land;
Fra
nce;Ir
ela
nd;Is
rael;
Italy
;Japan;
Neth
er-
lands;
New
Zeala
nd;
Norw
ay;
Sw
eden;
Sw
itzerl
and;
Unit
ed
Kin
gdom
;U
nit
ed
Sta
tes;
Uru
guay
Table 7: Democracies and autocracies classified according to their levels of income andlife expectancy, 1970
37

Low
life
expectancy
Mid
dle
life
expectancy
Hig
hlife
expectancy
Mean:
47.8
8;M
in:
37.5
9;M
ax:
56.2
9M
ean:
62.6
3;M
in:
56.4
3;M
ax:
68.6
0M
ean:
71.9
6;M
in:
68.9
4;M
ax:
76.2
5A
utocracie
sD
em
ocracie
sA
utocracie
sD
em
ocracie
sA
utocracie
sD
em
ocracie
sLow
incom
eA
fghanis
tan;
Bangla
desh
;B
enin
;B
huta
n;B
urk
ina
Faso
;B
uru
ndi;
Centr
al
Afr
ican
Republic;
Chad;
Com
oro
s;C
ongo,
Dem
.R
ep.;
Congo,
Rep.;
Equato
-ri
al
Guin
ea;
Eth
iopia
;G
uin
ea-B
issa
u;
In-
donesi
a;
Lao
PD
R;
Leso
tho;
Lib
eri
a;
Madagasc
ar;
Mala
wi;
Mali;
Mauri
tania
;M
ozam
biq
ue;
Nepal;
Nig
er;
Pakis
tan;
Rw
anda;
Senegal;
Sie
rra
Leone;
Som
alia;
Sudan;
Tanzania
;Togo;Zam
bia
The
Gam
bia
;G
hana;
India
;M
ald
ives;
Nig
e-
ria;U
ganda
Chin
a;
Kenya;
Kore
a,
Dem
.R
ep.;
Mongolia;
Syri
an
Ara
bR
epublic
Sri
Lanka
--
Mid
dle
incom
eB
olivia
;C
am
ero
on;
Djibouti
;Egypt.
Ara
bR
ep.;
El
Sal-
vador;
Guin
ea;
Hait
i;Sw
aziland
Papua
New
Guin
ea
Alg
eri
a;
Bra
zil;
Guate
mala
;Ir
an,
Isla
mic
Rep.;
Iraq;
Jord
an;
Kore
a,
Rep.;
Mexic
o;
Moro
cco;
Nic
ara
gua;
Para
guay;
Philip
pin
es;
Tunis
ia;
Turk
ey
Bots
wana;
Colo
mbia
;D
om
inic
an
Republic;
Ecuador;
Fiji;
Hon-
dura
s;M
ala
ysi
a;
Mau-
riti
us;
Peru
;Solo
mon
Isla
nds;
South
Afr
ica;
Thailand;Zim
babw
e
Chile;
Cuba;
Panam
a;
Pola
nd;R
om
ania
Cost
aR
ica;Jam
aic
a
Hig
hin
com
eG
abon
-B
ahra
in;
Om
an;
Qata
r;Saudi
Ara
bia
;U
nit
ed
Ara
bEm
irate
s
Venezuela
,R
BA
rgenti
na;
Hungary
;K
uw
ait
;Sin
gapore
;U
ruguay
Aust
ralia;
Aust
ria;
Belg
ium
;B
runei;
Canada;
Cypru
s;D
en-
mark
;Fin
land;Fra
nce;
Gre
ece;
Irela
nd;
Is-
rael;
Italy
;Japan;
Neth
erl
ands;
New
Zeala
nd;
Norw
ay;
Por-
tugal;
Spain
;Sw
eden;
Sw
itzerl
and;
Tri
nid
ad
and
Tobago;
Unit
ed
Kin
gdom
;U
nit
ed
Sta
tes
Table 8: Democracies and autocracies classified according to their levels of income andlife expectancy, 1980
38

Low
life
expectancy
Mid
dle
life
expectancy
Hig
hlife
expectancy
Mean:
48.7
1;M
in:
37.5
4;M
ax:
61.3
1M
ean:
67.6
2;M
in:
61.3
6;M
ax:
72.1
8M
ean:
76.2
4;M
in:
72.4
5;M
ax:
81.2
3A
utocracie
sD
em
ocracie
sA
utocracie
sD
em
ocracie
sA
utocracie
sD
em
ocracie
sLow
incom
eA
fghanis
tan;
Angola
;B
huta
n;
Burk
ina
Faso
;B
uru
ndi;
Chad;
Congo,
Dem
.R
ep.;
Congo,
Rep.
Eri
trea;
The
Gam
bia
;H
ait
i;K
enya;
Lao
PD
R;
Lib
eri
a;
Mauri
tania
;R
wanda;
Sie
rra
Leone;
Som
alia;
Sudan;
Togo;
Uganda;Yem
en.
Rep.
Benin
;C
am
bodia
;C
entr
al
Afr
ican
Re-
public;
Cote
d’Ivoir
e;
Eth
iopia
;G
hana;
Guin
ea-B
issa
u;
Leso
tho;
Madagas-
car;
Mala
wi;
Mali;
Mozam
biq
ue;
Nepal;
Nig
er;
Nig
eri
a;
Sene-
gal;
Tanzania
;Zam
bia
Kore
a,
Dem
.R
ep.;
Solo
mon
Isla
nds;
Tajikis
tan;V
ietn
am
Bangla
desh
;H
on-
dura
s;M
old
ova;
Mongolia
Syri
an
Ara
bR
epublic
Serb
iaand
Monte
negro
Mid
dle
incom
eC
am
ero
on;
Equato
rial
Guin
ea;
Guin
ea;
Iraq;
Pakis
tan;
Sw
aziland;
Zim
babw
e
Bots
wana;
Djibouti
;G
uyana;
Nam
ibia
;Papua
New
Guin
ea;
South
Afr
ica
Alg
eri
a;
Azerb
ai-
jan;
Bela
rus;
Chin
a;
Egypt.
Ara
bR
ep.;
Jord
an;
Kazakhst
an;
Kyrg
yz
Republic;
Moro
cco;
Pakis
tan;
Turk
menis
tan;
Uzbek-
ista
n
Arm
enia
;B
olivia
;B
razil;
Bulg
ari
a;
Colo
mbia
;D
om
inic
an
Republic;
El
Sal-
vador;
Fiji;
Georg
ia;
Guate
mala
;G
uyana;
India
;In
donesi
a;
Iran,
Isla
mic
Rep.;
Jam
aic
a;
Latv
ia;
Lit
huania
;N
icara
gua;
Para
guay;
Philip
pin
es;
Rom
ania
;R
uss
ian
Federa
tion;
Thailand
Turk
ey;
Ukra
ine
Cuba;Lib
ya;Tunis
iaA
lbania
;C
ost
aR
ica;
Cro
ati
a;
Ecuador;
Macedonia
,FY
R;
Mexic
o;
Panam
a;
Pola
nd;
Slo
vak
Re-
public;
Sri
Lanka;
Venezuela
,R
B
Hig
hin
com
eG
abon
-Q
ata
r;SaudiA
rabia
Est
onia
;H
ungary
;M
auri
tius;
Tri
nid
ad
and
Tobago
Bahra
in;
Kuw
ait
;O
man;
Sin
gapore
;U
nit
ed
Ara
bEm
irate
s
Arg
enti
na;
Aust
ralia;
Aust
ria;
Belg
ium
;C
anada;
Chile;
Cypru
s;C
zech
Re-
public;
Denm
ark
;Fin
land;
Fra
nce;
Ger-
many;G
reece;Ir
ela
nd;
Isra
el;
Italy
;Japan;
Kore
a,R
ep.;
Mala
ysi
a;
Neth
erl
ands;
New
Zeala
nd;
Norw
ay;
Port
ugal;
Slo
ve-
nia
;Spain
;Sw
eden;
Sw
itzerl
and;
Unit
ed
Kin
gdom
;U
nit
ed
Sta
tes;
Uru
guay
Table 9: Democracies and autocracies classified according to their levels of income andlife expectancy, 1990
39

Low
life
expectancy
Mid
dle
life
expectancy
Hig
hlife
expectancy
Mean:
48.7
1;M
in:
37.5
4;M
ax:
61.3
1M
ean:
67.6
2;M
in:
61.3
6;M
ax:
72.1
8M
ean:
76.2
4;M
in:
72.4
5;M
ax:
81.2
3A
utocracie
sD
em
ocracie
sA
utocracie
sD
em
ocracie
sA
utocracie
sD
em
ocracie
sLow
incom
eA
fghanis
tan;
Angola
;B
huta
n;
Burk
ina
Faso
;B
uru
ndi;
Chad;
Congo,
Dem
.R
ep.;
Congo,
Rep.
Eri
trea;
The
Gam
bia
;H
ait
i;K
enya;
Lao
PD
R;
Lib
eri
a;
Mauri
tania
;R
wanda;
Sie
rra
Leone;
Som
alia;
Sudan;
Togo;
Uganda;Yem
en.
Rep.
Benin
;C
am
bodia
;C
entr
al
Afr
ican
Re-
public;
Cote
d’Ivoir
e;
Eth
iopia
;G
hana;
Guin
ea-B
issa
u;
Leso
tho;
Madagas-
car;
Mala
wi;
Mali;
Mozam
biq
ue;
Nepal;
Nig
er;
Nig
eri
a;
Sene-
gal;
Tanzania
;Zam
bia
Kore
a,
Dem
.R
ep.;
Solo
mon
Isla
nds;
Tajikis
tan;V
ietn
am
Bangla
desh
;H
on-
dura
s;M
old
ova;
Mongolia
Syri
an
Ara
bR
epublic
Serb
iaand
Monte
negro
Mid
dle
incom
eC
am
ero
on;
Equato
rial
Guin
ea;
Guin
ea;
Iraq;
Pakis
tan;
Sw
aziland;
Zim
babw
e
Bots
wana;
Djibouti
;G
uyana;
Nam
ibia
;Papua
New
Guin
ea;
South
Afr
ica
Alg
eri
a;
Azerb
ai-
jan;
Bela
rus;
Chin
a;
Egypt.
Ara
bR
ep.;
Jord
an;
Kazakhst
an;
Kyrg
yz
Republic;
Moro
cco;
Pakis
tan;
Turk
menis
tan;
Uzbek-
ista
n
Arm
enia
;B
olivia
;B
razil;
Bulg
ari
a;
Colo
mbia
;D
om
inic
an
Republic;
El
Sal-
vador;
Fiji;
Georg
ia;
Guate
mala
;G
uyana;
India
;In
donesi
a;
Iran,
Isla
mic
Rep.;
Jam
aic
a;
Latv
ia;
Lit
huania
;N
icara
gua;
Para
guay;
Philip
pin
es;
Rom
ania
;R
uss
ian
Federa
tion;
Thailand
Turk
ey;
Ukra
ine
Cuba;Lib
ya;Tunis
iaA
lbania
;C
ost
aR
ica;
Cro
ati
a;
Ecuador;
Macedonia
,FY
R;
Mexic
o;
Panam
a;
Pola
nd;
Slo
vak
Re-
public;
Sri
Lanka;
Venezuela
,R
B
Hig
hin
com
eG
abon
-Q
ata
r;SaudiA
rabia
Est
onia
;H
ungary
;M
auri
tius;
Tri
nid
ad
and
Tobago
Bahra
in;
Kuw
ait
;O
man;
Sin
gapore
;U
nit
ed
Ara
bEm
irate
s
Arg
enti
na;
Aust
ralia;
Aust
ria;
Belg
ium
;C
anada;
Chile;
Cypru
s;C
zech
Re-
public;
Denm
ark
;Fin
land;
Fra
nce;
Ger-
many;G
reece;Ir
ela
nd;
Isra
el;
Italy
;Japan;
Kore
a,R
ep.;
Mala
ysi
a;
Neth
erl
ands;
New
Zeala
nd;
Norw
ay;
Port
ugal;
Slo
ve-
nia
;Spain
;Sw
eden;
Sw
itzerl
and;
Unit
ed
Kin
gdom
;U
nit
ed
Sta
tes;
Uru
guay
Table 10: Democracies and autocracies classified according to their levels of incomeand life expectancy, 2000
40

Low
literacy
rate
Mid
dle
literacy
rate
Hig
hliteracy
rate
Mean:
21.3
0;M
in:
5.7
5;M
ax:
35.3
6M
ean:
54.2
1;M
in:
35.6
4;M
ax:
72.8
9M
ean:
89.0
7;M
in:
73.2
1;M
ax:
99
Autocracie
sD
em
ocracie
sA
utocracie
sD
em
ocracie
sA
utocracie
sD
em
ocracie
sLow
incom
eB
enin
;B
urk
ina
Faso
;B
uru
ndi;
Centr
al
Afr
ican
Republic;
Chad;
Congo,
Dem
.R
ep.;
Congo,
Rep.;
Eth
iopia
;M
ali;
Mau-
rita
nia
;N
epal;
Nig
er;
Nig
eri
a;
Pakis
tan;
Rw
anda;
Senegal;
Sudan;Togo
The
Gam
bia
;G
hana;
India
Cam
bodia
;C
hin
a;
Equato
rial
Guin
ea;
Indonesi
a;
Kenya;
Lao
PD
R;
Leso
tho;
Madagasc
ar;
Mala
wi;
Syri
an
Ara
bR
epublic;
Tanzania
;U
ganda;
Zam
bia
Bots
wana
Mongolia
Sri
Lanka
Mid
dle
incom
eA
lgeri
a;
Cam
ero
on;
Egypt,
Ara
bR
ep.;
Hait
i;Ir
aq;
Lib
eri
a;
Moro
cco;Tunis
ia
-B
olivia
;B
razil;
Do-
min
ican
Republic;
El
Salv
ador;
Hon-
dura
s;Jord
an;
Peru
;Sw
aziland
Guate
mala
;Jam
aic
a;
Mala
ysi
a;
Mauri
tius;
Zim
babw
e
Cuba;
Ecuador;
Panam
a;
Para
guay;
Rom
ania
Colo
mbia
;Fiji;
Philip
-pin
es;
Thailand
Hig
hin
com
eIr
an,
Isla
mic
Rep.;
Om
an;SaudiA
rabia
-K
uw
ait
;N
icara
gua;
Sin
gapore
South
Afr
ica
Arg
enti
na
Chile;
Cost
aR
ica;
Cypru
s;Is
rael;
Tri
nid
ad
and
Tobago;
Uru
guay;
Venezuela
,R
B
Table 11: Democracies and autocracies classified according to their levels of incomeand literacy, 1970
41

Low
literacy
rate
Mid
dle
literacy
rate
Hig
hliteracy
rate
Mean:
29.7
6;M
in:
7.9
5;M
ax:
47.5
5M
ean:
63.1
1;M
in:
48.1
8;M
ax:
76.2
7M
ean:
91.9
0;M
in:
79.4
3;M
ax:
99
Autocracie
sD
em
ocracie
sA
utocracie
sD
em
ocracie
sA
utocracie
sD
em
ocracie
sLow
incom
eB
angla
desh
;B
enin
;B
urk
ina
Faso
;B
u-
rundi;
Centr
al
Afr
ican
Republic;
Chad;
Congo,
Dem
.R
ep.;
Eth
iopia
;G
uin
ea-
Bis
sau;Lib
eri
a;M
ada-
gasc
ar;
Mala
wi;
Mali;
Mauri
tania
;M
ozam
-biq
ue;
Nepal;
Nig
er;
Pakis
tan;
Rw
anda;
Senegal;
Sudan;Togo
The
Gam
bia
;G
hana;
India
;N
igeri
a;U
ganda
Chin
a;
Com
oro
s;C
ongo,
Rep.;
Equato
-ri
alG
uin
ea;In
donesi
a;
Kenya;
Lao,
PD
R;
Leso
tho;
Syri
an
Ara
bR
epublic;
Tanzania
;Zam
bia
-M
ongolia
Sri
Lanka
Mid
dle
incom
eA
lgeri
a;
Cam
ero
on;
Djibouti
;Egypt,
Ara
bR
ep.;
Hait
i;Ir
aq;
Moro
cco;Tunis
ia
-B
olivia
;B
razil;
El
Salv
ador;
Guate
mala
;Ir
an,
Isla
mic
Rep.;
Jord
an;
Nic
ara
gua;
Sw
aziland
Bots
wana;
Dom
inic
an
Republic;
Hondura
s;Jam
aic
a;
Mala
ysi
a;
Mauri
tius;
Papua
New
Guin
ea;
South
Afr
ica;
Zim
babw
e
Chile;
Cuba;
Panam
a;
Para
guay;
Philip
pin
es;
Rom
ania
Colo
mbia
;C
ost
aR
ica;
Ecuador;
Fiji;
Peru
;T
hailand
Hig
hin
com
eO
man
-B
ahra
in;
Kuw
ait
;Q
ata
r;Saudi
Ara
bia
;U
nit
ed
Ara
bEm
irate
s
-A
rgenti
na;
Sin
gapore
;U
ruguay
Cypru
s;Is
rael;
Tri
nid
ad
and
To-
bago;
Venezuela
,R
B
Table 12: Democracies and autocracies classified according to their levels of incomeand literacy, 1980
42
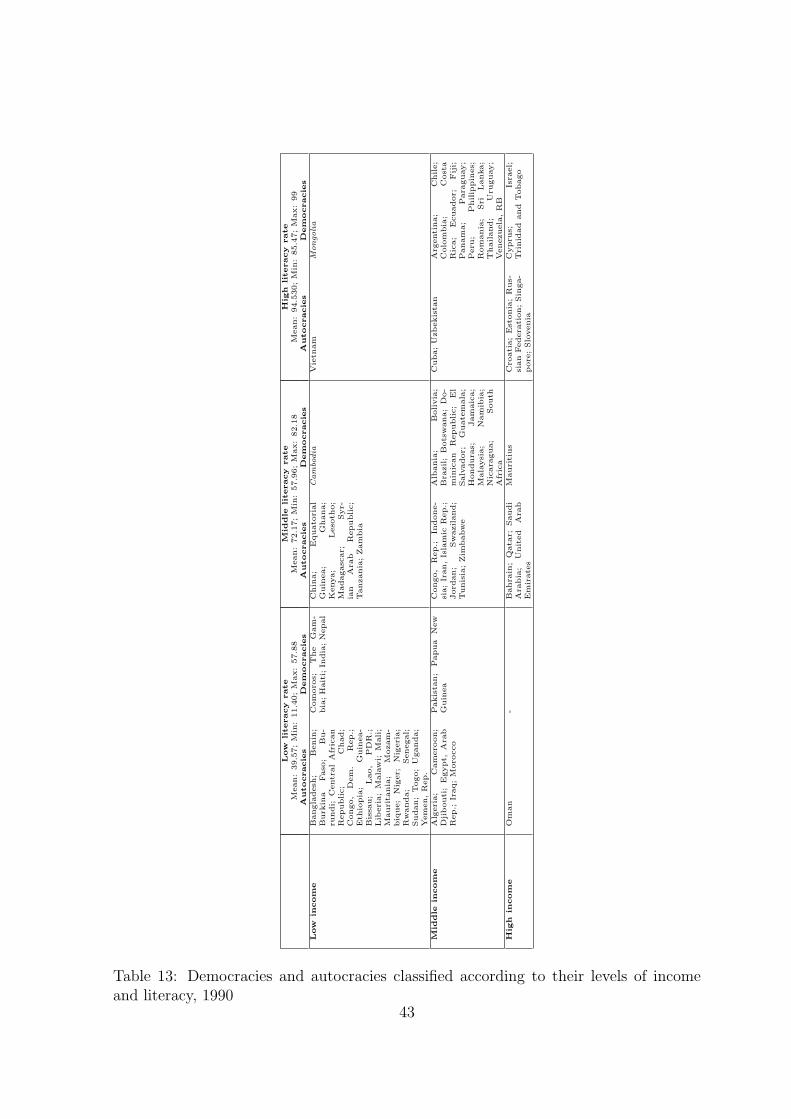
Low
literacy
rate
Mid
dle
literacy
rate
Hig
hliteracy
rate
Mean:
39.5
7;M
in:
11.4
0;M
ax:
57.8
8M
ean:
72.1
7;M
in:
57.9
6;M
ax:
82.1
8M
ean:
94.5
30;M
in:
85.4
7;M
ax:
99
Autocracie
sD
em
ocracie
sA
utocracie
sD
em
ocracie
sA
utocracie
sD
em
ocracie
sLow
incom
eB
angla
desh
;B
enin
;B
urk
ina
Faso
;B
u-
rundi;
Centr
al
Afr
ican
Republic;
Chad;
Congo,
Dem
.R
ep.;
Eth
iopia
;G
uin
ea-
Bis
sau;
Lao,
PD
R.;
Lib
eri
a;
Mala
wi;
Mali;
Mauri
tania
;M
ozam
-biq
ue;
Nig
er;
Nig
eri
a;
Rw
anda;
Senegal;
Sudan;
Togo;
Uganda;
Yem
en,R
ep.
Com
oro
s;T
he
Gam
-bia
;H
ait
i;In
dia
;N
epal
Chin
a;
Equato
rial
Guin
ea;
Ghana;
Kenya;
Leso
tho;
Madagasc
ar;
Syr-
ian
Ara
bR
epublic;
Tanzania
;Zam
bia
Cam
bodia
Vie
tnam
Mongolia
Mid
dle
incom
eA
lgeri
a;
Cam
ero
on;
Djibouti
;Egypt,
Ara
bR
ep.;
Iraq;M
oro
cco
Pakis
tan;
Papua
New
Guin
ea
Congo,
Rep.;
Indone-
sia;Ir
an,Is
lam
icR
ep.;
Jord
an;
Sw
aziland;
Tunis
ia;Zim
babw
e
Alb
ania
;B
olivia
;B
razil;
Bots
wana;
Do-
min
ican
Republic;
El
Salv
ador;
Guate
mala
;H
ondura
s;Jam
aic
a;
Mala
ysi
a;
Nam
ibia
;N
icara
gua;
South
Afr
ica
Cuba;U
zbekis
tan
Arg
enti
na;
Chile;
Colo
mbia
;C
ost
aR
ica;
Ecuador;
Fiji;
Panam
a;
Para
guay;
Peru
;Philip
pin
es;
Rom
ania
;Sri
Lanka;
Thailand;
Uru
guay;
Venezuela
,R
BH
igh
incom
eO
man
-B
ahra
in;
Qata
r;Saudi
Ara
bia
;U
nit
ed
Ara
bEm
irate
s
Mauri
tius
Cro
ati
a;
Est
onia
;R
us-
sian
Federa
tion;Sin
ga-
pore
;Slo
venia
Cypru
s;Is
rael;
Tri
nid
ad
and
Tobago
Table 13: Democracies and autocracies classified according to their levels of incomeand literacy, 1990
43

Low
literacy
rate
Mid
dle
literacy
rate
Hig
hliteracy
rate
Mean:
49.7
4;M
in:
15.9
6;M
ax:
67.0
3M
ean:
80.0
3;M
in:
68.0
1;M
ax:
88.6
7M
ean:
96.2
7;M
in:
89.8
1389;M
ax:
99
Autocracie
sD
em
ocracie
sA
utocracie
sD
em
ocracie
sA
utocracie
sD
em
ocracie
sLow
incom
eB
urk
ina
Faso
;B
u-
rundi;
Chad;C
om
oro
s;C
ongo,
Dem
.R
ep.;
Eri
trea;
The
Gam
bia
;H
ait
i;Lao,
PD
R;
Lib
eri
a;
Mauri
tania
;M
ozam
biq
ue;
Rw
anda;
Sudan;
Togo;
Uganda;
Yem
en,R
ep.
Bangla
desh
;B
enin
;C
entr
al
Afr
ican
Re-
public;
Eth
iopia
;G
uin
ea-B
issa
u;
Mada-
gasc
ar;
Mala
wi;
Mali;
Mozam
biq
ue;
Nepal;
Nig
er;
Nig
eri
a;Senegal
Congo,
Rep.;
Kenya;
Syri
an
Ara
bR
epublic
Cam
bodia
;G
hana;
Hondura
s;Leso
tho;
Tanzania
;Zam
bia
Tajikis
tan;V
ietn
am
Mold
ova;M
ongolia
Mid
dle
incom
eA
lgeri
a;
Egypt,
Ara
bR
ep.;
Iraq;
Moro
cco;
Pakis
tan
Djibouti
;In
dia
;N
icara
gua;Papua
New
Guin
ea
Cam
ero
on;
Chin
a;
Equato
rial
Guin
ea;
Lib
ya;
Sw
aziland;
Tunis
ia;Zim
babw
e
Alb
ania
;B
olivia
;B
ots
wana;
Bra
zil;
Do-
min
ican
Republic;
El
Salv
ador;
Guate
mala
;In
donesi
a;
Iran,
Is-
lam
icR
ep.;
Jam
aic
a;
Nam
ibia
;South
Afr
ica
Bela
rus;
Cuba;
Jor-
dan;
Kazakhst
an;
Uzbekis
tan
Arm
enia
;B
ulg
ari
a;
Colo
mbia
;C
ost
aR
ica;
Ecuador;
Fiji;
Guyana;
Latv
ia;
Lit
huania
;Panam
a;
Para
guay;
Philip
pin
es;
Rom
ania
;R
uss
ian
Federa
tion;
Sri
Lanka;
Thailand;
Ukra
ine;
Venezuela
,R
BH
igh
incom
e-
-B
ahra
in;
Kuw
ait
;O
man;
Qata
r;Saudi
Ara
bia
;U
nit
ed
Ara
bEm
irate
s
Mala
ysi
a;M
auri
tius
Gabon
Arg
enti
an;
Chile;
Cypru
s;Est
onia
;Is
rael;
Slo
venia
;Tri
nid
ad
and
Tobago;
Uru
guay
Table 14: Democracies and autocracies classified according to their levels of incomeand literacy, 2000
44