pontificia universidad católica del perú - core · pdf filepontificia...
TRANSCRIPT

PONTIFICIA UNIVERSIDAD CATÓLICA DEL PERÚ
ESCUELA DE POSGRADO
3D UPDATING OF SOLID MODELS BASED ON LOCAL
GEOMETRICAL MESHES APPLIED TO THE RECONSTRUCTION OF
ANCIENT MONUMENTAL STRUCTURES
By
José Fernando Zvietcovich Zegarra
Thesis submitted in partial fulfillment of the requirements for the degree of
Master in Digital Signal and Image Processing
in the Graduate School of the Pontificia Universidad Católica del Perú.
Thesis Supervisor: Benjamín Castaneda Aphan, Ph.D.
Renato Perucchio, Ph.D.
Examining committee members:
Paul A. Rodriguez Ph.D.
Rafael Aguilar Ph.D.
Lima, Perú
June, 2014

Abstract
We introduce a novel methodology for locally updating an existing 3D solid model of a
complex monumental structure with the geometric information provided by a 3D mesh
(point cloud) extracted from the digital survey of a specific sector of a monument. Solid
models are fundamental for engineering analysis and conservation of monumental
structures of the cultural heritage. Finite elements analysis (FEA), the most versatile and
commonly used tool for the numerical simulation of the static and dynamic response of
large structures, requires 3D solids which accurately represent the outside as well as the
inside geometry and topology of the domain to be analyzed. However, the structural
changes introduced during the lifetime of the monument and the damage caused by
anthropogenic and natural factors contribute to producing complex geometrical
configurations that may not be generated with the desired accuracy in standard CAD solid
modeling software. On the other hand, the development of digital techniques for
surveying historical buildings and cultural monuments, such as laser scanning and
photogrammetric reconstruction, has made possible the creation of accurate 3D mesh
models describing the geometry of those structures for multiple applications in heritage
documentation, preservation, and archaeological interpretations.
The proposed methodology consists of a series of procedures which utilize image
processing, computer vision, and computational geometry algorithms operating on
entities defined in the Solid Modeling space and the Mesh space. The operand solid
model is defined as the existing solid model to be updated. The 3D mesh model
containing new surface information is first aligned to the operand solid model via 3D
registration and, subsequently, segmented and converted to a provisional solid model
incorporating the features to be added or subtracted. Finally, provisional and operand
models are combined and data is transferred through regularized Boolean operations
performed in a standard CAD environment.
We test the procedure on the Main Platform of the Huaca de la Luna, Trujillo, Peru, one
of the most important massive earthen structures of the Moche civilization. Solid models
are defined in AutoCAD while 3D meshes are recorded with a Faro Focus laser scanner.
The results indicate that the proposed methodology is effective at transferring complex
geometrical and topological features from the mesh to the solid modeling space. The
methodology preserves, as much as possible, the initial accuracy of meshes on the
geometry of the resultant solid model which would be highly difficult and time
consuming using manual approaches.
Contents
1 Introduction .....................................................................................................................1
1.1 Research Aims .........................................................................................................3
2 Case Study: Huaca de la Luna (Perú) ...........................................................................5
2.1 Site Description .......................................................................................................5
2.2 Data Collection: 3D Reconstruction .......................................................................6
2.2.1 3D Solid Modeling .........................................................................................6
2.2.2 3D Mesh Modeling .......................................................................................7
3 Definitions and Theoretical Development ....................................................................9
3.1 Geometrical Spaces ................................................................................................9
3.1.1 Solid Modeling Space ................................................................................9
3.1.2 Mesh Space ...............................................................................................10
3.2 Operators ..............................................................................................................10
3.2.1 Intra-domain Operators ...............................................................................10
3.2.2 Inter-domain Operators ...............................................................................11
3.2.2.1 Solid-to-Mesh Operator ...............................................................11
3.2.2.1 Mesh-to-Solid Operator ...............................................................12
4 Design of 3D the Updating Procedure .........................................................................13
4.1 3D Loading Procedure ..........................................................................................14
4.2 Conversion from Solid Model to Mesh Model .....................................................14
4.3 Rigid Registration Procedure ...............................................................................15
4.3.1 Line Feature Extraction ...............................................................................15
4.3.2 Feature Matching ........................................................................................17
4.3.3 Transformation Procedure ...........................................................................17
4.4 Distance Function Calculation .............................................................................18
4.5 Segmentation ........................................................................................................19
4.6 Feature Formation ................................................................................................24
4.6.1 Border Extraction ........................................................................................24
4.6.2 Covering Surface Formation .......................................................................25
4.6.3 Feature Encapsulation .................................................................................25
4.7 Conversion from Mesh to Solid Model ................................................................25
4.8 Boolean Operations ..............................................................................................26

5 Applications and Results ..............................................................................................27
5.1 3D Solid Updating Using One Layer of the Monument .......................................27
5.2 3D Solid Updating Using Various Layers of the Monument ...............................33
5.3 Discussion ............................................................................................................33
6 Conclusions ....................................................................................................................35
Bibliography ....................................................................................................................36

List of Figures
1.1. Solid model of Huaca de la Luna. The monument is located at the foot of the Cerro
Blanco Mountain in the city of Trujillo in the north coast of Perú. ..............................3
2.1. Huaca de la Luna internal structure: (a) location of North-South section, (b) internal
section - cut along red line in (a) - showing internal superposition of at least six
building stages (A, B/C, D, E and F). Figure (b) is taken from [16] .............................6
2.2. Laser-scanned areas in Main Platform of Huaca de la Luna: (a) location of areas 1
(altar), 2 (decorated façade), 3 (Unit 16) and 4 (Hypostyle Hall); corresponding point
clouds: (b) altar, (c) decorated façade, (d) Unit 16, and (e) Hypostyle Hall. Point
clouds preserve actual scale of scanned areas and contain texture information attached
to each point. ................................................................................................................8
3.1. Regularized Boolean operations between solids in CAD environment. S1 and S2
represent a cube and a sphere, respectively: (a), (b), (c) and (d) show the resultant
solids after applying operations S1 S2, S1 S2, S1 S2 and S1 S2. ...........................10
3.2. Three-level structure for 3D meshes: level 1 contains Cartesian coordinates of points
(point clouds); level 2 consists of straight-line edges formed by two points at level 1;
level 3 holds triangular faces formed by three edges in level 2; normal vectors are
calculated in each face from available topological information. ...............................11
3.3. 3D mesh pathological cases: (a) regular mesh, (b) unreferenced points, (c) dangling
edges (edges not belonging to triangular face), (d) gap (surface discontinuity), (e)
self-intersecting faces; and (f) dangling sections. .......................................................12
4.1. Flow chart of proposed methodology: elements (meshes and solids) and their
transformations represented by letters next to the arrows while operations denoted by
blocks. Numbers in the top left corner of each block indicate flow direction. ............13
4.2. Operations on altar model: (a) solid model S, (b) transformation of S to mesh
representation MS, (c) mesh model M obtained by Faro Focus laser scanner
corresponding to the current structural state of altar. ..................................................14
4.3. Figure 4.3: Plane feature extraction from mesh models M and MS
representing altar:
(a) and (d) represents Gauss maps of both M and MS, indicating normal directions of
each mesh point (colors represent confidence ratios); (b) and (e) correspond to
clusters of planes identified in Gauss map (a) and (d); finally, (c) and (f) illustrate
plane surfaces detected in M and MS, based on identified clusters. ............................16
4.4. Registration procedure. (a) Aligned models M* and M
S after calculating the best
transformation . (b) Convergence graphic of the algorithm for l=0.1, l=10,
l=100. .........................................................................................................................19
4.5. Distance function calculation of mesh model M: (a) color distance map calculated by
measuring Euclidean distances between MS
and M, (b) histogram of calculated
distances. .....................................................................................................................21
4.6. Behavior of a 3D contour on a mesh. (a) Adjacent points of will define a local
coordinate system which will be projected on a plane in (b) formed by the vectors
and . The mentioned plane is formed by the point and its normal vector . (c)
The set of neighboring points of define the set of movement vectors .
The total force vector has an orientation close to which is represented with
discontinuous line. .......................................................................................................22

4.7. Segmentation procedure applied over the mesh model using a 3D discrete
contour. (a) External force function (Equation 4.19) for various values of . (b)
Histogram of the calculated values of the external force. (c) Colorized external force
displayed over the mesh ( ). (d) - (g) Contour evolution from
its initial configuration set by the user. (h) Segmented sector from . ..............23
4.8. Feature formation and conversion from mesh to solid model of segmented part of the
altar : (a) border extraction (blue line), (b) surface c o v e r formation, (c) feature
encapsulation, and (d) conversion from mesh to solid model
. .....................24
4.9. Regularized Boolean difference on altar model (AutoCad): (a) initial solid model S
and solid feature registered in the Solid Modeling Space, (b) final result after
applying Boolean operation H = S . .....................................................................26
5.1. Plane feature extraction from mesh models M and representing the North façade
of the monument: (a) and (b) represents Gauss maps of both M and , indicating
normal directions of each mesh point (colors represent confidence ratios); (c) and
(d) correspond histograms of confidence ratios of both meshes; finally, (e) and (f)
illustrate plane surfaces detected in M and , based on identified clusters. ..........28
5.2. Registration of meshes M1*
(from laser scanner) and (from solid model of the
entire monument) describing the North façade of Huaca de la Luna. .......................29
5.3. Mesh models of selected areas of Huaca de la Luna and corresponding solid features:
decorated façade - mesh M1 (a) and corresponding solid feature
(b), Unit 16 -
mesh M2 (c) and corresponding solid feature (d); and Hypostyle Hall - mesh M3
(e) and corresponding solid feature (f). ...............................................................30
5.4. Registration of features ,
, and and Huaca de la Luna model S in solid space
(AutoCad). ..................................................................................................................31
5.5. (a) Updated solid model resulting from applying regularized Boolean difference
between ,
, and and S: (b), (c) and (d) the updated areas of decorated
façade, Unit 16, and Hypostyle Hall, respectively. ....................................................32
5.6. Decorated façade: (a) detail of solid model of Huaca de la Luna updated taking into
account three structural layers: A, B/C, and D, and (b) actual state. ..........................32
5.7. Mesh model obtained from the updated solid model of the entire monument in sectors
(a) North façade, (b) Unit 16, and (c) Hypostyle Hall. ...............................................34

List of Tables
2.1. Resolution of point clouds for each case study and the computational time required
for the re-processing methodology which was interactively done in Meshlab by a
user. ..............................................................................................................................7
5.1. Resolution of meshes for each case study and the computational time required for the
proposed methodology during the updating procedure. Pre-processing stage, which
was interactively done in Meshlab by a user, is also considered in the assessment of
time. The computer is equipped with an 8-core Intel i7 processor at 3.40 Ghz, and 8
GB of RAM. ............................................................................................................... 33

1
Chapter 1
Introduction
The development of digital techniques for surveying historical buildings and cultural
monuments has made possible the creation of accurate 3D models describing the
geometry of those structures for multiple applications in heritage documentation,
preservation, and archaeological interpretations [1,2], including accurate 3D databases
with topological, geometrical and texture information, and virtual reality environments
[3,4]. Time-of-flight 3D laser scanning devices are able to record the position of millions
of points describing the geometrical surface of monumental buildings and large structures
[5]. Photogrammetric reconstruction methods record the same geometrical information by
applying dense stereo reconstruction algorithms on a set of unordered images describing
the target object [6]. At the same time, computer-aided design (CAD) solid modeling
procedures developed in the context of modern mechanical and civil engineering
applications have been used successfully to reconstruct the solid geometry of complex
monumental structures for engineering analysis [7,8]. Although serving similar purposes,
laser scanning and photogrammetry differ substantially from solid modeling CAD
techniques both in their algorithmic structure and in the type of 3D reconstructions they
provide. The first two are highly automatic procedures which provide a geometrical
approximation to the boundary surface of the structure in the form of dense 3D point
clouds and 2D meshes containing millions of triangles. In contrast, CAD procedures are
predicated on user interactive control, consisting in defining primitive geometrical entities
(points, lines, surfaces, solids), positioning these into a three-dimensional space, and
finally assigning controlling parameters to combine primitive entities into complex solids.
Furthermore, CAD solid models are geometrical exact representation of 3D domains from
which approximate representations can be extracted according to specific engineering
needs (e.g., structural analysis, construction sequencing, etc.).
Solid models are fundamental for engineering analysis of monumental structures. Finite
Elements Analysis (FEA), the most versatile and commonly used tool for the numerical
simulation of the static and dynamic response of large structures, requires 3D solid
meshes accurately representing the outside as well as the inside geometry and topology of
the domain to be analyzed. When dealing with complex configurations, FEA 3D meshes
can only be constructed by operating on CAD solid models [7]. As recently shown in [8],
similar requirements apply in order to perform Computational Fluid Dynamic Analysis
(CFDA) to estimate the temperature distribution in a reconstructed archaeological
structure. Since FEA 3D meshes inherit their validity and accuracy from the solid model,
the possibility of performing engineering analysis is predicated on the existence of a solid
model representation. Therefore, in general, 3D mesh models generated by laser scanners
or photogrammetric reconstructions cannot be used for a direct application in engineering
structural analysis because they do not define a complete solid. However, since they
provide detailed and accurate representations of visible surfaces, 3D meshes can be used

2
effectively to document the current state of a monumental structure beyond what is
generally feasible with a standard CAD reconstruction.
Besides supporting engineering analysis, the parametric structure of CAD solid models
offers additional advantages in the representation of historical buildings and monumental
structures. Features in solid models are created using libraries of primitive geometrical
entities, each supported by a mathematical formula. Thus, complex 3D solid models can
be edited locally without having to reconstruct the entire model; detailed architectural
features can be introduced without using dense data, and accurate dimensional
measurement can be easily extracted for various applications [8]. On the other hand, the
creation of irregular curves and shapes in a CAD program can be exceedingly
complicated or even impossible due to limitations in the mathematical formulations
available in the libraries of primitives [8]. For example, structural alterations commonly
found in archaeological structures, such as fractures, perforations, and breaches caused by
anthropogenic and natural factors, may not be easily inserted in the CAD solid models of
the monument. To solve this problem, a procedure capable of updating an existing 3D
solid model of a historical monument with local detailed information of its current
physical state is needed.
Some attempts have been made in the context of adapting 3D solid modeling to digital
heritage applications. Russo and Guidi [9] developed a critical analysis of the importance
of having a detailed 3D mesh model which describes a monument as is, and a 3D solid
model of the reconstruction of non-existing parts of the monument. Here, the creation of
the solid model was done interactively in a CAD software using information from a
topographic survey and historical sources. Then, Vilbrandt et al. [10] introduced a
constructive modeling approach to generate solid models of an archaeological object
based on automatically fitting a parameterized model interactively constructed to a point
cloud representation of the object. Cheng [11] proposed the use of reverse engineering
software, Rapidform (INUS Technology) [12], in order to recreate a solid model of a
monument from a point cloud representation produced by a laser scanner. Boulaassal et
al. [13] developed a procedure for the creation of 3D parametric models of architectural
façades from point clouds. Here, automatically extracted architectural components such
as walls and openings were used for the creation of a parametric model of the façade in
Maya embedded language (Autodesk) [14]. Finally, Guidi et al. [15] developed a
methodology in which they extract planar sections of the 3D point-based model of a
monument as starting elements of its 3D polygonal reconstruction in an interactive
fashion. Then, an iterative procedure refines the initial polygonal model with geometrical
details from the point clouds and archaeological.
The procedures described in [9, 10, 11, 15] imply the creation of the solids and polygonal
meshes manually in CAD software. That is, they have to manually define planes,
columns, lines, and primitives in order recreate the monument which is time consuming,
requires a specialist in the use of a particular CAD modeler and, in some cases, it is even
impossible to do for complex irregular structures. More importantly, the proposed
methodologies do not address the problem of updating an existing solid model of
monuments with information provided by meshes (or point clouds) representing
accurately complex surfaces which describe its recent structural state. This is of special
importance when it is desired a high geometric resolution in certain areas of a model

3
rather than other ones. For instance, for applications of FEA, areas of monuments with
high irregularity and complexity are required to be represented in much more resolution
than areas that can be well represented with planes, cylinders and simple architectural
features.
A procedure for updating solid models of complex monumental structures with
information of point clouds and meshes is needed. This procedure must require the
minimum intervention of an specialist, be less time consuming than the reported
literature, and allow the user to decide the geometrical resolution in which areas of the
monument is represented.
1.1. Research Aims
In the present thesis work, we introduce a novel methodology for updating an existing
solid model with information from a local mesh data utilizing image processing,
computer vision, and computational geometry algorithms. The modified solid model can
be uploaded and operated upon in any standard CAD platform and, as such, can be used
for FEA and augmented reality applications. In order to develop and test the
methodology, we focus on the Main Platform of Huaca de la Luna, Trujillo, Perú, one of
the best-preserved and most intensively studied massive earthen structures of the Moche
civilization. A 3D solid model of the monument is shown in Figure 1.1.
The specific objectives are:
- To provide formal mathematical definitions and properties of the domains where
the geometric 3D models can be represented: the Solid Modeling space and the
Mesh space.
Figure 1.1: Solid model of Huaca de la Luna. The monument is located at the foot of the
Cerro Blanco Mountain in the city of Trujillo in the north coast of Perú.

4
- To create a computational methodology containing operators and procedures
needed to update a 3D solid model with the information extracted from 3D
meshes.
- To test the entire methodology on real data from the Huaca de la Luna.
The thesis is distributed as follows: Chapter 2 provides historical, archaeological and
architectural information of the case study: Huaca de la Luna, and the description of the
3D reconstruction methods and the equipment used for this purpose. Chapter 3 establishes
the theoretical definitions of spaces and operators in which solid models and mesh models
are supported. Chapter 4 describes the methodology proposed for the updating of solid
models using meshes in eight stages. Here, the model of a small temple of Huaca de la
Luna is used for the explanation in each stage. Finally, Chapter 5 provides information of
the experiments performed in four sectors of the monument. The proposed methodology
is tested in two different situations in which the solid model of the monument is
considered as a single model and as an assembly of various models. Conclusions and
recommendations of the entire work are reported in this Chapter 6.

5
Chapter 2
Case Study: Huaca de la Luna
(Perú)
In this section, we provide a historical and archaeological description of the monument
Huaca de la Luna, as well as the protocols for its 3D reconstruction in the Solid
Modeling Space and Mesh Space . This space supports geometric elements called
solid models and mesh models, respectively, and the operations between them. A detailed
formulation of these spaces, operators, and requirements for transferring models from one
space to another is described in Chapter 3.
2.1. Site Description
The complex Huaca de la Luna is one of the best-preserved and most intensively studied
massive earthen structures of the Moche civilization located in the city of Trujillo in the
north coast of Perú. The monument, constructed roughly between the years 200 and 850
AD at the foot of the Cerro Blanco Mountain, is considered a political and ceremonial
center of the Moche Society [16].
As depicted in Figure 1.1, Huaca de la Luna is formed by three main platforms and four
plazas made of adobe bricks and mud mortar. The platform I is known as the Main
Platform and it is located between platform II and the Ceremonial Plaza. Due to its size,
location and characteristics, the Main Platform is the area where the work of Huacas del
Sol y de la Luna Archaeological Project is mostly concentrated. A particular feature of
this platform of major interest for the study of the monument is its multilayered
construction method, consisting in the superposition of at least six building stages
constructed one on the top of the other over approximately 500 years [16]. To add a new
layer, the previous building was ceremonially buried by filling empty spaces with adobe
blocks and constructing a new building on top of it. Openings, walls and a new façade
were added, allowing the expansion of the monument in width and height. Figure 2.1a
shows the location of the transversal cut from north to south resulting in the planar profile
section illustrated in Figure 2.1b. This profile shows the known six structural layers
labeled A to F, in which A constitutes the last (most recent) building, and F, the oldest
known to date [16]. Architectural features and pictorial representations distinguish one
layer from the other. In particular, the north façade located in front of the Ceremonial
Plaza is profusely decorated with polychrome reliefs in each building stage.
Figure 2.2a shows an idealized model of building A created using data from a standard
topographic survey of the existing monument augmented by conjectural integrations.

6
This model with those from Figures 2.1 and 1.1, were created as part of the
archaeological survey and documentation effort. It is apparent that the current structural
state of the monument differs substantially from these idealized representations.
Damages, often involving the destruction of sizable portions of the structure, have been
caused by catastrophic rains due to El Niño Phenomenon, earthquakes, and systematic
looting. Even archaeological excavations have substantially altered the monument. Figure
2.2.b depicts damage in the top part of the altar produced by natural factors while Figure
2.2.c illustrates a mayor breach caused by looters that cuts across the upper part of the
decorated façade.
2.2. Data Collection: 3D Reconstruction
The following two sections describe the field work related to data collection and model
reconstruction. The first addresses the construction of four idealized solid models
representing the Main Platform in its four stages A, B/C, D, while the second explains the
procedure utilized to create 3D mesh models representing the current structural
configuration of four selected sectors of the monument using a time-of-flight laser
scanner.
2.2.1. 3D Solid Modeling
The solid modeling reconstruction was independently done by the staff of the Huacas del
Sol y de la Luna Archaeological Project between the years 2002 and 2004. The models
were constructed using the CAD commercial software AutoCad (Autodesk) [17] in a
computer system Pentium 4 running Microsoft Windows XP. Data were collected
through a topographic survey of the layers A, B/C, and D. The existence of large breaches
and cracks allowed archaeologist to access the internal layers. The areas in which the
information was missing were reconstructed by extrapolating features from similar
structures in other layers of the same monument. Four 3D solid models were created,
each of them representing the entire monument using only the information of a particular
layer. We denote with SA, S
B, S
C, S
D the solid models representing the monument
using information of layers A, B, C, and D, respectively. In order to simplify notations,
we assign S1= S
A and S
2 = S
A S
B S
C S
D. Thus, S
1 defines the monument with
(a) (b)
Figure 2.1: Huaca de la Luna internal structure: (a) location of North-South section, (b)
internal section - cut along red line in (a) - showing internal superposition of at least six
building stages (A, B/C, D, E and F). Figure (b) is taken from [16].

7
information pertaining to the last (most recent) layer, and S2 is a solid model formed by
the superposition and assembly of models representing the last four consecutive layers.
Notice that, S2 preserves its internal boundaries between layers.
2.2.2. 3D Mesh Modeling
Four sectors of the Main Platform are selected to be surveyed using a time-of-flight laser
scanner as depicted in Figure 2.2a. The first consists of a small altar located in the
southwest corner of the platform I (Figure 2.2b). The second represents the breach in the
decorated façade located in front of the Ceremonial Plaza (Figure 2.2c). The third and
fourth sectors are also on the platform I. The third consists of a complex formed by a
group of walls and columns called Unit 16 (Figure 2.2d) while the fourth is the Hypostyle
Hall located in the north of Unit 16 (Figure 2.2e).
The reconstruction was performed with a portable Faro Focus 3D laser scanner (Faro
Technologies) [18]. This scanner reconstructs surfaces with an acquisition rate of 976,000
points/sec, an accuracy of ± 2mm, a scanning range from 0.6m up to 330m, and a field of
view of 300° vertical and 360° horizontal. It also allows attaching colors to the point
cloud with a resolution up to 70 megapixels. The scanning strategy was to use different
scans around each sector in order to produce overlapping areas between them.
Subsequently, a pre-processing procedure was applied over the 3D clouds for the
alignment and the mesh generation. To this end, we utilized the open source software
Meshlab (Visual Computing Lab – ISTI – CNR) [19] in a computer system equipped with
an 8-core Intel i7 processor at 3.40 Ghz, 8 GB of RAM and a ADM Radeon HD 7470
with 512 MB RAM graphics card running Microsoft Windows 7 64-bit. The pre-
processing steps are described as follows:
- We use a point-based rigid registration for the first alignment estimation. This
implies the placing of common features manually in all point clouds.
- We refine the previous alignment using the Iterative Closed Point approach [20]
of the combination of all point clouds.
- We then eliminated manually the areas of the 3D point clouds that were not of
our interest.
- We utilized the Poisson Surface Reconstruction algorithm [21] for the creation of
a regular mesh based on the aligned and cleaned point clouds.
Table 2.1: Resolution of point clouds for each case study and the computational time
required for the re-processing methodology which was interactively done in Meshlab by
a user.
Number of
clouds
Time consumed by an user during the procedure (minutes)
Point-based registration
Iterative Closed Points
Cleaning Poisson Surface
Reconstruction
Total time
Altar 5 25.3 1.1 2 0.2 28.6 North façade 12 60.8 6.6 10 0.6 78.0 Unit 16 9 45.4 3.6 6 5.2 60.2 Hypostyle Hall 8 40.9 2.8 5 6.1 54.8

8
The time required for developing these procedures is detailed in Table 2.1. As a
conclusion of the pre-processing step, we obtained four triangle-based mesh models of
the digitized areas of the monument. We call M the mesh model of the small altar,
and {M1, M
2, M
3} those of the breach in the decorated façade, Unit 16, and the
Hypostyle Hall, respectively.
(a)
(b) (c)
(d) (e)
Figure 2.2: Laser-scanned areas in Main Platform of Huaca de la Luna: (a) location of
areas 1 (altar), 2 (decorated façade), 3 (Unit 16) and 4 (Hypostyle Hall); corresponding
point clouds: (b) altar, (c) decorated façade, (d) Unit 16, and (e) Hypostyle Hall. Point
clouds preserve actual scale of scanned areas and contain texture information attached to
each point.

9
Chapter 3
Definitions and Theoretical
Development
In this section, we develop theoretical definitions of the solid and mesh models, and the
properties of the geometrical spaces which support them. We also provide information
about the operator, and their domains of action within a space and between spaces. We
finish the explanation with a formalization of the requirements of meshes to be converted
in solid models, and vice versa.
3.1. Geometrical Spaces
We define a space as a mathematical domain in which certain types of geometrical
entities are supported. The conditions needed for a space to exist are the following:
- It must support the representation of certain types of geometrical and
topological information,
- It must support operations between elements belonging to this space.
For the purpose of the present research, only the Solid Modeling space and the Mesh
space need to be defined.
3.1.1. Solid Modeling Space
This space supports geometric elements called solid models and the operations between
them. A solid model contains geometric and topological information, and it is defined
mathematically as a point set S in the 3D Euclidean space R3 such that
S=iS bS (3.1)
where iS indicates the interior point set, bS the boundary set, and U denotes the
regularized union operation between sets [22]. Mathematically, to represent a solid, a
point set S has to satisfy the following condition: for each point p S, its neighborhood
defined as an open ball centered in p has to be three-dimensional (R3). Points of the
neighborhood with less dimensionality mean lack of solidity [22]. Hereafter, we denote
the Solid Modeling space as . Because of the constructive definition, solid models are
well bounded, that is, their boundary surface is always correctly defined in geometrical
and topological terms. The Solid Modeling space supports the following regularized
Boolean operations (Shapiro, 2012) between solid models: addition (U), intersection ( ),
difference ( ) and assembly ( ). The results of these operations are also elements of ,
i.e., if (S1, S2 ), the results S3=S1 S2, S4=S1 S2, S5=S1 S2 and S6=S1 S2 will be also
solid models, i.e., {S3, S4, S5, S6} . Figure 3.1 illustrates these cases.

10
(a) (b) (c) (d)
Figure 3.1: Regularized Boolean operations between solids in CAD environment. S1 and
S2 represent a cube and a sphere, respectively: (a), (b), (c) and (d) show the resultant
solids after applying operations S1 S2, S1 S2, S1 S2 and S1 S2.
3.1.2. Mesh Space
This space supports elements called 3D meshes and point clouds, and the operations
between them. A mesh consists of a geometrical representation formed by a collection of
vertices, edges and triangular faces connected by a three-level data structure. The first
level is occupied by vertices representing the location of points in R3. The second level
contains edges formed by a straight-line segment connecting two vertices. Finally, the
third level is occupied by triangular faces formed by the edges belonging to the second
level [23]. It is always possible to compute the normal vector of a face by calculating the
cross product between two edges of the face being analyzed. The three-level structure and
the normal vector field computation are illustrated in Figure 3.2.
Point clouds are structures formed only by the elements on the first level of the data
structure. Thus, point clouds are a subset of meshes. The majority of commercial time-of-
flight 3D laser scanners computes only point clouds of the target being reconstructed and
a post-processing procedure is required to generate a 3D mesh from the initial point
cloud. The only mathematical requirement for an entity to be a 3D mesh consists in the
existence of the three levels in the model representation. This definition is loose since it
can support a variety of meshes that do not represent a continuous, not-self intersecting
surface in 3D (see Figure 3.3). Hereafter, we denoted the Mesh space as .
For instance, the space supports operators such as Rotation (Rot), Translation (Trs)
and Scale Transformation (Scl). Thus, if S1 , the results S2=Rot(S1), S3=Trs(S1) and
S4=Scl(S1) will be also meshes, i.e., {S2, S3, S4} .
3.2. Operators
An operator is a function in which one or more elements of a given space are transformed
into one or more elements of the same or another space. Thus, we distinguish between
intra-domain operators that work in a single space and inter-domain operators that
transform elements from one space to another.
3.2.1. Intra-domain Operators
Examples of this class are the regularized Boolean operators (in the Solid Modeling
space) and rotation, translation and scale transformation (in the Mesh space).

11
Figure 3.2: Three-level structure for 3D meshes: level 1 contains Cartesian coordinates of
points (point clouds); level 2 consists of straight-line edges formed by two points at level
1; level 3 holds triangular faces formed by three edges in level 2; normal vectors are
calculated in each face from available topological information.
Notation:
- Case 1: F(x), x and F(x) . Then F is an intra-operator.
- Case 2: G(x), x and G(x) . Then G is an intra-operator.
3.2.2. Inter-domain Operators
These operators associate an element from one space to an element in a different space. In
the particular case of and , there exist two types of inter-operators.
3.2.2.1. Solid-to-Mesh Operator
This operator extracts a 3D mesh from a solid model. Since a solid model is always
comprised of the interior point set and the boundary point set, it is always possible to
convert a solid model to a mesh model. In this case, the mesh constitutes a discretization
of the boundary of the solid. During this procedure, however, the element may loose
geometric and topological information concerning the boundary faces. Similarly, all the
internal features are lost. Thus, the solid-to-mesh operator is always possible, but the
inverse operation may yield a reconstructed solid that differs from the original one due to
the loss of geometrical and topological information.
The notation of this operator is as follows:
F(x), x and F(x) . Then F is a solid-to-mesh operator.

12
(a) (b) (c)
(d) (e) (f)
Figure 3.3: 3D mesh pathological cases: (a) regular mesh, (b) unreferenced points, (c)
dangling edges (edges not belonging to triangular face), (d) gap (surface discontinuity),
(e) self-intersecting faces; and (f) dangling sections.
3.2.2.2. Mesh-to-Solid Operator
As it was defined earlier, a 3D mesh is composed of a structured collection of vertices,
edges and faces. Meshes only contain surface information and, therefore, it is necessary to
attach extra information in order to covert a mesh into a solid representation. Furthermore,
the following conditions apply:
There must not exist duplicate, overlapping and intersecting faces.
There must not exist vertices that do not belong to a triangle (unreferenced vertices).
The normal vector field of the mesh has to be properly defined: all normal vectors
must point outside (or inside) the region being enclosed by the mesh surface.
The mesh must be properly closed (manifold): each edge of the mesh must be
shared by two triangular faces only.
We denote 1 the regular mesh subspace ( 1 ) that supports meshes that satisfy all
of the above conditions. Only elements of 1 can be transformed into a solid. The output
data consists of a solid model formed by an internal part and a boundary. The notation of
this operator is described as follows:
F(x), x and F(x) , is a valid mesh to solid operator if and only if x 1.
The output meshes from the majority of laser scanners and photogrammetric
reconstructions does not satisfy the conditions described above. In Chapter 4, we propose
a methodology in which this problem is addressed in a series of stages in order to convert
meshes to solids.

13
Chapter 4
Design of the 3D Updating
Procedure
In this section, we describe the proposed solid updating approach, articulated in eight
stages as illustrated in the flowchart in Figure 4.1. Therein, letters next to the arrows
denote the elements and their transformations while blocks indicate the operations. The
flow direction follows the numbers in the top left corner of each block. Procedures 1, 2,
and 8 are developed in the CAD software AutoCad [17] and the algorithms associated
with procedures 3 to 7 are implemented in Matlab 2011a [24].
We follow the entire procedure using the altar illustrated in Figure 2.2b as a test case. The
solid model S and the mesh model of the altar M , depicted in Figure 4.2a and
Figure 4.2c respectively, represent semantically the same architectural features, albeit in
two different conditions: idealized, the former, and in its present state, the latter. Notice
that the mesh model contains cavities on top of the staircase due to the deterioration of
the structure that are not present in the solid model. In the flowchart in Figure 4.1, H
is the updated solid model of the altar that incorporates the new geometric information
which represents the structural deterioration. The sets S and M correspond to the data
inputs to the procedure while H denotes its output.
4.1. 3D Loading Procedure
The loading operation stores the 3D descriptions of the structure in the correct spaces and
formats: the mesh M and the solid S , where M represents the current state of the
surface and S describes a conceptual CAD reconstruction, including relevant internal
features. This operator is able to load mesh models coming from any acquisition
technique such as laser-based or image-based reconstructions. The selected file formats
for M and S are the Wavefront OBJ file and the Standard ACIS Text (SAT) file,
respectively. The size of meshes ranges from 25 MB to 1Gb; then a computer with Intel
i7 processor with 8GB to 16GB of RAM memory is recommended for the processing of
models.
4.2. Conversion from Solid Model to Mesh Model
This operation transforms the solid model S into a 3D mesh MS by applying a
solid-to-mesh inter-domain operator called SM, thus MS SM. The procedure
consists of creating a triangular tessellation on the boundary surface of S, such that the
vertices, edges and faces of this tessellation become the points, edges, and triangles of
MS. Since a solid model definition includes a well-defined boundary, M
S automatically
satisfies all the requirements given in Section 3.2.2.2 and thus MS 1
. We denote 1

14
Fig
ure
4.1
: F
low
char
t of
pro
pose
d m
eth
odo
logy:
elem
ents
(m
eshes
and s
oli
ds)
an
d t
hei
r tr
ansf
orm
atio
ns
rep
rese
nte
d b
y
lett
ers
nex
t to
the
arro
ws
whil
e op
erat
ions
den
ote
d b
y b
lock
s. N
um
ber
s in
th
e to
p l
eft
corn
er o
f ea
ch b
lock
in
dic
ate
flo
w
dir
ecti
on
.

15
(a) (b)
(c)
Figure 4.2: Operations on altar model: (a) solid model S, (b) transformation of S to
mesh representation MS, (c) mesh model M obtained by Faro Focus laser scanner
corresponding to the current structural state of altar.
as a sub-space of in which mesh models are manifold (closed meshes) and satisfy
some other requirements describe in Section 3.2.2.2. However, since mathematically
defined surfaces are replaced by sets of triangles (compare Figure 4.2a and 4.2b) MS loses
the parametric description of the original bounding faces of S. Any geometrical and
topological information associated with the interior of S is also lost. This conversion
operation is already implemented in several commercial CAD programs, such as
AutoCad, Abaqus/CAE, and SolidWorks.
4.3. Rigid Registration Procedure
This procedure aligns mesh models MS and M, presently occupying arbitrary positions in
the mesh space . We assume that both models contain a sufficient amount of
overlapping information to ensure the convergence of the 3D registration procedure. This
involves an intra-domain operator that works in three sub stages: line feature extraction,
line feature matching, and transformation.
4.3.1. Line Feature Extraction
This algorithm extracts 3D lines from M. We select 3D lines as the principal descriptor to
find semantic similarities between MS and M, under the assumption that the architecture
of the monument being operated contains primarily planar surfaces (this is clearly true for
Huaca de la Luna and other Moche monuments.) We calculate the mathematical
parameters that describe planar surfaces of each model by clustering points according to
their normal vectors using Gauss maps. These consist of 3D diagrams formed by the
orientation of each normal vector calculated from the point cloud p being analyzed.
Following the approach described by Chen and Chen [25], for each point of p that has a
neighborhood of points , where N is the number of points of the neighborhood, a
covariance matrix can be calculated can be calculated as:

16
(4.1)
where is the centroid of the neighborhood. Then, the eigenvector of M are
v1, v2, and v3 with corresponding eigenvalues of , , and , ordered as
. Then, the normal of point {pi} has a normal equal to the eigenvector of small
eigenvalue. We want to cluster groups of points that belong to the same plane by
analyzing the degree of parallelism between their normal vectors and by testing if the
points belong to the same neighborhood. Then, we need to eliminate points with low
quality planar surface. Then, it is defined a confidence rate of p as
(4.2)
Values of kp close to 1 means a neighborhood of {pi} with high quality planar surface.
Then, we can set a threshold kT for eliminating points {pi} that has confidence rates lower
than kT. Figure 4.3a illustrates the Gauss map of M where colors represent the confidence
ratio.
The clustering algorithm proposed by Chen and Chen [25] classifies points of p such that
each cluster Ci, where i=1,2,..,r, and r is the number of clusters detected, contains points
that belongs to a plane. There are two criteria in order to check if a pair of points p and q
lies in the same cluster:
- The normal vectors np and nq of points p and q respectively must be roughly
parallel. That is pT, where pT is a threshold close to 1.
(a) (b) (c)
(d) (e) (f)
Figure 4.3: Plane feature extraction from mesh models M and MS
representing altar: (a)
and (d) represents Gauss maps of both M and MS, indicating normal directions of each
mesh point (colors represent confidence ratios); (b) and (e) correspond to clusters of
planes identified in Gauss map (a) and (d); finally, (c) and (f) illustrate plane surfaces
detected in M and MS, based on identified clusters.

17
- p-q has to be roughly orthogonal to np and nq. That is
)) , where oT is a threshold close to 0.
The algorithm starts with a point p with the highest confidence rate and search for point
that satisfy the above conditions. After analyzing all points, if the cluster does not have
the required length NT, then, those points are discarded from the point cloud. Each time
that a cluster is growing, a new normal vector is calculated from the group. This normal
vector belongs to the cluster is being analyzed and utilized to be compared with normal
vectors of other points during the search. Figure 4.3b shows the normal vectors of each
cluster calculated from the Gauss map. The computational complexity of this algorithm
lies between O(N+Nr), if the points selected as starting points does not grow a cluster,
and O(N+Nr2), if most of the points belongs to some cluster. Nr is the number of
surviving points during the clustering procedure. Finally, each cluster describing a planar
region in M is plotted in Figure 4.3c. The same procedure applies to MS and the result is
illustrated in Figures 4.3d-f. It is evident that more plane clusters are found in M than MS
since walls represented in MS are lower planar due to its method of construction and
deterioration.
In order to obtain a set of line equations per mesh, we intersect the calculated planes
using the approach proposed also by Chen and Chen [25]. In M, we obtain the set of lines
X={Xn}, where n=1,2,…,N, and N denotes the maximum number of lines detected in X.
Similarly, for MS we calculate the set of lines A= {An}, where n=1,2,…,P, and P indicates
the maximum number of lines detected in A. Sets X and A contain the parameters of each
line in an arbitrary order. In general, N and P are not identical, since not all the
intersections of planes in M produce unambiguous line segments.
4.3.2. Feature Matching
Sets X and A are matched interactively by the analyst operating in a graphic interface
created in Matlab. Here, we use the data cursor to select lines in mesh M that are in
common to the ones in MS. There is not a rule for line assignment. We considered two
criteria during line selection:
- Choose lines that represent borders in both mesh models.
- Choose lines with obvious correspondence in both meshes.
- Give preference to common lines with high length.
Not all the lines of each set are necessarily utilized in this procedure. Finally, both sets
are reordered in such a way that the lines in X={Xn} correspond to the lines in A= {An},
for n=1,2,…,Q, where Q is the maximum number of matched lines and .
4.3.3. Transformation Procedure
This algorithm is applied to the set of lines X={Xn} using the information of A={An} in
order to compute the best rotation and translation of X, where t represents a
translation vector and R the rotation matrix. In the case of laser scanning data, this
procedure does not need to calculate a scale factor since both meshes Ms and M share the
same scale. We follow the approach in Kamgar-Parsi [26] in order to find the best for
sets of infinite length lines. The Euclidian distance between the

18
transformed set X and A provides a cost function C whose global minimizer *
represents the best transformation:
(4.3)
where
(4.4)
The set of lines An and Xn are formed by the pairs and
where an and bn are the closest points of each line to the origin, and and the
directions of each line, respectively. l is a virtual length. If we take the corresponding
point to an as xn+sn (midpoint of the virtual line segment of length l), it is possible to
calculate:
(4.5)
Then, we want to minimize C with respect to the parameter sn. To solve this, we find the
solution of =0 which is:
(4.6)
C can not be minimized in a closed with respect to R form as we did with respect to sn.
However we can perform an iterative procedure. Given a known sn, we can minimize C in
a closed form by calculating its cross-covariance matrix which is given by:
(4.7)
where
, and
. The rotation matrix and translation
vector can estimated by using the quaternion representation as follows:
(4.8)
where are the elements of the matrix S. We extract the normalized eigenvector with
the highest eigenvalue of Q, which is q=(q1,q2,q3,q4)T that will be used in the calculation
of the rotation matrix as follows:
(4.9)
19
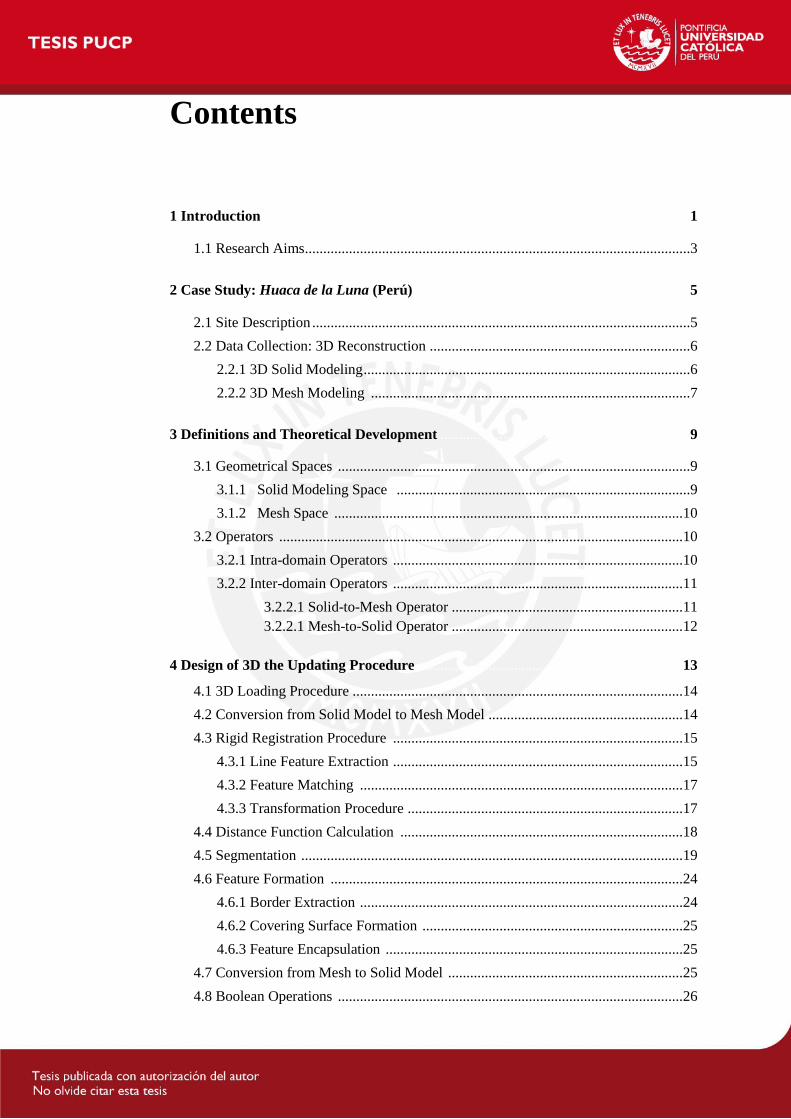
(a) (b)
Figure 4.4: Registration procedure. (a) Aligned models M* and M
S after calculating the
best transformation . (b) Convergence graphic of the algorithm for l=0.1,
l=10, l=100.
Then, the translation vector is calculated as follows:
(4.10)
For more details about the above description, we refer to Kamgar-Parsi [26]. Then the
iterative procedure for getting the best transformation is given by the
following procedure:
- Step1: Initillize {Sn}.
- Step 2: Compute R and t from Equations 4.9 and 4.10
- Step 3: Update values of {Sn} with Equation 4.6
- Step 4: Repeat steps 2 and 3 until {Sn} converges.
{Sn} can be initialized with zeros and the length l can be set between 0.001 and 100. The
algorithm probes to have low variation with respect to l. In this case, the convergence was
found in the iteration 8 for the initial value {Sn} = 0 and a l = 10. The result of the
alignment is provided by the following output: M*= where M
* , as shown in
Figure 4.4a. The convergence of the algorithm is shown in Figure 4.4b for three values of
l.
4.4. Distance Function Calculation
This procedure consists of an intra operator designed to compute the Euclidean distance
between each point of the mesh M* and those of M
S 1. To visually compare
how well the alignment between M* and M
S has been achieved, the procedure assigns a
color to each vertex of M* representing the distance error. We assume that new
geometrical information that we want to transfer from M* to M
S is characterized by
vertices with large distance errors compared to the other vertices of the entire mesh. The
objective consists in establishing a scalar field K indexed to M*, which allows the
recognition of the new information, defined as:

20
(4.11)
where p denotes the number of vertex points present in the mesh M*. The correspondence
between the pairs and
is defined as the nearest point of the set MS with respect to
the point for all i. Since M
S does not contain the same resolution of points as M
* due
to the discretization of the boundary surface of S, a linear re-meshing procedure is applied
over MS. We calculate K using the k-d trees technique described in Redmond and
Heneghan [27], which organizes the points in 3D partitions in an efficient way, thus
reducing the computational time as compared with exhaustive search methods. The result
consists of a four-level data structure mesh which contains the geometrical
information of M* (the first three levels) and the distance scalar function K (the fourth
level) as is illustrated in Figure 4.5a. For more details about the structure of a mesh, we
refer the reader to Chapter 3.
4.5. Segmentation
In this stage, an intra-mesh segmentation operator extracts a portion of the mesh
that is considered to represent new information. As indicated earlier, we assume that new
information consists of a group of vertices within characterized by having K
relatively higher than the rest of the vertices. We designed a 3D discrete contour for
segmenting sets of clusters which are considered new information. We use the framework
of the discrete dynamic contour model proposed by Lobregt and Viergever [28] in which
a set of N connected points , forms a 2D contour for segmenting images. The
internal energy of the contour depends of the local curvature of each point which is a
vector calculated using the following equation:
(4.12)
where is defined as the local curvature of the point pi; and di-1=pi-pi-1, and
di=pi+1-pi constitute vectors from consecutive points of (see Figure 4.6a). We can set a
local coordinate system of each point formed by two orthogonal vectors and using
the following equations:
(a) (b)
Figure 4.5: Distance function calculation of mesh model M: (a) color distance map
calculated by measuring Euclidean distances between MS
and M, (b) histogram of
calculated distances.

21
(4.13)
(4.14)
These equations, as they are, were designed for a 2D coordinate system. We extend this
procedure for a 3D mesh model in which each point has a normal vector , and
it is surrounded by neighborhood of points connected by segments. Then, for each point
of the contour pi, vectors di-1 and di are projected into the plane formed by . With this
correction, we locally covert 3D vectors into 2D vectors (see Figure 4.6b). Following the
approach of Lobregt and Viergever (1995), the internal force is defined as the
convolution of the magnitude of the curvature with a low pass filter hi ={-0.5,1,0.5}, by
the equation:
(4.15)
where “ ” denotes convolution. Then, the internal force vector is:
(4.16)
On the other hand, Lobregt and Viergever [28] defined the external force of each point pi
as the radial component of the gradient of the image I with the following equations:
(4.17)
(4.18)
where “ ” denotes the gradient operator. Extrapolating this approach for the 3D case, and
knowing that we want to locate the initial contour in an area of the mesh of high K, and
stop it for values of K close to cero, we define as:
(4.19)
(4.20)
where , and is a signed weight that will decide if the contour is evolving
inwards (positive ) or outwards (negative ). Note that in this case is a scalar value
which ranges from 0 to 1. Since is now a 2D vector after its projection to the plane of
pi, then is also a 2D vector. The deformation of the contour, according to [28], is
governed by the cinematic laws of position of points (pi), velocity (vi) and acceleration
(ai) described as follows:

22
(4.21)
(4.22)
(4.23)
where mi is a constant (analog to mass in physics), (total force) represents the sum of
forces , and , act as weighting factors. We assign
for this case. The problem with this approach is that does not control
the movement (velocity) directly. It controls the acceleration; and, in some cases of
and , there would exist an oscillatory behavior like its analogue with a spring. Then,
we decided to make controls the velocity as the majority of active contours do, like
Caselles et al. [29] in the geodesic active contour. Moreover, since our problem is
working over a 3D mesh, is restricted to occupy only the position of other points of the
mesh and to move in the direction of edges of the mesh. Being the
neighborhood of points connected by edges to a given point of the contour , we
calculate the movement vectors as:
(4.24)
Then, is able to move only through (see Figure 4.6c). Since we are working with 2D
vectors over the plane defined by and , we project to that plane. We set a
rule for updating given by:
(4.25)
where determines which movement vector is closer to the total
force vector . The constant determines how long the projection of over has to
be in order to decide if would be updated or retained. We set =0.5 since it
appears to be a satisfactory rate in the majority of cases.
(a) (b) (c)
Figure 4.6: Behavior of a 3D contour on a mesh. (a) Adjacent points of will define
a local coordinate system which will be projected on a plane in (b) formed by the
vectors and . The mentioned plane is formed by the point and its normal vector
. (c) The set of neighboring points of define the set of movement vectors
. The total force vector has an orientation close to which is represented with
discontinuous line.

23
The step length is set as 1, since a different value would make lies in a non-
existing position in the mesh. The design of this new 3D discrete contour, as in the case
of [28], needs special attention to the resampling of points in each iteration. That is, for
2 consecutive points, if the distance between them is higher than a given threshold, one of
those points is eliminated. Similarly, if this distance is higher than a threshold, a new
point is estimated and added to the contour. We adopt the same rules and parameters as in
[28] for the resampling problem.
We use the proposed contour for segmenting the desired sector (region considered new
information) from . As we notice in Figure 4.5b, the histogram of K reveals that there
exists a considerable portion of points with distance error between 0 and 0.1 meters. We
take into account this information for the scaling of K and the selection of parameter in
Equation 4.19 in order to obtain a useful external force. Figure 4.7a shows plots of
Equation 4.19 for five values of . We choose for this case. Then, we scale K such
that distance errors between 0 and 0.1 meters lies between 0 and 0.86 (pass band) in the
plot of Figure 4.7a. The resultant scalar external force is shown in Figure 4.7c, and
its histogram is plotted in Figure4.7b. It is evident the discrepancy between the sector of
the mesh where the cavity is located with respect to the rest of the mesh. We choose
equal to the negative of the mean of the distances between two connected points in the
mesh (spatial mesh resolution). The reason for choosing a negative value in is because
we want the contour to be expanded from an initial to a final configuration. Figures 4.7d-
g show the evolution of the initial contour located interactively in the center of the target
sector of . Finally, Figure 4.7h shows the segmented region called . In
general, it is possible to segment various regions from the same mesh. We call this group
of meshes (subsets) , i=1,2,…,q where q is the maximum number of sectors
segmented from .
4.6. Feature Formation
This procedure creates a mesh 1
from for i=1,2,…,q in three steps:
border extraction, formation of the covering surface, and feature encapsulation (see
Figure 4.8). The objective is to make the mesh regular in order to be converted into a
solid model in the next stage. In the present case, for to be regular, the mesh must
satisfy the following conditions:
- It must satisfy the first three properties described in Section 3.2.2.2.
- There must be a regular edge boundary.
- There are no gaps in the mesh.
A mesh opening is defined as a set of connected edges, which are not shared by two
triangular faces. A regular edge boundary of a mesh is defined as a mesh opening with a
close loop border that establishes the delimitation of the segmented region from the rest
of the mesh – shown with a blue line in Figure 4.8a. A gap is defined as any mesh
opening that is not an edge boundary. It is not complicated to distinguish between the
edge boundary and gaps since the former one is usually bigger than the latter. The
selection of the edge boundary is done manually by a user.

24
(a) (b)
(c) (d)
(e) (f)
(g) (h)
Figure 4.7: Segmentation procedure applied over the mesh model using a 3D
discrete contour. (a) External force function (Equation 4.19) for various values of . (b)
Histogram of the calculated values of the external force. (c) Colorized external force
displayed over the mesh ( ). (d) - (g) Contour evolution from
its initial configuration set by the user. (h) Segmented sector from .

25
In general, since the initial mesh M was obtained by triangulating the point clouds
produced by a laser scanner, may not satisfy the three conditions described above. We
then apply a Poisson surface reconstruction [21] over the point clouds in order to obtain a
regular mesh that satisfies those conditions.
4.6.1. Border Extraction
Since must contain a regular edge boundary, a hole detection algorithm is applied to
find the set of edges forming this boundary. The procedure consists in analyzing if each
edge of the mesh is shared by to triangular faces. Edges that do not satisfy the anterior
condition are stored in , i=1,2,…,q. The result of this step is illustrated in Figure 4.8a.
4.6.2. Covering Surface Formation
This procedure was designed for creating a surface that encloses the mesh by connecting
points of with points of the surface border. This surface could have any shape that
satisfies the following requirements:
- It must not intersect any geometrical structure of the M* or M
S.
- The points of its border have to have a one to one correspondence with the points of
.
Depending of the shape of we designed two procedures for the creation of that surface.
A plane entity P is estimated from the point set using a linear fitting procedure. If the
variance of with respect to that plane is lower than a given threshold , then,
Ensures certain planarity and we apply the criterion 1. Otherwise, we apply criterion 2.
Criterion 1: P is moved out from its original position by an arbitrary distance along its
normal direction. The direction is represented by a vector with an orientation opposite to
M*. Finally, is projected into that plane for the creation of a new border enclosing a
planar sector, which we call covering surface Fi , for i=1,2,…,q.
(a) (b)
(c) (d)
Figure 4.8: Feature formation and conversion from mesh to solid model of segmented
part of the altar : (a) border extraction (blue line), (b) surface c o v e r formation,

26
(c) feature encapsulation, and (d) conversion from mesh to solid model
.
Criterion 2: A copy of is moved out from its original position by an arbitrary distance
along the normal direction of P. The direction is represented by a vector with an
orientation opposite to M*. Subsequently, this border is triangulated in its interior using
Delaunay tessellation with non-convex constraints in order to generate a covering surface
Fi , for i=1,2,…,q, as illustrated in Figure 4.8b.
In both criteria, the distance used for moving (or projecting) along P is manually set by
a user taking in account the accomplishment of the first requirement described above. We
found that a distance equal to 2% of the perimeter of is adequate for the majority of the
models analyzed. On the other hand, there is not a rule for selecting . We used a of 0.2
meters for all the cases.
4.6.3. Feature Encapsulation
Fi and are connected using a hole completion algorithm. Since each point of the edge
boundary of Fi and has a one to one correspondence, both edge boundaries are
connected by triangulation. We call the final result and it is illustrated in Figure 4.8c.
It is important to stress that, due the completion of with Fi, each edge of is shared
by two triangular faces (manifold mesh). Therefore, satisfies the fourth condition
described in Section 3.2.2.2, i.e., .
4.7. Conversion from Mesh to Solid Model
This stage converts the mesh representation into a solid model representation
by a mesh-to-solid inter domain operator called MS. Then,
.
The operator takes the information of points, edges, facets and normals from and
translate them into entities according to the Standard ACIS Text (SAT) format. Since
is a manifold representation and satisfies the properties described in Section 3.2.2.2., this
operation is always possible. As a result, can be imported in any CAD software as
depicted in Figure 4.8d.
4.8. Boolean Operations
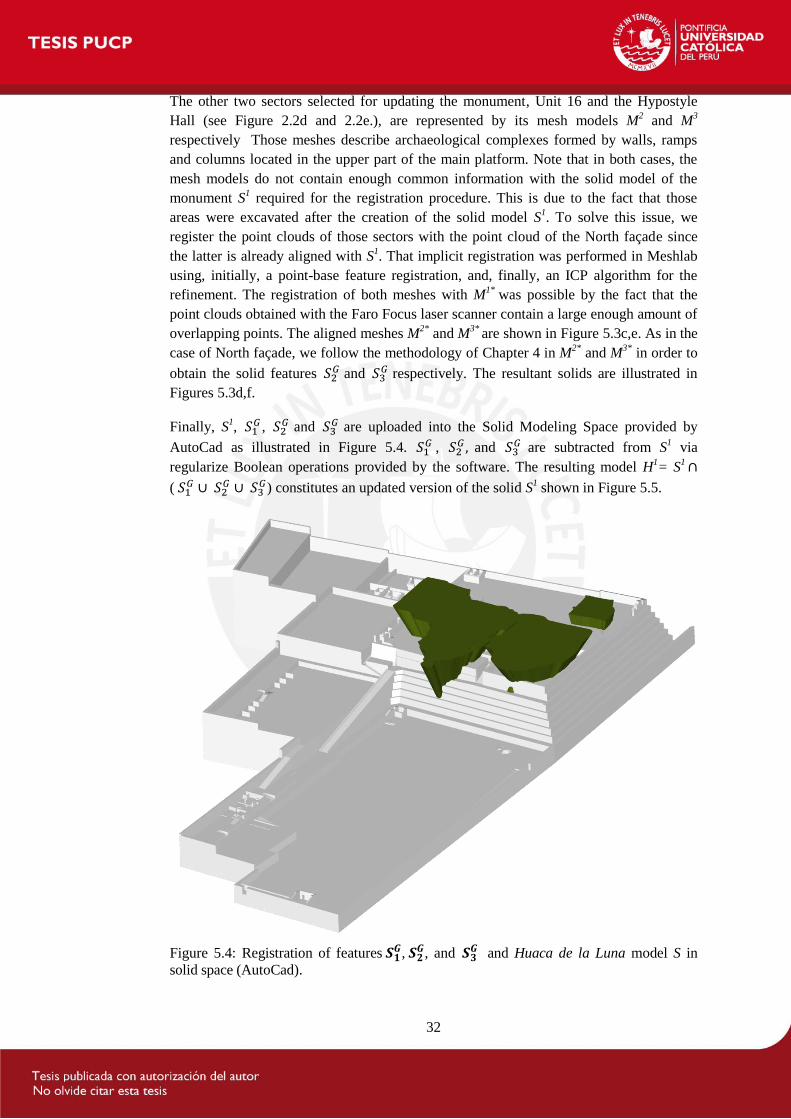
This stage constitutes the last procedure of the entire flow chart. It updates the initial solid
model S with the information of , i=1,2,…,q via Boolean operations. First,
both solid models S and are located in the same space as illustrated in Figure 4.9a.
Then, as a result of the previous procedures, will partially overlap the model S.
Finally, the operation of subtraction (or addition, depending on the specific case) is
performed by H=S . Figure 4.9b shows the output solid model H for the test
case. This operation is performed in the solid modeling space. In the present research, we
use AutoCad to import both solid models and apply the Boolean operations.

27
(a)
(b)
Figure 4.9: Regularized Boolean difference on altar model (AutoCad): (a) initial solid
model S and solid feature registered in the Solid Modeling Space, (b) final result
after applying Boolean operation H = S .

28
Chapter 5
Applications and Results
In this section, we test the methodology proposed in Chapter 4 in three sectors of Huaca
de la Luna defined earlier: the North façade, Unit 16, and the Hypostyle Hall. We explain
the updating procedure considering two cases: a solid model of the monument formed by
only one layer and multiple layers. The results are discussed in detail, as well as any
inconvenience found during the procedure.
5.1. 3D Solid Updating Using One Layer of the
Monument
We begin by using only the last level of the solid model of the monument (layer A)
represented by S1 . The first sector to be updated is located in the North façade , and it
includes a portion in the upper platform of the monument. As illustrated in the mesh M1of
Figure 2.2c, a large breach cuts the façade and extends towards the back of the
monument, compromising a considerable part of the upper surface. Following the
procedure described in Chapter 4, we align the position of M1 according to its real
location in the monument. Gauss maps were extracted from both models: M1 and ,
being the mesh extracted from a portion of the solid model S1 of the monument which
describes the same sector. Figure 5.1a,b depicts these maps with a color code describing
the confidence ratio for both cases. A histogram of this metric is shown in Figure 5.1c,d.
As expected, the variance value of the confidence ratio in M1 ( =0.996) is higher than
variance ( =0.998) since the former contains a detailed description of real handmade
walls with relieves (low planar quality) while the latter is a conceptual and an ideal
reconstruction of them (high planar quality).
We cluster points in both mesh models using the approach of Chen and Chen [25] in
which three parameters can be set: pt, ot, and Nt. The parameter pt describes the angle
tolerance between normal vectors of points in which they can be considered as belonging
to the same plane; ot consists in an angle tolerance, which represents the perpendicularity
between normal vectors of two points of the same plane and the unitary vector which
connects those points.; and Nt represent the minimum number of points allowed in a
cluster. Those parameters were well described in Section 4.3.1. For a pair of points that
have values of ot highly different to 90° but with values of pt near to 0° means that they
belong to different but parallel planes. For both mesh models M1 and , we set
tolerances pt=8°, ot=80°, Nt=100; and pt=3°, ot=85°, Nt=200, respectively Those values
were found to produce the best classification after a number of experiments. 20 clusters
were calculated for M1, and 23 for as shown in Figure 5.1e-f.

29
(a) (b)
(c) (d)
(e) (f)
Figure 5.1: Plane feature extraction from mesh models M and representing the North
façade of the monument: (a) and (b) represents Gauss maps of both M and ,
indicating normal directions of each mesh point (colors represent confidence ratios); (c)
and (d) correspond histograms of confidence ratios of both meshes; finally, (e) and (f)
illustrate plane surfaces detected in M and , based on identified clusters.

30
In order to obtain a set of line equations per mesh, we intersect the calculated planes
using the approach proposed by Chen and Chen [25]. 35 lines were extracted from M1
while 48 from . We manually selected and matched 13 lines between models using a
graphic interface. We considered the criteria described in Section 4.3.2 for the selection
of lines. Finally, we applied the transformation procedure described in [26] for the case of
infinite line sets. The estimation of , where t is the translation vector and R the
rotation matrix, was reached at iteration 11. The result provides the following output:
M1*
= , as shown in Figure 5.2.
Subsequently, we segment the sector of the mesh M1*
that we want to export into the solid
S1. First, we calculate the Euclidean distance between M
1* and and its histogram.
Then, we use the 3D dynamic contour designed in Chapter 4 for segmenting the portion
of mesh that we consider new information to be exported in S1. We encapsulate G1 using
the criterion 1 over the boundary of the mesh (C1) in order to obtain
as
described in Section 4.6.2. Finally, G1 is converted into a solid feature . The
result is shown in Figure 5.3b where the blue line constitutes the boundary C1.
A comparison between the mesh M1*
and in Figure 5.2 shows that, in the
neighborhood of the decorated façade, M1*
contains a considerable portion of its surface
in common with the solid representation. This highlights the importance of having
common information between the mesh and the solid model in order to ensure
convergence during the registration procedure. This common information is eliminated
from the mesh using the segmentation operation described earlier.
Figure 5.2: Registration of meshes M1*
(from laser scanner) and (from solid model of
the entire monument) describing the North façade of Huaca de la Luna.

31
(a) (b)
(c) (d)
(e) (f)
Figure 5.3: Mesh models of selected areas of Huaca de la Luna and corresponding solid
features: decorated façade - mesh M1 (a) and corresponding solid feature
(b), Unit 16
- mesh M2 (c) and corresponding solid feature (d); and Hypostyle Hall - mesh M3 (e)
and corresponding solid feature (f).
32
The other two sectors selected for updating the monument, Unit 16 and the Hypostyle
Hall (see Figure 2.2d and 2.2e.), are represented by its mesh models M2 and M
3
respectively Those meshes describe archaeological complexes formed by walls, ramps
and columns located in the upper part of the main platform. Note that in both cases, the
mesh models do not contain enough common information with the solid model of the
monument S1 required for the registration procedure. This is due to the fact that those
areas were excavated after the creation of the solid model S1. To solve this issue, we
register the point clouds of those sectors with the point cloud of the North façade since
the latter is already aligned with S1. That implicit registration was performed in Meshlab
using, initially, a point-base feature registration, and, finally, an ICP algorithm for the
refinement. The registration of both meshes with M1*
was possible by the fact that the
point clouds obtained with the Faro Focus laser scanner contain a large enough amount of
overlapping points. The aligned meshes M2*
and M3*
are shown in Figure 5.3c,e. As in the
case of North façade, we follow the methodology of Chapter 4 in M2*
and M3*
in order to
obtain the solid features and
respectively. The resultant solids are illustrated in
Figures 5.3d,f.
Finally, S1,
, and
are uploaded into the Solid Modeling Space provided by
AutoCad as illustrated in Figure 5.4. ,
and are subtracted from S
1 via
regularize Boolean operations provided by the software. The resulting model H1= S
1
(
) constitutes an updated version of the solid S
1 shown in Figure 5.5.
Figure 5.4: Registration of features ,
, and and Huaca de la Luna model S in
solid space (AutoCad).

33
(a)
(b) (c) (d)
Figure 5.5: (a) Updated solid model resulting from applying regularized Boolean
difference between ,
, and and S: (b), (c) and (d) the updated areas of decorated
façade, Unit 16, and Hypostyle Hall, respectively.
(a) (b)
Figure 5.6: Decorated façade: (a) detail of solid model of Huaca de la Luna updated
taking into account three structural layers: A, B/C, and D, and (b) recent state of the
monument.

34
5.2. 3D Solid Updating using various layers of the
monument
As explained in Section 2, Huaca de la Luna is formed by at least six buildings
constructed one on top of the other. To take this information into account, a second test is
performed using a solid model S2 consisting of an assembly of the three layers of
construction of the monument A, B and C. We apply the same procedure as in Section 5.1
to the first case: North façade. Figure 5.6a depicts three layers of construction which were
partially cut by during the updating procedure of S
2. A comparison between the
updated solid model H2= S
2 and the picture of the real situation of the façade
(Figure 5.6b) denotes that internal layer can coexist even in the complicated surfaces.
This result will allow its posterior application for structural simulations using Finite
Elements Analysis in which each layer is characterized with a different material property.
5.3. Discussion
The present methodology allows to locally update an existing 3D solid model of a
monument with geometric information of a 3D mesh (point cloud) extracted from a sector
of the same monument using a laser scanner or a photogrammetric reconstruction. The
procedure does not require having the entire mesh-based model of the monument, thus
making our approach suitable for massive monumental structures for which a complete
survey may not be possible. Moreover, the user is able to decide the number of sectors to
be updated, their resolution, and the 3D acquisition technique for recording them. For
instance, in Figure 5.7 a mesh representation of the final updated solid model is
illustrated. It is evident that each area (which corresponds to Figure 5.7a,b and c) has a
different triangle-based mesh resolution (see Table 5.1). Similarly, the resolution of those
areas is higher than the rest of the mesh representation of the entire monument. In
addition, the user is able to select the level of detail and the complexity of the area
selected for updating the monument.
In the present methodology a number of operations need user intervention. For instance,
in the registration step, the user has to establish the matching relation between lines of
both models. Similarly, in the segmentation procedure and during the application of
operations between solid models in the CAD software, the process remains interactive.
Table 5.1: Resolution of meshes for each case study and the computational time required
for the proposed methodology during the updating procedure. Pre-processing stage,
which was interactively done in Meshlab by a user, is also considered in the assessment
of time. The computer is equipped with an 8-core Intel i7 processor at 3.40 Ghz, and 8
GB of RAM.
Resolution (number of
triangle faces)
Computational time of the procedure (minutes)
Pre-processing
Processing: Stages 1 to 7
Processing: Stages 8
Total time
Altar 66082 28.6 36.92 1.43 66.95 North façade 25150 78.0 15.02 0.55 93.57 Unit 16 145682 60.2 46.31 1.24 107.75 Hypostyle Hall 215492 54.8 75.30 23.33 153.43

35
A future work should focus the automation of each operation described in the flow chart
in Figure 4.1 in order to reduce possible errors introduced by the user and accelerate the
overall process. However, it is important that the user maintains final control at each state
of the process.
The present methodology has proven its effectiveness in updating a non-manifold solid
model representing a monument with relevant internal information, as shown in Figure
5.6. The particular mode of construction of Huaca de la Luna justifies the need of
distinguishing the various layers in the solid model since each could have different
material properties, which need to be identified in the context of engineering modeling.
Table 5.1 contains information of the time required for the pre-processing step (i.e., the
3D mesh generation from the point cloud), steps 1 to 7, and step 8 for four cases: the
Altar, the North façade, Unit 16, and the Hypostyle Hall. The equivalent manual updating
of the selected areas in a CAD modeler would be extremely time consuming and in some
cases impossible. For example, the breach in the North façade sector is completely
irregular and it does not contain any recognizable architectural feature like walls or
columns. On the other hand, Unit 16 and the Hypostyle hall contain clear architectural
features, making them suitable for a manual solid reconstruction. However, due to the
irregularity and the damage of the present structure, manual reconstruction will inevitably
require a simplification of the geometry, which in turn may produce unacceptable
simplifications in a subsequent FEA model.
Finally, the accuracy of the updated solid models is directly related to the accuracy of the
meshes obtained by the 3D surveying system. Although the test cases are based on a point
cloud from a 3D laser scanner, the proposed methodology allows the user to introduce
meshes from other acquisition techniques. For instance, photogrammetric models could
be used as input meshes in the uploading procedure of Figure 4 but the accuracy of those
models is inferior to those generated by laser scanning. We test that case in the
publication of Zvietcovich et al. [30]. At any rate, the user should be able to decide
which acquisition technique applies taking into account the target accuracy to be achieved
in the updated models and the total time required to complete the various operations.
(a) (b) (c)
Figure 5.7: Mesh model obtained from the updated solid model of the entire monument in
sectors (a) North façade, (b) Unit 16, and (c) Hypostyle Hall.

36
Chapter 6
Conclusions
We introduce a novel methodology for updating solid models of monuments with
information extracted from 3D local meshes built from point clouds. The procedure
consists of a series of operations using image processing and computer vision algorithms
operating in the Solid Modeling space and the Mesh space. The effectiveness of this
methodology is demonstrated by applying it to the problem of updating an idealized
model of the massive monument Huaca de la Luna with information pertaining to the
current damaged state of the structure. The procedure allows controlling each of the
stages in an interactive fashion, and reduces considerably the time employed for a user to
update the model manually in a CAD software. Moreover, since the creation, registration,
segmentation and transformation of meshes to the solid model are managed by
algorithms, the final outcome will avoid the human bias, as much as possible, of the
resultant solid model. Preserving the same accuracy using manual methods will be highly
difficult and time consuming. More importantly, the proposed methodology addresses the
problem of updating an existing solid model which avoids the creation of the complete
model of the monument. This is of special importance when a high geometric resolution
is desired in certain areas of a model rather than other ones. That can be achieved since
we have the control of the mesh resolution as shown in Figure 5.7.
The availability of this methodology will expand the applicability of engineering
modeling techniques to the analysis of complex monumental structures. In particular, for
the study case presented here, it will make it possible the systematic application of FEA
to the analysis of massive earthen monuments in order to determine their structural
response to natural (e.g., earthquakes) and anthropogenic factors (e.g., breaches). Since
this methodology allows localized modifications, the user will be able to derive both
global (coarse) as well as local (refined) FEA models to serve the requirements of
specific engineering analysis. Preliminary tests on the updated solid model of Huaca de
la Luna obtained with the proposed methodology have been done using FEA. Results
demonstrate the utility of our approach for its application on engineering analysis in the
detection of vulnerable areas of the monument under horizontal deformations and
gravitational load [31].
In addition, the proposed methodology is applicable to complex structures with internal
features best represented by non-manifold models, as is the case for the layered structure
of Huaca de la Luna. Finally, the updating methodology contributes to creating
information-rich multi-domain 3D representations designed to support discipline-specific
as well as interdisciplinary applications, such as virtual and augmented reality systems
specifically designed for the spatio-temporal analysis and conservation of complex
monumental structures of the cultural heritage.

37
We recommend focusing in the automation of each operation described in the proposed
methodology in order to reduce the user intervention which produce human bias, and
accelerate the overall process using an object oriented programing language with
predefined libraries for point cloud processing such as Point Cloud Library Project (PLC)
[32]. In addition, we recommend exploring the possibility of converting the facetted solid
features described in subsection 4.7 into NURBS (Non-Uniform Rational Basis Splines)
surfaces which are supported by the majority of commercial CAD software. NURBS
surfaces will reduce the complexity of representing huge amount of facets in a visual
interface; as well as, it will provide more versatility in the generation of finite elements
meshes (FEM) for structural analysis.
38
Bibliography
[1] L. Arbace, E. Sonnino, M. Callieri, M. Dellepiane, M. Fabbri, A. Iaccarino
Idelson, and R. Scopigno, "Innovative uses of 3D digital technologies to assist
the restoration of a fragmented terracotta statue," Journal of Cultural Heritage,
vol. 14, pp. 332-345, 2013.
[2] M. Dellepiane, N. Dell’Unto, M. Callieri, S. Lindgren, and R. Scopigno,
"Archeological excavation monitoring using dense stereo matching techniques,"
Journal of Cultural Heritage, vol. 14, pp. 201-210, 2013.
[3] M. Carrozzino and M. Bergamasco, "Beyond virtual museums: Experiencing
immersive virtual reality in real museums," Journal of Cultural Heritage, vol. 11,
pp. 452-458, 2010.
[4] H. Rua and P. Alvito, "Living the past: 3D models, virtual reality and game
engines as tools for supporting archaeology and the reconstruction of cultural
heritage – the case-study of the Roman villa of Casal de Freiria," Journal of
Archaeological Science, vol. 38, pp. 3296-3308, 2011.
[5] N. A. Haddad, "From ground surveying to 3D laser scanner: A review of
techniques used for spatial documentation of historic sites," Journal of King Saud
University - Engineering Sciences, vol. 23, pp. 109-118, 2011.
[6] A. H. Ahmadabadian, S. Robson, J. Boehm, M. Shortis, K. Wenzel, and D.
Fritsch, "A comparison of dense matching algorithms for scaled surface
reconstruction using stereo camera rigs," ISPRS Journal of Photogrammetry and
Remote Sensing, vol. 78, pp. 157-167, 2013.
[7] P. Brune and R. Perucchio, "Roman Concrete Vaulting in the Great Hall of
Trajan’s Markets: Structural Evaluation," Journal of Architectural Engineering,
vol. 18, pp. 332-340, 2012/12/01 2012.
[8] T. Oetelaar, "Reconstructing the Baths of Caracalla," Digital Applications in
Archaeology and Cultural Heritage. Available from:
http://dx.doi.org/10.1016/j.daach.2013.12.002
[9] M. Russo, and G. Guidi, “Reality-based and reconstructive models: digital media
for cultural heritage valorization,” Scientific Research and Information
Technology (SCIRES-IT), vol. 2 (4), 2011.
[10] C. Vilbrandt, G. Pasko, A. Pasko, P. A. Fayolle, T. Vilbrandt, J. R. Goodwin, J.
M. Goodwin, and T. L. Kunii, "Cultural Heritage Preservation Using
Constructive Shape Modeling," Computer Graphics Forum, vol. 23, pp. 25-41,
2004.
[11] H.-M. Cheng, "Workflows of 3D Digitizing Heritage Monuments," in Laser
Scanner Technology, J. A. Munoz, Ed., ed: InTech, 2012.
[12] INUS Technology, Rapidform XOR [computer software]. Korea: INUS
Technology, 2012. Retrieved from: http://www.rapidform.com/home/
[13] H. Boulaassal, C. Chevrier, and T. Landes, "From Laser Data to Parametric
Models: Towards an Automatic Method for Building Façade Modelling," in
Digital Heritage. vol. 6436, M. Ioannides, D. Fellner, A. Georgopoulos, and D.
Hadjimitsis, Eds., ed: Springer Berlin Heidelberg, 2010, pp. 42-55.
[14] Autodesk, Maya [computer software]. San Rafael: Autodesk, 2012. Retrieved
from: http://www.autodesk.com/products/autodesk-maya/overview
[15] G. Guidi, M. Russo, and D. Angheleddu, "3D survey and virtual reconstruction of
archeological sites," Digital Applications in Archaeology and Cultural Heritage,
vol. 1, pp. 55-69, 2014.

39
[16] S. Uceda and R. Morales, Moche pasado y presente. Trujillo, Peru: Patronato
Huacas del Valle de Moche, 2010.
[17] Autodesk, AutoCAD [computer software]. San Rafael: Autodesk, 2012.
Retrieved from: http://www.autodesk.com/products/autodesk-autocad/overview
[18] Faro Technologies, FARO Focus 3D [laser scanner device]. Lake Mary: Faro
Technologies, 2012.
[19] Visual Computing Lab – ISTI – CNR, Meshlab [computer software]. Pisa: Visual
Computing Lab, 2012. Retrieved from: http://meshlab.sourceforge.net/
[20] Z. Xie, S. Xu, and X. Li, "A high-accuracy method for fine registration of
overlapping point clouds," Image and Vision Computing, vol. 28, pp. 563-570,
2010.
[21] M. Kazhdan, M. Bolitho, and H. Hoppe, "Poisson surface reconstruction,"
presented at the Proceedings of the fourth Eurographics symposium on Geometry
processing, Cagliari, Sardinia, Italy, 2006.
[22] V. Shapiro, "Chapter 20 - Solid Modeling," in Handbook of Computer Aided
Geometric Design, F. Gerald, H. Josef, K. Myung-Soo, and J. H. M.-S. K. J. H.
Myung-Soo KimA2 - Gerald Farin, Eds., ed Amsterdam: North-Holland, 2002,
pp. 473-518.
[23] E. Gindis, "Chapter 27 - Surfaces and Meshes," in Up and Running with
AutoCAD 2013 (Third Edition), E. Gindis, Ed., ed Boston: Academic Press,
2013, pp. 585-602.
[24] MathWorks, Matlab [computer software]. Natick: MathWorks, 2011. Retrieved
from: http://www.mathworks.com/products/matlab/
[25] J. Chen and B. Chen, "Architectural Modeling from Sparsely Scanned Range
Data," International Journal of Computer Vision, vol. 78, pp. 223-236,
2008/07/01 2008.
[26] B. Kamgar-Parsi, "Algorithms for matching 3D line sets," Pattern Analysis and
Machine Intelligence, IEEE Transactions on, vol. 26, pp. 582-593, 2004.
[27] S. J. Redmond and C. Heneghan, "A method for initialising the K-means
clustering algorithm using kd-trees," Pattern Recognition Letters, vol. 28, pp.
965-973, 2007.
[28] S. Lobregt and M. A. Viergever, "A discrete dynamic contour model," Medical
Imaging, IEEE Transactions on, vol. 14, pp. 12-24, 1995.
[29] V. Caselles, R. Kimmel, and G. Sapiro, "Geodesic Active Contours," Int. J.
Comput. Vision, vol. 22, pp. 61-79, 1997.
[30] F. Zvietcovich, B. Castañeda, R. Perucchio, R. Morales, and S. Uceda, "A
methodology for updating 3D solid models of complex monumental structures
based on local point-based meshes," in Digital Heritage International Congress
(DigitalHeritage), 2013, 2013, pp. 7-14.
[31] C. Chachara, F. Zvietcovich, C. Briseño, R. Marques, R. Perucchio, B.
Castañeda, S. Uceda, R. Morales, and R. Aguilar. “On-site investigation and
numerical analysis for structural assessment of the archaeological complex of
Huaca De La Luna,” in International Conference on Structural Analysis of
Historical Constructions, Mexico, 2014. (Submitted on June, 2014).
[32] R. B. Rusu and S. Cousins, "3D is here: Point Cloud Library (PCL)," in Robotics
and Automation (ICRA), 2011 IEEE International Conference on, 2011, pp. 1-4.