population dynamics extinction edited - mr. siemianowski · 2018-11-16 · population dynamics and...
TRANSCRIPT

10/10/2018
1
Population Dynamicsand Extinction
Extinction and Reasoning about Loss of Biodiversity
Population Dynamics: Wolves and Moose of Isle Royale
(Optional: Introduction to Extinction Project)
Version September 2018
www.modelbasedbiology.com
Symbols
We use these symbols to communicate to students the following actions:
Work in research
groups Think Write downShare
3
Why should we care about biodiversity? Why does it matter?
Take a moment to think of at least one idea.
Write the idea (or ideas) on your doodle sheet in the first box (Box 1).
(Then we’ll share with a neighbor.)
Turn to a partner and share your ideas. Also be ready to share one idea from your pair with the whole group

10/10/2018
2
Why should we care about biodiversity? Why does it matter?
[insert class list here or post in the room]
What do we know is happening to biodiversity now?
• [insert class ideas here]
West African black rhinoceros (R.I.P. 2011) golden toad (R.I.P. 1989)
10/10/2018
3
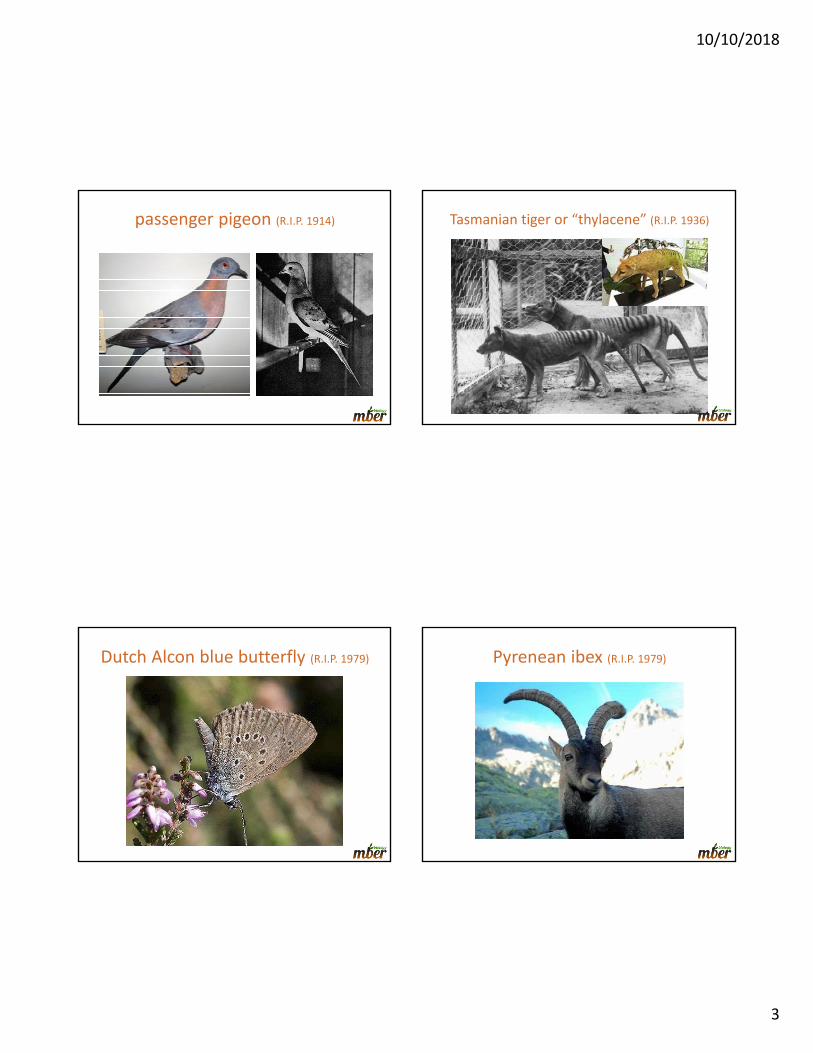
passenger pigeon (R.I.P. 1914) Tasmanian tiger or “thylacene” (R.I.P. 1936)
Dutch Alcon blue butterfly (R.I.P. 1979) Pyrenean ibex (R.I.P. 1979)

10/10/2018
4
Spix’s macaw (R.I.P. 2004) Carolina parakeet (R.I.P. 1918)
Steller’s sea cow (R.I.P. 1768) Yangtze River dolphin (R.I.P. 2006)

10/10/2018
5
What is Extinction?
[record student ideas here or elsewhere in the classroom]
Write your best summary/paraphrased definition of extinction on your Doodle Sheet in Box 2.
Looking to the Past
Can you think of examples of species that existed long ago but have not been around for millions, maybe even hundreds of millions of years?
So, if we know that the same species haven’t always been around, what can we say about biodiversity over the history of our planet?
Let’s look at what the big pattern of extinction looks like over the entire history of the earth…
Have extinctions happened in the past?
Extinctions Have Always Happened 5 Mass Extinctions
millions of years ago ( “mya” )
loss of biodiversity (%
)

10/10/2018
6
Recent Extinctions(since we’ve been paying attention)
*http://www.factmonster.com/ipka/A0934288.html**Coddington & Levi (1991) Annual Review of Ecology
GroupExtinctionssince 1500
Est. Number Species*
Birds 145 9,956Mammals 79 5,416Amphibians 36 6,199Snails and Clams 324 81,000Reptiles 22 8,240Ray-finned Fish 71 30,000Flowering Plants 121 258,650Crabs and Shrimp 8 40,000Mosses 2 15,000Insects 58 950,000Arachnids 9 180,000**
Question:Why were these arranged in this particular order?
Does anyone see a pattern?
Extinctions Across Some Major Animal Groups
63 4
24
53
1500‐1600 1600‐1700 1700‐1800 1800‐1900 1900‐2000
Mammals
610
27
48
63
1500‐1600 1600‐1700 1700‐1800 1800‐1900 1900‐2000
Birds
Graphs produced by MBERbio.
Data taken from Scientific papers:
Maas 2014, Szabo et al. 2012, Pimm 2014
0 02
12
21
1500‐1600 1600‐1700 1700‐1800 1800‐1900 1900‐2000
Amphibians
Total N
umber of Species Gone Extinct
Per Hundred Years
Total N
umber of Species Gone Extinct
Per Hundred Years
Total N
umber of Species Gone Extinct
Per Hundred Years
Century Century
Century
Are we in the 6th Mass Extinction?
• Read the article and highlight a couple o facts you think might be interesting to discuss with your group.
• Respond to the questions at the end of the article. (Be prepared to share your answers with your group.)
Are we in the 6th Mass Extinction?
• Use “Talking Sticks” to discuss the article:– The first person has 30 seconds to share their response to question #1.
– The second has 30 seconds for question #2…
and so on.
– After everyone has shared, take one minute to discuss any points you didn’t understand or any of the responses where you didn’t all agree.
• Class discussion: What do we think?

10/10/2018
7
Causes of Extinction
Let’s go back to thinking about the recent extinctions from the last few centuries…
6 3 4
24
53Mammals
What might be the cause of these recent extinctions? What do we think is going on here?
Record your ideas in Doodle Box 3.
Causes of Extinction6 3 4
24
53Mammals
Discuss your ideas with your group and come up with a group list “Causes of Extinction” on your whiteboard. Try to come up with as many ideas as you can, but make sure your ideas are clear.
Be ready to share one idea with the whole class.
Causes of Extinction:
Looking for Patterns
Let’s try to look at our list for patterns and any places we shorten it or combine ideas…
Is there a way to shorten our class list?
Are there any general patterns or themes among our causes for extinctions?
Record our class ideas in Doodle Box 4.
Human Impacts
• One commonality among our ideas about the causes of extinction is the role of humans.
• Example: Though hunting can be a really good way to help control animal populations, humans (including early humans) have hunted a number of animal species to extinction.
In Doodle Box 5, record one specific way in which you think humans may have contributed to extinctions. Be specific.

10/10/2018
8
Human Impacts
Dodo Bird: Skeleton cast and model of dodo at the Oxford University Museum of Natural History, based on modern research.
(Photo/Caption: Wikipedia)
Human Impacts
Comparison of a woolly mammoth (left) and an American mastodon (right).
(Photo/Caption: Wikipedia)
Canis lupus, the gray wolf
– nearly hunted to extinction in the United States during the 19th and 20th centuries.
Human Impacts Human Impacts: Saving Species in Trouble
• What have humans done to protect species?
• Let’s look at one species’ story to learn more about the
factors that affect populations of wildlife, what might
make them go extinct, and some of the ways in which
humans may have prevented their loss.
In Doodle Box 6, record one idea you have about how humans have worked or can work to protect species from extinction.

10/10/2018
9
A trip to the islands…
The Case of the Gray Wolf in North America
• Canis lupus, the gray wolf – one of the few large predators native to our continent.
What else do you know about gray wolves?
Record your thoughts in Doodle Box A. (On the new Doodle Sheet.)
Before European settlement
≈ 250,000 ‐ 500,000
What’s Up With Wolves?By 1960 < 300 wolves were left in the entire continental U.S.
Wolves only lived in Minnesota and in one other place…

10/10/2018
10
Isle Royale National Park Isle Royale National Park
• Established as a national park in 1940.
• Isolated: 15 miles to mainland.
• No evidence of long‐term human habitation.
• Seemingly just large enough to support wolves and moose.
• A great place to study these animals and their ecosystem!
Wildlife Conservation Biologists
These scientists are part of a team that has collected more than 50 years of data on the ecosystems of Isle Royale.
What might a graph of the wolf population for this 50‐year time period look like?
How has the wolf population changed over time? (50 years)
Sketch it on your blank wolf graph. Then describe your graph (in words) on your Doodle Sheet Box B. Recall that Isle Royale was already a protected National Park at this point in history.
Then take a minute to share with other members of your group. What did you draw? Why?

10/10/2018
11
WHOA! What’s up with the wolves?
What are we wondering about when we look at this graph?
Let’s come up with a question (or questions) we are trying to answer…
Now in your groups, consider the following specific questions:
(1) What patterns do you notice?
(2) What factors might explain the patterns?
(3) What are you wondering about? Specifically, what other information might it be helpful to have?
Record your group ideas in Doodle Box C. Be ready to share at least two.
So, there are a number of things we are still wondering about…
Would it be helpful to know more about the wolves?
And the moose?
Wanting to learn more…

10/10/2018
12
Each member of your group will read a different story.
When everyone is done, each person will share the main ideas from their reading.
Wanting to learn more…Instructions:
• Read over the handout in front of you.
– Highlight or underline key points.
– Be ready to share out the key points to your group.
• In preparation, record your key ideas in the top portion of Doodle Box D.
• In a minute, you will have a chance to hear what other group members read about, so be sure to leave some room to record their key ideas as well.
Readings: Island Overview, Moose, & Wolves
• Use the “Say Something” protocol to share ideas within the group.
• Goal: Listen attentively and record a couple of points each person makes.
• “Say Something” • One person talks at a time. When the first person is done, then…
• The “responder”– Makes an observation or comment
– Clarifies something
– Makes an inference
– Makes a connection
– Asks a question
Readings: Island Overview, Moose, & Wolves
Observation/Comment
Clarify Inference Connect Questions
I noticed that…
I think that…I saw (heard, smelled)…
This is good because…
This is hard because…
This is confusing because…
This makes sense because…
Now I understand…
No, I think it means…
At first I thought…, but now…
I agree with you, and…
What this means is…
I predict that…
I bet that…
Based on these data I think…
One thing I think is…
I wonder if…
This reminds meof…
This process is like…
This is similar to…
This…makes me think of…
It also…
This…is like…because…
How did…
In what ways are…like…
What might happen if…
Do you think that…
What evidence supports…
In other words, are you saying…
From “Success in Science Through Dialogue, Reading and Writing” By Beauchamp, Kusnick McCallum 2011
“Say Something” in response… (some ideas)

10/10/2018
13
Wolves are highly social – live and hunt in packs of 7‐8 adults, usually led by one breeding pair.
Annual litters of 4‐7 pups. Pups cared for collectively by the pack for about the first 10 months of their lives.
Prey to no other animal.
What’s Up With Wolves?
• Now that we’ve learned a bit more about the wolves, do we have any changes / additions to our initial ideas about what might be contributing to their population numbers?
• Let’s quickly add those now…
• What about questions we have?
Are there any big holes in our understanding?
Adding to Our Ideas
Let’s look at the moose population to see if it can shed more light on what might be happening with the wolves.
We might also want to know:
What’s up with the moose?The moose population over time…
Isthiswhatyouexpected?Whyorwhynot?

10/10/2018
14
Given what we know about the moose at this point, what factors do you think might affect the size of the moose population on Isle Royale?
Record ideas in Doodle Box E.
What’s up with the moose?
Let’s share some of our ideas publically.
Good. We know some things from our readings, but let’s explore further with a game…
End of Notes for Today
Moose Population Simulation Moose Population Simulation

10/10/2018
15
Moose Population Simulation
Be sure to record your data!
RESULTS – 1 year of Moose Population Group‐Round Starting Moose Births Deaths Ending Moose
Table 1 30 21 27 31
Table 2 30 12 12 34
Table 3 30 21 34 17
Table 4 30 19 17 32
Table 5 30 27 42 23
Table 6 30 12 32 28
Table 7 30 25 12 48
TOTAL 210 137 176 213
Do our game results help us to understand what is happening with the moose population?
Let’s focus in a little bit to try to make sense of this…
Choose one part of the graph where the population is either increasing or decreasing. (Pick a color which represents range of years.)
Record the years covered by your group’s chosen section and briefly describe the pattern you see in Doodle F.
1959 ‐1965
1966 ‐1973
1974 ‐1980
1988 ‐1996
1996 ‐ 1997
1981 ‐1987
2011 ‐2015

10/10/2018
16
In your groups, discuss the following:
In the game, the population stayed pretty stable. Think about / talk about why it was stable.
What is one specific modification you might make to the game to instead produce the trends you see in the moose population in your focal section of the graph? Discuss in your group.
Be certain to clearly explain how changing this one factor could produce the pattern you see in the years you are focusing on in the real moose population.
Record your group’s ideas in Doodle Box F.
And be ready to share with the class.
How do we explain these times of population change (increase or decrease)?
1959 ‐1965
1966 ‐1973
1974 ‐1980
1988 ‐1996
1996 ‐ 1997
1981 ‐1987
2011 ‐2015
Let’s boil it down…Think about what all of the times of increase had in common.
Think about what all of the times of decrease had in common.
What fundamentally determines whether the moose population increases or decreases during any time interval? What does it all come down to?
Take a moment to answer on your doodle sheet in Box G.
Our Model and the Moose
[insert model ideas associated with decreasing populations]
[insert model ideas associated with increasing populations]
How do all of the factors we said control the moose population relate to our model?

10/10/2018
17
Our Model and the MooseHow do all of those specific factors we said control the moose population relate to our model?
Pick 3 of the factors that we’ve agreed affect the moose population. (See our class list!)
With your group, create a representation that clearly relates each of factors to (1) birth, (2) death, or (3) both. Would the factor cause the population to increase or decrease? How can you tell?
Our Model and the Wolves
With your group, do the same thing for the wolves that we did with the moose. Create a representation that clearly relates each factor the model.
You may use some of the same factors if they also apply to the wolf population.
Can we explain the changes in the wolf population now?
Back to our driving question…
Record your thoughts in Doodle Box I.
Wrapping It Up
• We have a pretty decent understanding of our model and how it broadly helps us to explain changes in the number of wolves over time.
• But we know there are some things we still cannot explain…
How does our model help us here?What questions do we still have?
Add any ideas that came up just now.

10/10/2018
18
What ideas do we now have to make sense of how populations change in size over time?
[use this space or the records you have posted in your classroom to review the phenomenon and question with your students and then to summarize and “finalize” the model; skip this step if you’ve already completed this task]
Let’s revisit extinction…
We’ve seen that gray wolves on Isle Royale are in real trouble…
So, what does it mean to “go extinct”?Maybe we need to revisit our definition…
But were gray wolves ever in danger of going extinct? Why or why not?
What does it mean to go extinct?Are the wolves of Isle Royale becoming extinct?And what about gray wolves in general?
Record your thoughts in Doodle Box 7.
Let’s revisit extinction…
What does this graph about cod show us?

10/10/2018
19
Let’s revisit extinction…
What more have we learned about extinction regarding the wolves and in general?
Write your new ideas about extinction in Doodle Box 7.
What does it mean to go extinct?
Lost (c 1850) and… FOUND!!! (2003)
New Zealand Storm Petrel
It can be hard to tell when things go extinct…
What does it mean to go extinct?
Lost (c 1971) and… FOUND!!! (2005)
Mt Diablo Buckwheat
It can be hard to tell when things go extinct…
What does it mean to go extinct?
Lost (66 million years ago) and… FOUND!!! (1938)
Coelacanth
It can be hard to tell when things go extinct…
10/10/2018
20
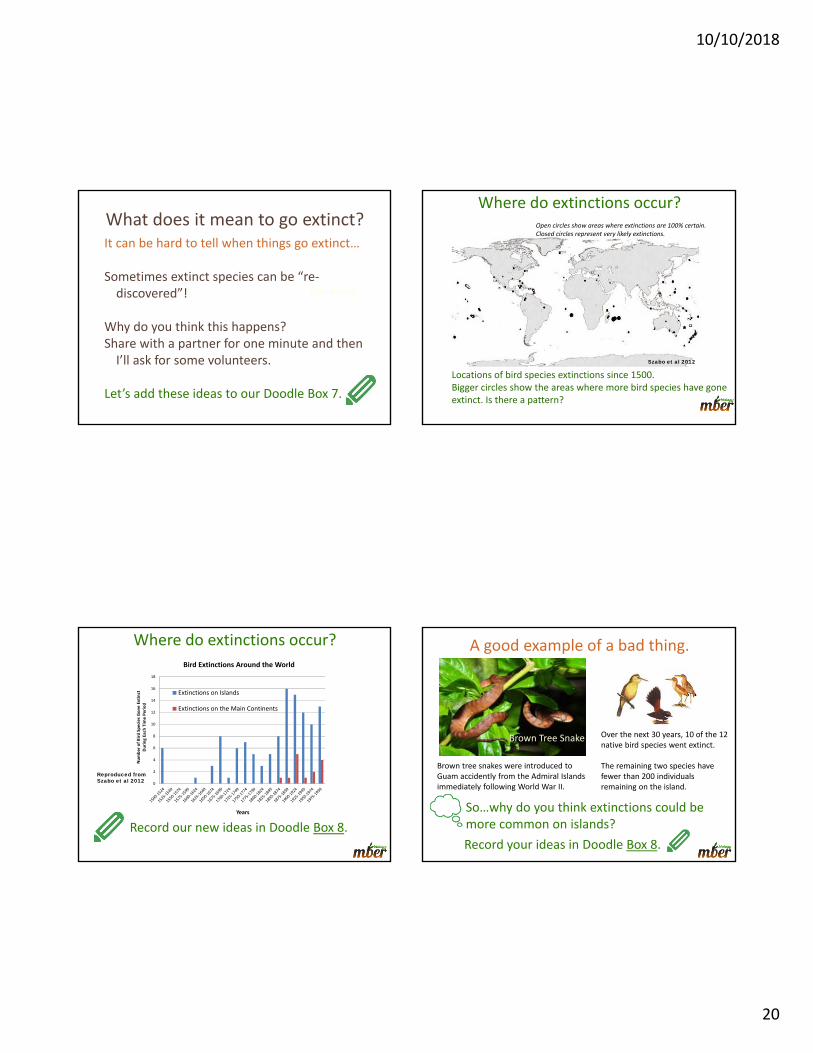
What does it mean to go extinct?
Coelacanth
It can be hard to tell when things go extinct…
Sometimes extinct species can be “re‐discovered”!
Why do you think this happens?Share with a partner for one minute and then I’ll ask for some volunteers.
Let’s add these ideas to our Doodle Box 7.
Where do extinctions occur?
Szabo et al 2012
Locations of bird species extinctions since 1500. Bigger circles show the areas where more bird species have gone extinct. Is there a pattern?
Open circles show areas where extinctions are 100% certain. Closed circles represent very likely extinctions.
Reproduced from Szabo et al 2012
0
2
4
6
8
10
12
14
16
18
Number of Bird Species Gone Extinct
During Each Tim
e Period
Years
Bird Extinctions Around the World
Extinctions on Islands
Extinctions on the Main Continents
Record our new ideas in Doodle Box 8.
Where do extinctions occur? A good example of a bad thing.
So…why do you think extinctions could be more common on islands?
Brown Tree Snake
Brown tree snakes were introduced to Guam accidently from the Admiral Islands immediately following World War II.
Over the next 30 years, 10 of the 12 native bird species went extinct.
The remaining two species have fewer than 200 individuals remaining on the island.
Record your ideas in Doodle Box 8.

10/10/2018
21
Why on islands?
Hint: recall our earlier questions…(1) Are the wolves of Isle Royale becoming extinct?(2) And what about gray wolves in general?
How does our conversation about islands relate to our wolf population?
Why do we think species go extinct on islands?
Back to Unity and Diversity
• How might our birth and death model help us to think about changes in biodiversity?
Looking again… Back to Unity and Diversity
• How might our model help us to think about changes in biodiversity?
• What if we look at the graph in the same way we looked at population graphs.
• Instead of tracking individuals over time, we are tracking species over time.
• Can we make an analogy here?

10/10/2018
22
Back to Unity and Diversity
• How might our model help us to think about changes in biodiversity?
• What if we look at the graph in the same way we looked at population graphs.
• Instead of tracking individuals over time, we are tracking species over time.
• Can we make an analogy here?
Is it the moose that drive changes in the wolf population?
What is the relationship between the populations?
Do changes in one population depend on the other?
Are other factors more important?
Do any factors affect BOTH populations?
What do you think are the most important factors for the wolf population?
Be sure to talk about evidence for your claims.
Considering Moose and Wolves Together…
Number of moose for every one wolf.
What does this graph show us about the connection between wolves and moose?
Take a minute to chat in your group. Then we’ll talk as a class.

10/10/2018
23
Number of moose for every one wolf.
So… if the decline of the wolf population is not about lack of food, what else might explain it?
Take a minute to chat in your group. Then we’ll talk as a class.
We may explore some of these ideas in later units…
…but for now, it remains a mystery.
What has happened to gray wolves in the U.S.?
• Some protection starting in 1960’s. Listed as “Endangered” in the 1970’s.
• Recovery was slow until the 1990’s when some wolves were imported from Canada to help repopulate.
So, what’s the story now?
Graph courtesy of
Canis lupus, the gray wolf – a story of recovery?

10/10/2018
24
Despite the wolf’s recovery in other portions of the U.S., the population that provided a refuge is in real trouble…
Read the article in front of you. Some of the language may be technical, but do your best.• Highlight key points. • Put parentheses around sentences or words you have questions about.
• Be ready to discuss with your group.
Wanting to learn more…
Let’s find out a little more about the recent decline of the wolves.
What has happened recently with the wolf population?
What is the suggested solution?
What do you think about the proposed solution?
What did we learn?