population geography class 4 - uc santa barbara …carr/geog141/microsoft powerpoint - geog...
TRANSCRIPT

Last Time
• International Migration in the
Developing World: Origin and
Destination Impacts
•Mexico-US Migration
Population Geography Class 4.1

Today’s Objectives
• Urbanization
• Population, Environment, and Development

• International Migration:
The Case of Mexico
Urban Density

Urbanization
World Population: Average Annual Increase For
Each Decade, 1750-2100 (projected) Source: "World
Population in Transition", Population Bulletin, by Thomas W. Merrick and PRB
0
20
40
60
80
100
1750 1800 1850 1900 1950 2000 2050 2100
Iincrease (millions) Developing Regions
Developed Regions


Urbanization - Definitions
• Urbanization - % of a nation’s populations
in urban areas or change in % urban
– static point in time measure or as sense of rate
of ↑%
• Urban Growth - increase in city size
(regardless of percent change in the city)

Primacy and Rank Size Rule
• One city per country that dominates in size and
influence = Primate City
Primacy and Rank Size Rule
• Rank Size Rule – in large countries with
diverse economies, city size is related to its
rank among country’s cities • cities ranked 4th would have a population 1/4x as large as
#1 rank

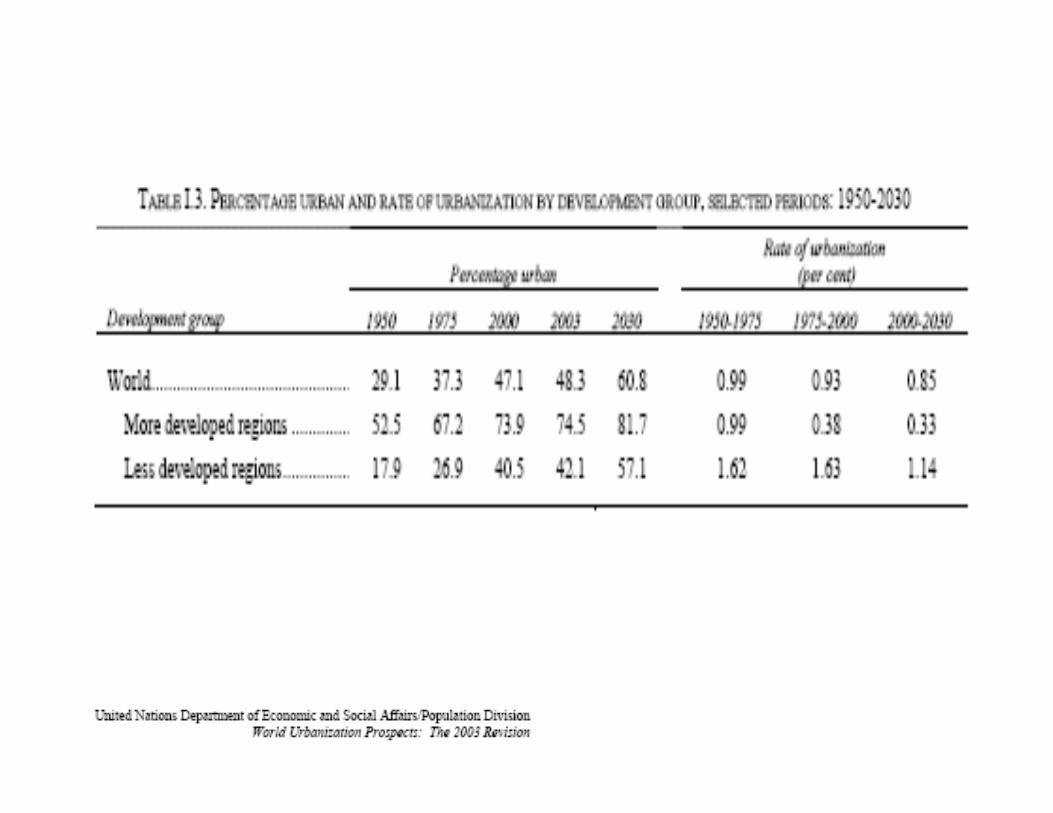
Urban Transition:
Urbanization % by Region
http://www.globalchange.umich.edu/globalchange2/current/lectures/human_pop/human_pop.html
Urbanization Transition
• Logistic curve from < 20% to > 70%
– A transition in location
– Newly industrializing countries are mimicking
the 19th century experiences of W. Europe
• 1950-75 LDCs % urban increase 17% to 28%
• vs. 1875-1900 Europe/USA % urban increase 17%
to 26%

Urban Transition: Europe
• Before 1850, no country was predominately urban
• 1900, United Kingdom is the only urban country – Today, all industrialized countries & much of Latin America are urbanized
• Europe– 1.6% in cities > 100,000 in 1600
– 2.2% “ “ in 1800
• Industrial Revolution → very rapid change: more rapid industrialization → more rapid urbanization– England 10% in cities > 100k in 1800
– 40% 1900

USA Urbanization
History
• Before 1790 < 5% urban; 1860 20% urban
– Increase in Irish and other immigration
• 1900 40% urban (>2,500); 1920 51% urban
– large scale immigration from Europe
– new industrialization in NE and Mid West
– Rural to Urban movement generally with
mechanization of agriculture
USA Urbanization
History
• Transportation technologies
– Rail transportation, Trolleys, Automobiles
• Policy and Social change
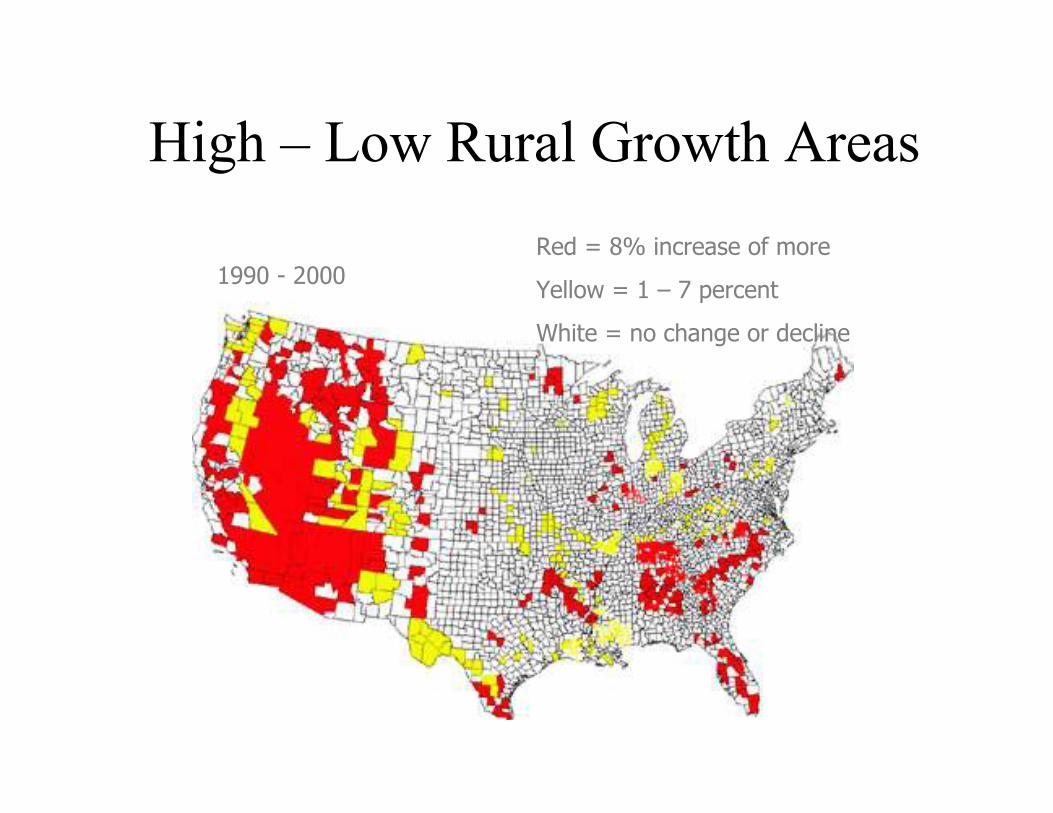
High – Low Rural Growth Areas
Red = 8% increase of more
Yellow = 1 – 7 percent
White = no change or decline
1990 - 2000

Basic U.S. Change 1990-2000

Where does this growth come
from?
• 19th C urban places had mortality > rural
• 19th C urban fertility ~ 1/3 lower than rural
• Growth of cities in 19th C due to rural to
urban migration
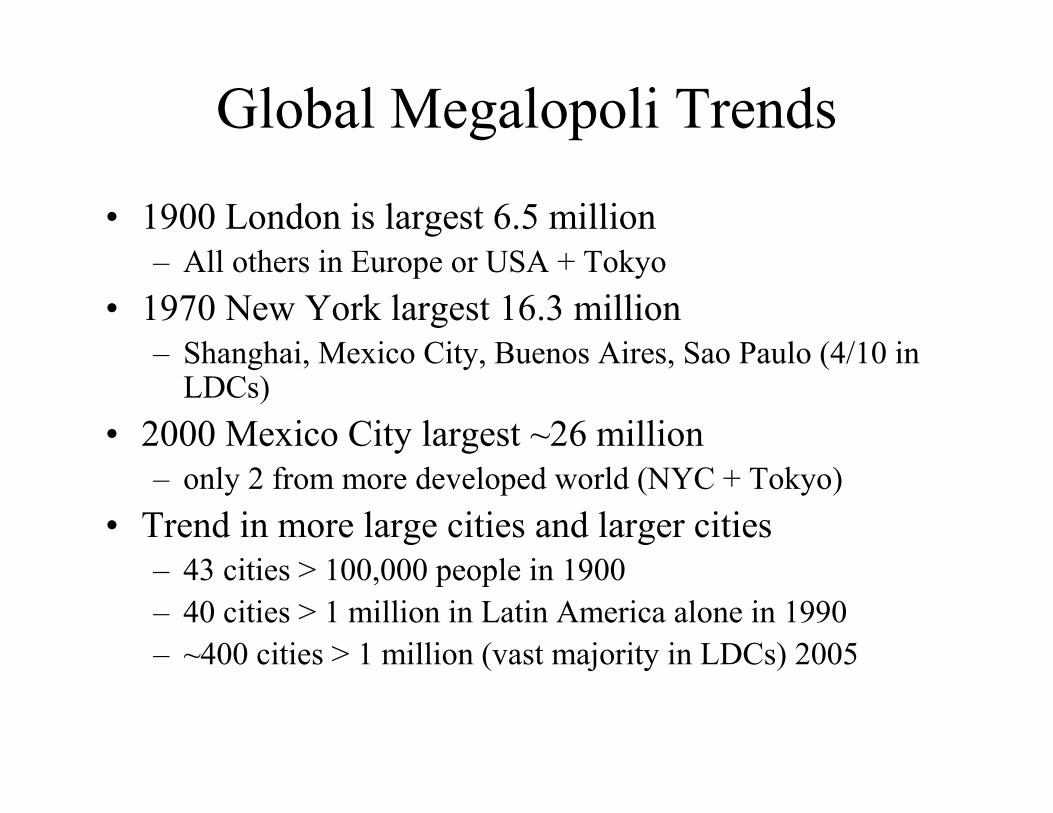
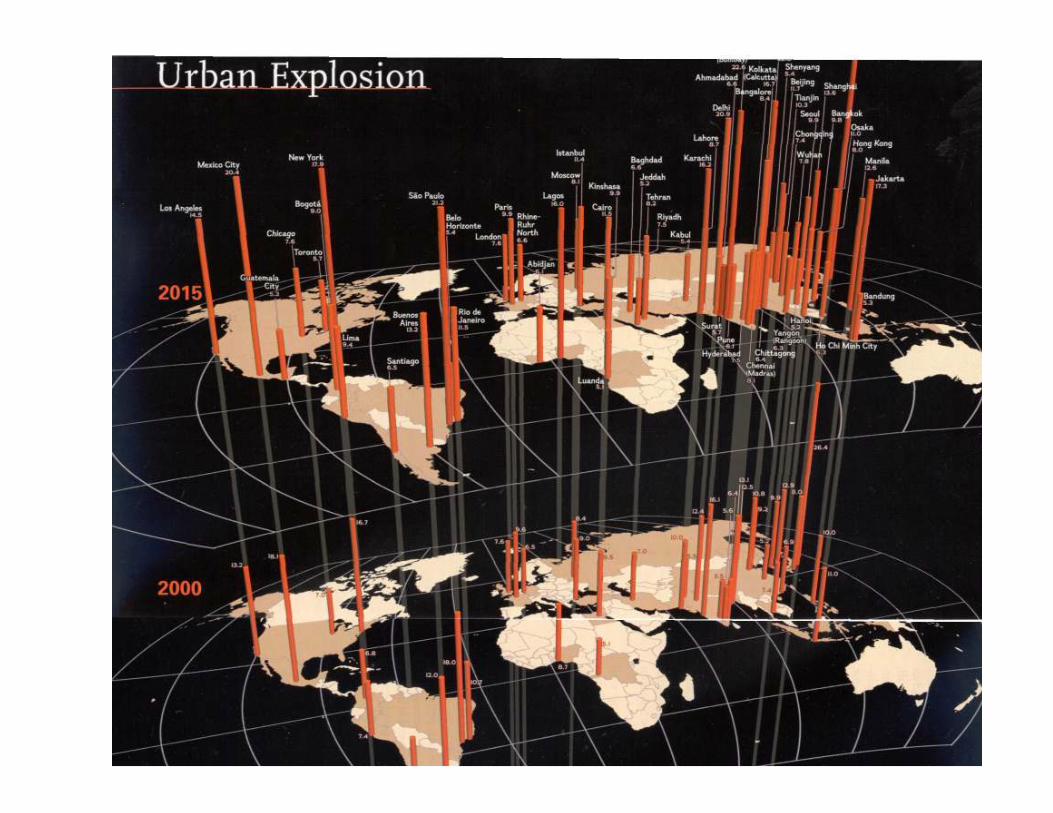
Global Megalopoli Trends
• 1900 London is largest 6.5 million– All others in Europe or USA + Tokyo
• 1970 New York largest 16.3 million– Shanghai, Mexico City, Buenos Aires, Sao Paulo (4/10 inLDCs)
• 2000 Mexico City largest ~26 million– only 2 from more developed world (NYC + Tokyo)
• Trend in more large cities and larger cities – 43 cities > 100,000 people in 1900
– 40 cities > 1 million in Latin America alone in 1990
– ~400 cities > 1 million (vast majority in LDCs) 2005


The Developing World Urban
Transition: Urbanization
from1970-2001
• Urban growth rates are 2x larger than rural
• MDCs + Latin America – Rural growth
rates very small (or negative)
• Africa: very high urban growth 4.5%/year
– 15 year doubling (highest in the world)
• Africa: rural growth rate also world’s
highest due to very rapid RNI

The Developing World Urban
Transition: Urbanization
from1970-2001
• Africa: 23% → 37.7% (307m) ~60% increase
• Asia: 20% → 38% (1.4b) ~ 2x increase
• Latin America 57% → 76% (400m) ~ 1.3x increase
• MDCs: 68-75% → ~7% increase
• LDCs: 25-40% → 1.6x increase
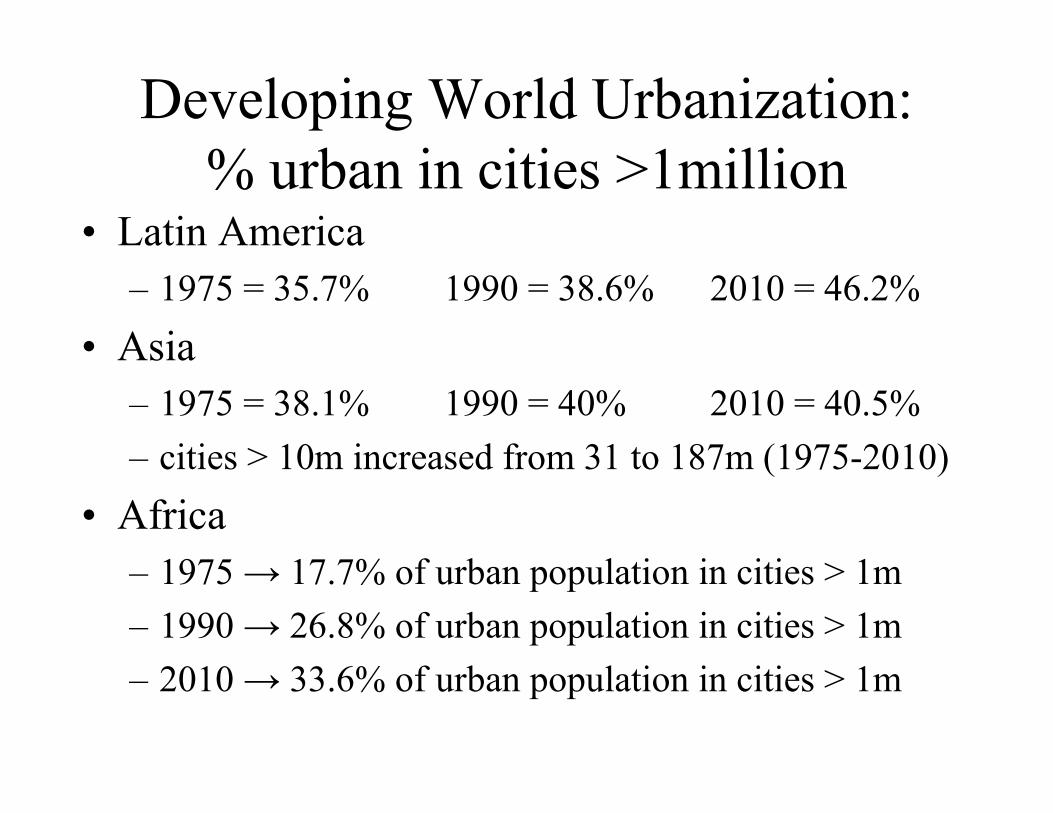
Developing World Urbanization:
% urban in cities >1million• Latin America
– 1975 = 35.7% 1990 = 38.6% 2010 = 46.2%
• Asia
– 1975 = 38.1% 1990 = 40% 2010 = 40.5%
– cities > 10m increased from 31 to 187m (1975-2010)
• Africa
– 1975 → 17.7% of urban population in cities > 1m
– 1990 → 26.8% of urban population in cities > 1m
– 2010 → 33.6% of urban population in cities > 1m
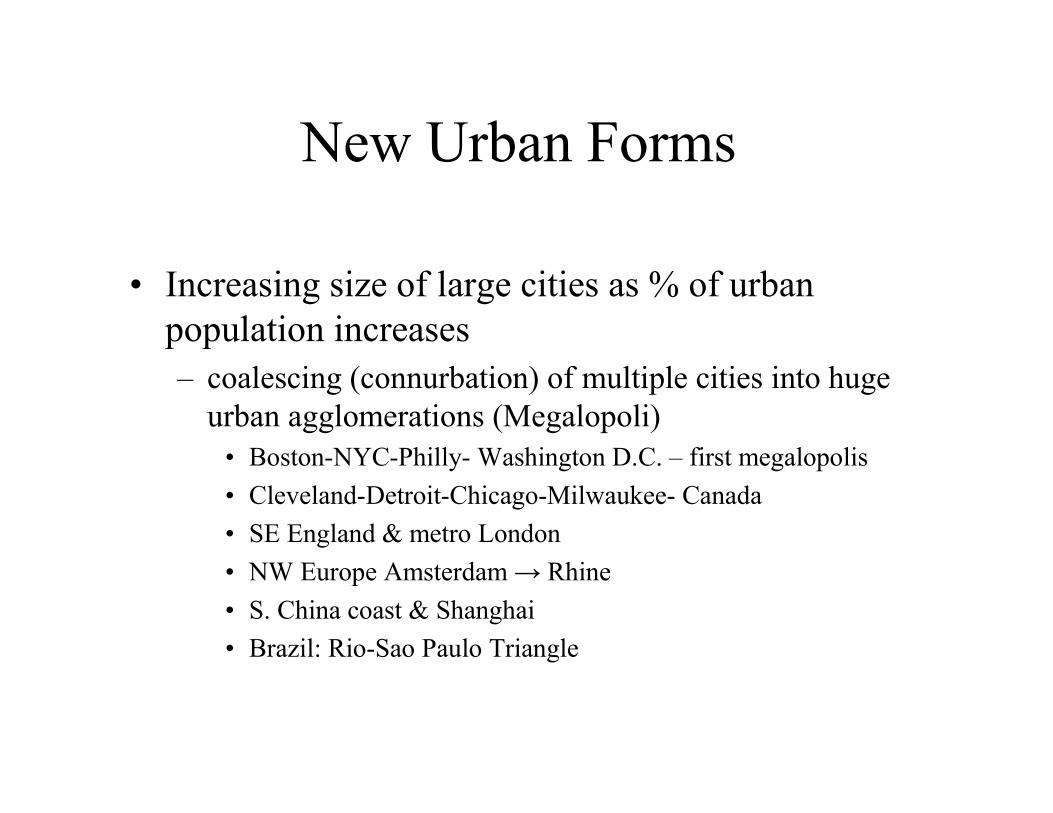
New Urban Forms
• Increasing size of large cities as % of urban
population increases
– coalescing (connurbation) of multiple cities into huge
urban agglomerations (Megalopoli)
• Boston-NYC-Philly- Washington D.C. – first megalopolis
• Cleveland-Detroit-Chicago-Milwaukee- Canada
• SE England & metro London
• NW Europe Amsterdam → Rhine
• S. China coast & Shanghai
• Brazil: Rio-Sao Paulo Triangle
Urban Futures 2002 - 2015
• Africa has highest rates of urban growth ~
same as last 20 years, 4%/year
• Latin America and MDCs rural growth is
negative (i.e. loses population)
Urban Futures 2002 - 2015
• Rural growth rates are smaller than last 20
years
• Urban growth rates are smaller 1993-2015
than 1973-93
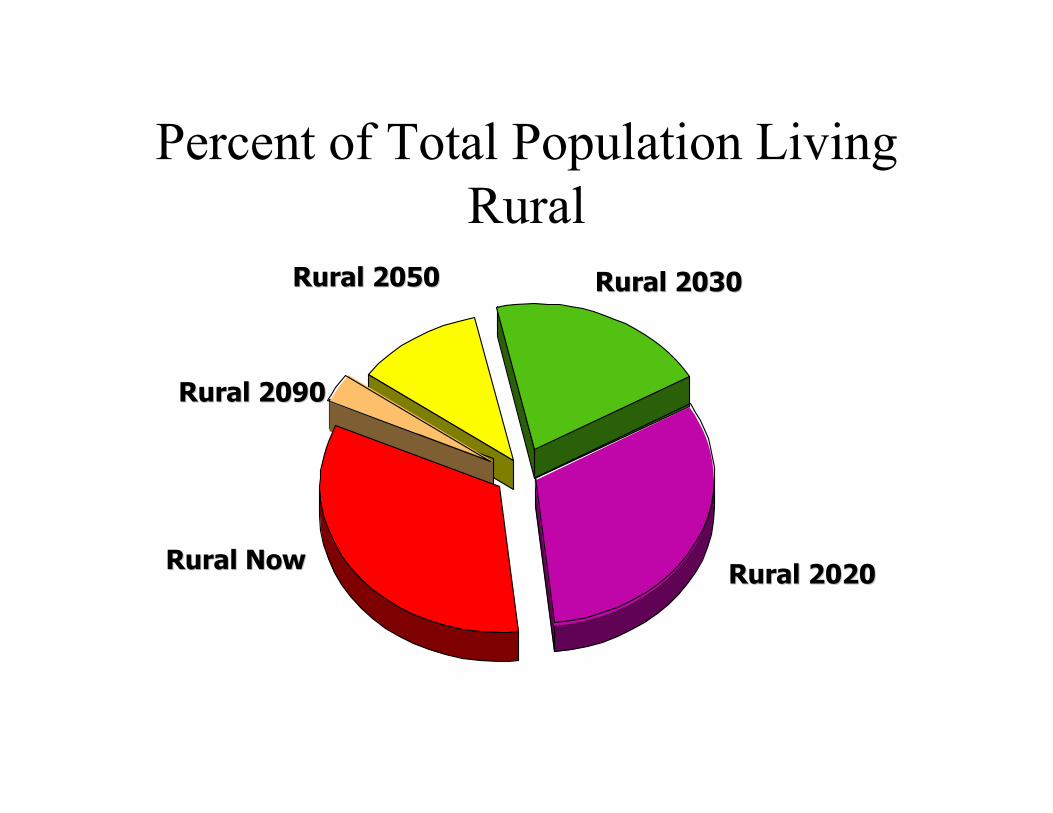
Percent of Total Population Living
Rural
Rural 2050Rural 2050 Rural 2030Rural 2030
Rural 2020Rural 2020
Rural 2090Rural 2090
Rural NowRural Now

The Year is 2050
Asians
Africans
LatinAmericans
Eastern
Europe.
NorthAmericans
Aus./N.Z.
RussianFederation
WestEurope
584
124
84
6755
52
6
28
THE GLOBAL
VILLAGE OF 1,000Rural 2050Rural 2050

Causes of Urbanization
• Rural Push
– insufficient land, few alternative economic
opportunities, few avenues for social advance,
labor-saving agriculture
• Urban Pull
– greater variety in employment, greater
possibility of advancement

Causes of Urbanization
• Social Pulls & Pushes
– (Pulls) Individual factors, Increased education
and health care
– (Pushes) Rural violence, Physical disasters

Future of Urbanization
• All the world’s net expected population growth in the next thirty years will be from urban areas.
• Smaller urban settlements (< 500,000) of the less developed regions will be absorbing most of this growth.
• Mega-cities, like Tokyo, Mexico City, and New York will continue to dominate the urban landscape in some countries, but the majority of the urban dwellers will be residing in the smaller cities.
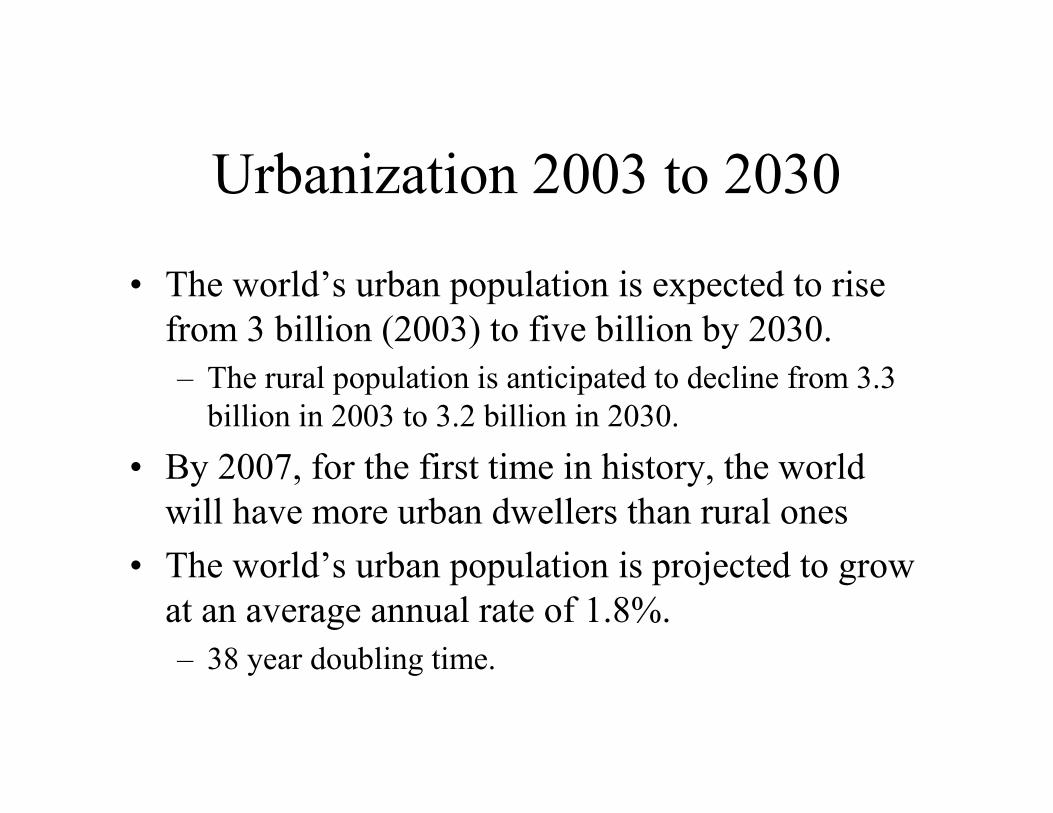
Urbanization 2003 to 2030
• The world’s urban population is expected to rise
from 3 billion (2003) to five billion by 2030.
– The rural population is anticipated to decline from 3.3
billion in 2003 to 3.2 billion in 2030.
• By 2007, for the first time in history, the world
will have more urban dwellers than rural ones
• The world’s urban population is projected to grow
at an average annual rate of 1.8%.
– 38 year doubling time.

Urbanization Impacts
Economic: Will wages increase or decrease?
Socio-economic: Education
Political-economic: Public infrastructure,
sewage, waste, roads, housing, schools, water
Demographic: Fertility, Disease transmission
Environmental: Pollution, food demand,
rural deforestation or afforestation?

5 minute break
and then…
• Population-Resources-Environment
Theories
• Historical and Current Population-
Food Patterns
• Sustainability: Green Revolution
& renewable vs. non-renewable
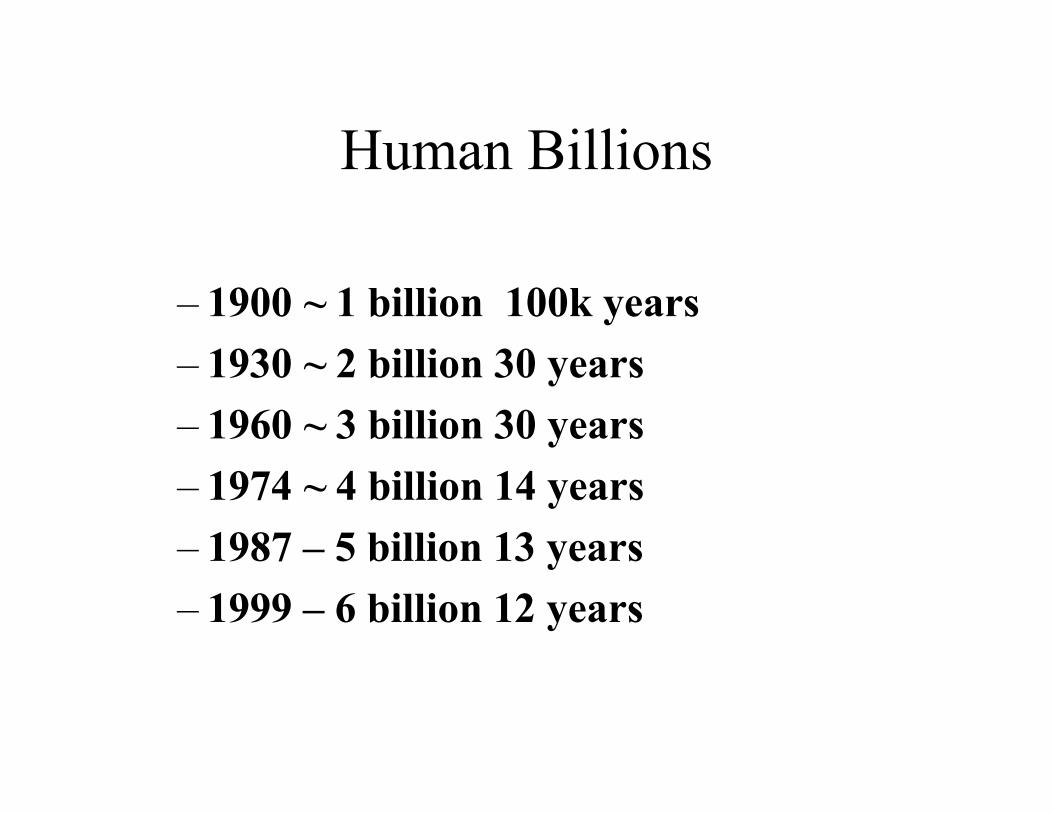
Human Billions
– 1900 ~ 1 billion 100k years
– 1930 ~ 2 billion 30 years
– 1960 ~ 3 billion 30 years
– 1974 ~ 4 billion 14 years
– 1987 – 5 billion 13 years
– 1999 – 6 billion 12 years

Current and Projected Human
Population Growth

World Population Projections
Source: United Nations, World Population Prospects, The 1998 Revision; and estimates by the Population Reference Bureau.

Carrying Capacity
• The upper limit beyond which resources that support a given population are exceeded
• Classic View - Population growth limited by resources necessary for survival
• Current View - some populations grow to OR over shoot limit and fail beyond recovery
• To what degree are humans dependent on natural resources?

Food Requirements
• Food needs are a function of population size, age structure and income
• Food demand is projected to grow 2.7%/year partly as a consequence of ↑ income
• Regionally – potential problems with food supply– Asia demand increasing at > 2.3%/year
– N. Africa + Mideast (↑ population + wealth) →3.8%/year demand growth
– S. Saharan Africa → 3.6%/year demand growth
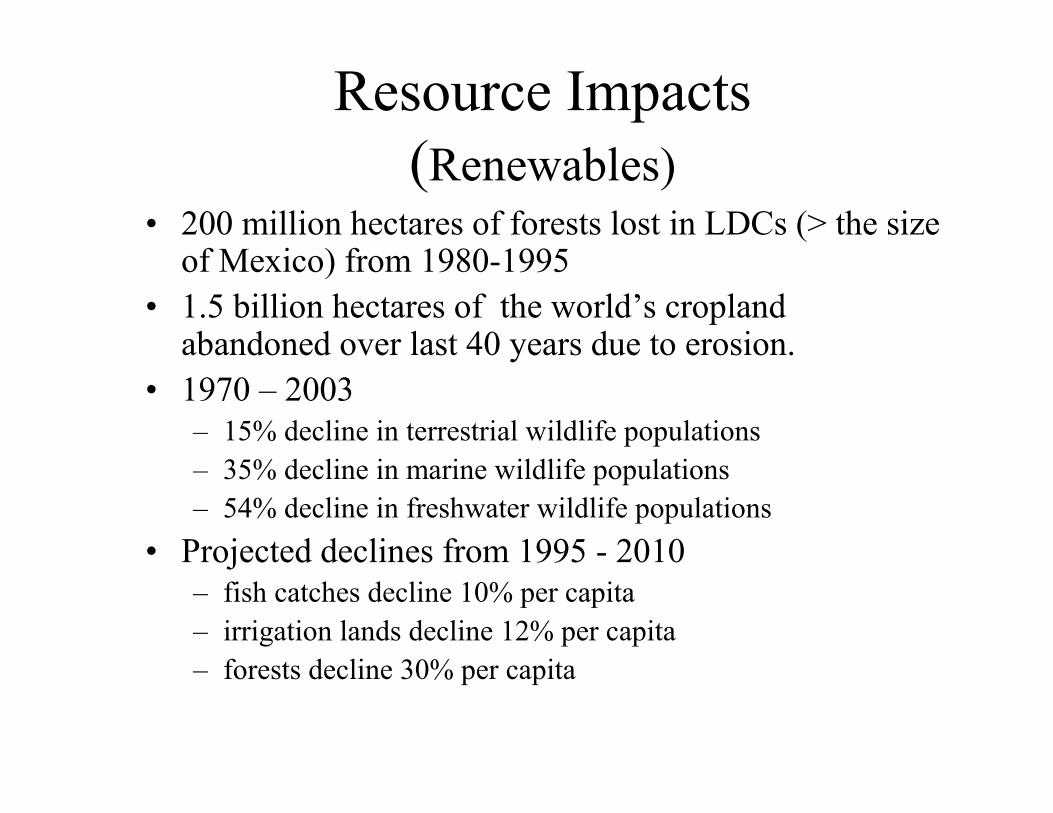
Resource Impacts
(Renewables)• 200 million hectares of forests lost in LDCs (> the size of Mexico) from 1980-1995
• 1.5 billion hectares of the world’s cropland abandoned over last 40 years due to erosion.
• 1970 – 2003– 15% decline in terrestrial wildlife populations
– 35% decline in marine wildlife populations
– 54% decline in freshwater wildlife populations
• Projected declines from 1995 - 2010 – fish catches decline 10% per capita
– irrigation lands decline 12% per capita
– forests decline 30% per capita
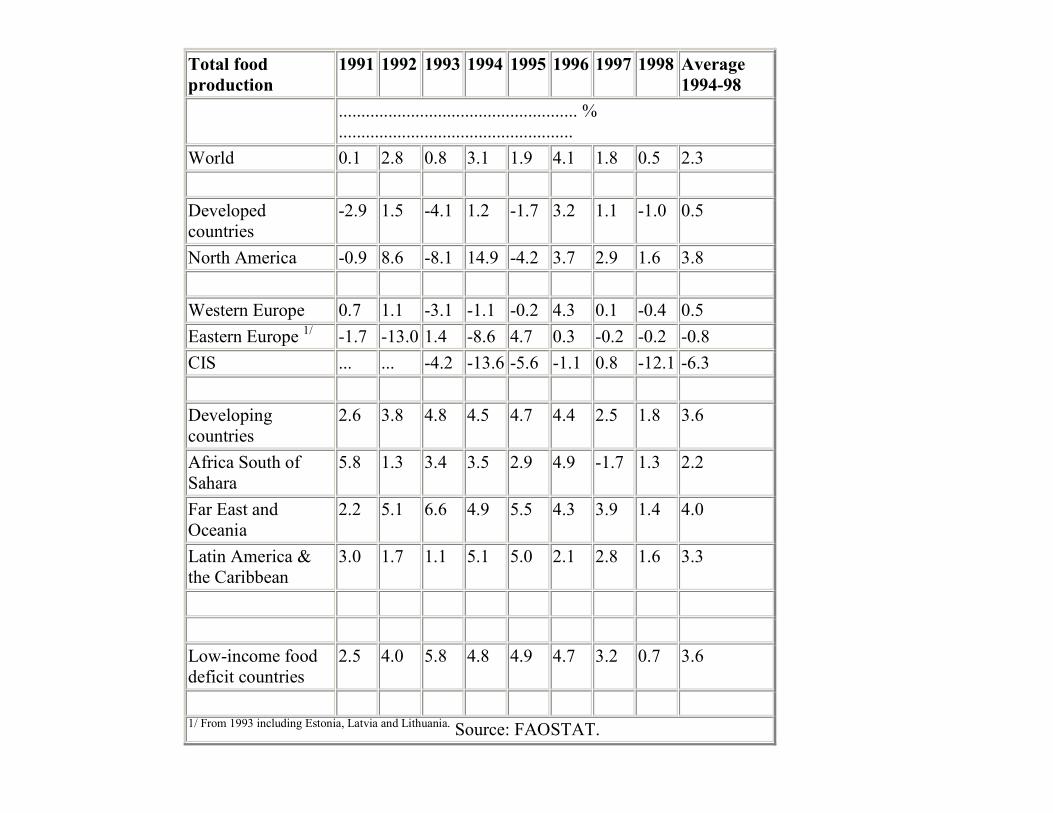
Total food
production 1991 1992 1993 1994 1995 1996 1997 1998 Average
1994-98
..................................................... % ....................................................
World 0.1 2.8 0.8 3.1 1.9 4.1 1.8 0.5 2.3
Developed countries
-2.9 1.5 -4.1 1.2 -1.7 3.2 1.1 -1.0 0.5
North America -0.9 8.6 -8.1 14.9 -4.2 3.7 2.9 1.6 3.8
Western Europe 0.7 1.1 -3.1 -1.1 -0.2 4.3 0.1 -0.4 0.5
Eastern Europe 1/ -1.7 -13.0 1.4 -8.6 4.7 0.3 -0.2 -0.2 -0.8
CIS ... ... -4.2 -13.6 -5.6 -1.1 0.8 -12.1 -6.3
Developing countries
2.6 3.8 4.8 4.5 4.7 4.4 2.5 1.8 3.6
Africa South of Sahara
5.8 1.3 3.4 3.5 2.9 4.9 -1.7 1.3 2.2
Far East and Oceania
2.2 5.1 6.6 4.9 5.5 4.3 3.9 1.4 4.0
Latin America & the Caribbean
3.0 1.7 1.1 5.1 5.0 2.1 2.8 1.6 3.3
Low-income food deficit countries
2.5 4.0 5.8 4.8 4.9 4.7 3.2 0.7 3.6
1/ From 1993 including Estonia, Latvia and Lithuania. Source: FAOSTAT.

Table 2. Annual changes in per caput food production (crop and livestock)
Per caput food
production 1991 1992 1993 1994 1995 1996 1997 1998 Average
1994-98
.......................................................... % .....................................................
World -1.4 1.2 -0.6 1.6 0.5 2.6 0.4 -0.9 0.9
Developed countries
-3.5 1.0 -4.6 0.6 -2.1 2.9 0.7 -1.5 0.1
Developing countries
0.7 2.0 3.0 2.6 2.9 2.7 0.8 0.1 1.8
Africa South of Sahara
2.9 -1.5 0.7 0.8 0.3 2.3 -4.1 -1.2 -0.4
Far East and Oceania
0.6 3.5 5.0 3.4 4.0 2.8 2.4 0.0 2.5
Latin America & the Caribbean
1.1 0.0 -0.7 3.3 3.3 0.5 1.2 0.0 1.7
Near East & North Africa
-0.1 -0.1 -0.9 -0.9 -2.2 8.1 -7.2 3.1 0.2
Low-income food deficit countries
0.6 0.4 4.0 3.0 3.2 2.9 1.5 -0.9 1.9
Source: FAOSTAT.

Thomas Malthus 1766-1834
In 1798 he argued:
• Food is necessary
• Passion between the sexes is
necessary and constant
• Population if unchecked grows geometrically
• Food production can only grow arithmetically

Thomas Malthus 1766-1834
Two forms of population regulation
• “Positive Checks” mortality
• “Preventative Checks” reduced human
fertility

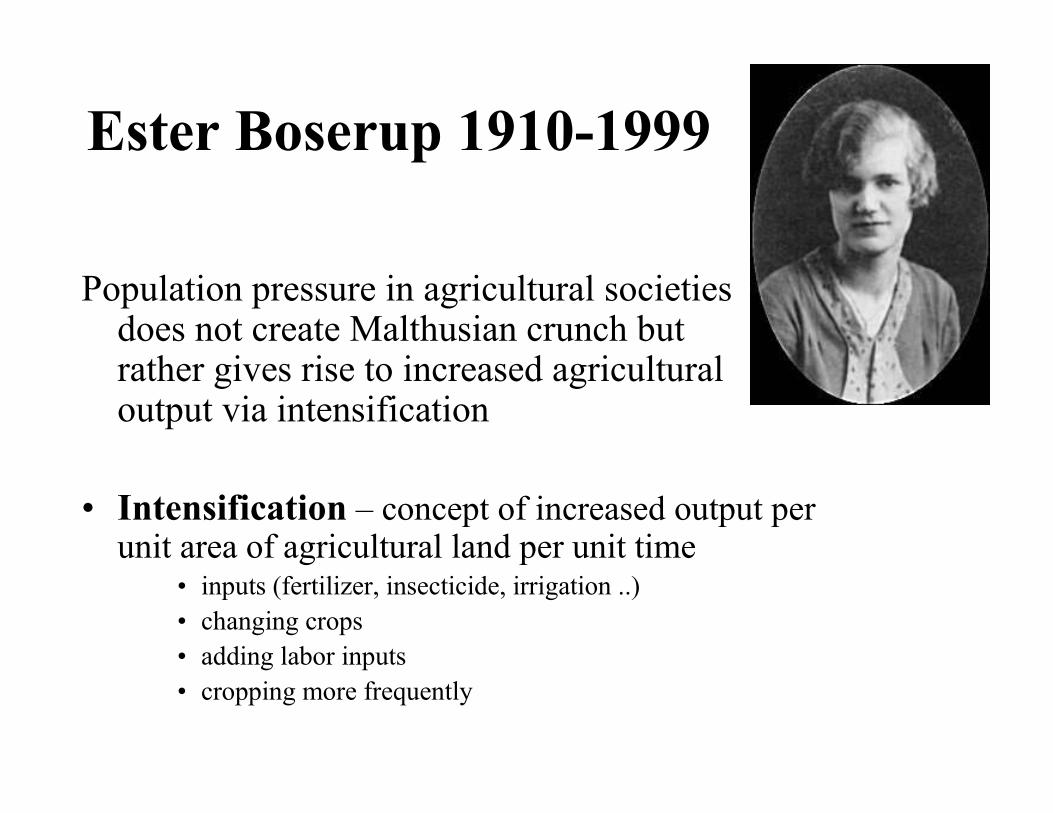
Ester Boserup 1910-1999
Population pressure in agricultural societies does not create Malthusian crunch but rather gives rise to increased agricultural output via intensification
• Intensification – concept of increased output per unit area of agricultural land per unit time
• inputs (fertilizer, insecticide, irrigation ..)
• changing crops
• adding labor inputs
• cropping more frequently

Food vs. Population:
From Theory to Reality
• Population growth has been matched by
food output growth
• Using 1961-65 as baseline:
– LDCs had increased food production 160% by
early 1980s
• Problems over last 20-30 years
– ¾ of world’s population in LDCs – but they
produce only ~ ½ the world’s food

Food vs. Population:
From Theory to Reality
• But…problems over last 20-30 years:
– ¾ of world’s population in LDCs – but they
produce only ~ ½ the world’s food

Hunger: Problem of Production
or Distribution?– Presence of food in a community no guarantee
that people have access to it
– Most famines are a failure of access more than
an absolute shortage of food
– For subsistence: availability of enough land to
produce food for the family
– For non-farmers: opportunity to get food via
exchange

Food Access Problems
• Population growth
– increase in population may push people to
environmentally marginal land

Food Access Problems
• Environmental problems
– regional drought
– environmental degradation/marginal areas

Food Access Problems
• Political economy aspects
– poor land distribution (rich have most)
– high fees/taxes/bribes
– best lands in cash export crops not food
Consequences of Hunger
• Regional scale (e.g. SS Africa)
– food shortage “classic” view of famine
– social conflict
– regional population movements
– changing demographics: ↑ mortality & ↓ fertility
– disease synergy in refugee camps

Consequences of Hunger
• Household scale
– not all suffering shared equally
– women and children
– family fragmentation


Global-Scale Food Production
• Currently, there is enough food for a basic
vegetarian diet to support ~ 6 billion
– If the available food was distributed according to need,
it would be sufficient to feed everyone in the world
– Animal foods are inefficient: <10% of vegetable food
• If 15% calories from animal sources: enough to
feed ~ 3.9b
• If~25% calories from animals: enough for ~ 2.6b

Food Poverty & Deprivation
2002
• 780 million suffer from chronic hunger
• 156 million children under five in
developing countries suffer from protein
energy malnutrition
• 16% infants worldwide born underweight
• 35% of kids < 5 years old were underweight
for age

Strategies to Prevent Food
Shortages
• Alter conditions of food availability
– Social disruption/war/revolution
• Subsistence farmers displaced from Ag lands

Strategies to Prevent Food
Shortages– Agricultural land distribution
• The best land is often controlled by few in LDCs
• Remaining population without sufficient land
• Provide sufficient non-agricultural employment
• Shortage of jobs → shortage of ability to buy food
Strategies to Prevent Food
Shortages (Increase Ag. Output)
• Institutional problems
– “Cheap” urban food policies
– Export-oriented government policies

Strategies to Prevent Food
Shortages (Increase Ag. Output)
– Policy on tenure/title also a problem
– Little direct government investment in
appropriate infrastructure for small farmers
– Internationalization of grain and agriculture
generally
– Shortage of labor in some rural areas

Have we overshot our limits?
How has food production
surpassed population growth?
Green Revolution
• Started with Rockefeller’s $ in the 1950s to
develop higher yielding varieties of wheat for
Mexican conditions
• The research has significantly increased yields of
rice & wheat in Latin America, India, Pakistan,
Philippines, Thailand, Indonesia

Green Revolution
• The development of new varieties of basic staple
grain crops that out produced traditional ones
• High Yield Varieties produce significantly larger
yields/plant (of grain) in “Ideal” special conditions
– these plants are very responsive to increased fertilizer
– need very careful control of pests
– responsive to (needs) irrigation

Green Revolution Problems
• High cost since seed is hybrid and must be
purchased (cannot save)
• High yield but also high risk – lacks diversity
of strains to protect against pest damage
• Produces less non-grain biomass
• Requires irrigation
Green Revolution Problems
• Agro chemicals contamination
– water pollution
– human health risks
– pesticides – damage environment (produce
resistant bugs)

Bio Tech – the 2nd Green
Revolution?
• Genetic engineering leads to breeding
changes:
– Breed for post/disease resistance
– Breed for tolerance for marginal conditions
– Breed for increased protein: quantity and
quality
– Expanded suite of N2 fixing crops

Renewable vs. Non-renewable
resources • Renewable resources can be used repeatedly
– Water
– Forests
– Crops
• Non-renewable resources are used once only
– Coal
– Oil

Renewable vs. Non-renewable
resources • Role of technology
• Mineral use has risen over time
• Neo-malthusian problem

Nonrenewable Resources
• Energy the key since much substitution of the resources is by energy – fax vs. letters vs. WWW/email
• Vast increase in fossil fuel use unevenly distributed– Developing world has 85% of world’s population and uses 25% of world’s oil; about the same as the US with <5% of world’s population.
• Other resource inequities– MDCs use ~ 10 more fuel/capita
– 7x more steel/capita
– 3x more cereal/capita
– 18x more wood/capita
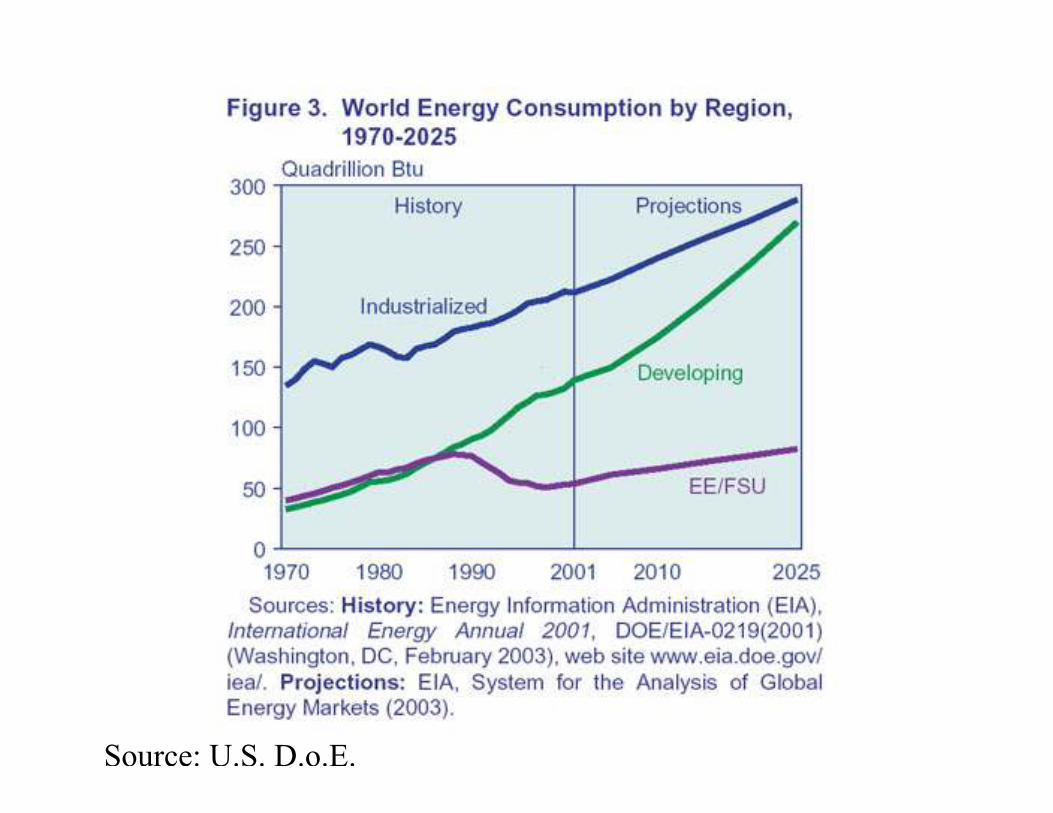
World Energy Use, 1970-2025
Source: U.S. D.o.E.

This map depicts the world's
relative geography
http://research.amnh.org/biodiversity/crisis/resconpercap.html

This map depicts the distribution
of the world's population.
http://research.amnh.org/biodiversity/crisis/resconpercap.html

This map depicts the distribution
of the world's wealth.
http://research.amnh.org/biodiversity/crisis/resconpercap.html

This map depicts global CO2
emissions
http://research.amnh.org/biodiversity/crisis/resconpercap.html

World Oil Consumption by
Region, 1970-2025
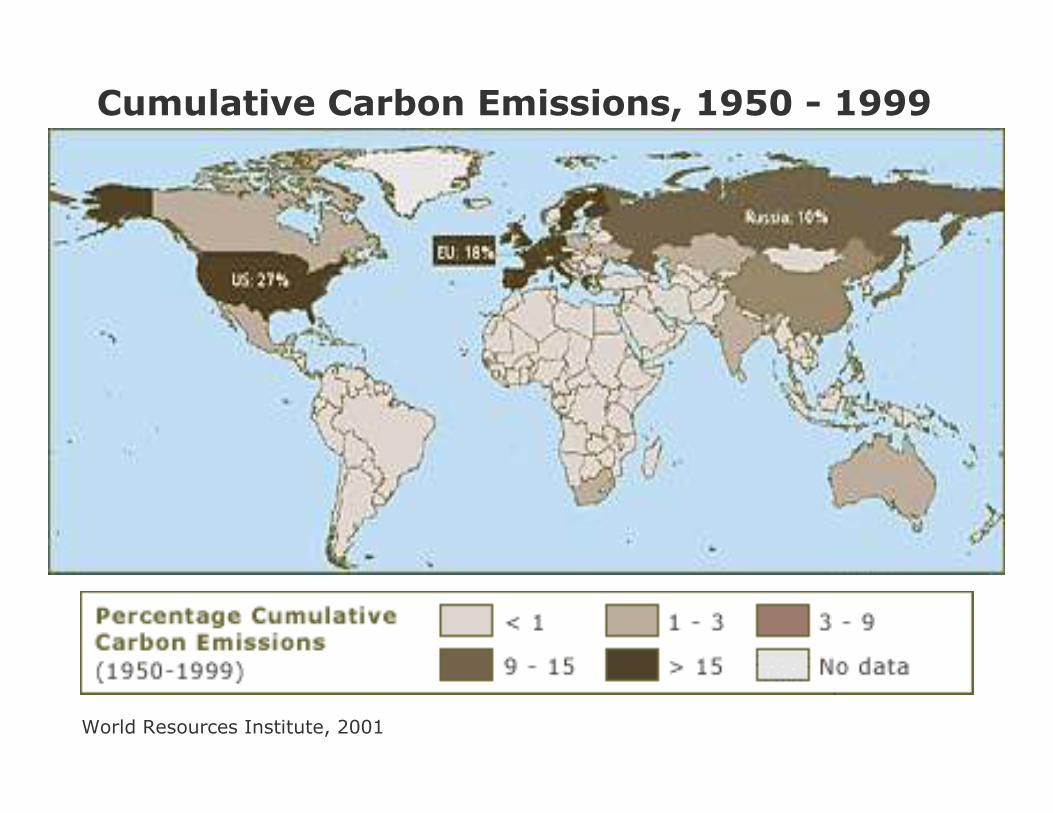
Cumulative Carbon Emissions, 1950 - 1999
World Resources Institute, 2001


Renewable Resources & Pollution
• Model of pollution/degradation - 3 parts
– Demographics Effect (population size)• population → ↑ problems
– Technology Effect (Barry Commoner)• types of technology/industry is the main problem not population
– Affluence effect (Paul Erlich)• increasing use per capita → major problem not population
– Synergies

Land Use Change and
Degradation
• Developing world population growth responsible for most (80%) deforestation
• Expansion of agriculture
– use of more marginal soils in drylands and elsewhere → potential loss of productive potential
• Increased (intensification) of agriculture on existing plots → ↑ erosion
• >2 billion use wood as fuel: deforestation/erosion
Population Impacts
• Soil degradation/erosion etc → ↓ food production
• ¾ of population in developing world live in
ecologically vulnerable areas
– low agricultural potential, increased risk to
environmental change
• ↑ population → ↑ crowding → ↓ sanitation →↑
disease (developing world cities)

Population, Resources, & Violence
– people use renewables more rapidly than appropriate
– population growth can result in overuse
– social wealth distribution can produce resource scarcity for a group
– synergies

The Example of Bangladesh
• 120m population, 0.08ha/capita, 785 people/ha, $200/capita – size of Wisconsin– physical geography: among the best agricultural soils anywhere
– high population → complete use of available cropland
– resource/population crunch → significant migration from Bangladesh to neighboring Assam in India
– conflict with India – political/ethic/religious

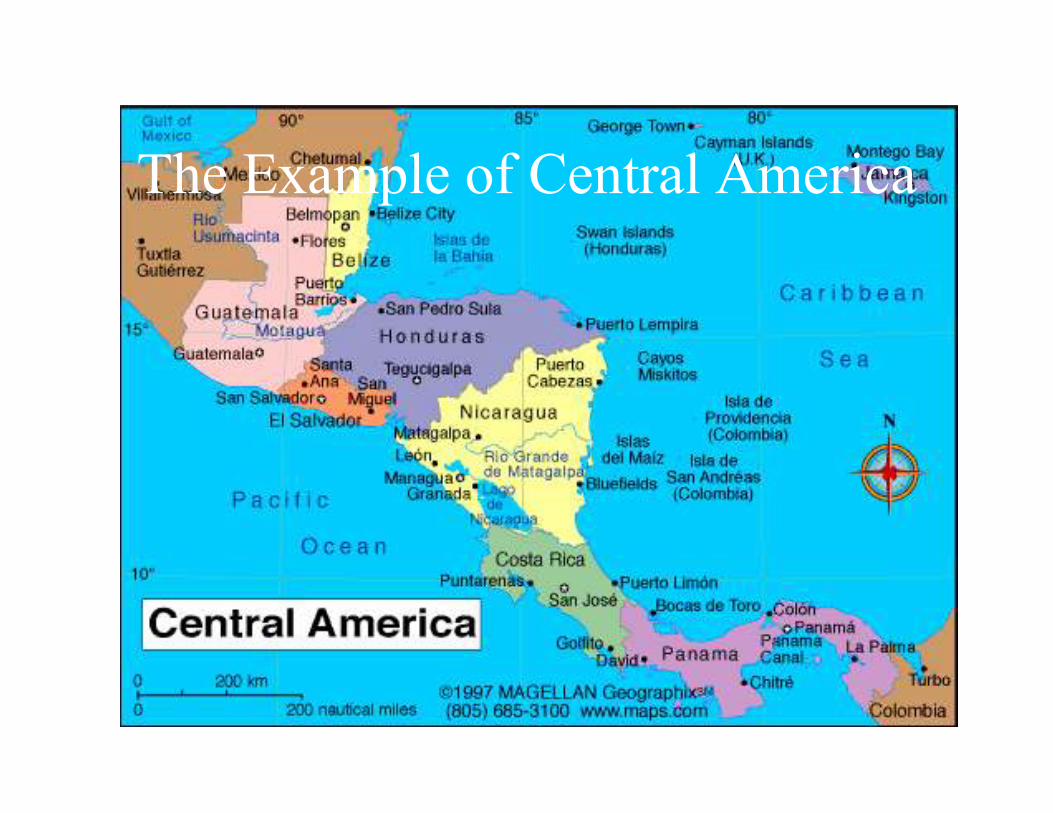
The Example of Central America

2 Worlds: 2 Kinds of Impacts
• Problems and Potential Solutions: Population and
Sustainable Development in the Developing vs.
Developed Worlds

• Half the world -- nearly three billion people -- live on less than two dollars a
day.
• The GDP (Gross Domestic Product) of the poorest 48 nations (i.e. a quarter of
the world's countries) is less than the wealth of the world's three richest people
combined.
• The world's 497 billionaires in 2001 registered a combined wealth of $1.54
trillion, greater than the combined incomes of the poorest half of humanity.
• Nearly a billion people entered the 21st century unable to read a book or sign
their names.
• Less than one per cent of what the world spent every year on weapons was
needed to put every child into school by the year 2000 and yet it didn't happen.
• 20% of the population in the developed nations, consume 86% of the worlds
goods.
The population-resource-environment nexus

An analysis of long-term trends shows the
consumption gap between the richest and
poorest countries was about:
• 3 to 1 in 1820
• 11 to 1 in 1913
• 35 to 1 in 1950
• 44 to 1 in 1973
• 72 to 1 in 1992
• 100+ to 1 in 2007

• “Today, across the world, 1.3 billion have no
access to clean water; 3 billion have no access to
sanitation; 2 billion have no access to
electricity.”
• A mere 12 percent of the world's population
uses 85 percent of its water; these 12 percent do
not live in the Third World.
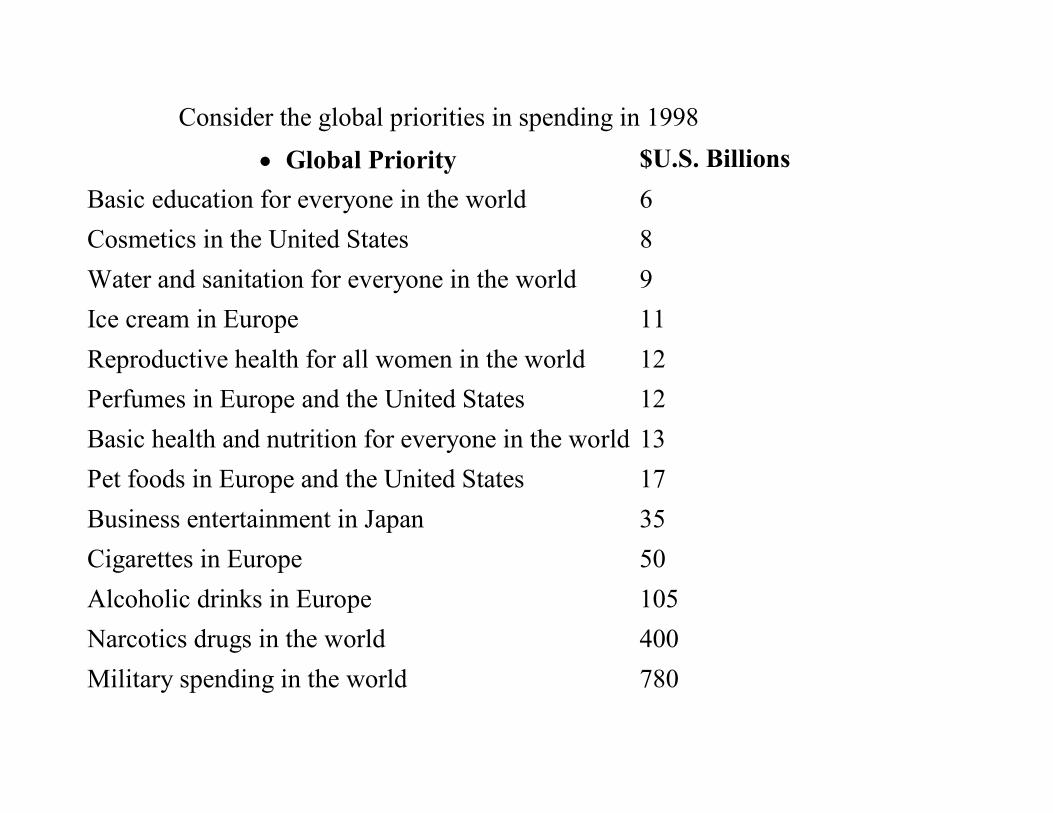
Consider the global priorities in spending in 1998
• Global Priority $U.S. Billions
Basic education for everyone in the world 6
Cosmetics in the United States 8
Water and sanitation for everyone in the world 9
Ice cream in Europe 11
Reproductive health for all women in the world 12
Perfumes in Europe and the United States 12
Basic health and nutrition for everyone in the world 13
Pet foods in Europe and the United States 17
Business entertainment in Japan 35
Cigarettes in Europe 50
Alcoholic drinks in Europe 105
Narcotics drugs in the world 400
Military spending in the world 780
Review
• Urbanization
• Population, Environment, and Development