population heterogeneity in saccharomyces cerevisiae and
TRANSCRIPT
General rights Copyright and moral rights for the publications made accessible in the public portal are retained by the authors and/or other copyright owners and it is a condition of accessing publications that users recognise and abide by the legal requirements associated with these rights.
Users may download and print one copy of any publication from the public portal for the purpose of private study or research.
You may not further distribute the material or use it for any profit-making activity or commercial gain
You may freely distribute the URL identifying the publication in the public portal If you believe that this document breaches copyright please contact us providing details, and we will remove access to the work immediately and investigate your claim.
Downloaded from orbit.dtu.dk on: Jan 31, 2019
Population heterogeneity in Saccharomyces cerevisiae and Escherichia coli lab scalecultivations simulating industrial scale bioprocesses
Heins, Anna-Lena; Carlqvist, Magnus; Gernaey, Krist V.; Eliasson Lantz, Anna
Publication date:2014
Document VersionPeer reviewed version
Link back to DTU Orbit
Citation (APA):Heins, A-L., Carlqvist, M., Gernaey, K., & Eliasson Lantz, A. (2014). Population heterogeneity in Saccharomycescerevisiae and Escherichia coli lab scale cultivations simulating industrial scale bioprocesses. TechnicalUniversity of Denmark (DTU).

Population heterogeneity in Saccharomyces
cerevisiae and Escherichia coli lab scale
cultivations simulating industrial scale
bioprocesses
PhD Thesis
by
Anna-Lena Heins
February 2014
Department of Systems Biology, Technical University of Denmark
Supervisors: Associate Professor Anna Eliasson Lantz,
Professor Krist V. Gernaey (DTU Chemical and Biochemical Engineering),
Assistant Professor Magnus Carlquist (Lund University)


Preface iv
Preface
This thesis was prepared at the Department of Systems Biology, at the Technical University of
Denmark (DTU) as partial fulfillment of the requirement for acquiring the degree of Doctor of
Philosophy (Ph.D.)
The here presented work was carried out from January 2011 till February 2014. Associate Professor
Anna Eliasson Lantz (DTU Systems Biology) was the principal supervisor for the project with
Professor Krist V. Gernaey (DTU Chemical Engineering) and Assistant Professor Magnus Carlquist
(Lund University) as co-supervisors.
This Ph.D. project was financed by the Danish Council for Strategic Research in the frame of the
project “Towards robust fermentation processes by targeting population heterogeneity at
microscale” (project number: 09-065160).
Kongens Lyngby, 2014
Anna-Lena Heins


Acknowledgements vi
Acknowledgements
First I would like to thank my three supervisors Anna Eliasson Lantz, Krist V. Gernaey and Magnus
Carlquist for giving me the opportunity of doing this project. Furthermore I’m grateful for all the
guidance, support, optimism and always an open ear especially during the last months. A special
thanks also for the long work meetings in Denmark and Sweden.
Moreover I was really lucky to be part of a project that involved a lot of different people which
were all fun to work with! Thanks for the fun workshops, group meetings, long fermentation nights,
bus or car rides with samples, sample measurement days, conferences, work meetings and always
nice chats ! A special thanks to you Rita, Luisa, Marta, Andrijana, Shanshan, Ted and Ines. Also
to Anna S. who joined the heterogeneity group for a short while.
I also want to thank all my colleagues from the former CMB for being welcoming and always nice,
helpful and anytime open for a talk. Special thanks goes to Stig, Lars, Paiman, Peter, Phillippe,
Tomas and Gerit for always being up for socialising as well as to my two offices mates Louise and
Zofia for a lot of fun, motivational talks and always finding good excuses to not work ;)!
A big thanks also goes to all the people that were there for lunch, afternoon breaks and especially
outside working hours and always up for crazy things! Thanks for all the nice evenings, nights,
days, weekend tripsBecause I Can and moments! Thanks for the motivation, head ups and for just always
being there Koletti, Sarah, Oli, Hande, Watsy, Thas (thanks for always fixing stuff), Andrea, Aleks
and BrauneyBecause I can! Special thanks also to the girls and my danish family!
Als letztes aber natürlich nicht am unwichtigsten danke ich meiner Familie dafür dass sie mich
immer unterstützt und für mich da ist auch wenn ich manchmal nichts von mir hören lasse ;).

Abstract vii
Abstract
Today it is well known that a population of cells in a bioreactor is heterogeneous, opposite to
traditional belief, and thus exhibiting distributions of single cell properties e.g. cell size, viability
and metabolic activity rather than having a set of characteristics that can be described by averaged
values. Population distributions always exist, but are significantly pronounced due to a combination
of metabolic and stress responses of single cells travelling throughout the reactor experiencing
gradients of substrate, pH and oxygen caused by non-ideal mixing in industrial scale bioprocesses.
This thesis aimed at reaching a deeper understanding of how microbial physiology and cell
dynamics are affected by the spatial heterogeneity in a bioreactor. Therefore large scale
fermentation was simulated in laboratory scale using two of the most industrially relevant
organisms E. coli and S. cerevisiae. Single cell distributions of cell size and fluorescence -
originating from growth, cell membrane robustness and ethanol reporter strains or different
fluorescence stains (for e.g. viability and metabolic activity) - were thereby followed by applying
flow cytometry. Cell responses were studied in different cultivations modes, in steady state at
different growth rates and in response to glucose perturbation in continuous culture, simulating the
feeding zone of a large scale fed-batch fermentation and in batch culture to characterise the single
cell behaviour in a dynamic environment. Furthermore, a two compartment chemostat setup,
simulating different zones seen in large scale cultivations, was developed and studied under
different compartmentalization conditions. The observed population heterogeneity distributions
were, opposite to the common approach using mean values, described and validated in a
quantitative manner through newly developed parameters, using percentile analysis followed by
multivariate statistics as well as using a modeling approach.
In general the applied reporter strains as well as fluorescence stains in combination with flow
cytometry showed to be valuable tools to study population heterogeneity in the different setups
simulating large scale fermentation that can potentially be used in development and optimisation of
industrial scale processes. Differences in growth and membrane robustness due to varying growth
conditions and between slow and fast growing cells, different metabolic activities on different
substrates and phenomena during compartmentalization which are hidden in a normal chemostat
could be successfully visualised and quantified.

Resumé viii
Resumé
Modsat den tidligere traditionelle opfattelse er det i dag velkendt at en population af celler i en
bioreaktor er heterogen. Cellerne i populationen er forskellige og derfor finder man fordelinger af
enkel celle egenskaber, f.eks. celle størrelse, levedygtighed og metabolisk aktivitet, i modsætning til
karakteristikker der kan blive beskrevet af gennemsnitlige værdier. Der vil altid være en vis
heterogenicitet i en celle population, men heterogeniciteten bliver mere tydelig på grund af forskel i
metabolske og stress responser hos enkelte celler når de bevæger sig igennem reaktoren og udsættes
for gradienter af substrat, pH og oxygen, forårsaget af en ikke-ideel omrørning i industri-skala
bioreaktorer. Denne afhandling sigter efter at opnå en større forståelse af hvordan mikrobiel
fysiologi og celle dynamik er påvirket af spatial heterogenicitet i en bioreaktor. Derfor blev
industriskala fermenteringer simuleret i laboratorieskala, hvor der blev anvendt to af industriens
mest relevante organismer, E. coli and S. cerevisiae. Enkel celle fordelinger af celle størrelse og
fluorescens – udsprunget fra henholdsvis vækst-, cellemembran robusthed- og ethanol- reporter
stammer eller fra forskellige fluorescens indfarvninger (for at detektere f.eks. levedygtighed og
metabolisk aktivitet) – blev dermed fulgt ved at anvende flødescytometri.
Cellernes respons blev studeret i forskellige fermenterings opstillinger; i steady state ved varierende
vækst rate og efter glukose pulser i kontinuerlige gæringer, med formål at simulere fodringszonen
af en storskala fed-batch fermentering samt i batch for at karakterisere cellepopulationens adfærd i
et dynamisk miljø. Dertil blev en to-kammer kemostat opstilling, med hensigt at simulere de
forskellige zoner som opstår i storskala reaktorer, udviklet og studeret under forskellige betingelser.
Den observerede population heterogenicitets fordelningen, kunde beskrives kvantitativt ved brug af
ny-udviklede matematiske parametre, percentil analyse i kombination med multivariat statistik samt
ved modellering.
Generelt set viste sig de anvendte reporter stammer, såvel som fluorescens indfarvningsmetoderne, i
kombination med flødescytometri at være værdifulde værktøjer til at studere populations
heterogenicitet i forskellige setups, simulerende storskala fermentering. Strategier brugt i denne
afhandling har potentiale til at blive anvendt i udvikling og optimering af storskala processer.
Følgende er succesfuldt blevet visualiseret og kvantificeret: Forskelle i vækst og membranrobusthed
under varierende vækstbetingelser og mellem langsomt og hurtigt voksende celler; forskellige
metabolske aktiviteter på forskellige substrater og fænomener relateret til hurtigt skift mellem

Resume ix
vækstbetingelser, som normalt er skjulte i en regulær kemostat. Desuden vil den opnåede
fysiologiske indsigt kunne bruges i udformning af fremtidlige proces optimerings strategier.

Resumé x

Table of contents xi
Table of contents
Preface ................................................................................................................................................ iv
Acknowledgements............................................................................................................................ vi
Abstract ............................................................................................................................................. vii
Resumé .............................................................................................................................................viii
Table of contents ............................................................................................................................... xi
1. Chapter: Outline and aim of the thesis ..................................................................................... 1
1.1 Aim of the thesis.................................................................................................................... 1
1.2 Outline of the thesis in brief .................................................................................................. 3
1.3 References ............................................................................................................................. 5
2. Chapter a: Background of tools for single cell analysis .......................................................... 6
2.1 Study of general physiology and single cell properties in bioprocesses ............................... 6
2.2 Tools used to study single cell properties in bioprocesses .................................................... 7
2.2.1 Basic principles of flow cytometry ................................................................................ 7
2.2.2 Reporter strains, a tool to study population heterogeneity........................................... 10
2.2.3 Fluorescent dyes that enable description of microbial properties at single cell level .. 12
2.3 References ........................................................................................................................... 15
2. Chapter b: Population heterogeneity in bioprocesses studied at single cell level: industrial
scale simulated in the lab using basic and advanced setups ......................................................... 18
Abstract .......................................................................................................................................... 19
2.1 Introduction ......................................................................................................................... 20
2.2 Population heterogeneity, microbial physiology and production studied at single cell level
22
2.2.1 Cell size and cell cycle heterogeneity .......................................................................... 22
2.2.2 Heterogeneity in physiological state ............................................................................ 23
2.2.3 Heterogeneity in Production ........................................................................................ 25
2.3 Specialised setups to simulate large scale in lab scale ........................................................ 31
2.3.1 Setups using continuous culture ................................................................................... 31
2.3.1.1 Turbidostat......................................................................................................... 31

Table of contents xii
2.3.1.2 Retentostat ......................................................................................................... 32
2.3.1.3 Cytostat .............................................................................................................. 33
2.3.1.4 Bioscope ............................................................................................................ 34
2.3.2 Miniaturised Setups...................................................................................................... 34
2.3.2.1 Microbioreactors ............................................................................................... 34
2.3.2.2 Envirostat........................................................................................................... 36
2.3.2.3 Single cell reactors and flow chamber .............................................................. 37
2.3.3 Scale down reactors ..................................................................................................... 37
2.3.3.1 PFR and STR ..................................................................................................... 38
2.3.3.2 2STRs ................................................................................................................ 39
2.4 Discussion and outlook ....................................................................................................... 46
2.4.1 Further application possibilities of the presented setups ............................................. 46
2.4.2 Need for more advanced data analysis ......................................................................... 48
2.4.3 General usefulness of the presented setups and tools for industry and outlook .......... 49
2.5 References ........................................................................................................................... 52
3. Chapter: Experimental design................................................................................................. 65
3.1 Experimental Design/ Lab scale simulation of large-scale fermentation ............................ 65
3.1.1 S. cerevisiae cultivations .............................................................................................. 65
3.1.2 E. coli cultivation ......................................................................................................... 67
3.1.3 Parameters analysed for the study of general physiology and single cell properties ... 70
3.2 References ........................................................................................................................... 72
4. Chapter: Physiological heterogeneities in microbial populations and implications for
physical stress tolerance .................................................................................................................. 73
Abstract .............................................................................................................................................. 74
Background ........................................................................................................................................ 75
Results and Discussion....................................................................................................................... 76
Population dynamics during batch cultivation ........................................................................... 76
Cell to cell variation in cell membrane robustness ..................................................................... 78
Changes in cell membrane robustness by glucose perturbation ................................................. 79
Conclusions ........................................................................................................................................ 80
Table of contents xiii
Methods .............................................................................................................................................. 80
Strains ......................................................................................................................................... 80
Molecular biology techniques ..................................................................................................... 80
Construction of reporter strains .................................................................................................. 81
Batch cultivations ....................................................................................................................... 81
Glucose gradient simulation ....................................................................................................... 82
Freeze-thaw stress experiments .................................................................................................. 82
Analyses ...................................................................................................................................... 82
References .......................................................................................................................................... 83
5. Chapter: Combined approach o principal component and interval analysis to evaluate
population heterogeneity in batch fermentation experiments of S. cerevisiae ........................... 87
Abstract .......................................................................................................................................... 88
5.1 Introduction ........................................................................................................................ 88
5.2 Materials and Methods ....................................................................................................... 91
5.2.1 Strain .............................................................................................................................. 91
5.2.2 Cultivation conditions .................................................................................................... 91
5.2.3 Sample analysis .............................................................................................................. 92
5.2.4 Data treatment and statistics .......................................................................................... 93
5.3 Results ................................................................................................................................ 94
5.3.1 Physiological characteristics of the batch cultivations .................................................. 94
5.3.2 Introduction of the method describing growth correlated GFP fluorescence and
membrane robustness originating from a dual reporter strain .................................................... 96
5.3.2.1Case one: Cell membrane robustness and growth correlated GFP fluorescence
under different conditions at pH 5 ................................................................................... 97
5.3.2.2 Case two: GFP fluorescence distributions of frozen cells for all performed
experiments .................................................................................................................... 103
5.4 Discussion ........................................................................................................................ 106
5.4.1 Usefulness of the approach for data analysis ............................................................... 106
5.4.2 Fluorescence distributions for growth and cell membrane robustness ........................ 107
5.4.3 Conclusion and Outlook............................................................................................... 108
5.5 References ........................................................................................................................ 110
5.6 Appendix .......................................................................................................................... 113

Table of contents xiv
6. Chapter: Population heterogeneity distribution in E. coli and S. cerevisiae continuous
cultivations as a response to growth rate and glucose perturbation ........................................ 116
Abstract ........................................................................................................................................ 115
6.1 Introduction ...................................................................................................................... 115
6.2 Materials and Methods ..................................................................................................... 116
6.2.1 Cultivation conditions .................................................................................................. 117
6.2.2 Freezing test of E. coli samples ................................................................................... 118
6.2.3 Sample analysis ............................................................................................................ 119
6.2.4 Data analysis ................................................................................................................ 119
6.3 Results .............................................................................................................................. 123
6.3.1 Physiology and GFP fluorescence distribution for S. cerevisiae cells at steady-state
conditions .................................................................................................................................. 123
6.3.2 Cell membrane robustness for cells from steady state conditions ............................... 127
6.3.3 Influence of glucose perturbation on S. cerevisiae physiology and GFP fluorescence
heterogeneity............................................................................................................................. 130
6.3.4 Influence on cell robustness by glucose perturbation of S. cerevisiae cultivations ..... 133
6.3.5 Freeze-thaw stress as a tool to investigate membrane robustness in E. coli cells ........ 134
6.3.6 Physiology and GFP fluorescence distribution of E. coli cells at steady-state conditions
......................................................................................................................................135
6.3.7 Influence of the glucose pulse on physiology and GFP distribution in E. coli at pH 5.5
and pH 7 .................................................................................................................................... 139
6.4 Discussion ........................................................................................................................ 144
6.4.1 Quantification of heterogeneity ................................................................................... 144
6.4.2 Freezing as a tool to determine membrane robustness ................................................ 145
6.4.3 Influence of growth rate ............................................................................................... 146
6.4.4 Influence of glucose perturbation ................................................................................ 147
6.4.5 Potential with the reporter strains and future outlook .................................................. 148
Acknowledgement ........................................................................................................................ 148
6.5 References ........................................................................................................................ 149
7. Chapter: Combined use of fluorescent dyes and a whole cell biosensor to monitor the
effect of acetate on single-cell heterogeneity of E. coli in aerobic batch cultures by flow
cytometry ........................................................................................................................................ 153
Abstract ........................................................................................................................................ 154
7.1 Introduction ...................................................................................................................... 154

Table of contents xv
7.2 Material and Methods ...................................................................................................... 157
7.2.1 Strains........................................................................................................................... 157
7.2.2 Flow cytometry ............................................................................................................ 157
7.2.3 Staining procedure and validation ................................................................................ 157
7.2.4 Preculture preparation .................................................................................................. 158
7.2.5 Batch cultivation .......................................................................................................... 159
7.2.6 OD, DW and HPLC ..................................................................................................... 159
7.2.7 Data analysis ................................................................................................................ 160
7.3 Results .............................................................................................................................. 161
7.3.1 Cellular growth physiology .......................................................................................... 161
7.3.2 GFP fluorescence during growth on glucose and acetate ............................................ 162
7.3.3 Physiological status evaluation by fluorescent staining ............................................... 164
7.3.3.1Membrane status assessment............................................................................... 164
7.3.3.2Metabolic activity assessment ............................................................................. 164
7.3.4 Heterogeneity of the populations grown on glucose and acetate ................................. 166
7.3.5 Subpopulation distributions for glucose and acetate grown cells ................................ 169
7.4 Discussion ........................................................................................................................ 170
7.4.1 Influence of acetate on heterogeneity of the population in different growth phase
compared to glucose ................................................................................................................. 171
7.4.2 Connection observed between metabolic activity using stains and physiology including
the use of growth reporter strains ............................................................................................. 171
7.4.3 Conclusions and recommendations with regards to the usefulness of the applied stains
.....................................................................................................................................172
7.4.4 Potential of the combined use of reporter strains together with stains ........................ 173
7.5 References ........................................................................................................................ 174
8. Chapter: Systematic approach for evaluation of continuous scale down fermentation of S.
cerevisiae conbining a newly developed two compartment setup with a PBM and unstructured
model ............................................................................................................................................... 178
Abstract ........................................................................................................................................ 179
8.1 Introduction ...................................................................................................................... 180
8.2 Materials and Methods ..................................................................................................... 183
8.2.1 Strains and Chemicals .................................................................................................. 183
8.2.2 Cultivation conditions .................................................................................................. 183

Table of contents xvi
8.2.3 Sample analysis ............................................................................................................ 186
8.2.4 Data analysis ................................................................................................................ 186
8.2.5 Modeling Aspects ........................................................................................................ 186
8.3 Results and discussion ..................................................................................................... 188
8.3.1 Comparison of the modeling results with the experimental setup ............................... 188
8.3.2 Variation of general physiology and cell size over time in the two compartment setup in
comparison with one compartment chemostats and modeling results...................................... 189
8.3.2.1General physiology ............................................................................................. 189
8.3.2.2Cell size ............................................................................................................... 194
8.3.3 The effect of compartmentalization on biomass productivity and yields on substrate 196
8.3.4 The use of reporter strains to gain additional information on cell physiology ............ 198
8.3.4.1Influence of compartmentalization on cell robustness/cell growth .................... 199
8.3.4.2 Influence of compartmentalization on ethanol/glucose consumption under chosen
conditions ....................................................................................................................... 202
8.4 Conclusion and general applicability of approach for future experiments ...................... 204
8.5 References ........................................................................................................................ 206
APPENDIX 1: Equations for model ............................................................................................ 209
APPENDIX 2: Experimental data for physiology and cell size and GFP respectively BFP
fluorescence distribution data for one compartment .................................................................... 213
APPENDIX 3: Modeling data for physiology and cell size distribution for one compartment ... 216
9. Chapter: Conclusion and Outlook ........................................................................................ 218
9.1 Conclusion ....................................................................................................................... 218
9.1.1 Physiological characteristics of E. coli and S. cerevisiae as reporter strains ............... 218
9.1.2 Use of flow cytometry in combination with fluorescent stains and reporter strains for
single cell analysis of microbial populations ............................................................................ 220
9.1.3 Setups for the experimental study of population heterogeneity ................................... 222
9.1.4 Data analysis applying objective methods and in combination with modeling ........... 223
9.1.5 Summary of major physiological findings related to population heterogeneity .......... 224
9.2 Outlook............................................................................................................................. 225
9.3 References ........................................................................................................................ 227
10. Appendix .................................................................................................................................. 228

Chapter 1 – Outline and aim of the thesis 1
1. Chapter
Outline and aim of the thesis
1.1 Aim of the thesis
The aim of this thesis was to achieve a deeper understanding of how the spatial heterogeneity often
seen in industrial fermentation processes influences microbial physiology, and in particular how
population heterogeneity and cell dynamics are affected. The underlying phenomena were
investigated at single cell level by experimental simulation of large-scale fermentation conditions in
laboratory scale. In addition, tools to perform population heterogeneity studies in a quantitative
manner were developed and validated in the frame of this thesis.
Traditionally microbial physiology in fermentation processes has been described using averaged
values which fail to characterise the real situation in a bioreactor1. Heterogeneous populations have
been found, for example with cells in different stages of the cell cycle and with varying activity,
which may lower the biomass yield in scale-up of aerobic processes and in addition enlarge by-
product formation2,3
. In contrast, it was found that large-scale processes with higher heterogeneity
are more robust, exhibiting a higher cell viability compared to lab-scale experiments4. The
underlying reason for both phenomena is a combination of metabolic and stress responses of the
cells resulting from glucose, pH and oxygen gradients throughout the reactor causing a highly
dynamic environment and hence a heterogeneous population3. Based on these findings the central
hypothesis arises that there is an optimal level of population heterogeneity that leads to more robust
processes while still sustaining a high productivity. But currently, the understanding of population
heterogeneity is very limited and seldom researched in detail.
To get a deeper understanding of the interplay between environmental conditions and cell responses
at the single cell level, two of the most industrially relevant organisms for production of
recombinant proteins and biopharmaceuticals, Escherichia coli and Saccharomyces cerevisiae, were
studied in different cultivation modes. The enterobacterium E. coli is widely used for the production

Chapter 1 – Outline and aim of the thesis 2
of recombinant proteins, and numerous of them have been approved for use as biopharmaceuticals
for the treatment of infectious diseases or endocrine, nutritional and metabolic disorder disease
groups like e.g. insulin for the treatment of diabetes mellitus or the human hormone somatostatin5.
Due to its advantageous physiology and characteristics (fast growth, rapid expression as well as
ease to culture and genetically modify) it has also become a model organism for prokaryotes and
therefore its genetics is better understood than those of other microorganisms6. However, E. coli
also exhibits some disadvantageous features, for example the inability to glycosylate the produced
proteins and the formation of inclusion bodies, which inactivates proteins. Furthermore, acetate that
is produced by E. coli as by-product in mixed acid fermentation not only reduces overall process
yields but also results in cell toxicity6. The well-known yeast S. cerevisiae is both used as an
eukaryotic model organism and for production of various biotechnological products7,8
. Some
industrial processes aim at S. cerevisiae itself (for bread, wine and beer production) or products
naturally produced by yeast e.g. ethanol, whereas for others like the production of recombinant
proteins and biopharmaceuticals, new metabolic pathways need to be introduced into yeast7. For
the latter case S. cerevisiae exhibits advantageous characteristics compared to prokaryotes because
the produced proteins are mostly excreted (extracellular) and S. cerevisiae can furthermore
glycosylate them in a similar way as mammalian cells, though still not all proteins produced by
yeast can be accepted by humans6. Further valuable properties of S. cerevisiae are its GRAS
(generally regarded as safe) status, considerably rapid and high density growth in defined medium,
high yields and productivity in processes and its stability as production strain making it a cost
efficient production host6. Even though S. cerevisiae as production host also shows some obstacles,
e.g. that the production of recombinant proteins also triggers conformational stress responses and
produced proteins sometimes fail to reach their native conformation, many approved protein
products are available like hormones (e.g. insulin), vaccines (e.g. hepatitis B virus surface antigen)
and virus-like particles (VLPs)5. As in the case of E. coli, most of the recombinant pharmaceuticals
from yeast are targeting the treatment of either infectious diseases or endocrine, nutritional and
metabolic disorders5.
My studies have focused on exploring causes and influences of cell population heterogeneity of the
two organisms during experimental lab-scale simulation of large-scale fermentation processes.
Hereby the focus was mainly on cultivations with glucose as substrate. Primarily, continuous
cultivations (chapter 4, 6 and 8), which are used to investigate single cell responses to different
growth rates and to simulate gradients seen in industrial scale fed-batch fermentation by

Chapter 1 – Outline and aim of the thesis 3
perturbations with substrate pulses, were used for my population heterogeneity studies. Another
way of simulating large-scale fed-batch and/or continuous cultivations is the use of multi-
compartment reactors (mostly referred to as scale-down reactors), which have been shown to be a
valuable tool to study cellular responses to gradients9 and were employed for work described in this
thesis (chapter 8). Furthermore, for strain characterization (chapter 4), to follow changes in growth
rate and single cell physiology over time (chapter 5 and 7) or study the influence of different
conditions (aerobic/anaerobic, pH and glucose concentration) on physiology, batch cultivations
were used.
During the performed cultivations, population performance and physiology were studied both at the
average population and at the single-cell level. Physiological heterogeneities during cultivation in
different process modes were studied by using flow cytometry (for method description, see chapter
2a) gathering information about cell size, morphology as well as fluorescence intensity correlated to
specific cell properties. Fluorescent dyes were used to study metabolic activity, viability and
respiration of single cells in cultivation processes (chapter 4 and 7). Furthermore, transcription
based reporter strains expressing green respectively blue fluorescent protein (GFP, BFP) were used
to study heterogeneities in growth and physiological responses to ethanol and glucose levels
(detailed description see chapter 2a). As an additional feature the GFP reporter strain could be used
to study freeze-thaw stress tolerance due to the pH sensitivity of GFP as a fluorescent reporter. The
BFP fluorescence however is pH independent (chapter 8).
1.2 Outline of the thesis in brief
At first, a short introduction to the tools and methods used in the scope of this thesis, partly based
on a review paper which is included in the appendix, is given (chapter 2a). The E. coli and S.
cerevisiae strains employed, the major measurement tool flow cytometry and the fluorescence
strains to assess single cell property distributions are introduced. Thereafter, studies of population
heterogeneity at single cell level in cultivation processes at different scales and with different
process modes presented in literature will be reviewed (chapter 2b). The sample analysis and
experimental setup used for different population heterogeneity studies in this thesis are then shortly
introduced (chapter 3). Experimental results are presented in the chapters four to eight. The major
findings of my studies will be summarised and future perspectives will be discussed in chapter nine.
In the appendix other publications that were generated during my PhD project but are not included
in this thesis are provided.

Chapter 1 – Outline and aim of the thesis 4
In chapter four, the characterization of the S. cerevisiae growth reporter strain FE440 and its
potential as a tool to investigate single-growth rate heterogeneities within a population during batch
and continuous cultivation was described. Thereafter, to obtain an objective overview of the degree
of heterogeneity seen under different conditions in batch cultivation of S. cerevisiae FE440 in lab-
scale, a data analysis method combining interval analysis with principal component analysis was
developed (chapter 5). To investigate the physiological responses to sudden changes from glucose-
limited to glucose excess conditions glucose pulses were introduced to steady state cultures of E.
coli and S. cerevisiae growth reporter strains to investigate the resulting impact on single cell
physiology. To objectively quantify the overall resulting heterogeneity, both in steady state and as a
result of the glucose pulse, descriptive mathematical tools were developed (chapter 6). In chapter
seven, a combination of five different fluorescent stains targeting different metabolic properties and
an E. coli growth reporter strain were applied to investigate the effect of acetate on population
heterogeneity in large scale fermentation. Therefore, the cells were grown in batch cultivations with
acetate respectively glucose as carbon source. To further simulate industrial production conditions
and the appearance of substrates gradients, a continuous scale down setup has been modeled in
silico and subsequently developed in the lab by connecting two stirred tank reactors (STRs) to each
other (chapter 8). This two-compartment reactor set-up was applied to further study physiology
responses to fluctuating conditions using the FE440 growth reporter strain as well as a S. cerevisiae
ethanol reporter strain expressing BFP.

Chapter 1 – Outline and aim of the thesis 5
1.3 References
1. Fernandes, R. L. et al. Experimental methods and modeling techniques for description of cell
population heterogeneity. Biotechnol. Adv. 29, 575–599 (2011).
2. Bylund, F., Collet, E., Enfors, S.-O. & Larsson, G. Substrate gradient formation in the large-
scale bioreactor lowers cell yield and increases by-product formation. Bioprocess Eng. 18,
(1998).
3. Enfors, S. O. et al. Physiological responses to mixing in large scale bioreactors. J.
Biotechnol. 85, 175–185 (2001).
4. Hewitt, C. J., Nebe-von Caron, G., Nienow, a W. & McFarlane, C. M. The use of multi-
parameter flow cytometry to compare the physiological response of Escherichia coli W3110
to glucose limitation during batch, fed-batch and continuous culture cultivations. J.
Biotechnol. 75, 251–264 (1999).
5. Ferrer-Miralles, N., Domingo-Espín, J., Corchero, J. L., Vázquez, E. & Villaverde, A.
Microbial factories for recombinant pharmaceuticals. Microb. Cell Fact. 8, (2009).
6. Demain, A. L. & Vaishnav, P. Production of recombinant proteins by microbes and higher
organisms. Biotechnol. Adv. 27, 297–306 (2009).
7. Krogh, A. M. et al. Adaptation of Saccharomyces cerevisiae expressing a heterologous
protein. J. Biotechnol. 137, 28–33 (2008).
8. Nielsen, J. & Jewett, M. C. Impact of systems biology on metabolic engineering of
Saccharomyces cerevisiae. FEMS Yeast Res. 8, 122–131 (2008).
9. Papagianni, M. Methodologies for Scale-down of Microbial Bioprocesses. J. Microb.
Biochem. Technol. 05, 1–7 (2011).

Chapter 2a –Background of tools for single cell analysis 6
2. Chapter a
Background of tools for single cell analysis
2.1 Study of general physiology and single cell properties in bioprocesses
As mentioned above, cell population heterogeneity resulting from a changing environment inside
the bioreactor implies the co-existence of cells at different physiological states. It is of outmost
importance to characterize the physiological state of single cells in a population and to monitor the
presence of potential unproductive subpopulations for industrial fermentation processes since in a
number of bioprocesses cell growth, and closely related to it physiology, is tightly correlated to
productivity1. Information about cell physiology is a prerequisite for process optimization to
achieve robust and high-yielding production. Traditionally, this knowledge has been acquired by
on-line respectively at-line measurement of a number of parameters characterizing the process (e.g.
pH and T) or the performance of the microorganism indirectly (e.g. cell density, sugar consumption,
product formation). However, with the significant improvements of the techniques for molecular
biology and systems level analysis, the physiological state of cells may be investigated in much
greater detail (see chapter 2b). This may for example involve assessment of the change in
expression levels of individual genes throughout a process, either by global transcriptomics or by
following the expression of specific genes of particular relevance1. Therefore, the traditional
methods are today known as general practices which are applied as a basis in every bioprocess and
normally more advanced methods are applied for deeper cell analysis (see chapter 2b). Single-cell
analysis of microbial populations is an advanced method that lately has received much attention,
and a number of studies focusing on quantification of single-cell properties have been reported in
the last years (see chapter and review by Schmid et al. (2010)2). Most single-cell studies generally
aim at characterisation of the microenvironment in the vicinity of individual cells (applying
traditional methods), whereas understanding the underlying phenomena of population
heterogeneity, the mechanisms or origin of the observed changes between cells is rarely done up to
now (reviewed by Fernandes et al. (2011)1). Such methodologies can be of different nature and
involve a broad range of characteristics, which in combination give information about the response
of populations to their immediate environment.
Chapter 2a –Background of tools for single cell analysis 7
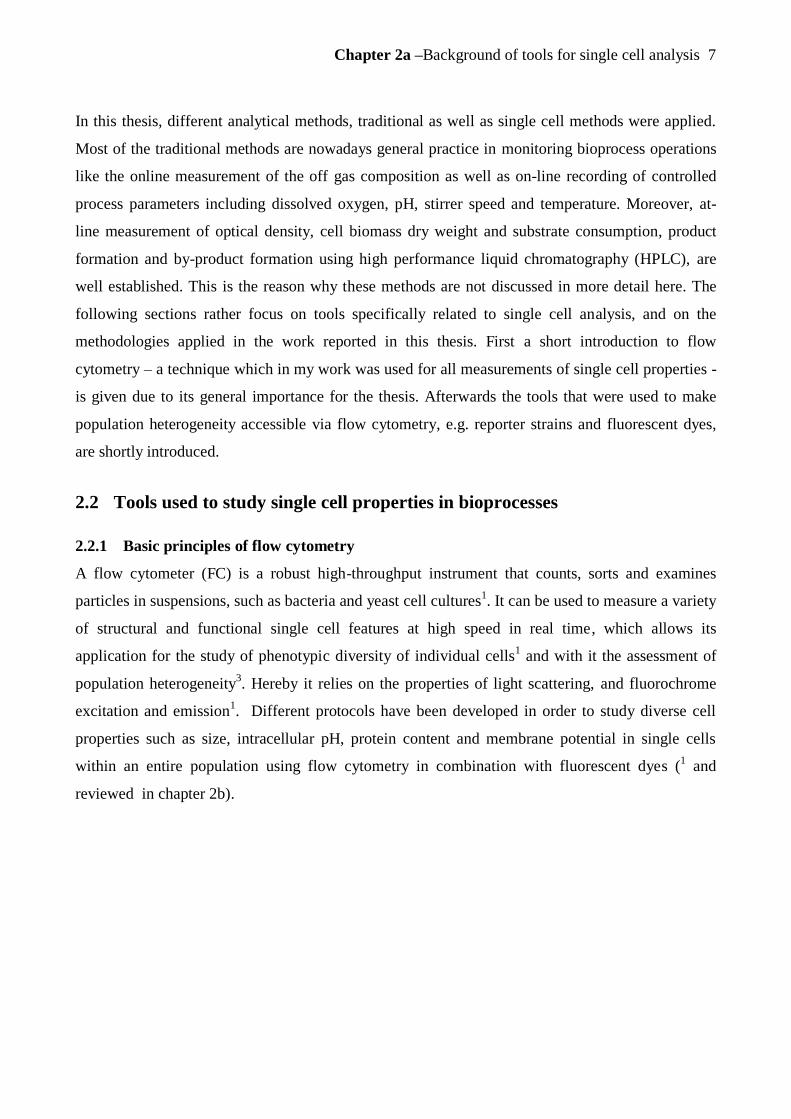
In this thesis, different analytical methods, traditional as well as single cell methods were applied.
Most of the traditional methods are nowadays general practice in monitoring bioprocess operations
like the online measurement of the off gas composition as well as on-line recording of controlled
process parameters including dissolved oxygen, pH, stirrer speed and temperature. Moreover, at-
line measurement of optical density, cell biomass dry weight and substrate consumption, product
formation and by-product formation using high performance liquid chromatography (HPLC), are
well established. This is the reason why these methods are not discussed in more detail here. The
following sections rather focus on tools specifically related to single cell analysis, and on the
methodologies applied in the work reported in this thesis. First a short introduction to flow
cytometry – a technique which in my work was used for all measurements of single cell properties -
is given due to its general importance for the thesis. Afterwards the tools that were used to make
population heterogeneity accessible via flow cytometry, e.g. reporter strains and fluorescent dyes,
are shortly introduced.
2.2 Tools used to study single cell properties in bioprocesses
2.2.1 Basic principles of flow cytometry
A flow cytometer (FC) is a robust high-throughput instrument that counts, sorts and examines
particles in suspensions, such as bacteria and yeast cell cultures1. It can be used to measure a variety
of structural and functional single cell features at high speed in real time, which allows its
application for the study of phenotypic diversity of individual cells1 and with it the assessment of
population heterogeneity3. Hereby it relies on the properties of light scattering, and fluorochrome
excitation and emission1. Different protocols have been developed in order to study diverse cell
properties such as size, intracellular pH, protein content and membrane potential in single cells
within an entire population using flow cytometry in combination with fluorescent dyes (1 and
reviewed in chapter 2b).

Chapter 2a –Background of tools for single cell analysis 8
Figure 1 – Schematic presentation of a flow cytometer: including fluidics, light source, optics
and electronic parts.
A flow cytometer (figure 1) consists of four core parts, the fluidics, the light source, the optics and
the electronic part4. The fluidics contains a flow chamber that provides and maintains a constant
laminar stream of liquid in the system which is use to transport the cells. The cell sample is injected
into the flow chamber stream (Sheath fluid) and aligned by hydrodynamic focusing4. Thereafter the
cells pass one after each other through a laser beam that is orthogonal to the flow. This allows the
detection of up to 10 000 cells /s 3. When the light impacts the cells, the focused light of the laser is
scattered in both forward and sideways directions. The forward-scattered light (FSC) can be
correlated to cell size in yeast5. For bacterial cells it provides hints about cell morphology
6. The
side-scattered light (SSC) is affected by several parameters, including granularity, cell size and cell
morphology4. The scattered light will be directly collected whereas cell fluorescence originating
from e.g. staining of specific cell characteristics (see chapter 7) or from reporter genes (applied in
all chapters) needs to be filtered by optical filter units for specific wavelength detection before
collection (e.g. 488 nm for GFP fluorescence)4. For this purpose separate fluorescence channels are
present, which allows certain cell components and properties to be selectively assayed3. The
resulting fluorescence light will then be processed through the photomultiplier converting the
recorded optical signal into an electrical impulse that will be sent to the data processing system. The
scattered light and the fluorescence signals can be combined in various ways to enable the
observation of subpopulations carrying different traits. To sort subpopulations or cells with user-

Chapter 2a –Background of tools for single cell analysis 9
specified properties, flow cytometry can also be combined with a sorting unit which offers the
possibility of separating selected cells from the rest of the population4.
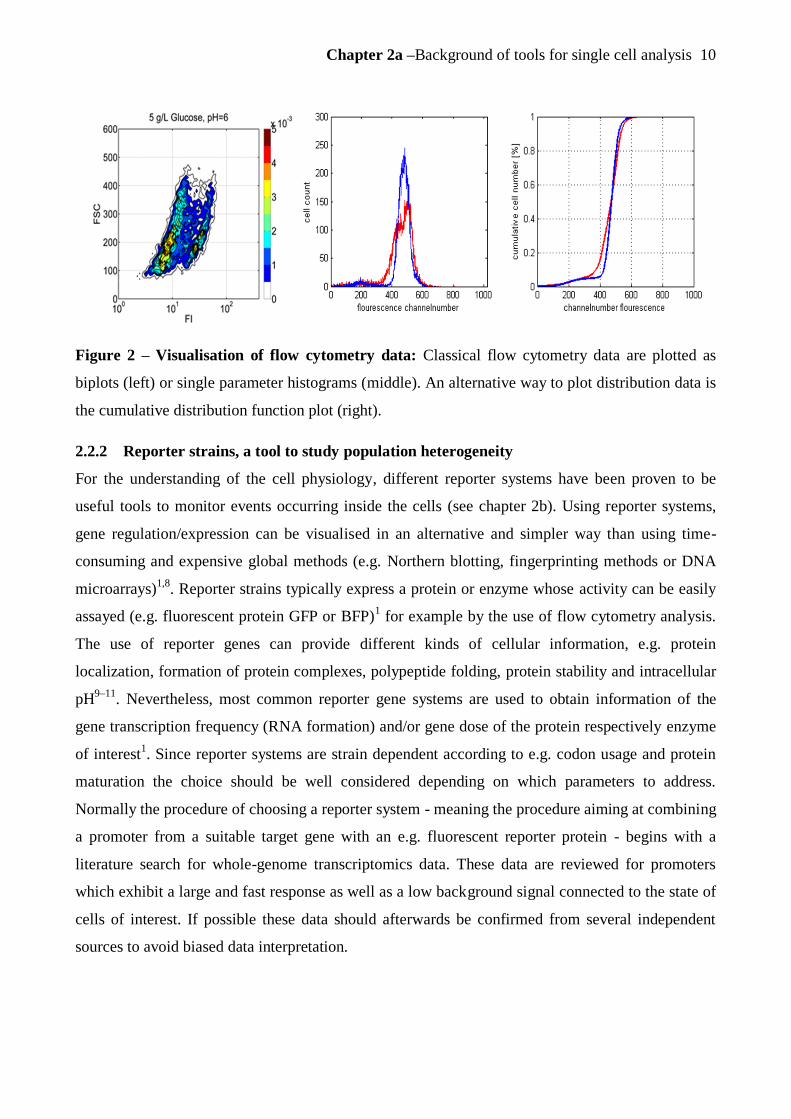
When visualizing the collected flow cytometry data, bivariate plots or single parameter plots
(histograms) are created in most cases (figure 2) using one of the various available softwares for
data processing. But also multivariate data analysis methods have been developed to improve the
extraction of information from data obtained by multi-parameter flow cytometry analysis7. In this
thesis Matlab was exclusively used for processing of the single-cell data, obtained as fcs-files from
the FC. To get a general overview of the data the above mentioned biplots or single parameter plots
(histograms) were used in the this thesis (figure 2). For the biplots two properties of the cell
population, normally FSC and GFP fluorescence, were plotted against each other to evaluate the
relation between these parameters. Additionally, when evaluating the shape of a population
distribution of a chosen property, histogram plots were utilised. Hereby the number of events/cells
recorded in each fluorescence channel, which are 1024 for the flow cytometer used in this thesis,
were plotted. Series of histograms plotted in the same graph – either stacked or stacked offset -
allow the direct comparison of the shape as well as e.g. the detection of shifts of the whole
population over time. For the deeper investigation of the shape of the population distributions, an
alternative and only rarely applied way of plotting distribution data was also used in the scope of
this thesis, namely the cumulative distribution function plot (cdf-plot, figure 2 right). The cdfplot
represents the cumulative sum of the number of events/cells recorded in sequential channelnumbers
and is normalised by the sum of the total number of recorded cells, thus resulting in a sigmoidal
shaped distribution curve. This way of plotting facilitates shape comparisons if two distributions are
similar and also clarifies the existence of subpopulations, because even small changes in the
distribution are visible as shifts in the slope of the curve.
Chapter 2a –Background of tools for single cell analysis 10
Figure 2 – Visualisation of flow cytometry data: Classical flow cytometry data are plotted as
biplots (left) or single parameter histograms (middle). An alternative way to plot distribution data is
the cumulative distribution function plot (right).
2.2.2 Reporter strains, a tool to study population heterogeneity
For the understanding of the cell physiology, different reporter systems have been proven to be
useful tools to monitor events occurring inside the cells (see chapter 2b). Using reporter systems,
gene regulation/expression can be visualised in an alternative and simpler way than using time-
consuming and expensive global methods (e.g. Northern blotting, fingerprinting methods or DNA
microarrays)1,8
. Reporter strains typically express a protein or enzyme whose activity can be easily
assayed (e.g. fluorescent protein GFP or BFP)1 for example by the use of flow cytometry analysis.
The use of reporter genes can provide different kinds of cellular information, e.g. protein
localization, formation of protein complexes, polypeptide folding, protein stability and intracellular
pH9–11
. Nevertheless, most common reporter gene systems are used to obtain information of the
gene transcription frequency (RNA formation) and/or gene dose of the protein respectively enzyme
of interest1. Since reporter systems are strain dependent according to e.g. codon usage and protein
maturation the choice should be well considered depending on which parameters to address.
Normally the procedure of choosing a reporter system - meaning the procedure aiming at combining
a promoter from a suitable target gene with an e.g. fluorescent reporter protein - begins with a
literature search for whole-genome transcriptomics data. These data are reviewed for promoters
which exhibit a large and fast response as well as a low background signal connected to the state of
cells of interest. If possible these data should afterwards be confirmed from several independent
sources to avoid biased data interpretation.

Chapter 2a –Background of tools for single cell analysis 11
In the scope of this thesis, two S. cerevisiae and two E. coli reporter strains with the expression of a
green respectively blue fluorescent protein (GFP, BFP), were applied for different studies and their
characteristics are summed up in table 1. Both E. coli reporter strains, and one of the S. cerevisiae
reporter strains are transcription based,-GFP growth reporters. The growth reporter strains carry the
GFP gene chromosomal integrated for yeast (additionally also an extra copy of the promoter of
choice) respectively on the plasmid for E. coli downstream of growth related promoters, and are
useful tools to study physiology since they provide an estimate of the growth of non-steady–state
cultures12
. In my work, I used the strains to study how environmental changes influence reporter
gene expression and consequently also influence the growth of the microorganisms.
The S. cerevisiae growth reporter strain FE440 expresses a chromosomal integrated yEGFP3 gene
(yeast optimized GFP)13
under the control of the ribosomal promoter RPL22a (further described in
chapter 4 and also used in chapter 5, 6 and 8). Ribosomal protein synthesis in S. cerevisiae is
believed to be regulated at transcription level14
implying that the amount of mRNA is correlated to
the amount of ribosomal protein. Since the ribosome biogenesis is affected by the growth rate of the
cell, transcription of the ribosomal protein genes should be correlated to growth15
, and thus GFP
expression is a marker for growth in this case (chapter 4). In addition, when applying freeze-thaw
stress the reporter strain can also be used to examine cell wall robustness, since fluorescence from
the intracellular GFP, which is pH dependent, is reduced in cells with permeabilised cell membrane
due to changes of the intracellular pH (chapter 4).
As mentioned before, both of the E. coli strains are growth reporter strains. The E. coli Fis reporter
strain is based on the fis promoter (applied in chapter 6), whose product controls the expression of a
transcriptional activator of the ribosomal RNA by recruiting the RNA polymerase to the promoter16
.
This strain carries an unstable variant of GFP17
and the genes are expressed from a low copy
number plasmid. GFP expression in the E. coli Fis reporter strain has been shown to respond to
changes in growth conditions since fis expression is immediately replying to nutrient up-and
downshift and thereby regulated by growth18–21
. The second E. coli reporter strain rrnBP1P2
(applied in chapter 7) also expresses an unstable GFP and the promoter is Fis. Fis acts as a
transcription factor that activates the rrnB promoter18
. Also for this reporter strain GFP fluorescence
has been seen to correlate to growth.
The second S. cerevisiae reporter strain is an ethanol reporter strain expressing a BFP (Johansen,
unpublished). Hereby the BFP expression is controlled by the promoter for phosphoenolpyruvate
Chapter 2a –Background of tools for single cell analysis 12
carboxykinase 1 (PCK1). PCK1 catalyzes the conversion of oxaloacetate via guanosine triphosphate
(GTP) to phosphoenolpyruvate as the first and rate-limiting step of the gluconeogenesis.
Transcriptome studies have demonstrated that the expression of PCK1 is upregulated during ethanol
consumption after diauxic shift and repressed by the presence of glucose22,23
and hence the BFP
signal will increase when glucose has been depleted and cells are utilising ethanol. Compared to the
other reporter strains that express a GFP, the use of TagBFP, whose fluorescence is pH
independent, results in that the strain cannot be used for determination of membrane robustness as
no reduction in fluorescence signal can be seen in cells exposed to freeze-thaw stress.
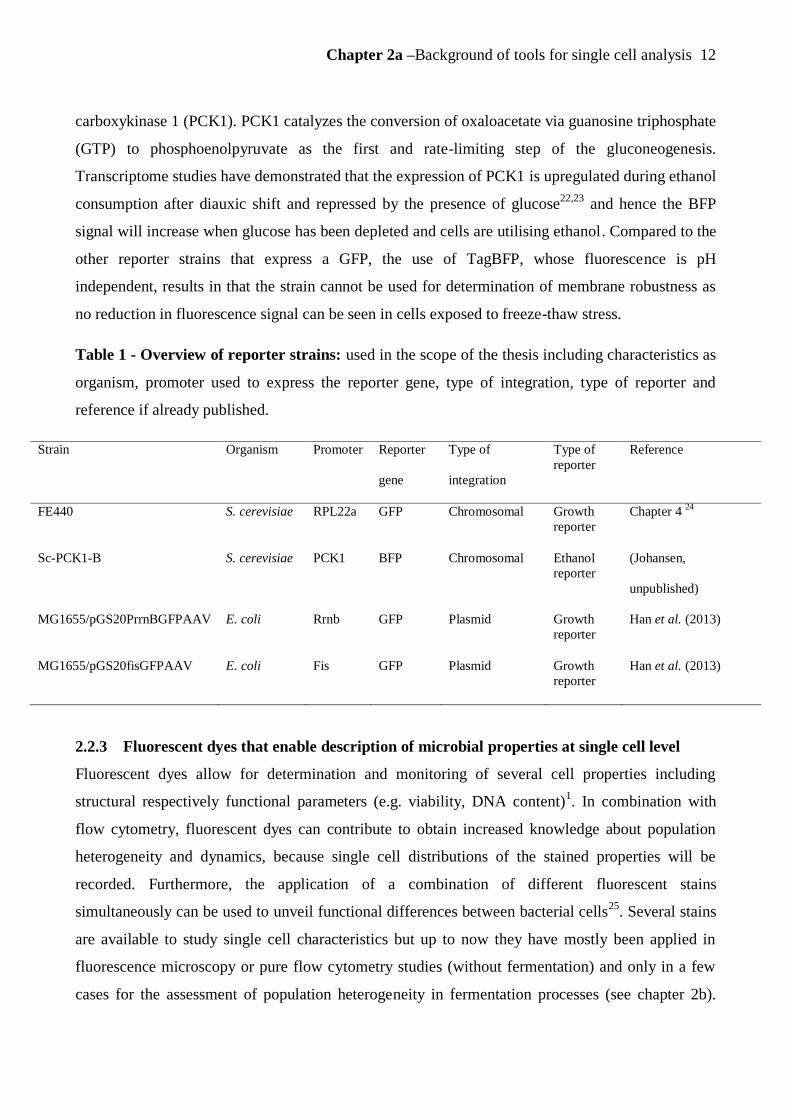
Table 1 - Overview of reporter strains: used in the scope of the thesis including characteristics as
organism, promoter used to express the reporter gene, type of integration, type of reporter and
reference if already published.
Strain Organism Promoter Reporter
gene
Type of
integration
Type of
reporter
Reference
FE440 S. cerevisiae RPL22a GFP Chromosomal Growth
reporter
Chapter 4 24
Sc-PCK1-B S. cerevisiae PCK1 BFP Chromosomal Ethanol
reporter
(Johansen,
unpublished)
MG1655/pGS20PrrnBGFPAAV E. coli Rrnb GFP Plasmid Growth
reporter
Han et al. (2013)
MG1655/pGS20fisGFPAAV E. coli Fis GFP Plasmid Growth
reporter
Han et al. (2013)
2.2.3 Fluorescent dyes that enable description of microbial properties at single cell level
Fluorescent dyes allow for determination and monitoring of several cell properties including
structural respectively functional parameters (e.g. viability, DNA content)1. In combination with
flow cytometry, fluorescent dyes can contribute to obtain increased knowledge about population
heterogeneity and dynamics, because single cell distributions of the stained properties will be
recorded. Furthermore, the application of a combination of different fluorescent stains
simultaneously can be used to unveil functional differences between bacterial cells25
. Several stains
are available to study single cell characteristics but up to now they have mostly been applied in
fluorescence microscopy or pure flow cytometry studies (without fermentation) and only in a few
cases for the assessment of population heterogeneity in fermentation processes (see chapter 2b).

Chapter 2a –Background of tools for single cell analysis 13
However many of them have great potential to be established for on-line monitoring of
bioprocesses1. For example, the novel fluorogenic Redox Sensor Green, which was also applied for
my studies (chapter 7), can be used as an indicator for the respiratory ability of cells.
Cellular viability is one of the most relevant physiological parameters to be assessed in any kind of
biological studies and also of high importance for the performance of industrial fermentation
processes. Therefore viability stains nowadays are one of the most commonly and often the only
type of stain used in bioprocess monitoring in combination with flow cytometry/online flow
cytometry. Especially in industrial fed-batch and continuous processes, where viability is a crucial
parameter to ensure a robust high yielding process they have a wide range of applications (see
chapter 2b and e.g. 26,27
). Membrane integrity is the most commonly used indicator in the
assessment of viability and is based on the capacity of cells with intact membranes to exclude the
fluorescent dye1. The most frequently applied example is Live/Dead staining
28 respectively
propidium iodide (PI) (figure 3), which has also been applied in the scope of this thesis (chapter 4
and 7) together with bis-(1,3-dibarbituric acid)-trimethine oxanol (DiBAC4(3)). DiBAC4 selectively
enters cells with depolarised membrane/lack of membrane potential (figure 3)29
.
Cellular respiration is another important cell parameter that is commonly studied in staining
experiments. The stain of choice for the determination of respiratory activity is mostly, despite of
many critical issues concerning toxicity and accuracy, 5-cyano-2,3-ditolyltetrazolium chloride
(CTC). CTC forms red-fluorescing formazan crystals inside the cell when reduced by the electron
transport system in bacterial cells (figure 3)1. CTC has also been applied in the scope of this thesis
together with SYBR Green (SYBR), a cyanine dye, which binds to nucleic acids in cells (figure 3
and chapter 7).

Chapter 2a –Background of tools for single cell analysis 14
Figure 3 – Stains used in the scope of the thesis and their targets: including the viability stains
propidium iodide (PI) and DIBAC4 as well as the metabolic activity stains CTC, RSG (Redox
sensor green) and SYBR green.

Chapter 2a –Background of tools for single cell analysis 15
2.3 References
1. Fernandes, R. L. et al. Experimental methods and modeling techniques for description of cell
population heterogeneity. Biotechnol. Adv. 29, 575–599 (2011).
2. Schmid, A., Kortmann, H., Dittrich, P. S. & Blank, L. M. Chemical and biological single cell
analysis. Curr. Opin. Biotechnol. 21, 12–20 (2010).
3. Díaz, M., Herrero, M., García, L. a. & Quirós, C. Application of flow cytometry to industrial
microbial bioprocesses. Biochem. Eng. J. 48, 385–407 (2010).
4. Rieseberg, M., Kasper, C., Reardon, K. F. & Scheper, T. Flow cytometry in biotechnology.
Appl. Microbiol. Biotechnol. 56, 350–360 (2001).
5. Porro, D., Brambilla, L. & Alberghina, L. Glucose metabolism and cell size in continuous
cultures of Saccharomyces cerevisiae. FEMS Microbiol. Lett. 229, 165–171 (2003).
6. Gottfredsson, M., Erlendsdóttir, H., Sigfússon, Á., Gottfredsson, S. & Erlendsdo, H.
Characteristics and Dynamics of Bacterial Populations during Postantibiotic Effect
Determined by Flow Cytometry Characteristics and Dynamics of Bacterial Populations
during Postantibiotic Effect Determined by Flow Cytometry. Antimicrob. Agents Chemother.
42, 1005–1011 (1998).
7. Davey, H. M., Jones, A., Shaw, a D. & Kell, D. B. Variable selection and multivariate
methods for the identification of microorganisms by flow cytometry. Cytometry 35, 162–168
(1999).
8. Misteli, T. & Spector, D. L. Applications of the green fluorescent protein in celll biology and
biotechnology. Nat. Biotechnol. 15, (1997).
9. Chien, C. T., Bartel, P. L., Sternglanz, R. & Fields, S. The two-hybrid system: a method to
identify and clone genes for proteins that interact with a protein of interest. Proc. Natl. Acad.
Sci. U. S. A. 88, 9578–9582 (1991).
10. Fields, S. & Song, O. A novel genetic system to detect protein-protein interactions. Nature
340, (1989).
11. Waldo, G. S., Standish, B. M., Berendzen, J. & Terwilliger, T. C. Rapid protein-folding
assay using green fluorescent protein. Nat. Biotechnol. 17, 691–695 (1999).
12. Brauer, M. J. et al. Coordination of Growth Rate , Cell Cycle , Stress Response , and
Metabolic Activity in Yeast. Mol. Biol. Cell 19, 352–367 (2008).
13. Cormack, B. P. et al. Yeast-enhanced green fluorescent protein (yEGFP): a reporter of gene
expression in Candida albicans. Microbiology 143, 303–311 (1997).

Chapter 2a –Background of tools for single cell analysis 16
14. Fazio, A. et al. Transcription factor control of growth rate dependent genes in
Saccharomyces cerevisiae: a three factor design. BMC Genomics 9, (2008).
15. Regenberg, B. et al. Growth-rate regulated genes have profound impact on interpretation of
transcriptome profiling in Saccharomyces cerevisiae. Genome Biol. 7, (2006).
16. Han, S., Delvigne, F., Brognaux, A., Charbon, G. E. & Sorensen, S. J. Design of growth-
dependent biosensors based on destabilized GFP for the detection of physiological behavior
of Escherichia coli in heterogeneous bioreactors. Biotechnol. Prog. (2013).
doi:10.1002/btpr.1694
17. Andersen, J. B. et al. New Unstable Variants of Green Fluorescent Protein for Studies of
Transient Gene Expression in Bacteria New Unstable Variants of Green Fluorescent Protein
for Studies of Transient Gene Expression in Bacteria. Appl. Environ. Microbiol. 64, 2240–
2246 (1998).
18. Han, S., Delvigne, F., Brognaux, A., Charbon, G. E. & Sørensen, S. J. Design of growth-
dependent biosensors based on destabilized GFP for the detection of physiological behavior
of Escherichia coli in heterogeneous bioreactors. Biotechnol. Prog. 29, 553–563 (2013).
19. Bradley, M. D., Beach, M. B., de Koning, a P. J., Pratt, T. S. & Osuna, R. Effects of Fis on
Escherichia coli gene expression during different growth stages. Microbiology 153, 2922–
2940 (2007).
20. Richins, R. & Chen, W. Effects of FIS overexpression on cell growth, rRNA synthesis, and
ribosome content in Escherichia coli. Biotechnol. Prog. 17, 252–257 (2001).
21. Zhi, H., Wang, X., Cabrera, J. E., Johnson, R. C. & Jin, D. J. Fis stabilizes the interaction
between RNA polymerase and the ribosomal promoter rrnB P1, leading to transcriptional
activation. J. Biol. Chem. 278, 47340–47349 (2003).
22. DeRisi, J. L., Iyer, V. R. & Brown, P. O. Exploring the Metabolic and Genetic Control of
Gene Expression on a Genomic Scale. Science (80-. ). 278, 680–686 (1997).
23. Daran-Lapujade, P. et al. Role of transcriptional regulation in controlling fluxes in central
carbon metabolism of Saccharomyces cerevisiae. A chemostat culture study. J. Biol. Chem.
279, 9125–9138 (2004).
24. Carlquist, M. et al. Physiological heterogeneities in microbial populations and implications
for physical stress tolerance. Microb. Cell Fact. 11, (2012).
25. Nebe-von-Caron, G., Stephens, P. J., Hewitt, C. J., Powell, J. R. & Badley, R. a. Analysis of
bacterial function by multi-colour fluorescence flow cytometry and single cell sorting. J.
Microbiol. Methods 42, 97–114 (2000).
26. Hewitt, C. J., Nebe-Von Caron, G., Nienow, a W. & McFarlane, C. M. Use of multi-staining
flow cytometry to characterise the physiological state of Escherichia coli W3110 in high cell
density fed-batch cultures. Biotechnol. Bioeng. 63, 705–711 (1999).

Chapter 2a –Background of tools for single cell analysis 17
27. Wang, J. et al. Genetic engineering of Escherichia coli to enhance production of L-
tryptophan. Appl. Microbiol. Biotechnol. 97, 7587–7596 (2013).
28. Boulos, L., Desjardins, R. & Barbeau, B. Methods LIVE / DEAD ® Bac Light E :
application of a new rapid staining method for direct enumeration of viable and total bacteria
in drinking water. J. Appl. Microbiol. 37, 77–86 (1999).
29. Laflamme, C., Lavigne, S., Ho, J. & Duchaine, C. Assessment of bacterial endospore
viability with fluorescent dyes. J. Appl. Microbiol. 96, 684–692 (2004).

Chapter 2b Population heterogeneity in bioprocesses studied at single cell level: industrial scale
simulated in the lab using basic and advanced setups 18
2. Chapter b
Population heterogeneity in bioprocesses studied at
single cell level: industrial scale simulated in the lab
using basic and advanced setups
Heins A.-L. 1, Carlquist M.
1,3, Gernaey K.V.
2, Eliasson Lantz A.
1
1 Department of Systems Biology, Technical University of Denmark, 2800 Kongens Lyngby,
Denmark
2 Department of Chemical Engineering, Technical University of Denmark, 2800 Kongens Lyngby,
Denmark
3 Present address: Department of Chemistry, Division of Applied Microbiology, Lund University,
221 00 Lund, Sweden
Written as review
Status: Manuscript in preparation

Chapter 2b Population heterogeneity in bioprocesses studied at single cell level: industrial scale
simulated in the lab using basic and advanced setups 19
Abstract
This review focuses on the setups and tools that are used to study population heterogeneity in bench
scale. Population heterogeneity is a phenomenon that is especially observable in large scale
industrial fermentation processes. Hereby mostly studies that use E. coli and/or S. cerevisiae are
taken into account due to their relevance as industrial production hosts for biomass, bulk chemicals,
enzymes and recombinant proteins. After a summary on how population heterogeneity is studied in
classical process or lab scale setups of batch, fed-batch and continuous culture (chemostat), specific
setups developed or potentially valuable for the study of single cell heterogeneities are presented.
This includes microbioreactors (MBRs), single cell reactors/flow chambers, scale down reactors
(SDRs, also referred to as multi compartment reactors) as well as special setups that are based on
continuous cultivation. These setups are chosen as they have special characteristics which would be
suitable or are already used to study single cells in a controlled environment under e.g. extreme
growth conditions, following rapid changes originating from external perturbations of the stable
environment or automated sampling followed by investigation of single cell distributions. Flow
cytometry is presented, since it is a technique that is often used as a central measurement tool for
the different kinds of studies on cell heterogeneity due to its increasing importance for single cell
analysis, but also other tools like fluorescence sensors and fluorescence microscopy are mentioned.
Methods are focusing on the use of fluorescence stains, reporter strains or other methods to access
population heterogeneity. Additionally possibilities for data analysis that are other than the classical
presentation of mean values are depicted.
Table of contents
2.1 Introduction ......................................................................................................................... 20
2.2 Population heterogeneity, microbial physiology and production studied at single cell level
22
2.2.1 Cell size and cell cycle heterogeneity .......................................................................... 22
2.2.2 Heterogeneity in physiological state ............................................................................ 23
2.2.3 Heterogeneity in Production ........................................................................................ 25
2.3 Specialised setups to simulate large scale in lab scale ........................................................ 31
2.3.1 Setups using continuous culture ................................................................................... 31

Chapter 2b Population heterogeneity in bioprocesses studied at single cell level: industrial scale
simulated in the lab using basic and advanced setups 20
2.3.1.1 Turbidostat......................................................................................................... 31
2.3.1.2 Retentostat ......................................................................................................... 32
2.3.1.3 Cytostat .............................................................................................................. 33
2.3.1.4 Bioscope ............................................................................................................ 34
2.3.2 Minituarised Setups...................................................................................................... 34
2.3.2.1 Microbioreactors ............................................................................................... 34
2.3.2.2 Envirostat........................................................................................................... 36
2.3.2.3 Single cell reactors and flow chamber .............................................................. 37
2.3.3 Scale down reactors ..................................................................................................... 37
2.3.3.1 PFR and STR ..................................................................................................... 38
2.3.3.2 2STRs ................................................................................................................ 39
2.4 Discussion and outlook ....................................................................................................... 46
2.4.1 Further application possibilities of presented setups ................................................... 46
2.4.2 Need for more advanced data analysis ......................................................................... 48
2.4.3 General usefulness of the presented setups and tools for industry and outlook .......... 49
2.5 References ........................................................................................................................... 52
2.1 Introduction
Microbial cells, primarily genetically modified, are nowadays extensively used in industrial scale
fermentation processes for the production of diverse goods like biomass, bulk products e.g.
bioethanol, pharmaceuticals or recombinant proteins1,2
. Yeast, especially S. cerevisiae, as well as
bacteria like E. coli are applied in several of these different processes3–6
.
Together with the steadily rising demand for sustainable high yielding production processes, also
the demand for robustness of biotechnological production systems/hosts increases, which
consequently needs to be well characterised and controllable. Optimization of fermentation
parameters is therefore crucial. The development in instrumental tools enabled the study of single
cells involved in production processes in bioreactors, and consequently it is generally known today
that cultures originally perceived as homogeneous, in fact show a heterogeneous behavior

Chapter 2b Population heterogeneity in bioprocesses studied at single cell level: industrial scale
simulated in the lab using basic and advanced setups 21
(reviewed in7,8
): population properties are distributed rather than following, as generally assumed,
averaged characteristics9,10
. These distributions originate from gradients, especially seen in large
scale industrial processes, of e.g. substrate, pH, oxygen or other factors changing the environment
of cells. Gradients arise due to non-ideal mixing creating local microenvironments in the reactor
which induce dynamic changes to the single cell distribution10–12
. But population heterogeneity is
also a generally accepted phenomenon in bench scale cultivations and in even smaller scale in e.g.
biofilms which are reviewed elsewhere13
. As a consequence of population heterogeneity elevated
stress responses of cells circulating throughout the reactor, reduced yields and productivities as well
as increases by-product formation were observed, but also higher cell robustness, especially at low
growth rates, as well as quick adaption to new conditions, making population heterogeneity a two-
sided phenomenon11,12,14–17
. Therefore the investigation to improve its understanding and
subsequently enable the control of heterogeneity is of high importance to optimise production
processes as well as develop new microbial cell factories.
To approach single cell heterogeneity flow cytometry (FC) has become a valuable tool and has
therefore been frequently reviewed elsewhere18,19
. A flow cytometer is a robust high-throughput
instrument that counts, sorts and examines up to 10 000 cells per second10,18
. It has been extensively
used in mammalian cell research before, but is also adapted for the study of bacterial and yeast cell
size and morphology as well as in combination with e.g. fluorescence stains or reporter strains20
.
Other tools and a deeper description of flow cytometry for the measurement of single cell properties
have been reviewed elsewhere10,21–23
.
This review aims at giving a summary of lab scale cultivation setups that are used to study
population heterogeneity in fermentation processes, which includes primarily the application of
flow cytometry, with a special focus on E. coli and S. cerevisiae. The intention is to show the
potential of single cell studies in bioreactors to reveal more detailed cell physiological
characteristics which are normally hidden in classical physiology studies and control strategies of
fermentation processes. First an overview of the current status of population heterogeneity studies
and tools to study it in industrial biotechnology labs and large scale batch, fed-batch and continuous
cultivation will be given. Afterwards special setups that can potentially be used or are already
applied to study population heterogeneity are presented and likewise studies done will be summed
up. Moreover, in the discussion possible future strategies to control population heterogeneity as
well as the need for deeper and more objective data analysis will be discussed.

Chapter 2b Population heterogeneity in bioprocesses studied at single cell level: industrial scale
simulated in the lab using basic and advanced setups 22
2.2 Population heterogeneity, microbial physiology and production studied at
single cell level
In this first part of the review studies to access population heterogeneity or monitor special single
cell properties that have been performed using a basic reactor setup in different cultivation modes
will be summarised. This includes studies done under the changing conditions in batch cultivation,
in the for production most frequently used setup of fed-batch cultivation as well as in continuous
cultivation (Chemostat) (for short definitions of the setups see glossary box). Hereby studies have
been grouped into targeting heterogeneity in cell size and cell cycle, physiological state and
production respectively single cell productivity.
2.2.1 Cell size and cell cycle heterogeneity
The investigation of general physiology, concerning cell properties, like optical density, dry weight
and extracellular metabolites (e.g. using high performance liquid chromatography (HPLC)) as well
as off-gases released by the organism are nowadays complemented with the study of single cell
parameters. The introduction of flow cytometry for the analysis of cultivation broth samples
enabled an additional measurement of distributions of e.g. cell size, morphology and cell cycle
progression24
.
The first single cell cycle investigations of S. cerevisiae and E. coli on different carbon sources
were performed in shake flasks analyzing samples at-line by applying flow cytometry for cell size
and protein distributions (fluorescein isothiocyanate (FITC) staining) and coulter counter for cell
count25–27
. Furthermore bud scar analysis was performed. Later, additional analysis of the budding
index and cell cycle distributions revealed that S. cerevisiae cells are bigger and enter the S-phase
faster when growing on glucose than when growing slower on ethanol28
. Furthermore with the
frequent integration of flow cytometry into continuous cultivation processes single cell
heterogeneities in general physiology have also been studied in a steady state environment24
. This
was in many studies supported by the use of the measurement of the expression of fluorescence
originating from reporter strains (GFP and BFP), stained properties or immuno-fluorescent
methods. Cell size studies of both E. coli and S. cerevisiae were mainly based on investigations of
cell cycle kinetics at different growth rates (range from D = 0.07 h-1
to 0.43h-1
) and were combined

Chapter 2b Population heterogeneity in bioprocesses studied at single cell level: industrial scale
simulated in the lab using basic and advanced setups 23
with staining for protein content using FITC, mitramycin and/or ethidium bromide to assess the
budding index or distribution of single cell division29–31
.
Later cell division and growth heterogeneities in well controlled batch reactors have been further
examined as well by the application of different reporter strains expressing GFP whose expression
can be analysed using flow cytometry. An example is the monitoring of cell division of single cells
of E. coli using a GFP dilution method32
.
A combined approach of experimental and mathematical description (population balance model
coupled to unstructured model) of the dynamics of cell size and cell cycle position distributions of
S. cerevisiae in batch experiments showed good agreement between data and model, thus indicating
the suitability of the model as well as leading to considerations for development of additional
combined approaches33
. Details about the research in cell cycle progression of yeast including
modeling of growing yeast populations and the application of flow cytometry in batch experiments
for measurement of cellular properties, have been reviewed elsewhere34
.
2.2.2 Heterogeneity in physiological state
Since the cell physiology (see 2.1. in e.g. cell size) is found to be clearly influenced by the dynamic
growth conditions in a batch reactor but also during fed-batch and continuous cultures (mainly as
stress response), the environmental influences on the single cell physiological state are frequently
studied as well. Especially the assessment of the level of single cell viability is nowadays a
commonly used method in process control and optimization to ensure high process efficiency of S.
cerevisiae and E. coli. Normally at-line flow cytometry in combination with one or more viability
stains (e.g. propidium iodide (PI), ethidium bromide (EB), BOX (Bis-oxonol), Rhodamine123
(RH123) etc.) and/or metabolic activity stains (e.g. 3,3-dihexylocarbocyanine iodide (DIOC6) for
membrane integrity and potential or Dihydrorhodamine123 (DHR)) or fluorescence sensors was
applied. Hereby the level of viability in different growth phases35–37
or in response to various kind
of stress e.g. UV-light, agitation, susceptibility to copper toxicity, weak acids, dissolved oxygen
level or heat shock38–43
was evaluated. The result of combining stains that target different properties
is that cells can be classified into different physiological state categories like e.g. alive, dead and
alive but not culturable by simple gating/overlaying of measured distribution plots of cell
properties. An example is a drop in viability due to cell death at the end of the fed-batch phase of a
high density E. coli production process found in some processes or cells that were alive but lost
their ability to divide in a process producing the recombinant protein promegapoietin or in Fab

Chapter 2b Population heterogeneity in bioprocesses studied at single cell level: industrial scale
simulated in the lab using basic and advanced setups 24
production36,44,45
. This knowledge can then be used to e.g. generate segregated models of population
dynamics in a batch process35
. Also, one approach used multivariate statistics to predict population
responses to different stresses39
.
Furthermore, with the application of a combination of different viability stains it could be shown
that cells in large scale fed-batch processes, experiencing a dynamic environment (gradients of
glucose, oxygen etc.) were less affected in viability than cells grown in well mixed lab scale
experiments46,47
. Opposite to this, nothing similar could be detected during batch or continuous
culture46
.These findings lead to the suggestion to use an on-line flow cytometer46
or at least to
introduce the application of more on-line fluorescent measuring sensors, as e.g. the biomass sensor
and on-line HPLC analyzer monitoring recombinant protein production by E. coli used by
Gustavsson et al. (2012)48
to improve process control.
To realize constant production with high productivity and viability, also process optimization
concerning the control strategy and conditions the microorganism experience is of high importance.
For this reason perturbation studies with e.g. pulses of substrate (e.g. ethanol or glucose), a toxic
compound or a sudden change in oxygen level49
and the resulting physiological responses to
concentration heterogeneities10
have been performed frequently. For example the general
physiological response of S. cerevisiae and E. coli cells to glucose pulses in glucose-limited
chemostat culture (D= 0.05 h-1
and 0.1 h-1
) has been studied evaluating glucose and oxygen uptake
as well as the metabolic fluxes50–53
.
Additionally, many studies dealing with proteome and transcriptome as well as metabolome
analysis with fully labeled C13
carbon of e.g. E. coli54–56
and S. cerevisiae52,57
have been performed
in fed-batch cultivations or in the stable steady state environment of the chemostat at different
dilution rates (focus on dilution rate range D = 0.02-0.33 h-1
). The aim of such studies has mainly
been to investigate the transcriptional or proteomic changes of E. coli and S. cerevisiae, for example
studying the influence of growth rate, oxygen level or carbon source (e.g. glucose, ethanol, maltose
or acetate) respectively a combination of all three58
on e.g. gene expression24,59–62
. In the course of
such investigations, S. cerevisiae cells isolated during the bioethanol production phase of a fed-
batch process by density gradient centrifugation were found to consist of two distinct
subpopulations, which were further analysed using transcriptome analysis as well as fluorescence
microscopy for evaluating viability and metabolic activity (methylene blue, Calcuflor and FUN1
staining)63
. It was found that one population was uniform in size with high respiratory activity

Chapter 2b Population heterogeneity in bioprocesses studied at single cell level: industrial scale
simulated in the lab using basic and advanced setups 25
whereas the other one was heterogeneous in size as well as less respiratory active, which led to the
conclusion that the production is uncoupled from growth while the cells show similar characteristics
in morphology and metabolism as when entering stationary phase63
.
Stress response distributions of single cells in batch, fed-batch and continuous cultivation have also
been further examined by the application of different reporter strains expressing BFP or GFP whose
expression can be assessed using flow cytometry and correlated to a specific cell response.
Examples are the application of S. cerevisiae stress reporter strains based on the heat shock protein
Hsp104, the stress response protein Hsp12 or an E. coli stress reporter strain (bioluminescence
construct yciG::LuxCDABE) to investigate heterogeneities of stress responsive gene expression and
stress tolerance of individual cells64,65
. Also, in response to e.g. pulses of glucose of different
intensities (0.08, 0.4 and 1g/L) or NaCL, ethanol and elevated temperature in glucose limited
chemostats at different dilution rates65–67
. A S. cerevisiae dual reporter system to map growth and
cell robustness (assessed via exposure to freeze-thaw stress) heterogeneities based on a ribosomal
protein promoter (RPL22a) made it possible to distinguish between different cell growth phases in
batch fermentation by the level of fluorescence intensity, study the single cell response to glucose
pulses as well as subpopulations with high and low cell membrane robustness could be detected14
. It
may be applied to identify more robust subpopulations for process design of more effective
bioprocesses.
2.2.3 Heterogeneity in Production
Apart from the assessment of the influence of the process environment (see 2.2.) on the cell
population in bioreactors the investigation of single cell heterogeneities in the production of e.g.
recombinant proteins itself is also of importance to ensure a high yielding process. A few attempts
using reporter genes to follow recombinant protein production by E. coli in fed-batch cultivation in
combination with special sensors were made, e.g. applying an operon fusion of GFP and
chloramphenicol acetyltransferease (CAT) (under control of pBAD promoter or arabinose
(araBAD) operon)68
or GFP respectively BFP monitoring the expression of a stress related
promoter. Both fluorescent proteins were found to be a valuable tool to monitor processes as
reporter genes for recombinant protein production in E. coli69
. In general these reporter genes could
also be used in combination with at-line flow cytometry or as suggested elsewhere with on-line
flow cytometry46
to get a better understanding of population heterogeneity and single cell behavior
in e.g. large scale fed-batch processes, and would as a consequence enable further process

Chapter 2b Population heterogeneity in bioprocesses studied at single cell level: industrial scale
simulated in the lab using basic and advanced setups 26
optimization. Studies like this have been done in batch cultivation e.g. the study of the dynamics in
glucose uptake of E. coli single cells using a fluorescent glucose analogue (2-NBDG (2-(N-(7-
nitrobenz-2-oxa-1,3-diazol-4-yl)amino)-2-deoxyglucose)) which is taken up by the cells and can
afterwards be measured as intracellular fluorescence that can then indirectly be correlated to
product formation70
. Furthermore the investigation of the physical and metabolic consequences of
inclusion body formation in batch cultures of E. coli producing a recombinant protein (the
isopropylthiogalactopyranoside-inducible model eukaryotic protein AP50), using dual colour
staining for membrane polarisation and permeability which can also be used as a tool for on-line
monitoring of potential production processes71
. Additionally the NADH dependent culture
fluorescence and plasmid stability in recombinant protein production followed by the fluorescence
decline when a fluorescent substrate is degraded by the produced enzyme (e.g. fluorescein di-beta-
D-glucopyranoside (FDGlu)) has been studied in chemostat culture72,73
.
Moreover, combining metabolic and physiological perturbation responses with gene expression
analysis can reveal information for the improvement of production processes through the design of
new strains10
. Examples are transcriptomics studies of glucose pulses respectively repeated glucose
pulses in glucose limited chemostats of E. coli and S. cerevisiae65,67,74
.
.

Chapter 2b Population heterogeneity in bioprocesses studied at single cell level: industrial scale simulated in the lab using basic and
advanced setups 27
Table 1- population heterogeneity studied in fermentation processes using batch, fed-batch or chemostat mode: The table is divided
into studies investigating heterogeneity in cell size and cell cycle, physiological state or production/productivity of single cells. In each
section studies are listed in chronological order. Abbreviations: BFP: Blue fluorescent protein; BI: budding index; CFU: Colony forming
units; DAPI: 4',6-diamidino-2-phenylindole; EB: Ethidium bromide; GFP: Green fluorescent protein; FC: flow cytometry; FITC:
Fluorescein isothiocyanate; FSC: Forward scatter; PI: Propidum iodide; RH123: Rhodamine123; SSC: Side scatter;
Reference Organism DEF/RICH
medium
Type of
heterogeneity
studied
Tools used to study
heterogeneity
Fermenta
tion
mode/
scale
Data analysis
Cell size and cell cycle heterogeneity
Skarstad et al. (1983) E. coli M9 medium,
glucose
Cell cycle kinetics FC (EB, FSC,
mitramycin), CFU
Chemostat Correlation between DNA, cell size
and cell count in different cell cycle
stages
Vanoni et al. (1983)
Lord and Wheals (1980)
S. cerevisiae YEP and YNB
medium, different
carbon sources
DNA content, protein
content
FC (FITC staining), bud
scar analysis
Shake
flask 0.5 L
Fried algorithm analysis of DNA
distributions, histogram plots of
measured distributions, modeling of
unequal division of yeast
Ranzi et al. (1986) S. cerevisiae D = 0.07-0.43h-1
,
YEP medium,
glucose
Protein content, cell
volume
FC (PI, FITC), coulter
counter
Chemostat
, 0.75 L
Biplots and histograms of measured
properties
Åkerlund et al. (1995) E. coli LB or M9 medium,
glucose or acetate
Cell size, DNA
content
FC (DAPI, FSC),
fluorescence
microscopy
Shake
flask
Time series of histogram plots
Larsson et al. (1996)
Bylund et al. (1998)
S. cerevisiae
E. coli
Minimal medium,
glucose
biomass productivity,
recombinant protein
production
rapid sampling at
different locations
Fed-batch,
30 m3,
12 m3
CFD modeling, product formation,
measured properties plotted over
time
Zhao et al. (1998) E. coli
S. cerevisiae
2XGYT complex
medium or YPD
medium, both with
glucose
Growth rate, cell size,
SSC, growth, DNA
content
Online spectrometer,
automated online FC
(GFP, FSC, SSC,
FITC), rapid sampling,
Batch, 1 L Histogram and landscape plots for
measured property distributions

Chapter 2b Population heterogeneity in bioprocesses studied at single cell level: industrial scale simulated in the lab using basic and
advanced setups 28
Howlett and Avery
(1999)
S. cerevisiae YPD-medium,
glucose, D= 0.1h-1
Cell cycle stage,
viability, protein
content
FC (FSC, PI, FITC) Chemostat Biplots, histogram plots, gating for
different cell cycle stages with
percentale analysis and for positive
stained cells
Porro et al. (2003) S. cerevisiae Minimal medium,
glucose, D= 0.08-
0.3h-1
Cell size, protein,
viability
FC (FSC, PI, FITC) Chemostat
0.8 L
BI, measured properties plotted
against dilution rate
Cipolina et al. (2005 &
2007)
S. cerevisiae Rich/poor medium,
glucose/ethanol,
D= 0.05h-1
Cell size, DNA
content, viability,
transcriptomics
FC (FSC,FITC, PI),
coulter counter (cell
count)
Shake
flask,
chemostat
BI, FSC, RNA/DNA content
distributions, histogram plots, mean
values plotted over time
Roostalu et al. (2008) E. coli LB-medium,
glucose
cell division,
viability, cell size
FC (GFP, SSC, PI) Shake
flask 0.5 L
Series of histograms and biplots of
measured properties, peak shift
analysis
Tibyrenc et al. (2010) S. cerevisiae Defined medium,
200-300g/L
glucose
Cell size & viability FC( FSC, PI), coulter
counter, fluorescence
microscopy, online
measurement of
biomass
Batch 2 L Multivariate statistical analysis of
data, partial least square method,
viability and cell size histogram plots
Fernandes Lencastre et
al. (2012)
S. cerevisiae Minimal medium,
glucose
Cell size and cell
cycle stage, DNA
content,
BI, FC (FITC, PI) Batch, 1.5
L
population balance model coupled to
unstructured model, time series of
histogram plots and biplots
Heterogeneity in physiological state
Hewitt et al. (1998,
1999& 2000)
E. coli Synthetic medium,
glucose
Growth,
physiological state,
cell size, viability
Multiparameter FC (PI,
EB, RH123, FSC, SSC,
BOX)
Fed-batch,
2.5 L and
20 m3
Biplots of stained properties, gating
for positively and negatively stained
cells
Hewitt et al. (1998) E. coli D= 0.2h-1
, SM
medium, glucose
Cell size, cell
membrane
FC (PI, BOX,
RH123,FSC),
microscopy
Chemostat
4 L
Microscopic pictures, biplots of
measured properties, gating for
positive cells
Nebe-von-Caron et al.
(2000)
Bacteria Various Viability, metabolic
state, vitality,
metabolic activity,
cell size
Multiparameter FC (PI,
BOX, RH123, EB,
FSC, SSC), cell sorting
Fedb-
batch,
various
Biplots of measured properties, 3D
plots over time, correlation analysis
of metabolic traits, plots of mean and
CV
Enfors et al. (2001) E. coli Glucose-ammonia
salt medium
Stress response,
viability
FC (PI, BOX), mRNA
analysis
Fed-batch,
22 m3 and
scale
down
CFD simulation, gene expression
tables, biplots of measured
properties, gating for positive and
negative cells

Chapter 2b Population heterogeneity in bioprocesses studied at single cell level: industrial scale simulated in the lab using basic and
advanced setups 29
Attfield et al. (2001) S. cerevisiae GYP medium,
glucose,
stress response &
tolerance, viability
Reporter strain
(HSP104), FC (PI,
GFP), fluorescence
microscopy
Shake
flask
Biplots, histograms, gating for viable
cells, percentage and expression
plotted over time
Abu-Absi et al. (2002) S. cerevisiae SD minimal
medium, glucose
Stress response, cell
count, cell size,
viability
Automated FC (GFP,
FSC, SSC, PI), frequent
sampling
Batch, 2 L Biplots for measured properties, 3D
plots for property time frequency
Kacmar et al. (2004) S. cerevisiae SD minimal
medium, glucose
Cell size, viability,
GFP
fluorescence/producti
on
Automated FC (PI,
FSC, GFP), 3 different
reporter strains,
frequent sampling
Batch, 1.5
L
Biplots for measured properties,
manual gating, mean and CV plotted
over time, percentage viability,
fluorescence color map plots
Nisamedtinov et al.
(2008)
S. cerevisiae SM medium,
glucose, D=0.14h-1
Stress response Fluorescence reader
(GFP fluorescence),
reporter strain
(HSP12p)
Chemostat
, 1 L
Mean values plotted over time
Benbadis et al. (2009) S. cerevisiae YPD medium,
glucose,
Stress response Global transcriptome
analysis, subpopulation
evaluation
Fed-batch Subpopulation analysis
Winder et al. (2011) E. coli MSX medium,
glucose
Metabolic
fingerprinting,
viability,
FT-IR analysis, CFU Fed-batch,
1.25 L
Cluster analysis and PCA, mean
values plotted over time
Amilastre et al. (2012) S. cerevisiae Mineral medium Viability, biomass
formation
FC(Methylene blue
staining)
Fed-batch,
continuou
s, 1,3 & 5
L
Model of temperature impact on
production
Carlquist et al. (2012) S. cerevisiae Delft minimal
medium, glucose,
glucose pulse
Cell size, growth, cell
robustness, viability
FC (FSC, SSC, GFP,
PI), dual reporter strain
(RPL22a)
Batch and
continuou
s
2 L
Budding index, biplots and histogram
plots, percentage analysis, mean
values plotted over time
Freitas et al. (2013) S.
carlsbergensis
MC medium,
glucose
Viability Multi-parameter FC
(PI, RH123)
Shake
flask, 1 L
Biplots and histograms with squared
gating
Heterogeneity in production
DeLisa et al. (1999) E. coli Defined or semi-
defined medium,
glucose
Recombinant protein
production
Reporter strain ( GFP
sensor, activity assay)
Fed-batch,
2 L
Data comparison from different
sources and plotted over time

Chapter 2b Population heterogeneity in bioprocesses studied at single cell level: industrial scale simulated in the lab using basic and
advanced setups 30
Natarajan and Srienc
(1999)
E. coli M9 minimal
medium, glucose
Glucose uptake FC (fluorescent
substrate, FSC)
Batch, 2 L Model of distributions, mean values
plotted over time, biplots and
histogram plots
Chau et al. (2001) S. cerevisiae Complex medium,
glucose, D= 0.1h-1
Plasmid stability,
viability, protein
content, cell size
FC (plasmid
fluorescence, PI, FITC),
electron microscopy
Chemostat
, 2 L
Histogram plots, biplots, gating for
percentage of positively stained cells
Reischer et al. (2004) E. coli D= 0.1h-1
, minimal
medium, glucose
BFP & GFP protein
production
ELISA, reporter strains
for recombinant protein
production
Chemostat
, 7 L
Mean values plotted over time
Abel et al. (2004) S. cerevisiae D= 0.2h-1
, synthetic
medium, glucose
NADH dependent
fluorescence
Fluorescence reader Chemostat
, 2.5 L
Mean values plotted over time,
histogram plots for fluorescence
Lewis et al. (2004) E. coli LB-medium,
glucose
Cell size, membrane
permeability
reporter strain
(recombinant protein
production), FC (FSC,
PI, BOX)
Batch, 4 L Histograms and biplots of measured
properties, squared gating of
subpopulations
Wållberg et al. (2005)
Sunstroem et al. (2004)
E. coli Minimal medium,
glucose
Viability,
Recombinant protein
production
Multiparameter FC
(immunofluorescent
labelling, FSC, PI,
BOX),CFU
Fed-batch,
5 L
Histograms plots of measured
properties, mean values plotted over
time
Want et al. (2008) E. coli Minimal medium,
glucose
Viability, growth,
recombinant protein
production
FC (PI, BOX), ELISA
for product formation
Fed-batch,
3 L
Biplots for measured properties,
mean values plotted over time
Sunya et al. (2012) 1+2,
(2013)
Sunya
E. coli D= 0.15h-1
,
minimal medium,
glucose
GFP fluorescence Fluorescence reader
(GFP fluorescence),
reporter strain
Chemostat
, 1 L
Mean values plotted over time
Gustavssen et al. (2013) E. coli Semi synthetic
medium, glucose
Biomass, GFP
fluorescence,
recombinant protein
production
Online sensor for
biomass
Fed-batch,
4 L
Measured values plotted in time
plots, model for process control

Chapter 2b Population heterogeneity in bioprocesses studied at single cell level: industrial scale
simulated in the lab using basic and advanced setups 31
2.3 Specialised setups to simulate large scale in lab scale
This part focuses on the presentation of setups that have specifically been developed to study single
cells or population heterogeneity, as well as setups that are used or could potentially be used to
investigate population heterogeneity, and are based on the above described continuous cultivation
principle. These setups include the study of cells grown under extreme conditions (e.g. retentostat)
as well as under isolated/ idealized growth conditions (e.g. single cell reactor).
2.3.1 Setups using continuous culture
In this section setups are described that are based on continuous cultivation and have not been
mentioned above because they have a special feature which is beneficial for studying population
heterogeneity or they have already been used to access population heterogeneity at single cell level.
2.3.1.1 Turbidostat
The Turbidostat (for a short definition, see the glossary box) has, apart from that it permits direct
observation of fluctuations in the specific growth rate, several advantages that can be used to study
population heterogeneity, including a higher volumetric productivity than a chemostat, a stable
culture behaviour at high dilution rates close to the critical dilution rate, and a high selection
pressure75
. The latter feature enables its application for strain development/selection e.g. the
selection for S. cerevisiae mutants with higher acetate respectively higher ethanol tolerance by
gradually increasing the concentration of the respective compound and furthermore also selection
for strains with the highest growth rate76,77
. As continuous process the turbidostat was also used to
study different production processes in small scale using fluorescent reporters strains or proteins
like e.g. the production of human proinsulin by S. cerevisiae where the expression was regulated by
a promoter that is repressed when glucose is present78
. This revealed single cell production rate
distributions.
Furthermore, various studies of the metabolic fluxes applying flux analysis and/or studies of the
central carbon metabolism in E. coli79–81
have been conducted. Interestingly, only very few
modeling attempts of the conditions in a turbidostat have been made82–84
. However, the reason
might be that the turbidostat is not as popular as the chemostat85
. Potential challenges when
developing a model for such system are some of the disadvantages of the system, like the nonlinear
correlation between biomass and optical density, fouling of the sensors which tampers the

Chapter 2b Population heterogeneity in bioprocesses studied at single cell level: industrial scale
simulated in the lab using basic and advanced setups 32
measurement and the fact that the sensors are also sensitive to air bubbles or other particles in the
culture75
. Although some attempts to overcome these problems led to an improvement, like the
measurement of growth by-products85
, a biomass measurement system based on dielectric
permittivity (so called Permittistat75
) or the use of an external, replaceable tube for optical density
measurements86
, still mostly population averaged values and no single cell distributions are
measured. However, for the study of oscillations in turbidostats in S. cerevisiae and E. coli75,87,88
cell size and viability distributions (using methylene blue and fluorescence microscopy respectively
FC) were recorded. Furthermore, for the analysis of the oscillation signaling system in E. coli a
fluorescent reporter system which allowed single cell analysis was used88
.
2.3.1.2 Retentostat
The retentostat (for a short definition, see the glossary box) was developed for specific study of
microbial physiology at extreme low/near-zero specific growth rates89
which allows the distinction
between carbon starvation and calorie restriction, which is not possible in a conventional chemostat,
while other parameters like agitation, aeration and pH can be tightly controlled90
. Because the
substrate is constantly fed, a retentostat does not lead to starvation and is different from resting cell
states where there is little or no metabolic activity91,92
.
The retentostat system has mainly been applied to study the maintenance requirements (general
physiology and DNA/RNA content) of several bacterial systems like e.g. E. coli93
without studying
population heterogeneity in particular. The experiments revealed that physiology of these
prokaryotes at extremely low specific growth rates could not be accurately predicted by
extrapolation of the results obtained in a conventional chemostat at higher specific growth rates,
which was also forecasted by Konopka (2000)94
who reviewed physiological cell characteristics at
low growth rate and principles of nutrient starvation. The most frequently studied organism in a
retentostat up to now is S. cerevisiae because its behavior at near-zero growth rates is a rather
unexplored field of yeast research92
. A couple of studies, whose results were in good agreement
with conventional chemostat studies, were performed90–92
starting with the investigation of the
physiology of S. cerevisiae in an anaerobic glucose limited retentostat (D=0,025 h-1
). Thereby also
population distributions of cells were analysed concerning viability (CFU and live/dead staining)
and metabolic activity (FITC and cFDA) measured by fluorescence microscopy. In addition,
calculations of the maintenance requirements were done and were supplemented with the
quantification of general physiology including storage compounds. Later, additional genome wide-

Chapter 2b Population heterogeneity in bioprocesses studied at single cell level: industrial scale
simulated in the lab using basic and advanced setups 33
transcriptional analysis was performed to compare S. cerevisiae cells grown at near-zero specific
growth rate with faster growing and stationary phase yeast cultures as well as with cells under
starvation compared to cells that have been grown under extreme calorie restriction (by switching
off the glucose feed)90,91
. A similar study has also been done for L. lactis decreasing the specific
growth rate from 0,025h-1
to 0,0001h-195
.
2.3.1.3 Cytostat
The cytostat (for a short definition, see the glossary box) can be controlled at very low cell
concentrations which only negligibly change the composition of the medium in the bioreactor,
making the cell environment precisely defined by the feed. This allows also the investigation of the
effect of nutrients or toxic compounds (e.g. drugs or inhibiting products) on the cell culture85
as
well as the selection of more robust/tolerant strain towards a specific compound96,97
. The cytostat
has also been modeled98
. Examples for this are investigations of the cell size increase in S.
cerevisiae due to high ethanol concentration85
or the selection for S. cerevisiae strains with higher
acetate tolerance during ethanol production99,100
. These studies were mainly followed by RNA
microarray analysis and general physiology.
But additionally, with the connected flow cytometer it is possible to measure single cell property
distributions and the appearance of subpopulations (presented in biplots and histogram plots, mean
and CV, cdfplots are also plotted) instead of just population average properties for example for cell
size, cell membrane robustness (PI-staining) and metabolic activity (FITC), or one can apply stress
reporter strains (GFP, promoter pTEF,S65T)97,101
. In the experiments performed in these studies,
cells are frequently withdrawn automatically (every 15min) from the bioreactor and collected in a
microchamber with two different outlets, one with a membrane for exchange of liquid for stains (PI
or others) and washing while the cells are retained in the chamber and one connected to a sampling
loop of known volume with which the cells are pumped into the flow cytometer97
. These kinds of
studies have been performed using S. cerevisiae as well as E. coli, each expressing GFP and stained
for different properties (FITC, PI)82,97
thus revealing subpopulations which potentially could be
sorted.
It should be mentioned that the system applying automated sampling in connection to the use of an
on-line flow cytometer has also been used in batch fermentation82,102
.

Chapter 2b Population heterogeneity in bioprocesses studied at single cell level: industrial scale
simulated in the lab using basic and advanced setups 34
2.3.1.4 Bioscope
The bioscope system (for a short definition, see the glossary box) which was developed by Visser et
al. (2002) and Mashego et al. (2006)103,104
allows the elucidation of short-term in vivo kinetics of a
continuous microbial culture in steady state via perturbation experiments. It is an improved version
of a system developed by Buziol et al. (2001)105
, who created a system for stimulus response
experiments and uses the stopped flow technique originally developed by Koning and van Dam
(1992)106
. The technique allows rapid sampling without disturbing the main culture since the
perturbation takes place outside the reactor103,107
. A detailed description of the characteristics and
building blocks of the system can be found elsewhere103,104
. Up to date the system was exclusively
applied for metabolome and general physiology studies and showed results in good agreement with
conventional chemostat perturbation experiments. Firstly the metabolic response of S. cerevisiae
and P. chrysogenum to pulses of glucose, ethanol as well as electron donor and acceptor (glucose
and acetaldehyde) was examined in aerobic glucose and ethanol limited steady state cultures (D=
0.05h-1
). Samples were rapid and automatically withdrawn and quenched for intra- and extracellular
metabolites, both in steady state and over a time period of 180 s following the perturbation. Such
experiments lead among others to the calculation of the NAD/NADH ratio in the cytosol104,108,109
.
Furthermore a method for the assessment of the intracellular pH could be established using
perturbation with benzoic acid and ethanol or glucose74,110
. Later, after the introduction of some
changes in the system concerning increased oxygen transfer and adjusted sampling intervals to the
faster response of bacteria, the dynamics of a large range of central metabolites of E.coli could be
followed111
.
2.3.2 Miniaturised Setups
2.3.2.1 Microbioreactors
Microbioreactors (MBRs) are still quite new experimental tools that are typically operated with a
volume between 50µL-2mL, although the strict definition of MBRs defines a volume of less than
1mL112,113
. But due to the demand for more advanced sample analysis partly at-line or at the end of
the process MBR platforms with parallelised reactors (microtiterplates with 8 or 48 wells) that are
designed like MBRs can have a volume up to 12 mL114–117
. Such reactors are also described in this
section, although they are strictly speaking not MBRs. A detailed investigation and evaluation of
the future potential and applicability of today’s MBRs including recommendations for use are
reviewed elsewhere112,113
. In general MBRs are disposable and miniaturised versions of bench scale
reactors that combine the easy handling of shake flask experiments with the controllability of bench

Chapter 2b Population heterogeneity in bioprocesses studied at single cell level: industrial scale
simulated in the lab using basic and advanced setups 35
scale reactors118
.This has some practical and financial advantages as it reduces the overall process
cost, concerning material and energy use as well as space requirement for equipment113
. But MBRs
also have some advantages due to their inherent characteristics. For example, the mixing (achieved
with miniature versions of impeller, gas-induced or magnetic stirrer as well as peristaltic
mixers116,119
) can due to the small volume, almost be considered to be ideal without significant
gradients of glucose, oxygen or pH, which allows the investigation of single cell dynamics in a
controlled environment10
. Additionally MBRs exhibit some thermal advantages allowing quick
temperature changes, headspace aeration without bubble formation as well as due to this often
precise online monitoring of general process parameters and general cell characteristics like pH,
temperature, DOT (dissolved oxygen tension) and OD (optical density)10,114,120,121
. Furthermore a
conductometric method for on-line CO2 measurement in a MBR batch culture of C. albicans was
developed119
. Due to the sensitivity of the signals in MBRs it is also possible to monitor real time
cell responses by measuring fluorescence from reporter strains with fluorescence sensors or a
microscope (reviewed elsewhere122
) as well as using fluorescence readers which are especially
developed for MBRs10,114,120,123
. Also a fiber-optic on-line monitoring system of OD and
fluorescence during MBR and shaken MTPs cultivations, called BioLector, was developed124
. It
enabled monitoring of the dry weight/ optical density development as well as GFP expression (on-
line reporter for protein expression) in batch and fed-batch (linear and exponential feed) cultivation
of E. coli in a microbioreactor array (200µL)115,124,125
. Moreover results showed good agreement
with a 1 L bench scale reactor cultivation, which was also proven with other MBRs using fed-batch
fermentation of E. coli (2 mL compared to 1 L) for e.g. the production of a plasmid DNA vaccine
vector (p VAX1-GFP)121,126
. Continuous cultivations of E. coli and S. cerevisiae could also be
successfully scaled down in MBRs (8 µL respectively droplets (BAY (Bacteria, Archaea, Yeast)
reactor)), and included also applying fluorescent growth reporter strains, measuring general
physiology (OD, DW, offline: HPLC) as well as off-line application of stains for viability (EB, PI
and SYTO9)120,127
. Also topology optimization was applied for process optimization of recombinant
protein production by S. cerevisiae investigated in a MBR128
. With all these features and
characteristics MBRs can be used for high throughput bioprocess development and optimization
simulating distinct conditions which cells might experience in large scale reactors10,124,126
. As an
example it has been shown that a MBR (volume: 50 µL) can be used for DNA microarray analysis
to obtain differential gene expression profiles during the exponential growth phase of E. coli 129
.
The applicability of a parallel micro-chemostat array for investigation of the S. cerevisiae proteome
Chapter 2b Population heterogeneity in bioprocesses studied at single cell level: industrial scale
simulated in the lab using basic and advanced setups 36
in response to UV irradiation as also been demonstrated123
. Together with similar approaches, this
will enable the rapid assessment of environmental factors responsible for spatial heterogeneity in
microbial populations10
.
Also, using an array of parallel controlled MBRs respectively microtiterplates (MTPs) equipped as
MBRs allows the time efficient performance of a high number of experiments with good scalability
and optimization strategies using CFD modeling114
. Examples are batch and fed-batch (linear and
exponential feed) cultivations of E. coli and S. cerevisiae in a block with 48 parallel miniaturised
stirred tank reactors (volume: 8-12 mL) which is autoclavable in place and provides possibilities for
on-line monitoring of controlled parameters (pH, temperature, DOT) and physiology (OD, GFP
fluorescence), double sided pH control as well as automated sampling114,116,117
.
2.3.2.2 Envirostat
An Envirostat is a microfluidic bioreactor based on a microfluidic chip, on which cells are separated
into microtiter wells and then cultivated. It is a device to study cellular physiology and single cell
responses to environmental perturbations without disturbance of the whole cell population traits130
.
CFD simulations are used to ensure controlled constant environmental conditions (medium
composition changes below 0,001%, hence homogenous reactor) with constant medium supply
flow, temperature control and cell trapping via negative dielectrophoresis (nDEP)130
. Through on-
line monitoring of the optical density (OD), growth heterogeneities of single cells can be
investigated by assuming a correlation between OD and growth rate. Furthermore, the specific
growth rate can also be derived by recording budding events over time130,131
. Additionally, the
system is equipped with an inverted microscope to record pictures respectively videos, and there is
a possibility of taking samples for post growth analysis (transcriptome, proteome and metabolome).
The envirostat has been applied to study growth kinetic time trends of single cells of S. cerevisiae
and its descendants in glucose concentration independent population experiments130,131
. To enable
additionally the time resolved protein secretion by an individual cell, the envirostat was coupled to a
confocal microscope131
. In the latter setup the secretion of a scFv-eGFP fusion protein by
singularised and trapped S. pombe cells could be followed and secreting cells could be
differentiated from non-secreting cells. The latter feature can be potentially used in process
optimization of proteins secretion131
. Lately, the envirostat system was extended to cover a wider
range of cell types132
resulting in the first contactless cultivation procedure of a single bacterial cell.
The procedure, which cytometrically measures cell dimensions for single cell growth rate
calculation, was demonstrated growing Bacillus subtilis, E. coli and Corynebacterium glutamicum

Chapter 2b Population heterogeneity in bioprocesses studied at single cell level: industrial scale
simulated in the lab using basic and advanced setups 37
amongst others. It could be consistently shown, that growth of single cells is significantly higher
compared to growth rates observed in cell populations, like conventional batch cultivations or shake
flask experiments132,133
.
2.3.2.3 Single cell reactors and flow chamber
Single cell reactors or flow chamber experiments are the next step down in volume from
microbioreactors and are a quite new and upcoming field in single cell research within the last ten
years134
. The basic principle involves the trapping of single cells in membrane covered (to allow
medium flow in and out while retaining cells) microchannels or flow chambers (microfluidic
devices) which are mounted on a lab-on-chip or simple microscope slide135,136
. Some devices
consist of several of those channels allowing the parallel cultivation of several single cells or also
having different channels or chambers for cultivation and in place analysis and moving the cells
between the channels by means of optical tweezers135,137
. Additionally some systems have channels
to remove daughter cells after cell division through shear force in order to follow several cell
generations134,138
. The cultivation process is observed via phase-contrast or fluorescence
microscopy allowing to record pictures respectively videos followed by image analysis135,138,139
. Up
to now single cell reactors and flow chamber setups are mainly used for studies of E. coli in
continuous culture as well as once for yeast investigating e.g. biofilm formation140
, the effect of salt
or other compounds on growth138
or growth responses to environmental change over several cell
generations (up to 50)136,139
. This enables continuous observation and comparison of genetically
identical cells concerning kinetic parameters and distributions as well as some physiological
characteristics137
. It should thus help in the clarification of heterogeneous phenomena, for example
unequal cell division and cell differentiation. The control and data analysis of these systems is still
critical but it allows following of the cell size/cell volume or length increase over time, estimation
of individual doubling and lag-time as well as to record GFP expression exhibited by cells or
special tagged cell parts135,136,138,139
.
2.3.3 Scale down reactors
For the simulation and the development of future large scale processes as well as for optimization of
already existing industrial scale processes (mostly fed-batch processes) scale down reactors have
been reported to represent a better tool than conventional bench scale reactors10
. With a scale down
reactor, which refers in this case to a multi-compartment reactor, gradients of substrate, oxygen and
pH in large scale processes can be simulated by selecting appropriate points for oxygen inlet,
nitrogen sparging and/or substrate feed10,141
. The general characteristics of scale down reactors and

Chapter 2b Population heterogeneity in bioprocesses studied at single cell level: industrial scale
simulated in the lab using basic and advanced setups 38
methodologies including regime analysis have been reviewed elsewhere141
. Different approaches
have been developed depending on the type of study; STR (stirred tank reactor) coupled to a PFR
(plug flow reactor), two or more STRs in series, a STR with separated internal compartments,
tubular loop reactors142
and STRs with randomly fluctuating substrate addition141
.
2.3.3.1 PFR and STR
The most commonly used setup is the STR coupled to a PFR because it combines the stable
environment of the STR and the time varying conditions of the PFR which is especially useful for
population heterogeneity studies since it allows the creation of gradients of various reactor
parameters (e.g. pH, oxygen, substrate concentration)142
. Several studies investigated glucose
gradients since most optimization studies first aim at overcoming this problem, especially in
industrial fed-batch processes141
. George et al (1993)143
simulated aerobic ethanol production due to
glucose excess of S. cerevisiae in a scale down setup with a PFR connected with circulation to a
well-mixed aerated STR. Due to insufficient mixing, which was simulated by adding a glucose feed
at the inlet of the PFR (high glucose/low oxygen concentration), heterogeneities arose which
lowered the biomass yield and increased ethanol production. This experimental setup corresponded
well to the situation cells experience in large scale fed-batch E. coli cultivation (in this case for
acetate accumulation), which enabled the analysis of stress responses experienced by the cells
travelling throughout the different zones of the reactor as well as analysis of viability (PI and BOX
staining)11,144
.
Later, Delvigne et al. (2006a, 2006b & 2006c)145–147
developed, for both E. coli and S. cerevisiae, a
combination of stochastic microbial growth and bioreactor mixing models to explore the
hydrodynamic effect of the bioreactor on microbial growth and this allowed the explanation of the
scale down effect associated with glucose fluctuations. By combining the two model parts the
profile of concentrations that a cell was subjected to during its cultivation in the bioreactor were
obtained. Verification experiments in scale down reactors using a STR connected to four different
unmixed plug flow sections: a silicone tubing, a glass bulb, two glass bulbs in series and two glass
bulbs in parallel with continuous circulation between both parts were in good agreement with the
modeling results145–148
.
The latest approaches include the assignment of reporter strains of E. coli as whole microbial cell
biosensors to investigate the response of the single cells to glucose and oxygen gradients. This is
then followed by the modeling of the GFP expression which is coupled to the expression of specific

Chapter 2b Population heterogeneity in bioprocesses studied at single cell level: industrial scale
simulated in the lab using basic and advanced setups 39
growth, nutrient up- and downshift or stress related genes (like the sigma factor rpoS or rrnB and
fis, respectively) by using an on-line flow cytometer149–151
, which has also been reviewed recently23
.
Also GFP leakage in E. coli biosensors (cisE promoter response to nutrient up and down shift) was
found to be applicable to assess microbial viability in scale down experiments additionally to PI-
staining used for all experiments152
.
Apart from glucose gradient studies the setup has been used to study the general physiological
responses to e.g. oxygen gradients in B. subtilis fermentation 153
and Yarrowia lipolytica lipase
production154
in large scale fed-batch processes as well as for the investigation of pH gradients in B.
subtilis fermentation155
.
2.3.3.2 2STRs
Another widely used setup for scale down reactors consists of two STRs coupled to each other with
continuous circulation inbetween141
. Several studies have been done varying the circulation times as
well as the volume ratio between the reactors simulating different sizes of the glucose feeding zone
with more or less effective mixing with feeding that was only applied in the reactor with the smaller
volume. In this way decreased yields and elevated by-product formation as also seen in a setup with
STR and PFR143
were found for S. cerevisiae156
. Also instantaneous elevated levels of stress related
oxygen limitation and heat-shock genes were found for E. coli cells passing through the high
glucose zone (STR with glucose inlet)16
. Consequently, the system offers a tool for monitoring of
process related changes in the transcriptional regulation of genes156
. Apart from glucose gradients,
oscillations in the dissolved oxygen concentration in E. coli fermentation were studied with a setup
with one aerobic and one anaerobic STR with a volume ratio 1:2 (correspond to 88% of the cells
experience anaerobic conditions) applying a stress reporter strain which expresses GFP12
. In this
way population heterogeneity as a response to changing oxygen availability could be studied.
Studies just considering physiology changes as result of oxygen gradients have also been conducted
for different organisms, like E. coli and Penicillum chrysogenum157,158
.

Chapter 2b Population heterogeneity in bioprocesses studied at single cell level: industrial scale simulated in the lab using basic and
advanced setups 40
Table 2- special setups to study population heterogeneity in lab scale simulating large scale fermentation: The setups have been
grouped under separate headings in chronological order. Abbreviations: BFP: Blue fluorescent protein; BI: budding index; CFU: Colony
forming units; EB: Ethidium bromide; GFP: Green fluorescent protein; FC: flow cytometry; FITC: Fluorescein isothiocyanate; FSC:
Forward scatter; PI: Propidum iodide; RH123: Rhodamine123; SSC: Side scatter;
Fermentation mode Organism medium Type of
heterogeneity
studied
Tools used to study
heterogeneity
Reactor scale Data analysis
TURBIDOSTAT
Tøttrup and Carlsen
(1989)
S. cerevisiae YEP
medium,
ethanol
Proinsulin
production
Reporter strain
(fluorescence reader
and ELISA for
fluorescence)
2.5 L, 3, 5 and
300 L
Timeplots of production rate,
yields
Aarnio et al. (1990) S. cerevisiae YPD
medium,
glucose
growth rate Online measurement
of growth rate
1 L Growth rate distribution
plotted
Markx et al. (1991)
Davey et al. (1995)
S. cerevisiae Complex
medium,
sucrose,
glucose
Growth rate,
viability, bud
count, cell size,
biomass
Online monitoring,
fluorescence
microscopy (MB),
bud count, coulter
counter
0.75 L BI, percentage of viable cells
plotted over time, correlation
analysis between different
recorded parameters
Ullman et al. (2012) E. coli M9
minimal
medium,
glucose
Single cell
expression
Transcriptomics Lab-on-chip Image analysis
RETENTOSTAT
Tappe et al.
(1996&1999)
N. europaea,
N.
winogradskyi
Inorganic
medium,
ammonium
See below See below, but
automated sampling
and staining
0.5 L, internal
biomass retention
See below
Boender et al. (2009)
S. cerevisiae D=
<0.001h-1,
Viability,
metabolic
CFU, fluorescence
microscopy (PI,
2 L Mean properties plotted over
time

Chapter 2b Population heterogeneity in bioprocesses studied at single cell level: industrial scale simulated in the lab using basic and
advanced setups 41
YPD
medium,
glucose
activity FITC)
Boender et al. (2011)
1+2
S. cerevisiae See above See above,
gene
expression
analysis,
metabolome
See above FC(PI,
CFDA)
See above See above, metabolix fluxes
and expression levels
compared
Chesbro et al. (1999)
Ercan et al. (2013)
E. coli
L. lactis
Minimal
medium,
glucose
Viability,
DNA/RNA,
protein
FC (PI, FITC) 1 L Timeplots for mean measured
properties
CYTOSTAT
Zhao et al. (1998) S. cerevisiae,
E. coli
Complex
medium,
glucose
Growth rate Online monitoring
of growth rate,
automated FC (PI,
FITC)
See below See below
Gilbert et al. (2009)
Kacmar et al. (2006)
Kacmar et al. (2004)
Pena et al. (2012)
S. cerevisiae SD-
medium,
glucose
growth rate,
viability,
robustness,
metabolic
fingerprinting,
GFP
fluorescence
Metabolic analysis,
FC (FITC, PI, FSC,
GFP), comparison of
reporter strains,
online monitoring
(PI and GFP)
0.4 L Cumulative distribution plots
of measured properties and
analysis of shifts, biplots,
mean and CV plotted over
time, biplots for stained
properties
BIOSCOPE
Mashego et al. (2006)
1+2
Nasution et al. (2006)
De Mey et al. (2010)
Visser et al. (2002)
Lange et al. (2001)
S. cerevisiae,
P.
chrysogenum,
E. coli
Minimal
medium,
glucose,
D= 0.05h-1
or 0.1h-1
metabolome rapid sampling,
Glucose perturbation
compared to
conventional
chemostat
4 L Metabolic profiles, general
physiology
Kresnowati et al.
(2006 &2008)
S. cerevisiae See above See above, but
pulses of
ethanol and
glucose
See above,
evaluation of
intracellular pH
4 L See above, calculation of
intracellular pH

Chapter 2b Population heterogeneity in bioprocesses studied at single cell level: industrial scale simulated in the lab using basic and
advanced setups 42
Miniaturised Setups
SINGLE CELL REACTORS and FLOW CHAMBER
Inuoe et al. (2001) E. coli M9LB
medium,
glucose
Growth of
single cells
On-line monitoring
under microscope
<1mL, parallel
microchambers
Image analysis
Wakamoto et al. (2001) various Various See above See above Mircochambers See above
Groisman et al. (2005) Various Various Single cell
growth, GFP
fluorescence
Lab-on-chip for
single cell growth,
fluorescence
microscopy
See above Image analysis
Elfwing et al. (2005)
Jang et al. (2011)
E. coli, other
bacteria
LB
medium,
glucose
Single cell
growth, cell
division, single
cell protein
secretion
On-line monitoring
under microscope
<1 mL Image analysis, doubling time
analysis, protein production
plotted
Long et al. (2012) E. coli M9-
minimal
medium,
glucose
See above See above 6000 cell
trapping channels
See above
Denervaud et al. (2013) S. cerevisiae SD-
medium,
glucose
Growth, GFP
expression
Proteome,
microscopy
Microchemostat Image analysis
ENVIRONSTAT
Kortmann et al. (2008)
1+2
Dusny et al. (2012)
Fritzsch et al. (2013)
S. cerevisiae
E. coli and
other bacteria
Minimal
medium,
glucose
Single cell
growth rate
Lab-on-chip, on-line
monitoring of
biomass, microscopy
(pictures, videos)
MTPs CFD modeling, Image
analysis, growth rate
distributions, fitting of
distributions to growth rate
population
Kortmann et al. (2009) S. pombe
See above Single cell
recombinant
protein
production
See above See above See above, production of
single cell calculated

Chapter 2b Population heterogeneity in bioprocesses studied at single cell level: industrial scale simulated in the lab using basic and
advanced setups 43
MICROBIOREACTOR
Parallel MBRs/MTPS
Buchenauer et al. (2009)
Gebhardt et al. (2011)
Puskeiler et al. (2005)
Weuster-Botz et al.
(2005)
E. coli
S. cerevisiae
E. coli
TB-
medium,
glycerol
YEPD-
medium
Mineral
medium,
glucose
Growth rate BioLector
pH, biomass
monitored on-line,
magnetic stirring
fluorescence reader
48 well MTP (8-
12mL), batch,
fed-batch
(exponential&
constant feed)
Timeplots of measured
properties, comparison to large
scale
Van Leeuwen et al.
(2009)
C. utilis Minimal
medium,
glucose
Growth rate,
CO2-
production
See above, on-line
CO2 measurement
96 well MTP See above
MBRs
Kostov et al. (2000) E. coli LB-
medium,
glucose
Growth rate On-line monitoring
(OD, pH, DO)
8 mL Timeplots for measured data,
comparison to 1L scale
Edlich et al. (2009) S. cerevisiae Growth rate,
viability
On-line monitoring
(DO, OD),
fluorescence kit and
reader (PI, SYTO9)
8 µL, continuous
cultivation
possible
Percentage of viable cells,
timeplots of measured
properties, comparison to large
scale
Kensy et al. (2009)
Funke et al. (2010)
E. coli WR-
medium,
glycerol
Growth rate,
protein
production
BioLector software 200 µL, batch
and fed-batch
Timeplots of values,
comparison to 1L scale
Au et al. (2011) BAY
(bacteria,
archaea, yeast)
Various Growth rate,
viability,
fluorescence
On-line monitoring,
viability assay,
reporter strains
(microscope)
Droplet, semi,
continuous
See above
Bower et al. (2012) E. coli Semi-
defined
medium
Growth rate,
protein
production
On-line monitoring
(pH, OD,
temperature)
1 mL, fed-batch See above
SCALE DOWN REACTORS
PFR+STR
Amanullah et al. (2000) B. subtilis Defined
medium,
biomass and
product
product formation
assay
STR 2 L/PFR
0.05 L
Timeplots of measured data,
comparison to normal fed-

Chapter 2b Population heterogeneity in bioprocesses studied at single cell level: industrial scale simulated in the lab using basic and
advanced setups 44
glucose formation batch process
Enfors et al. (2001) E. coli Mineral
salt
medium,
ammonium
Stress
response,
viability
FC (PI, BOX), stress
gene expression
analysis
2 L Biplots gating for viable
percentage
Delvigne et al.
(2006 1,2& 3, 2009,
2011)
Han et al. (2013)
Lejeune et al. (2010)
E. coli
S. cerevisiae
Mineral
medium,
glucose
Cell count,
Stress
response,
viability, GFP
leakage,
growth rate
FC (FSC, SSC, GFP,
PI), subpopulation
analysis, stress and
growth reporter
strain
1 L Timeplots of all mean
measured properties,
frequency distribution of mean
concentration, stochastic
models for scale down in
comparison to normal fed-
batch and chemostat
Brognaux et al. (2012) E. coli Mineral
medium,
glucose
GFP
fluorescence
Three different
reporter strains (FC)
Mini scale down
system, fed-
batch, 0.2 L
Modeling of results and
compared to lab scale, scale
down and conventional reactor
2 STRS
Larsson and Enfors
(1985, 1988)
P.
chrysogenum
Complex
medium
Response to
oxygen
gradients
General physiology 2x15 dm3 Modeling, timeplots of general
physiology, oxygen uptake
rate
Sweere et al. (1988) S. cerevisiae Minimal
medium,
glucose
Growth General physiology Different volume
ratio and
recirculation
times
Glucose and oxygen uptake,
timeplots
Lara et al. (2006) E. coli Mineral
medium,
glucose
Stress gene
response
Fluorescence reader,
qRT-PCR
0.8 L anaerobic,
0.4 L aerobic
Mean fluorescence, gene
expression levels
TURBULAR LOOP REACTOR
Papagianni et al. (2003) A. niger Minimal
medium,
glucose
Response to
oxygen and pH
gradients
General physiology,
microscopy
3.5-9 L Image analysis

Chapter 2b Population heterogeneity in bioprocesses studied at single cell level: industrial scale
simulated in the lab using basic and advanced setups 45
Figure 1- Overview of setups used to investigate single cell population heterogeneity that are
described in this review. Short definitions of the basic and continuous culture based setups are
found in the glossary box respectively in the particular chapters describing the setups. The grey box
marks basic setups. Abbreviations: STR: stirred tank reactor; PFR: plug flow reactor.

Chapter 2b Population heterogeneity in bioprocesses studied at single cell level: industrial scale
simulated in the lab using basic and advanced setups 46
2.4 Discussion and outlook
2.4.1 Further application possibilities of the presented setups
The setups for simulation of population heterogeneity ‒ a phenomenon especially found to
influence large scale industrial production processes ‒ presented in the scope of this review are of
different nature and are in different stages of actually being applied in process research and
development. While there are various studies using the basic setups as batch, fed-batch and
chemostat in a scaled down version compared to industry, specialised setups e.g. cytostat,
retentostat or the bioscope are only used in a limited number of studies but have a tremendous
potential for extended future use. But also combinations of the basic setups with more advanced
sampling techniques (automated, rapid sampling) or on-line monitoring of single cell properties
could be integrated into cultivation processes to further improve the access to experimental data on
rapid physiology changes. These setups are especially valuable when reporter strains and/or stains
(applied as single stains or as a combination of several stains) are applied as single cell expression
targeting special features of interest can be monitored on-line. A valuable tool for the assessment of
rapid physiology changes could be the bioscope system. Up to now the application of the system, as
reviewed here, is limited to metabolome studies. However, it could be easily applied for the study
of dynamic responses on population heterogeneity level in combination with at-line flow cytometry
analysis applying e.g. reporter strains. The only limitation would be that in order to be able to detect
single cell responses the sampling time would need to be adjusted to the generation time of the
fluorescent protein, which is e.g. in case of GFP around 40 min69
. This could be avoided by using
setups like the cytostat that use an on-line flow cytometer since in this case fluorescence could be
monitored on-line permanently. The cytostat is generally broadly applicable within single cell
physiology studies but its development is still at the beginning97
. However, it could be used to
monitor the expression of a certain gene of interest which is e.g. stress response related as well as
by applying more stains apart from PI in the microchamber sampling unit. Furthermore, a cell sorter
could be integrated in the system to sort for single cell subpopulations with desired properties that
can afterwards be analysed in more detail. To study cells under more extreme growth conditions a
turbidostat or retentostat could be applied. The turbidostat could hereby be used to investigate
single cell behavior and responses to perturbations during growth at maximum specific growth
rates, which might be of interest for industrial processes that aim at producing growth related
products, due to the increased volumetric productivity. Also the potential high cell densities
achieved in a turbidostat resemble e.g. industrial high density fed-batch process conditions. On the

Chapter 2b Population heterogeneity in bioprocesses studied at single cell level: industrial scale
simulated in the lab using basic and advanced setups 47
other hand the retentostat could be used to study the opposite phenomenon of single cells growing
at near-zero growth rates, which might have future potential for creating new cell factories as well
as for the investigation of processes with a production that is uncoupled to growth, or in general for
a more detailed investigation of cell robustness. However, more measurements like, cell size
distribution, reporter strains, fluorescent stains and biosensors should be included in the studies. At
present there is room for considerable development as well as a need for modeling approaches to
make studies better controllable and predictable.
In general all these setups provide, when performed in lab scale considerable amounts of detailed
data and comparing all scales (figure 2), these setups have the biggest potential to be combined with
different sampling methods and analysis.
Furthermore scale down reactors can be used for several different approaches with different settings
and building blocks (Combination of narrow property distributions in PFR and zones with high and
low parameter values depending on the position in the reactor in a STR). Studies also showed that
they can mimic the behavior of industrial scale processes and can be modeled which makes scale
down reactors a useful tool for studying population heterogeneity and process optimization. Future
application could include extended use of reporter systems/microbial cell biosensors and also
expand scale down reactors up to now run as fed-batch processes towards other process modes like
the chemostat. An attempt was made recently to couple two STRs to each other with continuous
circulation between them, where one reactor represented the feeding zone with glucose inlet and the
other one the remaining reactor volume with outlet and aeration (unpublished results).
A tremendous potential for future use in bioprocess development and optimization also lies in
miniaturised setups like microbioreactors, arrays of microtiter plates(MTPs), lab-on-chip setups
(e.g. environstat) or single cell reactors134
. Especially setups following single cells like the
environstat or single cell reactors and flow chambers improve the possibilities in single cell
research, because it allows the characterization of single cells in an isolated environment, which can
be extended to study e.g. single cell protein expression (figure 2). Setups like this, although loosing
mostly the high throughput of flow cytometry because they use microscopy, describe processes with
high sample frequency (figure 2). Furthermore it might simplify the investigation of regulatory and
physiological responses to genetic and environmental perturbations130
. But these relatively new
devices need further improvement in process control, sampling and data analysis. However due to
the small volume it will be a challenge to integrate more advanced sampling for e.g. gene

Chapter 2b Population heterogeneity in bioprocesses studied at single cell level: industrial scale
simulated in the lab using basic and advanced setups 48
expression analysis as well as proteome or metabolome analysis. To circumvent this problem more
on-line monitoring tools in combination with reporter strains could be applied.
Figure 2- Comparison of investigation of single cells population heterogeneity at different
scales: evaluating tools, factors studied (extrinsic and intrinsic) and the output. With the decrease in
scale more valuable single cell data can be collected with decreasing respectively increasing
influence of intrinsic and extrinsic factors which is reflected in the output going from mostly
general physiology data to single values and distributions.
2.4.2 Need for more advanced data analysis
Studies at single cell level mentioned in the scope of this review generate bog amounts of data,
especially when involving flow cytometry with regular sampling to follow a whole cultivation

Chapter 2b Population heterogeneity in bioprocesses studied at single cell level: industrial scale
simulated in the lab using basic and advanced setups 49
process. These data are normally evaluated using biplots of cell size against a measured fluorescent
property distribution e.g. GFP fluorescence or single parameter histogram plots, which are manually
gated for positive stained cells (see table 1 and 2, column data analysis). Thereafter values are
mostly scaled down to mean values or in rare cases coefficient of variance (CV) values, which fail
to describe the real phenomena in the bioreactor. As a consequence the potential of the data
collected using advanced setups that make population heterogeneity assessable are subjectively
analysed which makes comparison of results from different studies difficult as well as
reproducibility questionable. Therefore, the need for more objective data analysis and unbiased
systematic tools to describe population heterogeneity arose in several studies and reviews10,14,23,33
.
This would in the end also facilitate the use of these methods for optimization of industrial
processes. Data analysis methods like this are general practice in mammalian cell research and have
been reviewed elsewhere159
. Additionally to data analysis also the mathematical modeling efforts to
account for the heterogeneity in bioprocesses is scarce and not sufficiently explored thus far to
validate model predictions for cell property distributions against experimental data, which has also
been reviewed160
.
Some approaches have been developed to overcome these problems in e.g. developing simple
mathematical parameters to describe the distribution shape of single cell properties in a quantitative
way (Heins et al., unpublished). Furthermore a basic kinetic model was coupled to a single cell
model to account for single cell distributions during batch cultivations of S. cerevisiae33
.
2.4.3 General usefulness of the presented setups and tools for industry and outlook
In conclusion, the reviewed methods and setups to investigate population heterogeneity hold great
potential to be further developed or/and combined, and thereby hopefully enable better control of
this phenomenon in the future. Moreover, if data analysis and modeling tools will be improved
these setups can also be used in industrial process development and optimization applying reporter
strains as well as different fluorescence stains evaluated by flow cytometry on-line or at-line. For
the production process itself the application of reporter strains might be critical but more on-line
monitoring methods could be applied. Also, adding cell sorting of subpopulations observed during
bioprocesses to allow more detailed characterization of them could be helpful and consequently be
used for strain population engineering, which lately caught increased attention.
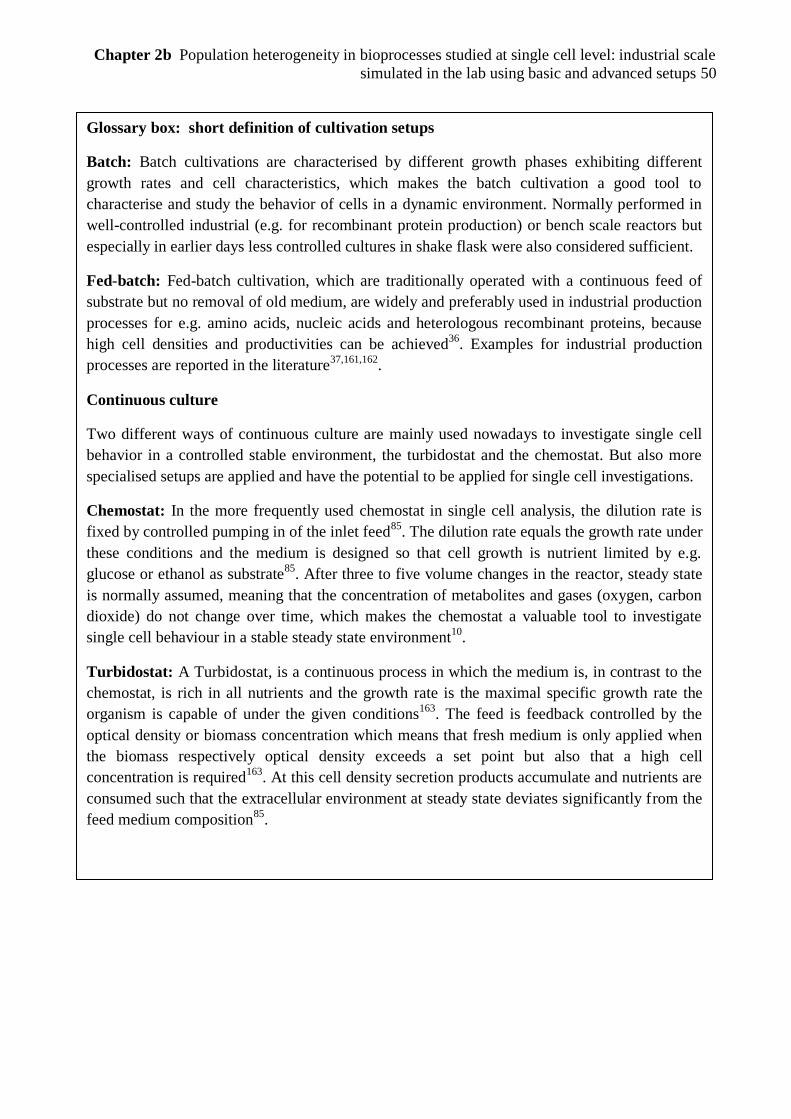
Chapter 2b Population heterogeneity in bioprocesses studied at single cell level: industrial scale
simulated in the lab using basic and advanced setups 50
Glossary box: short definition of cultivation setups
Batch: Batch cultivations are characterised by different growth phases exhibiting different
growth rates and cell characteristics, which makes the batch cultivation a good tool to
characterise and study the behavior of cells in a dynamic environment. Normally performed in
well-controlled industrial (e.g. for recombinant protein production) or bench scale reactors but
especially in earlier days less controlled cultures in shake flask were also considered sufficient.
Fed-batch: Fed-batch cultivation, which are traditionally operated with a continuous feed of
substrate but no removal of old medium, are widely and preferably used in industrial production
processes for e.g. amino acids, nucleic acids and heterologous recombinant proteins, because
high cell densities and productivities can be achieved36
. Examples for industrial production
processes are reported in the literature37,161,162
.
Continuous culture
Two different ways of continuous culture are mainly used nowadays to investigate single cell
behavior in a controlled stable environment, the turbidostat and the chemostat. But also more
specialised setups are applied and have the potential to be applied for single cell investigations.
Chemostat: In the more frequently used chemostat in single cell analysis, the dilution rate is
fixed by controlled pumping in of the inlet feed85
. The dilution rate equals the growth rate under
these conditions and the medium is designed so that cell growth is nutrient limited by e.g.
glucose or ethanol as substrate85
. After three to five volume changes in the reactor, steady state
is normally assumed, meaning that the concentration of metabolites and gases (oxygen, carbon
dioxide) do not change over time, which makes the chemostat a valuable tool to investigate
single cell behaviour in a stable steady state environment10
.
Turbidostat: A Turbidostat, is a continuous process in which the medium is, in contrast to the
chemostat, is rich in all nutrients and the growth rate is the maximal specific growth rate the
organism is capable of under the given conditions163
. The feed is feedback controlled by the
optical density or biomass concentration which means that fresh medium is only applied when
the biomass respectively optical density exceeds a set point but also that a high cell
concentration is required163
. At this cell density secretion products accumulate and nutrients are
consumed such that the extracellular environment at steady state deviates significantly from the
feed medium composition85
.

Chapter 2b Population heterogeneity in bioprocesses studied at single cell level: industrial scale
simulated in the lab using basic and advanced setups 51
Retentostat: A Retentostat or sometimes referred to as recycle fermenter or recyclostat92
, which
was first proposed by Herbert (1961), is a variation of the chemostat with the difference that the
effluent outlet is replaced by a polypropylene filter so that all cells are retained inside the
bioreactor90
. Consequently, the biomass concentration in the bioreactor will constantly increase
while the growth-limiting energy substrate is fed with a constant low rate that is sufficient for
maintenance of cellular viability and integrity but insufficient for growth91,92
. If operated for a
prolonged time the glucose available per cell is decreasing and finally a situation is attained where
the specific growth rate becomes zero (below 0.01 h-1
) and the substrate consumption equals the
maintenance energy requirement90,92
.
Cytostat: A cytostat, is a modification of the turbidostat, where the inlet feed is controlled by an
automated flow cytometer directly connected to the bioreactor which is measuring, monitoring
and controlling its cell number concentration85
. Originally, the cytostat process control was
developed for mammalian cell culture and used for diverse applications like the production of
monoclonal antibodies164
or the continuous culture of Chinese hamster ovary (CHO) cells97
. In the
latter case the original cytostat, whose use was limited to high cell concentrations and had the
disadvantage that the cell concentration needed to be achieved indirectly by a correlation, was
further developed by connecting an automated flow cytometer with flowchamber to the bioreactor
to use it for the control of the cell concentration85
. In this way the cytostat can be controlled at
very low cell concentrations which only negligibly change the composition of the medium in the
bioreactor making the cell environment precisely defined by the feed.
Bioscope: The bioscope sampling loop is connected to a fed-batch or continuously operated
bioreactor, from which it is fed with a constant flow (normally 1-3 mL/min) of bioreactor broth
which is then mixed with a small amount of perturbing agent (perturbation start, e.g. substrate,
inhibitors, uncoupled agents)103
. Afterwards the perturbed broth flows through a long channel and
samples are taken automatically at different locations along the bioscope, which resembles a PFR,
corresponding to different incubation times after perturbation (0-100s, sampling port every 3s)103
.
This setup allows the performance of perturbation experiments of various kind and intensity
evaluating in vivo kinetics during large scale continuous and fed-batch experiments within the
same experiment with high reproducibility and possible application of different sampling
protocols103,104
.

Chapter 2b Population heterogeneity in bioprocesses studied at single cell level: industrial scale
simulated in the lab using basic and advanced setups 52
2.5 References
1. Ferrer-Miralles, N., Domingo-Espín, J., Corchero, J. L., Vázquez, E. & Villaverde, A.
Microbial factories for recombinant pharmaceuticals. Microb. Cell Fact. 8, (2009).
2. Chemler, J. a, Yan, Y. & Koffas, M. a G. Biosynthesis of isoprenoids, polyunsaturated fatty
acids and flavonoids in Saccharomyces cerevisiae. Microb. Cell Fact. 5, (2006).
3. Demain, A. L. The business of biotechnology. Ind. Biotechnol. 3, 269–283 (2007).
4. Demain, A. L. & Vaishnav, P. Production of recombinant proteins by microbes and higher
organisms. Biotechnol. Adv. 27, 297–306 (2009).
5. Krogh, A. Stability of heterologous protein production by Saccharomyces cerevisiae in
continuous cultures. (2009).
6. Hensing, M. C., Rouwenhorst, R. J., Heijnen, J. J., van Dijken, J. P. & Pronk, J. T.
Physiological and technological aspects of large-scale heterologous-protein production with
yeasts. Antonie Van Leeuwenhoek 67, 261–279 (1995).
7. Lara, A. R., Galindo, E., Ramirez, O. T. & Palomares, L. A. Living with heterogeneities in
bioreactors: understanding the effects of environmental gradients on cells. Mol. Biotechnol.
34, 355–381 (2006).
8. Müller, S., Harms, H. & Bley, T. Origin and analysis of microbial population heterogeneity
in bioprocesses. Curr. Opin. Biotechnol. 21, 100–113 (2010).
9. Lidstrom, M. E. & Konopka, M. C. The role of physiological heterogeneity in microbial
population behavior. Nat. Chem. Biol. 6, 705–712 (2010).
10. Fernandes, R. L. et al. Experimental methods and modeling techniques for description of cell
population heterogeneity. Biotechnol. Adv. 29, 575–599 (2011).
11. Enfors, S. O. et al. Physiological responses to mixing in large scale bioreactors. J.
Biotechnol. 85, 175–185 (2001).
12. Lara, A. R., Galindo, E., Ramírez, O. T. & Palomares, L. A. Living With Heterogeneities in
Bioreactors Living With Heterogeneities in Bioreactors. Mol. Biotechnol. 34, (2006).
13. Muller, S., Harms, H. & Bley, T. Origin and analysis of microbial population heterogeneity
in bioprocesses. Curr. Opin. Biotechnol. 21, 100–113 (2010).
14. Carlquist, M. et al. Physiological heterogeneities in microbial populations and implications
for physical stress tolerance. Microb. Cell Fact. 11, (2012).

Chapter 2b Population heterogeneity in bioprocesses studied at single cell level: industrial scale
simulated in the lab using basic and advanced setups 53
15. Bylund, F., Collet, E., Enfors, S.-O. & Larsson, G. Substrate gradient formation in the large-
scale bioreactor lowers cell yield and increases by-product formation. Bioprocess Eng. 18,
(1998).
16. Schweder, T. et al. Monitoring of genes that respond to process-related stress in large-scale
bioprocesses. Biotechnol. Bioeng. 65, 151–159 (1999).
17. Larsson, G. et al. Substrate gradients in bioreactors: origin and consequences. Bioprocess
Eng. 14, 281–289 (1996).
18. Díaz, M., Herrero, M., García, L. a. & Quirós, C. Application of flow cytometry to industrial
microbial bioprocesses. Biochem. Eng. J. 48, 385–407 (2010).
19. Müller, S. & Nebe-von-Caron, G. Functional single-cell analyses: flow cytometry and cell
sorting of microbial populations and communities. FEMS Microbiol. Rev. 34, 554–587
(2010).
20. Rieseberg, M., Kasper, C., Reardon, K. F. & Scheper, T. Flow cytometry in biotechnology.
Appl. Microbiol. Biotechnol. 56, 350–360 (2001).
21. Schmid, A., Kortmann, H., Dittrich, P. S. & Blank, L. M. Chemical and biological single cell
analysis. Curr. Opin. Biotechnol. 21, 12–20 (2010).
22. Herzenberg, L. a, Tung, J., Moore, W. a, Herzenberg, L. a & Parks, D. R. Interpreting flow
cytometry data: a guide for the perplexed. Nat. Immunol. 7, 681–685 (2006).
23. Delvigne, F. & Goffin, P. Microbial heterogeneity affects bioprocess robustness: Dynamic
single-cell analysis contributes to understanding of microbial populations. Biotechnol. J. 9,
61–72 (2014).
24. Cipollina, C. et al. Revisiting the role of yeast Sfp1 in ribosome biogenesis and cell size
control: a chemostat study. Microbiology 154, 337–346 (2008).
25. Vanoni, M., Vai, M., Popolo, L. & Alberghina, L. Structural heterogeneity in populations of
the budding yeast Saccharomyces Structural Heterogeneity in Populations of the Budding
Yeast Saccharomyces cerevisiae. J. Bacteriol. 156, 1282–1291 (1983).
26. Lord, P. G. & Wheals, A. E. Asymmetrical division of Asymmetrical Division of
Saccharomyces cerevisiae. J. Bacteriol. 142, 808–818 (1980).
27. Akerlund, T., Nordström, K. & Bernander, R. Analysis of cell size and DNA content in
exponentially growing and stationary-phase batch cultures of Escherichia coli. J. Bacteriol.
177, 6791–6797 (1995).
28. Cipollina, C., Alberghina, L., Porro, D. & Vai, M. SFP1 is involved in cell size modulation
in respiro-fermentative growth conditions. Yeast 22, 385–399 (2005).

Chapter 2b Population heterogeneity in bioprocesses studied at single cell level: industrial scale
simulated in the lab using basic and advanced setups 54
29. Skarstad, K., Steen, H. B. & Boye, E. Cell cycle parameters of slowly growing Escherichia
coli B / r studied by flow Cell Cycle Parameters of Slowly Growing Escherichia coli B / r
Studied by Flow Cytometry. J. Bacteriol. 154, 656–662 (1983).
30. Porro, D., Brambilla, L. & Alberghina, L. Glucose metabolism and cell size in continuous
cultures of Saccharomyces cerevisiae. FEMS Microbiol. Lett. 229, 165–171 (2003).
31. Ranzi, B. M., Cornragno, C. & Martegani, E. Analysis of Protein and Cell Volume
Distribution in G I u cose- Li m it ed Continuous Cultures of Budding Yeast. Biotechnol.
Bioeng. XXVIII, 185–190 (1986).
32. Roostalu, J., Jõers, A., Luidalepp, H., Kaldalu, N. & Tenson, T. Cell division in Escherichia
coli cultures monitored at single cell resolution. BMC Microbiol. 8, (2008).
33. Lencastre Fernandes, R. et al. Cell mass and cell cycle dynamics of an asynchronous budding
yeast population: experimental observations, flow cytometry data analysis, and multi-scale
modeling. Biotechnol. Bioeng. 110, 812–826 (2013).
34. Porro, D., Vai, M., Vanoni, M., Alberghina, L. & Hatzis, C. Analysis and modeling of
growing budding yeast populations at the single cell level. Cytometry. A 75, 114–120 (2009).
35. Quiros, C., Herrero, M., Garcia, L. A. & Diaz, M. Application of flow cytometry to
segregated kinetic modeling based on the physiological states of microorganisms. Appl.
Environ. Microbiol. 73, 3993–4000 (2007).
36. Hewitt, C. J., Nebe-Von Caron, G., Nienow, a W. & McFarlane, C. M. Use of multi-staining
flow cytometry to characterise the physiological state of Escherichia coli W3110 in high cell
density fed-batch cultures. Biotechnol. Bioeng. 63, 705–711 (1999).
37. Wang, J. et al. Genetic engineering of Escherichia coli to enhance production of L-
tryptophan. Appl. Microbiol. Biotechnol. 97, 7587–7596 (2013).
38. Freitas, C., Neves, E., Reis, A., Passarinho, P. C. & da Silva, T. L. Use of multi-parameter
flow cytometry as tool to monitor the impact of formic acid on Saccharomyces carlsbergensis
batch ethanol fermentations. Appl. Biochem. Biotechnol. 169, 2038–2048 (2013).
39. Tibayrenc, P., Preziosi-Belloy, L. & Ghommidh, C. Single-cell analysis of S . cerevisiae
growth recovery after a sublethal heat-stress applied during an alcoholic fermentation. J. Ind.
Microbiol. Biotechnol. 687–696 (2011). doi:10.1007/s10295-010-0814-6
40. Amillastre, E., Aceves-Lara, C.-A., Uribelarrea, J.-L., Alfenore, S. & Guillouet, S. E.
Dynamic model of temperature impact on cell viability and major product formation during
fed-batch and continuous ethanolic fermentation in Saccharomyces cerevisiae. Bioresour.
Technol. 117, 242–250 (2012).
41. Berney, M. et al. Specific Growth Rate Determines the Sensitivity of Escherichia coli to
Thermal , UVA , and Solar Disinfection. Appl. Environ. Microbiol. 72, 2586–2593 (2006).

Chapter 2b Population heterogeneity in bioprocesses studied at single cell level: industrial scale
simulated in the lab using basic and advanced setups 55
42. Hewitt, C. J., Boon, L. a, McFarlane, C. M. & Nienow, a W. The use of flow cytometry to
study the impact of fluid mechanical stress on Escherichia coli W3110 during continuous
cultivation in an agitated bioreactor. Biotechnol. Bioeng. 59, 612–620 (1998).
43. Howlett, N. G. & Avery, S. V. Flow cytometric investigation of heterogeneous copper-
sensitivity in asynchronously grown Saccharomyces cerevisiae. FEMS Microbiol. Lett. 176,
379–386 (1999).
44. Sundström, H. et al. Segregation to non-dividing cells in recombinant Escherichia coli fed-
batch fermentation processes. Biotechnol. Lett. 26, 1533–1539 (2004).
45. Want, A., Thomas, O. R. T., Kara, B., Liddell, J. & Hewitt, C. J. Studies related to antibody
fragment (Fab) production in Escherichia coli W3110 fed-batch fermentation processes using
multiparameter flow cytometry. Cytometry. A 75, 148–154 (2009).
46. Nebe-von-Caron, G., Stephens, P. J., Hewitt, C. J., Powell, J. R. & Badley, R. a. Analysis of
bacterial function by multi-colour fluorescence flow cytometry and single cell sorting. J.
Microbiol. Methods 42, 97–114 (2000).
47. Hewitt, C. J., Nebe-Von Caron, G., Axelsson, B., McFarlane, C. M. & Nienow, a W. Studies
related to the scale-up of high-cell-density E. coli fed-batch fermentations using
multiparameter flow cytometry: effect of a changing microenvironment with respect to
glucose and dissolved oxygen concentration. Biotechnol. Bioeng. 70, 381–390 (2000).
48. Gustavsson, R. & Mandenius, C.-F. Soft sensor control of metabolic fluxes in a recombinant
Escherichia coli fed-batch cultivation producing green fluorescence protein. Bioprocess
Biosyst. Eng. 36, 1375–1384 (2013).
49. Sweere, A. P. J. et al. Modelling the dynamic behaviour of Saccharomyces cerevisiae and its
application in control experiments. Appl. Microbiol. Biotechnol. 116–127 (1988).
50. Taymaz-Nikerel, H., van Gulik, W. M. & Heijnen, J. J. Escherichia coli responds with a
rapid and large change in growth rate upon a shift from glucose-limited to glucose-excess
conditions. Metab. Eng. 13, 307–318 (2011).
51. Theobald, U., Mailinger, W., Baltes, M., Rizzi, M. & Reuss, M. In vivo analysis of metabolic
dynamics in Saccharomyces cerevisiae : I. Experimental observations. Biotechnol. Bioeng.
55, 305–316 (1997).
52. Wu, L. et al. Quantitative analysis of the microbial metabolome by isotope dilution mass
spectrometry using uniformly 13C-labeled cell extracts as internal standards. Anal. Biochem.
336, 164–171 (2005).
53. Zakrzewska, A. et al. Genome-wide analysis of yeast stress survival and tolerance
acquisition to analyze the central trade-off between growth rate and cellular robustness. Mol.
Biol. Cell 22, 4435–4446 (2011).

Chapter 2b Population heterogeneity in bioprocesses studied at single cell level: industrial scale
simulated in the lab using basic and advanced setups 56
54. Raman, B., Nandakumar, M. P., Muthuvijayan, V. & Marten, M. R. Proteome analysis to
assess physiological changes in Escherichia coli grown under glucose-limited fed-batch
conditions. Biotechnol. Bioeng. 92, 384–392 (2005).
55. Yoon, S. H., Han, M.-J., Lee, S. Y., Jeong, K. J. & Yoo, J.-S. Combined transcriptome and
proteome analysis of Escherichia coli during high cell density culture. Biotechnol. Bioeng.
81, ombined transcriptome and proteome analysis of Esc (2003).
56. Winder, C. L. et al. Metabolic fingerprinting as a tool to monitor whole-cell
biotransformations. Anal. Bioanal. Chem. 399, 387–401 (2011).
57. Daran-Lapujade, P. et al. Role of transcriptional regulation in controlling fluxes in central
carbon metabolism of Saccharomyces cerevisiae. A chemostat culture study. J. Biol. Chem.
279, 9125–9138 (2004).
58. Fazio, A. et al. Transcription factor control of growth rate dependent genes in
Saccharomyces cerevisiae: a three factor design. BMC Genomics 9, (2008).
59. Kolkman, A., Olsthoorn, M. M. a, Heeremans, C. E. M., Heck, A. J. R. & Slijper, M.
Comparative proteome analysis of Saccharomyces cerevisiae grown in chemostat cultures
limited for glucose or ethanol. Mol. Cell. Proteomics 4, 1–11 (2005).
60. Brauer, M. J. et al. Coordination of Growth Rate , Cell Cycle , Stress Response , and
Metabolic Activity in Yeast. Mol. Biol. Cell 19, 352–367 (2008).
61. Regenberg, B. et al. Growth-rate regulated genes have profound impact on interpretation of
transcriptome profiling in Saccharomyces cerevisiae. Genome Biol. 7, (2006).
62. Tai, S. L. et al. Two-dimensional transcriptome analysis in chemostat cultures.
Combinatorial effects of oxygen availability and macronutrient limitation in Saccharomyces
cerevisiae. J. Biol. Chem. 280, 437–447 (2005).
63. Benbadis, L., Cot, M., Rigoulet, M. & Francois, J. Isolation of two cell populations from
yeast during high-level alcoholic fermentation that resemble quiescent and nonquiescent cells
from the stationary phase on glucose. FEMS Yeast Res. 9, 1172–1186 (2009).
64. Attfield, P. V, Choi, H. Y., Veal, D. a & Bell, P. J. Heterogeneity of stress gene expression
and stress resistance among individual cells of Saccharomyces cerevisiae. Mol. Microbiol.
40, 1000–1008 (2001).
65. Sunya, S., Delvigne, F., Uribelarrea, J.-L., Molina-Jouve, C. & Gorret, N. Comparison of the
transient responses of Escherichia coli to a glucose pulse of various intensities. Appl.
Microbiol. Biotechnol. 95, 1021–1034 (2012).
66. Nisamedtinov, I. et al. The response of the yeast Saccharomyces cerevisiae to sudden vs.
gradual changes in environmental stress monitored by expression of the stress response
protein Hsp12p. FEMS Yeast Res. 8, 829–838 (2008).

Chapter 2b Population heterogeneity in bioprocesses studied at single cell level: industrial scale
simulated in the lab using basic and advanced setups 57
67. Sunya, S., Gorret, N., Delvigne, F., Uribelarrea, J.-L. & Molina-Jouve, C. Real-time
monitoring of metabolic shift and transcriptional induction of yciG::luxCDABE E. coli
reporter strain to a glucose pulse of different concentrations. J. Biotechnol. 157, 379–390
(2012).
68. DeLisa, M. P., Li, J., Rao, G., Weigand, W. a & Bentley, W. E. Monitoring GFP-operon
fusion protein expression during high cell density cultivation of Escherichia coli using an on-
line optical sensor. Biotechnol. Bioeng. 65, 54–64 (1999).
69. Reischer, H., Schotola, I., Striedner, G., Pötschacher, F. & Bayer, K. Evaluation of the GFP
signal and its aptitude for novel on-line monitoring strategies of recombinant fermentation
processes. J. Biotechnol. 108, 115–125 (2004).
70. Natarajan, a & Srienc, F. Dynamics of glucose uptake by single Escherichia coli cells.
Metab. Eng. 1, 320–333 (1999).
71. Lewis, G., Taylor, I. W., Nienow, A. W. & Hewitt, C. J. The application of multi-parameter
flow cytometry to the study of recombinant Escherichia coli batch fermentation processes. J.
Ind. Microbiol. Biotechnol. 31, 311–322 (2004).
72. Lú Chau, T., Guillán, A., Roca, E., Núñez, M. J. & Lema, J. M. Population dynamics of a
continuous fermentation of recombinant Saccharomyces cerevisiae using flow cytometry.
Biotechnol. Prog. 17, 951–957 (2001).
73. Abel, C. et al. Transient behaviour of continuously cultivated Baker ’ s yeast during enforced
variations of dissolved oxygen and glucose concentrations. J. Biotechnol. 33, 183–193
(1994).
74. Kresnowati, M. T. A. P., Groothuizen, M. K. & Winden, W. A. Van. Measurement of Fast
Dynamic Intracellular pH in Saccharomyces cerevisiae Using Benzoic Acid Pulse. J.
Biotechnol. 97, 86–98 (2007).
75. Davey, H. M. et al. Oscillatory, stochastic and chaotic growth rate fluctuations in
permittistatically controlled yeast cultures. Biosystems. 39, 43–61 (1996).
76. Aarnio, T. H., Suihko, M. L. & Kauppinen, V. S. Isolation of acetic acid-tolerant Baker’s
yeast variants in a turbidostat. Appl. Biochem. Biotechnol. 27, 55–63 (1991).
77. Avrahami-Moyal, L., Engelberg, D., Wenger, J. W., Sherlock, G. & Braun, S. Turbidostat
Culture of Saccharomyces cerevisiae W303-1A under Selective pressure elicited by ethanol
selects for mutations in SSD1 and UTH1. FEMS Yeast Res. 12, 521–533 (2013).
78. Tøsttrup, H. V & Carlsen, S. A Process for the Production of Human P r oi n su I i n i n
Saccharom yces cere vjsjae. Biotechnol. Bioeng. 35, 339–348 (1989).
79. el-Mansi, E. M. & Holms, W. H. Control of carbon flux to acetate excretion during growth of
Escherichia coli in batch and continuous cultures. J. Gen. Microbiol. 135, 2875–2883 (1989).

Chapter 2b Population heterogeneity in bioprocesses studied at single cell level: industrial scale
simulated in the lab using basic and advanced setups 58
80. Holms, H. Flux analysis and control of the central metabolic pathways in Escherichia coli.
FEMS Microbiol. Rev. 19, 85–116 (1996).
81. Laurinavichene, T. V, Chanal, A., Wu, L. F. & Tsygankov, a a. Effect of O2, H2 and redox
potential on the activity and synthesis of hydrogenase 2 in Escherichia coli. Res. Microbiol.
152, 793–798 (2001).
82. Zhao, R., Natarajan, A. & Srienc, F. A flow injection flow cytometry system for on-line
monitoring of bioreactors. Biotechnol. Bioeng. 62, 609–617 (1999).
83. Zhao, Z., Wang, T. & Chen, L. Dynamic analysis of a turbidostat model with the feedback
control. Commun. Nonlinear Sci. Numer. Simul. 15, 1028–1035 (2010).
84. Guo, H. & Chen, L. Periodic solution of a turbidostat system with impulsive state feedback
control. J. Math. Chem. 46, 1074–1086 (2008).
85. Kacmar, J., Gilbert, A., Cockrell, J. & Srienc, F. The cytostat: A new way to study cell
physiology in a precisely defined environment. J. Biotechnol. 126, 163–172 (2006).
86. Sorgeloos, P., Van Outryve, E., Persoone, G. & Cattoir-Reynaerts, A. New type of
turbidostat with intermittent determination of cell density outside the culture vessel. Appl.
Environ. Microbiol. 31, 327–331 (1976).
87. Markx, G. H., Davey, C. L. & Kell, D. B. The permittistat: a novel type of turbidostat. J.
Gen. Microbiol. 137, 735–743 (1991).
88. Atkinson, M. R., Savageau, M. a, Myers, J. T. & Ninfa, A. J. Development of genetic
circuitry exhibiting toggle switch or oscillatory behavior in Escherichia coli. Cell 113, 597–
607 (2003).
89. Van Verseveld, H. W. et al. Modeling of microbial substrate conversion, growth and product
formation in a recycling fermentor. Antonie Van Leeuwenhoek 52, 325–342 (1986).
90. Boender, L. G. M. et al. Extreme calorie restriction and energy source starvation in
Saccharomyces cerevisiae represent distinct physiological states. Biochim. Biophys. Acta
1813, 2133–2144 (2011).
91. Boender, L. G. M. et al. Cellular responses of Saccharomyces cerevisiae at near-zero growth
rates: transcriptome analysis of anaerobic retentostat cultures. FEMS Yeast Res. 11, 603–620
(2011).
92. Boender, L. G. M., de Hulster, E. a F., van Maris, A. J. a, Daran-Lapujade, P. a S. & Pronk,
J. T. Quantitative physiology of Saccharomyces cerevisiae at near-zero specific growth rates.
Appl. Environ. Microbiol. 75, 5607–5614 (2009).
93. Chesbro, W., Evans, T. & Eifert, R. Very slow growth of Very Slow Growth of Escherichia
coli. J. Bacteriol. 139, (1979).
Chapter 2b Population heterogeneity in bioprocesses studied at single cell level: industrial scale
simulated in the lab using basic and advanced setups 59
94. Konopka, a. Microbial physiological state at low growth rate in natural and engineered
ecosystems. Curr. Opin. Microbiol. 3, 244–247 (2000).
95. Ercan, O., Smid, E. J. & Kleerebezem, M. Quantitative physiology of Lactococcus lactis at
extreme low-growth rates. Environ. Microbiol. 15, 2319–2332 (2013).
96. Bull, A. T. The renaissance of continuous culture in the post-genomics age. J. Ind. Microbiol.
Biotechnol. 37, 993–1021 (2010).
97. Kacmar, J. & Srienc, F. Dynamics of single cell property distributions in Chinese hamster
ovary cell cultures monitored and controlled with automated flow cytometry. J. Biotechnol.
120, 410–420 (2005).
98. Gilbert, A. & Srienc, F. Optimized evolution in the cytostat: a Monte Carlo simulation.
Biotechnol. Bioeng. 102, 221–231 (2009).
99. Gilbert, A., Sangurdekar, D. P. & Srienc, F. Rapid strain improvement through optimized
evolution in the cytostat. Biotechnol. Bioeng. 103, 500–512 (2009).
100. Peña, P. V, Glasker, S. & Srienc, F. Genome-wide overexpression screen for sodium acetate
resistance in Saccharomyces cerevisiae. J. Biotechnol. 164, 26–33 (2013).
101. Kacmar, J., Zamamiri, A., Carlson, R., Abu-Absi, N. R. & Srienc, F. Single-cell variability in
growing Saccharomyces cerevisiae cell populations measured with automated flow
cytometry. J. Biotechnol. 109, 239–254 (2004).
102. Abu-Absi, N. R., Zamamiri, A., Kacmar, J., Balogh, S. J. & Srienc, F. Automated flow
cytometry for acquisition of time-dependent population data. Cytometry. A 51, 87–96 (2003).
103. Visser, D. et al. Rapid sampling for analysis of in vivo kinetics using the BioScope: a system
for continuous-pulse experiments. Biotechnol. Bioeng. 79, 674–681 (2002).
104. Mashego, M. R., van Gulik, W. M., Vinke, J. L., Visser, D. & Heijnen, J. J. In vivo kinetics
with rapid perturbation experiments in Saccharomyces cerevisiae using a second-generation
BioScope. Metab. Eng. 8, 370–383 (2006).
105. Buziol, S. et al. New bioreactor-coupled rapid stopped-flow sampling technique for
measurements of metabolite dynamics on a subsecond time scale. Biotechnol. Bioeng. 80,
632–636 (2002).
106. De Koning, W. & van Dam, K. A method for the determination of changes of glycolytic
metabolites in yeast on a subsecond time scale using extraction at neutral pH. Anal. Biochem.
204, 118–123 (1992).
107. Lange, H. C. et al. Improved rapid sampling for in vivo kinetics of intracellular metabolites
in Saccharomyces cerevisiae. Biotechnol. Bioeng. 75, 406–415 (2001).

Chapter 2b Population heterogeneity in bioprocesses studied at single cell level: industrial scale
simulated in the lab using basic and advanced setups 60
108. Mashego, M. R., van Gulik, W. M. & Heijnen, J. J. Metabolome dynamic responses of
Saccharomyces cerevisiae to simultaneous rapid perturbations in external electron acceptor
and electron donor. FEMS Yeast Res. 7, 48–66 (2007).
109. Nasution, U., Gulik, W. M. Van, Kleijn, R. J. & Winden, W. A. Van. Measurement of
Intracellular Metabolites of Primary Metabolism and Adenine Nucleotides in Chemostat
Cultivated Penicillium chrysogenum. Interscience (2006). doi:10.1002/bit
110. Kresnowati, M. T. a P., Suarez-Mendez, C. M., van Winden, W. a, van Gulik, W. M. &
Heijnen, J. J. Quantitative physiological study of the fast dynamics in the intracellular pH of
Saccharomyces cerevisiae in response to glucose and ethanol pulses. Metab. Eng. 10, 39–54
(2008).
111. De Mey, M. et al. Catching prompt metabolite dynamics in Escherichia coli with the
BioScope at oxygen rich conditions. Metab. Eng. 12, 477–487 (2010).
112. Gernaey, K. V et al. Monitoring and control of microbioreactors: an expert opinion on
development needs. Biotechnol. J. 7, 1308–1314 (2012).
113. Schäpper, D., Alam, M. N. H. Z., Szita, N., Eliasson Lantz, A. & Gernaey, K. V. Application
of microbioreactors in fermentation process development: a review. Anal. Bioanal. Chem.
395, 679–695 (2009).
114. Weuster-Botz, D. et al. Methods and milliliter scale devices for high-throughput bioprocess
design. Bioprocess Biosyst. Eng. 28, 109–119 (2005).
115. Buchenauer, a et al. Micro-bioreactors for fed-batch fermentations with integrated online
monitoring and microfluidic devices. Biosens. Bioelectron. 24, 1411–1416 (2009).
116. Puskeiler, R., Kaufmann, K. & Weuster-Botz, D. Development, parallelization, and
automation of a gas-inducing milliliter-scale bioreactor for high-throughput bioprocess
design (HTBD). Biotechnol. Bioeng. 89, 512–523 (2005).
117. Gebhardt, G., Hortsch, R., Kaufmann, K., Arnold, M. & Weuster-Botz, D. A new
microfluidic concept for parallel operated milliliter-scale stirred tank bioreactors. Biotechnol.
Prog. 27, 684–690 (2011).
118. Xie, D. in Methods Mol. Biol. (Cheng, Q.) 834, (Springer New York, 2012).
119. Leeuwen, M. Van & Heijnen, J. J. Development Of a System for the On-Line Measurement
of Carbon Dioxide Production in Microbioreactors : Application to Aerobic Batch
Cultivations of Candida utilis. Am. Inst. Chem. Eng. (2009). doi:10.1021/bp.145
120. Edlich, A. et al. Microfluidic reactor for continuous cultivation of Saccharomyces cerevisiae.
Biotechnol. Prog. 26, 1259–1270 (2010).

Chapter 2b Population heterogeneity in bioprocesses studied at single cell level: industrial scale
simulated in the lab using basic and advanced setups 61
121. Bower, D. M., Lee, K. S., Ram, R. J. & Prather, K. L. J. Fed-batch microbioreactor platform
for scale down and analysis of a plasmid DNA production process. Biotechnol. Bioeng. 109,
1976–1986 (2012).
122. Fritzsch, F. S. O., Dusny, C., Frick, O. & Schmid, A. Single-Cell Analysis in Biotechnology,
Systems Biology, and Biocatalysis. Annu. Rev. Chem. Biomol. Eng. Vol 3 3, 129–155 (2012).
123. Dénervaud, N. et al. A chemostat array enables the spatio-temporal analysis of the yeast
proteome. Proc. Natl. Acad. Sci. U. S. A. 110, (2013).
124. Funke, M. et al. Bioprocess control in microscale: scalable fermentations in disposable and
user-friendly microfluidic systems. Microb. Cell Fact. 9, (2010).
125. Kensy, F., Engelbrecht, C. & Büchs, J. Scale-up from microtiter plate to laboratory
fermenter: evaluation by online monitoring techniques of growth and protein expression in
Escherichia coli and Hansenula polymorpha fermentations. Microb. Cell Fact. 8, (2009).
126. Kostov, Y., Harms, P., Randers-Eichhorn, L. & Rao, G. Low-cost microbioreactor for high-
throughput bioprocessing. Biotechnol. Bioeng. 72, 346–352 (2001).
127. Au, S. H., Shih, S. C. C. & Wheeler, A. R. Integrated microbioreactor for culture and
analysis of bacteria, algae and yeast. Biomed. Microdevices 13, 41–50 (2011).
128. Schäpper, D. et al. Topology optimized microbioreactors. Biotechnol. Bioeng. 108, 786–796
(2011).
129. Boccazzi, P. et al. Gene expression analysis of Escherichia coli grown in miniaturized
bioreactor platforms for high-throughput analysis of growth and genomic data. Appl.
Microbiol. Biotechnol. 68, 518–532 (2005).
130. Kortmann, H. et al. The Envirostat - a new bioreactor concept. Lab Chip 9, 576–585 (2009).
131. Kortmann, H., Blank, L. M. & Schmid, A. Single cell analysis reveals unexpected growth
phenotype of S. cerevisiae. Cytometry. A 75, 130–139 (2009).
132. Fritzsch, F. S. O. et al. Picoliter nDEP traps enable time-resolved contactless single bacterial
cell analysis in controlled microenvironments. Lab Chip 13, 397–408 (2013).
133. Dusny, C., Fritzsch, F. S. O., Rosenthal, K., Frick, O. & Schmid, A. quantitative physiology
with isolated single cells and micropopulations in controlled microenvironments employing a
picoliter bioreactor. Conf. Contrib. 1576–1578 (2012).
134. Jang, K. et al. Development of a microfluidic platform for single-cell secretion analysis using
a direct photoactive cell-attaching method. Anal. Sci. 27, 973–978 (2011).
135. Inoue, I., Wakamoto, Y., Moriguchi, H., Okano, K. & Yasuda, K. On-chip culture system for
observation of isolated individual cells. Lab Chip 1, 50–55 (2001).

Chapter 2b Population heterogeneity in bioprocesses studied at single cell level: industrial scale
simulated in the lab using basic and advanced setups 62
136. Groisman, A. et al. A microfluidic chemostat for experiments with bacterial and yeast cells.
Nat. Methods 2, 685–689 (2005).
137. Wakamoto, Y., Inoue, I., Moriguchi, H. & Yasuda, K. Analysis of single-cell differences by
use of an on-chip microculture system and optical trapping. Fresenius. J. Anal. Chem. 371,
276–281 (2001).
138. Elfwing, A., Lemarc, Y., Baranyi, J. & Ballagi, A. Observing Growth and Division of Large
Numbers of Individual Bacteria by Image Analysis. Appl. Environ. Microbiol. 70, 675–678
(2004).
139. Long, Z. et al. Microfluidic chemostat for measuring single cell dynamics in bacteria. Lab
Chip 13, 947–954 (2013).
140. Teodósio, J. S., Simões, M., Melo, L. F. & Mergulhão, F. J. Flow cell hydrodynamics and
their effects on E. coli biofilm formation under different nutrient conditions and turbulent
flow. Biofouling 27, 1–11 (2011).
141. Papagianni, M. Methodologies for Scale-down of Microbial Bioprocesses. J. Microb.
Biochem. Technol. 05, 1–7 (2011).
142. Papagianni, M., Mattey, M. & Kristiansen, B. Design of a tubular loop bioreactor for scale-
up and scale-down of fermentation processes. Biotechnol. Prog. 19, 1498–1504 (2003).
143. George, S., Larsson, G. & Enfors, S.-O. A scale-down two-compartment reactor with
controlled substrate oscillations: Metabolic response of Saccharomyces cerevisiae.
Bioprocess Eng. 9, 249–257 (1993).
144. Bylund, F., Guillard, F., Enfors, S.-O., Trägårdh, C. & Larsson, G. Scale down of
recombinant protein production: a comparative study of scaling performance. Bioprocess
Eng. 20, (1999).
145. Delvigne, F., Destain, J. & Thonart, P. Toward a stochastic formulation of microbial growth
in relation to bioreactor performances: case study of an E. coli fed-batch process. Biotechnol.
Prog. 22, 1114–1124 (2006).
146. Delvigne, F., Destain, J. & Thonart, P. A methodology for the design of scale-down
bioreactors by the use of mixing and circulation stochastic models. Biochem. Eng. J. 28,
256–268 (2006).
147. Delvigne, F., Lejeune, A., Destain, J. & Thonart, P. Stochastic Models To Study the Impact
of Mixing on a Fed-Batch Culture of Saccharomyces cere W isiae. Biotechnol. Prog. 259–
269 (2006).
148. Lejeune, A., Delvigne, F. & Thonart, P. Influence of bioreactor hydraulic characteristics on a
Saccharomyces cerevisiae fed-batch culture: hydrodynamic modelling and scale-down
investigations. J. Ind. Microbiol. Biotechnol. 37, 225–236 (2010).
Chapter 2b Population heterogeneity in bioprocesses studied at single cell level: industrial scale
simulated in the lab using basic and advanced setups 63
149. Delvigne, F., Boxus, M., Ingels, S. & Thonart, P. Bioreactor mixing efficiency modulates the
activity of a prpoS::GFP reporter gene in E. coli. Microb. Cell Fact. 8, (2009).
150. Han, S., Delvigne, F., Brognaux, A., Charbon, G. E. & Sørensen, S. J. Design of growth-
dependent biosensors based on destabilized GFP for the detection of physiological behavior
of Escherichia coli in heterogeneous bioreactors. Biotechnol. Prog. 29, 553–563 (2013).
151. Brognaux, A. et al. Direct and indirect use of GFP whole cell biosensors for the assessment
of bioprocess performances: design of milliliter scale-down bioreactors. Biotechnol. Prog.
29, 48–59 (2012).
152. Delvigne, F. et al. Green fluorescent protein (GFP) leakage from microbial biosensors
provides useful information for the evaluation of the scale-down effect. Biotechnol. J. 6,
968–978 (2011).
153. Junne, S., Klingner, A., Kabisch, J., Schweder, T. & Neubauer, P. A two-compartment
bioreactor system made of commercial parts for bioprocess scale-down studies: impact of
oscillations on Bacillus subtilis fed-batch cultivations. Biotechnol. J. 6, 1009–1017 (2011).
154. Kar, T., Destain, J., Thonart, P. & Delvigne, F. Scale-down assessment of the sensitivity of
Yarrowia lipolytica to oxygen transfer and foam management in bioreactors: investigation of
the underlying physiological mechanisms. J. Ind. Microbiol. Biotechnol. 39, 337–346 (2012).
155. Amanullah, a, McFarlane, C. M., Emery, a N. & Nienow, a W. Scale-down model to
simulate spatial pH variations in large-scale bioreactors. Biotechnol. Bioeng. 73, 390–399
(2001).
156. Sweere, A. P. J., Matla, Y. A., Zandvliet, J., Luyben, C. A. M. & Kossen, N. W. F. Applied
Microbiology Biotechnology. Appl. Microbiol. Biotechnol. 28, 109–115 (1988).
157. Larsson, G. & Enfors, S. Influence of oxygen starvation on the respiratory capacity of
Penicillium chrysogenum. Appl. Microbiol. Biotechnol. 21, 228–233 (1985).
158. Larsson, G. & Enfors, S.-O. Studies of insuffiecient mixing in bioreactors: Effects of limiting
oxygen concentrations and short term oxygen starvation on Penicillium chrysogenum.
Bioprocess Eng. 3, 123–127 (1988).
159. Pedreira, C. E., Costa, E. S., Lecrevisse, Q., van Dongen, J. J. M. & Orfao, A. Overview of
clinical flow cytometry data analysis: recent advances and future challenges. Trends
Biotechnol. 31, 415–425 (2013).
160. Koutinas, M., Kiparissides, A., Pistikopoulos, E. N. & Mantalaris, A. Bioprocess systems
engineering : transferring traditional process engineering principles to industrial
biotechnology. Comput. Struct. biotechnoloy 3, (2012).
161. Gao, T., Wong, Y., Ng, C. & Ho, K. L-lactic acid production by Bacillus subtilis MUR1.
Bioresour. Technol. 121, 105–110 (2012).

Chapter 2b Population heterogeneity in bioprocesses studied at single cell level: industrial scale
simulated in the lab using basic and advanced setups 64
162. Kim, S.-J., Seo, S.-O., Jin, Y.-S. & Seo, J.-H. Production of 2,3-butanediol by engineered
Saccharomyces cerevisiae. Bioresour. Technol. 146, 274–281 (2013).
163. Szybalski, W. & Bryson, V. Genetic studies on microbial cross resistance to toxic agents. I.
Cross resistance of Escherichia coli to fifteen antibiotics. J. Bacteriol. 64, 489–499 (1952).
164. Fazekas de St Groth, S. Automated production of monoclonal antibodies in a cytostat.
Methods Enzymol. 121, 360–375 (1986).

Chapter 3– Experimental design 65
3. Chapter
Experimental design
3.1 Experimental Design/ Lab scale simulation of large-scale fermentation
In the scope of this thesis, different aspects of large scale fermentation conditions were
experimentally simulated in lab-scale to investigate effects of environmental conditions on
population heterogeneity using different process types (batch, fed-batch, continuous cultivation).
Additionally a new setup for two compartment chemostat culture was developed (referred to as
scale down reactor). Slightly different procedure protocols were applied depending on the particular
study and they are shortly introduced in the following sections.
3.1.1 S. cerevisiae cultivations
S. cerevisiae cultivations were performed in batch mode (figure 1 setup I, used in chapters 4 and 5),
as conventional chemostat followed by glucose perturbation (figure 1 setup II, used in chapters 4, 6
and 8) as well as continuous cultivation in a two compartment reactor (figure 1 setup III, used in
chapter 8). For continuous cultivations in scale down reactors (two compartment chemostat),
additionally a fed-batch phase was introduced to achieve a higher biomass before the switch to
chemostat for cultivations with high glucose concentration in the feed. Common to all cultivations
was the growth medium used, which in the case of S. cerevisiae was a defined mineral medium
after Verduyn et al. (1992)1 with glucose as carbon source. Furthermore, irrespectively of the
process type the preculture procedure was the same for all performed experiments. The strain was
first streaked out on a yeast nitrogen base plate and grown for at least two days. Thereafter, a single
colony was used to inoculate a shake flask preculture which was grown until mid-exponential phase
and subsequently used to inoculate the bioreactor (figure 1).

Chapter 3– Experimental design 66
Figure 1 - Experimental setup summary: Different experimental setups used for S. cerevisiae
cultivations.
For S. cerevisiae experiments mainly the growth reporter strain FE4402 was used, which was first
characterized in stirred tank batch cultivations (figure 1 setup I, used in chapter 4) under the growth
conditions which were defined as standard conditions (pH 5; aeration: 1 v/vm; stirring: 600 rpm;
5g/L glucose as carbon source) in the frame of this thesis. If not otherwise noted, cultivations have
been performed using standard conditions (see table 1). Later on, to evaluate the influence of
different parameters on population heterogeneity, batch experiments were performed in stirred tank
reactors under different conditions (see table 1, figure 1 setup I, used in chapter 5).
Furthermore, continuous cultivations (figure 1, setup II) evaluating steady state at different dilution
rates were executed. In this way the dependency of the GFP fluorescence expression on cell growth
of the reporter strain FE440 could be investigated (chapter 4 and 6). Thereafter the steady state
cultures were perturbed with glucose (chapter 6) to simulate the occurrence of a sudden rise in
carbon concentration which the cells might experience in large scale fed-batch and continuous
cultivation due to non-ideal mixing, especially close to the feed point3.
For the simulation of static zones and the further investigation of substrate gradients a new type of
scale down reactor setup for two-compartment continuous cultivation consisting of two
interconnected stirred tank reactors (figure 1 setup III) was developed in the course of the thesis.
For a current status on scale down reactor studies, chapter 2 should be consulted. Hereby, the
feeding zone of the continuous process was represented by a 0.5 L reactor with low oxygen and

Chapter 3– Experimental design 67
high glucose concentration whereas the rest of the reactor with high oxygen and low glucose
concentration was represented by a 5 L reactor (working volume: 3 L). Both reactors were
connected to each other via a recirculation loop. The experiments in the system were run with three
different dilution rates applying different feed concentrations and recirculation between the two
reactors following a factorial design plan (for details, see chapter 8). Besides the growth reporter
strain FE440, also the ethanol reporter strain Sc-PCK1-B was used in some of the experiments
(chapter 8). Because the feed concentration in continuous mode was higher than for the standard
conditions used during the batch, a fed-batch phase to achieve an increase in biomass was
introduced applying a 300 g/L glucose feed to avoid later washout of the biomass or a delay in
reaching steady state. As a comparison, conventional chemostats were performed under the same
conditions.
3.1.2 E. coli cultivation
Cultivations with E. coli were either performed in batch (figure 2 setup I, chapter 7) or
continuous mode (figure 2 setup II, chapter 6). Similar to S. cerevisiae cultivations a defined
mineral growth medium was applied for all performed experiments4. However both glucose
(chapter 6 and 7) and acetate (chapter 7) were used as carbon source. Standard conditions were
defined as pH 5, aeration: 1 v/vm, stirring: 1000 rpm and 5 g/L glucose as carbon source.
Figure 2 - Experimental setup summary: Different experimental setups used for E. coli
cultivations
Also the preculture procedure was common to all E. coli experiments. The strain was streaked out
on a Luria Bertani (LB) plate, incubated for at least two days and then inoculated for a two-step
preculture procedure. First, an overnight culture in LB medium was prepared, which in the second

Chapter 3– Experimental design 68
step was used to inoculate a dilution series with 10-fold steps. Subsequently, the optical density
from the dilution series grown overnight was measured and the dilution with an optical density
between 0.4 and 0.6 was used to inoculate the bioreactor.
To compare the influence of different carbon sources on single cell physiology and heterogeneity in
metabolic activity, respiration and viability batch experiments with acetate respectively glucose
were performed under standard conditions (figure 2 setup I, chapter 7). For both types of batch
experiments the rrnB reporter strain was used.
Furthermore, continuous cultivations (figure 2 setup II) under standard conditions evaluating steady
state followed by glucose perturbation at three different dilution rates were performed using the fis
promoter reporter strain (for details, see chapter 6). This study was conducted in parallel with the
corresponding S. cerevisiae investigation and steady state experiments and also served the
investigation of substrate gradients in large scale fermentation.
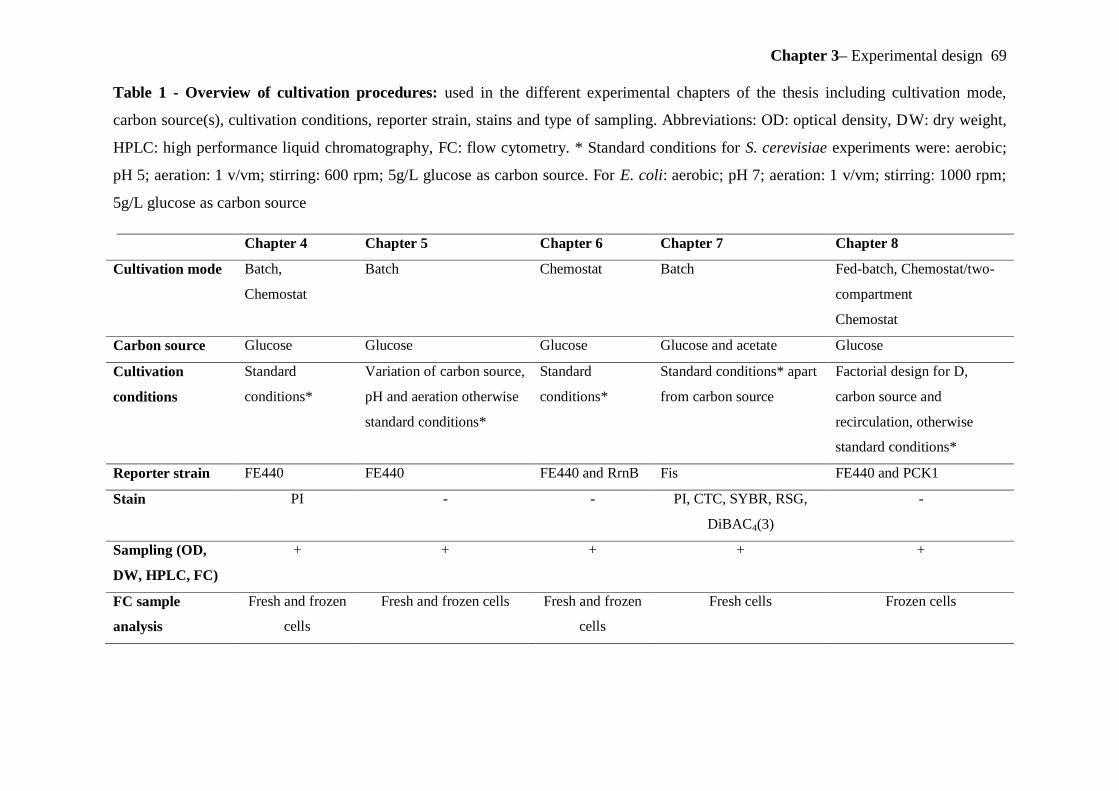
Chapter 3– Experimental design 69
Table 1 - Overview of cultivation procedures: used in the different experimental chapters of the thesis including cultivation mode,
carbon source(s), cultivation conditions, reporter strain, stains and type of sampling. Abbreviations: OD: optical density, DW: dry weight,
HPLC: high performance liquid chromatography, FC: flow cytometry. * Standard conditions for S. cerevisiae experiments were: aerobic;
pH 5; aeration: 1 v/vm; stirring: 600 rpm; 5g/L glucose as carbon source. For E. coli: aerobic; pH 7; aeration: 1 v/vm; stirring: 1000 rpm;
5g/L glucose as carbon source
Chapter 4 Chapter 5 Chapter 6 Chapter 7 Chapter 8
Cultivation mode Batch,
Chemostat
Batch Chemostat Batch Fed-batch, Chemostat/two-
compartment
Chemostat
Carbon source Glucose Glucose Glucose Glucose and acetate Glucose
Cultivation
conditions
Standard
conditions*
Variation of carbon source,
pH and aeration otherwise
standard conditions*
Standard
conditions*
Standard conditions* apart
from carbon source
Factorial design for D,
carbon source and
recirculation, otherwise
standard conditions*
Reporter strain FE440 FE440 FE440 and RrnB Fis FE440 and PCK1
Stain PI - - PI, CTC, SYBR, RSG,
DiBAC4(3)
-
Sampling (OD,
DW, HPLC, FC)
+ + + + +
FC sample
analysis
Fresh and frozen
cells
Fresh and frozen cells Fresh and frozen
cells
Fresh cells Frozen cells

Chapter 3– Experimental design 70
3.1.3 Parameters analysed for the study of general physiology and single cell properties
As mentioned earlier, in my studies both traditional and advanced methods for monitoring
physiology and population behaviour in the model bioprocesses were applied. Sampling procedures
were adjusted to the particular process type and the organism used. Common to all performed
experiments was the on-line measurement of the off-gas composition including oxygen, carbon
dioxide and ethanol via a mass spectrometer as well as on-line recording of process parameters
including dissolved oxygen, pH, stirrer speed and temperature (figure 3). Moreover, the at-line
sampling procedure included sampling for optical density (OD600), dry weight (DW) and HPLC for
all studies (figure 3 and table 1). Hereby samples for OD600 and DW were analysed directly,
whereas samples for HPLC analysis were filtered and frozen in -20°C until analysis. HPLC samples
of E. coli and S. cerevisiae cultivations revealed the concentrations of substrate (glucose or acetate)
as well as of the major metabolites produced (acetate, pyruvate, lactate, glycerol, ethanol and
formate).
Flow cytometry (FC) samples were either kept on ice or at room temperature (referred to as fresh
cells) (chapter 4, 5, 6 and 7) until analysis or frozen in -80°C (referred to as frozen cells) with
subsequent thawing on ice (Chapter 4, 5, 6 and 8) and storage in buffer with different pH (chapter
6). Hereby, the procedure differed depending on the organism and experimental setup (table 1 and
particular chapters). Afterwards the flow cytometry samples were either analysed directly to
measure Forward scatter, Side scatter as well as GFP fluorescence (all chapters) of the reporter or
for two experimental studies also stained for different cell properties (table 1). The stains applied
were 5-cyano-2,3-ditolyltetrazolium chloride (CTC), SYBR Green (SYBR), Propidium Iodide (PI),
Bis-(1,3-dibutylbarbituric acid) trimethine oxonol (DiBAC4(3)) and Redox Sensor Green (RSG)
(see chapters 4 and 7 for further details).

Chapter 3– Experimental design 71
Figure 3 – Sampling from the bioreactor: At-line, On-line and Off-line collected data and
samples from cultivation in a bioreactor. Depending on the setup not all types of data respectively
samples were collected (see corresponding chapters).
Also the sampling frequency for at-line and off-line analysis was dependent on the particular
process type. For batch cultivation sampling following the different growth phases (lag-,
exponential growth on glucose and ethanol respectively acetate, diauxic shift and stationary phase)
was done every 1-1,5h (chapter 4 and 7) or sampling intervals were timed to record at least three
data points in each growth phase (chapter 5). During continuous cultivation samples were taken
over at least three residence times to confirm steady state whereas during glucose perturbation
frequent sampling with time intervals depending on the dilution rate was performed (details see
chapter 4 and 6). In chapter 8 continuous cultivations (ordinary chemostats and in scale down
reactors) were performed and the cultivations followed starting from the batch and fed-batch phase
over the switch to chemostat (0. residence times) until 9 residence times. Sampling was done once
every residence time for the chemostat phase and every 2 hours during the exponential growth in
batch and fed-batch phase.

Chapter 3– Experimental design 72
3.2 References
1. Verduyn, C., Postma, E., Scheffers, W. a & Van Dijken, J. P. Effect of benzoic
acid on metabolic fluxes in yeasts: a continuous-culture study on the regulation
of respiration and alcoholic fermentation. Yeast 8, 501–517 (1992).
2. Carlquist, M. et al. Physiological heterogeneities in microbial populations and
implications for physical stress tolerance. Microb. Cell Fact. 11, (2012).
3. Enfors, S. O. et al. Physiological responses to mixing in large scale bioreactors.
J. Biotechnol. 85, 175–85 (2001).
4. Xu, B., Jahic, M. & Blomsten, G. Glucose over flow metabolism and mixed-
acid fermentation in aerobic large-scale fed-batch processes with Escherichia
coli. Appl. Microbiol. Biotechnol. 51, 564–571 (1999).

Chapter 4– Physiological heterogeneities in microbial populations and implications for physical
stress tolerance 73
4. Chapter
Physiological heterogeneities in microbial
populations and implications for physical stress
tolerance
Magnus Carlquist3, Rita Lencastre Fernandes
2, Søren Helmark
5, Anna-Lena Heins
1, Luisa Lundin
4,
Søren J Sørensen4, Krist V Gernaey
2 and Anna Eliasson Lantz
1*
1 Department of Systems Biology, Technical University of Denmark, 2800 Kongens Lyngby,
Denmark
2 Department of Chemical Engineering, Technical University of Denmark, 2800 Kongens Lyngby,
Denmark
3 Department of Chemistry, Division of Applied Microbiology, Lund University, 221 00 Lund,
Sweden
4 Molecular Microbial Ecology Group, Department of Biology, University of Copenhagen, 1370K
Copenhagen, Denmark
5 Fermenco ApS, 2800 Kongens Lyngby, Denmark
Written as journal paper
Status: Published in microbial cell factories since 16. July 2012

RESEARCH Open Access
Physiological heterogeneities in microbialpopulations and implications for physical stresstoleranceMagnus Carlquist1,2, Rita Lencastre Fernandes3, Søren Helmark4, Anna-Lena Heins1, Luisa Lundin5,Søren J Sørensen5, Krist V Gernaey3 and Anna Eliasson Lantz1*
Abstract
Background: Traditionally average values of the whole population are considered when analysing microbial cellcultivations. However, a typical microbial population in a bioreactor is heterogeneous in most phenotypesmeasurable at a single-cell level. There are indications that such heterogeneity may be unfavourable on the onehand (reduces yields and productivities), but also beneficial on the other hand (facilitates quick adaptation to newconditions - i.e. increases the robustness of the fermentation process). Understanding and control of microbialpopulation heterogeneity is thus of major importance for improving microbial cell factory processes.
Results: In this work, a dual reporter system was developed and applied to map growth and cell fitnessheterogeneities within budding yeast populations during aerobic cultivation in well-mixed bioreactors. The reporterstrain, which was based on the expression of green fluorescent protein (GFP) under the control of the ribosomalprotein RPL22a promoter, made it possible to distinguish cell growth phases by the level of fluorescence intensity.Furthermore, by exploiting the strong correlation of intracellular GFP level and cell membrane integrity it waspossible to distinguish subpopulations with high and low cell membrane robustness and hence ability to withstandfreeze-thaw stress. A strong inverse correlation between growth and cell membrane robustness was observed,which further supports the hypothesis that cellular resources are limited and need to be distributed as a trade-offbetween two functions: growth and robustness. In addition, the trade-off was shown to vary within the population,and the occurrence of two distinct subpopulations shifting between these two antagonistic modes of celloperation could be distinguished.
Conclusions: The reporter strain enabled mapping of population heterogeneities in growth and cell membranerobustness towards freeze-thaw stress at different phases of cell cultivation. The described reporter system is avaluable tool for understanding the effect of environmental conditions on population heterogeneity of microbialcells and thereby to understand cell responses during industrial process-like conditions. It may be applied toidentify more robust subpopulations, and for developing novel strategies for strain improvement and processdesign for more effective bioprocessing.
Keywords: Population heterogeneity, Cell fitness, Cell membrane robustness, Flow cytometry, Budding yeast,Reporter strain, Cell factory optimisation
* Correspondence: [email protected] for Microbial Biotechnology, Department of Systems Biology,Technical University of Denmark, DK-2800 Kgs. Lyngby, DenmarkFull list of author information is available at the end of the article
© 2012 Carlquist et al.; licensee BioMed Central Ltd. This is an Open Access article distributed under the terms of the CreativeCommons Attribution License (http://creativecommons.org/licenses/by/2.0), which permits unrestricted use, distribution, andreproduction in any medium, provided the original work is properly cited.
Carlquist et al. Microbial Cell Factories 2012, 11:94http://www.microbialcellfactories.com/content/11/1/94

BackgroundTraditionally, a microbial population has been consid-ered homogeneous in optimisation studies of fermenta-tion processes. Bioprocess measurements are typicallyobtained as an “average” of the whole cell population,thereby neglecting the effects and phenomena at the in-dividual cell level. However, research has shown that atypical microbial population in a bioreactor is heteroge-neous in most phenotypes measurable at a single-celllevel [1-3]. There are indications that such heterogeneitymay be unfavourable on the one hand (reduces yields andproductivities), but also beneficial on the other hand (facil-itates quick adaptation to new conditions - i.e. increasesthe robustness of the fermentation process) [4,5]. There-fore, understanding and control of microbial populationheterogeneity is of major importance for improving bio-logical production processes, and this has led to anincreased interest from industry for methods to monitorpopulation heterogeneity [6,7].Phenotypic heterogeneity occurs even if the micro-
environment surrounding the cells is constant, and it isdriven by factors such as differences in cell cycle andcell ageing. Furthermore, stochastic gene transcription,translation and post-translational modifications have animpact [2]. In industrial scale fermentation processes,phenotypic heterogeneity is further amplified as a result ofdeficient mixing, which leads to zones with diverse envir-onmental conditions [8]. The microbial cells, thus, experi-ence sudden changes in the environmental conditions asthey circulate from one zone to the other. Thesechanges may pose different types of stress (e.g. oxida-tive, temperature, pH) on the cells and affect theirmetabolism and fitness [4,8,9]. The heterogeneous envir-onment in large-scale fermenters may lead to repeatedcycles of production/re-assimilation of overflow metabo-lites and repeated induction/relaxation of stress responsesresulting in reduced biomass yield and productivity [4,10].Stress tolerance has previously been shown to differ
depending on the physiological state of the cell, i.e.which growth phase the cells were in prior to exposureto the stress factor. For example, yeast cells in respira-tory ethanol growth phase have been found to be moretolerant to freeze-thaw stress than cells in respiro-fermentative glucose growth phase during aerobic batchcultivation [11]. This may be due to differences in cellmembrane robustness, which is a key phenotypic traitthat determines how well the cell can cope with physicalstresses (such as heat, mechanical, osmotic or freezing)[12]. Many cellular stress responses are unique for thespecific stress, however, there is also a global inductionof cell responses leading to cross-tolerance towards non-related stresses; a phenomenon known as the environ-mental stress response (ESR) [13]. In a recent study byZakrezewska et al. [14], tolerance to different stresses
has been shown to be inversely correlated to cell growthrate, i.e. cells growing at a slow rate display a higher resist-ance to a number of stresses (e.g. heat, acid, oxidative)irrespectively of the cause for the reduced growth rate.The inverse correlation to growth rate was speculated tobe related to the fact that the pool of cellular resources(energy, material) is limited and needs to be distributed asa trade-off between the two cellular functions growth andsurvival. In a population, the individuals differ in physio-logical state and are therefore equipped differently to copewith subsequent exposure to harsh conditions [15] thatmay occur in large-scale fermentation processes or in suc-ceeding bioprocessing operations.The aim of the present work was to map physiological
state and cell robustness distributions within a microbialpopulation, using budding yeast Saccharomyces cerevisiaeas model organism. S. cerevisiae has an outstanding im-portance in industrial bioprocesses. It has been used inbaking and alcoholic brewing for centuries, but is alsoused in a wide range of newer biotechnology productionapplications, such as production of heterologous proteins(e.g. insulin and different vaccines) and commodity chemi-cals. Most of the pharmaceutical proteins produced by mi-crobial eukaryotic cells so far approved by the FDA orEMEA are almost exclusively based on production by S.cerevisiae [16].To be able to shed light into whether population het-
erogeneity could be a consequence of the trade-off incell economy for growth and robustness, a dual reportersystem was developed that allowed for studying theprevalence of subpopulations which are differently pre-pared for changes in environmental conditions. The dualreporter system was based on:
(A) the expression of green fluorescent protein (GFP)[17,18] under control of the ribosomal proteinpromoter RPL22A, thereby making cellular GFPlevel proportional to growth;
(B) loss of GFP signal in cells with permeabilisedplasma membranes after exposure to physical stress.
The dual nature of the reporter strain was validated bystaining with propidium iodide (PI), which clearly demon-strated that cells with permeabilised plasma membranelost GFP signal and were PI positive, while cells withremained level of GFP were PI negative.As a case study, the relationship between physiological
heterogeneity of a microbial population and the prerequisiteof the population to tolerate subsequent freeze-thaw stress(as a model of physical stress) was characterised on a singlecell level. It was found that subpopulations with differentlevel of cell membrane robustness and tolerance towardsphysical stress co-existed in a population, and that the dis-tribution was changing dynamically between different
Carlquist et al. Microbial Cell Factories 2012, 11:94 Page 2 of 13http://www.microbialcellfactories.com/content/11/1/94

phases of cultivation. The results have implications for bio-logical processing where intact cell membranes are desir-able, for example in pharmaceutical protein production. Inaddition, the presented methodology more generally pro-vides an additional dimension in optimisation of microbialcell factories.
Results and discussionPopulation dynamics during batch cultivationIn order to capture the dynamic growth responses in apopulation during the different growth phases of batchcultivation, a reporter strain based on the expression ofGFP under the control of the promoter for the riboso-mal protein gene RPL22a was used. The RPL22a pro-moter was chosen based on that ribosomal protein genetranscription has previously been found to be linearlycorrelated to growth rate, as determined by transcrip-tome analysis of cells grown in continuous cultivationmode under different limiting conditions [19-21]. Fur-thermore, ribosomal protein synthesis is believed to beregulated at the transcription level [22], which makespromoters for ribosomal proteins the ideal choice forconstruction of growth reporter strains.To investigate the behaviour of the growth reporter
strain during different growth phases, batch cultivationsin well-controlled stirred tank reactors were performedand the physiology was monitored both on the wholepopulation by standard methods and on a single-celllevel by flow cytometry (see Materials and Methods).The reporter strain exhibited expected growth behaviourin defined mineral media, i.e. four distinct growth phaseswere observed. Growth first occurred on glucose, whichwas exhausted after 19 hours (Figure 1). Cells thenunderwent a diauxic shift and growth occurred on etha-nol until stationary phase was reached approximatelyafter 35–40 hours. The growth rate and biomass yield ofthe reporter strain did not differ from the control strainthat did not express GFP, hence demonstrating that ex-pression of GFP was not a burden to the cell (data notshown).The mean GFP level defined as mean cellular fluores-
cence intensity measured by flow cytometry was initiallyquite stable around ca. 215 channel number units duringgrowth on glucose (Figure 1). As the cells entered dia-uxic shift, the fluorescence decreased with approximately30 channel number units in 2 hours. The turn-over ofintracellular GFP is a result of the sum of gene tran-scription, gene translation as well as mRNA transcriptdegradation and protein degradation. Thus, the relativelyrapid decrease in GFP level upon glucose depletionwhich coincides with a momentarily detainment of cellproliferation rate during the diauxic shift, demonstratedthat the RPL22a promoter activity and GFP synthesiswere rapidly down-regulated during this growth phase.
The half-life of the GFP version used in the presentstudy has previously been reported to be approximately7 hours [23], which is coherent with the fluorescence de-crease observed upon glucose depletion (approximately15% decrease in 2 hours, Figure 1). Besides protein deg-radation, the decrease in GFP level may also to some ex-tent be ascribed to dilution by cell division [24]. Afterthe diauxic shift, the mean fluorescence continued todecrease, although at a lower rate than upon glucose de-pletion, which indicates that the RPL22a promoter activ-ity and GFP synthesis were re-initiated to some extentduring exponential growth on ethanol until the carbonsource was depleted and stationary phase was reached.The mean fluorescence in stationary phase (ca. 70 chan-nel number units) remained ca 10 times higher for thereporter strain compared to the auto fluorescence of thecontrol strain.The differences in GFP level at different growth phases
confirmed that the growth reporter could be used to dis-tinguish cells in different propagation modes, i.e. distin-guish cells growing on glucose from cells growing onethanol or in stationary phase. However, whether thelowered GFP level during growth on ethanol is a resultof the lower growth rate and that the regulation of theRPL22a promoter is a part of the ‘universal’ growth rateresponse (GRR) as defined by Slavov and Botstein (2011)[25], or if the regulation of RPL22a is specific for thecarbon source or other extrinsic factors is not clear. Inthe study performed by Slavov and Botstein (2011),RPL22a was found not to be a part of the ‘universal’GRR, i.e. the transcription of RPL22a was strongly up-regulated at higher growth rates on glucose and slightlydown-regulated at higher growth rates on ethanol [26].It is therefore likely that the decreased level of GFP afterthe diauxic shift (Figure 1) is not strictly due to thelower growth rate per se, but also a response to thechange in carbon source and the change from respiro-fermentative to respiratory metabolism. Another supportfor the interpretation that the regulation of the RPL22apromoter is not exclusively related to the growth rate isthe observation that the GFP level decreased steadilyduring growth on ethanol despite the fact that thegrowth rate did not decrease until late exponentialphase. On the other hand, the gradual decrease in GFPlevel during ethanol growth may additionally be due todilution by cell division [24]. Albeit that other aspectsmight have influence on the regulation of the RPL22apromoter in addition to the growth rate, the reporterstrain can be used to distinguish cells at different growthconditions (e.g. growth on glucose, growth on ethanol,no growth) which may be useful during optimisation oflarge-scale bioprocess conditions. Effects due to differentstirring and feeding can be evaluated by following the re-sponse by the reporter system thereby used to guide
Carlquist et al. Microbial Cell Factories 2012, 11:94 Page 3 of 13http://www.microbialcellfactories.com/content/11/1/94

process development. The reporter system may enableidentification of cell growth physiology at single-celllevel from different zones of a large-scale reactor, for ex-ample if cells are being trapped in ethanol (or alterna-tively glucose) rich zones for longer time periods.To enumerate whether cell to cell variations in RPL22a
promoter activity could be ascribed to more than differ-ences in cell size, a percentile analysis similar to the methodpreviously reported by Sumner et al. [27] was performed.For such an analysis, the events measured in the flow cyto-metry for each sample were first categorised in 10%-percen-tiles based on the forward scatter (FSC) signal; then foreach percentile the mean FSC and GFP level were calcu-lated and plotted against each other (Figure 2; see Add-itional file 1: Figure S1-2 for further information on howthe percentile analysis was made). In Figure 2, the differentcoloured lines correspond to the sample time points, andeach marker indicates the mean FSC and GFP for cellsbelonging to a given FSC percentile interval (e.g. the meanFSC and GFP of the cells presenting a FSC between the10th and 20th percentile, for each time point, is indicatedwith an open circle). From the percentile analysis, a clearcorrelation between GFP level and FSC was observed for alltime points, with larger cells in general having a higherGFP level (Figure 2). However, cell size was not the only de-terminant of GFP level as there was a discrepancy from thelinearity, especially at higher FSC percentiles. The differencein GFP level that cannot be explained by cell size alone maybe an artefact from the flow cytometry analysis (particularly
at the 90-100% percentile), meaning that the deviation maysimply be explained by the presence of cell aggregates,which are read as a single event thereby giving a false read-ing of the GFP level. On the other hand, it may also well in-dicate non-stochasticity and the presence of subpopulationswith different regulation of RPL22a promoter activity. In re-lation to this, it could be speculated that larger cells withhigher fluorescence propagate at a higher rate, at least dur-ing glucose assimilation, which would be in agreement withearlier observations that RPL22a transcription in glucose-limited chemostats correlated to growth rate [19,25]. More-over, differences in cell cycle phase may contribute to thenon-linear GFP level-cell size correlation (in general highFSC percentiles may contain a higher fraction of buddingcells, which are larger than non-budding cells). In thiswork the budding index (BI), i.e. the fraction of bud-ding cells in the population, was not measured, how-ever it has been reported in the literature that forcultures in exponential growth on glucose the BI isapproximately 70-80% [28,29]. This implies that bud-ding cells would most likely be present also in theFSC percentile intervals as low as 20–30 or 30-40%and that influence by cell cycle therefore is not likelyto have a large influence on the correlation discrepan-cies. The results reported here are however not con-clusive, and additional analysis is needed to clearlystate whether two cells of approximately the sameFSC would present different GFP level due to the factthat one is budding and the other is not.
Figure 1 Mean fluorescence, biomass formation, substrate utilisation and product formation during aerobic batch cultivation of the S.cerevisiae reporter strain in defined mineral media. Symbols: Mean GFP fluorescence (snowflakes); OD600 (open diamonds); Glucose (opencircles); Acetate (open triangle pointing upwards); Ethanol (open squares); Glycerol (open triangles pointing downwards). The vertical line marks thetime point glucose depletion was observed.
Carlquist et al. Microbial Cell Factories 2012, 11:94 Page 4 of 13http://www.microbialcellfactories.com/content/11/1/94

Another circumstance highlighted from the percentileanalysis was that the slope of the GFP level-cell size cor-relation differed depending on growth phase, with alower slope during ethanol assimilation than before thediauxic shift (Figure 2). At the same time, a trend to-wards smaller cells throughout the cultivation could beobserved. The decreased GFP level-cell size slope illus-trates a decrease in growth heterogeneity, which may bea consequence of the fact that the whole populationrelocates resources to get prepared for survival ratherthan propagation. In general, the GFP level decreased toa relatively higher extent in larger cells than smallercells, which may be interpreted as the larger cells under-went a larger physiological change (both growth and cellsize decreased) as a response to the shift in environmen-tal conditions.
Cell to cell variation in cell membrane robustnessAs a case study for determining heterogeneities in cellmembrane robustness and cellular capacity to withstandphysical stress, the population was exposed to freeze-thaw stress and the degree of cell membrane permeabil-isation was quantified by flow cytometry after cellstaining with propidium iodide (PI). It has previouslybeen shown that there is a connection between toleranceto freeze-thaw stress and other physical stresses (H2O2
oxidative stress; calcofluor white as cell wall-challengingreagent) [30]. Therefore, cells displaying high toleranceto freeze-thaw stress are also likely to withstand other
seemingly unrelated types of specific stresses since theresponse to most stress factors relies at least partly onthe ESR [13]. Thus, mapping of subpopulations with ele-vated capacity to freeze-thaw stress is of high relevancefor reaching more robust bioprocesses where multiplefactors pose pressure on cell membrane integrity.Prior to the freeze-thaw stress, over 95% of the cells
were PI negative demonstrating an undamaged cellmembrane phenotype (Figure 3). However, after freeze-thaw stress a significant amount of cells had permeabi-lised cell membranes and were thus stained with PI. Thedegree of cell membrane permeabilisation varied withinthe population and could be divided in two categories:PI negative (PI fluorescence intensity <=10), and PI posi-tive (PI fluorescence intensity >10). Cell membrane ro-bustness was clearly linked to the specific growth phasethe cells were in prior to applying freeze-thaw stress; ingeneral cells growing on glucose were more sensitivethan cells growing on ethanol, and cells in stationaryphase. The fraction of PI negative cells increased frombelow 20% during the exponential glucose growth phaseto around 80% in stationary phase and a correspondingdecrease of the PI positive subpopulation in the sametime interval was seen. This is in accordance with a pre-viously published study made on the whole populationlevel, where viability after freeze-thaw stress was measuredon cells in different growth phases [11]. Furthermore, it isin line with the hypothesis that there is an inverse correl-ation between growth and robustness as has been
Figure 2 Mean GFP level as a function of mean FSC for each percentile during aerobic batch cultivation. For each time point there is aline (in a different colour) with markers for each percentile. Details of the percentile analysis can be found in the methods section and theAdditional file 1: Figure S1-2.
Carlquist et al. Microbial Cell Factories 2012, 11:94 Page 5 of 13http://www.microbialcellfactories.com/content/11/1/94

previously suggested [25]. The trade-off between growthand robustness can be further substantiated by the inversecorrelation between the RPL22a promoter activity prior tostress and freeze-thaw stress tolerance (Figure 4). How-ever, the rapid increase in cell membrane robustness afterthe diauxic shift may also be a consequence of the ESR,which previously has been shown to be activated duringdiauxia and increase tolerance to multiple stresses [13].Level of cell membrane robustness was also found to
be correlated to cellular GFP level after exposure tofreeze-thaw stress. Permeabilised cells significantly lostGFP fluorescence, while the PI negative subpopulationwith intact cell membrane kept similar fluorescence in-tensity to untreated cells (Figure 5). The loss in GFPfluorescence in cells with permeabilised cell membranemay be due to leakage of intracellular GFP [31] and itmay additionally be due to a decrease in intracellular pHwhich quenches the fluorescence signal [32]. Regardlessof the specific cause, the measurable loss of GFP signalmeans that PI staining becomes redundant and that cellmembrane robustness can be estimated by GFP levelalone. In fact, this demonstrates that the reporter straincan be used as a dual reporter system for mapping het-erogeneities in both growth (GFP level prior to stressexposure) and cell membrane robustness (distribution ofsubpopulations with high/low GFP level after stressexposure). The redundancy of PI was clear for the ex-perimental set-up used in this study, and it may be use-ful for other investigations of cell membrane robustness
on a single cell level; however, further experiments areneeded to confirm that the dual nature of the reportersystem also is applicable for other cases of physicalstress.
Changes in cell membrane robustness by glucoseperturbationTo study how heterogeneity in cell membrane robustnessof the population is influenced by a dynamic environmentoften seen in larger scale cultivations, an experiment mim-icking glucose gradients was performed. Cells were grownin continuous mode with D=0.2 h-1 (which is below thedilution rate where overflow metabolism occurs [33,34])and subjected to a glucose pulse. Cells were harvested atdifferent time points during the pulse and subsequentlyexposed to freeze-thaw stress. As demonstrated above, theGFP signal could directly be used as a measure of cellmembrane robustness and no additional staining was ap-plied for these experiments. During steady state, the meanfluorescence was constant and the cells displayed two sep-arate subpopulations with varying degree of cell mem-brane robustness (ca 80-85% of subpopulation P1, highmean fluorescence, intact cell membrane; ca 15-20% ofsubpopulation P2, low mean fluorescence, permeabilisedcell membrane) (Figures 6, 7). The degree of cells withpermeabilised cell membrane was thus significantly lowerthan for a population during batch growth on glucose,which is consistent with the inverse relationship betweengrowth rate and cell robustness. Furthermore, the steady
Figure 3 Distribution of PI-stained cells prior to and after freeze-thaw stress exposure plotted against point of harvest during aerobicbatch cultivation. Symbols: PI negative cells prior to freeze-thaw stress (circles), PI negative cells (triangles) and PI positive cells (squares) afterfreeze-thaw stress.
Carlquist et al. Microbial Cell Factories 2012, 11:94 Page 6 of 13http://www.microbialcellfactories.com/content/11/1/94

Figure 5 Effect of freeze-thaw stress on GFP signal. Mean GFP level of the entire population prior to freeze-thaw stress (circles) and mean GFPlevel of PI negative cells (triangles) and PI positive cells (squares) after freeze-thaw stress plotted against point of harvest during aerobic batchcultivation. The GFP signal was significantly decreased in cells that have been permeabilised by the stress exposure, hence making PI stainingredundant to estimate number of cells with intact membranes.
Figure 4 Inverse correlation between growth and cell membrane robustness. Mean GFP level of the whole population prior to freeze-thawstress (empty symbols) as a function of the percentage of PI negative cells after freeze-thaw stress; and the mean GFP of the PI negative cells afterfreeze-thaw stress (full symbols) as a function of the percentage of PI negative cells after freeze-thaw stress. a These outlying data points are fromthe first sample of aerobic batch cultivation.
Carlquist et al. Microbial Cell Factories 2012, 11:94 Page 7 of 13http://www.microbialcellfactories.com/content/11/1/94

distribution of subpopulations demonstrates that continu-ous cultivation, where the environment is constant andthe average cell population grows with a constant growthrate, is the preferred experimental setup when comparing
physiology of different strains, since dynamic changes inphysiology otherwise seen in batch mode are minimised.Continuous cultivation may also be used to investigatehow subpopulation distribution is affected by growth rate
Figure 6 Dynamic responses of subpopulations and metabolites in glucose gradient experiments mimicking large-scale cultivationconditions. An aerobic glucose-limited chemostat was perturbed with a low concentration glucose pulse. Cells were sampled from thebioreactor and exposed to freeze-thaw stress and subsequently analysed with flow cytometry. Symbols: Subpopulation P1 (high GFP level, intactcell membranes) (crosses); Subpopulation P2 (low GFP level, permeabilised cell membranes) (snowflakes); Glucose (open circles); Acetate (opendiamonds); Ethanol (open squares); Glycerol (open triangles).
Figure 7 GFP histograms illustrating the distribution of subpopulations with different degree of cell membrane robustness followingthe glucose pulse. GFP histograms (grey area). FI = Fluorescence intensity. The black lines correspond to the fitted mixture of two Gaussiandistributions. The vertical line corresponds to the subpopulation classification threshold.
Carlquist et al. Microbial Cell Factories 2012, 11:94 Page 8 of 13http://www.microbialcellfactories.com/content/11/1/94

as it allows for changing the growth rate while keepingother conditions constant and this knowledge can then beapplied in development and design of a fed-batch process.At time point zero, a pulse of 10 mL highly concen-
trated glucose solution was added and the glucose con-centration inside the bioreactor instantly increased fromca 0 g/L to 0.8 g/L. Directly after the pulse, glucose wasconsumed and ethanol, acetate and glycerol were pro-duced at different rates, as has been observed previously[35]. After glucose depletion, ethanol and acetate con-sumption occurred. During the pulse, the cells rapidlyexperienced a variation from a low to a high glucoseconcentration, which is similar to what a cell may ex-perience in fed-batch cultivations as the cell is trans-ported from the bottom of a bioreactor – a low glucoseenvironment – to the top, which normally is close to thefeeding point and hence has a high glucose concentra-tion [36]. Approximately 15 minutes after glucose wasadded, a drop in the P1 subpopulation (intact cell mem-branes) and an increase in the P2 subpopulation (per-meabilised cell membranes) fractions were observed(Figures 6, 7). The P2 subpopulation increased to 63% ofthe entire population 45 min after the glucose pulse wasadded. This demonstrates that a sudden change in glu-cose concentration has a profound effect on cell fitnessdistribution, since an increased number of cells withlower fluorescence and consequently lower cell mem-brane robustness emerged. The shift from steady stategrowth with D= 0.2 h-1 to batch mode and hence highergrowth rate led to that a substantial part of cellularresources were redistributed to promote an increasedgrowth rate, and consequently, the population becamemore sensitive to freeze-thaw stress. A difference insubpopulation distribution at steady states before andafter the pulse was observed (68% P1 before com-pared to 59% P1 after the pulse), despite similar bio-mass and carbon dioxide profiles. The mechanismunderlying the difference in subpopulation distribu-tion at the different steady states before and after thepulse is not clear, however, it is probable that steadystate after the pulse had not yet been reached on alllevels despite constant biomass concentration, as hasbeen observed previously [33].
ConclusionsA dual reporter system in budding yeast was constructedand used to measure population heterogeneities ingrowth and cell membrane integrity after physical stress,using freeze-thaw stress as a model. A clear inverse cor-relation between growth and cell membrane robustnesswas observed and the two antagonistic phenotypesco-existed in the population, demonstrating that thepopulation was prepared for different types of variationsin environmental conditions.
Cells in stationary phase displayed the highest cell mem-brane robustness and tolerance to freeze-thaw stress. Forcells that were actively proliferating, the percentage of thesubpopulation with low cell membrane robustness waslower in continuous cultivation mode as compared to apopulation growing in batch mode. However, the lowmembrane robustness phenotype could be easily inducedfor cells growing under glucose limiting conditions by asudden increase of glucose at a low concentration. Distri-bution of the two subpopulations with high and low mem-brane robustness was modulated quickly as a response tothe low-level fluctuation in glucose concentration. Thissuggests that spatial heterogeneities of glucose concentra-tion in a fermentation tank may be detrimental for cellmembrane robustness and physical stress tolerance. Fur-thermore this demonstrates the importance of rapidmethods for monitoring effects of small sudden changeson microbial cultures at a single-cell levelTo the best of our knowledge this is the first time that
the existence of subpopulations with different tolerancetowards physical stress and a reporter system to analysedistributions of cell membrane robustness in buddingyeast have been reported. The developed system is usefulfor optimisation studies for more efficient production inmicrobial cell factories or for optimising physical state ofa population at point of harvest, thus increasing resist-ance to adverse conditions during downstream proces-sing where intact cells are desired, for example for theproduction of baker’s yeast. Furthermore, a high fractionof cells with robust membrane phenotype may be im-portant in secretory production of recombinant proteinswhere release of contaminating intracellular proteins ishighly unwanted [37]. Contrary, in production processeshaving a cell-lysis step to liberate the product a high per-centage of a less robust subpopulation may be preferred.
MethodsStrainsEscherichia coli strain MC1000 [araD139 Δ(ara-leu)7679galU galK lac 174 rpsL thi-1] [38] was used for subcloningbefore yeast transformation. Plasmids and S. cerevisiaestrains are summarised in Table 1. All strains were storedin 15% glycerol stocks in liquid media at −80°C. S. cerevi-siae strains were plated on YNB-agar plates (6.7 g/L yeastnitrogen base (Difco, USA), 20 g/L glucose and 20 g/Lagar) and incubated for 2 days at 30°C before use.
Molecular biology techniquesPCR was performed using PhusionW DNA polymerasefrom Finnzymes (Espoo, Finland) and all other enzymesfor cloning were purchased from Fermentas InternationalInc (Canada) and used following the recommendations ofthe manufacturer. Purification of DNA fragments fromagarose gels was performed using the DNA Extraction Kit
Carlquist et al. Microbial Cell Factories 2012, 11:94 Page 9 of 13http://www.microbialcellfactories.com/content/11/1/94

from Fermentas International Inc (Canada). PlasmidDNA was isolated from E. coli by using ZyppyTMPlasmid Miniprep Kit, Zymo Research (California, USA).Chromosomal DNA from S. cerevisiae was purified usingYeaStarTM Genomic DNA Kit from Zymo Research(California, USA). Sequencing of DNA constructs was doneby Macrogen (Seoul, Korea). Cells of E. coli were trans-formed by electroporation using a Bio-Rad MicropulserTM
and the recommended procedure of the manufacturer. S.cerevisiae cells were made competent, frozen in sorbitolbuffer and transformed by electroporation according to theprotocol of Suga et al. [42]. Southern blotting was donewith the digoxigenin method by Roche (Indianapolis, IN,USA) using a digoxigenin labeled yEGFP PCR probe andhybridization at 65°C.
Construction of reporter strainsA 2200 bp EcoRI-PaeI fragment of CEN4-ARS1 wasobtained by PCR with pCM188 as template [43] and a1143 bp URA3 fragment flanked by PaeI and BamHI/SalIwas obtained with pEMBLyex4 as template [44]. pBR322[41] was cut with EcoRI and SalI and the larger 4085 bpfragment was purified. The CEN4-ARS1 and URA3 frag-ments were cut with PaeI, ligated in vitro and cloned inthe purified EcoRI-SalI fragment of pBR322 resulting inplasmid pFe131. Then the RPL22A promoter was ampli-fied as a 444 bp BamHI-HindIII fragment with CEN.PK113-5D chromosomal DNA as template, a 730 bp yEGFP3fragment flanked by HindIII in the 5’ end and XhoI-XbaIsites divided by two stop codons in the 3’ end was ampli-fied with pYGFP3 [17] as template and the CYC1 termin-ator was amplified as a 268 bp XbaI-SalI fragmentwith pCM188 as template. The RPL22A promoterfragment was cut with HindIII, the yEGFP3 fragmentwas cut with HindIII and XbaI, the CYC1 terminatorfragment was cut with XbaI and the three fragmentswere ligated in vitro and the combined 1442 bp frag-ment was purified from an agarose gel. This fragmentwas then cloned with BamHI-SalI in pFe131 resultingin pFe134. For chromosomal integrations a 2585 bpURA3-RPL22A-yEGFP3-TCYC1 fragment was ampli-fied with primers FP212 and FP169 with pFe134 as
template and transformed to CEN.PK 113-5D result-ing in strain FE440, whereas the control strain FE522was obtained by transforming CEN.PK 113-5D with a1143 bp URA3 fragment obtained by PCR with pri-mers FP212 and FP213 and with pFe131 as template.Primers for chromosomal integrations are shown inTable 2. Correct chromosomal integration was verifiedby sequencing and Southern blotting.
Batch cultivationsBatch cultivations were performed in duplicate usingSartorius 1 L bioreactors (Sartorius Stedim Biotech,Germany) with a working volume of 1.0 L. The pH andDOT electrode (Mettler Toledo, OH, USA) were cali-brated according to standard procedures provided by themanufacturer. Inocula of S. cerevisiae strains were pre-pared by transferring colonies from fresh YNB-plates into500 mL Erlenmeyer flasks containing 100 mL definedmineral media [45] supplemented with 10 g/L glucose andincubating in a shake incubator set to 150 rpm and 30°C.Precultures were grown until reaching mid exponentialphase (approximately 10 hours) and then used directly forinoculation (starting OD600nm= 0.001) of the bioreactorcontaining defined mineral media [45] supplemented with5 g/L glucose. Cultivation conditions were set to the
Table 1 S. cerevisiae strains and plasmids used in this study
Strains Relevant genotype Ref.
CEN.PK 113-5D Mata SUC2 MAL2-8c ura3-52 [39]
FE440 CEN.PK 113-5D with ura3-52:: URA3-PRPL22A-yEGFP-TCYC1 chromosomal integration This study
FE522 CEN.PK 113-5D with ura3-52::URA3 chromosomal integration This study
Plasmids
pBR322 [40,41]
pFe131 pBR322 with CEN1-ARS4-URA3 This study
pFe134 pFe131 with PRPL22A-yEGFP-TCYC1 This study
Table 2 Primers used for S. cerevisiae chromosomalintegrations
Primer Sequence 5'-3'
FP169, r TATAAAGGCCATGAAGCTTTTTCTTTCCAATTTTTTTTTTTTCGTCATTA
TAGAAATCATTACGACCGAGATTCCCGGGTAATTGGCCGCAAATTAAAGC
FP212, f GATTCGGTAATCTCCGAGCAGAAGGAAGAACGAAGGAAGGAGCAC
CAGCTATGACCATGATTACG
FP213, r TTTTTCGTCATTATAGAAATCATTACGACCGAGATTCCCGGGTAA
TTTTTGATCGGGTAATAACTGThe underlined sequence is complementary to the PCR template; theremaining part of the sequence is complementary to the ura3-52chromosomal site in CEN.PK113-5D.
Carlquist et al. Microbial Cell Factories 2012, 11:94 Page 10 of 13http://www.microbialcellfactories.com/content/11/1/94

following; aeration 1 v/v/min; temperature 30°C; stirring600 rpm and pH 5.0 (pH was controlled by automaticaddition of 2 M KOH). Samples for OD600nm, high per-formance liquid chromatography (HPLC) and flow cyto-metry analysis were withdrawn approximately every 1hour. Samples for OD600 were analysed directly whilesamples for HPLC were kept at −20°C. Samples for flowcytometry were centrifuged for 1 minute at 3000 gand 4°C, and resuspended in saline solution. Cellswere then kept in saline solution on ice for maximum45 minutes until they were stained with PI (10 μg/mL)[46]. In brief, cell samples were stained by the addition ofPI stock solution and subsequently incubated in darknessfor 20 min at room temperature and analysed by flowcytometry. As positive control for cells with permeabilisedplasma membranes was ethanol (70%) treated cells (100%of cells were PI positive; PI >100 ch. nr.).
Glucose gradient simulationContinuous cultivations were performed using a Sartorius2 L bioreactor (Sartorius Stedim Biotech, Germany) with aworking volume of 1.5 L. Cultivation parameters were setas described above. After an initial batch phase, the con-tinuous operation mode was started when glucose wasnearly depleted and the carbon dioxide production startedto peak. The dilution rate (D) was set to 0.2 h-1, whichwas below the dilution rate where overflow metabolismoccurs [33]. Steady state was observed after feeding ca 5reactor volumes, and biomass and carbon dioxide wereconstant for at least 20 hours. When steady state wasreached, 10 mL of concentrated glucose was swiftly addedto the bioreactor by using a sterile syringe, which resultedin an increase in glucose concentration from ca 0 g/L to0.8 g/L. Samples were taken before, during and after glu-cose addition and analysed by HPLC. Cell samples wereexposed to freeze-thaw stress as described below and ana-lysed by flow cytometry.
Freeze-thaw stress experimentsSamples were withdrawn from the bioreactor using asterile syringe and then instantly mixed with an equalvolume of 30% glycerol solution, resulting in a cell sus-pension with 15% glycerol. Cell suspensions were sub-jected to freezing by placement in a freezer set to −80°C.After complete freezing for at least 4 hours, cell sampleswere taken out of the freezer and placed in a water bathwith controlled temperature at 37°C until samples wereentirely thawed. After thawing, cells were centrifuged for1 minute at 3000 g and 4°C, and resuspended in saline so-lution, and kept on ice for maximum 45 min until analysis.Cells were stained with PI (10 μg/mL) as described aboveand analysed by flow cytometry.
AnalysesGrowth was monitored by measuring OD600nm with aShimadzu UV mini 1240 spectrophotometer (Shimidzu,Kyoto, Japan). The concentrations of glucose, acetate,ethanol, glycerol, pyruvate and succinate were determinedby HPLC (Agilent 1100, Agilent Technologies, CA, USA)with a 300 mm×7.8 mm Aminex HPX-87 H ion exchangecolumn (Bio-Rad, Hercules, CA, USA), refractive index de-tector (RID Agilent 1200, Agilent Technologies, CA, USA)and UV detector (Agilent 1100, Agilent Technologies, CA,USA) set to 210 nm. The mobile phase was 5 mM H2SO4
(aq.), temperature 60°C and flow rate 0.6 mL/min. Thecomposition of the outgoing gas from batch cultivationswas monitored by a 1311 Fast response Triple-gas monitor(Innova Air tech technologies, Ballerup, Denmark).A BD FACSAria III (Becton-Dickinson, NJ, USA) flow
cytometer was used for single-cell analysis. Excitationwavelength for the laser used was 488 nm. Fluorescenceemission levels were measured using a band pass filter at530/30 nm (FITC) and 616/23 (PI). Light scattering andfluorescence levels were standardized using 2.5 μm fluor-escent polystyrene beads. 10,000 events were recordedwith a rate of approximately 1,000 events per second. Pro-cessing and analysis of flow cytometry raw data wasperformed by using MatLab W R2009b (The MathWorks,Inc., Natick, MA, USA). The measurement files, exportedas fcs files by the flow cytomer FACSAria III, wereimported into MatLabW, using a “fcs data reader” routine(by L.Balkay, University of Debrecen, Hungary), availableon MatLabW File Exchange website. The classification ofcells into a high and a low fluorescence subpopulation wasbased on fitting a gaussian mixture of two components tothe GFP fluorescence histograms (using a nonlinear leastsquare curve fitting algorithm available in MatLabW
R2009b). The relative weight of the two gaussian distribu-tions in the mixture were used as prior probabilities in thedefinition of the classification rule that minimizes theexpected cost of misclassification [47].
Additional file
Additional file 1: S1. Percentile analysis.
Competing interestsThe authors declare that they have no competing interests.
Authors’ contributionsMC and RLF participated in the design of the study, physiologicalexperiments, flow cytometry analysis and drafted the manuscript. SH carriedout the strain constructions. ALH participated in the physiologicalexperiments and flow cytometry analysis. LL participated in the flowcytometry analysis. SJS participated in the design of the study. KVGparticipated in the design of the study and its coordination. AEL conceivedthe study, and participated in its design and coordination and helped todraft the manuscript. All authors read and approved the final manuscript.
Carlquist et al. Microbial Cell Factories 2012, 11:94 Page 11 of 13http://www.microbialcellfactories.com/content/11/1/94

AcknowledgementsERA-IB (ERA-NET Industrial Biotechnology) is gratefully acknowledged forfinancial support in the frame of the project”Targeting populationheterogeneity at microscale for robust fermentation processes” (projectnumber EIB.08.031). The Danish Council for Strategic Research is gratefullyacknowledged for financial support in the frame of the project “Towardsrobust fermentation processes by targeting population heterogeneity atmicroscale” (project number 09–065160).
Author details1Center for Microbial Biotechnology, Department of Systems Biology,Technical University of Denmark, DK-2800 Kgs. Lyngby, Denmark. 2Division ofApplied Microbiology, Department of Chemistry, Lund University, SE-22100Lund, Sweden. 3Center for Process Engineering and Technology, Departmentof Chemical and Biochemical Engineering, Technical University of Denmark,DK-2800 Kgs. Lyngby, Denmark. 4Fermenco ApS, Kgs. Lyngby, DK-2800 Kgs.Lyngby, Denmark. 5Molecular Microbial Ecology Group, Department ofBiology, University of Copenhagen, Sølvgade 83H, DK-1370K Copenhagen,Denmark.
Received: 22 March 2012 Accepted: 19 June 2012Published: 16 July 2012
References1. Lencastre Fernandes R, Nierychlo M, Lundin L, Pedersen AE, Puentes Tellez
PE, Dutta A, Carlquist M, Bolic A, Schapper D, Brunetti AC, Helmark S, HeinsAL, Jensen AD, Nopens I, Rottwitt K, Szita N, Van Elsas JD, Nielsen PH,Martinussen J, Sørensen SJ, Lantz AE, Gernaey KV: Experimental methodsand modeling techniques for description of cell populationheterogeneity. Biotechnol Adv 2011, 29:575–599.
2. Avery SV: Microbial cell individuality and the underlying sources ofheterogeneity. Nat Rev Microbiol 2006, 4:577–587.
3. Muller S, Harms H, Bley T: Origin and analysis of microbial populationheterogeneity in bioprocesses. Curr Opin Biotechnol 2010, 21:100–113.
4. Enfors SO, Jahic M, Rozkov A, Xu B, Hecker M, Jurgen B, Kruger E, SchwederT, Hamer G, O'Beirne D, Noisommit-Rizzi N, Reuss M, Boone L, Hewitt C,McFarlane C, Nienow A, Kovacs T, Trägårdh C, Fuchs L, Revstedt J, FribergPC, Hjertager B, Blomsten G, Skogman H, Hjort S, Hoeks F, Lin HY, NeubauerP, Van der Lans R, Luyben K, et al: Physiological responses to mixing inlarge scale bioreactors. J Biotechnol 2001, 85:175–185.
5. Hewitt CJ, Nebe-Von Caron G, Axelsson B, McFarlane CM, Nienow AW:Studies related to the scale-up of high-cell-density E. coli fed-batchfermentations using multiparameter flow cytometry: effect of achanging microenvironment with respect to glucose and dissolvedoxygen concentration. Biotechnol Bioeng 2000, 70:381–390.
6. Díaz M, Herrero M, García LA, Quirós C: Application of flow cytometry toindustrial microbial bioprocesses. Biochem Eng J 2010, 48:385–407.
7. Mattanovich D, Borth N: Applications of cell sorting in biotechnology.Microb Cell Fact 2006, 5:12.
8. Lara AR, Galindo E, Ramirez OT, Palomares LA: Living with heterogeneitiesin bioreactors: understanding the effects of environmental gradients oncells. Mol Biotechnol 2006, 34:355–381.
9. Delvigne F, Boxus M, Ingels S, Thonart P: Bioreactor mixing efficiencymodulates the activity of a prpoS::GFP reporter gene in E. coli. MicrobCell Fact 2009, 8:15.
10. Bylund F, Collet E, Enfors SO, Larsson G: Substrate gradient formation inthe large-scale bioreactor lowers cell yield and increases by-productformation. Bioproc Eng 1998, 18:171–180.
11. Lewis JG, Learmonth RP, Watson K: Role of growth phase and ethanol infreeze-thaw stress resistance of Saccharomyces cerevisiae. Appl EnvironMicrobiol 1993, 59:1065–1071.
12. Klis FM, Boorsma A, De Groot PW: Cell wall construction in Saccharomycescerevisiae. Yeast 2006, 23:185–202.
13. Gasch AP: The environmental stress response: a common yeast responseto environmental stresses. In Yeast Stress Responses, Topics in CurrentGenetics, Volume 1. Edited by Hohmann S, Mager WH. Heidelberg: Springer;2002:11–70. Hohmann S. (Series Editor).
14. Zakrzewska A, van Eikenhorst G, Burggraaff JE, Vis DJ, Hoefsloot H, Delneri D,Oliver SG, Brul S, Smits GJ: Genome-wide analysis of yeast stress survival andtolerance acquisition to analyze the central trade-off between growth rateand cellular robustness. Mol Biol Cell 2011, 22:4435–4446.
15. Lidstrom ME, Konopka MC: The role of physiological heterogeneity inmicrobial population behavior. Nat Chem Biol 2010, 6:705–712.
16. Ferrer-Miralles N, Domingo-Espin J, Corchero JL, Vazquez E, Villaverde A:Microbial factories for recombinant pharmaceuticals. Microb Cell Fact2009, 8:17.
17. Cormack BP, Bertram G, Egerton M, Gow NA, Falkow S, Brown AJ:Yeast-enhanced green fluorescent protein (yEGFP)a reporter of geneexpression in Candida albicans. Microbiology 1997, 143:303–311.
18. Day RN, Davidson MW: The fluorescent protein palette: tools for cellularimaging. Chem Soc Rev 2009, 38:2887–2921.
19. Regenberg B, Grotkjaer T, Winther O, Fausboll A, Akesson M, Bro C, HansenLK, Brunak S, Nielsen J: Growth-rate regulated genes have profoundimpact on interpretation of transcriptome profiling in Saccharomycescerevisiae. Genome Biol 2006, 7:R107.
20. Fazio A, Jewett MC, Daran-Lapujade P, Mustacchi R, Usaite R, Pronk JT,Workman CT, Nielsen J: Transcription factor control of growth ratedependent genes in Saccharomyces cerevisiae: a three factor design.BMC Genomics 2008, 9:341.
21. Brauer MJ, Huttenhower C, Airoldi EM, Rosenstein R, Matese JC, Gresham D,Boer VM, Troyanskaya OG, Botstein D: Coordination of growth rate, cellcycle, stress response, and metabolic activity in yeast. Mol Biol Cell 2008,19:352–367.
22. Warner JR, Vilardell J, Sohn JH: Economics of ribosome biosynthesis. ColdSpring Harb Symp Quant Biol 2001, 66:567–574.
23. Mateus C, Avery SV: Destabilized green fluorescent protein for monitoringdynamic changes in yeast gene expression with flow cytometry. Yeast2000, 16:1313–1323.
24. Roostalu J, Joers A, Luidalepp H, Kaldalu N, Tenson T: Cell division inEscherichia coli cultures monitored at single cell resolution. BMCMicrobiol 2008, 8:68.
25. Slavov N, Botstein D: Coupling among growth rate response, metaboliccycle, and cell division cycle in yeast. Mol Biol Cell 2011, 22:1997–2009.
26. Growth rate response. [http://genomics-pubs.princeton.edu/grr/].27. Sumner ER, Avery AM, Houghton JE, Robins RA, Avery SV: Cell cycle- and
age-dependent activation of Sod1p drives the formation of stressresistant cell subpopulations within clonal yeast cultures. Mol Microbiol2003, 50:857–870.
28. Brauer MJ, Saldanha AJ, Dolinski K, Botstein D: Homeostatic adjustmentand metabolic remodeling in glucose-limited yeast cultures. Mol Biol Cell2005, 16:2503–2517.
29. Cipollina C, Alberghina L, Porro D, Vai M: SFP1 is involved in cell sizemodulation in respiro-fermentative growth conditions. Yeast 2005,22:385–399.
30. Ando A, Nakamura T, Murata Y, Takagi H, Shima J: Identification andclassification of genes required for tolerance to freeze-thaw stressrevealed by genome-wide screening of Saccharomyces cerevisiaedeletion strains. FEMS Yeast Res 2007, 7:244–253.
31. Delvigne F, Brognaux A, Francis F, Twizere JC, Gorret N, Sorensen SJ,Thonart P: Green fluorescent protein (GFP) leakage from microbialbiosensors provides useful information for the evaluation of thescale-down effect. Biotechnol J 2011, 6:968–978.
32. Kneen M, Farinas J, Li Y, Verkman AS: Green fluorescent protein as anoninvasive intracellular pH indicator. Biophys J 1998, 74:1591–1599.
33. Van Hoek P, Van Dijken JP, Pronk JT: Effect of specific growth rate onfermentative capacity of baker's yeast. Appl Environ Microbiol 1998,64:4226–4233.
34. Carlsen M, Jochumsen KV, Emborg C, Nielsen J: Modeling the growth andproteinase A production in continuous cultures of recombinantSaccharomyces cerevisiae. Biotechnol Bioeng 1997, 55:447–454.
35. Flikweert MT, Kuyper M, van Maris AJ, Kotter P, van Dijken JP, PronkJT: Steady-state and transient-state analysis of growth andmetabolite production in a Saccharomyces cerevisiae strain withreduced pyruvate-decarboxylase activity. Biotechnol Bioeng 1999,66:42–50.
36. George S, Larsson G, Olsson K, Enfors SO: Comparison of the baker's yeastprocess performance in laboratory and production scale. Bioproc Eng1998, 18:135–142.
37. Porro D, Sauer M, Branduardi P, Mattanovich D: Recombinant proteinproduction in yeasts. Mol Biotechnol 2005, 31:245–259.
38. Casabadan MJaC SN: Analysis of gene control signals by DNA fusion andcloning in Escherichia coli. J Mol Biol 1980, 138:179–207.
Carlquist et al. Microbial Cell Factories 2012, 11:94 Page 12 of 13http://www.microbialcellfactories.com/content/11/1/94
39. van Dijken JP, Bauer J, Brambilla L, Duboc P, Francois JM, Gancedo C,Giuseppin ML, Heijnen JJ, Hoare M, Lange HC, Madden EA, Niederberger P,Nielsen J, Parrou JL, Petit L, Porro D, Reuss M, Van Riel N, Rizzi M, SteensmaHY, Verrips CT, Vindelov J, Pronk JT: An interlaboratory comparison ofphysiological and genetic properties of four Saccharomyces cerevisiaestrains. Enzyme Microb Technol 2000, 26:706–714.
40. Watson N: A new revision of the sequence of plasmid pBR322. Gene1988, 70:399–403.
41. Bolivar F, Rodriguez RL, Greene PJ, Betlach MC, Heyneker HL, Boyer HW,Crosa JH, Falkow S: Construction and characterization of new cloningvehicles. II. A multipurpose cloning system. Gene 1977, 2:95–113.
42. Suga M, Isobe M, Hatakeyama T: Cryopreservation of competent intactyeast cells for efficient electroporation. Yeast 2000, 16:889–896.
43. Gari E, Piedrafita L, Aldea M, Herrero E: A set of vectors with atetracycline-regulatable promoter system for modulated geneexpression in Saccharomyces cerevisiae. Yeast 1997, 13:837–848.
44. Murray JA, Scarpa M, Rossi N, Cesareni G: Antagonistic controls regulatecopy number of the yeast 2 mu plasmid. EMBO J 1987, 6:4205–4212.
45. Verduyn C, Postma E, Scheffers WA, Van Dijken JP: Effect of benzoicacid on metabolic fluxes in yeasts: a continuous-culture study onthe regulation of respiration and alcoholic fermentation. Yeast 1992,8:501–517.
46. Kacmar J, Zamamiri A, Carlson R, Abu-Absi NR, Srienc F: Single-cellvariability in growing Saccharomyces cerevisiae cell populationsmeasured with automated flow cytometry. J Biotechnol 2004,109:239–254.
47. Johnson RA, Richard DW: Applied multivariate statistical analysis. UpperSaddle River: Pearson International Edition; 2007.
doi:10.1186/1475-2859-11-94Cite this article as: Carlquist et al.: Physiological heterogeneities inmicrobial populations and implications for physical stress tolerance.Microbial Cell Factories 2012 11:94.
Submit your next manuscript to BioMed Centraland take full advantage of:
• Convenient online submission
• Thorough peer review
• No space constraints or color figure charges
• Immediate publication on acceptance
• Inclusion in PubMed, CAS, Scopus and Google Scholar
• Research which is freely available for redistribution
Submit your manuscript at www.biomedcentral.com/submit
Carlquist et al. Microbial Cell Factories 2012, 11:94 Page 13 of 13http://www.microbialcellfactories.com/content/11/1/94

Chapter 5 – Combined approach of principal component and interval analysis to evaluate
population heterogeneity in a factorial design batch fermentation experiment of S. cerevisiae
87
5. Chapter
Combined approach of principal component and
interval analysis to evaluate population
heterogeneity in batch fermentation experiments of
S. cerevisiae
Heins A.L. 1, Lencastre Fernandes R.
2, Carlquist M.
4, Lundin, L.
3, Sørensen S.
3, Gernaey
V.K. 2, Eliasson Lantz A.
1
1 Department of Systems Biology, Technical University of Denmark, 2800 Kongens Lyngby,
Denmark
2 Department of Chemical and Biochemical Engineering, Technical University of Denmark,
2800 Kongens Lyngby, Denmark
3 Department of Biology, Section of Microbiology, University of Copenhagen, 2100 DK,
Copenhagen, Denmark
4 Department of Chemistry, Division of Applied Microbiology, Lund University, 221 00
Lund, Sweden
Written as method paper
Status: Manuscript in preparation

Chapter 5 – Combined approach of principal component and interval analysis to evaluate
population heterogeneity in a factorial design batch fermentation experiment of S. cerevisiae
88
Abstract
Process development and optimization often involves the evaluation of an industrial
biotechnological production process in conditions which are different from the standard
conditions employed for production to explore the applicability range of the production
host/system. Here an approach is presented to evaluate the influence of different conditions on
single cell growth and cell robustness distributions using a dual reporter strain of S. cerevisiae
in batch cultivations. Using the abilities of the strain - possessing a built-in growth reporter
expressing a GFP fluorescent protein under the control of a ribosomal promoter - growth
heterogeneities were investigated on single cell level using flow cytometry. By the application
of freeze-thaw stress additionally cell membrane robustness could be studied under the
different batch conditions. To evaluate the large amount of data resulting from 12 different
batch experiments following the different growth phases, principal component analysis (PCA)
was applied after the development of a method for the objective description of single cell
fluorescence distributions. In general it was found that the glucose concentration seems to
have a major influence on general physiology as well as on single cell property distribution,
whereas a change in oxygen level and pH only seem to exhibit minor influences. Cells from
aerobic low gravity cultivations exhibiting two batch growth phase were found to be mostly
robust and responding to changing growth conditions. In contrast to that anaerobic low
gravity cultivations as well as aerobic and anaerobic high gravity cultivations only exhibited
one growth phase and showed generally lower robustness especially towards the end of the
batch cultivation and lower growth rates could be found.
Keywords: batch cultivation, reporter strain, GFP fluorescence, cell robustness, flow
cytometry, principal component analysis, interval analysis
5.1 Introduction
To achieve an efficient industrial biotechnological production process which is robust and
high-yielding, it is essential to optimize both the cell factory and the cultivation conditions.
This often also includes the performance of experiments under conditions that are different
from the standard conditions to explore the scope of application of the process. Hereby
generally all process parameter that are normally controlled at a specific set point can be
varied, like pH, substrate concentration, substrate feed rate, oxygen level, temperature,
aeration and gas flow rate. For instance recently the influence of environmental parameter on
the production of exopolysaccharide in Lactobacillus reuteri1 was studied using a factorial

Chapter 5 – Combined approach of principal component and interval analysis to evaluate
population heterogeneity in a factorial design batch fermentation experiment of S. cerevisiae
89
design experiment. Similarly, the general evaluation of the influence of different
environmental conditions on various cell properties like transcriptome, growth or intracellular
pH was the subject of many studies 2–4
.
A change in environmental conditions can have influence on the growth, cell metabolism,
general physiology and stress level of the cells5–7
used in the production process which in turn
might influence the yields as outcome of the process in either a negative or a positive way.
Additionally the nowadays well accepted phenomenon of population heterogeneity, which is
known to especially influence large scale cultivation processes, might show a different impact
on the production. Generally, population heterogeneity is known to decrease yields, rise by-
product formation, induce stress responses but also has positive effects like facilitating the
adaption of a cell population to new environmental conditions8–11
. The heterogeneity of cell
populations arises due to non-ideal mixing in large scale as well as in bench scale bioreactors
which causes gradients of e.g. substrate, pH and oxygen. Thus microbial cells that circulate
throughout the reactor experience rapid changes in environmental conditions which might
pose stress on them and affect their metabolism leading to formation of single cell
distributions of cell characteristics and activities (e.g. respiration, product efficiency)12
.
Consequently the population of cells used for the production of e.g. biomass, recombinant
proteins or bulk products rather exhibits individual properties than homogenous behavior
which cannot be described by averaged values13
.
Therefore tools like flow cytometry hat enable the measurement of distributions of single cell
properties are increasingly employed14,15
to investigate broth samples taken during
bioprocesses at-line or online in automated setups with a flow chamber connected to the
bioreactor and the flow cytometer16,17
. Flow cytometry is a high throughput technique that
allows the measurement of different properties of up to 10000 cells per second including cell
size (FSC), side scatter which can be correlated to cell morphology and fluorescence
originating from stains respectively from the cells themselves (reporter strains)15,18
. As a
consequence big amounts of data can be collected which are nowadays mostly evaluated
subjectively using mean or coefficient of variance (CV) values which fail to describe the
whole picture of the single cell distribution (e.g. of shifts and subpopulations)14
. Furthermore,
flow cytometry results are typically plotted as biplots of mostly fluorescence and FSC
respectively single parameter histograms showing relative cell count in every fluorescence
channel, which shows the whole population but the plots can only be subjectively compared.

Chapter 5 – Combined approach of principal component and interval analysis to evaluate
population heterogeneity in a factorial design batch fermentation experiment of S. cerevisiae
90
In this study a method combining interval analysis of fluorescence histogram plots, - a
technique which has been employed earlier for the description of biplots7- with principal
component analysis is presented which allows objective data description. Principal component
analysis transforms the original variables, based on singular value decomposition, into a new
set of uncorrelated factors (principal components) that account for the maximum proportion
of the variance in the data, with each component being a linear combination of the original
observed variables. The first principal component is the linear combination of variables that
accounts for the largest proportion of variance in the data, the following one accounts for the
second highest and so forth19
.
Single cell differences were evaluated using flow cytometry employing a dual S. cerevisiae
reporter strain expressing a chromosomal integrated stable GFP7. The GFP fluorescence is
controlled by the ribosomal promoter RPL22a whose expression was found to be growth
correlated20
. Furthermore the applicability of the strain was successfully shown by monitoring
changes in growth during the different phases in batch experiments7. Additionally, the strain
can also be used as indicator for membrane robustness after applying freeze-thaw stress to
broth samples, due to a strong correlation between membrane intactness and the intracellular
GFP fluorescence level7.
This study aims at developing a method to objectively describe the large amount of data
resulting from flow cytometry analysis which can be used to understand the correlation
between the population structure and the environmental variables (glucose and oxygen
availability) in the dynamic environment of a batch cultivation. Hereby GFP fluorescence
correlated to growth as well as cell membrane robustness using the dual S. cerevisiae reporter
strain FE440 was evaluated using flow cytometry. The study focuses on the analysis of a data
set originating from a total of 12 S. cerevisiae batch cultivations with variable pH, glucose
and oxygen concentrations.
5.2 Materials and Methods
5.2.1 Strain
The strain FE440, used in this study, is a dual reporter strain (for growth and cell membrane
robustness) based on the S. cerevisiae wildtype strain CEN.PK 113-5D7. The strain was stored
in a 15% glycerol stock in liquid media at −80 °C.

Chapter 5 – Combined approach of principal component and interval analysis to evaluate
population heterogeneity in a factorial design batch fermentation experiment of S. cerevisiae
91
5.2.2 Cultivation conditions
Precultures. A single colony of S. cerevisiae FE440 grown on a YNB plate (0.73 % Yeast
nitrogen base w/o amino acids and (NH4)2SO4 (Difco, USA), 20 g/L D-Glucose, 20 g/L Bacto
Agar adjusted to pH 5.8 with NaOH) was used to inoculate a 0.5 L baffled shake flask with
100 ml of defined mineral medium21
. Precultures were grown in an orbital shaken incubator
set to 150 rpm and 30°C until reaching mid exponential phase (approximately 10 h) and
directly used to inoculate the bioreactor.
Batch cultivations. 12 Batch cultivations with varying pH, oxygen level and glucose
concentration have been performed (for list of conditions, see table 1) using 1 L bioreactors
(Sartorius, B. Braun Biotech International, GmbH, Melsungen, Germany) with a working
volume of 1 L. The pH and DOT electrodes (Mettler Toledo, OH, USA) were calibrated
according to standard procedures provided by the manufacturer using a two point calibration
(pH 4 and 7, gassing with Oxygen (100%) and with Nitrogen (0%)). The growth medium used
was either a defined mineral medium containing 5 g/L (NH4)2SO4, 3 g/L KH2PO4, 0.1 g/L
MgSO4*H2O, 1 ml/L trace metal solution, 1 ml/L vitamin solution, 50 µL Sigma 204
Antifoam and 5 or 25 g/L glucose21
or a modified medium with 10 g/L (NH4)2SO4, 3 g/L
KH2PO4, 0.3 g/L MgSO4*H2O, 2 ml/L trace metal solution, 2 ml/L vitamin solution, 50 µL
Sigma 204 Antifoam and 300 g/L glucose22
. The OD600 for inoculation was 0.001 when using
5 g/L and 25 g/L glucose and 0.01 when using 300 g/L glucose. The pH was controlled to 4 or
5 using 2M NaOH. Temperature, aeration and stirring were kept constant at 30 °C, 1v/vm and
600 rpm. Cultivations were either performed under aerobic conditions using oxygen or under
anaerobic conditions using nitrogen for sparging.
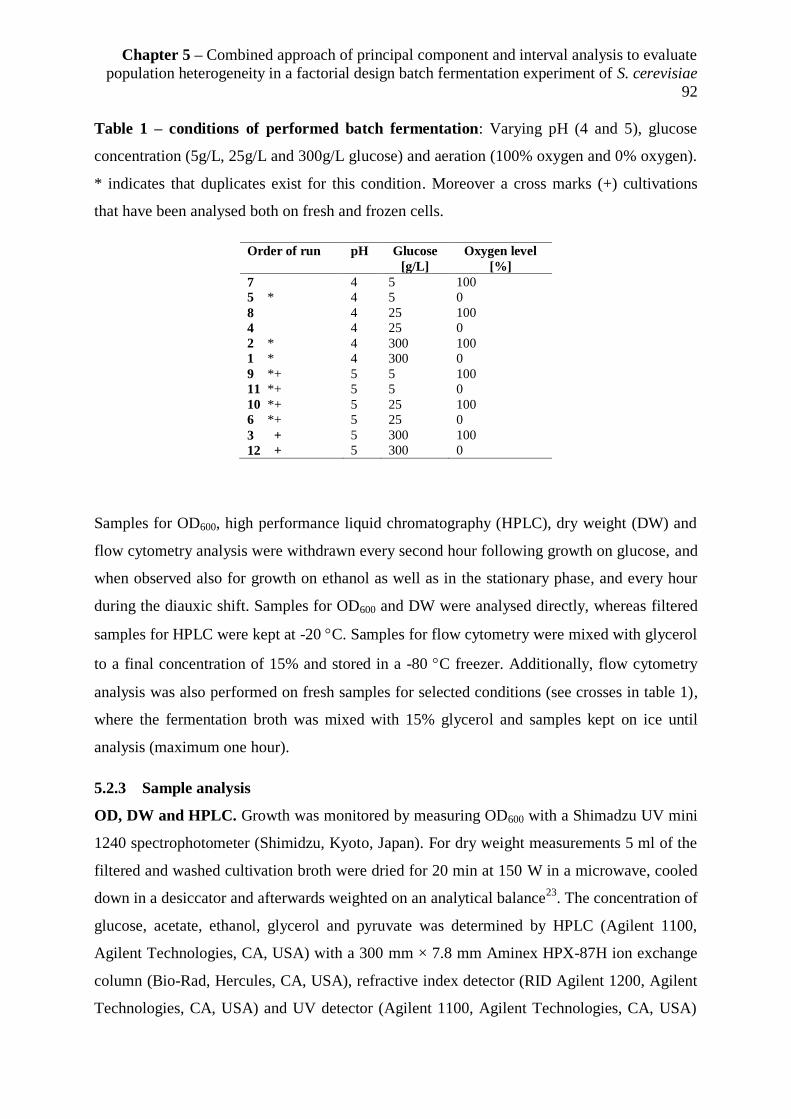
Chapter 5 – Combined approach of principal component and interval analysis to evaluate
population heterogeneity in a factorial design batch fermentation experiment of S. cerevisiae
92
Table 1 – conditions of performed batch fermentation: Varying pH (4 and 5), glucose
concentration (5g/L, 25g/L and 300g/L glucose) and aeration (100% oxygen and 0% oxygen).
* indicates that duplicates exist for this condition. Moreover a cross marks (+) cultivations
that have been analysed both on fresh and frozen cells.
Order of run pH Glucose
[g/L]
Oxygen level
[%]
7 4 5 100
5 * 4 5 0
8 4 25 100
4 4 25 0
2 * 4 300 100
1 * 4 300 0
9 *+ 5 5 100
11 *+ 5 5 0
10 *+ 5 25 100
6 *+ 5 25 0
3 + 5 300 100
12 + 5 300 0
Samples for OD600, high performance liquid chromatography (HPLC), dry weight (DW) and
flow cytometry analysis were withdrawn every second hour following growth on glucose, and
when observed also for growth on ethanol as well as in the stationary phase, and every hour
during the diauxic shift. Samples for OD600 and DW were analysed directly, whereas filtered
samples for HPLC were kept at -20 C. Samples for flow cytometry were mixed with glycerol
to a final concentration of 15% and stored in a -80 C freezer. Additionally, flow cytometry
analysis was also performed on fresh samples for selected conditions (see crosses in table 1),
where the fermentation broth was mixed with 15% glycerol and samples kept on ice until
analysis (maximum one hour).
5.2.3 Sample analysis
OD, DW and HPLC. Growth was monitored by measuring OD600 with a Shimadzu UV mini
1240 spectrophotometer (Shimidzu, Kyoto, Japan). For dry weight measurements 5 ml of the
filtered and washed cultivation broth were dried for 20 min at 150 W in a microwave, cooled
down in a desiccator and afterwards weighted on an analytical balance23
. The concentration of
glucose, acetate, ethanol, glycerol and pyruvate was determined by HPLC (Agilent 1100,
Agilent Technologies, CA, USA) with a 300 mm × 7.8 mm Aminex HPX-87H ion exchange
column (Bio-Rad, Hercules, CA, USA), refractive index detector (RID Agilent 1200, Agilent
Technologies, CA, USA) and UV detector (Agilent 1100, Agilent Technologies, CA, USA)

Chapter 5 – Combined approach of principal component and interval analysis to evaluate
population heterogeneity in a factorial design batch fermentation experiment of S. cerevisiae
93
set to 210 nm. The mobile phase was 5 mM H2SO4 (aq.), with a temperature of 60°C and a
flow rate of 0.6 mL/min. The composition of the off-gas from batch cultivations was
monitored by a MS gas analyzer with multiplexer (Thermo Prima SigmaV).
Flow cytometry. A FACSAria™ III (Becton-Dickinson, NJ, USA) flow cytometer was used
for single-cell analysis. Excitation wavelength for the laser was set to 488 nm. Two scattering
channels (FSC and SSC) and two fluorescent detection channels were used in the analysis.
Fluorescence emission levels were measured using a band pass filter at 530±30 nm. Light
scattering and fluorescence levels were standardised using 2.5 µm fluorescent polystyrene
beads. Samples for flow cytometry were centrifuged for 1 min at 3000 g and 4 C,
resuspended in 0.9 % saline solution and directly analysed. 10,000 events were recorded.
CS&T beads (Cytometer Setup and Tracking beads) (Becton Dickinson, USA) were used for
the automated QA/QC of the machine performance.
5.2.4 Data treatment and statistics
Processing and analysis of the flow cytometry data was done using MatLab® R2013a (The
MathWorks, Inc., Natick, MA, USA).
The raw data files, extracted as fcs files by the flow cytometer FACSvantage SE software,
were imported into MatLab®, using the fcs data reader function (by L.Balkay, University of
Debrecen, Hungary, available on MatLab® File Exchange website). The HPLC data was
collected in an excel file and imported into MatLab. The data from the fcs files was extracted
and saved into mat files including the recorded GFP fluorescence for all performed
experiments. For the evaluation of GFP fluorescence data histogram plots for the GFP
fluorescence samples were generated using the hist function and followed by plotting the
relative cell count per channelnumber (1024 recording channels). In the following the
histogram plot area was divided into five different parts and the percentage of GFP
fluorescent cells in each of the parts calculated. The percentage values have been collected in
a matrix for all conditions respectively for pH 5 for fresh and frozen analysed cells.
Afterwards principal component analysis (PCA) was performed to get an overview of the data
and to detect a possible underlying pattern. Prior to this autoscaling and centering of the data
was performed. Results have been plotted as score and loading plots for the first two principal
components and the fluorescence patterns have been evaluated and the main clusters were
manually gated.

Chapter 5 – Combined approach of principal component and interval analysis to evaluate
population heterogeneity in a factorial design batch fermentation experiment of S. cerevisiae
94
5.3 Results
12 cultivations with the S. cerevisiae reporter strain FE440 have been carried out under
different conditions, varying pH (4 and 5) , glucose concentration (5g/L, 25g/L and 300g/L)
and aeration (100% O2 or 100% N2). First the general physiology under different conditions
will be shortly discussed followed by the presentation and analysis of GFP fluorescence
profiles throughout the batch experiments. Thereby the in this study presented method
combining principal component analysis and interval analysis will be shortly explained.
Afterwards its application will be demonstrated comparing the GFP fluorescence for pH 5 for
cells kept on ice (referred to as fresh cells) and also after exposure to freeze-thaw stress
(referred to as frozen cells). The latter can provide information about cell membrane
robustness, as earlier a strong inverse correlation between growth and cell membrane
robustness was observed7. Afterwards GFP fluorescence for frozen cells for all performed
batch cultivations will be compared.
5.3.1 Physiological characteristics of the batch cultivations
The S. cerevisiae reporter strain FE440 was cultivated in batch experiments applying 12
different conditions (see table 1). Figure 1 shows four representative profiles: two profiles for
pH 5 and 5 g/L of glucose both under aerobic and anaerobic conditions, and one profile at pH
5 and 25 g/L of glucose under aerobic conditions (low gravity cultivation), and one profile at
pH 5 and 300g/L glucose under aerobic conditions (high gravity cultivation).
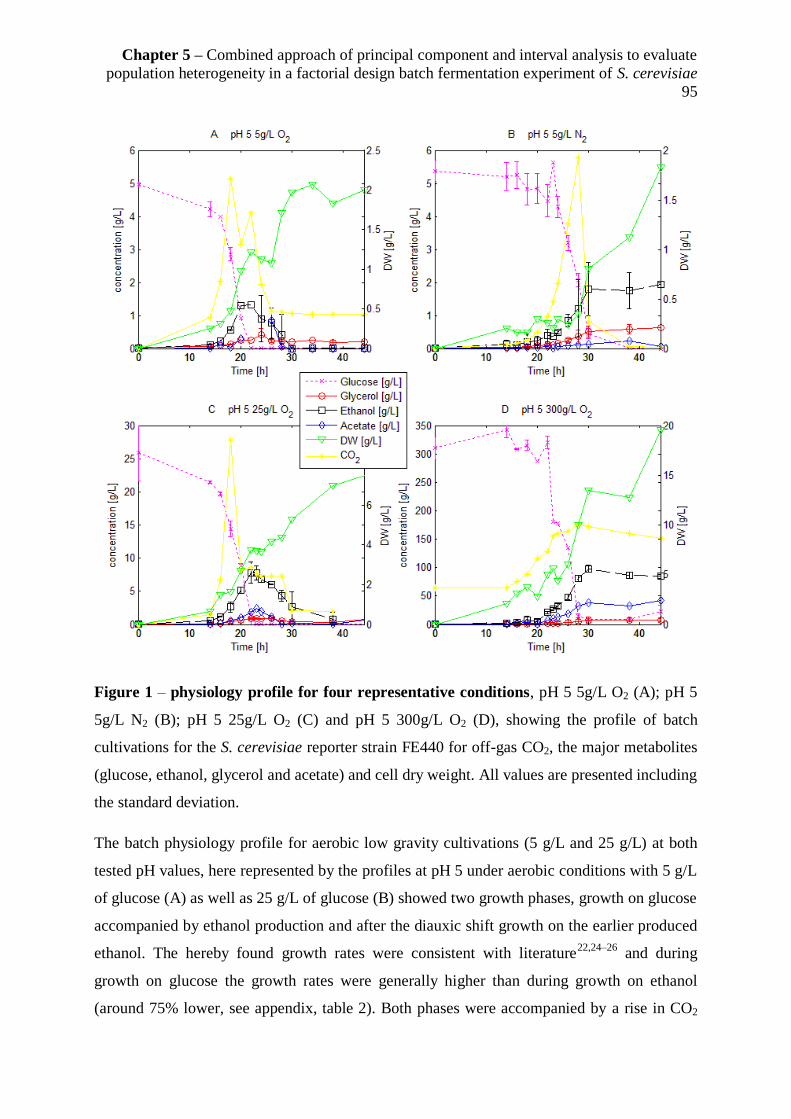
Chapter 5 – Combined approach of principal component and interval analysis to evaluate
population heterogeneity in a factorial design batch fermentation experiment of S. cerevisiae
95
Figure 1 – physiology profile for four representative conditions, pH 5 5g/L O2 (A); pH 5
5g/L N2 (B); pH 5 25g/L O2 (C) and pH 5 300g/L O2 (D), showing the profile of batch
cultivations for the S. cerevisiae reporter strain FE440 for off-gas CO2, the major metabolites
(glucose, ethanol, glycerol and acetate) and cell dry weight. All values are presented including
the standard deviation.
The batch physiology profile for aerobic low gravity cultivations (5 g/L and 25 g/L) at both
tested pH values, here represented by the profiles at pH 5 under aerobic conditions with 5 g/L
of glucose (A) as well as 25 g/L of glucose (B) showed two growth phases, growth on glucose
accompanied by ethanol production and after the diauxic shift growth on the earlier produced
ethanol. The hereby found growth rates were consistent with literature22,24–26
and during
growth on glucose the growth rates were generally higher than during growth on ethanol
(around 75% lower, see appendix, table 2). Both phases were accompanied by a rise in CO2

Chapter 5 – Combined approach of principal component and interval analysis to evaluate
population heterogeneity in a factorial design batch fermentation experiment of S. cerevisiae
96
and biomass production as well as glycerol and acetate production during growth on glucose.
Glycerol and acetate were also found in other studies to accompany overflow metabolism27,28
.
In the second growth phase on ethanol, the produced acetate was consumed whereas the
glycerol concentration remained constant. The diauxic shift took place after around 20-22h
and the cultures reached stationary phase after around 30-33h.
In contrast to that, anaerobic low gravity cultivations (5g/L and 25g/L) as well as aerobic and
anaerobic high gravity cultivations (300g/L glucose) exhibited only one growth phase
consuming the glucose in the medium while producing ethanol. The growth rates for
anaerobic low gravity cultivations were consistent with literature26
and in general lower than
for the corresponding aerobic cultivations, whereas for high gravity cultivations, apart from
the fact that the growth rates were in general lower than for low gravity cultivations, no clear
growth rate trend could be seen. Compared to Odman et al. (2009)22
, who found 0.17+/-0.01
h-1
for aerobic high gravity cultivations at pH 5, the growth rates observed here were slightly
higher (see appendix, table 2). After glucose depletion the ethanol remained constant and
consequently no diauxic shift was seen. Also for these cultivations growth was accompanied
by a rise in CO2 level, increasing biomass concentration as well as production of acetate and
glycerol, though in higher amounts than for aerobic low gravity cultivations which is in
agreement with other studies27,28
. Different compared to aerobic low gravity cultivations was
that the acetate as well as the ethanol were not consumed after production. The cultures
reached steady state after around 30h.
Furthermore the yields for the major metabolites as well as the carbonbalance were calculated
for the performed cultivation (see appendix, table 2). All carbonbalances could be closed with
at least 88% (referring to the one fermentation out of 12 were most carbon was missing). The
missing carbon can possibly be explained by ethanol evaporation, as earlier seen by Eliasson
et al. (2000)29
.
5.3.2 Introduction of the method describing growth correlated GFP fluorescence and
membrane robustness originating from a dual reporter strain
In the following sections first the new method for objective description and comparison of
flow cytometry data will be introduced using a part of the data set, i.e. the experiments
performed at pH 5, comparing growth correlated GFP fluorescence for cells kept on ice,
referred to as fresh cells, with GFP fluorescence of freeze-thawed cells. The fluorescence of
freeze-thawed cells, referred to as frozen cells, shows information about cell membrane
Chapter 5 – Combined approach of principal component and interval analysis to evaluate
population heterogeneity in a factorial design batch fermentation experiment of S. cerevisiae
97
robustness as a strong correlation between intracellular GFP level and cell membrane integrity
could be observed after subjecting cell samples to freeze-thaw stress7. Afterwards the
application of the method will be demonstrated comparing fluorescence of frozen cells and
thereby membrane robustness for all performed conditions.
5.3.2.1 Case one: Cell membrane robustness and growth correlated GFP fluorescence
under different conditions at pH 5
For the six different fermentation conditions performed at pH 5 cells were kept on ice (fresh
cells) as well as subjected to freeze-thaw stress until flow cytometry analysis to evaluate
growth correlated GFP fluorescence of cells with intact cell membrane respectively the
influence of freeze-thaw stress on membrane robustness. As it is general practice in single cell
studies first GFP fluorescence distributions were plotted as histogram plots for fresh cells
following the different time points of the batch cultivation under the different growth
conditions (figure 2).
In general the shape of the GFP fluorescence remained the same throughout the batch
cultivations, featuring one sharp main population with slight tailing towards higher
fluorescence. Also comparing the different conditions no distinct differences could be found.
Solely the tailing got more distinct with higher glucose concentration as well as when the
cultivations were performed under anaerobic instead of aerobic conditions. Moreover, the
mean fluorescence level abided the same throughout the batch for the high gravity
cultivations, around 400 for aerobic respectively 350 for anaerobic cultivations, as well as for
the anaerobic low gravity cultivations (around 330-350). In contrast to that the mean
fluorescence slightly declined for aerobic low gravity cultivations when the glucose was
depleted (from around 350-360 to 320-330) and cells underwent diauxic shift, leading to
redistribution of cellular components. Afterwards, at the beginning of the ethanol
consumption phase the GFP fluorescence further decreased before remaining constant until
ethanol depletion. This fluorescence pattern was also found during batch cultivations for
characterising the strain FE4407.
Considering the level of heterogeneity within the GFP fluorescence distribution, meaning the
broadness of the distribution, an increase was found with increasing cultivation time
especially after glucose depletion.
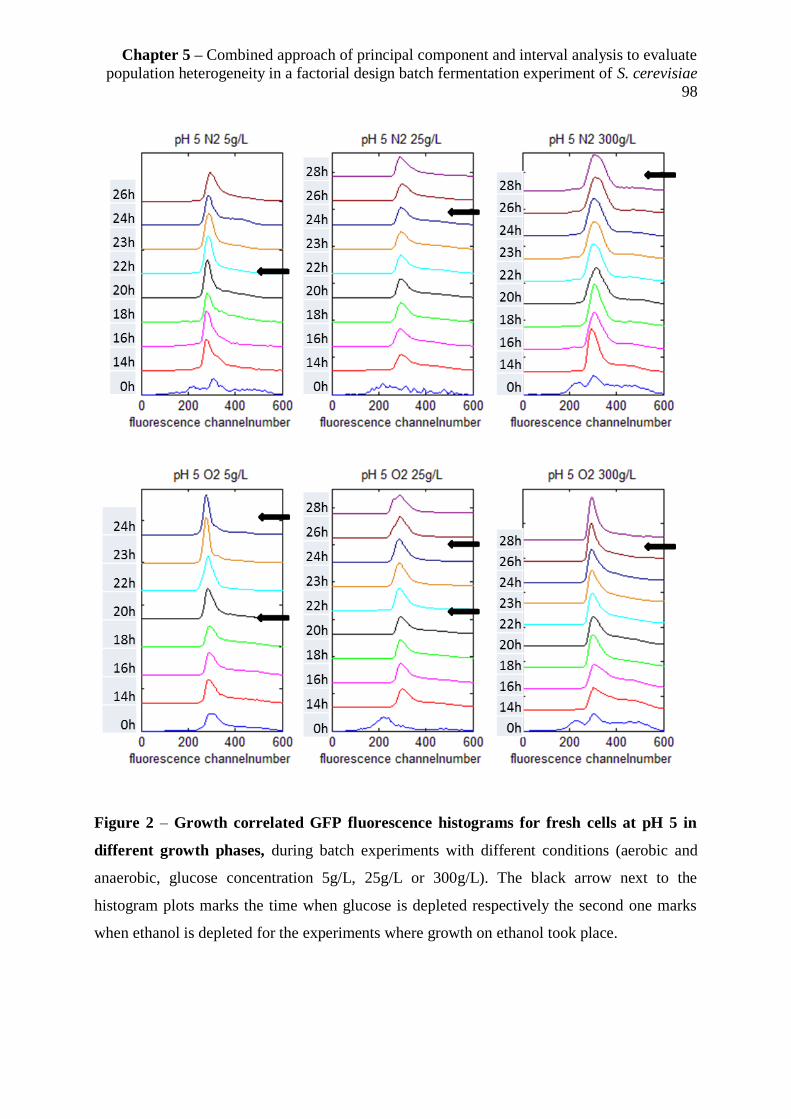
Chapter 5 – Combined approach of principal component and interval analysis to evaluate
population heterogeneity in a factorial design batch fermentation experiment of S. cerevisiae
98
Figure 2 – Growth correlated GFP fluorescence histograms for fresh cells at pH 5 in
different growth phases, during batch experiments with different conditions (aerobic and
anaerobic, glucose concentration 5g/L, 25g/L or 300g/L). The black arrow next to the
histogram plots marks the time when glucose is depleted respectively the second one marks
when ethanol is depleted for the experiments where growth on ethanol took place.

Chapter 5 – Combined approach of principal component and interval analysis to evaluate
population heterogeneity in a factorial design batch fermentation experiment of S. cerevisiae
99
To compare the GFP fluorescence distribution of fresh S. cerevisiae cells to cells that were
subjected to freeze-thaw stress (frozen cells) in a more quantitative way than the above used
histogram plots for the different performed conditions and at different time points within each
batch cultivation, an interval analysis was developed. Thereby the fluorescence distribution
histograms, which represent channel number fluorescence against cell count, were divided
into five channel number intervals (1-200, 200-400, 400-600, 600-800 respectively 800-1024)
and the percentage of cell count in each interval was calculated (figure 3A). Results can be
illustrated as a barplot, which contains one bar for each batch sampling time point, adding up
to 100% when combining the percentage of cells in each of the five intervals of the histogram
(figure 3B).
Figure 3 – Example demonstrating GFP fluorescence conversion from histogram to
barplot for interval analysis: for pH 5 O2 5g/L during the different growth phases of a batch
experiments. The left plot (A) shows histogram plots throughout the batch which are divided
into five intervals (indicated by blue lines). The right plot shows the corresponding barplot
(B), displaying the percentage of fluorescent cells in each of the five intervals.
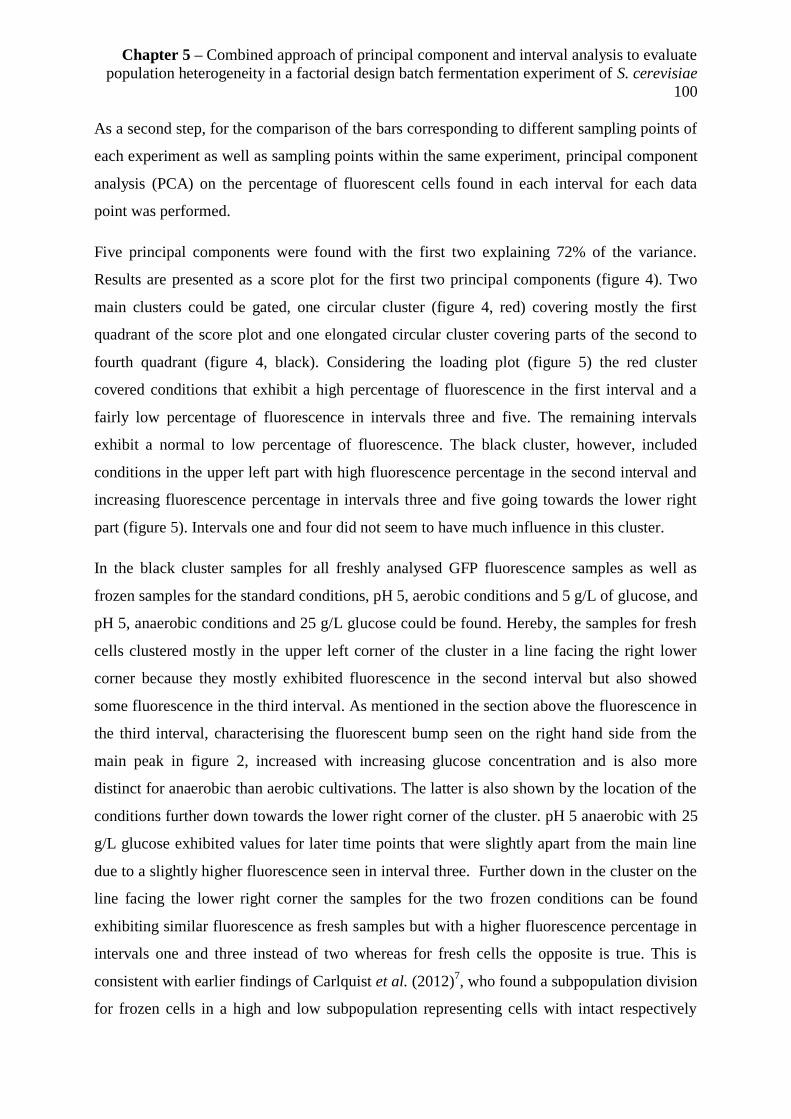
Chapter 5 – Combined approach of principal component and interval analysis to evaluate
population heterogeneity in a factorial design batch fermentation experiment of S. cerevisiae
100
As a second step, for the comparison of the bars corresponding to different sampling points of
each experiment as well as sampling points within the same experiment, principal component
analysis (PCA) on the percentage of fluorescent cells found in each interval for each data
point was performed.
Five principal components were found with the first two explaining 72% of the variance.
Results are presented as a score plot for the first two principal components (figure 4). Two
main clusters could be gated, one circular cluster (figure 4, red) covering mostly the first
quadrant of the score plot and one elongated circular cluster covering parts of the second to
fourth quadrant (figure 4, black). Considering the loading plot (figure 5) the red cluster
covered conditions that exhibit a high percentage of fluorescence in the first interval and a
fairly low percentage of fluorescence in intervals three and five. The remaining intervals
exhibit a normal to low percentage of fluorescence. The black cluster, however, included
conditions in the upper left part with high fluorescence percentage in the second interval and
increasing fluorescence percentage in intervals three and five going towards the lower right
part (figure 5). Intervals one and four did not seem to have much influence in this cluster.
In the black cluster samples for all freshly analysed GFP fluorescence samples as well as
frozen samples for the standard conditions, pH 5, aerobic conditions and 5 g/L of glucose, and
pH 5, anaerobic conditions and 25 g/L glucose could be found. Hereby, the samples for fresh
cells clustered mostly in the upper left corner of the cluster in a line facing the right lower
corner because they mostly exhibited fluorescence in the second interval but also showed
some fluorescence in the third interval. As mentioned in the section above the fluorescence in
the third interval, characterising the fluorescent bump seen on the right hand side from the
main peak in figure 2, increased with increasing glucose concentration and is also more
distinct for anaerobic than aerobic cultivations. The latter is also shown by the location of the
conditions further down towards the lower right corner of the cluster. pH 5 anaerobic with 25
g/L glucose exhibited values for later time points that were slightly apart from the main line
due to a slightly higher fluorescence seen in interval three. Further down in the cluster on the
line facing the lower right corner the samples for the two frozen conditions can be found
exhibiting similar fluorescence as fresh samples but with a higher fluorescence percentage in
intervals one and three instead of two whereas for fresh cells the opposite is true. This is
consistent with earlier findings of Carlquist et al. (2012)7, who found a subpopulation division
for frozen cells in a high and low subpopulation representing cells with intact respectively

Chapter 5 – Combined approach of principal component and interval analysis to evaluate
population heterogeneity in a factorial design batch fermentation experiment of S. cerevisiae
101
disrupted membrane as a consequences of freeze thaw stress. Considering the different growth
phases during the batch, illustrated by the increasing size of the markers for the samples in the
PCA, in general for fresh cells no significant difference can be seen apart from a small
downshift in fluorescence for later time points for aerobic low gravity cultivations which was
also seen from the histogram plots (figure 4).
The red cluster included the remaining frozen GFP fluorescence samples, but interestingly
samples taken close to glucose depletion almost consistently, apart from aerobic high gravity
cultivations, spread in the closer vicinity of the border to the black cluster (figure 4). Hereby
the aerobic cultivation with 25 g/L and the anaerobic cultivation with 5 g/L (low gravity
cultivations) exhibited a similar fluorescence profile to fresh cells (high vicinity of samples to
the border of the black cluster) but with higher fluorescence in the first and third interval in
the exponential growth phase which was later shifting down to the first and mostly second
interval (figure 4). For the anaerobic high gravity cultivation the GFP fluorescence was high
(mostly fourth interval) at the beginning of the cultivation, but with also a subpopulation of
cells with fluorescence in the second interval. During exponential growth on glucose the
fluorescence shifted down (mostly first, second and third interval) and decreased even further
after glucose depletion (mostly first and second interval). For aerobic high gravity cultivation
a similar but even stronger trend was seen with a significant downshift in fluorescence during
exponential growth on glucose (third interval to mostly first and second) and even more
distinct after glucose depletion (mostly first interval).
In general, when comparing anaerobic and aerobic cultivations no clear trend can be seen that
would indicate that anaerobic or aerobic cultivations exhibit similar characteristics. Opposite
to this, cultivations with different glucose concentration can be grouped in high and low
gravity cultivations exhibiting different GFP fluorescence characteristics.

Chapter 5 – Combined approach of principal component and interval analysis to evaluate
population heterogeneity in a factorial design batch fermentation experiment of S. cerevisiae
102
Figure 4 – Score plot for PCA (Principal component analysis) of GFP fluorescence for
the comparison of fresh and freeze-thawed cells for batch experiments performed at pH 5.
Four principal components have been found. The scores for the first two principal
components (together 72% of variance explained) are plotted against each other. The black
and red circles indicate gates for the cluster seen in the distribution. The increasing marker
size for each experiment is indicating samples taken at later time points in a batch experiment.

Chapter 5 – Combined approach of principal component and interval analysis to evaluate
population heterogeneity in a factorial design batch fermentation experiment of S. cerevisiae
103
Figure 5 – Loading plot for PCA (Principal component analysis) of GFP fluorescence for
the comparison of fresh and freeze-thawed cells for batch experiments performed at pH 5.
Four principal components have been found. The loadings for the first two principal
components (together 72% of variance explained) are plotted against each other.
5.3.2.2 Case two: GFP fluorescence distributions of frozen cells for all performed
experiments
As a second case study the developed method is applied for the comparison between frozen
cells of all performed batch conditions. Five principal components were found with the first
two explaining 74% of the variance. Results are again presented as a score plot for the first
two principal components (figure 6). Three main clusters could be gated (figure 6, red, green
and black), all with oval shape. The biggest one (figure 6, red) covered the bottom area of the
score plot (quadrant two and three). The two smaller ones (figure 6, green and black) lay in
the top part of the score plot, the black one covered the intersection between the first and the
fourth quadrant whereas the green one pointed right downwards on the intersection between
the first and the second quadrant. Considering the loading plot (figure 7) the red cluster
covered conditions that exhibit a high percentage of fluorescence in the first interval and low
until middle percentage of fluorescence in intervals three, four and five. Interval two in this
case did not show significant fluorescence in this cluster. In contrast to that the black cluster
covered conditions that exhibited higher fluorescence in the second interval as well as some in

Chapter 5 – Combined approach of principal component and interval analysis to evaluate
population heterogeneity in a factorial design batch fermentation experiment of S. cerevisiae
104
interval three four and five but only minor in the first interval. Consequently for the
conditions that were found in the green cluster the major part of the GFP fluorescence
percentage was found in intervals three, four and five, with increasing fluorescence in the
third interval when clustered closer to the right lower border of the cluster (figure 6 and 7).
The black cluster contained low gravity cultivations for both pH values apart from some
earlier time points of the anaerobic cultivations with 5 g/L and 25 g/L glucose at pH 5 and the
aerobic cultivation with 5 g/L glucose at pH 5. However the aerobic cultivations were found
to settle in the vicinity of the black and green cluster. In the black cluster cells mostly showed
similar fluorescence to fresh cells (fluorescence in the second interval) especially for pH 4.
But with increasing pH and under aerobic conditions also a subpopulation division is found
with fluorescence in the first and third interval, which is increasing in the low interval towards
the end of the cultivations, especially after glucose depletion. Therefore, later sampling points
were found to be closer to the red cluster.
The red cluster included anaerobic high gravity cultivations for pH 4 and partly pH 5, the
middle time points for anaerobic low gravity cultivation (5 g/L) at pH 5 as well as the aerobic
high gravity cultivation for pH 5. For these conditions cells were found to exhibit fairly high
fluorescence in the first interval, being largely affected by the freeze-thaw procedure. It needs
to be mentioned, though, that these conditions at the beginning of the batch, before
exponential growth on glucose set in, also resulted in a population of cells with high
fluorescence in the third and fourth interval (figure 6). Samples were in this case found in the
upper part of the cluster in the vicinity of the black and the green cluster. First during growth
on glucose as well as even more after its depletion the fluorescence decreases sharply.
The green cluster contained, apart from single time-points of anaerobic cultivations at the
beginning of the batch cultivation, the aerobic high gravity cultivations for pH 4 as well as the
middle time-points for anaerobic high gravity and aerobic low gravity cultivation (5 g/L
glucose) at pH 5. These conditions are consequently characterised by a fluorescence
distribution in the middle fluorescence range, but with increased fluorescence in the third
interval for the high gravity cultivation at pH 4. Furthermore, as for the other clusters the GFP
fluorescence level mostly decreased with glucose depletion, moving the fluorescence
percentage to lower intervals respectively to the borders of the cluster facing the red or black
cluster (figure 6).
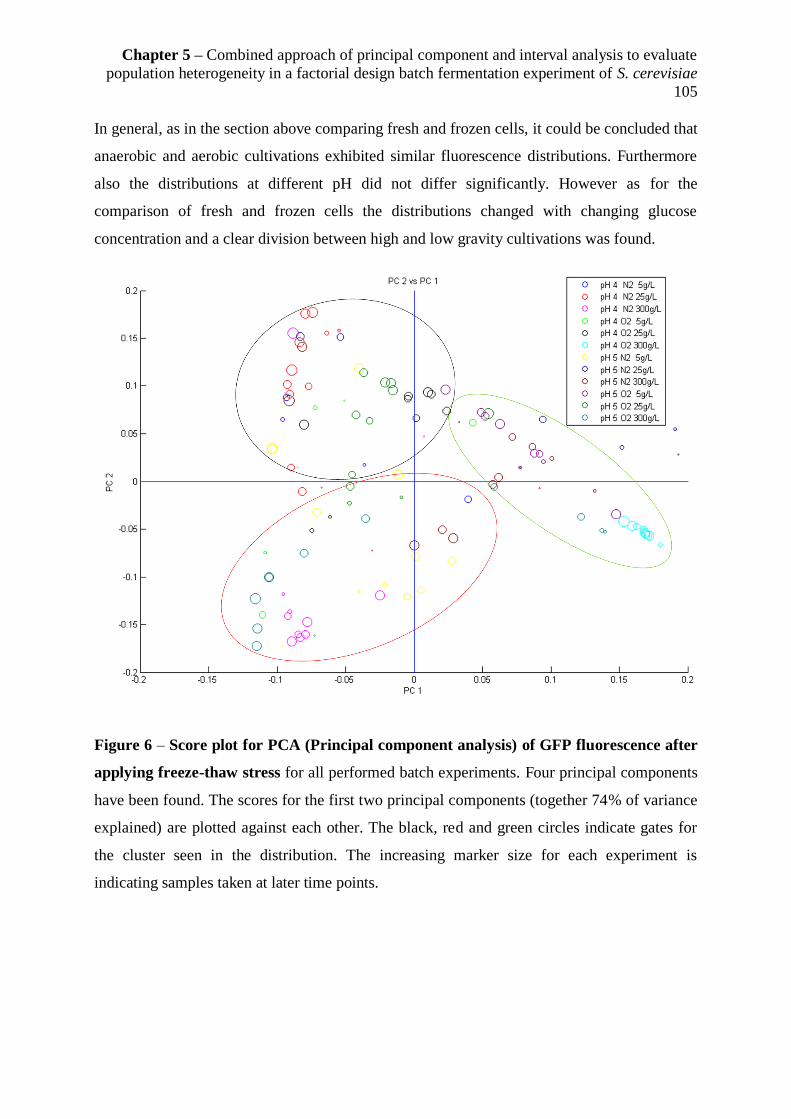
Chapter 5 – Combined approach of principal component and interval analysis to evaluate
population heterogeneity in a factorial design batch fermentation experiment of S. cerevisiae
105
In general, as in the section above comparing fresh and frozen cells, it could be concluded that
anaerobic and aerobic cultivations exhibited similar fluorescence distributions. Furthermore
also the distributions at different pH did not differ significantly. However as for the
comparison of fresh and frozen cells the distributions changed with changing glucose
concentration and a clear division between high and low gravity cultivations was found.
Figure 6 – Score plot for PCA (Principal component analysis) of GFP fluorescence after
applying freeze-thaw stress for all performed batch experiments. Four principal components
have been found. The scores for the first two principal components (together 74% of variance
explained) are plotted against each other. The black, red and green circles indicate gates for
the cluster seen in the distribution. The increasing marker size for each experiment is
indicating samples taken at later time points.

Chapter 5 – Combined approach of principal component and interval analysis to evaluate
population heterogeneity in a factorial design batch fermentation experiment of S. cerevisiae
106
Figure 7 – Loading plot for PCA (Principal component analysis) of GFP fluorescence
after the application of freeze-thawed cells for all performed batch experiments. Four
principal components have been found. The loadings for the first two principal components
(together 74% of variance explained) are plotted against each other.
5.4 Discussion
Different growth and stress conditions in a bioreactor are generally found to influence the
physiology of microbial cells and thereby the underlying population heterogeneity
distributions7,30,31
. Here we successfully developed a method employing principal component
and interval analysis to investigate single cell physiology of the S. cerevisiae dual reporter
FE440 in batch cultivations under different conditions. With the used approach the problem of
interpretation of the considerable amounts of data resulting from the flow cytometry analysis
could be scaled down and single cell growth heterogeneities and cell membrane robustness
could be evaluated.
5.4.1 Usefulness of the approach for data analysis
The use of flow cytometry to follow single cell distributions of growth and cell membrane
robustness in different batch growth phases and under different conditions created
multidimensional data especially for the flow cytometry analysis that needed to be converted
to a comparable format. Principal component analysis (PCA) can help to reduce the amount of

Chapter 5 – Combined approach of principal component and interval analysis to evaluate
population heterogeneity in a factorial design batch fermentation experiment of S. cerevisiae
107
variables by creating new variables that makes it easier to compare data points to each other33
.
Data like flow cytometry data exhibiting distributions of 10000 counted cell events at every
sampling point throughout the batch are difficult to be converted to meaningful variables that
can be used as input for the PCA, as e.g. taking simple mean fluorescence values would fail to
describe the whole population dynamics. Therefore it was chosen to introduce an interval
analysis that has been used in a similar way in an approach to evaluate biplots of GFP
fluorescence and cell size (FSC) before7. Histograms were divided into five fluorescence
areas and the percentage of fluorescence cells in each interval compared to the fluorescence in
the whole histogram was calculated. In this way more descriptive information could be
gathered compared to simple mean values, also capturing possible shifts of the fluorescent
population, shapes that spread over more than one interval and appearance of subpopulations
while scaling down multiple data points to five values per sample. This facilitated the
comparison between different conditions because now by using PCA single values containing
cell distribution information could be created instead of the whole distribution.
5.4.2 Fluorescence distributions for growth and cell membrane robustness
The GFP fluorescence originating from the dual reporter system was analysed comparing
fresh and frozen cells for conditions performed at pH 5 as well as comparing frozen cells for
all performed experiments. In general for aerobic low gravity cultivation at pH 5 fresh
analysed cells can be used to follow the different phases (growth on glucose, ethanol and
stationary phase) of a batch cultivation as also found earlier7. For fresh analysed cells in
anaerobic low gravity and high gravity cultivations no significant difference between the
different growth phases could be seen. For high gravity cultivations especially, this might be
due to the fact that cells are generally more stressed and a constant high expression of
ribosomal related genes is detected due to adjustment to first the high viscosity glucose
concentration, also seen in a longer lag-phase/phase of slow growth, as well as afterwards due
to constant reorganization towards the new growth environment (e.g. low glucose
concentration, limited oxygen during growth, stationary phase). However, when comparing
cells exposed to freeze-thaw stress to evaluate cell membrane robustness to fresh cells clear
differences between cells were seen.
Fresh cells at pH 5, as mentioned above, had intact membranes, exhibiting almost constant
fluorescence levels, but seem to be more metabolically stressed or show other/higher growth
activity when grown in anaerobic low gravity or high gravity cultivations than in aerobic low

Chapter 5 – Combined approach of principal component and interval analysis to evaluate
population heterogeneity in a factorial design batch fermentation experiment of S. cerevisiae
108
gravity cultivations. This is supported by the bump with higher fluorescence for these
conditions, which is stronger developed for higher glucose concentration especially under
anaerobic conditions. However this is in disagreement with the growth rates derived from
general physiology data which were found to be significantly lower for high gravity
cultivations, which should in principle be reflected by the GFP expression. Therefore the
reporter system seems to show limitation in its applicability under extreme growth conditions
in which cells are potentially highly stressed. When exposing cells grown under different
conditions at pH 5 to freeze-thaw stress (frozen cells), low gravity cultivations mostly
resemble fresh cells considering the main fluorescent population but especially during
exponential growth on glucose they seem to contain a small amount of cells in a lower
fluorescent subpopulation. These cells seem to be highly affected in membrane integrity,
which might be due to open membrane pores during exponential growth because,
interestingly, these cells seem to recover when the culture reaches stationary phase in all
cases. A reason for this might be that cells in this phase are preparing for coping with nutrient
limitation and depletion and are therefore more robust7. A similar effect is also seen for cells
grown in high gravity cultivation, but towards the end of the exponential growth phase on
glucose the whole fluorescent cell population seems to be highly affected in membrane
integrity because the fluorescence drops sharply and remains low during stationary phase.
Possibly the high stress level cells experience and that they try to cope with the high glucose
concentration is affecting them strongly when they reach the opposite extreme of the already
above mentioned nutrient limitation or depletion.
When taking frozen cells under all performed conditions into account mostly the same trends
as for pH 5 can be seen so that it seems as the pH and oxygen level do not have a big
influence on cell membrane robustness, whereas the glucose concentration highly affects the
freeze-thaw tolerance.
5.4.3 Conclusion and Outlook
In conclusion comparing the influences of pH, oxygen level and glucose concentration on
growth heterogeneity and membrane robustness glucose seems to be the major influence, and
this mean that further studies should be focused on developing a deeper understanding of the
underlying phenomenon behind this observation e.g. by applying pulses of glucose to
chemostat cultures. Thereby its influence on single cell physiology could be studied in a
steady growth environment and potentially it could be combined with cell sorting of different

Chapter 5 – Combined approach of principal component and interval analysis to evaluate
population heterogeneity in a factorial design batch fermentation experiment of S. cerevisiae
109
subpopulations of different robustness to deeper investigate their physiology. These studies
are also of interest for industrial production processes because glucose is widely used as a
substrate.
Furthermore, combining PCA and interval analysis for the evaluation/comparison of flow
cytometry data provides a lot of information that can potentially be used in process
optimization. This could be especially interesting when using high throughput setups like
parallelized microbioreactors as well as experiments involving automated sampling e.g. using
a sampling robot.
Chapter 5 – Combined approach of principal component and interval analysis to evaluate
population heterogeneity in a factorial design batch fermentation experiment of S. cerevisiae
110
5.5 References
1. Arsköld, E. et al. Environmental influences on exopolysaccharide formation in
Lactobacillus reuteri ATCC 55730. Int. J. Food Microbiol. 116, 159–167 (2007).
2. Rohe, P., Venkanna, D., Kleine, B., Freudl, R. & Oldiges, M. An automated workflow
for enhancing microbial bioprocess optimization on a novel microbioreactor platform.
Microb. Cell Fact. 11, (2012).
3. Fazio, A. et al. Transcription factor control of growth rate dependent genes in
Saccharomyces cerevisiae: a three factor design. BMC Genomics 9, (2008).
4. Valli, M., Sauer, M., Branduardi, P., Borth, N. & Porro, D. Intracellular pH
Distribution in Saccharomyces cerevisiae Cell Populations , Analyzed by Flow
Cytometry Intracellular pH Distribution in Saccharomyces cerevisiae Cell Populations ,
Analyzed by Flow Cytometry. Appl. Environ. Microbiol. 71, 1515–1521 (2005).
5. Lara, A. R. et al. Transcriptional and metabolic response of recombinant Escherichia
coli to spatial dissolved oxygen tension gradients simulated in a scale-down system.
Biotechnol. Bioeng. 93, 372–385 (2006).
6. Schweder, T. et al. Monitoring of genes that respond to process-related stress in large-
scale bioprocesses. Biotechnol. Bioeng. 65, 151–159 (1999).
7. Carlquist, M. et al. Physiological heterogeneities in microbial populations and
implications for physical stress tolerance. Microb. Cell Fact. 11, (2012).
8. Bylund, F., Collet, E., Enfors, S.-O. & Larsson, G. Substrate gradient formation in the
large-scale bioreactor lowers cell yield and increases by-product formation. Bioprocess
Eng. 18, (1998).
9. Enfors, S. O. et al. Physiological responses to mixing in large scale bioreactors. J.
Biotechnol. 85, 175–185 (2001).
10. George, S., Larsson, G., Olsson, K. & Enfors, S.-O. Comparison of the Baker’s yeast
process performance in laboratory and production scale. Bioprocess Eng. 18, 135–142
(1998).
11. Sumner, E. R. & Avery, S. V. Phenotypic heterogeneity: differential stress resistance
among individual cells of the yeast Saccharomyces cerevisiae. Microbiology 148, 345–
351 (2002).
12. Avery, S. V. Microbial cell individuality and the underlying sources of heterogeneity.
Nat. Rev. Microbiol. 4, 577–587 (2006).
13. Fernandes, R. L. et al. Experimental methods and modeling techniques for description
of cell population heterogeneity. Biotechnol. Adv. 29, 575–599 (2011).
Chapter 5 – Combined approach of principal component and interval analysis to evaluate
population heterogeneity in a factorial design batch fermentation experiment of S. cerevisiae
111
14. Díaz, M., Herrero, M., García, L. a. & Quirós, C. Application of flow cytometry to
industrial microbial bioprocesses. Biochem. Eng. J. 48, 385–407 (2010).
15. Buziol, S. et al. New bioreactor-coupled rapid stopped-flow sampling technique for
measurements of metabolite dynamics on a subsecond time scale. Biotechnol. Bioeng.
80, 632–636 (2002).
16. Zhao, R., Natarajan, A. & Srienc, F. A flow injection flow cytometry system for on-
line monitoring of bioreactors. Biotechnol. Bioeng. 62, 609–617 (1999).
17. Rieseberg, M., Kasper, C., Reardon, K. F. & Scheper, T. Flow cytometry in
biotechnology. Appl. Microbiol. Biotechnol. 56, 350–360 (2001).
18. Wold, S., Esbensen, K. & Geladi, P. Principal component analysis. Chemom. Intell.
Lab. Syst. 2, 37–52 (1987).
19. Regenberg, B. et al. Growth-rate regulated genes have profound impact on
interpretation of transcriptome profiling in Saccharomyces cerevisiae. Genome Biol. 7,
(2006).
20. Verduyn, C., Postma, E., Scheffers, W. a & Van Dijken, J. P. Effect of benzoic acid on
metabolic fluxes in yeasts: a continuous-culture study on the regulation of respiration
and alcoholic fermentation. Yeast 8, 501–517 (1992).
21. Odman, P., Johansen, C. L., Olsson, L., Gernaey, K. V & Lantz, A. E. On-line
estimation of biomass, glucose and ethanol in Saccharomyces cerevisiae cultivations
using in-situ multi-wavelength fluorescence and software sensors. J. Biotechnol. 144,
102–112 (2009).
22. Olsson L, N. J. On Line and in situ Monitoring of Biomass in Submerged Cultivations.
Trends Biotechnol. 15, 517–522 (1997).
23. Papini, M., Nookaew, I., Siewers, V. & Nielsen, J. Physiological characterization of
recombinant Saccharomyces cerevisiae expressing the Aspergillus nidulans
phosphoketolase pathway: validation of activity through 13C-based metabolic flux
analysis. Appl. Microbiol. Biotechnol. 95, 1001–1010 (2012).
24. Van Maris, a J. et al. Modulating the distribution of fluxes among respiration and
fermentation by overexpression of HAP4 in Saccharomyces cerevisiae. FEMS Yeast
Res. 1, 139–149 (2001).
25. Bakker, B. M. et al. The mitochondrial alcohol dehydrogenase Adh3p is involved in a
redox shuttle in Saccharomyces cerevisiae. J. Bacteriol. 182, 4730–4737 (2000).
26. Costenoble, R., Valadi, H., Gustafsson, L., Niklasson, C. & Franzén, C. J.
Microaerobic glycerol formation in Saccharomyces cerevisiae. Yeast 16, 1483–1495
(2000).
27. Radler, F. & Schtitz, H. Glycerol production of various strains of Saccharomyces. Am.
Inst. Chem. Eng. 5–9 (1981).

Chapter 5 – Combined approach of principal component and interval analysis to evaluate
population heterogeneity in a factorial design batch fermentation experiment of S. cerevisiae
112
28. Eliasson, A. et al. Anaerobic Xylose Fermentation by Recombinant Saccharomyces
Mineral Medium Chemostat Cultures. Appl. Environ. Microbiol. 66, 3381–3386
(2000).
29. Lidstrom, M. E. & Konopka, M. C. The role of physiological heterogeneity in
microbial population behavior. Nat. Chem. Biol. 6, 705–712 (2010).
30. Müller, S., Harms, H. & Bley, T. Origin and analysis of microbial population
heterogeneity in bioprocesses. Curr. Opin. Biotechnol. 21, 100–113 (2010).

Chapter 5 – Combined approach of principal component and interval analysis to evaluate population heterogeneity in a factorial design
batch fermentation experiment of S. cerevisiae 113
5.6 Appendix
Table 2 - Collection of yields in [cmole/cmole] for the major metabolites (ethanol, acetate and glycerol), CO2 and dry weight as well as
the carbon-balance for all performed batch experiments including standard deviation where duplicates exist.
conditions pH 4 pH 5
5g/L 25g/L 300g/L 5g/L 25g/L 300g/L
N2 O2 N2 O2 N2 O2 N2 O2 N2 O2 N2 O2
Ys/x
[cmole/cmole]
0.23 0.22
±0.0
0.18 0.27 0.15
±0.02
0.08
±0.01
0.14
±0.01
0.3
±0.0
0.16
±0.06
0.17
±0.01
0.1 0.15
±0.01
Ys/e
[cmole/cmole]
0.33 0.38
±0.03
0.37 0.35 0.42
±0.02
0.54
±0.03
0.49
±0.01
0.39
±0.04
0.44
±0.05
0.4 ±
0.09
0.39 0.42
±0.06
Ys/g
[cmole/cmole]
0.16 0.02
±0.01
0.07 0.02 0.02
±0.01
0.05
±0.01
0.09 ±
0.0
0.08
±0.03
0.06
±0.04
0.03
±0.01
0.08 0.03
±0.01
Ys/a
[cmole/cmole]
0.01 0.06
±0.03
0.01 0.01 0.02
±0.01
0.05
±0.03
0.09
±0.06
0.07
±0.04
0.03
±0.01
0.12
±0.05
0.01 0.01
±0.06
Ys/CO2
[cmole/cmole]
0.24 0.2
±0.03
0.24 0.3 0.34 ±
0.0
0.2
±0.0
0.18
±0.03
0.18
±0.0
0.3
±0.0
0.23
±0.03
0.4 0.27
±0.03
Carbonbalance 0.97 0.88
±0.02
0.87 0.95 0.95
±0.02
0.92
±0.05
0.99
±0.05
0.98
±0.09
0.99
±0.11
0.95
±0.05
0.97 0.88
±0.13
µglucose [h-1
] 0.26 0.36
±0.07
0.29 0.34 0.17
±0.06
0.16
±0.06
0.21
±0.01
0.38
±0.01
0.30
±0.08
0.35
±0.05
0.23 0.18
±0.07
µethanol [h-1
] - 0.06
±0.02
- 0.09 - - - 0.1 ±
0.001
- 0.04
±0.0
- -

Chapter 6 – Population heterogeneity in E. coli and S. cerevisiae continuous cultivations as a
response to growth rate and glucose perturbation 114
6. Chapter
Population heterogeneity distributions in E. coli and S.
cerevisiae continuous cultivations as a response to
growth rate and glucose perturbation
Anna-Lena Heins1, Ted Johanson
1, Shanshan Han
2, Rita Lencastre Fernandes
3, Luisa Lundin
2, Gitte
E Charbon2, Magnus Carlquist
1,4, Krist V. Gernaey
3, Søren J. Sørensen
2, and Anna Eliasson Lantz
1,§
1 Department of Systems Biology, Technical University of Denmark, 2800 Kongens Lyngby,
Denmark
2 Department of Biology, Section of Microbiology, University of Copenhagen, 2100 DK,
Copenhagen, Denmark
3 Department of Chemical and Biochemical Engineering, Technical University of Denmark, 2800
Kongens Lyngby, Denmark
4 Present address: Department of Chemistry, Division of Applied Microbiology, Lund University,
221 00 Lund, Sweden
§Corresponding author
Written as journal paper
Status: Submitted

Chapter 6 – Population heterogeneity in E. coli and S. cerevisiae continuous cultivations as a
response to growth rate and glucose perturbation 115
Abstract
S. cerevisiae and E. coli growth reporter strains based on the expression of Green Fluorescent
Protein (GFP) were grown at different growth rates in glucose-limited chemostats to investigate
population heterogeneity in steady state and the effects of concentrated glucose pulses at single-cell
level using flow cytometry. Flow cytometry was thereby used for acheiving a quantitative
description thus going clearly beyond normal qualitative assessment of single cell properties. For E.
coli cells at both low and high growth rates as well as for the slow growing yeast, slight up-shifts in
fluorescence were seen after introduction of a glucose pulse, indicating that gene regulation of the
promoters primarily responded to upshifts to glucose excess. Slow growing cells responded stronger
to the transient glucose excess than fast growing cells. Cell membrane robustness was also
investigated by analysing changes in GFP fluorescence after exposure to freeze-thaw stress. Both
yeast and E. coli cells were seen to be heavily influenced by the freezing procedure at high dilution
rates, showing subpopulations with lower fluorescence than the main population, whereas at low
dilution rates they were more resilient. In addition, the glucose pulses had an instant effect in
protecting parts of the cell population of the rapidly growing yeast cells (D=0.3 h-1
) against
membrane damage. This was not seen for the slower growing yeast and E. coli cells (D=0.05 h-1
respectively D=0.1 h-1
). New tools were established to quantify population heterogeneity using a
combination of fluorescent growth reporter strains and mathematical methods. By calculating
peakwidth and coefficient of variation (CV) of the population distributions, information on the
spread of the population was obtained in a quantitative manner. The slope of the cumulative
distribution function (cdf) plots was used to quantify shifts over time and differences in peak shape.
Together these methods offer a less arbitrary way of quantifying flow cytometry data and
population heterogeneity.
Keywords: Population heterogeneity, glucose pulse, reporter strain, freezing effect, flow cytometry
6.1 Introduction
The optimization of industrial cultivation processes requires a comprehensive analysis and
understanding of the physiology of the host strain throughout the cultivation. Traditionally, this is
performed on averaged cell characteristics from samples containing millions of cells1,2
. However,
microbial cells exhibit an intrinsic cell-to-cell variability that is influenced by the cultivation
parameters but also in itself affect the overall performance of the process3. In addition, large scale
Chapter 6 – Population heterogeneity in E. coli and S. cerevisiae continuous cultivations as a
response to growth rate and glucose perturbation 116
cultivations introduce spatial heterogeneity through gradients of e.g. dissolved oxygen, substrate,
temperature and pH exposing microbial cells to rapid changes in environmental conditions as they
circulate throughout the reactor4,5
. These dynamic conditions pose metabolic stress on the cells,
which affects their metabolism and the inherent population heterogeneity6. Although this
heterogeneity has been found to be harmful for cultivation processes by reducing yields and
increasing by-product formation, there are also indications that it may be beneficial as it facilitates a
quick adaption to novel conditions2,7,8
. Transient metabolic responses of microorganisms to rapid
changes in nutrient availability have been addressed in several studies based on average population
data9–12
. It has been shown that external perturbations can have many deleterious effects such as
disturbing optimal enzyme activity levels and metabolic fluxes, destabilizing cellular structures,
affecting chemical gradients and the intracellular pH. But, it has also been shown, that it can lead to
higher stress tolerance especially in slow growing cells4,13–16
. The concomitant stress responses that
follow a perturbation are typically transient at the gene expression level and lead to new steady
state levels similar to pre-perturbation conditions even in the presence of a persistent stress17
. The
magnitude and duration of the transcriptional responses correspond with the duration and magnitude
of the perturbation18,19
. Although stress responses upon perturbation have been studied, little is
known about how changing environments affect population heterogeneity or how different
subpopulations contribute to the cultivation process3.
We have previously looked into how population heterogeneity of batch grown S. cerevisiae cells is
affected by freeze-thaw stress by comparing the GFP fluorescence, cell size as well as morphology
of fresh and frozen cells6. Whereas the cell size did not change, clear differences were seen in the
GFP fluorescence including the formation of subpopulations that were not present in fresh samples.
Especially cells in the exponential growth phase on glucose were susceptible to freeze-thaw
damage, while the slower growing cells in the ethanol growth phase were far more resilient6. This
was in accordance with literature where, in general fast growing cells are found to be more
susceptible to freeze-thaw stress20
, whereas slower growing cells tend to redistribute cellular
resources towards stress tolerance functions14,21,22
.
The aim of the present study was to gain deeper insight into how microbial population
heterogeneity related to growth and cell membrane robustness is influenced by growth rate and
changing nutrient availability, hence verifying the effect of industrial-like fluctuating conditions on
cell physiology. To enable this, reporter strains for the industrially relevant model organisms S.

Chapter 6 – Population heterogeneity in E. coli and S. cerevisiae continuous cultivations as a
response to growth rate and glucose perturbation 117
cerevisiae6 and E. coli
23 were employed and the cell responses analysed and mathematically
quantified at single cell resolution. The reporter systems are based on expression of green
fluorescent protein (GFP) coupled with ribosomal or ribosomal related promoters as these type of
promoters normally are considered to be related to growth and translational activity24
. The S.
cerevisiae reporter system (FE440) may in addition be used for analysis of cell membrane
robustness as a loss of GFP signal in cells has been seen to be coupled with permeabilised cell
membranes6. This dual reporter feature makes the reporter strain an interesting tool for further
investigations of cell robustness and growth responses to changes in nutrient availability. The E.
coli reporter system (MG1655/pGS20fisGFPAAV) was selected based on its ability to rapidly
respond to changing environmental conditions, avoiding a ‘memory’ effect on the evolution of gene
expression as seen in a prior investigation23
. Furthermore, it has been demonstrated that the
behaviour of both reporter systems depends on the operating mode of the bioreactor6,25
. The state of
the individual cells is reflected in the expression of the reporter protein, which can be followed by
its fluorescence by using flow cytometry. Furthermore, by applying freeze-thaw stress prior to flow
cytometry analysis, membrane robustness can be examined.
The use of flow cytometry generates large amounts of data as it enables the analysis of thousands of
cells per second acquiring and recording big amounts of data related to several different properties
(as forward scatter, side scatter and fluorescence) per cell. However, data collected in this way are
generally illustrated as single parameter histograms or in plots where two parameters are correlated,
such as biplots, scatterplots or contourplots26,27
. This makes data interpretation subjective and it
becomes difficult to compare samples. Here we present new tools to quantify population
heterogeneity using a combination of reporter strains and mathematical methods.
6.2 Materials and Methods
S. cerevisiae reporter strain FE4406 and E. coli MG1655/pGS20PfisGFPAAV
23 were used
throughout this study. The integrated S. cerevisiae reporter system (FE440) is based on expression
of the stable eGFP, exhibiting a bright signal, under the control of the ribosomal RPL22a promoter6.
The E. coli reporter system (MG1655/pGS20fisGFPAAV) is of a slightly different nature using the
fis promotor to express an unstable green fluorescent protein from a low copy number plasmid23
.
The fis promoter controls the expression of a transcriptional activator that in turn activates the
bacterial ribosomal promoter rrnB P. The destabilized GFPAAV variant of GFP was chosen as it
Chapter 6 – Population heterogeneity in E. coli and S. cerevisiae continuous cultivations as a
response to growth rate and glucose perturbation 118
permits the observation of rapid downshifts, however, a plasmid based expression system was
deemed necessary to achieve a sufficiently high GFP fluorescence23
. In all E. coli cultivations, 25
μg/mL of chloramphenicol (stock concentration: 50 mg/ml in 96% ethanol) was added to the
medium to keep the selection pressure.
6.2.1 Cultivation conditions
Pre-culture. S. cerevisiae: A single colony was picked from a plate with minimal medium and used
to inoculate a 0.5 L baffled shake flask with 100 ml of defined mineral medium containing 7.5 g/L
(NH4)2SO4, 14.4 g/L KH2PO4, 0.5 g/L MgSO4*H2O, 2 ml/L trace metal solution, 1 ml/L vitamin
solution and 10 g/L glucose 28
. The pre-culture was incubated in an orbital shaker at 150 rpm and
30°C until mid-exponential phase (approximately 10 h) and directly used for inoculation.
E. coli: The E. coli inoculum was obtained by a two-step procedure. First, a single colony from a
fresh LB plate was used to inoculate a 100 mL Luria-Bertani broth containing shake flask at 37ºC
and was grown overnight. A serial dilution with 10-fold steps was then prepared from the overnight
culture and the tubes were incubated at 37ºC for 6 to 8 hours in an orbital shaker (180 rpm). The
optical density was subsequently measured and the tube grown to an OD600 between 0.4 and 0.6 was
used to inoculate the bioreactors.
Chemostats. S. cerevisiae: Aerobic, glucose-limited, level-based chemostats with 5 different
dilution rates (D= 0.05/0.1/0.2/0.25/0.3 h-1
) were performed in duplicates using 1 L bioreactors
(Sartorius, B. Braun Biotech International, GmbH, Melsungen, Germany) with a working volume of
1 L. pH and DOT electrodes (Mettler Toledo, OH, USA) were calibrated according to standard
procedures provided by the manufacturer using two point calibration (pH 4 and 7, gassing with
oxygen (100%) and nitrogen (0%), respectively). The growth medium was a defined mineral
medium according to Verduyn et al. (1992)28
with 5 g/L glucose. The OD600 for inoculation was
0.001. The pH was adjusted and kept constant at 5.0 using 2 M NaOH. Temperature, aeration and
stirring were kept constant at 30°C, 1 v/vm and 600 rpm.
E. coli: Glucose-limited chemostat cultures were inoculated with an OD600 of 0.01 and operated at
37 °C in the same bioreactor setup as for yeast but with a working volume of 0.6 L. The growth
medium was a defined mineral medium29
containing 4.5 g/L glucose, 2 g/L Na2SO4, 2.468 g/L
(NH4)2SO4, 0.5 g/L NH4Cl, 14.6 g/L K2HPO4, 3.6 g/L NaH2PO4*H2O, 1 g/L (NH4)2-H-Citrate, 50

Chapter 6 – Population heterogeneity in E. coli and S. cerevisiae continuous cultivations as a
response to growth rate and glucose perturbation 119
µL Sigma 204 Antifoam and 0.1 g/L thiamine. After autoclavation, 3 mL MgSO4, 1 mL trace metal
solution and 25 µg/ml chloramphenicol (stock concentration: 50 mg/L, diluted in 96 % ethanol) was
sterile filtered (0.2 µm) into the medium. The trace metal solution contained 0.5 g/L CaCl2*H2O,
0.18 g/L ZnSO4*7H2O, 0.1 g/L MnSO4*H2O, 20.1 g/L Na2EDTA, 16.7 g/L FeCl3*6H2O, 0.16 g/L
CuSO4*5H2O and 0.18 g/L CoCl2*6H2O. Aeration and agitation speed were kept constant at 1 v/vm
and 1000 rpm to avoid oxygen limitation.
The batch phase of both yeast and E. coli cultivations was followed by OD600 measurement for
determination of biomass concentration and continuous analysis of the off-gas composition by a
Mass spectrometer (Prima Pro Process MS, Thermo Fisher Scientific, Winsford UK). After glucose
depletion, detected as a rapid drop in the CO2 content of the off gas, the cultures were switched to
chemostat mode by applying a feed with the same medium as used for the batch with the flow rate
set to achieve the desired dilution rate. The volume was kept constant by a level based outlet.
Steady state was considered established when dry weight, dissolved oxygen tension (DOT) and
exhaust gas concentration (CO2) had remained constant for at least three residence times. After
confirming steady state, all cultures were perturbed by addition of a concentrated glucose solution
corresponding to a final bioreactor concentration of 1 g/L for S. cerevisiae and 0.45 g/L for E. coli.
After addition of glucose the cultivations were followed by frequent sampling (sampling time
depending on the organism, see result section).
Samples were withdrawn for OD600, high performance liquid chromatography (HPLC), dry weight
(DW) and flow cytometry analysis. Samples for OD600 and DW were analysed directly, HPLC
samples were sterile filtered and stored at -20 C. Samples for flow cytometry were mixed with
glycerol to a final concentration of 15% and frozen and stored in a -80 C freezer. For yeast, flow
cytometry analysis was also performed on fresh samples for two of the dilution rates (D= 0.05 h-1
and 0.3 h-1
), where broth was mixed with 15% glycerol and kept on ice until analysis (maximum
one hour).
6.2.2 Freezing test of E. coli samples
A freezing test was performed in shake flasks using the same minimum medium as in chemostat
cultivation. Triplicate samples were collected from each growth phase and each sample was divided
into three sub-samples: one was measured directly, one flash frozen in liquid nitrogen with 15%

Chapter 6 – Population heterogeneity in E. coli and S. cerevisiae continuous cultivations as a
response to growth rate and glucose perturbation 120
glycerol and one more slowly frozen in a -80°C freezer, also with 15% glycerol. To avoid non-
desirable degradation during the sample treatment, 20 samples were thawed at a time, then
centrifuged, and re-suspended in 0.9% NaCl. The maximum lag time between the first and the 10th
analysed sample was 10 min, during which it was assumed that the intracellular GFP concentration
was not influenced by the sample preparation. This was verified by re-analysing the first sample
after the last, givingidentical results.
6.2.3 Sample analysis
OD, DW and HPLC. Growth was monitored by measuring the OD600nm with a Shimadzu UV mini
1240 spectrophotometer (Shimadzu, Kyoto, Japan). Dry weight measurements were performed on 5
mL cultivation broth according to Olsson and Nielsen (1997)29
. The concentrations of glucose,
acetate, ethanol, glycerol and pyruvate in the broth of the S. cerevisiae cultivations were determined
by HPLC as earlier described by Carlquist et al. (2012)6. The E. coli cultivations were in addition
analysed for lactate and formate, and the glucose concentration was measured by an enzymatic
(hexokinase) colorimetric procedure (ABX Pentra Glucose HK CP).
Flow cytometry. A FACSAria™ III (Becton-Dickinson, NJ, USA) flow cytometer was used for
single-cell analysis of both yeast and bacteria. Excitation wavelength for the laser was set to 488
nm. Two scattering channels (FSC and SSC) and one fluorescent detection channels were used in
the analysis. Fluorescence emission levels were measured using a band pass filter at 530±30 nm.
Light scattering and fluorescence levels were standardised using 2.5 µm fluorescent polystyrene
beads. Samples for flow cytometry were kept on ice (fresh cells) respectively thawed on ice (frozen
cells), afterwards centrifuged for 1 min at 3000 g and 4 C, resuspended in 0.9 % saline solution
and directly analysed. E. coli cells used for investigation of pH effects on GFP fluorescence were
instead resuspended in 100 mM phosphate buffer at either pH 5.5 or pH 7, incubated 20 minutes at
room temperature and kept on ice until analysis. 20,000 and 30,000 events were recorded for yeast
and E. coli respectively. CS&T beads (Cytometer Setup and Tracking beads) (Becton Dickinson,
USA) were used for the automated QA/QC of the machine performance.
6.2.4 Data analysis
Processing and analysis of the flow cytometry raw data was performed using MatLab ® R2010b
(The MathWorks, Inc., Natick, MA, USA). The raw data was extracted as fcs files and loaded into
MatLab with the help of the readfsc function (by L. Balkay, University of Debrecen, Hungary,

Chapter 6 – Population heterogeneity in E. coli and S. cerevisiae continuous cultivations as a
response to growth rate and glucose perturbation 121
available on MatLab central file sharing). The HPLC data was collected in an excel file and
imported into MatLab. The data from the fcs files was extracted and saved into mat files including
the recorded GFP fluorescence and the FSC for each steady state and pulse experiment. The
cumulative cell distribution function (cdf) from the 1024 recording channels of the flow cytometer
was fitted to the data of the GFP fluorescence using the hist function, and afterwards applying the
cdfplot function. By applying the hist function to the 1024 recording channels cell count was saved
for all channels and plotted as channel number fluorescence for the GFP detector. Biplots for FSC
and GFP were created using this function. For achieving better quantitative data for the distributions
of GFP, the peakwidth at baseline level was calculated by searching for the borders of the peak,
which were considered as at least 25 cell counts per channel number to disregard the noise level of
the flow cytometer. By subtracting the channel numbers for the higher and lower border the
peakwidth was determined. Furthermore, the mean function was used to calculate the Mean FSC
and Mean GFP fluorescence. The normalized GFP was estimated by dividing the mean GFP by the
mean FSC. By dividing the peakwidth by the Mean GFP the coefficient of variance (CV) of the
distribution was generated. Finally the slope of the cdfplot was estimated by fitting a line to the
exponential part of the cumulative distribution of the GFP fluorescence histograms by using the
polyfit function with a degree of one. For frozen pulse samples the sub-population percentage was
computed by dividing the histogram plot into three areas, a low, middle and a high fluorescent area.
The areas were set in relation to the local minimum in the histogram between two sub-populations,
which was calculating using the min function. The middle fluorescence range was excluded to
avoid biased data and then the sub-population percentage in the low and high range was calculated
by dividing the cell amount in the sub-population by the total cell amount found in the two
fluorescence ranges. As a result of having duplicate datasets for all samples, all values and
estimated parameters were stated showing replicates.

Chapter 6 – Population heterogeneity in E. coli and S. cerevisiae continuous cultivations as a
response to growth rate and glucose perturbation 122
Table 1 - List of abbreviations
Symbol Description Unit
Cdf Cumulative distribution function -
CV Coefficient of variation [%]
D Dilution rate h-1
FSC Forward Scatter -
GFP Green flourescent protein -
rS Specific substrate uptake rate [g glucose/g cells /h]
rEthanol Specific ethanol production rate [g ethanol/g cells /h]
RT Residence time [h]
SSC Side Scatter -
YSX Growth yield on the fed substrate [cmole/cmole]
YSCO2 Yield of CO2 on the fed substrate [cmole/cmole]
YSEth Yield of ethanol on the fed substrate [cmole/cmole]
YSGly Yield of glycerol on the fed substrate [cmole/cmole]
YSAce Yield of acetate on the fed substrate [cmole/cmole]
Yspyr Yield of pyruvate on the fed substrate [cmole/cmole]

Chapter 6 – Population heterogeneity in E. coli and S. cerevisiae continuous cultivations as a
response to growth rate and glucose perturbation 123
6.3 Results
To investigate the influence of growth rate and glucose excess on microbial population
heterogeneities in growth and cell membrane robustness, glucose pulses were introduced to
glucose-limited continuous cultivations with S. cerevisiae reporter strain FE4406 and E. coli
reporter strain MG1655/pGS20PfisGFPAAV23
after characterization of steady state.
Cultivations with both low and high dilution rates were performed to compare responses of cells in
fully respiratory versus respiro-fermentative growth. The low dilution rates corresponded to
approximately 13% of the maximum specific growth rate (i.e. D = 0.05 and 0.1 h-1
) and the high
dilution rates to about 77% (D = 0.3 and 0.51 h-1
) for S. cerevisiae and E. coli, respectively. In
addition, an additional dilution rate, 0.36 h-1
, which roughly corresponded to the rate where
overflow metabolism sets in in E. coli 30
as well as three dilution rates in between high and low for
yeast, were included in the evaluation to further examine the influence of growth rate.
6.3.1 Physiology and GFP fluorescence distribution for S. cerevisiae cells at steady-state
conditions
To ensure the accuracy of the performed S. cerevisiae cultivations, the yields on glucose for steady
state yeast cultivations were calculated for cell mass, CO2, ethanol and acetate as well as the uptake
and production rate of glucose and ethanol, all shown in table 2. Carbon balances were calculated
from the yield coefficients to confirm data consistency.

Chapter 6 – Population heterogeneity in E. coli and S. cerevisiae continuous cultivations as a
response to growth rate and glucose perturbation 124
Table 2 - Yields (ratios of cell mass, CO2, ethanol and acetate produced on amount of
consumed substrate) and carbon balances, as well as consumption respectively production
rates for glucose and ethanol for aerobic glucose-limited continuous cultivations of S.
cerevisiae FE440 at different dilution rates (D= 0.05/0.1/0.2/0.25/0.3 h-1
). All data are presented
as mean values including standard deviations and originate from two independent cultivations and
include samples taken over a minimum of three distinct residence times.
Chemostat
parameter
D=0.05 h-1
D=0.1 h-1
D=0.2 h-1
D=0.25 h-1
D=0.3 h-1
YSX [cmole/cmole] 0.58±-0.02 0.56± 0.06 0.60± 0.01 0.35± 0.02 0.22± 0.01
YSCO2
[cmole/cmole]
0.53± 0.02 0.40± 0.04 0.38± 0.01 0.35± 0.01 0.27± 0.01
YSEth
[cmole/cmole]
- - - 0.22± 0.01 0.42± 0.01
YSAce
[cmole/cmole]
- - - - 0.01± 0.00
rS [g/gh] 0.10± 0.01 0.20±0.02 0.38± 0.00 0.82± 0.05 1.61± 0.05
rEthanol [g/gh] - - - 0.16± 0.00 0.52± 0.00
Carbon
balance
1.11± 0.05 0.96± 0.10 0.98± 0.01 0.94± 0.03 0.92± 0.01
For the dilution rates below D = 0.25 h-1
the yield on biomass, YSX, was around 55-60%, which is
consistent with literature data for respiratory metabolism31
. No accumulation of metabolites was
detected indicating an absence of overflow metabolism, which is in accordance with earlier
observations32
. For the two higher dilution rates (D = 0.25 h-1
and 0.3 h-1
) YSX was significantly
lower and accompanied by accumulation of ethanol as well as small amounts of acetate at the
highest dilution rate (D = 0.3 h-1
), also seen in Diderich et al. (1999)33
. These results were in
agreement with previous results where the onset of respiro-fermentative metabolism for
CEN.PK113-7D was found to be 0.28 h-1
34
. The YSCO2 decreased with increasing dilution rate,
whereas rS as well as rEthanol increased, which are results that are also in agreement with Postma et
al. (1989)32
and Van Hoek et al. (1998)34
. In general, all yields showed low standard deviations and
confirmed steady state on the physiological level as well as high reproducibility between replicates.

Chapter 6 – Population heterogeneity in E. coli and S. cerevisiae continuous cultivations as a
response to growth rate and glucose perturbation 125
Carbon balances for all the cultivations closed within a maximum error of 6% apart from the
highest and lowest dilution rates, where a deviation of 8 respectively 11% was found. This variation
in the carbon balance could be explained by a slightly higher, respectively lower, biomass yield
compared to earlier studies and as well that there was no glycerol produced34,35
.
Using flow cytometry the distribution for the GFP fluorescence as well as morphological and cell
size parameters (FSC and SSC) were investigated using freshly harvested cells. The GFP
fluorescence versus forward scatter (FSC) distributions (figure 1 A and B) for the two dilution rates,
D= 0.05 h-1
and D= 0.3 h-1
, had slightly different subpopulation distributions for the GFP
fluorescence. Both dilution rates varied within an interval of 100-600 fluorescence channel numbers
and had cells grouped into two subpopulations, high and low fluorescence, respectively. However,
the high fluorescence subpopulation covered a broader fluorescence range in the 0.05 h-1
cultivations (approx. 300-600 compared to 400-600 fluorescence channel numbers). FSC, which
usually correlates with particle size, stayed within a range of 800-1000 for the majority of cells at
both dilution rates. However, at D=0.05 h-1
a minor subpopulation with smaller cell size (FSC=300-
600) was observed.
To facilitate an unbiased, quantitative interpretation of the heterogeneous responses seen in the
study we decided to introduce additional parameters describing population heterogeneity in growth
and cell robustness. These parameters were: coefficient of variation (CV) for mean GFP, peakwidth
and the slope of the cumulative distribution curve (table 3). The mean fluorescence can hereby
describe general trends of the averaged GFP distribution. Additionally, the peakwidth at baseline
level as well as the CV, which is calculated by dividing the mean fluorescence by the peakwidth,
can be used to describe the spread and variation of the population. By considering the slope of the
cumulative distribution, hints about potential subpopulations can be provided.
In general, fluorescence distributions for cells grown at high dilution rates were more narrow and
distinct, compared to cells grown at low dilution rates (figure 1E and F), which was confirmed by
the peakwidth value (table 3). Also, the lower dilution rates showed more variation in the
distribution, which indicates a higher degree of population heterogeneity. Using the other way to
quantify the heterogeneity of the cell fluorescence by plotting the cumulative distribution and
calculate the value of its slope (cdf-plot, figure 1G and H and table 3). A lower slope was seen for
D=0.05 h-1
(0.0062 +/- 2.2·10-4
compared to 0.0095+/- 5.2·10-4
for 0.3 h-1
). This indicates a broader

Chapter 6 – Population heterogeneity in E. coli and S. cerevisiae continuous cultivations as a
response to growth rate and glucose perturbation 126
distribution for the low dilution rate. The mean GFP fluorescence was slightly higher for the higher
dilution rate, 456.9+/- 28.3 and 464.6+/- 20.3 fluorescence channel numbers, for D=0.05 and 0.3 h-
1, respectively. After normalizing mean GFP fluorescence with mean cell size, i.e. fluorescence per
cell size unit, the value obtained for D= 0.05 h-1
(0.49) and D= 0.3 h-1
(0.50), were almost the same,
which indicated that the observed difference in fluorescence was related to differences in cell size.
Figure 1 - Fluorescence and size distributions for fresh and frozen yeast cells at steady-state
conditions: Biplots for FSC against GFP for fresh cells grown at D= 0.05 h-1
(A) and D= 0.3 h-1
(B)
and for comparison between fresh and frozen cells for both dilution rates (C and D). Also GFP
fluorescence represented as cell count against channel number fluorescence (E and F) and cdfplots
of cumulative cell number against channel number fluorescence (G and H) for D= 0.05 h-1
and D=
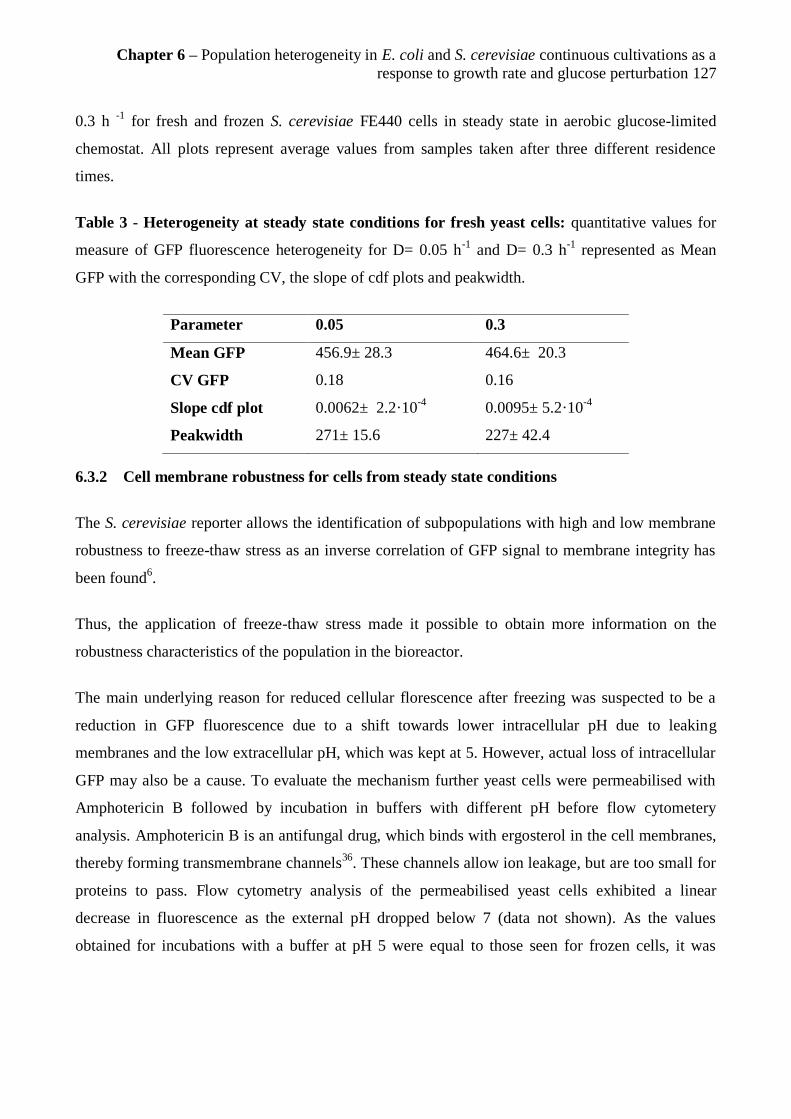
Chapter 6 – Population heterogeneity in E. coli and S. cerevisiae continuous cultivations as a
response to growth rate and glucose perturbation 127
0.3 h -1
for fresh and frozen S. cerevisiae FE440 cells in steady state in aerobic glucose-limited
chemostat. All plots represent average values from samples taken after three different residence
times.
Table 3 - Heterogeneity at steady state conditions for fresh yeast cells: quantitative values for
measure of GFP fluorescence heterogeneity for D= 0.05 h-1
and D= 0.3 h-1
represented as Mean
GFP with the corresponding CV, the slope of cdf plots and peakwidth.
Parameter 0.05 0.3
Mean GFP 456.9± 28.3 464.6± 20.3
CV GFP 0.18 0.16
Slope cdf plot 0.0062± 2.2·10-4
0.0095± 5.2·10-4
Peakwidth 271± 15.6 227± 42.4
6.3.2 Cell membrane robustness for cells from steady state conditions
The S. cerevisiae reporter allows the identification of subpopulations with high and low membrane
robustness to freeze-thaw stress as an inverse correlation of GFP signal to membrane integrity has
been found6.
Thus, the application of freeze-thaw stress made it possible to obtain more information on the
robustness characteristics of the population in the bioreactor.
The main underlying reason for reduced cellular florescence after freezing was suspected to be a
reduction in GFP fluorescence due to a shift towards lower intracellular pH due to leaking
membranes and the low extracellular pH, which was kept at 5. However, actual loss of intracellular
GFP may also be a cause. To evaluate the mechanism further yeast cells were permeabilised with
Amphotericin B followed by incubation in buffers with different pH before flow cytometery
analysis. Amphotericin B is an antifungal drug, which binds with ergosterol in the cell membranes,
thereby forming transmembrane channels36
. These channels allow ion leakage, but are too small for
proteins to pass. Flow cytometry analysis of the permeabilised yeast cells exhibited a linear
decrease in fluorescence as the external pH dropped below 7 (data not shown). As the values
obtained for incubations with a buffer at pH 5 were equal to those seen for frozen cells, it was

Chapter 6 – Population heterogeneity in E. coli and S. cerevisiae continuous cultivations as a
response to growth rate and glucose perturbation 128
concluded that the reduction in fluorescence caused by freezing is dominated by changes in
intracellular pH.
To investigate how growth rate affects membrane integrity, samples from the five dilution rates
D=0.05/0.1/0.2/0.25/0.3 h-1
were frozen in 15% glycerol at -80°C before flow cytometry analysis
and compared to data from fresh cells.
Cells growing at high and low dilution rates were differently affected by freeze-thaw stress, as can
be seen from the FSC-GFP biplots and fluorescence histograms in figure 1C-F. For D = 0.05 h-1
the
shape of the distribution as well as the fluorescence range remained the same after freezing and only
a slight increase in the lower fluorescence population was seen. However, for D = 0.3 h-1
the
fluorescence shifted considerably towards lower values and the fluorescence distribution also
broadened. As a result, the mean GFP fluorescence remained almost constant after freezing for D=
0.05 h-1
(409.0 +/-14.3) but decreased for the high dilution rate to 295.4 +/- 6.9 (highlighted with
red circles in figure 2). This leads to the conclusion that cells growing with a low growth rate (D=
0.05 h-1
) are more robust towards freeze-thaw stress.
To further investigate how growth rate influences freeze-thaw stress tolerance and the level of
population heterogeneity; mean GFP, mean GFP normalized by cell size as well as CV of mean
GFP, the slope of the cdf plot and the peakwidth were calculated for all 5 dilution rates and plotted
in figure 2. Similar mean GFP fluorescence (figure 2A) was found for frozen cells from all dilution
rates, except for D= 0.05 h-1
, where the mean fluorescence was higher. From FSC data it was seen
that the cell size decreased with increasing growth rate until the respiro-fermentative metabolism
sets in, after which it sharply increased (data not shown). To remove the effect of cell size on mean
fluorescence, the fluorescence was normalized with cell size. A steep increase in the normalized
mean GFP was seen when going from 0.05 to 0.1 h-1
. Thereafter, the value remained almost
constant for growth rates up to where respiro-fermentative metabolism sets in (0.25 h-1
).
Interestingly, above this growth rate, the normalized GFP fluorescence decreased sharply.
The CV of the GFP distribution, which indicates the level of population heterogeneity, showed a
similar but opposite trend with a higher level of heterogeneity for D=0.05 and D=0.3 h-1
than the
dilution rates in between. In general, GFP fluorescence distributions for cells grown at 0.1 h-1
and
0.2 h-1
were more narrow (peakwidth, figure 2B). This can be seen in the cdfplots whose slopes
were highest for D= 0.1 h-1
and lower for 0.2 and 0.25 h-1
(figure 2B). For D= 0.05 h-1
and 0.3 h-1

Chapter 6 – Population heterogeneity in E. coli and S. cerevisiae continuous cultivations as a
response to growth rate and glucose perturbation 129
the GFP fluorescence distribution was broader, resulting in higher peakwidths compared to the
other dilution rates.
Though the peak characteristics are different for D = 0.05 h-1
and 0.3 h-1
, the slope of the cdfplots
were similar for these two growth rates (figure 2B). Compared to fresh cells (figure 1E), the
distribution for frozen cells grown at 0.05 h-1
was broader with a more distinct low fluorescent
subpopulation, though keeping the same shape, resulting in a similar value of the slope of the
cdfplot. For a diltuion rate of 0.3 h-1
the slope of the cdfplot for frozen cells was considerably lower
and the shape of the distribution changed with broad tailing towards higher fluorescence and a
division into two distinct subpopulations (figure 1F).
Figure 2 - The effect of growth rate on fluorescence and heterogeneity for yeast cells exposed
to freeze-thaw stress: Mean GFP fluorescence distribution as well as GFP fluorescence normalized
by cell size together with the corresponding coefficient of variance (A) as well as the peakwidth and
the slope of the cdfplot (B) for S. cerevisiae cells at steady-state conditions in aerobic glucose-
limited chemostat for D= 0.05 h-1
, 0.1 h-1
, 0.2 h-1
, 0.25 h-1
and D= 0.3 h-1
. The plots represent
average values from samples taken after three different residence times. The blue line in both plots
indicates the critical dilution rate where respiro-fermentative metabolism sets in.

Chapter 6 – Population heterogeneity in E. coli and S. cerevisiae continuous cultivations as a
response to growth rate and glucose perturbation 130
In order to investigate population heterogeneity dynamics after a glucose perturbation of a steady
state culture, single cell analysis of samples frequently taken following the pulse using flow
cytometry was applied. The physiological responses as well as the distribution of individual cell
responses are presented in the following two sections.
6.3.3 Influence of glucose perturbation on S. cerevisiae physiology and GFP fluorescence
heterogeneity
A glucose pulse of 1 g/L was introduced to the steady states at the different dilution rates and FSC,
GFP fluorescence and HPLC data were recorded over the duration of each perturbation.
Figure 3 - Time profiles of physiological response: to a 1 g/L glucose pulse in aerobic glucose-
limited chemostats of S. cerevisiae growing with a dilution rate of 0.05 h-1
(top) and 0.3 h-1
(bottom). Glucose (g/L, black), CO2 (v/v %, blue), ethanol (g/L, green) and acetate (g/L, red)
concentrations are shown during the duration of the perturbation.
The lower dilution rates, 0.05 h-1
(figure 3) as well as 0.1 h-1
and 0.2 h-1
(data not shown) displayed
a batch like behavior with a sharp increase in CO2 production, overflow metabolism and
concomitant ethanol and acetate accumulation when perturbed with a 1 g/L glucose pulse, thus
corroborating what was observed by Visser et al. (2004)37
. In contrast, the respiro-fermentative

Chapter 6 – Population heterogeneity in E. coli and S. cerevisiae continuous cultivations as a
response to growth rate and glucose perturbation 131
chemostats (0.25 and 0.3 h-1
), only showed a very slight increase in CO2 generation, consumed the
extra glucose at a much slower rate and did not react with an increased ethanol or acetate
production.
Figure 4 - Time profiles of GFP fluorescence distribution for S. cerevisiae fresh cells and cells
exposed to freezing: GFP fluorescence represented as cell count against channel number
fluorescence of S. cerevisiae FE440 before, during and after a 1 g/L glucose pulse in aerobic
glucose-limited chemostats for D= 0.05 h-1
(left) and D= 0.3 h -1
(right) shown as comparison for
fresh (top) and frozen cells (bottom). The plots represent time points between -60 min to +150 min
after the pulse.
Figure 4 shows the responses of the D= 0.05 h-1
and 0.3 h-1
steady states to a 1 g/L glucose pulse
with regards to GFP fluorescence. From the fluorescence histogram data for fresh cells (figure 4
top) it can be seen that the pulse caused a slight shift towards higher fluorescence for cells grown at
0.05 h-1
, whereas cells grown at 0.3 h-1
where not influenced. This is also seen in the mean
fluorescence, which remained constant for the higher rate and increased for cells grown at the lower
rate until around 30-40 min after the pulse (figure 5A fresh). CV and peakwidth (figure 5B and C
fresh) indicated a somewhat higher heterogeneity for the low growth rate. However, there was not
seen any influence from the pulse, as the values were constant over time. On the contrary, the slope
of the cdfplot (figure 5D fresh) increased as a consequence of glucose perturbation for D=0.3 h-1

Chapter 6 – Population heterogeneity in E. coli and S. cerevisiae continuous cultivations as a
response to growth rate and glucose perturbation 132
and decreased for D=0.05 h-1
. The change in the slope of the cdf plot may be attributed to a decline
in the low fluorescence subpopulation for cells grown at D=0.3 h-1
and an increase for cells grown
at D=0.05 h-1
(see figure 4), whereas the main subpopulation remained constant. Coinciding with
glucose depletion (compare with figure 3) the slope returned to the steady state value for both
dilution rates.
Figure 5 - Heterogeneity following glucose perturbation for fresh and frozen yeast cells: Mean
GFP fluorescence (A) as well as CV of GFP fluorescence (B), peakwidth (C) and slope of the
cdfplots (D) plotted against time following a 1 g/L glucose pulse for S. cerevisiae FE440 in aerobic
Chapter 6 – Population heterogeneity in E. coli and S. cerevisiae continuous cultivations as a
response to growth rate and glucose perturbation 133
glucose-limited chemostats for D= 0.05 h-1
and D= 0.3 h-1
for fresh (red and blue) and frozen cells
(magenta and cyan). The red, blue, magenta and cyan coloured vertical lines indicate the time when
the pulsed glucose is consumed for the respective experiment, whereas the black line marks the time
of the glucose pulse. Dotted lines represent replicate cultivations.
6.3.4 Influence on cell robustness by glucose perturbation of S. cerevisiae cultivations
A distinct difference could be seen after the addition of the glucose pulse when fluorescence
histograms for fresh and frozen cells from D=0.05 h-1
and D=0.3 h-1
cultivations were compared.
Frozen samples of cells from the 0.05 h-1
cultivation had similar GFP fluorescence distributions
before and after the glucose pulse. Hence, glucose perturbation did not seem to have a significant
influence on the membrane integrity of cells grown at the low growth rate (figure 4 and 5). In
contrast, frozen samples from cells grown at 0.3 h-1
were significantly affected. The high
fluorescence subpopulation increased as a response to the pulse (figure 4) and this was also
reflected as an increase in the mean GFP value (figure 5A frozen). Even though the mean GFP of
the cells grown at 0.3 h-1
still was more affected by the freezing compared to the mean GFP of cells
grown at 0.05 h-1
, the addition of glucose seemed to protect the fast growing cells towards freeze-
thaw stress to some extent.
In comparison to the uniform and constant population distribution seen when analysing fresh cell
samples a much broader population distribution was seen for frozen cells, which got even more
pronounced after the addition of a glucose pulse as seen from the values for CV, peakwidth and
slope of the cdf plot (figure 4 and 5).
To further elucidate the effect of the pulse on subpopulation distribution, the relative fraction of the
low and high fluorescence subpopulation was calculated at different time points (figure 6). The low
fluorescence subpopulation contributed with 80% and the high fluorescence sub-population with
20% during steady-state conditions for cells grown at 0.3 h-1
. When glucose was added, this
changed to an approximately equal distribution. For cells grown at 0.05 h-1
, the subpopulation
distribution was unaffected by the pulse and composed of approx. 20% low fluorescence and 80%
high fluorescence cells.

Chapter 6 – Population heterogeneity in E. coli and S. cerevisiae continuous cultivations as a
response to growth rate and glucose perturbation 134
Figure 6 - Subpopulation distribution dynamics following glucose perturbation for yeast cells
exposed to freezing: percentage for low (red) and high (blue) fluorescence subpopulation plotted
against time following a 1g/L glucose pulse for S. cerevisiae FE440 in aerobic glucose-limited
chemostats for frozen cells grown with D= 0.3 h-1
and D= 0.05 h-1
. The red and blue coloured
vertical lines are indicating the time when the pulsed glucose is consumed in the 0.05 h-1
and 0.3 h-1
cultivations respectively. The black line is indicating the time of the glucose pulse.
6.3.5 Freeze-thaw stress as a tool to investigate membrane robustness in E. coli cells
The use of a GFP reporter strain in combination with freeze-thaw stress as a tool to map the
distribution of membrane robustness has earlier not been applied to E. coli cells. Hence, to evaluate
the potential with the methodology, shake flasks cultivations of the E. coli reporter strain were
performed and samples taken for each growth phase. Flow cytometry analysis was performed on
both fresh and frozen cells. To verify whether the freezing has resulted in leaky membranes and if
this could be detected as a reduction in the GFP signal, cell samples for analysis of GFP
fluorescence where kept in buffers at different pH ranging from pH 7.5 down to pH 5.5.
Frozen cells analysed at pH 7 displayed fluorescence patterns very similar to those seen for fresh
cells, independent of growth phase and freezing method (data not shown). When analyzing at
different pH the fluorescence distribution remained the same with and without freezing for E. coli
cells analysed at a pH between 6.5 and 7.5 (figure 7). In contrast, the GFP fluorescence of freeze-
thawed cells increasingly declined with lower pH when the cells were resuspended in buffers below
pH 6. This behaviour is in accordance with what was seen for yeast cells and is also in agreement
with the known pH dependence of GFP38
. We consequently concluded that freeze-thaw stress is
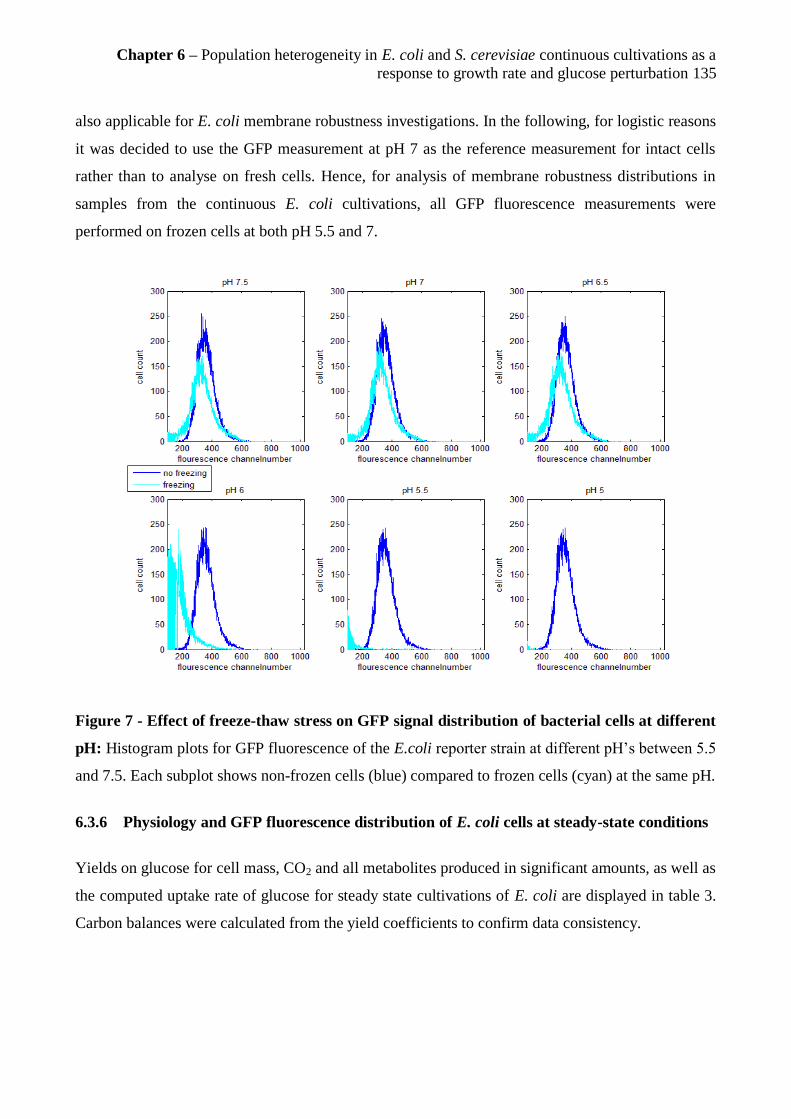
Chapter 6 – Population heterogeneity in E. coli and S. cerevisiae continuous cultivations as a
response to growth rate and glucose perturbation 135
also applicable for E. coli membrane robustness investigations. In the following, for logistic reasons
it was decided to use the GFP measurement at pH 7 as the reference measurement for intact cells
rather than to analyse on fresh cells. Hence, for analysis of membrane robustness distributions in
samples from the continuous E. coli cultivations, all GFP fluorescence measurements were
performed on frozen cells at both pH 5.5 and 7.
Figure 7 - Effect of freeze-thaw stress on GFP signal distribution of bacterial cells at different
pH: Histogram plots for GFP fluorescence of the E.coli reporter strain at different pH’s between 5.5
and 7.5. Each subplot shows non-frozen cells (blue) compared to frozen cells (cyan) at the same pH.
6.3.6 Physiology and GFP fluorescence distribution of E. coli cells at steady-state conditions
Yields on glucose for cell mass, CO2 and all metabolites produced in significant amounts, as well as
the computed uptake rate of glucose for steady state cultivations of E. coli are displayed in table 3.
Carbon balances were calculated from the yield coefficients to confirm data consistency.

Chapter 6 – Population heterogeneity in E. coli and S. cerevisiae continuous cultivations as a
response to growth rate and glucose perturbation 136
The biomass yields on glucose were about 0.44 cmole/cmole for the low dilution rate and 0.57
cmole/cmole for the higher ones. Though showing the same trend, our yields were lower than those
reported in literature for E. coli K12 on the same medium. where an YSX of about 0.6 cmole/cmole
has been reported for lower dilution rates (below 0.4 h-1
).The biomass yield was seen to increase
with increasing dilution rate to reach a maximum of 0.69 cmole/cmole before tapering off at even
higher rates39
. Similarly to S. cerevisiae, at the low growth rates (D=0.1 h-1
and D= 0.36 h-1
) the E.
coli cultivations had strictly respiratory metabolism with no acetate formation. Literature data
suggests a shift to respiro-fermentative growth at a dilution rate above about 0.4 h-1
with
concomitant acetate production 40
. However, this was not seen in the present study as only a small
amount of acetate was observed for the highest growth rate (D= 0.51 h-1
). This observation is
consistent with Qiang Hua et al (2004)22
where no acetate excretion was found at detectable levels.
Additionally, their biomass yields were found to be similar to our data but the CO2 yields were
comparably higher. Lactate was only seen in very low concentrations (< 0.1g/L) in the medium
(data not shown), whereas formate formation was found for the higher dilution rates. Surprisingly
also small amounts of glycerol were found to be produced in all tested dilution rates. The low
standard deviations of the calculated yields, in addition to carbon balances closing with a maximum
error of 5%, demonstrate a high data consistency in the present study.
Table 3 - Yield coefficients and carbon balance as well as glucose consumption rate at
different dilution rates for aerobic glucose-limited chemostats of E. coli
MG1655/pGS20PfisGFPAAV (+/-standard deviation). Data are presented as mean values and
originate from samples taken over at least three different residence times. Each dilution rate was
carried out as a biological duplicate (D=0.1 h-1
) or as a single measurement (D=0.36 h-1
and D=0.51
h-1
).
Chemostat parameter D=0.1 h-1 D=0.36 h-1 D=0.51 h-1
YSX [cmole/cmole] 0.44± 0.02 0.58± 0.02 0.56± 0.02
YSCO2 [cmole/cmole] 0.49± 0.00 0.37± 0.00 0.36± 0.00
YSAce [cmole/cmole] 0.001± 0.00 0.001± 0.0005 0.003± 0.001
YSGly [cmole/cmole] 0.007± 0.002 0.003± 0.00 0.004± 0.001
YSFor [cmole/cmole] - 0.03± 0.003 0.03± 0.001
rS [g/gh] 0.18± 0.09 0.78± 0.04 0.94± 0.00
Carbonbalance 0.95± 0.02 0.98± 0.02 0.96± 0.02
Chapter 6 – Population heterogeneity in E. coli and S. cerevisiae continuous cultivations as a
response to growth rate and glucose perturbation 137
Subsequently, the effect of growth rate on GFP expression and population heterogeneity was
investigated. From the FSC-GFP biplots (figure 8 A, B, C) it can be seen that the population
spanned over a large FSC range (around 600 channel numbers) both for cells analysed at pH 5.5 and
7, which shifted towards higher values with increasing growth rate. A similar population
distribution was seen for the GFP fluorescence at the different dilution rates (figure 8), however
there was a significant difference between samples analysed at pH 5.5 and 7. Whereas intact cells
(pH 7) only exhibited one fluorescent population with a narrow distribution and low CV (table 5),
cells analysed at pH 5.5 showed a lower fluorescence subpopulation in addition to the main
fluorescent subpopulation that resembled the one for intact cells (figure 8 D, E, F). Moreover, the
low fluorescent subpopulation got more pronounced with increasing dilution rate, which can be
seen in the increasing CV and peakwidth (table 5). Irrespective of the pH a slight shift in the main
population towards higher fluorescence was observed for the higher growth rates (D= 0.36 h-1
and
D= 0.51 h-1
). Consequently, the mean fluorescence for cells grown at the two higher dilution rates
and analysed at pH 7 was higher (438.43+/-4.22 and 422.49+/-7.08) (table 5) than for cells grown at
D= 0.1 h-1
(377.50+/-17.33). The lower peakwidth of cell distributions for cells grown at the higher
growth rates of 0.36 h-1
and 0.51 h-1
indicated a lower heterogeneity in rapidly growing cells. When
analysis of GFP fluorescence was performed at pH 5.5, the mean fluorescence initially increased
when the dilution rate was raised from D= 0.1 h-1
to D= 0.36 h-1
, but decreased again at D= 0.51 h-1
which can be explained by the more pronounced low fluorescent subpopulation observed at higher
dilution rates. The slope of the cdfplot (table 5) remained unchanged irrespectively of the pH used
for analysis and the dilution rate at which cells where grown, confirming that the fluorescence
distribution only changed in the low channel numbers whereas the shape of the main fluorescent
subpopulation remained the same (figure 8).

Chapter 6 – Population heterogeneity in E. coli and S. cerevisiae continuous cultivations as a
response to growth rate and glucose perturbation 138
Figure 8 - Fluorescence and size distributions for frozen E.coli cells at steady-state conditions
at pH 5.5 and 7: Biplots for FSC against GFP for frozen cells at pH 5.5 (blue) and 7 (red) grown at
D = 0.1 h-1
(A), D = 0.36 h-1
(B) and D = 0.51 h-1
(C). Also GFP fluorescence represented as cell
count against channel number fluorescence (D, E and F) and cdfplots of cumulative cell number
against channel number fluorescence (G, H and I) for D= 0.1 h-1
, D= 0.36 h-1
and D= 0.51 h-1
frozen
E.coli cells at pH 5.5 and 7 in steady state in aerobic glucose-limited chemostat. The plots represent
average values from samples taken after three different residence times.
Table 5 - Quantitative values for population heterogeneity of GFP fluorescence: represented as
CV, mean GFP, peakwidth and slope of the cdfplots and including the standard deviation for
steady-states of frozen cells at pH 5.5 and 7 for D =0.1 h-1
, 0.36 h-1
and 0.51 h-1
, respectively.
Parameters 0.1 h-1
0.36 h-1
0.51 h-1
Mean GFP
pH 5.5
379.86± 29.34
377.50± 17.33
407.83± 23.17
438.43± 4.22
370.67± 14.53
422.49± 7.08
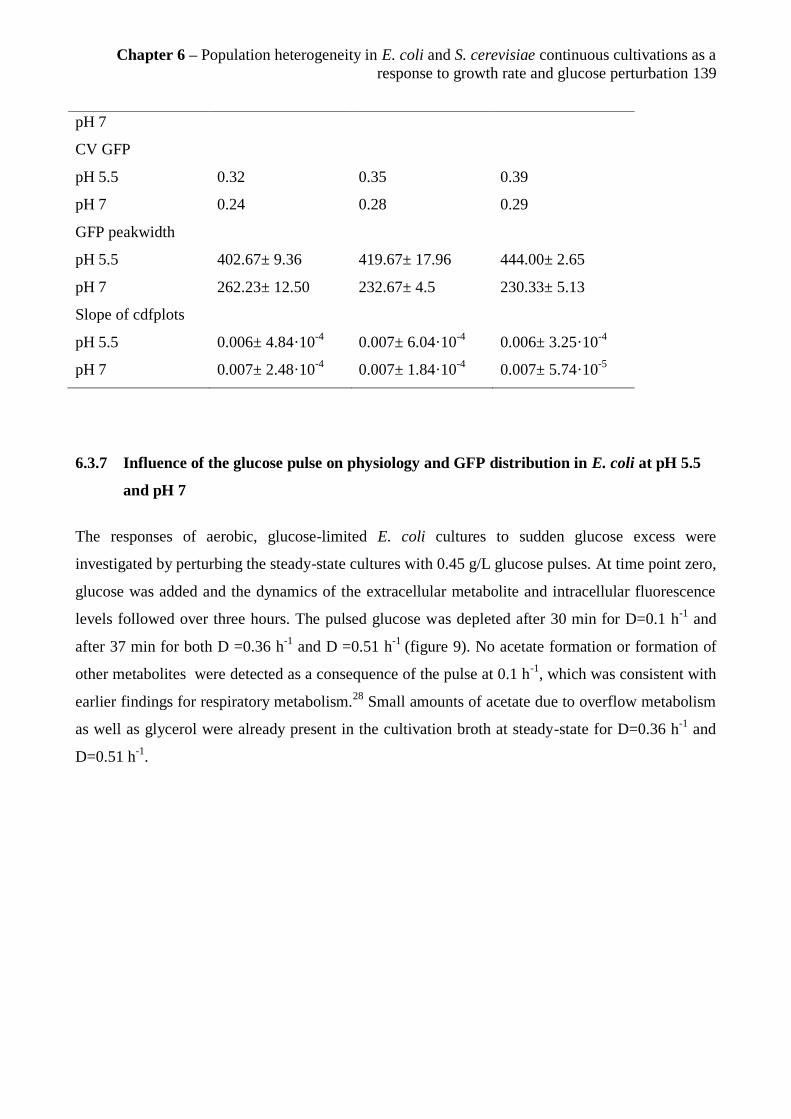
Chapter 6 – Population heterogeneity in E. coli and S. cerevisiae continuous cultivations as a
response to growth rate and glucose perturbation 139
pH 7
CV GFP
pH 5.5
pH 7
0.32
0.24
0.35
0.28
0.39
0.29
GFP peakwidth
pH 5.5
pH 7
402.67± 9.36
262.23± 12.50
419.67± 17.96
232.67± 4.5
444.00± 2.65
230.33± 5.13
Slope of cdfplots
pH 5.5
pH 7
0.006± 4.84·10-4
0.007± 2.48·10-4
0.007± 6.04·10-4
0.007± 1.84·10-4
0.006± 3.25·10-4
0.007± 5.74·10-5
6.3.7 Influence of the glucose pulse on physiology and GFP distribution in E. coli at pH 5.5
and pH 7
The responses of aerobic, glucose-limited E. coli cultures to sudden glucose excess were
investigated by perturbing the steady-state cultures with 0.45 g/L glucose pulses. At time point zero,
glucose was added and the dynamics of the extracellular metabolite and intracellular fluorescence
levels followed over three hours. The pulsed glucose was depleted after 30 min for D=0.1 h-1
and
after 37 min for both D =0.36 h-1
and D =0.51 h-1
(figure 9). No acetate formation or formation of
other metabolites were detected as a consequence of the pulse at 0.1 h-1
, which was consistent with
earlier findings for respiratory metabolism.28
Small amounts of acetate due to overflow metabolism
as well as glycerol were already present in the cultivation broth at steady-state for D=0.36 h-1
and
D=0.51 h-1
.

Chapter 6 – Population heterogeneity in E. coli and S. cerevisiae continuous cultivations as a
response to growth rate and glucose perturbation 140
Figure 9 - Perturbation profile of E. coli cultivations following a 0.45 g/L glucose pulse:
Profiles for aerobic glucose-limited chemostats at D = 0.1 h-1
(A), 0.36 h-1
(B), 0.51 h-1
(C). Glucose
(g/L, black), acetate (g/L, red), glycerol (g/L, pink), CO2 (v/v%, blue) and formate (g/L, green).
For the high dilution rates, D =0.36h-1
and D = 0.51h-1
, the acetate concentration increased up to
0.1g/L respectively 0.15g/L as a consequence of the pulse together with a rise in CO2. After glucose
depletion, the acetate was consumed connected to a second rise in CO2 level. The reduction of the
acetate level was slower for D = 0.51 h-1
than for D =0.36 h-1
, as the cells were already growing
with overflow metabolism and were unable to re-assimilate the produced acetate. The acetate was in
this case probably diluted out rather than consumed by the cells. Formic acid levels before the pulse
were around 0.2g/L and seemed to only respond with a slight increase. Thereafter its concentration
slowly decreased probably due to dilution.
Considering the GFP fluorescence analysed at pH7 (corresponding to values for intact cells), the
pulse caused a slight shift towards higher fluorescence for all three dilution rates, which resulted in
slightly elevated mean fluorescence values (figure 10 A). As the pulses abated, the fluorescence
returned after a short period with increased population variance (CV, figure 10C) to steady state
levels. This rise in variance is co-occurring for all three dilution rates and might for the high ones be
connected to acetate growth. No population segregation was found for either of the three dilution
rates and the peak shapes, considering the peakwidth and slope of the cdfplot (figure 10 D and G),
remained constant during the pulses. There was only a slight observed decrease in the slope after
nutrient depletion for D = 0.1h-1
after glucose depletion and for the two higher dilution rates after
acetate depletion.

Chapter 6 – Population heterogeneity in E. coli and S. cerevisiae continuous cultivations as a
response to growth rate and glucose perturbation 141
When GFP was analysed at pH 5.5 to assess membrane robustness, the effect of the pulse could
easily be seen with clear differences between slow and fast growing cells. For the two higher
dilution rates a second distinct phase was also seen for the GFP signal mirroring the overall trend of
the CO2 evolution - corresponding to acetate re-assimilation. This indicates that the reporter strain
had a response fast enough to capture both the glucose and the acetate phase. For the low dilution
rate the mean fluorescence remained constant apart from a slight drop during growth on the pulsed
glucose. Furthermore, cells growing at the higher dilution rates of 0.36 h-1
and 0.51 h-1
, showed a
more dynamic response to the glucose addition than the low dilution rate. This could be seen in the
slight increase in peakwidth for the faster growing cells during both glucose and acetate growth, in
contrast to the almost constant peakwidth for the slow growth condition (figure 11 D). Also the CV
of the GFP at D = 0.1 h-1
remained constant apart from a steep increase after the glucose
perturbation followed by an asymptotic decrease during the glucose consumption. In contrast to that
the level of heterogeneity for the two higher dilution rates decreased after the glucose perturbation
and then rose above steady state level during the acetate consumption phase. Slow growing cells
were characterized by a generally higher and constant slope of the cdfplot, apart from a small drop
after the glucose perturbation indicating an increase in heterogeneity induced by the pulse (figure
11H). In contrast fast growing cells decreased their heterogeneity with the pulse, seen by a slight
increase in slope. However when growing on acetate the slope dropped steeply followed by a slow
return to steady state level after acetate depletion indicating that fast growing cells were strongly
affected when growing on acetate.
Cells analysed for membrane robustness at pH 5.5 showed a bigger population spread as well as a
higher level of overall heterogeneity considering peakwidth and CV (figure 11 C, D, E and F) than
when just analysed for growth heterogeneity (at pH 7). Additionally the carbon source seemed to
influence the membrane robustness (at pH 5.5) at high growth rates which was not revealed when
analysing intact cells at pH 7 (figure 11 A and B). Furthermore, membrane robustness affected cells
(at pH 5.5) also required a longer time, which increased with increasing dilution rate, to return to
steady state levels.
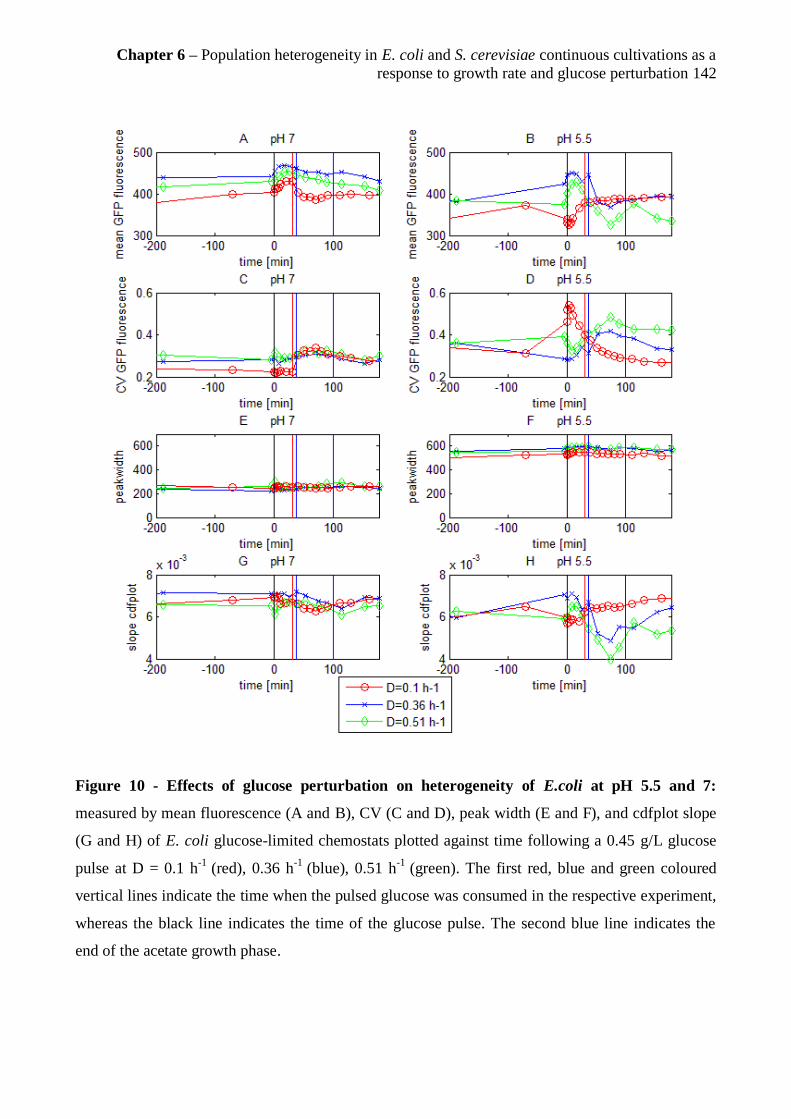
Chapter 6 – Population heterogeneity in E. coli and S. cerevisiae continuous cultivations as a
response to growth rate and glucose perturbation 142
Figure 10 - Effects of glucose perturbation on heterogeneity of E.coli at pH 5.5 and 7:
measured by mean fluorescence (A and B), CV (C and D), peak width (E and F), and cdfplot slope
(G and H) of E. coli glucose-limited chemostats plotted against time following a 0.45 g/L glucose
pulse at D = 0.1 h-1
(red), 0.36 h-1
(blue), 0.51 h-1
(green). The first red, blue and green coloured
vertical lines indicate the time when the pulsed glucose was consumed in the respective experiment,
whereas the black line indicates the time of the glucose pulse. The second blue line indicates the
end of the acetate growth phase.

Chapter 6 – Population heterogeneity in E. coli and S. cerevisiae continuous cultivations as a
response to growth rate and glucose perturbation 143
Figure 11 - Subpopulation distribution dynamics following glucose perturbation for E.coli
cells exposed to freezing at pH 5.5: percentage for low (red) and high (blue) fluorescence
subpopulation plotted against the time following a 0.45 g/L glucose pulse for E.coli in aerobic
glucose-limited chemostats for frozen cells grown with D = 0.1 h-1
(A), D = 0.36 h-1
(B) and D =
0.51 h-1
(C) at pH 5.5. The red and blue colored vertical lines are indicating the time when the
pulsed glucose is consumed in the 0.1 h-1
, 0.36 h-1
and 0.51 h-1
cultivation respectively. The black
line is indicating the time of the glucose pulse.
To further investigate the effect of the pulse on membrane robustness subpopulation distributions
(samples analysed at pH 5.5), the relative fraction of the low and high fluorescence subpopulation
was calculated at different time points (figure 11). For D = 0.1 h-1
the high fluorescent
subpopulation (intact membranes) compromised around 97% of the whole population under steady
state conditions. With perturbation the low fluorescent subpopulation (damaged membranes)
increased up to around 7 %, but with glucose depletion the distribution returned to steady state
values. For D = 0.36 h-1
the same subpopulation distribution in steady state and trend during
glucose growth could be seen. However, during acetate growth after glucose depletion the
percentage of the high subpopulation (intact cells) decreased further to around 78% and only slowly
returned to steady state values after its depletion. The same trend was also found during acetate
growth for the highest dilution rate, although after its depletion the steady state level was not fully
reached again during the analysis window (low/high subpopulation: 20%/80%). In contrast to the
two other dilution rates the fraction of the high fluorescent subpopulation (intact cells) increased
with the pulse to up to 95% compared to steady state (around 90%).
Chapter 6 – Population heterogeneity in E. coli and S. cerevisiae continuous cultivations as a
response to growth rate and glucose perturbation 144
6.4 Discussion
Cellular heterogeneity is present in all living things from simple bacteria, to eukaryotic and
mammalian cells. To explore how cell-to-cell variability in growth and membrane robustness
(investigated as a consequence of freeze-thaw stress) are affected by growth rate and sudden
variation in glucose concentration, fluorescent reporter strains of S. cerevisiae and E. coli were
grown in continuous cultivations at different dilution rates. Both high and low dilution rates were
employed and the population distributions followed during steady state and after the introduction of
a glucose pulse. The glucose pulse was applied to mimic the fluctuating conditions cells experience
in industrial scale bioreactors. With our investigations we successfully described and compared
microbial responses to environmental perturbations at the single-cell level for slow and fast growing
E. coli and S. cerevisiae cells. The introduction of new tools allowed us to perform a detailed,
quantitative characterization of population heterogeneity properties.
6.4.1 Quantification of heterogeneity
As unsynchronized microbial cultures are heterogeneous, averaged response values fail to describe
the influence of different subpopulations1. The currently most used method for single cell analysis
is flow cytometry, which allows simultaneous quantification of thousands of individual cells per
second41
. As mentioned earlier, flow cytometry data are generally illustrated as single parameter
histograms or in plots where two parameters are correlated26,27
. By using classical histograms and
biplots and by calculating mean GFP fluorescence, general traits of the GFP distribution can be
observed. However, this type of data treatment provides a qualitative description rather than a
quantitative one and the selection of parameters and divisions of subpopulations are based on
subjective interpretations, which points to the need for more objective standards for the
quantification of population heterogeneity. To achieve this the shape of the distribution values were
enumerated using simple statistical and mathematical functions, which permits the peakwidth and
the CV, based on peakwidth divided by the mean GFP fluorescence, to be used to describe
population heterogeneity. The wider the peak and the bigger the CV, the more heterogeneous is the
population. The appearance of subpopulations, shifts over time and differences in peak shape can be
illustrated by using a cumulative distribution, which can be quantified via its slope. So the higher
the slope, the narrower the distribution will be and the lower the population heterogeneity. The
challenge, depending on the study, however lies in determining which or what combination of
parameter/s that can reveal relevant and the most descriptive information from the torrent of data.
For example a rapid change in peakwidth can either be related to a more aligned population in

Chapter 6 – Population heterogeneity in E. coli and S. cerevisiae continuous cultivations as a
response to growth rate and glucose perturbation 145
general or to an appearance of a subpopulation (which is related to more heterogeneity in general).
Hence it can be necessary, especially when expecting subpopulations, to consider peakwidth and
slope of the cdfplot together to avoid false argumentation. In conclusion, by using the newly
developed parameters or a combination of them a cell population can be described more objectively
and more detailed than using conventional trend plots. A set of parameter values are also easier to
comprehend than rows of distribution plots because they are represented as single values for
sampling points that can be plotted over time (figure 5 and 10) similar to general physiology data.
6.4.2 Freezing as a tool to determine membrane robustness
Freezing is well known to affect and damage microbial cells. Cooling and thawing rates have a
significant influence on the amount of damage inflicted42
. Furthermore, faster growing cells are
more susceptible to freeze-thaw stress,20
whereas slower growing cells tend to redistribute cellular
resources towards stress tolerance functions14,21,22
. But freezing can also be consciously employed
to reveal information about the population structure of cells related to membrane robustness under
different environmental conditions as done in our study. We have previously looked into freezing
effects in yeast on fluorescence distributions and shape of cells by comparing freshly analysed cells
versus cells frozen before analysis6.Whereas there was no observable effect on cell morphology,
clear differences were seen for the GFP fluorescence including the formation of subpopulations at
different fluorescence levels. The underlying cause of the decreasing fluorescence in yeast cells
subjected to freeze-thaw stress was further investigated in this study and found to be mainly due to
a pH drop caused by an equalization of the external and internal pH via membrane pores/holes as
freeze-thawed yeast cells displayed a fluorescence similar to that of fresh cells when the external
pH was kept at pH 7, which then linearly decreased as the external pH dropped below 7. This is in
accordance with earlier observations where fluorescent proteins, especially the green and yellow
variants, showed to be severely affected by acid shifts close to the physiological pH43
. The fact that
the applied freezing procedure reproducibly generates pores in the membranes that allow exchange
of ions between the intracellular and extracellular space, but that are too small to allow the
fluorescent proteins to pass, permits the usage of freeze-thawing for studying membrane robustness
heterogeneity. The methodology was also successfully applied for investigation of membrane
robustness heterogeneity in E. coli cells and hence seem to be applicable for different
microorganisms.

Chapter 6 – Population heterogeneity in E. coli and S. cerevisiae continuous cultivations as a
response to growth rate and glucose perturbation 146
6.4.3 Influence of growth rate
The yeast growth reporter strain has previously been shown to be growth related in a batch study
when comparing the fast growth in the glucose phase with the slower growth in the ethanol phase6.
However, in batch cultivations the effect of growth rate versus use of carbon source on GFP
expression cannot be separated. In the current study, where continuous cultivations were employed
to facilitate investigation of the influence of growth rate separately, we did not observe an increase
in GFP fluorescence for intact cells with increasing dilution rate as expected. Instead, the mean
fluorescence level was fairly constant with the exception of an increase at the lowest dilution rate
(0.05 h-1
). However, after normalising with FSC, which is correlated with cell size in yeast, a clear
increasing trend was observed up until D=0.25 h-1
, whereafter the fluorescence/FSC sharply
declined. This would indicate that the “expression per cell volume” increased with growth rate in
the respiratory phase. Yet, as observed previously in the shift from respiro-fermentative growth on
glucose to respirative growth on ethanol6, the particular type of metabolism seems to have a strong
influence on the ribosomal promoter associated fluorescence as indicated by the sharp decline
above 0.25 h-1
, which marks the onset of respiro-fermentative growth.
A similar pattern was seen for the E. coli reporter, though prior to normalisation with cell size
which in this case might be due to the small size not accurately being predicted by the FSC (it rather
gives information about the morphology41
). However it is known that E. coli cells increase slightly
in length and width when growing under nutrient richer conditions44
. Therefore the rising steady-
state GFP fluorescence for intact cells with dilution rate for the two lower growth rates (D= 0.1 h-1
and D =0.36h-1
) (figure 8) cannot strictly be described by higher “expression per cell volume” but is
also influenced by other factors. Afterwards the GFP fluorescence remained constant respectively
slightly declined depending on the growth rate. Whether the GFP expression was reduced due to
change in metabolism with the onset of overflow metabolism or due to reduction in plasmid counts
remains unclear. However plasmid counts of low copy number plasmids have previously been
shown to decrease at high dilution rates in E. coli chemostats45
.
Growth rate had a clear influence on membrane robustness population distributions for both yeast
and E. coli cells. The slower growing cells were largely unaffected by the freezing procedure,
whereas for the rapidly growing cells a shift towards lower fluorescence was seen, which was more
pronounced for yeast than for E. coli. In accordance, small cells have earlier been seen to be less

Chapter 6 – Population heterogeneity in E. coli and S. cerevisiae continuous cultivations as a
response to growth rate and glucose perturbation 147
susceptible to freeze damage than larger cells when the freezing is performed at slow freezing rates,
similar to those applied at the present study46
.
6.4.4 Influence of glucose perturbation
The influence of the fluctuating environmental conditions cells experience in industrial scale
reactors was further explored by analysing responses to transient changes from glucose limitation to
glucose excess and back. Fresh samples from the yeast cultivations showed a slight shift in
fluorescence intensity at the lower dilution rate (D=0.05 h-1
), but a constant intensity at the higher
dilution rate (0.30 h-1
). This seems intuitive, as any shift in metabolism after a relief of glucose
limitation must be bigger for slower growing cells. This trend was also seen for E. coli cells, and
though all cells irrespective of dilution rate reacted to the pulse with an upshift in fluorescence, the
reaction got more pronounced with decreasing dilution rate (figure 10). Our results indicate that
while the growth rate was only found to introduce small changes to the expression of our reporter
genes in yeast and E. coli, clear up-regulations were observed after the introduction of the glucose
pulses. This indicates that the gene regulations of the promoters are primarily responding to
environmental shifts rather than growth rate at steady state conditions.
With regards to cell membrane integrity, cell population distributions were largely unchanged after
the pulse in samples from the low dilution rate cultivations. However, in strong contrast, samples
from the high dilution rate cultivations displayed significant shifts in the population distributions as
a response to the pulses (figure 5 and 6). Interestingly, after the introduction of the pulse a larger
part of the population maintained the fluorescence. This behaviour was mirrored by the E. coli cells.
At the low dilution rate (D= 0.1 h-1
) the E. coli GFP fluorescence barely shifted with the pulse,
whereas as the dilution rate increased (D= 0.36 h-1
and D= 0.51 h-1
), the shifts became more
pronounced (figure 10 and 11). The bacterial cells responded with an upshift in fluorescence, i.e.
increased ratio of cells with intact cell membranes, in the glucose consumption phase but the
amount of intact cells declined increasingly with rising dilution rate ( for the two higher dilution
rates ) respectively remained constant for acetate consumption for D=0.1 h-1
. This exemplifies the
high toxicity of acetate which seems to increase with increasing dilution rate whereas ethanol for
yeast cell rather seems to function as freezing protectant, what has also been found earlier in batch
cultures of S. cerevisiae20
. Figure 4 shows how the yeast population distribution changed
responding to glucose perturbation after the freeze-thaw cycle. At the low dilution rate there was a

Chapter 6 – Population heterogeneity in E. coli and S. cerevisiae continuous cultivations as a
response to growth rate and glucose perturbation 148
slight shift to lower fluorescence and a widening of the peak. In contrast, the high dilution rate
population showed a dramatic peak widening and a shift to a lower fluorescence for a large part of
the population. Why the pulse seems to protect some of the faster growing cells from freeze-thaw
damage is not straight forward to explain. The only thing connected to the physiology of the cells
that can react on the time-scales of the almost instantaneous changes observed is the intra-cellular
metabolite levels. One could surmise that the fast growing cells, already primed for over-flow
metabolism, quickly absorbed the glucose and perhaps even produced some storage carbohydrates,
e.g. trehalose which in yeast is found to accumulate as response to freeze stress47
. An intracellular
shift in metabolite concentrations might very well affect the physics of the freezing process offering
additional protection to the cell membrane.
6.4.5 Potential with the reporter strains and future outlook
High-throughput, single-cell gene expression studies are vital for elucidating the dynamics and
contributions of heterogeneous cell populations. In general, the new tools presented here combines
reporter strains and mathematical methods to explore subpopulation dynamics in changing
environments. Changes that traditionally were only subjectively quantified by comparing classical
histograms can be now be objectively quantified and analyzed using these mathematical tools. The
tools can be used to facilitate analysis and interpretation of cytomics data and provide insight for the
generation of future strategies for the improvement of performance and robustness of industrial
scale cultivations.
Acknowledgement
The Danish Council for Strategic Research is gratefully acknowledged for financial support in the
frame of the project “Towards robust fermentation processes by targeting population heterogeneity
at microscale” (project number 09-065160). ERA-IB (ERA-NET Industrial Biotechnology) is
gratefully acknowledged for financial support in the frame of the project “Targeting population
heterogeneity at microscale for robust fermentation processes” (project number EIB.08.031).

Chapter 6 – Population heterogeneity in E. coli and S. cerevisiae continuous cultivations as a
response to growth rate and glucose perturbation 149
6.5 References
1. Fernandes, R. L. et al. Experimental methods and modeling techniques for description of cell
population heterogeneity. Biotechnol. Adv. 29, 575–599 (2011).
2. Avery, S. V. Microbial cell individuality and the underlying sources of heterogeneity. Nat.
Rev. Microbiol. 4, 577–87 (2006).
3. Müller, S., Harms, H. & Bley, T. Origin and analysis of microbial population heterogeneity
in bioprocesses. Curr. Opin. Biotechnol. 21, 100–113 (2010).
4. Lara, A. R., Galindo, E., Ramírez, O. T. & Palomares, L. A. Living With Heterogeneities in
Bioreactors Living With Heterogeneities in Bioreactors. Mol. Biotechnol. 34, (2006).
5. George, S., Larsson, G., Olsson, K. & Enfors, S.-O. Comparison of the Baker’s yeast process
performance in laboratory and production scale. Bioprocess Eng. 18, 135–142 (1998).
6. Carlquist, M. et al. Physiological heterogeneities in microbial populations and implications
for physical stress tolerance. Microb. Cell Fact. 11, (2012).
7. Bylund, F., Collet, E., Enfors, S.-O. & Larsson, G. Substrate gradient formation in the large-
scale bioreactor lowers cell yield and increases by-product formation. Bioprocess Eng. 18,
(1998).
8. Enfors, S. O. et al. Physiological responses to mixing in large scale bioreactors. J.
Biotechnol. 85, 175–185 (2001).
9. Taymaz-Nikerel, H., van Gulik, W. M. & Heijnen, J. J. Escherichia coli responds with a
rapid and large change in growth rate upon a shift from glucose-limited to glucose-excess
conditions. Metab. Eng. 13, 307–318 (2011).
10. Schweder, T. et al. Monitoring of genes that respond to process-related stress in large-scale
bioprocesses. Biotechnol. Bioeng. 65, 151–159 (1999).
11. Yosef, N. & Regev, A. Impulse control: Temporal dynamics in gene transcription. Cell 144,
886–896 (2011).
12. Ronen, M. & Botstein, D. Transcriptional response of steady-state yeast cultures to transient
perturbations in carbon source. Proc. Natl. Acad. Sci. U. S. A. 103, 389–394 (2006).
13. Mashego, M. R., van Gulik, W. M., Vinke, J. L., Visser, D. & Heijnen, J. J. In vivo kinetics
with rapid perturbation experiments in Saccharomyces cerevisiae using a second-generation
BioScope. Metab. Eng. 8, 370–383 (2006).
14. Zakrzewska, A. et al. Genome-wide analysis of yeast stress survival and tolerance
acquisition to analyze the central trade-off between growth rate and cellular robustness. Mol.
Biol. Cell 22, 4435–4446 (2011).

Chapter 6 – Population heterogeneity in E. coli and S. cerevisiae continuous cultivations as a
response to growth rate and glucose perturbation 150
15. Kresnowati, M. T. a P. et al. When transcriptome meets metabolome: fast cellular responses
of yeast to sudden relief of glucose limitation. Mol. Syst. Biol. 2, (2006).
16. Wu, L. et al. Short-Term Metabolome Dynamics and Carbon , Electron , and ATP Balances
in Chemostat-Grown Saccharomyces cerevisiae CEN . PK 113-7D following a Glucose
Pulse. Appl. Environ. Microbiol. 72, 3566–3577 (2006).
17. Gasch, A. P. & Werner-Washburne, M. The genomics of yeast responses to environmental
stress and starvation. Funct. Integr. Genomics 2, 181–192 (2002).
18. Delvigne, F., Boxus, M., Ingels, S. & Thonart, P. Bioreactor mixing efficiency modulates the
activity of a prpoS::GFP reporter gene in E. coli. Microb. Cell Fact. 8, (2009).
19. Gasch, a P. et al. Genomic expression programs in the response of yeast cells to
environmental changes. Mol. Biol. Cell 11, 4241–4257 (2000).
20. Lewis, J. G., Learmonth, R. P. & Watson, K. freeze-thaw stress resistance of Role of Growth
Phase and Ethanol in Freeze-Thaw Stress Resistance of Saccharomyces cerevisiae. Appl.
Environ. Microbiol. 59, (1993).
21. Brauer, M. J. et al. Coordination of Growth Rate , Cell Cycle , Stress Response , and
Metabolic Activity in Yeast. Mol. Biol. Cell 19, 352–367 (2008).
22. Hua, Q., Yang, C., Oshima, T., Mori, H. & Shimizu, K. Analysis of Gene Expression in
Escherichia coli in Response to Changes of Growth-Limiting Nutrient in Chemostat Cultures
Analysis of Gene Expression in Escherichia coli in Response to Changes of Growth-Limiting
Nutrient in Chemostat Cultures. Appl. Environ. Microbiol. 70, (2004).
23. Han, S., Delvigne, F., Brognaux, A., Charbon, G. E. & Sørensen, S. J. Design of growth-
dependent biosensors based on destabilized GFP for the detection of physiological behavior
of Escherichia coli in heterogeneous bioreactors. Biotechnol. Prog. 29, 553–563 (2013).
24. Regenberg, B. et al. Growth-rate regulated genes have profound impact on interpretation of
transcriptome profiling in Saccharomyces cerevisiae. Genome Biol. 7, (2006).
25. Han, S., Delvigne, F., Brognaux, A., Charbon, G. E. & Sorensen, S. J. Design of growth-
dependent biosensors based on destabilized GFP for the detection of physiological behavior
of Escherichia coli in heterogeneous bioreactors. Biotechnol. Prog. (2013).
doi:10.1002/btpr.1694
26. Kacmar, J., Zamamiri, A., Carlson, R., Abu-Absi, N. R. & Srienc, F. Single-cell variability in
growing Saccharomyces cerevisiae cell populations measured with automated flow
cytometry. J. Biotechnol. 109, 239–254 (2004).
27. Attfield, P. V, Choi, H. Y., Veal, D. a & Bell, P. J. Heterogeneity of stress gene expression
and stress resistance among individual cells of Saccharomyces cerevisiae. Mol. Microbiol.
40, 1000–1008 (2001).

Chapter 6 – Population heterogeneity in E. coli and S. cerevisiae continuous cultivations as a
response to growth rate and glucose perturbation 151
28. Verduyn, C., Postma, E., Scheffers, W. a & Van Dijken, J. P. Effect of benzoic acid on
metabolic fluxes in yeasts: a continuous-culture study on the regulation of respiration and
alcoholic fermentation. Yeast 8, 501–517 (1992).
29. Olsson, L., Schulze, U. & Nielsen, J. On-line bioprocess monitoring – an academic discipline
or an industrial tool? TrAC Trends Anal. Chem. 17, 88–95 (1998).
30. Nahku, R. et al. Specific growth rate dependent transcriptome profiling of Escherichia coli
K12 MG1655 in accelerostat cultures. J. Biotechnol. 145, 60–65 (2010).
31. Van Dijken JP et al. An interlaboratory comparison of physiological and genetic properties
of four Saccharomyces cerevisiae strains. Enzyme Microb. Technol. 26, 706–714 (2000).
32. Postma, E., Verduyn, C., Scheffers, W. A. & Dijken, J. P. V. A. N. glucose-limited
chemostat cultures of Enzymic Analysis of the Crabtree Effect in Glucose-Limited
Chemostat Cultures of Saccharomyces cerevisiae. Appl. Environ. Microbiol. 55, 468–477
(1989).
33. Diderich, J. a. Glucose Uptake Kinetics and Transcription of HXT Genes in Chemostat
Cultures of Saccharomyces cerevisiae. J. Biol. Chem. 274, 15350–15359 (1999).
34. Hoek, P. Van, Dijken, J. P. Van & Pronk, J. T. Effect of Specific Growth Rate on
Fermentative Capacity of Baker ’ s Yeast Effect of Specific Growth Rate on Fermentative
Capacity of Baker ’ s Yeast. Appl. Environ. Microbiol. 64, (1998).
35. Larsson, C., von Stockar, U., Marison, I. & Gustafsson, L. Growth and metabolism of
Saccharomyces cerevisiae in chemostat cultures under carbon-, nitrogen-, or carbon- and
nitrogen-limiting conditions. J. Bacteriol. 175, 4809–4816 (1993).
36. Medoff, G., Kobayashi, G. S., Kwan, C. N., Schlessinger, D. & Venkov, P. Potentiation of
Rifampicin and 5-Fluorocytosine as Antifungal Antibiotics by Amphotericin B. Proc. Natl.
Acad. Sci. U. S. A. 69, 196–199 (1972).
37. Visser, D. et al. Analysis of in vivo kinetics of glycolysis in aerobic Saccharomyces
cerevisiae by application of glucose and ethanol pulses. Biotechnol. Bioeng. 88, 157–167
(2004).
38. Robey, R. B. et al. pH-dependent fluorescence of a heterologously expressed Aequorea green
fluorescent protein mutant: in situ spectral characteristics and applicability to intracellular pH
estimation. Biochemistry 37, 9894–9901 (1998).
39. Kayser, A., Weber, J., Hecht, V. & Rinas, U. Metabolic flux analysis of Escherichia coli in
glucose-limited continuous culture. I. Growth-rate-dependent metabolic efficiency at steady
state. Microbiology 151, 693–706 (2005).
40. Nanchen, A., Schicker, A. & Sauer, U. Nonlinear Dependency of Intracellular Fluxes on
Growth Rate in Miniaturized Continuous Cultures of Escherichia coli Nonlinear Dependency
Chapter 6 – Population heterogeneity in E. coli and S. cerevisiae continuous cultivations as a
response to growth rate and glucose perturbation 152
of Intracellular Fluxes on Growth Rate in Miniaturized Continuous Cultures of Escherichia
coli †. Appl. Environ. Microbiol. 72, 1164–1173 (2006).
41. Díaz, M., Herrero, M., García, L. a. & Quirós, C. Application of flow cytometry to industrial
microbial bioprocesses. Biochem. Eng. J. 48, 385–407 (2010).
42. Mazur, P. Freezing of living cells: mechanisms and implications. Am. J. Physiol. 247, 125–
142 (1984).
43. Chudakov, D. M., Matz, M. V, Lukyanov, S. & Lukyanov, K. A. Fluorescent Proteins and
Their Applications in Imaging Living Cells and Tissues. Physiol. Rev. 90, 1103–1163 (2010).
44. Chien, A.-C., Hill, N. S. & Levin, P. A. Cell size control in bacteria. Curr. Biol. 22, 340–349
(2012).
45. Seo, J. H. & Bailey, J. E. Continuous cultivation of recombinant Escherichia coli: Existence
of an optimum dilution rate for maximum plasmid and gene product concentration.
Biotechnol. Bioeng. 28, 1590–1594 (1986).
46. Gervais, P. Cell Size and Water Permeability as Determining Factors for Cell Viability after
Freezing at Different Cooling Rates. J. Biotechnol. 70, 268–272 (2004).
47. Mahmud, S. A., Hirasawa, T. & Shimizu, H. Differential importance of trehalose
accumulation in Saccharomyces cerevisiae in response to various environmental stresses. J.
Biosci. Bioeng. 109, 262–266 (2010).

Chapter 7 – Combined use of fluorescent dyes and a whole cell biosensor to monitor the effect of
acetate on single cell heterogeneity of E. coli in aerobic batch cultures by flow cytometry 153
7. Chapter
Combined use of fluorescent dyes and a whole cell
biosensor to monitor the effect of acetate on single-cell
heterogeneity of E. coli in aerobic batch cultures by flow
cytometry
Luisa Lundin1*
, Anna-Lena Heins2 *
, Inês Nunes1, Shanshan Han
1, Rita Lencastre Fernandes
3, Gitte
E Charbon1, Waleed Abu Al-Soud
1, Krist V Gernaey
3, Søren J Sørensen
1, Anna Eliasson Lantz
2§
1 Department of Biology, Section of Microbiology, University of Copenhagen, 2100 DK,
Copenhagen, Denmark
2 Department of Systems Biology, Technical University of Denmark, 2800 Kongens Lyngby,
Denmark
3 Department of Chemical and Biochemical Engineering, Technical University of Denmark, 2800
Kongens Lyngby, Denmark
§Corresponding author
*These authors contributed equally to the work
Written as journal paper
Status: Manuscript in preparation
Chapter 7 – Combined use of fluorescent dyes and a whole cell biosensor to monitor the effect of
acetate on single cell heterogeneity of E. coli in aerobic batch cultures by flow cytometry 154
Abstract
The appearance of acetate as a by-product in large scale bioprocesses with E. coli is found to
decrease the biomass yield as well as to be toxic to cells, which has several different effects e.g.
large induction of stress responses. However, the underlying cell phenomena are poorly explored.
Here the time-resolved cellular heterogeneity profile of E. coli strain MG1655 during batch growth
on acetate and glucose as carbon sources was studied by applying a growth reporter strain
expressing a destabilized GFP together with different fluorescent activity stains targeting particular
features (viability and metabolic activity). The obtained results from flow cytometry analysis
suggested that, cells are more heterogeneous in growth as well as stronger metabolically challenged
during growth on acetate than when growing on glucose. Furthermore, also compared to acetate
growth after diauxic shift, when growing on acetate as sole carbon source, population heterogeneity
was found to be more significant with the presence of subpopulations. Interestingly considering the
subpopulation distribution some cells seem to be more robust than the rest of the population when
growing on acetate.
In conclusion cellular heterogeneity was evident if not only plotted in traditional averaged data plots
and noticeable in all measured parameters. The developed approach enabled a deeper study of
heterogeneity during growth on the favoured substrate glucose as well as on the toxic acetate. The
use of a combination of activity fluorescent dyes proved to be an accurate and fast alternative and
supplement to the employment of a fluorescent growth reporter strain. However the choice of
combination of stains should be well considered depending on which particular population traits to
aim for.
Keywords: Flow cytometry, Biosensor, Physiology on acetate, Heterogeneity, GFP fluorescence,
Stains, metabolic activity, viability, objective data analysis
7.1 Introduction
The use of living cells for the production of biomass or products such as bulk chemicals (e.g. 1,3-
propanediol, ethanol), enzymes and pharmaceutical proteins (e.g. insulin) has gained increasingly
importance over the last decade1. E. coli is the most commonly used bacterial production host for
proteins, because of its ability of inexpensive, easy and fast expression of proteins2.
Nowadays it is widely known, that microbial cell populations in industrial scale, biotechnological
production processes, though originating from pure, isogenic cultures, are heterogeneous. Due to
non-ideal mixing gradients of e.g. substrate, dissolved oxygen and pH arise which create local

Chapter 7 – Combined use of fluorescent dyes and a whole cell biosensor to monitor the effect of
acetate on single cell heterogeneity of E. coli in aerobic batch cultures by flow cytometry 155
microenvironments that are experienced by the cells traveling throughout the reactor3–5
. This
experience of a fluctuating environment induces dynamic cell responses both genetic, metabolic and
physiological6 level and causes the development of cell population heterogeneity in bioprocesses
7.
Increased population heterogeneity may lead to reduced yields and productivity as well as elevated
by-product formation4,5,8
. For instance, formation of acetate as the major by-product in E. coli
fermentation when glucose is the carbon source, has been seen to decrease the biomass yield in
large scale cultivation due to repeated production/re-assimilation when the cells move from zones
of high glucose and low oxygen concentration to zones with low glucose and high oxygen
saturation9,10
. Hence, zones with different acetate concentration are formed, which is undesirable as
an acetate concentrations above 2 g/L is already toxic for cells11
, having several negative effects on
growth, biomass and recombinant protein production and, as mentioned above, leads to a
detrimental effect on process performance as well as to significant induction of stress responses12,13
.
However, the underlying cellular phenomena are poorly understood and potential occurrence of less
productive or less robust subpopulations would reduce the overall process efficiency. This points to
the need for investigating the physiology at subpopulation level, especially cell viability and
robustness towards stress, and population dynamics of E. coli cells growing with acetate as sole
carbon source10
. Once a deeper understanding for differences between cells in a population has been
gained, strategies for process optimization, favoring beneficial subpopulations may be developed.
Ordinary bioprocess monitoring often relies solely on population-based average measurements
which by not distinguishing co-existing cell behaviors, are unable to reflect the heterogeneity
among individual cells within a population14
. Flow cytometry (FC) has been applied to discover and
monitor cell-to-cell differences, cellular mechanisms and regulatory circuits at single-cell level15
by
applying fluorescent stains as well as reporter strains expressing a fluorescence protein whose
expression can be correlated to a gene product of interest7. Furthermore, the application of more
than one fluorescent stain simultaneously unveils functional differences between bacterial cells, and
as so population heterogeneity16
. This enables the study of the physiological state of bacteria with a
high resolution achieving distributions of the measured parameters, and these methodologies have
also been applied to study heterogeneity of microbial populations grown in batch cultures17,18
.
A big variety of fluorescence stains targeting different cellular properties are commercially
available allowing the assessment of population heterogeneity. The redox dye, 5-cyano-2,3-ditolyl
tetrazolium chloride (CTC), is reduced by electron transport activity to a water insoluble,
intracellular red fluorescent formazan and has commonly been used for monitoring the respiratory

Chapter 7 – Combined use of fluorescent dyes and a whole cell biosensor to monitor the effect of
acetate on single cell heterogeneity of E. coli in aerobic batch cultures by flow cytometry 156
activity of cells19–21
. The still relatively unused stain, redox sensor green (RSG) is a vitality stain
that becomes fluorescent (green) when altered by bacterial reductases22
and as many of these are
part of the electron transport system, this stain has also been employed as an indicator of the
respiratory ability of bacteria23
. The membrane permeable, asymmetrical cyanine dye, SYBR green,
binds readily to nucleic acids in cells and it has been applied in flow cytometry to among other
things quantify bacteria in crude environmental samples24,25
. As a counterpart to activity
measurements, the propidium iodide (PI) dye has commonly been used as a membrane integrity
indicator. It is a nucleic acid stain that is also membrane impermeable and therefore employed to
detect cells with disrupted membranes in bacterial populations26
. Cells that are not metabolically
active, lack the ability to exchange ions through the membrane, due to lack of membrane potential.
The bis-(1,3-dibarbituric acid)-trimethine oxanol (DiBAC4(3)) dye has the ability to enter
depolarized cells and, while retained inside, turns green27
.
As mentioned above, potential cellular heterogeneities in bioreactors may also be investigated by
the combined use of FC analysis and the microbial population itself as reporter28
. The green
fluorescent protein (GFP) is a small bioluminescent protein that is used as promoter activity reporter
in many bacteria and yeast cells, not interfering with cell growth29,30
. The high degree of stability of
the wild type GFP might pose a problem in some experiments where transient gene expression is
studied. Non-active, non-viable or dormant microbial cells containing stable GFP would continue to
express the fluorescent signal even in the absence of promoter gene expression and over many cell
generations31. It has been reported that the addition of an AAV-tag to the C-terminal of the template
GFPmut3.1, reduces its half-life from 24 h to 60 min, forming a destabilized form of GFP32
. A growth
reporter (biosensor strain) with the gene encoding a destabilized GFP variant (AVV) fused to the E.
coli ribosomal promoter rrnB P1P233
was used in the present study. This promoter is known to be
growth rate regulated and responsive to nutrient starvation34
.
In this study, the effect of acetate on physiological heterogeneity and viability of E. coli was
investigated under two different conditions in batch culture; while growing on acetate as sole
carbon source eliminating the effect of glucose as well as while consuming acetate after diauxic
shift. Additionally physiology was compared to growth on glucose. To assess population
heterogeneity, we applied a combination of five different fluorescent stains, CTC, RSG, SYBR
green, DiBAC4 and PI, and an E. coli growth reporter strain expressing a destabilized GFP. The
change of the state of the individual cells in the microbial population throughout the batch

Chapter 7 – Combined use of fluorescent dyes and a whole cell biosensor to monitor the effect of
acetate on single cell heterogeneity of E. coli in aerobic batch cultures by flow cytometry 157
experiment was analyzed by FC and quantified using simple mathematical tools. We hypothesize
that acetate strongly affects the percentage of metabolically active cells.
7.2 Material and Methods
7.2.1 Strains
A biosensor strain based on the expression of destabilized GFP under the control of the rrnB P1P2
promoter, namely, MG1655/pGS20PrrnBGFPAAV, was used to illustrate the growth dynamics of a
bacterial population in batch cultures35
. The recombinant strain MG1655 bearing pGS20PrrnB, i.e. a
strain containing the same plasmid with the rrnB promoter but without the gfp gene, was used as the
control strain for the growth studies and flow cytometric measurements.
7.2.2 Flow cytometry
All bacterial cells were analysed using a FACSAria™ III (Becton Dickinson, USA) flow cytometer.
The system includes two lasers with minimum laser power of 10 mW with the specific wavelengths
of 488 nm and 561 nm. Two scattering channels (FSC and SSC) and two fluorescent detection
channels (530/30 nm and 610/20 nm) were used in the analysis. The amplification voltages on the
detectors were set based on negative and positive controls (stained, non-stained, viable and non-
viable bacterial populations) to better visualize the populations and were as followed: FSC – 301V;
SSC – 316 V; 530/30 nm – 520 V and 610/20 – 582 V. The detection thresholds were set in FSC
and SSC in order to eliminate background noise.
The flow cytometer (FC) specific software was used in combination with CS&T beads (Cytometer
Setup and Tracking beads) (Becton Dickinson, USA) for the automated QA/QC of the machine
performance. All results obtained with the FCM were saved as fcs files.
7.2.3 Staining procedure and validation
Five activity stains were used in this study: 5-cyano-2,3-ditolyltetrazolium chloride (CTC) (Sigma-
Aldrich, Germany), SYBR Green (SYBR) (Invitrogen, USA), Propidium Iodide (PI) (Sigma-
Aldrich, Germany), Bis-(1,3-dibutylbarbituric acid) trimethine oxonol (DiBAC4(3)) (Molecular
probes, USA) and Redox Sensor Green (RSG) (Invitrogen, USA). For each staining procedure, 1
μL of stain was added to 100 µL of sample suspended in 0.9% of saline solution. The final stain
concentrations were 1x for SYBR, 0.05 mg/mL for PI, 0.5 mM for CTC and 0.001 mM for both
DiBAC4(3) and RSG. The CTC staining was incubated for 1 hour at 37ºC. The SYBR staining was

Chapter 7 – Combined use of fluorescent dyes and a whole cell biosensor to monitor the effect of
acetate on single cell heterogeneity of E. coli in aerobic batch cultures by flow cytometry 158
incubated for 20 minutes and DiBAC4(3), PI and RSG for 10 minutes at room temperature. The
stains were protected from the light during the whole procedure.
With the aim to investigate if staining results vary during sample handling, a validation procedure
was performed, which allowed the optimization of the sample handling prior to staining and
subsequent flow cytometric analysis. The biosensor MG1655/pGS20PrrnBGFPAAV was grown in
shake flasks using 100 mL of the defined minimal media36
with addition of either glucose (5 g/L) or
acetate (2 g/L) as a carbon source. The medium used during these validation procedures was
supplemented with 25 μg/mL of chloramphenicol (dissolved in 96% ethanol, stock concentration:
10 mg/ml). The cultures were grown at 37ºC in an orbital shaker at 140 rpm. Samples were taken
every hour until the cultures reached the stationary phase. The optical density at 600nm (OD600) of
the cultures was measured with a UV/Vis photometer (Biophotometer 6131, Eppendorf AG,
Germany) at each time point. The staining procedure was applied to samples immediately, after 30
and 60 minutes of ice incubation as well as after 30 and 60 minutes of room temperature incubation.
Flow cytometry methods (FC) was used to detect the growth dependent GFP expression of the
biosensor and the fluorescent signal of the cells after staining.
Two-way analysis of variance (ANOVA) was applied to the obtained mean fluorescence signals,
using the GraphPad Prism 5 (GraphPad, Inc, USA) software. A significance level of 0.05 was
employed. Thus, adequate incubation times and temperatures were chosen when no significant
differences (p>0.05) were observed between the results obtained immediately after sampling and
after the different tested incubation conditions. Based on the validation results, the samples for
staining with RSG, SYBR green and PI should be kept on ice until flow cytometric measurements.
For the DiBAC4(3) staining, the samples collected during the first ten hours of growth in batch
were placed at room temperature and on ice after this time point. The samples to be stained with
CTC were kept at room temperature. Proper dilution increases staining efficiency and accuracy, so
based on calibration curves relating the OD600 and the number of events recorded in the flow
cytometer, samples with an OD600 above 0.2 were diluted 10 times before staining.
7.2.4 Preculture preparation
The inocula used to start the batch cultures were obtained by a two-step procedure. First, a single
colony of the biosensor MG1655/pGS20PrrnBGFPAAV strain grown a fresh LB plate was used to
inoculate a flask containing 100 ml of LB medium and incubated at 37 ºC incubated overnight.
Secondly, a dilution series with 10-fold steps in LB medium was prepared from the overnight
culture, and grown for 6 to 8 hours at 37ºC on an orbital shaker (160 rpm). Subsequently the OD600

Chapter 7 – Combined use of fluorescent dyes and a whole cell biosensor to monitor the effect of
acetate on single cell heterogeneity of E. coli in aerobic batch cultures by flow cytometry 159
was measured for the whole dilution series, and the one with a 0.4< OD600< 0.6 was used to
inoculate the bioreactors. The medium used in the pre-cultures was supplemented with 25 μg/mL of
chloramphenicol (dissolved in 96% ethanol, stock concentration: 10 mg/ml). The same procedure
was used to prepare the inoculum of the control strain.
7.2.5 Batch cultivation
Batch cultivations of the biosensor MG1655/pGS20PrrnBGFPAAV strain were performed using 5
g/L glucose or 2 g/L acetate as carbon source. The growth medium used was a defined mineral
medium36
. After autoclavation, 3 mL MgSO4, 1 mL trace metal solution and 25 µg/ml
chloramphenicol were added by sterile filtration (0.2 µm). All cultivations were performed using 1-
liter bioreactors (Sartorius, B. Braun Biotech International, GmbH, Melsungen, Germany) with a
working volume of 1 L. The pH and DOT electrodes (Mettler Toledo, USA) were calibrated
according to standard procedures provided by the manufacturer using a two-point calibration (pH 4
and 7 respectively gassing with air (100%) or nitrogen).
The inoculum achieved from the pre-cultivation was used to inoculate the bioreactor to a final
OD600 of 0.005 for both carbon sources. The pH was controlled at pH 7 using 2 M NaOH and 2 M
HCl. Temperature, aeration and stirring were kept constant at 37°C, 1v/v/m and 1000 rpm, to avoid
oxygen limitation. A mass spectrometer (Prima Pro Process MS, Thermo Fisher Scientific,
Winsford UK) was used for continuous analysis of the off-gas composition.
Samples for OD600 measurements, high performance liquid chromatography (HPLC), dry weight
(DW) measurements and flow cytometry analysis were withdrawn periodically every 1.5 or 2 hours.
Samples for OD600 and DW were analyzed directly, whereas filtrated samples for HPLC were kept
at -20 C until measurement. Samples for flow cytometry were kept on ice or at room temperature
until analysis (see “Staining procedure and validation”).
7.2.6 OD, DW and HPLC
Growth was followed with OD600 measurements using a Shimadzu UV mini 1240
spectrophotometer (Shimidzu, Kyoto, Japan). For dry weight measurements 5 ml of the cultivation
broth was filtered, washed and dried for 20 min at 150W in a microwave, cooled down in
desiccators and afterwards weighed on an analytical balance37
. The concentrations of glucose,
succinate, acetate, ethanol, glycerol, lactate, formate and pyruvate were determined by HPLC
(Agilent 1100, Agilent Technologies, CA, USA) with a 300 mm × 7.8 mm Aminex HPX-87H ion
exchange column (Bio-Rad, Hercules, CA, USA), refractive index detector (RID Agilent 1200,

Chapter 7 – Combined use of fluorescent dyes and a whole cell biosensor to monitor the effect of
acetate on single cell heterogeneity of E. coli in aerobic batch cultures by flow cytometry 160
Agilent Technologies, CA, USA) and UV detector (Agilent 1100, Agilent Technologies, CA, USA)
set to 210 nm. The mobile phase was 5 mM H2SO4 (aq.), temperature 60°C and flow rate 0.6
mL/min.
7.2.7 Data analysis
Processing and analysis of the flow cytometry raw data was performed using MatLab ® R2010b
(The MathWorks, Inc., Natick, MA, USA). The raw data were extracted as fcs files and loaded into
MatLab with the readfsc function (by L. Balkay, University of Debrecen, Hungary, available on
MatLab central file sharing). The HPLC data were collected in an excel file and imported into
MatLab. The data from the fcs files were extracted and saved into mat files including the recorded
fluorescence for the different staining, GFP fluorescence and the FSC and SSC. The cumulative cell
distribution function (cdf) from the 1024 recording channels of the flow cytometer was fitted to the
fluorescence data using the hist function and afterwards applying the cdfplot function. By applying
the hist function to the 1024 recording channels cell count was saved for all channels and plotted as
channel number fluorescence for the used detector of the flow cytometer. Biplots for FSC and
fluorescence (GFP and stains) were created using this function. With the help of the function
FindGate (by M. McClean, Princeton University, USA, available on MatLab central file sharing) all
data have been gated for the main bacterial size population. For better quantitative data for the
fluorescence distributions (GFP and stains), the peakwidth at baseline level was calculated by
searching for the borders of the peak, which were considered as at least 5 cell counts per channel
number to disregard the noise level of the flow cytometer. By subtracting the channel numbers for
the higher and lower border the peakwidth was determined. Furthermore, the mean function was
used to calculate the mean fluorescence (GFP and stains). By dividing the peakwidth by the mean
fluorescence (GFP and stains) the coefficient of variance (CV) of the distribution was generated.
Finally the slope of the cdfplot was estimated by fitting a line to the exponential part of the
cumulative distribution of the fluorescence histograms (GFP and stains) by using the polyfit
function with a degree of one. For SYBR, RSG and CTC for cells grown on acetate the sub-
population percentage was computed by dividing the histogram plot into three areas, a low, middle
and a high fluorescent area. The areas were set in relation to the local minimum in the histogram
between two sub-populations, which was calculated using the min function. The middle
fluorescence range was excluded to avoid biased data and then the sub-population percentage in the
low and high range was calculated by dividing the cell amount in the sub-population by the total
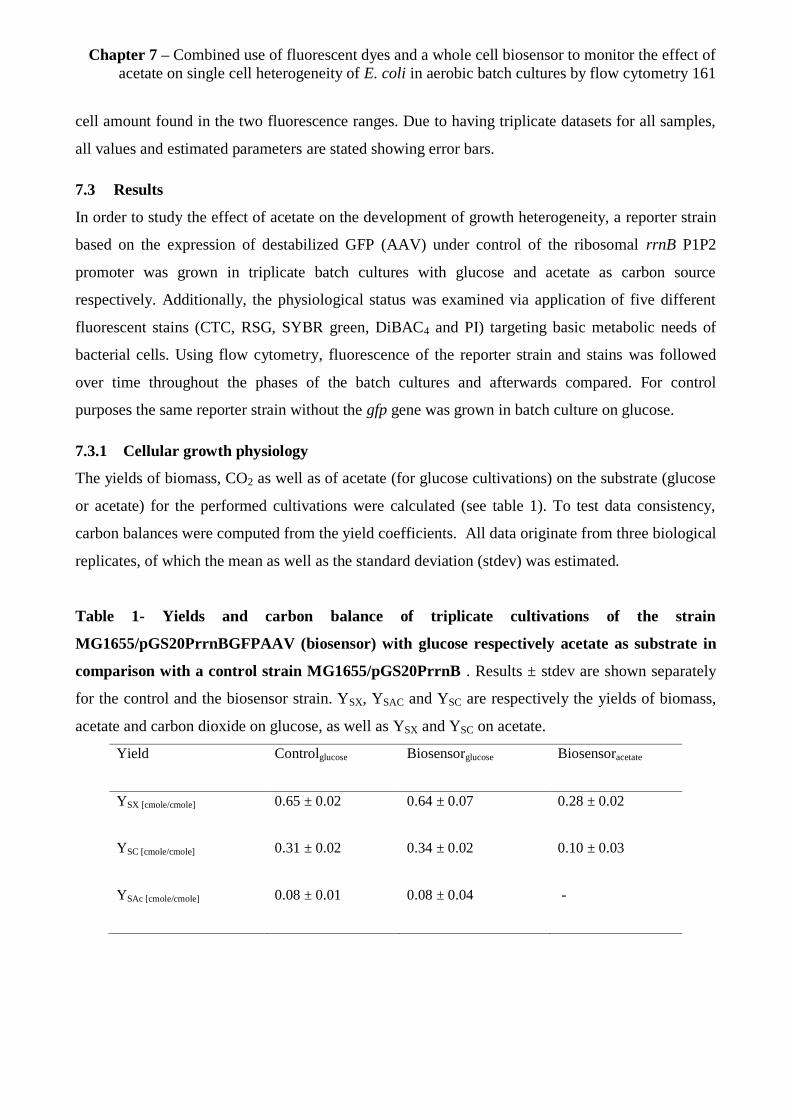
Chapter 7 – Combined use of fluorescent dyes and a whole cell biosensor to monitor the effect of
acetate on single cell heterogeneity of E. coli in aerobic batch cultures by flow cytometry 161
cell amount found in the two fluorescence ranges. Due to having triplicate datasets for all samples,
all values and estimated parameters are stated showing error bars.
7.3 Results
In order to study the effect of acetate on the development of growth heterogeneity, a reporter strain
based on the expression of destabilized GFP (AAV) under control of the ribosomal rrnB P1P2
promoter was grown in triplicate batch cultures with glucose and acetate as carbon source
respectively. Additionally, the physiological status was examined via application of five different
fluorescent stains (CTC, RSG, SYBR green, DiBAC4 and PI) targeting basic metabolic needs of
bacterial cells. Using flow cytometry, fluorescence of the reporter strain and stains was followed
over time throughout the phases of the batch cultures and afterwards compared. For control
purposes the same reporter strain without the gfp gene was grown in batch culture on glucose.
7.3.1 Cellular growth physiology
The yields of biomass, CO2 as well as of acetate (for glucose cultivations) on the substrate (glucose
or acetate) for the performed cultivations were calculated (see table 1). To test data consistency,
carbon balances were computed from the yield coefficients. All data originate from three biological
replicates, of which the mean as well as the standard deviation (stdev) was estimated.
Table 1- Yields and carbon balance of triplicate cultivations of the strain
MG1655/pGS20PrrnBGFPAAV (biosensor) with glucose respectively acetate as substrate in
comparison with a control strain MG1655/pGS20PrrnB . Results ± stdev are shown separately
for the control and the biosensor strain. YSX, YSAC and YSC are respectively the yields of biomass,
acetate and carbon dioxide on glucose, as well as YSX and YSC on acetate.
Yield Controlglucose Biosensorglucose Biosensoracetate
YSX [cmole/cmole] 0.65 ± 0.02 0.64 ± 0.07 0.28 ± 0.02
YSC [cmole/cmole] 0.31 ± 0.02 0.34 ± 0.02 0.10 ± 0.03
YSAc [cmole/cmole] 0.08 ± 0.01 0.08 ± 0.04 -

Chapter 7 – Combined use of fluorescent dyes and a whole cell biosensor to monitor the effect of
acetate on single cell heterogeneity of E. coli in aerobic batch cultures by flow cytometry 162
All yields for the glucose cultivations are in agreement with earlier studies36,38
. Moreover, the
yields of the biosensor strain did not differ significantly from the control strain with no GFP
expression (table 1). The carbon balance for cultivations with glucose as the substrate could be
closed within 1.05±0.00 and 1.06±0.04, for the control and the biosensor strain, respectively.
Both strains showed a typical growth behavior with glucose as substrate (figure 1A for the
biosensor, data for the control strain not shown). After a phase of slow growth/lag phase (around
6h), an exponential growth phase with glucose consumption accompanied by the production of
acetate, biomass and CO2 followed. Both strains exhibited almost the same maximum specific
growth rate, which was µmax = 0.72 h-1
± 0.03 for the control strain, and µmax = 0.70 h-1
± 0.02 for the
biosensor. With glucose depletion after around 10 h, the cells underwent diauxic shift, upon which
the prior produced acetate was consumed. In this phase biomass was further accumulated, though
with a lower rate compared to when glucose was the substrate (µacetate = 0.1 h-1
± 0.02). Stationary
phase was reached after approximately 14 h. No other metabolites than the above mentioned could
be detected.
Compared to growth on glucose, when growing on acetate (figure 1B) the biosensor exhibited a
longer phase of slow growth/lag phase (around 17h), where after acetate was consumed
accompanied by biomass production until depletion after around 35h. The maximum specific
growth rate (µmax = 0.15 h-1
± 0.04) as well as the biomass production (final value: 1g/L) was lower,
resulting in 50% lower biomass yield (table 1), than for growth on glucose (final value: 2g/L),
though comparable with growth on acetate after diauxic shift. Also the CO2 production was
comparably low for all time points (fig. 1B) also resulting in around 66% less CO2 yield compared
to glucose cultivation (table 1). No other metabolites could be identified. When calculating the
carbon balance for the biosensor grown on acetate, around 61% of the carbon was missing, though
the biomass yield is consistent with the findings of Andersen and Von Meyenburg (1980)39
as well
as with Steinsiek et al. (2011)38
. From the HPLC chromatograms, an unidentified peak could be
seen, which may be oxaloacetate (data not shown). A possible reason is that oxaloacetate was over-
produced through the bypass of isocitrate dehydrogenase in acetate grown cultures, and was central
to successful adaption and growth on acetate40
.
7.3.2 GFP fluorescence during growth on glucose and acetate
To follow growth related heterogeneities over time in the different batch cultures, the GFP
expression of the growth reporter strain was measured by flow cytometry. The mean values for GFP
fluorescence for the strain growing on glucose (A) respectively acetate (B) are presented in figure 1.

Chapter 7 – Combined use of fluorescent dyes and a whole cell biosensor to monitor the effect of
acetate on single cell heterogeneity of E. coli in aerobic batch cultures by flow cytometry 163
Figure 1 - Physiology and mean GFP fluorescence along time for the strain
MG1655/pGS20PrrnBGFPAAV (biosensor) in batch cultivation growing with glucose (A)
respectively acetate as carbon source (B). Time profiles are shown for biomass, substrate
concentration (g/L), CO2 (%), mean GFP fluorescence (arbitrary units) as well as acetate
concentration (g/L). All values are provided including standard deviation originating from triplicate
cultivations.
The biosensor signal (GFP expression) was rather low throughout the cultivations, which also has
been observed for similar cultivations earlier33
. However, a similar trend for both glucose and
acetate grown cells could be observed, as the fluorescent signal slightly increased during the
exponential growth phase and subsequently decreased again towards the end of the cultivation
(figure 1 and 2). For the cultivations with glucose as substrate, the mean fluorescence already

Chapter 7 – Combined use of fluorescent dyes and a whole cell biosensor to monitor the effect of
acetate on single cell heterogeneity of E. coli in aerobic batch cultures by flow cytometry 164
decreased slightly during the second growth phase, the exponential growth on acetate (mean and
stdv 194±10.87) compared to exponential growth on glucose (mean and stdv 212.46±37.69) thereby
exhibiting lower mean fluorescence values than for exponential growth on acetate as sole carbon
source (mean and stdv 220±21.36), which can also be seen considering histogram plots throughout
the cultivations (figure 2).
7.3.3 Physiological status evaluation by fluorescent staining
To gain further insight into the physiological state of the strain at a single cell level during growth
on acetate in comparison to glucose and to assess the effect acetate has on the degree of population
heterogeneity, a combination of fluorescent stains were applied, targeting the membrane status and
chosen metabolic activities.
7.3.3.1 Membrane status assessment
The assessment of the cellular membrane status was made using PI and DiBAC4(3). For both stains
a very low percentage of positive stained cells were detected, hence indicating that cells had intact
membranes and maintained the membrane potential for all growth conditions applied in this study
(data not shown). However, it was noticed that the amount of PI positive cells showed a slight
increase at the beginning of the exponential growth phase for both, cells growing on acetate
respectively glucose as sole carbon source, whereas this increase was not observed when cells grew
on acetate after diauxic shift.
7.3.3.2 Metabolic activity assessment
To gain a deeper understanding of metabolic heterogeneity for growth on acetate and glucose and to
highlight eventual subpopulations, the DNA and vitality stains: SYBR green, CTC and RSG were
applied. The metabolic activity changes over time for both carbon sources were monitored by
measuring the fluorescence distribution for cells grown on glucose (figure 2A-D) and on acetate
(figure 2E-H) along the growth curve. Due to differences in growth rate, data from all batch growth
phases are presented for the strain growing on glucose whereas for the strain growing on acetate
most of the presented results are related to the exponential phase.
The histogram profiles for the CTC stain (figure 2A, E) were distinct different for cells growing on
the two different carbon sources. For cells from pure acetate cultures, the CTC distribution was
broader compared to cells from glucose cultures, hence more heterogeneous and displayed a small
subpopulation exhibiting a higher respiratory activity than the main population. Furthermore, for the
main population, a lower fluorescence signal was observed for cells grown on acetate compared to
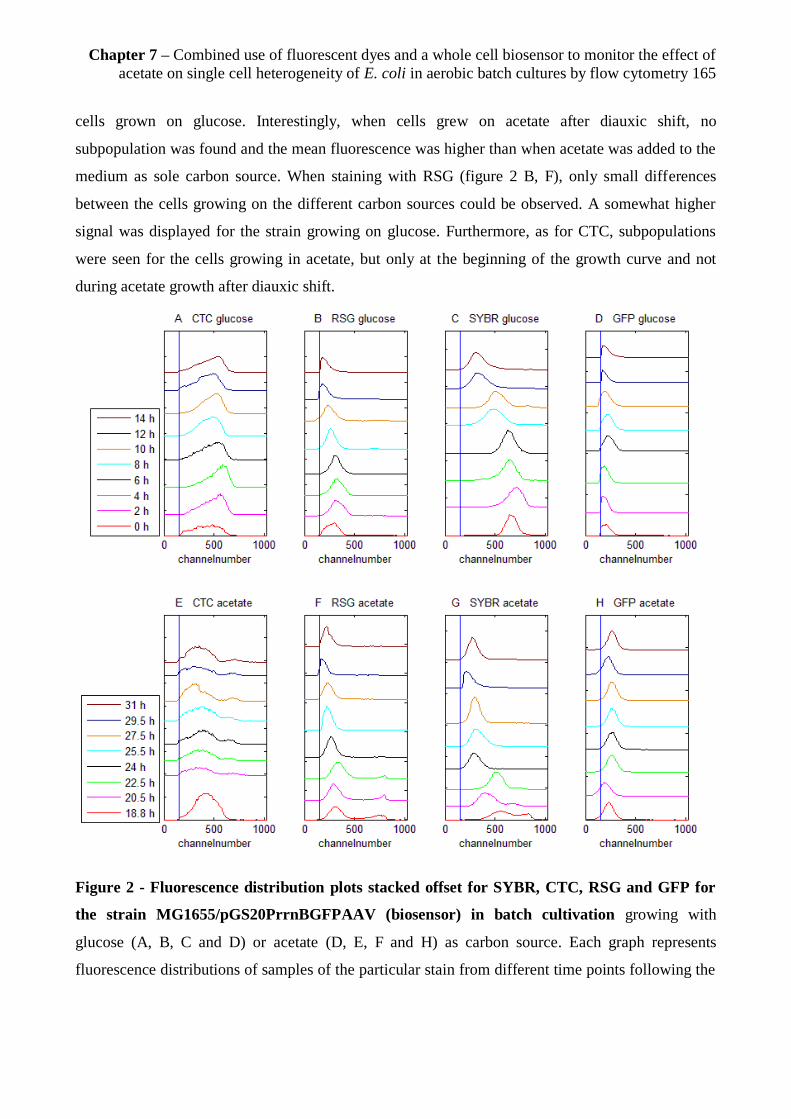
Chapter 7 – Combined use of fluorescent dyes and a whole cell biosensor to monitor the effect of
acetate on single cell heterogeneity of E. coli in aerobic batch cultures by flow cytometry 165
cells grown on glucose. Interestingly, when cells grew on acetate after diauxic shift, no
subpopulation was found and the mean fluorescence was higher than when acetate was added to the
medium as sole carbon source. When staining with RSG (figure 2 B, F), only small differences
between the cells growing on the different carbon sources could be observed. A somewhat higher
signal was displayed for the strain growing on glucose. Furthermore, as for CTC, subpopulations
were seen for the cells growing in acetate, but only at the beginning of the growth curve and not
during acetate growth after diauxic shift.
Figure 2 - Fluorescence distribution plots stacked offset for SYBR, CTC, RSG and GFP for
the strain MG1655/pGS20PrrnBGFPAAV (biosensor) in batch cultivation growing with
glucose (A, B, C and D) or acetate (D, E, F and H) as carbon source. Each graph represents
fluorescence distributions of samples of the particular stain from different time points following the

Chapter 7 – Combined use of fluorescent dyes and a whole cell biosensor to monitor the effect of
acetate on single cell heterogeneity of E. coli in aerobic batch cultures by flow cytometry 166
batch. The blue line in the graphs is indicating the negative control without the corresponding stain.
For glucose cultivations, exponential growth on glucose was seen between 6 and 10h, growth on
acetate between 10 and 14h, where after the cells entered stationary phase. For the acetate
cultivations, the samples presented are all from exponential growth phase.
Clear differences were seen for SYBR fluorescence between the populations growing on acetate
and on glucose (figure 2 C, G). For cells grown on glucose, the DNA/RNA content (expressed as
SYBR fluorescence) was high from the beginning, but shifted down after around 8 h, coinciding
with the end of exponential growth phase on glucose and further decreased during the transition to
stationary phase (after around 12 h). For the cells grown on acetate as sole carbon source, the signal
fluctuated significantly during exponential growth. Compared to growth on glucose, the DNA/RNA
content as analyzed using SYBR was generally lower for growth on acetate as sole carbon source as
well as during acetate consumption after diauxic shift.
7.3.4 Heterogeneity of the populations grown on glucose and acetate
Since histogram plots (figure 2) only allow a qualitative description of the fluorescence levels, the
distributions of GFP, CTC, RSG and SYBR fluorescence for each sampling point were
quantitatively analysed by calculating parameters supplementary to the mean fluorescence, the
coefficient of variance (CV), the peakwidth as well as the slope of the cumulative distribution plot
(cdfplot slope) (Heins et al., chapter 6) allowing an objective interpretation of the results (figure 3).
The slope of the cdfplot, which is calculated of the exponential part of the cumulative distribution
(see example for CTC data in figure 4), as well as the peakwidth, meaning the width of the peak at
baseline level, provide information about the shape of a distribution (Heins et al., chapter 6).
Additionally both parameters also give insight about potential subpopulations. A non-purely
exponential shape of the cdfplot representing plateaus will be seen if subpopulations are present (as
in figure 4 D or B) and will be reflected in changes of the slope of the plot. In combination with the
cdfplot slope a rise in peakwitdh can also point towards appearance of subpopulations. The CV is
calculated by dividing the peakwidth by the mean fluorescence and provides information about the
level of heterogeneity of the distribution, as well as about reproducibility of the performed
cultivations (Heins et al., chapter 6). Opposite to the CV and the peakwidth, there is an inverse
relation of the slope values to the level of heterogeneity as a wider peak represents a lower slope.
Considering the CV (figure 3A and D), it is clear that the cells grown on acetate in comparison to
growth on glucose yields more heterogeneity between replicate cultivations, though the level of

Chapter 7 – Combined use of fluorescent dyes and a whole cell biosensor to monitor the effect of
acetate on single cell heterogeneity of E. coli in aerobic batch cultures by flow cytometry 167
heterogeneity within the distribution for growth on glucose and acetate is similar in the beginning of
the exponential phase, except for CTC, where a lower CV was seen for the glucose cultivation (0.23
for glucose, compared to 0.34 for acetate). This was also valid when cells grew on acetate after
glucose depletion (figure 3 A). Furthermore, the CV increased during exponential growth on
glucose for GFP fluorescence, RSG and SYBR, which may be connected to an increasing
peakwidth (figure 3B) whereas it remained constant for CTC. Constant values for the calculated CV
were also seen for all stains and GFP fluorescence for growth on acetate, which can be connected to
constant peakwidths. For the glucose cultivation after glucose depletion, where cells consumed the
produced acetate, the peakwidth stabilised and values were similar to the ones for the cultivations
where acetate was the sole substrate.
The slope of the cdfplot for GFP, RSG and SYBR fluorescence declined throughout exponential
growth on glucose while it remained constant for SYBR (figure 3C and F). For growth on acetate,
both when acetate was added from the start as carbon source as well as after diauxic shift in the
glucose cultivations, similar values were found and no changes in the slope values were observed
throughout the cultivations for neither GFP nor any of the stains, thereby confirming the
observations on heterogeneity level seen using the other parameters. The only exception was the
CTC fluorescence, for which lower slope values for cells from growth on acetate after diauxic shift
were seen than for cells from the pure acetate cultivations. When considering the whole cdfplot
(figure 4) it can be seen, more pronounced than in figure 2, that the distributions for cells grown on
glucose and acetate exhibit differences in the peakshape. For the CTC data, in general, little shifts
and peakshape changes were observed, in glucose and acetate which is in concordance with the
slope observations in figure 3C and F. The only exception is a subpopulation in the acetate batch
(highlighted by the bump in the plot) with higher fluorescence than the main population also visible
in figure 2. Compared to CTC, some shifts are seen in the RSG data for cells growing on glucose,
indicating more heterogeneity. The fluorescence is shifting up from the start of batch and down
again with exponential growth on glucose and acetate growth after diauxic shift. In the acetate
cultivations similar shifts can be seen and additionally a subpopulation is clearly visible, which is
more pronounced in the beginning of exponential growth on acetate. SYBR shows in general more
heterogeneity in the fluorescence level (bigger shifts) as also seen in figure 2 coincidental with
exponential growth on glucose and acetate (after diauxic shift as well as pure acetate culture). While
cells grow on acetate as only carbon source there are also subpopulations visible whereas growth on
acetate after diauxic shift does not exhibit this behavior.
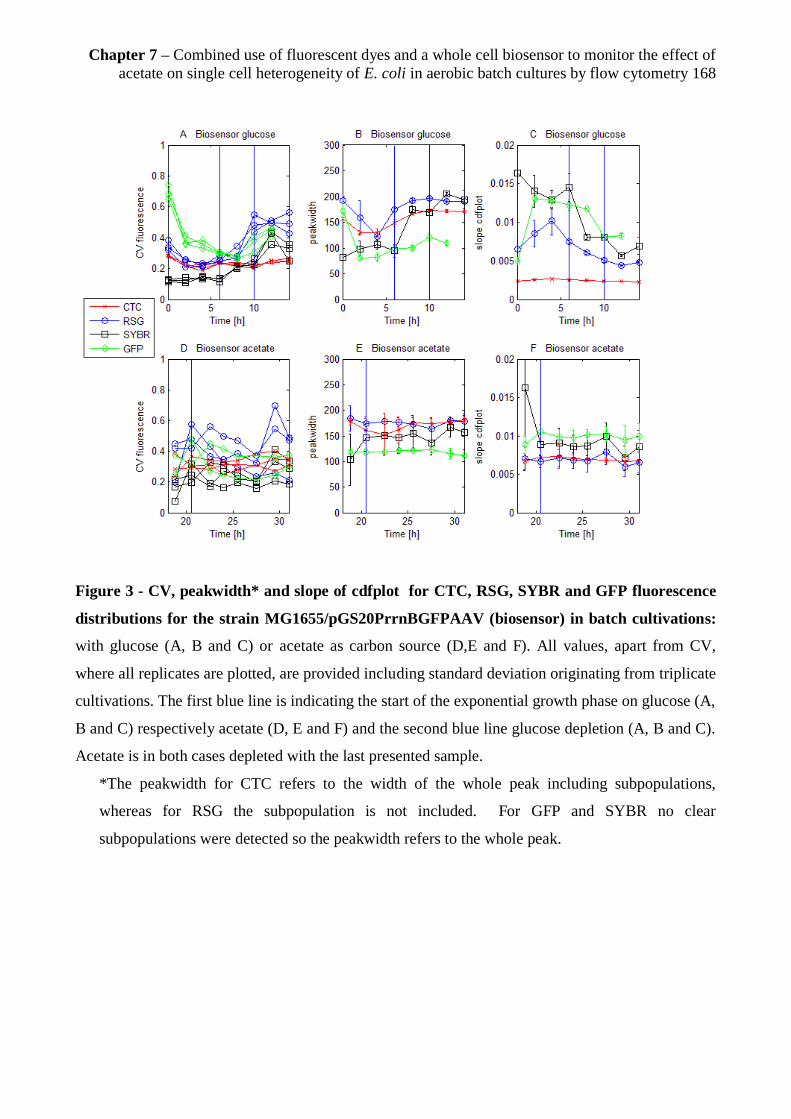
Chapter 7 – Combined use of fluorescent dyes and a whole cell biosensor to monitor the effect of
acetate on single cell heterogeneity of E. coli in aerobic batch cultures by flow cytometry 168
Figure 3 - CV, peakwidth* and slope of cdfplot for CTC, RSG, SYBR and GFP fluorescence
distributions for the strain MG1655/pGS20PrrnBGFPAAV (biosensor) in batch cultivations:
with glucose (A, B and C) or acetate as carbon source (D,E and F). All values, apart from CV,
where all replicates are plotted, are provided including standard deviation originating from triplicate
cultivations. The first blue line is indicating the start of the exponential growth phase on glucose (A,
B and C) respectively acetate (D, E and F) and the second blue line glucose depletion (A, B and C).
Acetate is in both cases depleted with the last presented sample.
*The peakwidth for CTC refers to the width of the whole peak including subpopulations,
whereas for RSG the subpopulation is not included. For GFP and SYBR no clear
subpopulations were detected so the peakwidth refers to the whole peak.

Chapter 7 – Combined use of fluorescent dyes and a whole cell biosensor to monitor the effect of
acetate on single cell heterogeneity of E. coli in aerobic batch cultures by flow cytometry 169
Figure 4 - cdfplots for CTC fluorescence for the strain MG1655/pGS20PrrnBGFPAAV
(biosensor) in batch cultivations: with glucose (A) or acetate as carbon source (D). Each graph
represents cumulative fluorescence distributions from different time points following the batch.
7.3.5 Subpopulation distributions for glucose and acetate grown cells
As mentioned in the sections above, two of the applied stains, namely CTC and RSG, exhibited two
subpopulations (see figure 2 and 4), when growing on acetate whereas for glucose only one main
population could be detected. These subpopulations were gated and in figure 5 the relative fractions
of the high and low fluorescent subpopulation following the batch are depicted. Additionally, the
same gating was applied for SYBR because the whole population was moving, although no clear
subpopulation division was seen.
Figure 5 - Subpopulation distribution for CTC, RSG and SYBR fluorescence for the strain
MG1655/pGS20PrrnBGFPAAV (biosensor) in batch cultivation growing with acetate as carbon
source. Blue represents the high fluorescent population and red the low fluorescent population,

Chapter 7 – Combined use of fluorescent dyes and a whole cell biosensor to monitor the effect of
acetate on single cell heterogeneity of E. coli in aerobic batch cultures by flow cytometry 170
whereas the black line indicates the start of the exponential growth phase on acetate. All values
originate from triplicate cultivations and are provided including standard deviation.
For CTC the subpopulation distribution remained constant throughout the batch, with a low
fluorescent main population, comprehending around 90% of the cells and a small fraction of cells
with a higher fluorescence (around 10%). Contrarily, for RSG the relative ratio of the low
fluorescent subpopulation increased with exponential growth from around 80% to almost 100%
with acetate depletion, whereas the opposite trend was seen for the high fluorescent subpopulation.
For SYBR as mentioned above, no distinct subpopulation division was visible; it was rather the
whole population moving. Prior to the start of exponential growth the percentage of the population
with low fluorescence was only around 10%. Then the relative fraction of the low fluorescent
subpopulation for the SYBR stained cells increased throughout the cultivation to finally include
around 90% of the cells. The standard deviations for calculations of the relative fractions of
subpopulations for SYBR stained cells were high compared to calculations for data from CTC and
RSG staining, indicating less reproducible results between replicates thus higher staining
heterogeneity.
7.4 Discussion
Heterogeneity at the single-cell level is often not deeper investigated as traditional studies of
microbial populations rely on data averaged across thousands or millions of cells in a sample41
. To
enable robust high-yielding bioprocesses it is important to consider and improve the understanding
of microbial population heterogeneity and how population dynamics are influenced by
environmental conditions7. In the present study five different stains targeting metabolic traits in
combination with a GFP-reporter strain were successfully applied for single-cell analysis and
mapping of population distributions over time in E. coli batch cultivations on the substrates acetate
and glucose.
7.4.1 Influence of acetate on heterogeneity of the population in different growth phase
compared to glucose
Growth of E. coli on acetate is inhibited even at very low concentrations, e.g. 0.5 g/l 42
, and this
inhibition becomes very significant in a defined medium when acetate is used as sole carbon
source43
. It is also known that bacterial populations become more asynchronous under stress and
contain cells at all stages of the division cycle44
, leading to a higher level of heterogeneity. Hence,
Chapter 7 – Combined use of fluorescent dyes and a whole cell biosensor to monitor the effect of
acetate on single cell heterogeneity of E. coli in aerobic batch cultures by flow cytometry 171
the hypothesis was that the enhanced stress during growth on acetate would lead to increased
heterogeneity of the population, compared to growth on glucose. Our data support this, as in general
wider and thereby more heterogeneous population distributions with slightly lower mean
fluorescence (for stains as well as the reporter fluorescence) were observed for acetate grown cells.
However, the difference between the two carbon sources was smaller than expected. In general,
comparing acetate growth after diauxic shift to growth on acetate as sole carbon source the cell
population distributions exhibited similar traits, however, the mean fluorescence was more similar
to fluorescence levels for cells grown on glucose and no subpopulation development was detected
after diauxic shift. Interestingly, a small portion of cells that are more robust and tolerant to acetate
stress seem to exist, since for some of the applied stains subpopulations with higher respiratory
activity than the main population were found (figure 2 and 5). Moreover, it is interesting to note that
regardless of the carbon source, hardly any cells with compromised or depolarized membrane (data
from PI and DiBAC4(3) staining), and therefore regarded as non-viable or dormant, were detected.
Concludingly, considering the long phase of slow growth/lag-phase in the acetate cultivations, cells
seem to be stressed and need time to adjust to the harsh growth conditions, but the acetate is not so
toxic that it influences the viability of the cells.
7.4.2 Connection observed between metabolic activity using stains and physiology including
the use of growth reporter strains
In general, in glucose cultures, the cells appeared to respire more actively (RSG and CTC data) and
to synthesize nucleic acids (SYBR green data) before the start of the exponential growth phase
(figure 1 and 2). Afterwards the respiratory activity as well as the synthesis of nucleic acid
decreased with time and when the cells grew on the prior produced acetate all metabolic activities
decreased further before reaching a constant level with the beginning of the stationary phase. The
same trend over the batch growth phases as for the stains could also be followed with the growth
reporter strain. The GFP fluorescence increased with the beginning of the exponential phase on
glucose, indicating active synthesis of ribosomal RNA, before declining during acetate growth and
reaching a plateau with the beginning of the stationary phase.
Discrepancies were found between the results obtained with CTC and RSG. Although both strains
are used to detect respiratory activity, the RSG distributions exhibited more heterogeneity than the
CTC distributions (figure 4). The distinct difference between acetate and glucose grown cells seen
for cells stained with CTC, i.e. more heterogeneous distribution seen for cells from acetate
cultivations, in addition to the existence of a small subpopulation with a higher respiratory level,
Chapter 7 – Combined use of fluorescent dyes and a whole cell biosensor to monitor the effect of
acetate on single cell heterogeneity of E. coli in aerobic batch cultures by flow cytometry 172
was not observed when staining with RSG. However, in general both stains showed a slightly lower
respiratory activity when growing on acetate than during growth on glucose. This might be
connected to the lower growth rate on acetate, which implies a slower metabolism and thereby
lower respiratory activity. This is also supported by the results for SYBR green, demonstrating that
cells exhibit a higher rate of DNA/RNA production when growing with a higher growth rate on
glucose than when growing on acetate. Surprisingly the growth reporter strain revealed slightly
higher GFP fluorescence levels during exponential growth on acetate compared to glucose. This
fact is contradictory to the observation of the higher fluorescent signal for SYBR green from cells
grown on glucose than from cells grown on acetate and to the generally accepted belief that fast
growing cells have a higher number of ribosomal operons resulting in a higher synthesis rate of
rRNA than cells growing at a slower growth rate34
. One explanation might be that glucose exhibits
a repression effect on the ribosomal activity. Potentially the strain’s machinery is working harder to
cope with the harsh conditions in the presence of acetate, as reflected in higher average ribosomal
activity (figure 1) and the RSG and SYBR data (figure 2 B,F,C and G). Further investigations are
required to fully understand the mechanisms involved in these phenomena.
7.4.3 Conclusions and recommendations with regards to the usefulness of the applied stains
CTC has frequently been used to define the amount of “active” bacteria in samples of diverse
origin45,46
. So far a direct correlation between the amount of cells that are actively respiring,
growing and dividing and the amount of cells that reduced enough dye to be detected could not be
verified, though a good correlation between colony forming units (CFU) and CTC positive cells
regardless of the growth phase was found47
. The use of CTC is controversial since a possible toxic
effect to the cells due to lowered counts of positive cells compared to other studies cannot be
obviated. Also an unified protocol for the application of CTC is missing which makes it hard to
compare the obtained results reported in different publications48
. RSG is altered by active
reductases in the cells22
, some of which are part of the electron transport system23
and therefore
enables the assessment of bacterial respiratory and metabolic activity. In conclusion considering our
results although both stains are aiming at displaying respiratory activity, differences were seen
between them, why the choice of which one to utilize should be taken with care depending on the
application. Whereas RSG shows a higher sensitivity and correlates especially for growth on
glucose better with SYBR fluorescence, CTC was able, although exhibiting lower sensitivity, to
display small highly respiring subpopulations.
Chapter 7 – Combined use of fluorescent dyes and a whole cell biosensor to monitor the effect of
acetate on single cell heterogeneity of E. coli in aerobic batch cultures by flow cytometry 173
The two stains targeted to access membrane status, PI and DiBAC4(3), demonstrated very low, not
statistically significant, fractions of positive stained cells. However, it was noticed that the
percentage of PI positive cells increased at the onset of exponential growth for both growth on
glucose and on acetate. These observations appear to corroborate the existence of false positives
when bacteria are actively growing as previously observed in environmental bacterial samples by
Shi et al. 2007 and considering that PI false positives have also been detected in stressed cultures of
S. cerevisiae50
. In conclusion, PI should be used with care when assessing viability of cells under
dynamic growth conditions, therefore DiBAC4(3) may be more suitable as a vitality indicator in
batch cultures.
7.4.4 Potential of the combined use of reporter strains together with stains
The physiological state of microorganisms can be affected by a number of environmental factors,
which consequently may influence the performance of bioprocesses. An understanding of the state
of the individual cells is thus needed to achieve high process efficiency. Traditional cultivation data
reflect the general metabolic ability of the production strains but do not illustrate single cell
differences. Using rapid fluorescent staining procedures and reporter strains combined with FC
provided fast information on cellular physiological status changes and population distributions.
Although this approach was comprehensive, by just choosing one of the stains or in combination
with the growth reporter strain and analyze the distributions quantitatively would already reveal
significant information about population heterogeneity and provide a important complement to the
traditional methods used in industry to monitor batch cultures.
Acknowledgement
The Danish Council for Strategic Research is gratefully acknowledged for financial support in the
frame of the project “Towards robust fermentation processes by targeting population heterogeneity
at microscale” (project number 09-065160). ERA-IB (ERA-NET Industrial Biotechnology) is
gratefully acknowledged for financial support in the frame of the project “Targeting population
heterogeneity at microscale for robust fermentation processes” (project number EIB.08.031). Part of
the work presented here is sponsored by the Portuguese Foundation for Science and Technology by
project SFRH/BD/43996 within the QREN-POPH and through the European Social Fund.

Chapter 7 – Combined use of fluorescent dyes and a whole cell biosensor to monitor the effect of
acetate on single cell heterogeneity of E. coli in aerobic batch cultures by flow cytometry 174
7.5 References
1. Demain, A. L. The business of biotechnology. Ind. Biotechnol. 3, 269–283 (2007).
2. Demain, A. L. & Vaishnav, P. Production of recombinant proteins by microbes and higher
organisms. Biotechnol. Adv. 27, 297–306 (2009).
3. Lara, A. R. et al. Transcriptional and metabolic response of recombinant Escherichia coli to
spatial dissolved oxygen tension gradients simulated in a scale-down system. Biotechnol.
Bioeng. 93, 372–385 (2006).
4. George, S., Larsson, G., Olsson, K. & Enfors, S.-O. Comparison of the Baker’s yeast process
performance in laboratory and production scale. Bioprocess Eng. 18, 135–142 (1998).
5. Larsson, G. et al. Substrate gradients in bioreactors: origin and consequences. Bioprocess
Eng. 14, 281–289 (1996).
6. Avery, S. V. Microbial cell individuality and the underlying sources of heterogeneity. Nat.
Rev. Microbiol. 4, 577–587 (2006).
7. Fernandes, R. L. et al. Experimental methods and modeling techniques for description of cell
population heterogeneity. Biotechnol. Adv. 29, 575–599 (2011).
8. Bylund, F., Collet, E., Enfors, S.-O. & Larsson, G. Substrate gradient formation in the large-
scale bioreactor lowers cell yield and increases by-product formation. Bioprocess Eng. 18,
(1998).
9. Enfors, S. O. et al. Physiological responses to mixing in large scale bioreactors. J.
Biotechnol. 85, 175–185 (2001).
10. Luli, G. W. & Strohl, W. R. Comparison of Growth, Acetate Production, and Acetate
Inhibition of Escherichia-Coli Strains in Batch and Fed-Batch Fermentations. Appl. Environ.
Microbiol. 56, 1004–1011 (1990).
11. Gschaedler, a, Robas, N., Boudrant, J. & Branlant, C. Effects of pulse addition of carbon
sources on continuous cultivation of Escherichia coli containing a recombinant E. coli gapA
gene. Biotechnol. Bioeng. 63, 712–720 (1999).
12. Eiteman, M. A. & Altman, E. Overcoming acetate in Escherichia coli recombinant protein
fermentations. Trends Biotechnol. 24, 530–536 (2006).
13. Shiloach, J. & Fass, R. Growing E. coli to high cell density--a historical perspective on
method development. Biotechnol. Adv. 23, 345–357 (2005).
14. Dhar, N. & McKinney, J. D. Microbial phenotypic heterogeneity and antibiotic tolerance.
Curr. Opin. Microbiol. 10, 30–38 (2007).
Chapter 7 – Combined use of fluorescent dyes and a whole cell biosensor to monitor the effect of
acetate on single cell heterogeneity of E. coli in aerobic batch cultures by flow cytometry 175
15. Fritzsch, F. S. O., Dusny, C., Frick, O. & Schmid, A. Single-Cell Analysis in Biotechnology,
Systems Biology, and Biocatalysis. Annu. Rev. Chem. Biomol. Eng. Vol 3 3, 129–155 (2012).
16. Nebe-von-Caron, G., Stephens, P. J., Hewitt, C. J., Powell, J. R. & Badley, R. a. Analysis of
bacterial function by multi-colour fluorescence flow cytometry and single cell sorting. J.
Microbiol. Methods 42, 97–114 (2000).
17. Quiros, C., Herrero, M., Garcia, L. A. & Diaz, M. Application of flow cytometry to
segregated kinetic modeling based on the physiological states of microorganisms. Appl.
Environ. Microbiol. 73, 3993–4000 (2007).
18. Rezaeinejad, S. & Ivanov, V. Heterogeneity of Escherichia coli population by respiratory
activity and membrane potential of cells during growth and long-term starvation. Microbiol.
Res. 166, 129–135 (2011).
19. Prorot, A., Eskicioglu, C., Droste, R., Dagot, C. & Leprat, P. Assessment of physiological
state of microorganisms in activated sludge with flow cytometry: application for monitoring
sludge production minimization. J. Ind. Microbiol. Biotechnol. 35, 1261–1268 (2008).
20. Rodriguez, G. G., Phipps, D., Ishiguro, K. & Ridgway, H. F. Use of a fluorescent redox
probe for direct visualization of actively respiring bacteria. Appl. Environ. Microbiol. 58,
1801–1808 (1992).
21. Belkova, N. L., Tazaki, K., Zakharova, J. R. & Parfenova, V. V. Activity of bacteria in water
of hot springs from Southern and Central Kamchatskaya geothermal provinces, Kamchatka
Peninsula, Russia. Microbiol. Res. 162, 99–107 (2007).
22. Gray, D. Y., Chueng, C. & Godfrey, W. Bacterial vitality detected by a novel fluorogenic
redox dye using flow cytometry. Abstr. Am. Soc. Microbiol. Meet. Washington, (2005).
23. Kalyuzhnaya, M. G., Lidstrom, M. E. & Chistoserdova, L. Real-time detection of actively
metabolizing microbes by redox sensing as applied to methylotroph populations in Lake
Washington. ISME J 2, 696–706 (2008).
24. Zipper, H., Brunner, H., Bernhagen, J. & Vitzthum, F. Investigations on DNA intercalation
and surface binding by SYBR Green I, its structure determination and methodological
implications. Nucleic Acids Res. 32, (2004).
25. Noble, R. T. & Fuhrman, J. A. Use of SYBR green I for rapid depifluorescence counts of
marine virus and bacteria. Aquat. Microb. Ecol. 14, 113–118 (1998).
26. Strauber, H. & Muller, S. Viability states of bacteria--specific mechanisms of selected
probes. Cytom. A 77, 623–634 (2010).
27. Laflamme, C., Lavigne, S., Ho, J. & Duchaine, C. Assessment of bacterial endospore
viability with fluorescent dyes. J. Appl. Microbiol. 96, 684–692 (2004).

Chapter 7 – Combined use of fluorescent dyes and a whole cell biosensor to monitor the effect of
acetate on single cell heterogeneity of E. coli in aerobic batch cultures by flow cytometry 176
28. Delvigne, F. et al. Green fluorescent protein (GFP) leakage from microbial biosensors
provides useful information for the evaluation of the scale-down effect. Biotechnol. J. 6,
968–978 (2011).
29. Sorensen, S. J., Burmolle, M. & Hansen, L. H. Making bio-sense of toxicity: new
developments in whole-cell biosensors. Curr. Opin. Biotechnol. 17, 11–16 (2006).
30. Andersen, J. B. et al. New unstable variants of green fluorescent protein for studies of
transient gene expression in bacteria. Appl. Environ. Microbiol. 64, 2240–2246 (1998).
31. Leveau, J. H. J. & Lindow, S. E. Predictive and Interpretive Simulation of Green Fluorescent
Protein Expression in Reporter Bacteria. J. Bacteriol. 183, 6752–6762 (2001).
32. Miller, W. G., Leveau, J. H. J. & Lindow, S. E. Improved gfp and inaZ broad-host-range
promoter-probe vectors. Mol. Plant-Microbe Interact. 13, 1243–1250 (2000).
33. Han, S., Delvigne, F., Brognaux, A., Charbon, G. E. & Sorensen, S. J. Design of growth-
dependent biosensors based on destabilized GFP for the detection of physiological behavior
of Escherichia coli in heterogeneous bioreactors. Biotechnol. Prog. (2013).
doi:10.1002/btpr.1694
34. Jin, D. J., Cagliero, C. & Zhou, Y. N. Growth rate regulation in Escherichia coli. FEMS
Microbiol. Rev. 36, 269–287 (2012).
35. Han, S., Delvigne, F., Brognaux, A., Charbon, G. E. & Sørensen, S. J. Design of growth-
dependent biosensors based on destabilized GFP for the detection of physiological behavior
of Escherichia coli in heterogeneous bioreactors. Biotechnol. Prog. 29, 553–563 (2013).
36. Xu, B., Jahic, M. & Blomsten, G. Glucose overflow metabolism and mixed-acid
fermentation in aerobic large-scale fed-batch processes with Escherichia coli. Appl.
Microbiol. Biotechnol. 51, 564–571 (1999).
37. Olsson L, N. J. On Line and in situ Monitoring of Biomass in Submerged Cultivations.
Trends Biotechnol. 15, 517–522 (1997).
38. Steinsiek, S., Frixel, S., Stagge, S. & Bettenbrock, K. Characterization of E. coli MG1655
and frdA and sdhC mutants at various aerobiosis levels. J. Biotechnol. 154, 35–45 (2011).
39. Andersen, K. B. & von Meyenburg, K. Are growth rates of Escherichia coli in batch cultures
limited by respiration? J. Bacteriol. 144, 114–123 (1980).
40. Cozzone, A. J. & El-Mansi, M. Control of isocitrate dehydrogenase catalytic activity by
protein phosphorylation in Escherichia coli. J. Mol. Microbiol. Biotechnol. 9, 132–146
(2005).
41. Avery, S. V. Microbial cell individuality and the underlying sources of heterogeneity. Nat.
Rev. Microbiol. 4, 577–587 (2006).

Chapter 7 – Combined use of fluorescent dyes and a whole cell biosensor to monitor the effect of
acetate on single cell heterogeneity of E. coli in aerobic batch cultures by flow cytometry 177
42. Nakano, K., Rischke, M., Sato, S. & Markl, H. Influence of acetic acid on the growth of
Escherichia coli K12 during high-cell-density cultivation in a dialysis reactor. Appl.
Microbiol. Biotechnol. 48, 597–601 (1997).
43. Koh, B. T., Nakashimada, U., Pfeiffer, M. & Yap, M. G. S. Comparison of Acetate Inhibition
on Growth of Host and Recombinant Escherichia-Coli K12 Strains. Biotechnol. Lett. 14,
1115–1118 (1992).
44. Gilbert, P., Collier, P. J. & Brown, M. R. Influence of growth rate on susceptibility to
antimicrobial agents: biofilms, cell cycle, dormancy, and stringent response. Antimicrob.
Agents Chemother. 34, 1865–1868 (1990).
45. Bartosch, S., Mansch, R., Knötzsch, K. & Bock, E. CTC staining and counting of actively
respiring bacteria in natural stone using confocal laser scanning microscopy. J. Microbiol.
Methods 52, 75–84 (2003).
46. Servais, P. Are the actively respiring cells (CTC+) those responsible for bacterial production
in aquatic environments? FEMS Microbiol. Ecol. 35, 171–179 (2001).
47. Creach, V., Baudoux, A. C., Bertru, G. & Le Rouzic, B. Direct estimate of active bacteria:
CTC use and limitations. J. Microbiol. Methods 52, 19–28 (2003).
48. Nielsen, J. L., Kragelund, C. & Nielsen, P. H. Combination of fluorescence in situ
hybridization with staining techniques for cell viability and accumulation of PHA and polyP
in microorganisms in complex microbial systems. Methods Mol Biol 599, 103–116 (2010).
49. Shi, L. et al. Limits of propidium iodide as a cell viability indicator for environmental
bacteria. Cytometry. A 71, 592–598 (2007).
50. Davey, H. M. & Hexley, P. Red but not dead? Membranes of stressed Saccharomyces
cerevisiae are permeable to propidium iodide. Environ. Microbiol. 13, 163–171 (2011).

Chapter 8– Systematic approach for evaluation of continuous scale down fermentation of S.
cerevisiae combining a newly developed two compartment setup with a PBM and unstructured
model 178
8. Chapter
Systematic approach for evaluation of continuous scale
down fermentation of S. cerevisiae combining a newly
developed two compartment setup with a PBM and
unstructured model
Anna-Lena Heins1*
, Rita Lencastre Fernandes2*
, Krist V. Gernaey2 and Anna Eliasson Lantz
1,§
1 Department of Systems Biology, Technical University of Denmark, 2800 Kongens Lyngby,
Denmark
2 Department of Chemical Engineering, Technical University of Denmark, 2800 Kongens Lyngby,
Denmark
*These authors contributed equally to the work
§Corresponding author
Written as journal paper
Status: Manuscript in preparation

Chapter 8– Systematic approach for evaluation of continuous scale down fermentation of S.
cerevisiae combining a newly developed two compartment setup with a PBM and unstructured
model 179
Abstract
In this paper the combined approach of modeling and experimental work is presented to
demonstrate its usefulness to aid in and facilitate process development and optimization. A new
scale down setup to simulate large scale continuous cultivations was developed consisting of two
stirred tank reactors connected to each other (volume ratio 1:6), one representing the feeding zone
(small reactor, feed inlet) with high glucose concentration and low oxygen, whereas the other one
represents the remaining reactor volume (featuring the outlet), with high oxygen and lower substrate
concentration. As a first step a two compartment model based on an earlier developed population
balance model (PBM) coupled to an unstructured model1 was used to describe the development of
the bulk concentrations and cell size distributions in the cultivation broth. Thereafter the scale down
system, which can be performed as a continuous culture, was run in the lab using the same
conditions as used in the model. This included the assessment of different dilution rates (D = 0.05 h-
1 and D = 0.2 h
-1), glucose concentrations (50 g/L and 300 g/L) as well as different recirculation
times between the two compartments (0.1 L/h and 3L/h). General physiology was evaluated as well
as flow cytometry was used to quantify single cell properties including cell size and GFP
respectively BFP fluorescence originating from two fluorescent reporter strains, a growth and an
ethanol reporter. These reporter strains were applied for the deeper investigation of growth and cell
robustness characteristics as well as ethanol growth distributions of cells traveling between the two
compartments. All results, for the model and the experiments are compared to the performance of a
one compartment, conventional chemostat. Results underline the utility for the here presented
combined approach as well as the use of continuous scale down reactors for process investigations
as insides concerning single cell characteristics of the process are revealed which are normally
hidden when applying classical continuous cultivation setups in lab scale without deeper modeling
or data analysis inquiry.
Keywords: population balance model, population heterogeneity, reporter strain, yeast, two
compartment bioreactor setup, mathematical modeling, continuous scale down reactor
8.1 Introduction
Nowadays, the advances in modeling allow the model based description of single cell physiology in
biotechnological industrial fermentation processes2. Therefore, a systematic approach using
modeling in combination with lab scale experiments can be used to perform and in the end facilitate
Chapter 8– Systematic approach for evaluation of continuous scale down fermentation of S.
cerevisiae combining a newly developed two compartment setup with a PBM and unstructured
model 180
process optimization3. Hereby modeling can assist in setting the range of interesting experiments,
evaluate experimental data, find the performance optimum and create a framework for future
process development. In turn experiments are then used to collect data in setups simulating large
scale processes, and to validate modeling results. It is important to point out that the model
validation step is indeed one of the most important parts of a modeling study.
Large scale fed-batch and continuous cultivations are widely used in the biotechnology industry for
the production of pharmaceuticals, biomass and proteins (e.g. insulin)4,5
. The steadily increasing
demand for sustainable production also raises the demand for high yielding biotechnological
production processes using robust strains which consequently needs to be well characterized and
controllable. This and the fact that a cell population in a bioreactor is in fact heterogeneous, which
makes population properties rather distributed than following as earlier assumed averaged
characteristics6, makes process optimization crucial. Spatial population heterogeneity can have
several different causes. However, gradients of process parameters (e.g. substrate concentration, pH
and oxygen) arising in large scale fermentation due to non-ideal mixing, and thus the development
of zones representing different extracellular environments, were found to be one of the major causes
of poplation heterogeneity. For example the use of Rushton turbines, one of the most common
impellers used in industrial bioprocesses, has been observed to generate compartments within the
reactor due to high axial flow barriers created by the turbine7. Consequently, lowered yields and a
rise in by-product formation are obtained8,9
. Especially substrate gradients contribute to this
phenomenon because cells traveling throughout the reactor experience substrate concentrations that
may range from high concentrations close to the feed port to very low concentrations in zones more
distant to the feed port. It was found for Escherichia coli10,11
that this is connected with an elevated
stress response, especially when cells pass the feeding zone.
A crude and simple way of assessing the degree of spatial population heterogeneity in a bioreactor
is the compartment model approach. In such approach, it is assumed that the bioreactor is divided
into different zones due to the non-ideal mixing patterns. Exchange flows connect the compartments
(zones), and the higher the exchange flow between compartments, the closer to the ideal mixing
case one is, i.e. a one compartment set-up. In the other extreme, the system can be represented using
Computational Fluid Dynamics simulations, where a very large number of nearly infinitely small
volume elements is considered. In a compartment model approach, an ideal mixing behavior, and
thus a continuous stirred tank reactor (CSTR) description, can be assumed for each compartment

Chapter 8– Systematic approach for evaluation of continuous scale down fermentation of S.
cerevisiae combining a newly developed two compartment setup with a PBM and unstructured
model 181
(i.e. spatial zone). Besides consisting of a straightforward way for describing non-ideal mixing in
large scale reactors, a compartment model approach has the advantage of being easily translated
into laboratory experimental setups by using scale down reactors.
Scale down reactors are nowadays frequently used for process development and optimization and
have been shown to be a valuable tool for the study of gradients of substrate, oxygen12
and pH in
large scale fermentation processes13
. Different setups of scale down reactors have been used
depending on the process /application. Most common are stirred tank reactors (STR) connected to
plug flow reactors (PFR) or two STRs connected to each other 14
because both setups allow the
creation of gradients of various reactor parameters in a well-controlled environment which is
especially useful for studying population heterogeneity. Several studies investigated glucose
gradients and the consequent population heterogeneity e.g. during aerobic ethanol production15
which revealed the induction of stress responses close to the perturbation zone as well as by-product
formation in S. cerevisiae as well as E. coli16
(PFR connected to STR). Sweere et al. (1988)17
investigated the effects of fluctuating glucose concentration on a S. cerevisiae physiology, applying
different circulation times and volume ratio of the two reactors, while the feed was only added to
the reactor with the smaller volume. It resulted in the same findings as for George et al. (1993)15
in
the setup with STR and PFR connected. Later Delvigne et al. (2006a, 2006b & 2006c)18–20
developed, for both E. coli and S. cerevisiae, a combination of stochastic microbial growth and
bioreactor mixing models to explore the hydrodynamic effect of the bioreactor on microbial growth
which allowed explanation of the scale down effect associated with glucose fluctuations. By
combining the two model parts the authors obtained the profile of concentrations that a cell was
subjected to during its cultivation in the bioreactor. Common to all used setups is that they are
performed in fed-batch mode, with one reactor representing the feeding zone and the other one the
perturbation zone (either PFR with perturbation at inlet or STR with different conditions compared
to the other one).
In this study, substrate gradients, which are often seen in large scale industrial fermentation, are
simulated and the effect of the operating conditions (dilution rate and glucose feed concentration)
are evaluated using, to our knowledge for the first time a scale down reactor system for aerobic
glucose limited continuous cultivation. The existence of gradients is assumed to result in a
compartmentalization of the reactor (i.e. delimited spatial zones can be defined). This

Chapter 8– Systematic approach for evaluation of continuous scale down fermentation of S.
cerevisiae combining a newly developed two compartment setup with a PBM and unstructured
model 182
compartmentalization is translated into a set-up consisting of two compartments of different
volume, one representing the feeding zone of an industrial scale reactor and one representing the
remaining reactor volume where the bioreactor outlet is located. This study addresses firstly an in
silico investigation of the dynamics of a yeast population cell size distribution during a continuous
large scale fermentation, where a compartmentalization of the reactor can be assumed. The
performed computer simulations rely on an adaption of a previously described population balance
model (PBM) coupled to an unstructured model describing the bulk concentrations in the
cultivation media1.
Following the in silico study, the corresponding experimental investigation was performed by
running glucose-limited continuous cultivations using a growth and an ethanol metabolism S.
cerevisiae reporter strain. Yeast single cell physiology and robustness will be assessed using flow
cytometry analysis. Apart from exhibiting general growth physiology the two strains used in this
study were reporter strains which typically express a protein or enzyme whose activity can be easily
assayed21
. In the major part of the cultivations performed in this study, the growth reporter strain
FE440 was used: it expresses a green fluorescent protein (GFP) from a ribosomal promoter which
was correlated to single cell growth22
. In some cultivations, an ethanol reporter Sc-PCK1-B
expressing a blue fluorescent protein (TagBFP) from a phosphoenolpyruvate carboxykinase
promoter (inactive when glucose is present, part of gluconeogenesis) whose expression is correlated
to ethanol consumption (Johansen et al., unpublished) was utilized. Additionally, when applying
freeze-thaw stress to cells sampled from the fermentation broth membrane robustness could be
investigated22
. Consequently using flow cytometry analysis revealed not only distributions of cell
size and morphology, but also growth and ethanol consumption characteristics of thousands of
single cells per second. Thus, in addition to conventional growth physiology different expression
profiles of cells traveling throughout the scale down system were investigated.
8.2 Materials and Methods
8.2.1 Strains and Chemicals
The S. cerevisiae reporter strain FE44022
expressing a green fluorescent protein (GFP) controlled by
the ribosomal protein RPL22a promoter and thus correlated to growth was mainly used throughout
this study. The ethanol reporter strain Sc-PCK1-B (Johansen et al. (2013), unpublished) expressing
a blue fluorescent protein (BFP) controlled by the phosphoenolpyruvate carboxykinase promoter

Chapter 8– Systematic approach for evaluation of continuous scale down fermentation of S.
cerevisiae combining a newly developed two compartment setup with a PBM and unstructured
model 183
and thereby correlated to ethanol growth/non glucose growth (glucose repression/derepression). All
chemicals used during the study were obtained from Sigma Aldrich (St. Louis, USA).
8.2.2 Cultivation conditions
Pre-culture. A single colony of the growth reporter FE440 respectively the ethanol reporter strain
Sc-PCK1-B was picked from a plate with minimal medium and used to inoculate a 0.5 L baffled
shake flask with 100 ml of defined mineral medium containing 7.5 g/L (NH4)2SO4, 14.4 g/L
KH2PO4, 0.5 g/L MgSO4*H2O, 2 ml/L trace metal solution, 1 ml/L vitamin solution and 10 g/L
glucose23
. The pre-culture was incubated in an orbital shaker set to 150 rpm at 30°C until mid-
exponential phase (approximately 10 h) and directly used for inoculation.
Chemostats One compartment: Aerobic level-based chemostats were run with the growth reporter
strain FE440 according to a factorial design plan using 1 L bioreactors (Sartorius, B. Braun Biotech
International, GmbH, Melsungen, Germany) with a working volume of 1 L. The glucose
concentrations in the feed were 50 g/L or 300 g/L and the dilution rates were D= 0.05 and 0.2 h-1
as
well as including a center point with D = 0.125 h-1
and 125 g/L glucose. The experiments were
performed in duplicates (except for the center point). pH and DOT electrodes (Mettler Toledo, OH,
USA) were calibrated according to standard procedures provided by the manufacturer using two
point calibration (pH 4 and 7, gassing with oxygen (100 %) and nitrogen (0 %), respectively). The
growth medium was a defined mineral medium according to Verduyn et al. (1992)23
with 5 g/L
glucose for the batch phase and 50 g/L, 125 g/L respectively 300 g/L glucose for the feed in
continuous mode. The OD600 for inoculation was 0.001. The pH was adjusted and kept constant at
5.0 using 2 M NaOH. Temperature, aeration and stirring were kept constant at 30° C, 1 v/vm and
600 rpm.

Chapter 8– Systematic approach for evaluation of continuous scale down fermentation of S.
cerevisiae combining a newly developed two compartment setup with a PBM and unstructured
model 184
Run GFeed
[g/L]
D
[h-1
]
Recirculation
flow F2 [L/h]
A* 300 0.05 0.1
B 300 0.2 0.1
C 300 0.05 3.0
D 300 0.2 3.0
E* 50 0.05 0.1
F** 50 0.2 0.1
G 50 0.05 3.0
H* 50 0.2 3.0
I* 125 0.125 1.45
Figure 1 – setup for two compartment experiments: V1 represents the 0.5L reactor with the feed
inlet and no oxygen sparging, V2 represents the remaining reactor volume with the waste outlet and
the oxygen supply. Between the two reactors a recirculation is set up (F1 and F2) and samples are
taken at three different points, the waste outlet, at the beginning of F1 as well as at the beginning of
F2. The red arrows mark sampling points.
Table 1 – Overview of factorial design plan: Factorial design with varying glucose feed
concentration (50 g/L, 125 g/L and 300 g/L), dilution rate ( D= 0.05 h-1
, 0.125 h-1
and 0.2 h-1
) and
recirculation flow between the two reactors (0.1 L/h, 1.45 L/h and 3 L/h). The asterix respectively
double asterix marks the experiments that have been performed with the growth reporter strain
respectively with both strains.
Two compartment: Aerobic level-based chemostats with different dilution rates (D = 0.05 and 0.2 h-
1as well as D = 0.125 h
-1 as center point), glucose feed concentration (50 g/L, 125 g/L and 300 g/L)
and recirculation flow (0.1 L/h, 1.45 L/h and 3 L/h) between the two reactors were performed for
selected conditions (marked with an asterix for the growth reporter strain respectively two asterix
for performance with both strains, table 1) according to a factorial design experiment plan (see table
1). A 5 L reactor (V2) connected to a 0.5 L reactor (V1) (Sartorius, B. Braun Biotech International,
GmbH, Melsungen, Germany) was used with a ratio of the working volume of V1 = 1/6*V2. The
0.5 L reactor (V1) hereby represented the feeding zone with feed addition and no sparging of
oxygen whereas the 5 L reactor (V2) corresponded to the remaining reactor volume. The 5 L reactor
contained the outlet of the system and was sparged with oxygen. Between the two reactors a

Chapter 8– Systematic approach for evaluation of continuous scale down fermentation of S.
cerevisiae combining a newly developed two compartment setup with a PBM and unstructured
model 185
recirculation was applied (F1 and F2), whereas the recirculation flow rate from V2 to V1 (F2) was
varied according to the factorial design plan. The pH and DOT electrodes (Mettler Toledo, OH,
USA) were calibrated in the same way as for the one compartment and also the growth medium was
a defined mineral medium according to Verduyn et al. (1992) 23
with 5 g/L glucose for the batch
phase and 50 g/L respectively 125 g/L or 300 g/L glucose for the feed in continuous mode. The
OD600 for inoculation was 0.001. The pH was adjusted and kept constant in both reactors at 5.0
using 2 M NaOH. Temperature, aeration and stirring were kept constant at 30°C, 1 v/vm and 600
rpm.
For both setups, the one and two compartment setup, the batch phase was followed by OD600
measurement and continuous analysis of the off-gas composition by a Mass spectrometer (Prima
Pro Process MS, Thermo Fisher Scientific, Winsford UK). After glucose depletion, detected as a
rapid drop in the CO2 content of the off gas, the cultures were switched to chemostat mode with the
desired dilution rate by applying a feed with the same medium as used for the batch but containing
50 g/L, 125 g/L respectively 300 g/L glucose . The volume was kept constant by a level based outlet
for both the one and two compartment experiments. Steady state was considered established when
dry weight, dissolved oxygen tension (DOT), metabolites and exhaust gas concentration (CO2) had
remained constant for at least three residence times. For the ethanol reporter strain, and additional
fed-batch phase was integrated into the process after glucose depletion to validate if the same steady
state was reached as when the continuous mode was started with a lower biomass concentration
after the batch. Therefore, a feed with 300 g/L glucose at a growth rate of 0.1 h-1
was applied until a
biomass concentration of 25 g/L was reached.
Samples were withdrawn for OD600, high performance liquid chromatography (HPLC), dry weight
(DW) and flow cytometry analysis. Samples for OD600 and DW were analyzed directly, HPLC
samples were sterile filtered and stored at -20 C. Samples for flow cytometry were mixed with
glycerol to a final concentration of 15 % and frozen and stored in a -80C freezer. The sampling
frequency was once every residence time until the 9th
residence time starting with the 0th
residence
time directly after switching to chemostat mode, as well as three samples during exponential growth
in batch mode. For the one compartment experiments samples where withdrawn at the outlet
whereas for the two compartment experiments samples were additionally withdrawn on both outlets
of the recirculation lines (V1 and V2, see figure 1, marked with an arrow).

Chapter 8– Systematic approach for evaluation of continuous scale down fermentation of S.
cerevisiae combining a newly developed two compartment setup with a PBM and unstructured
model 186
8.2.3 Sample analysis
OD, DW and HPLC. Growth was monitored by measuring OD600 with a Shimadzu UV mini 1240
spectrophotometer (Shimidzu, Kyoto, Japan). Dry weight measurements were performed on 5 ml
cultivation broth according to Olsson and Nielsen (1997)24
. The concentrations of glucose, acetate,
ethanol, glycerol and pyruvate in the broth were determined by HPLC as earlier described by
Carlquist et al. (2012)22
.
Flow cytometry. A FACSAria™ III (Becton-Dickinson, NJ, USA) flow cytometer was used for
single-cell analysis of both yeast and bacteria. Excitation wavelength for the laser was set to 488
nm. Two scattering channels (FSC and SSC) and two fluorescent detection channels were used in
the analysis. Fluorescence emission levels were measured using a band pass filter at 530±30 nm for
GFP and 450±20 nm for BFP. Light scattering and fluorescence levels were standardised using 2.5
µm fluorescent polystyrene beads. Samples for flow cytometry were centrifuged for 1 min at 3000 g
and 4 C, resuspended in 0.9 % saline solution and directly analysed. 10,000 events were recorded
for yeast. CS&T beads (Cytometer Setup and Tracking beads) (Becton Dickinson, USA) were used
for the automated QA/QC of the machine performance.
8.2.4 Data analysis
Processing and analysis of the flow cytometry raw data was performed using MatLab ® R2013a
(The MathWorks, Inc., Natick, MA, USA). The raw data was extracted from the flow cytometer as
fcs files and loaded into MatLab with the help of the readfsc function (by L. Balkay, University of
Debrecen, Hungary, available on MatLab central file sharing). The HPLC data were imported from
excel. The data from the fcs files was saved into mat files including the recorded GFP fluorescence
and the FSC for each experiment. By application of the hist function to the 1024 recording channels
cell count was saved for all channels and histogram plots generated. For better quantitative
description of the GFP distributions, the mean function was used to calculate the mean FSC and
mean GFP fluorescence. By dividing the standard deviation of the GFP distribution by the mean
GFP the coefficient of variance (CV) of the distribution was generated.
8.2.5 Modeling Aspects
A two-stage PBM (population balance model) previously developed for a batch cultivation1, was
adapted to describe a continuous cultivation in a one- and two-compartment set-up (see figure 1).
Cell total protein content (a measure of cell size) is used as model variable. In the case of the two
compartment set-up presented in this work, four population balance equations are necessary (two

Chapter 8– Systematic approach for evaluation of continuous scale down fermentation of S.
cerevisiae combining a newly developed two compartment setup with a PBM and unstructured
model 187
cell stages x two compartments). Furthermore, the dilution terms taking into account the transport
between compartments, inlet and outlet are included in the PBM equations for both the case of one-
and two-compartment models. The PBM equations for a two compartment model are presented in
Appendix 1 (Eq. A1-1 to A1-4). For further details on the formulation of a PBM and the various
model kernels forming the PBM equations, the paper by Lencastre Fernandes et al., (2013)1 should
be consulted. The same boundary and initial conditions as proposed for the batch cultivation model
are used for both compartments.
Based on the trajectory of the estimated critical sizes along a batch cultivation1 the budding and
division critical sizes were defined as continuous functions of the concentrations of glucose or
ethanol, in a given compartment, according to the following assumptions:
If the concentration of glucose, in a given compartment, is equal to or above 0.1 g/l, growth
on glucose is assumed for that compartment, and the critical budding (µB) and division (µD)
sizes are calculated based on the glucose concentration according to Eq. A1-6 to A1-7 in
Appendix 1
If the concentration of glucose, in a given compartment, is below 0.1 g/l, growth on ethanol
is assumed for that compartment, and the critical budding (µB) and division (µD) sizes are
calculated based on the glucose concentration according to Eq. A1-8 to A1-9 in Appendix 1
If the concentration of glucose and ethanol, in a given compartment are under 1e-6
g/l,
growth in that compartment is assumed to be zero. An estimated value for the saturation
constant of the overall growth process (corresponding to half of the maximum specific
growth rate) is 0.15 g/l25
.
The partition shape parameters (necessary for defining the birth kernel in the PBM
equations) are assumed to change according to the growth mode (glucose or ethanol)
observed in a given compartment: for glucose growth, α=β=50, for ethanol growth α=30 and
β=60. The nature of these values is further discussed in Lencastre Fernandes et al. (2013)1.
In order to further describe the bulk concentration of glucose, ethanol and oxygen in the cultivation
media, in each compartment, an unstructured model was coupled to the PBM (see Eq. A1-10 to A1-
15). As presented for the experimental set-up (see figure 1), the glucose feed corresponds to the
inlet in compartment one, and the oxygen supply takes place exclusively in compartment two. As

Chapter 8– Systematic approach for evaluation of continuous scale down fermentation of S.
cerevisiae combining a newly developed two compartment setup with a PBM and unstructured
model 188
proposed for the batch model 1, the substrate dependent term in the growth kernel (λ(Z)) is
evaluated, in this case, for each of the compartments (see Eq. A1-19).
The model was implemented and solved in MatLab® Release2012b, and the fixed-pivot method
was used for discretization of the PBM equations. The unstructured and PBM models are solved
iteratively, following a solution procedure similar to the one proposed for the batch model1.
8.3 Results and discussion
8.3.1 Comparison of the modeling results with the experimental setup
To simulate gradients often seen in large scale cultivations and the consequent development of
compartments with different microenvironment inside a reactor that influences the single cell
behavior a 2-compartment setup was developed (figure 1). It consists of two reactors with a volume
ratio 1:6. The smaller reactor (V1) represents the feeding zone with feed addition and no sparging
of oxygen, whereas the bigger reactor (V2) corresponds to the remaining reactor volume containing
the outlet, considerably lower glucose concentration and sparging with oxygen. A circulation loop
(with flow F1 and F2, respectively) ensured the exchange between the two reactors, where the
recirculation from V2 to V1 (F2) was varied according to the factorial design plan (table 1). Overall
dilution rates (calculated for the whole working volume of both reactors) of D = 0.05 h-1
and 0.2 h-1
,
in addition to a center point corresponding to D = 0.125 h-1
were applied. The dilution rates in the
two compartments were different than the overall dilution rate and an overview of the resulting
flows and dilution rates (based on the flow per volume in the respective compartment) in each of
the compartments for the experimentally performed conditions is given in table 2. It needs to be
mentioned that due to the volume differences and circulation between the reactors (two
compartments) with only one feed inlet, local dilution rates in the compartments can be higher than
what is normally possible without experiencing a wash-out of biomass.
Different operating conditions were evaluated in silico using a factorial design plan, of which
afterwards selected conditions were performed experimentally (table 1). These included two cases
(A and E) run with D = 0.05 h-1
and 50 g/L respectively 300 g/L of glucose feed both with low
recirculation flow rate between the reactors. Furthermore to be able to evaluate effect of a higher
overall dilution rate on the cell population structure, also cases F and H, corresponding to a low and
high recirculation flow rate respectively, were included in the experimental study. In the case H
oscillations were found when performing simulations as well as for the center point (case I) which

Chapter 8– Systematic approach for evaluation of continuous scale down fermentation of S.
cerevisiae combining a newly developed two compartment setup with a PBM and unstructured
model 189
was also chosen to be carried out as a middle range condition between the extremes. Additionally to
the comparison of the model and the two compartment setup all results are also compared to the
corresponding one compartment chemostat experimental cultivation and model simulation.
Table 2 – Overview of dilution rates in each of the compartments for experimental conditions:
the overall dilution rates were D= 0.05 h-1
, 0.125 h-1
and 0.2 h-1
with flows estimated for the
working volume of the two compartments in total. The dilution rates in each compartment were
calculated based on the flows (F1 and F2) between the reactors.
D =0.05 h-1
/low recirculation for 50g/L (E) respectively 300g/L feed
(A) flow rate in for Doverall [h
-1] 0.175 DV1[h
-1] 0.55
recirculation flow [L/h] 0.1 DV2[h-1
] 0.079 D= 0.2 h
-1/50g/L feed/ low recirculation (F)
flow rate in for Doverall [h-1
] 0.7 DV1 [h-1
] 1.64 recirculation flow [L/h ] 0.1 DV2 [h
-1] 0.229
D= 0.2 h-1
/50g/L feed/high recirculation (H) flow rate in for Doverall [h
-1] 0.7 DV1 [h
-1] 7.4
recirculation flow [L/h] 3 DV2 [h-1
] 1.057 D=0.125 h
-1/125g/L feed/middle recirculation (I)
flow rate in for Doverall [h-1
] 0.438 DV1 [h-1
] 3.78 recirculation flow [L/h] 1.45 DV2 [h
-1] 0.539
8.3.2 Variation of general physiology and cell size over time in the two compartment setup
in comparison with one compartment chemostats and modeling results
8.3.2.1 General physiology
When looking at the general physiology of the different cases, for all of them steady state was
achieved, though after a different number of residence times depending on the conditions. For
growth at the high dilution rate, D= 0.2 h-1
, the cells generally consumed the fed glucose producing
CO2 and ethanol due to overflow metabolism. When the experiment was performed with low
recirculation flow rate (case F, figure 2), the glucose concentration in compartment V1 was around
half of the feed concentration along with the production of CO2 and low amounts of biomass (end
value for biomass concentration: around 3 g/L). The dilution rate in compartment V1 was much

Chapter 8– Systematic approach for evaluation of continuous scale down fermentation of S.
cerevisiae combining a newly developed two compartment setup with a PBM and unstructured
model 190
higher than the overall dilution rate (table 2). This implies that cells, glucose and ethanol were
transported to V2. In this compartment the incoming glucose was readily consumed and ethanol
accumulated (ethanol concentration was around 3 g/L). The model simulations supported these
observations (figure 3), and further suggested that cells in V2 have not switched to ethanol growth:
a high budding index (around 60%) was predicted for both compartments, and the predicted cell
size distributions were similar, although slightly smaller cells were observed in V2 as it would be
expected as found by earlier studies26,27
as lower glucose concentrations were observed. In both
compartments no other metabolites were found in significant amounts.
When applying a high recirculation flow rate between the compartments (case H), both
compartments exhibited the same concentration profiles. This was expected and predicted by the
model simulations, as the high exchange between compartments is closer to the one-compartment
case (i.e. where ideal mixing and homogeneity in the reactor is assumed). The glucose fed to V1
was readily consumed, CO2 was produced as well as small amounts of biomass (around 12 g/L) and
ethanol (around 5 g/L). In the model simulations an oscillatory behavior was observed, in particular
for the budding index profile for both compartments and the oxygen profile for compartment V2.
These oscillations are a result of a continuous shift between glucose and ethanol growth modes: as
the budding and division critical sizes (and consequently the growth rate) decrease gradually
following the glucose concentration. When the glucose concentration reaches the threshold value,
the partition shape parameters change resulting in the generation of new smaller cells, which grow
slower leading to an accumulation of glucose and when the glucose concentration again rises above
the threshold value the shape parameters change once again leading to an accumulation of bigger
cells and thus a faster growth rate and faster consumption of glucose (leading to a decrease of the
glucose concentration). These oscillations were not visible in the experimental results. It remains to
be studied whether the oscillations are exclusively due to a model artifact (due to the assumptions
that were made) or they take place in reality, but the frequency of the experimental sampling was
too low to capture this phenomenon.
When lowering the dilution rate and elevating the glucose feed concentration (case I, center point),
a similar picture as for the high dilution rate (case H) was observed. Whereas there was no
difference in biomass concentration between the two compartments (up to around 25g/L), the
ethanol level was different. The fed glucose was readily consumed in compartment V1 producing
CO2, biomass and ethanol (around 25g/L). The remaining glucose and ethanol are recirculated and

Chapter 8– Systematic approach for evaluation of continuous scale down fermentation of S.
cerevisiae combining a newly developed two compartment setup with a PBM and unstructured
model 191
completely consumed in the compartment V2. The model simulation also predicted oscillations for
this case.
For experiments with the low dilution rate (D = 0.05h-1
, cases A and E) the fed glucose was only
partly consumed in V1 producing ethanol, CO2 and biomass. The remaining glucose, the formed
ethanol and biomass were transported into V2, where significantly higher biomass concentrations
were detected. When increasing the feed glucose concentration, an increase in the produced
biomass concentration (to around 50 g/L vs 20 g/L), ethanol concentration (around 20 g/L vs 5 g/L)
and CO2 were observed in both compartments, as well as a higher remaining glucose concentration
in V1. In contrast to experiments with lower glucose concentration, also small amounts of glycerol
were detected in V1 for case A.
The model predictions for case A were not in agreement with the experimental observations.
Indeed, while the model predicts a residual glucose concentration in V1, a significant amount was
observed after 6 retention times in the experiments. It is however not clear if a steady state has been
reached at that point, or if a further decrease of the glucose concentration (to residual levels) would
be observed for higher residence times. An explanation for this could be that the cells due to the
high glucose concentration are more stressed and hence need longer time to adjust and to reach
steady state. It could be a similar phenomenon as seen in high gravity batch cultivations, where a
lag phase/phase of slow growth of about 20h is seen before the exponential growth phase starts28
.
This was not incorporated in the model and could thereby lead to different results compared to the
experiments.

Chapter 8– Systematic approach for evaluation of continuous scale down fermentation of S.
cerevisiae combining a newly developed two compartment setup with a PBM and unstructured
model 192
Figure 2 – Variation of glucose, ethanol, glycerol, acetate, pyruvate, biomass and CO2 for the
two compartment experiments: using the growth reporter strain FE440. Results are shown for the
experimental performed cases (A, E, H, F, I).

Chapter 8– Systematic approach for evaluation of continuous scale down fermentation of S.
cerevisiae combining a newly developed two compartment setup with a PBM and unstructured
model 193
Figure 3 – Variation of glucose, ethanol, glycerol, acetate, pyruvate, biomass and CO2 for the
two compartment model: results are shown for the experimental performed cases (A, E, H, F, I).
Blue: glucose; Black: ethanol; Red: biomass; Green: dissolved oxygen; Yellow: budding index

Chapter 8– Systematic approach for evaluation of continuous scale down fermentation of S.
cerevisiae combining a newly developed two compartment setup with a PBM and unstructured
model 194
8.3.2.2 Cell size
Figure 4 – Variation of the experimental cell size distribution in the two compartments in
steady state: using the growth reporter strain FE440. Results are shown for the experimental
performed cases (A, E, H, F, I).
Figure 5 – Variation of the cell size distribution in the two compartments model: Results are
shown for the experimental performed cases (A, E, H, F, I).

Chapter 8– Systematic approach for evaluation of continuous scale down fermentation of S.
cerevisiae combining a newly developed two compartment setup with a PBM and unstructured
model 195
The cell size distribution changed depending on the conditions when comparing the two
compartments and also in comparison with ordinary chemostat cultivations (figure 10 and Appendix
2). For case A, E and I the cell size remained the same for cells in both compartments as well as
cells grown in a normal chemostat (one compartment): 338.43+/-0.56 vs 338.12+/-30.63 vs
354.59+/-5.48. The model predictions however suggested that two different cell size distributions
would be observed in the two compartments, for case A: a smaller sized population is predicted for
V2, while a combined population of smaller and bigger cells would be found in V1 (see table 3).
This difference between experimental and model predictions is consistent with the discrepancies
found for the physiological data, and thus further suggests that the model may not be suitable for
describing high-gravity cultivations. But it also has to be mentioned that high-gravity cultivations
were not explicitly included during the model development. However, the smaller cell size
predicted in the model could be explained by a change in osmolarity, as it was found earlier that
incrasing osmolarity leads to shrinking cells27
.
The cell size distributions measured in V1 for case A, F, H and I (see table 3) correspond to larger
cells than for case E and displayed a clear tailing towards high cell sizes. In V2, the distributions for
case A and I were broader than for the remaining cases, showing a higher mean cell size (see table
3). For case E, the cell size distribution exhibited a lower mean cell size (see table 3) and more
narrow distribution (see table 3) but a similar shape tailing. Indeed, the results suggest that the
lowest level of population heterogeneity results from the operating conditions corresponding to the
lowest local dilution rates. Oppositely, the highest level of population heterogeneity is found for
case H, where the highest local dilutions rates were observed. This suggests that a high local
volume exchange contribute significantly to the heterogeneity of the cell population. A high glucose
feed concentration may be an additional factor contributing to a higher level of heterogeneity.
The model predictions showed different distributions for case A, H and I in comparison to case F:
smaller size populations were predicted for these cases, reflecting the shift of the population in
response to a lower glucose concentration. As previously discussed, for these cases higher glucose
concentrations were measured in comparison to the model predictions, which was in agreement
with the experimentally measured distributions displaying larger cells than shown in the predicted
distributions. In comparison with the one compartment model (see appendix 3, figure 13) cell size
distributions predicted for cases A, E and F resembled distributions found in the two compartment
model for V2, which seems to be expected as the biggest part of the one compartment chemostat
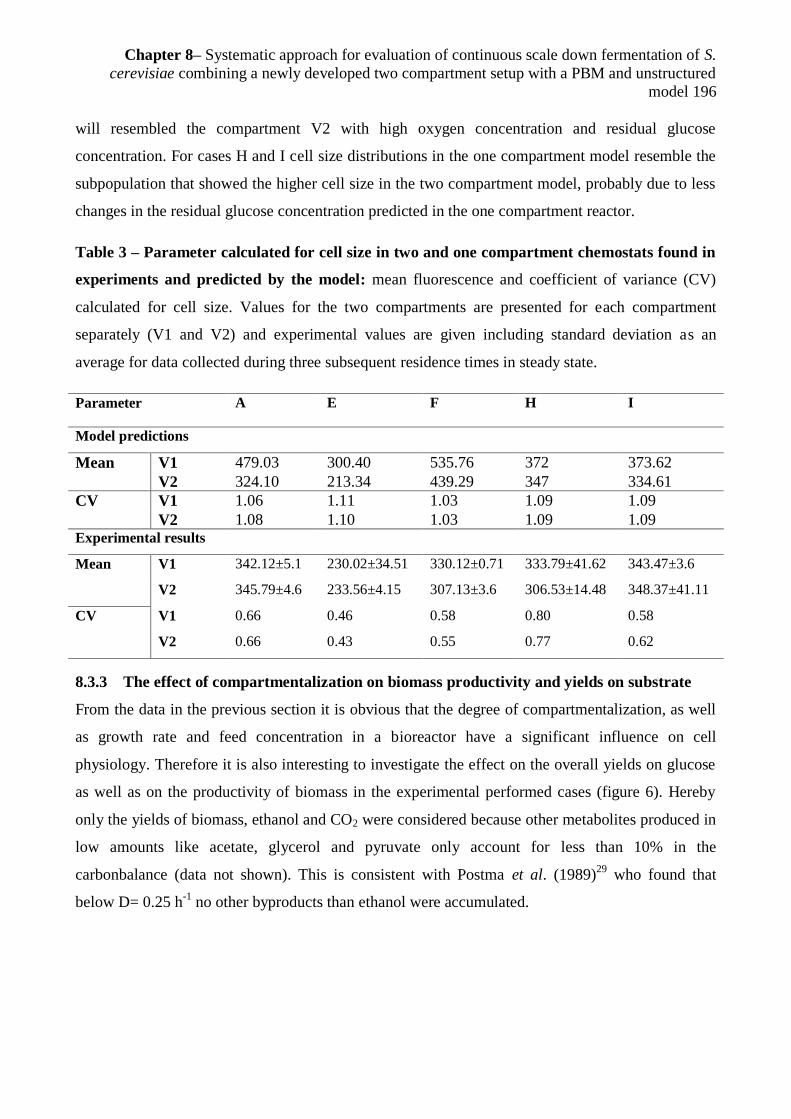
Chapter 8– Systematic approach for evaluation of continuous scale down fermentation of S.
cerevisiae combining a newly developed two compartment setup with a PBM and unstructured
model 196
will resembled the compartment V2 with high oxygen concentration and residual glucose
concentration. For cases H and I cell size distributions in the one compartment model resemble the
subpopulation that showed the higher cell size in the two compartment model, probably due to less
changes in the residual glucose concentration predicted in the one compartment reactor.
Table 3 – Parameter calculated for cell size in two and one compartment chemostats found in
experiments and predicted by the model: mean fluorescence and coefficient of variance (CV)
calculated for cell size. Values for the two compartments are presented for each compartment
separately (V1 and V2) and experimental values are given including standard deviation as an
average for data collected during three subsequent residence times in steady state.
Parameter A E F H I
Model predictions
Mean V1 479.03 300.40 535.76 372 373.62
V2 324.10 213.34 439.29 347 334.61
CV V1 1.06 1.11 1.03 1.09 1.09
V2 1.08 1.10 1.03 1.09 1.09 Experimental results
Mean V1 342.12±5.1 230.02±34.51 330.12±0.71 333.79±41.62 343.47±3.6
V2 345.79±4.6 233.56±4.15 307.13±3.6 306.53±14.48 348.37±41.11
CV V1 0.66 0.46 0.58 0.80 0.58
V2 0.66 0.43 0.55 0.77 0.62
8.3.3 The effect of compartmentalization on biomass productivity and yields on substrate
From the data in the previous section it is obvious that the degree of compartmentalization, as well
as growth rate and feed concentration in a bioreactor have a significant influence on cell
physiology. Therefore it is also interesting to investigate the effect on the overall yields on glucose
as well as on the productivity of biomass in the experimental performed cases (figure 6). Hereby
only the yields of biomass, ethanol and CO2 were considered because other metabolites produced in
low amounts like acetate, glycerol and pyruvate only account for less than 10% in the
carbonbalance (data not shown). This is consistent with Postma et al. (1989)29
who found that
below D= 0.25 h-1
no other byproducts than ethanol were accumulated.

Chapter 8– Systematic approach for evaluation of continuous scale down fermentation of S.
cerevisiae combining a newly developed two compartment setup with a PBM and unstructured
model 197
Figure 6 – Biomass, ethanol and CO2 yields as well as biomass productivity for experiments
on glucose: for the one compartment (blue bars) and the two compartment (red bars) experiments in
steady state.
The biomass yields for one and two compartment continuous cultivation show significant
differences. In general, the biomass yields (figure 6A) and thereby also the biomass productivity
(figure 6D) for the two compartment cultivations was higher than for the ordinary chemostat
cultures. Whereas for the low dilution rate the difference was only up to 3-fold, for D= 0.2 h-1
the
difference was around 6-fold. The highest productivity was found for case A in two compartment
chemostats whereas the lowest was found in one compartment chemostats for case F and H. The
center point (I) exhibited values in between the two other dilution rates. In general, the values found
for the two compartment were comparable with biomass yields seen in earlier studies in ordinary
chemostats by e.g. van Dijken et al. (2000)30
whereas for the one compartment values were lower
than reported in earlier studies. For the ethanol yields (figure 6B) the picture was less clear.
Whereas for case A as well as for case F and H the yield in the normal chemostat cultures was
higher than for the two compartment cultivations, the opposite was observed for case E as well as
for the center point. Also for the CO2 yields (figure 6C) the one compartment chemostats showed
significant higher values than for the two compartment cultivations with the exception of case A for
which the yield was almost the same in both setups. Van Dijken et al. (2000) as well as van Hoek
(1998)30,31
found that in chemostat cultures the CO2 yield is decreasing with increasing dilution rate
which can also be seen for the two compartment setup whereas it was only true for the center point
and the high dilution rate and not for D= 0.05 h-1
in the one compartment setup. Considering the
recirculation rate, the yields should resemble more the one compartment chemostat with increasing

Chapter 8– Systematic approach for evaluation of continuous scale down fermentation of S.
cerevisiae combining a newly developed two compartment setup with a PBM and unstructured
model 198
recirculation rate, which could not be seen from the results. In fact, in the results only the biomass
yield decreased whereas the ethanol increased when comparing low and high recirculation rate
(case F and H). The same was seen for the increase in glucose feed concentration (case A and E). In
large scale cultivations of S. cerevisiae it was found that when cells experience a fast change in
environmental conditions32
, the biomass yield decreases in line with an increase in ethanol yield,
which was not seen in conventional lab scale chemostat cultures. The reason are microenvironments
in different parts of the bioreactor due to non-ideal mixing which also makes cells more stressed,
which has been followed by the expression of stress related genes15
. This explains the observed
decrease in biomass concentration when the feed concentration increases which imposes a bigger
difference in environment between the two compartments. However with a rise in recirculation rate
this phenomenon should become less important since the conditions in both compartments become
more similar and should in general be more equal to a conventional chemostat, though the opposite
was seen from the yields which show similar values as for low recirculation.
8.3.4 The use of reporter strains to gain additional information on cell physiology
To gain further physiological information about the growth, stress level and robustness distributions
of the cells traveling throughout the two compartment chemostat as a special feature the strain used
in this study was a growth reporter strain expressing a green fluorescent protein (GFP). Its
expression was controlled by a ribosomal promoter and was shown to be a useful tool to follow
growth characteristics at single cell level22
. Additionally, the employed growth reporter strain when
exposing the cells to freeze-thaw stress can be applied for the investigation of cell membrane
robustness, because a strong correlation between intracellular GFP level and cell membrane
robustness was found22
.
Furthermore, case F was also performed using an ethanol reporter strain (Johansen, unpublished) to
investigate the distinct differences in ethanol level seen between the two compartments in this case.
The strain expresses a blue fluorescent protein (BFP), whose expression is controlled by the PCK1
(phosphoenolpyruvate carboxykinase 1) promoter. The promoter codes for the key enzyme of the
gluconeogenesis and is hence repressed during growth on glucose/glucose is present and active
during growth on ethanol. Therefor the BFP fluorescence can be correlated to growth on ethanol.
All cases performed with reporter strains are compared with the corresponding cultivation in an
ordinary chemostat.

Chapter 8– Systematic approach for evaluation of continuous scale down fermentation of S.
cerevisiae combining a newly developed two compartment setup with a PBM and unstructured
model 199
8.3.4.1 Influence of compartmentalization on cell robustness/cell growth
Growth and cell robustness were studied using the S. cerevisiae reporter strain FE44022
. The
experimental studied cases were investigated for GFP fluorescence via flow cytometry and
distributions are plotted as histogram plots comparing the distributions for two subsequent
residence times (for V1 and V2) for each case as well as distributions for different cases between
each other (figure 7). For all cases steady state of the fluorescence level was established. Whereas
for cases A, F, I and H only minor variation between different residence times was found, supported
by a low standard deviation for calculated parameters for description of the population (table 4),
population distributions for case E showed a slightly higher variation (figure 7) with higher standard
deviations in the calculations. However, variation between samples in steady state from cells grown
at D = 0.2 h-1
were bigger than for cells growing at D = 0.125 h-1
respectively D = 0.05 h-1
(figure
7). This indicates that it takes longer time to stabilize and adjust to the changing environment (high
glucose/low oxygen respectively low glucose/high oxygen) when cells grow at a higher dilution
rate. Between the two compartments no significant difference in GFP fluorescence could be seen,
except of case E, differences between the compartments in calculated values are less than 10%
(table 4), although for the cases with low recirculation general physiology in the two compartments
was different. The reason for this is probably the longer expression time of GFP compared to the
recirculation time between the two compartments. For case E for V2 a broad normal distribution is
seen whereas for V1 a slightly broader distribution with two maxima is seen.
However fluorescence distributions for all cases can still be compared between cases. Cases A, F, E
(V2) and I exhibited similar steady state characteristics (figure 7) with a broad distribution tailing
towards lower fluorescence (figure 7), whereas the tailing is less obvious for cells growing at the
high dilution rate, which is also illustrated by lower CV for the GFP distribution at higher dilution
rate (table 4). Case H revealed two subpopulations, one high fluorescent containing around 95% of
the whole population and one low fluorescent (around 5% of the population).
When comparing the cases to steady state values of ordinary chemostats (Appendix 2, figure 11),
two compartment cultivations revealed always lower fluorescence considering the mean (table 3),
especially for cases A, F and I. However for cases A and E in normal chemostats, apart from the
main population a lower subpopulation respectively subpopulation connected to the main
population was found resulting in an increased peak width and slightly lower mean fluorescence
than for other cases. This indicates that cells grown in one compartment chemostats are less affected

Chapter 8– Systematic approach for evaluation of continuous scale down fermentation of S.
cerevisiae combining a newly developed two compartment setup with a PBM and unstructured
model 200
by freeze-thaw stress than cells grown in a two compartment chemostat. Only when growing with D
= 0.05 h-1
in an ordinary chemostat a small portion of the cell population seemed to be strongly
affected by freeze-thaw stress and the influence became stronger with higher glucose concentration
in the feed. At the same conditions in a two compartment chemostat highly effected cells were only
found for case E in compartment V1, whereas no subpopulations were found for case A, but the
same general trend for the feed concentration was seen. Cells grown in a two compartment
chemostat seem to be less robust due to the recirculation. Especially the high recirculation at D=
0.2h-1
(case H) generated a small population of cells which are strongly influenced by freezing. Due
to this the CV for this case was higher than for the other cases (table 4). However, generally with
low recirculation in a two compartment chemostat cells growing at D = 0.2 h-1
as well as the middle
range dilution rate seem to be less affected by freezing, exhibiting a slightly more narrow
distribution connected with a lower CV and higher mean fluorescence (table 4), than cells growing
at the low dilution rate. This is interesting since generally it is found that in continuous culture cells
growing at a low dilution rate are more robust and tolerant to stress than cells growing with a higher
growth rate33,34
.
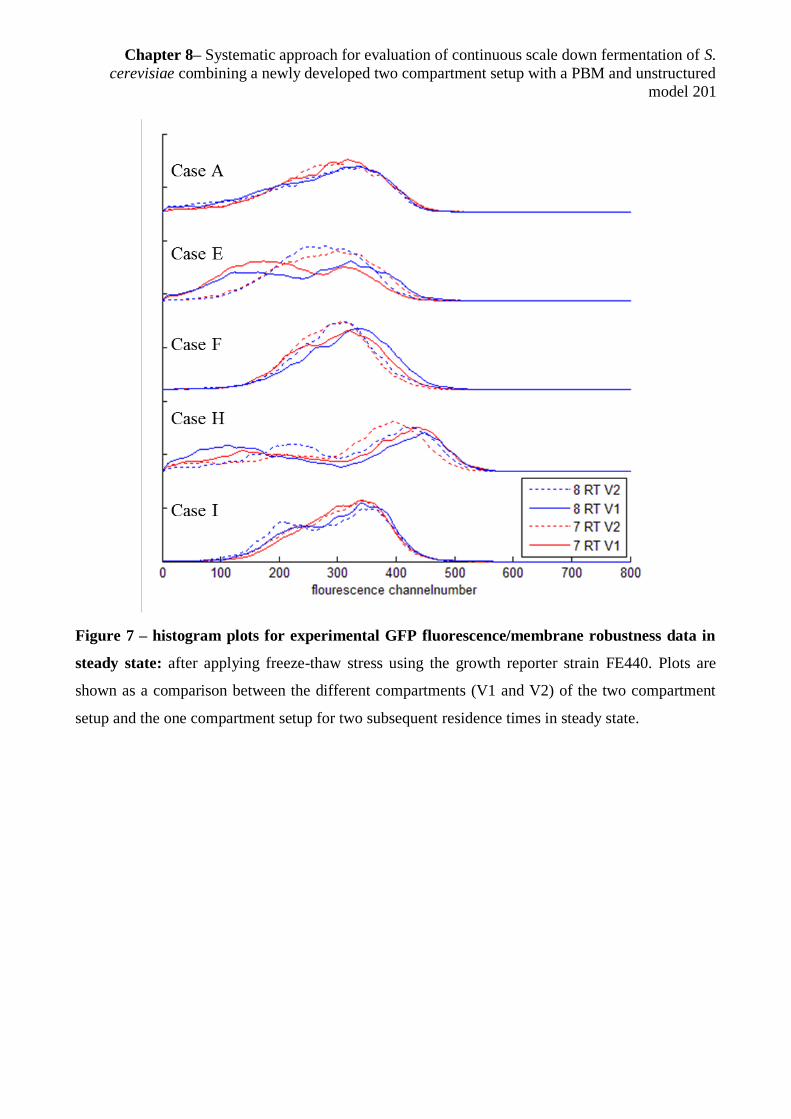
Chapter 8– Systematic approach for evaluation of continuous scale down fermentation of S.
cerevisiae combining a newly developed two compartment setup with a PBM and unstructured
model 201
Figure 7 – histogram plots for experimental GFP fluorescence/membrane robustness data in
steady state: after applying freeze-thaw stress using the growth reporter strain FE440. Plots are
shown as a comparison between the different compartments (V1 and V2) of the two compartment
setup and the one compartment setup for two subsequent residence times in steady state.

Chapter 8– Systematic approach for evaluation of continuous scale down fermentation of S.
cerevisiae combining a newly developed two compartment setup with a PBM and unstructured
model 202
Table 4 – Parameter calculated for objective description of membrane robustness in two and
one compartment experiments: mean fluorescence and coefficient of variance (CV) calculated for
GFP fluorescence in the two compartment setup and the one compartment setup. Values for the two
compartments are presented for each compartment separately (V1 and V2) and all values are given
including standard deviation as an average for three subsequent residence times in steady state.
8.3.4.2 Influence of compartmentalization on ethanol/glucose consumption under chosen
conditions
To further investigate physiological differences between the two compartments of the scale down
setup an ethanol reporter strain expressing a blue fluorescent protein (BFP) controlled by a PCK1
reporter was cultivated in the system with a dilution rate of D = 0.2 h-1
, 50 g/L feed concentration
and low recirculation between the two compartments (case F). This condition was chosen because it
revealed significant differences in dilution rate as well as ethanol and glucose level between the two
compartments. Additionally results are compared to a one compartment chemostat with the same
reporter strain.
Parameter A E F H I
Mean
GFP
V1
V2
268.83± 9.89
259.57±12.03
222.39± 20.58
280.71± 20.74
308.23±10.34
295.43± 9.07
270.58± 24.19
303.62± 6.93
310.34±10.01
298.91±7.49
Chemostat 342.91± 0.26 288.95 +/-35.57 361.32±27.98 361.32± 27.98 396.64± 3.84
CV V1
V2
0.41
0.46
0.52
0.56
0.24
0.23
0.60
0.45
0.24
0.26
Chemostat 0.33 0.42 0.31 0.31 0.21
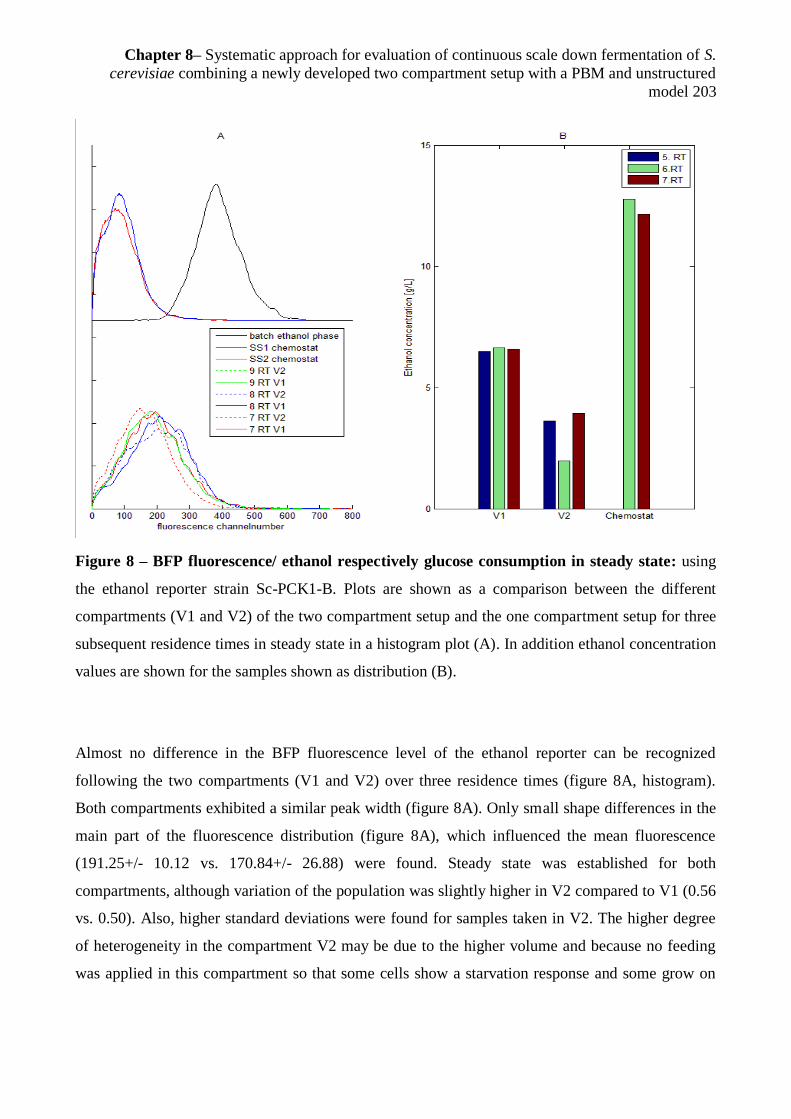
Chapter 8– Systematic approach for evaluation of continuous scale down fermentation of S.
cerevisiae combining a newly developed two compartment setup with a PBM and unstructured
model 203
Figure 8 – BFP fluorescence/ ethanol respectively glucose consumption in steady state: using
the ethanol reporter strain Sc-PCK1-B. Plots are shown as a comparison between the different
compartments (V1 and V2) of the two compartment setup and the one compartment setup for three
subsequent residence times in steady state in a histogram plot (A). In addition ethanol concentration
values are shown for the samples shown as distribution (B).
Almost no difference in the BFP fluorescence level of the ethanol reporter can be recognized
following the two compartments (V1 and V2) over three residence times (figure 8A, histogram).
Both compartments exhibited a similar peak width (figure 8A). Only small shape differences in the
main part of the fluorescence distribution (figure 8A), which influenced the mean fluorescence
(191.25+/- 10.12 vs. 170.84+/- 26.88) were found. Steady state was established for both
compartments, although variation of the population was slightly higher in V2 compared to V1 (0.56
vs. 0.50). Also, higher standard deviations were found for samples taken in V2. The higher degree
of heterogeneity in the compartment V2 may be due to the higher volume and because no feeding
was applied in this compartment so that some cells show a starvation response and some grow on

Chapter 8– Systematic approach for evaluation of continuous scale down fermentation of S.
cerevisiae combining a newly developed two compartment setup with a PBM and unstructured
model 204
ethanol. In comparison to an ordinary chemostat (figure 8) under the same conditions in steady
state, the mean BFP fluorescence in the two compartment cultivations was about 64% higher
(170.84+/. 26.88 respectively 191.25+/- 10.12 vs. 65.88+/- 6.04) and additionally in general a
higher degree of heterogeneity (0.65 respectively 0.50 vs. 0.35), characterized by a broader and less
aligned distribution, was seen. Considering physiology data for the ordinary chemostat no ethanol
growth was found (data not shown) and the ethanol concentration remained constant and higher
than in a two compartment chemostat (figure 8B). Compared to BFP fluorescence from ethanol
growth in batch cultivation the fluorescence during the two compartment cultivation was around
50% lower. However, the ethanol concentration was different in the two compartments (figure 8B).
These findings indicate that cells in the two compartments utilise ethanol because glucose
repression is released but in comparison to the recirculation the release of glucose repression is too
slow so that a switch from PCK1 repression to expression cannot be directly captured. For this
reason it could be interesting to perform two compartment cultivations with even lower
recirculation flow rate. But in general this application of the two compartment setup shows that it
reveals characteristics of the cultivation which cannot be captured using a conventional chemostat
because the flows as well as concentration differences between the feeding zone and the remaining
reactor volume are unknown and therefore the time cells linger in the different compartments is
unclear. By applying the here developed scale down system the expression differences cells are
found to exhibit in different parts of a large industrial scale reactor can be simulated9.
8.4 Conclusion and general applicability of approach for future experiments
The here presented approach of modeling in combination with the performance of experimental
work showed consistency or at least the same trend in most cases but also limitations, especially
under extreme growth conditions (high gravity glucose cultivations). Though in general the
approach is still useful for process optimization by applying modeling to get an overview of
conditions that might be interesting to perform in lab scale experiments exhibiting special traits like
e.g. oscillations found during our simulations. Such an approach can reduce the amount of
experiments to be performed because conditions revealing standard characteristics in the model
might not need to be performed in the lab.
The experimental setup can be used for studies of production processes in the development phase
for e.g. recombinant proteins, to investigate how production is influenced by compartmentalization
at different conditions. Furthermore, by applying reporter strains the single cell response e.g. in

Chapter 8– Systematic approach for evaluation of continuous scale down fermentation of S.
cerevisiae combining a newly developed two compartment setup with a PBM and unstructured
model 205
stress genes, growth or ethanol growth in the different compartments can be studied. For this
purpose it could also be interesting to include more sampling points or study more different
recirculation times and dilution rates to test the operating limits of the setup. In comparison to pulse
experiments in conventional chemostats, a setup like the here presented one has the advantage that
the flows between the two compartments are known, which makes it possible to assess phenomena
like the ones seen for the ethanol reporter strain. Furthermore in this setup the repeated exposure of
cells to a changing environment is taken into account whereas in perturbation studies this is only
achieved by pulsed feed experiments which are rarely reported up to now in physiological
investigations of single cells35
.

Chapter 8– Systematic approach for evaluation of continuous scale down fermentation of S.
cerevisiae combining a newly developed two compartment setup with a PBM and unstructured
model 206
8.5 References
1. Lencastre Fernandes, R. et al. Cell mass and cell cycle dynamics of an asynchronous budding
yeast population: experimental observations, flow cytometry data analysis, and multi-scale
modeling. Biotechnol. Bioeng. 110, 812–826 (2013).
2. Müller, S., Harms, H. & Bley, T. Origin and analysis of microbial population heterogeneity
in bioprocesses. Curr. Opin. Biotechnol. 21, 100–113 (2010).
3. Koutinas, M., Kiparissides, A., Pistikopoulos, E. N. & Mantalaris, A. Bioprocess systems
engineering : transferring traditional process engineering principles to industrial
biotechnology. Comput. Struct. biotechnoloy 3, (2012).
4. Ferrer-Miralles, N., Domingo-Espín, J., Corchero, J. L., Vázquez, E. & Villaverde, A.
Microbial factories for recombinant pharmaceuticals. Microb. Cell Fact. 8, (2009).
5. Chemler, J. a, Yan, Y. & Koffas, M. a G. Biosynthesis of isoprenoids, polyunsaturated fatty
acids and flavonoids in Saccharomyces cerevisiae. Microb. Cell Fact. 5, (2006).
6. Lidstrom, M. E. & Konopka, M. C. The role of physiological heterogeneity in microbial
population behavior. Nat. Chem. Biol. 6, 705–712 (2010).
7. Vrabel, P., Lans, R. G. J. M. Van Der, Luyben, K. C. A. M., Boon, L. & Nienow, A. W.
Mixing in large-scale vessels stirred with multiple radial or radial and axial up-pumping
impellers : modelling and measurements. Biotechnol. Bioeng. 55, 5881–5896 (2000).
8. Bylund, F., Collet, E., Enfors, S.-O. & Larsson, G. Substrate gradient formation in the large-
scale bioreactor lowers cell yield and increases by-product formation. Bioprocess Eng. 18,
(1998).
9. Enfors, S. O. et al. Physiological responses to mixing in large scale bioreactors. J.
Biotechnol. 85, 175–185 (2001).
10. Larsson, G. et al. Substrate gradients in bioreactors: origin and consequences. Bioprocess
Eng. 14, 281–289 (1996).
11. Schweder, T. et al. Monitoring of genes that respond to process-related stress in large-scale
bioprocesses. Biotechnol. Bioeng. 65, 151–159 (1999).
12. Lara, A. R. et al. Transcriptional and metabolic response of recombinant Escherichia coli to
spatial dissolved oxygen tension gradients simulated in a scale-down system. Biotechnol.
Bioeng. 93, 372–385 (2006).
13. Papagianni, M. Methodologies for Scale-down of Microbial Bioprocesses. J. Microb.
Biochem. Technol. 05, 1–7 (2011).

Chapter 8– Systematic approach for evaluation of continuous scale down fermentation of S.
cerevisiae combining a newly developed two compartment setup with a PBM and unstructured
model 207
14. Papagianni, M., Mattey, M. & Kristiansen, B. Design of a tubular loop bioreactor for scale-
up and scale-down of fermentation processes. Biotechnol. Prog. 19, 1498–1504 (2003).
15. George, S., Larsson, G. & Enfors, S.-O. A scale-down two-compartment reactor with
controlled substrate oscillations: Metabolic response of Saccharomyces cerevisiae.
Bioprocess Eng. 9, 249–257 (1993).
16. Bylund, F., Guillard, F., Enfors, S.-O., Trägårdh, C. & Larsson, G. Scale down of
recombinant protein production: a comparative study of scaling performance. Bioprocess
Eng. 20, (1999).
17. Sweere, A. P. J. et al. Modelling the dynamic behaviour of Saccharomyces cerevisiae and its
application in control experiments. Appl. Microbiol. Biotechnol. 116–127 (1988).
18. Delvigne, F., Destain, J. & Thonart, P. A methodology for the design of scale-down
bioreactors by the use of mixing and circulation stochastic models. Biochem. Eng. J. 28,
256–268 (2006).
19. Delvigne, F., Destain, J. & Thonart, P. Toward a stochastic formulation of microbial growth
in relation to bioreactor performances: case study of an E. coli fed-batch process. Biotechnol.
Prog. 22, 1114–1124 (2006).
20. Delvigne, F., Lejeune, A., Destain, J. & Thonart, P. Stochastic Models To Study the Impact
of Mixing on a Fed-Batch Culture of Saccharomyces cere W isiae. Biotechnol. Prog. 259–
269 (2006).
21. Fernandes, R. L. et al. Experimental methods and modeling techniques for description of cell
population heterogeneity. Biotechnol. Adv. 29, 575–599 (2011).
22. Carlquist, M. et al. Physiological heterogeneities in microbial populations and implications
for physical stress tolerance. Microb. Cell Fact. 11, (2012).
23. Verduyn, C., Postma, E., Scheffers, W. a & Van Dijken, J. P. Effect of benzoic acid on
metabolic fluxes in yeasts: a continuous-culture study on the regulation of respiration and
alcoholic fermentation. Yeast 8, 501–517 (1992).
24. Olsson, L. & Nielsen, J. On-line and in situ monitoring of biomass in submerged cultivations.
Reviews 15, 517–522 (1997).
25. Villadsen, J., Nielsen, J. & Lidén, G. Bioreaction Engineering Principles. (Springer US,
2011). doi:10.1007/978-1-4419-9688-6
26. Vanoni, M., Vai, M., Popolo, L. & Alberghina, L. Structural heterogeneity in populations of
the budding yeast Saccharomyces Structural Heterogeneity in Populations of the Budding
Yeast Saccharomyces cerevisiae. J. Bacteriol. 156, 1282–1291 (1983).
27. Porro, D., Vai, M., Vanoni, M., Alberghina, L. & Hatzis, C. Analysis and modeling of
growing budding yeast populations at the single cell level. Cytometry. A 75, 114–120 (2009).

Chapter 8– Systematic approach for evaluation of continuous scale down fermentation of S.
cerevisiae combining a newly developed two compartment setup with a PBM and unstructured
model 208
28. Odman, P., Johansen, C. L., Olsson, L., Gernaey, K. V & Lantz, A. E. On-line estimation of
biomass, glucose and ethanol in Saccharomyces cerevisiae cultivations using in-situ multi-
wavelength fluorescence and software sensors. J. Biotechnol. 144, 102–112 (2009).
29. Postma, E., Verduyn, C., Scheffers, W. A. & Dijken, J. P. V. A. N. glucose-limited
chemostat cultures of Enzymic Analysis of the Crabtree Effect in Glucose-Limited
Chemostat Cultures of Saccharomyces cerevisiae. Appl. Environ. Microbiol. 55, 468–477
(1989).
30. Van Dijken JP et al. An interlaboratory comparison of physiological and genetic properties
of four Saccharomyces cerevisiae strains. Enzyme Microb. Technol. 26, 706–714 (2000).
31. Hoek, P. I. M. V. A. N., Dijken, J. P. V. A. N. & Pronk, J. T. Effect of Specific Growth Rate
on Fermentative Capacity of Baker ’ s Yeast. Appl. Environ. Microbiol. 64, 4226–4233
(1998).
32. George, S., Larsson, G., Olsson, K. & Enfors, S.-O. Comparison of the Baker’s yeast process
performance in laboratory and production scale. Bioprocess Eng. 18, 135–142 (1998).
33. Brauer, M. J. et al. Coordination of Growth Rate , Cell Cycle , Stress Response , and
Metabolic Activity in Yeast. Mol. Biol. Cell 19, 352–367 (2008).
34. Zakrzewska, A. et al. Genome-wide analysis of yeast stress survival and tolerance
acquisition to analyze the central trade-off between growth rate and cellular robustness. Mol.
Biol. Cell 22, 4435–4446 (2011).
35. Sunya, S., Bideaux, C., Molina-Jouve, C. & Gorret, N. Short-term dynamic behavior of
Escherichia coli in response to successive glucose pulses on glucose-limited chemostat
cultures. J. Biotechnol. 164, 531–542 (2013).

Chapter 8– Systematic approach for evaluation of continuous scale down fermentation of S. cerevisiae combining a newly developed two
compartment setup with a PBM and unstructured model 209
APPENDIX 1: Equations for model 1
Eq. A1-1
Eq. A1-2
Eq. A1-3
Eq. A1-4

Chapter 8– Systematic approach for evaluation of continuous scale down fermentation of S. cerevisiae combining a newly developed two
compartment setup with a PBM and unstructured model 210
Eq. A1-5
Eq. A1-6
Eq. A1-7
Eq. A1-8
Eq. A1-9

Chapter 8– Systematic approach for evaluation of continuous scale down fermentation of S. cerevisiae combining a newly developed two
compartment setup with a PBM and unstructured model 211
Eq. A1-10
Eq. A1-11
Eq. A1-12
Eq. A1-13
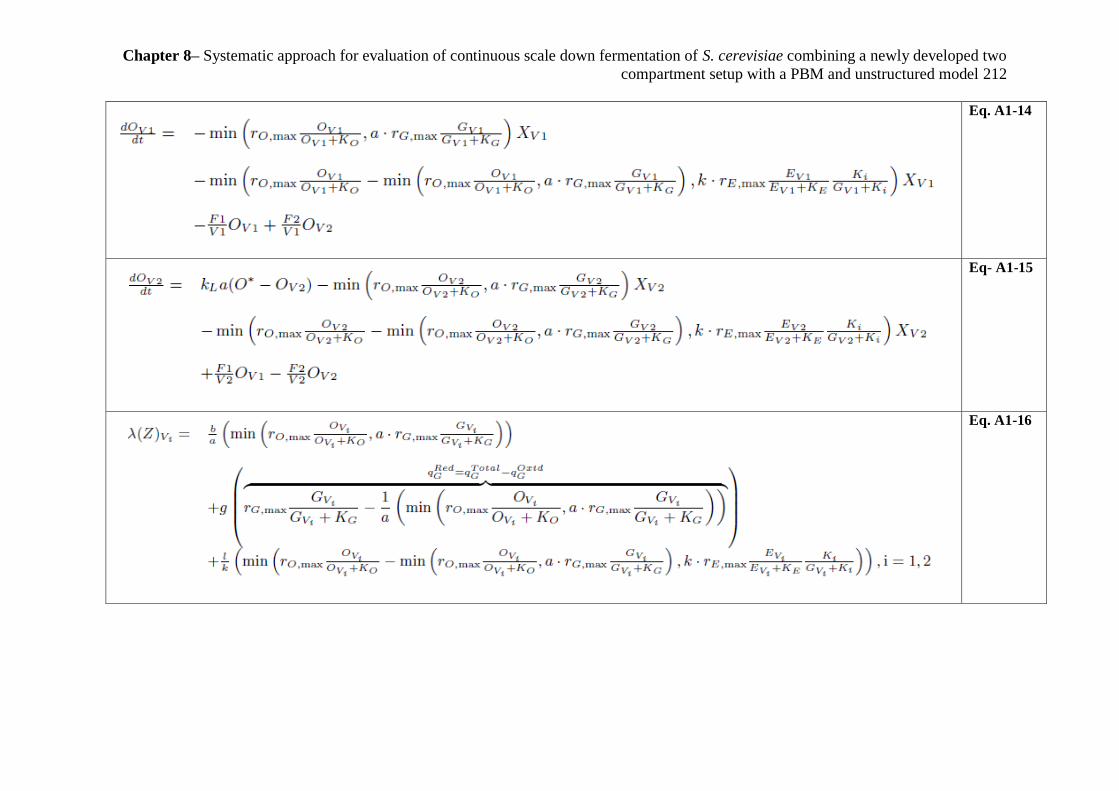
Chapter 8– Systematic approach for evaluation of continuous scale down fermentation of S. cerevisiae combining a newly developed two
compartment setup with a PBM and unstructured model 212
Eq. A1-14
Eq- A1-15
Eq. A1-16

Chapter 8– Systematic approach for evaluation of continuous scale down fermentation of S. cerevisiae combining a newly developed two
compartment setup with a PBM and unstructured model 213
APPENDIX 2: Experimental data for physiology and cell size and GFP respectively BFP fluorescence distribution data for one
compartment
Figure 9 – Variation of glucose, ethanol, glycerol, acetate, pyruvate, biomass and CO2 for one compartment experiments: using the
growth reporter strain FE440. Results are shown for the experimental performed cases (A, E, H, F, I).

Chapter 8– Systematic approach for evaluation of continuous scale down fermentation of S. cerevisiae combining a newly developed two
compartment setup with a PBM and unstructured model 214
Figure 10 – Variation of the experimental cell size distribution in steady state for one compartment experiments: using the growth
reporter strain FE440. Results are shown for the experimental performed cases (A, E, H, F, I).

Chapter 8– Systematic approach for evaluation of continuous scale down fermentation of S. cerevisiae combining a newly developed two
compartment setup with a PBM and unstructured model 215
Figure 11 – histogram plots for GFP fluorescence/membrane robustness data in steady state for one compartment experiments:
after applying freeze-thaw stress using the growth reporter strain FE440. Plots are shown as a comparison between the different cases (A,
E, F, H and I) for two following residence times in steady state.

Chapter 8– Systematic approach for evaluation of continuous scale down fermentation of S. cerevisiae combining a newly developed two
compartment setup with a PBM and unstructured model 216
APPENDIX 3: Modeling data for physiology and cell size distribution for one compartment
Figure 12 – Variation of glucose, ethanol, glycerol, acetate, pyruvate, biomass and CO2 for one compartment model: results are
shown for the experimental performed cases (A, E, H, F, I). Blue: glucose; Black: ethanol; Red: biomass; Green: dissolved oxygen;
Yellow: budding index.

Chapter 8– Systematic approach for evaluation of continuous scale down fermentation of S. cerevisiae combining a newly developed two
compartment setup with a PBM and unstructured model 217
Figure 13 – Variation of cell size distribution for one compartment model: results are shown for the modeled cases (A, E, H, F, I).

Chapter 9 - Conclusion and Outlook 218
9. Chapter
Conclusion and Outlook
9.1 Conclusion
In this chapter the major findings of the work described in this thesis are summed up. The aim was
to study the occurrence and consequences of population phenotypic heterogeneity for the two cell
factories E. coli and S. cerevisiae under different modes of bioprocess operation. For this purpose,
different analytical and experimental tools were developed and applied. This included new high-
throughput methods for quantitative analysis of large volumes of flow cytometry data and the
development and validation of new reporter strains to monitor population heterogeneities in growth
and cell membrane robustness. The major novelties related to tools applied will be shortly evaluated
and summed up in the following sections where after the main physiological findings will be
discussed.
9.1.1 Physiological characteristics of E. coli and S. cerevisiae as reporter strains
Reporter gene technology is powerful for dynamic in vivo measurements of activities of specific
promoters, which in turn correlate to specific cell properties. By using modern strain genetic
engineering techniques it is possible to place the gene coding for an easily detectable protein under
the control of any given promoter9.
The growth reporters were of slightly different nature for the two organisms. The two E. coli
reporter strains carried a destabilized GFP version integrated on a low copy number plasmid whose
expression was correlated to growth via promoters connected to the activation of the ribosomal
polymerase rRNA synthesis (fis and rrnb promoter) (see figure 1). Therefore the strains allowed
following of fast dynamic changes in batch and continuous cultivation as a response to a glucose
pulse at different growth rates (see chapter 6 and 7). In contrast, the S. cerevisiae reporter strain,
which was developed and validated in the scope of this thesis, carried a stable GFP which was
chromosomally integrated upstream of the ribosomal promoter RPL22a (see figure 2). As a
consequence of the stable GFP, but also due to the slower growth of S. cerevisiae compared to E.

Chapter 9 - Conclusion and Outlook 219
coli the reporter sometimes failed to capture fast changes e.g. as the response to a glucose pulse at
high growth rates or showed delayed response due to the maturation time of the GFP (see chapter
6). Due to the same reason possibly also no changes in GFP fluorescence between the two
compartments could be detected in the applied scale down system (chapter 8). Additionally, the
relatively long time until a stable GFP degrades makes it impossible to see direct switch off of any
reporter system. Furthermore the E. coli reporter strains were found to be suitable to be used as
“growth rate” reporter strains1 exhibiting a GFP fluorescence expression that can be directly
correlated to the growth rate whereas the S. cerevisiae reporter strain was more a “growth” or
“physiological state” reporter because opposite to original believe (based on transcriptomics data2) a
rise in growth rate was not directly correlated to a rise in GFP expression. Instead the GFP
expression upshift was rather correlated to nutrient upshift. Though, apart from some exceptions
(e.g. under extreme growth conditions in high gravity batch cultivation, chapter 5) the strain could
still be successfully applied to study growth patterns during e.g. batch cultivation as well as
continuous culture. This demonstrates in general that the choice of the reporter gene should be done
with caution and the reporter strain preferably well characertised under different conditions that
could possibly influence the expression of the gene of interest to eliminate false conclusions in
more complex experimental setups.
Figure 1 – The E. coli growth reporter strains rrnb and fis. The Fis protein has three binding
sites in front of the rrnB P1 promoter. The physical location of rrnB P1P2 promoter and gfp gene is
illustrated. The figure is borrowed from Han et al. (2013)1.

Chapter 9 - Conclusion and Outlook 220
Figure 2 – The dual S. cerevisiae growth reporter strain FE440 which can be used to
investigate growth related GFP fluorescence as well as when applying freeze-thaw stress to evaluate
cell membrane robustness.
Moreover, the S. cerevisiae growth reporter strain was found to be a dual reporter strain (see figure
1) revealing information about cell membrane robustness when applying freeze-thaw stress to broth
samples and performing the flow cytometry analysis at acidic pH (applied in chapter 4, 5 and 6).
Later it was demonstrated that this tool to assess cell membrane robustness is not exclusive for yeast
but can also be applied for E. coli (chapter 6).
The second applied S. cerevisiae reporter strain (applied in chapter 8), an ethanol reporter strain
based on the expression of TagBFP under the control of the promoter for the phosphoenolpyruvate
carboxykinase 1 (PCK1), was found suitable to monitor ethanol growth of cells in scale down
reactors. Due to the pH-independency of TagBFP, however, no information about the cell
membrane robustness could be gained. In conclusion, all in this thesis applied reporter strain
systems were found to be valuable tools within their scope of applicability to monitor single cell
characteristics.
9.1.2 Use of flow cytometry in combination with fluorescent stains and reporter strains for
single cell analysis of microbial populations
As a high throughput technique flow cytometry is able to generate large amounts of data points (cell
count) within seconds from broth samples representing the cell population inside the bioreactor. It
was successfully applied to record data for cell size (FSC), cell morphology (SSC) and fluorescence
originating from stains (see chapter 4 and 7) or reporter strains (BFP and GFP based). As
summarised above, different fluorescent reporter strains were effectively employed to follow single
cell distribution characteristics in cultivation processes of different nature (batch, chemostat and

Chapter 9 - Conclusion and Outlook 221
two compartment reactors). Additionally, different fluorescence stains were successfully used to
follow viability (PI and DiBAC4) or metabolic activity (CTC, RSG and SYBR green) of single cells
throughout the different phases of batch cultivation (chapter 7). Both approaches revealed useful
information about single cell characteristics under different growth conditions, but especially for the
stains, the choice of which combination of stains to apply should be made with care depending on
which physiological traits to focus on. It is important to note that some stains, although targeting the
same cell property e.g. metabolic activity, exhibited slightly different results (chapter 7, RSG and
CTC). Hence, it is important to fully investigate the specific target(s) for the stain one want to use.
Some obstacles were experienced during the application of flow cytometry in this work. For
example measurements are strongly dependent on the day of measurement which makes it
sometimes critical to compare results achieved on different days although calibration beads are
applied. Especially, when measuring on fresh samples (non-frozen samples, kept on ice) results can
easily vary when the settings are not completely the same. Hereby also storage and treatment of the
samples plays a big role. When analysing freeze-thaw stressed cell samples the sample handling
procedure should be exactly the same to eliminate other possible influences that can change the
fluorescence results especially also when the samples are frozen and thawed, as a different freezing
(e.g. fast freezing in liquid nitrogen and slow freezing on ice) and thawing speed also influences the
level of cell robustness (unpublished results). Furthermore, using different instruments with
different resolution makes an objective data comparison challenging as the underlying mathematical
relations needs to be evaluated first. Obviously some of these problems especially concerning
sample handling can be circumvented by using an online flow cytometer with an automated
sampling unit as already has been applied in a few studies by otehrs and e.g. the cytostat (see
chapter 2,3–5
).
In conclusion flow cytometry is a powerful tool for the investigation of single cell heterogeneities
but it also needs to be used with caution to avoid wrong conclusion on recorded data because the
output is influenced by the conditions accompanying the measurements. Furthermore as also
summed up in chapter 2 both reporter strains and stains or a combination of both show big potential
for single cell physiological investigations in both research and industry. Although reporter strains
might only be suitable in industry for the development or optimization of bioprocesses since the
introduction of a fluorescent protein in a production process might change or influence the
production characteristics. Therefore, fluorescent stains targeting different cell properties might in

Chapter 9 - Conclusion and Outlook 222
this case be the choice as also already employed e.g. viability staining as a standard method in fed-
batch production processes (see chapter 2).
9.1.3 Setups for the experimental study of population heterogeneity
During this thesis different experimental setups have been used to study population heterogeneity of
S. cerevisiae and E. coli, simulating conditions experienced in large scale cultivations, in lab scale.
Batch cultivations were performed as a first approach to characterise the applicability of reporter
strains and fluorescence stains as well as for getting an overview of single cell heterogeneities under
dynamic conditions. Through the different growth phases fluorescence properties originating from
fluorescent stains and reporter strains could be successfully monitored in response to different
growth rates and growth environment (e.g. high substrate concentrations during exponential phase,
nutrient limitation in stationary phase, overflow metabolism) (chapter 4,5 and 7). To further
investigate the responsiveness of the reporter strains featuring growth correlated GFP fluorescence
to different growth rates, continuous cultivations were used comparing slow and fast grown cells.
Afterwards, the cultures were perturbed with glucose pulses simulating the feeding zone of large
scale fed-batch cultivations and the sudden rise in substrate concentration cells experience passing
through that zone (chapter 6). Results (see below for summary) were consistent with earlier studies
investigating cell responses in large scale fermentation6,7
, which makes pulse experiments in
continuous cultivations generally a valuable tool to study gradients. However when applying
specialised setups e.g. a two compartment chemostat setup (scale down reactor, chapter 8) which is
a different way to simulate the zones seen in large-scale reactors, that arise due to gradients in
substrate and oxygen (feeding zone: high glucose/low oxygen level, remaining reactor: lower
glucose/higher oxygen level), characteristics that are hidden due to unknown flows between
different compartments in a conventional chemostat can be made visible. An example is the ethanol
consumption monitored by the application of the ethanol reporter strain which could not be found in
a normal chemostat (chapter 8). Furthermore, in a scale down setup cells are confronted to repeated
passage through the feeding zone which makes this setup probably better comparable with an
industrial large scale setup. Therefore different scale down setups have earlier been frequently
applied in single cell research (chapter 2).
9.1.4 Data analysis applying objective methods and in combination with modeling
Already during my summary of literature related to single cell studies simulating large scale
fermentation in lab scale to investigate the phenomenon of population heterogeneity the lack of
Chapter 9 - Conclusion and Outlook 223
deeper, systematic and objective/unbiased data analysis and presentation, especially for the big
amounts of data collected by flow cytometry analysis, was made evident (chapter 2). This has also
been concluded by earlier publications8–10
. However, general practice for treatment of flow
cytometry data is the presentation of biplots or histograms of two related single cell properties
respectively single parameter distributions, which are then interpreted subjectively using the bare
eye to evaluate population shifts or manual gating (which has been developed and published by
others) into positive and negative subpopulations e.g. for fluorescence stains (chapter 2). Also the
calculation of mean values and rarely CV (coefficient of variance) is applied, which indeed scales
down the complex data distribution data to single values that can be presented as time plots, but also
presents significant loss of information about the population shape (e.g. broadness, tailing),
appearance of subpopulations and potential shifts of the whole population. Without applying
difficult mathematical equations, but just using interval analysis or subpopulation analysis dividing
e.g. a histogram or biplot into different fluorescence areas and calculate the percentage or amount of
relative fluorescence in each area one can raise the level of data interpretation up in objectivity and
detail (chapter 4 and 5). Thereby the amount of output values that needs to be compared can still be
held small in comparison to the original data set which simplifies the comparison of different
cultivation conditions. Though if the amount of different conditions is large multivariate statistical
tools for the comparison of data sets e.g. ANOVA, regression analysis or principal component
analysis (PCA) as used in this thesis (chapter 5) can be easily applied (as they are e.g. add-in
functions in excel) to verify the significance of differences between datasets. Furthermore, by
applying simple mathematical tools new parameters for the objective description of histograms of
fluorescence distributions could be derived (chapter 6). As demonstrated in this thesis adding the
peak width (at baseline level or at half height) and the slope of the cumulative fluorescence
distribution as standard parameters for the distribution description, additionally to the mean
fluorescence and the CV, information about distribution heterogeneity in general and about peak
shape and subpopulation appearance in specific can be presented in a simple but quantitative
manner. Consequently a combination of the derived values can be plotted over time as e.g. general
physiology data and still give valuable and objective information about the whole distribution as
well as about shifts over time (chapter 6 and 7). Though it needs to be mentioned that depending on
the study and the desired level of information (e.g. focus on subpopulation or shifts, or just general
trends needed) the combination of parameters needs to be well considered. Furthermore, when only
calculating a single parameter it might again scale down data to an average level that fail to describe

Chapter 9 - Conclusion and Outlook 224
the real scenario of the single cell population in the bioreactor throughout time or at a particular
sampling point.
Another important approach that could aid to facilitate interpretation and handling of data analysis
and process control is combining modeling with experimental work (Chapter 8), which is up to now
rarely applied (Chapter 2) but found to have high potential especially for bioprocess optimization11
.
Approaches like this can reduce the experimental space or at least put some borders because the
whole range of possible conditions can be evaluated using modeling and afterwards interesting
conditions can be picked to be performed experimentally. Results can then be integrated back into
the model to increase its predictive power and in the end lead to strategies for process development
and optimization.
In conclusion both deeper data analysis especially of complex flow cytometry data and the
combination of modeling and experimental work shows great potential for the improvement of
industrial scale bioprocesses as well as for population heterogeneity research to investigate small
differences of single cell distributions in an unbiased systematic way under experimental interesting
conditions.
9.1.5 Summary of major physiological findings related to population heterogeneity
In general the project was based on the hypothesis that because population heterogeneity is a two-
sided phenomenon, leading towards decreased yields and an increased by-product formation but on
the other hand also to cell populations that could easier adjust to a changing environment, there
should be an optimal level of population heterogeneity, which results in high-yielded robust
fermentation processes. In the scope of this thesis experiments revealed that to find this optimum
the influences of several environmental factors (e.g. substrate, oxygen, pH etc.) on microbial cell
factory and its characteristics (e.g. cell size, viability, metabolic activity, cell robustness etc.) need
to be evaluated and quantified in depth at first, because things ongoing in a bioreactor are way more
dynamic than prior thought (e.g. chapter 4 and 5).
By subjecting growth reporter strains of E. coli and S. cerevisiae to glucose perturbation (chapter 6),
similar trends were seen, which is intriguing when taking into account the very different nature of
the two microorganisms. For both microbes it was found that slow growing cells are mostly robust
but the intact cells highly responding to the pulse whereas fast growing cells were less robust but
intact cells less responding to the pulse. However, when glucose was pulsed it acted as protectant of

Chapter 9 - Conclusion and Outlook 225
cells and increased the membrane robustness of fast growing cells. Some differences between the
two microbes were seen, for instance E. coli was found to be less sensitive to freeze-thaw stress
than yeast.
In batch cultivation of an E. coli growth reporter strain combined with the application of different
fluorescent stains (chapter 7) it was seen that, although acetate is known to be highly toxic for E.
coli, single cell physiology does not exhibit severe differences using glucose or acetate as sole
carbon source. Cells in both cases were highly viable and metabolic active. Though, for cells grown
on acetate as sole carbon a small fraction of the cell population was found to be more robust than
the remaining population, which was not seen for cells growing on acetate after diauxic shift.
Additionally, when investigating population heterogeneity concerning growth and membrane
robustness in a two-compartment chemostat it was revealed that single cell characteristics are
significantly influenced depending on the severity of differences between the two compartments
(chapter 8).
9.2 Outlook
In continuation of this thesis to get a deeper understanding of how exactly the applied reporter
systems function as well as to evaluate the growth and stress response on a deeper level
transcriptomics and/or proteomics should be integrated into the analysis of the cultivation
processes. Furthermore these methods could also be applied after cell sorting of different
subpopulations e.g. of different cell membrane robustness as seen as a response to the pulse or
during batch cultivation, to examine the underlying cellular characteristics that result in the
development of the different phenotypes in a population. Moreover after successful sorting of cells
from the subpopulations, they could be regrown if the sorting procedure allows sterile work. This
could aid in strain development and improvement in line with the new upcoming field strain
population engineering. All this could possibly be combined with a setup that complements the
basic fermentation setups with an online flow cytometer with automated sampling to get online
fluorescence data without the gaps that occur between normal sampling points for the different
reporter strains as well as for maybe additionally applied fluorescent stains. Also the application of
further reporter strains monitoring different cell properties as e.g. a stress reporter strain or even
more interesting especially in the industrial perspective a single protein expression reporter strain
would be relevant. Furthermore the in this thesis developed scale down system should be deeper
characterised testing its borders, e.g. using even lower recirculation, different length or circulation

Chapter 9 - Conclusion and Outlook 226
tubes and different dilution rates. Afterwards the system could also be combined with the above
mentioned online flow cytometer and fluorescence stains e.g. for viability and metabolic activity
and maybe transcriptomics. Also a comparison with a setup combining a PFR and STR could be of
interest to evaluate the different properties. For this purpose the integration of rapid sampling
methods similar to a bioscope could be useful. In the end to scale things down and in depth
investigation of the single cell behaviour in an isolated environment, microbioreactor studies should
be performed.
All possible further studies should obviously also be accompanied by objective, systematic data
analysis methods, maybe by using and evolving and the in this thesis introduced mathematical
parameters and methods and combine them with modeling approaches. Together all this could lead
to the ability of detailed description of population heterogeneity experienced in large scale
biotechnological production processes and derived from that the development of control strategies.

Chapter 9 - Conclusion and Outlook 227
9.3 References
1. Han, S., Delvigne, F., Brognaux, A., Charbon, G. E. & Sørensen, S. J. Design of growth-
dependent biosensors based on destabilized GFP for the detection of physiological behavior
of Escherichia coli in heterogeneous bioreactors. Biotechnol. Prog. 29, 553–563 (2013).
2. Regenberg, B. et al. Growth-rate regulated genes have profound impact on interpretation of
transcriptome profiling in Saccharomyces cerevisiae. Genome Biol. 7, (2006).
3. Zhao, R., Natarajan, A. & Srienc, F. A flow injection flow cytometry system for on-line
monitoring of bioreactors. Biotechnol. Bioeng. 62, 609–617 (1999).
4. Abu-Absi, N. R., Zamamiri, A., Kacmar, J., Balogh, S. J. & Srienc, F. Automated flow
cytometry for acquisition of time-dependent population data. Cytometry. A 51, 87–96 (2003).
5. Kacmar, J., Gilbert, A., Cockrell, J. & Srienc, F. The cytostat: A new way to study cell
physiology in a precisely defined environment. J. Biotechnol. 126, 163–172 (2006).
6. Bylund, F., Collet, E., Enfors, S.-O. & Larsson, G. Substrate gradient formation in the large-
scale bioreactor lowers cell yield and increases by-product formation. Bioprocess Eng. 18,
(1998).
7. George, S., Larsson, G., Olsson, K. & Enfors, S.-O. Comparison of the Baker’s yeast process
performance in laboratory and production scale. Bioprocess Eng. 18, 135–142 (1998).
8. Delvigne, F. & Goffin, P. Microbial heterogeneity affects bioprocess robustness: Dynamic
single-cell analysis contributes to understanding of microbial populations. Biotechnol. J. 9,
61–72 (2014).
9. Fernandes, R. L. et al. Experimental methods and modeling techniques for description of cell
population heterogeneity. Biotechnol. Adv. 29, 575–599 (2011).
10. Lencastre Fernandes, R. et al. Cell mass and cell cycle dynamics of an asynchronous budding
yeast population: experimental observations, flow cytometry data analysis, and multi-scale
modeling. Biotechnol. Bioeng. 110, 812–826 (2013).
11. Koutinas, M., Kiparissides, A., Pistikopoulos, E. N. & Mantalaris, A. Bioprocess systems
engineering : transferring traditional process engineering principles to industrial
biotechnology. Comput. Struct. biotechnoloy 3, (2012).

Chapter 10 - Appendix 228
10. Appendix
List of publications not included in the thesis
Cell mass and cell cycle dynamics of an asynchronous budding yeast population
Lencastre Fernandes, Rita ; Carlquist, Magnus ; Lundin, Luisa ; Heins, Anna-Lena ; Dutta,
Abhishek ; Sørensen, Søren J. ; Jensen, Anker Degn ; Nopens, Ingmar ; Eliasson Lantz,
Anna ; Gernaey, Krist
in journal: Biotechnology and Bioengineering, vol: 110, issue: 3, pages: 812-826, 2013
Type: Journal article
Status: Published 2013
Applying mechanistic models in bioprocess development.
Lencastre Fernandes, Rita ; Bodla, Vijaya Krishna ; Carlquist, Magnus ; Heins, Anna-
Lena ; Eliasson Lantz, Anna ; Sin, Gürkan ; Gernaey, Krist
part of: Advances in Biochemical Engineering/Biotechnology, pages: 137–166, 2013,
Springer
Type: Book chapter
Status: Published 2013
Experimental methods and modeling techniques for description of cell population
heterogeneity
Lencastre Fernandes, Rita ; Nierychlo, M. ; Lundin, L. ; Pedersen, Anne Egholm ;
PuentesTellez, P. E. ; Dutta, A. ; Carlqvist, Magnus ; Bolic, Andrijana ; Schäpper,
Daniel ; Brunetti, Anna Chiara ; Helmark, Søren ; Heins, Anna-Lena ; Jensen, Anker
Degn ; Nopens, I. ; Rottwitt, Karsten ;Szita, Nicolas ; van Elsas, J. D. ; Nielsen, P. H.
; Martinussen, Jan ; Sørensen, S. J. ; Eliasson Lantz, Anna ; Gernaey, Krist
in journal: Biotechnology Advances, vol: 29, issue: 6, pages: 575-599, 2011
Type: Journal article
Status: Published 2011