pork market value chain profile - nda.agric.zanda.agric.za/docs/amcp/porkmvcp2011-12.pdf · a...
TRANSCRIPT

1
A PROFILE OF THE SOUTH AFRICAN PORK MARKET VALUE CHAIN
2011
Directorate Marketing Private Bag X 15
Arcadia 0007
Tel: 012 319 8455/6 Fax: 012 319 8131
Email: [email protected]

TABLE OF CONTENTS
1. DESCRIPTION OF THE INDUSTRY. 3
1.1. Production areas. 3
1.2. Production trends. 4
5
6
6
6
78
1820
23
25
25
26
26
27
28
28
34
40
1.3. Local Consumption.
1.3. Employment.
2. MARKET STRUCTURE
2.1. Domestic Market.
2.2. Import – Export Analysis. 2.2.1. Export for pork. 2.2.2. Share Analysis. 2.2.3. Imports.
3. MARKETING CHANNELS / VALUE CHAIN.
4. OPPORUNITIES AND CHALLENGES.
5. STRENGTHS AND WEAKNESSES.
6. MARKET INTELLIGENCE.
6.1. Export tariffs.
6.2. Import tariffs.
7. PERFORMANCE ANALYSISOF SOUTH AFRICAN PORK INDUSTRY IN 2010.
7.1. Exports.
7.2. Imports.
8. ACKNOWLEDGEMENTS.
2

1. DESCRIPTION OF THE INDUSTRY.
South African pork industry is relatively large in terms of overall South African agricultural sector. It contributes around 2.15% to the primary agricultural sector. The gross value of production of pork is dependent on the quantity produced and the price received by farmers. The trend in gross value follows a pattern of prices since the industry is characterized by volatile prices. The average gross value of pork over the past 10 years amounted to R 1 763 million. The contribution of pork to the gross value of agricultural production increased steadily from 2000/01 to 2005/06. From 2006/07 to 2008/09 there were substantial increases in gross value due to an increase in prices. Gross value experienced slight decreases in 2009/10 compared to 2008/09.
Figure 1: Gross value of pigs slaughtered
0
500,000
1,000,000
1,500,000
2,000,000
2,500,000
3,000,000
3,500,000
2000
/01
2001
/02
2002
/03
2003
/04
2004
/05
2005
/06
2006
/07
2007
/08
2008
/09
2009
/10
Period (Years)
Thou
sand
Ran
ds
Source: Statistics and Economic Analysis.
1.1. Production areas.
Pork is produced throughout South Africa with Limpopo and North West provinces being the largest producers accounting for 44% of total production. Figure 2 below shows the production of pork per province during 2010.
3

Figure 2: Distribution of pigs per Province in 2010
Eastern Cape 6%
Western Cape 11%
Gauteng 11%Mpumalanga 8%
Limpopo 24%
Kwazulu-Natal 10%
North West 20%
Free State 8%Northern Cape
2%
Source: Statistics and Economic Analysis. There are approximately 400 commercial producers and 19 stud breeders in South Africa. Pig numbers are estimated at 1 599 million. During 2010, Limpopo province produced 24% of all pork produced in South Africa followed up by North West with 20%, Western Cape and Gauteng by 11% each.
1.2. Production trends. It is estimated that over 2.5 million pigs were slaughtered during 2010 yielding over 2 million tons of pork. Figure 3 below shows the number of pigs slaughtered and pork production from the period between 2000/01 and 2009/10.
4

Figure 3: Pork production and pigs slaughtered
0
500,000
1,000,000
1,500,000
2,000,000
2,500,000
2000
/01
2001
/02
2002
/03
2003
/04
2004
/05
2005
/06
2006
/07
2007
/08
2008
/09
2009
/10
Period (Years)
Qua
ntit
y (T
ons)
0
500,000
1,000,000
1,500,000
2,000,000
2,500,000
3,000,000
Pigs
sla
ught
ered
Production Slaughterings
Source: Statistics and Economic Analysis. Figure 3 shows that pigs slaughtered and pork production followed the same trend over the past decade but pigs slaughtered remained almost stable. Pork production increased steadily from 2000/01 to 2003/04 and started fluctuating from 2004/05 to 2009/10. Both pigs slaughtered and pork production reached the peak in 2006/07 due to global economic recession in August 2008 and in 2009/10.
1.3. Local Consumption.
Figure 4 below depicts local consumption of pork comparing it to the total production for each year to determine if the country is self – sufficient in terms of pork production.
5

Figure 4: Pork production vs consumption
0
500,000
1,000,000
1,500,000
2,000,000
2,500,000
2000
/01
2001
/02
2002
/03
2003
/04
2004
/05
2005
/06
2006
/07
2007
/08
2008
/09
2009
/10
Period (Years)
Qua
ntit
y (T
ons)
Production Consumption
Source: Statistics and Economic Analysis.
Figure 4 indicates that in South Africa more pork is produced than it is consumed. This makes South Africa to be the net exporter of pork. Both production and consumption has been increasing throughout the period under analysis and following the same pattern.
1.3. Employment.
Commercial pig farmers are estimated at 4000, stud farmers 19 and smallholder farmers are 100; they own about 125 000 sows (100 000 sows commercial and 25 000 smallholder farmers) they employ about10 000 workers, comprising of about 4 000 farm workers and 6 000 workers in the processing and abattoir sectors.
2. MARKET STRUCTURE.
2.1. Domestic Market.
The local market is split at almost 50:50 between the fresh meat market and the processing meat market.
6
The pork industry evolved from a highly regulated environment to one that is totally deregulated today. Various policies, such as the distinction between controlled and uncontrolled areas, compulsory levies payable by producers, restrictions on the establishment of abattoirs, the compulsory auctioning of carcasses according to grade and mass in controlled areas, the supply control via permits and quotas, the setting of floor prices, removal scheme, etc., characterised the pork industry before deregulation commenced in the early 1990s. Since the deregulation of the

agricultural marketing dispensation in 1997, the prices in the red meat industry are determined by demand and supply forces. Average producer prices of pork from 2000 to 2009/10 are illustrated in Figure 5.
Figure 5: Average pork producer prices
4.00
8.00
12.00
16.00
20.00
2000
/01
2001
/02
2002
/03
2003
/04
2004
/05
2005
/06
2006
/07
2007
/08
2008
/09
2009
/10
Period (Years)
Ran
ds p
er k
g
Source: Statistics and Economic Analysis.
The average producer price of pork slightly fluctuated during the period under analysis. The peak price of R 15.86 per Kg was reached in 2008/09 and the lowest price of R 8.99 was experienced in 2000/01. There is an increase of R 5.98 in 2009/10 compare to 200/01 and a decrease of R0.89 compared to 2008/09 which was the peak.
2.2. Import – Export Analysis.
Figure 6 compares volumes of imports and exports for pork (pork included) from 2001 to 2010.
7

Figure 6: Pork import and export quantities
0
5,000,000
10,000,000
15,000,000
20,000,000
25,000,000
30,000,000
2001
2002
2003
2004
2005
2006
2007
2008
2009
2010
Years
Kilo
gram
s
Export Quantities Import Quantities
Source: Quantec EasyData.
Figure 6 indicates that from 2001 to 2010, South Africa’s pork exports were far less than the imports. It was only in 2005 were exports increased substantially above 20 million kilograms. This means that South Africa is a net importer of pork.
2.2.1. Export for pork.
South Africa exported approximately 30.7 million kilograms of pork from 2001 to 2010, yielding an export value of R 212.3 million over the same period. The quantity and the value for exports of pork are shown in Figure 7 below.
8

Figure 7: Pork exports
0
5,000,000
10,000,000
15,000,000
20,000,000
25,000,000
2001
2002
2003
2004
2005
2006
2007
2008
2009
2010
Years
Kilo
gram
s
0
10,000,000
20,000,000
30,000,000
40,000,000
50,000,000
60,000,000
Ran
ds
Export quantities Exports values
Source: Quantec EasyData.
From Figure 7, pork exports remained lower over the past decade excluding the year 2005, which displayed an outlier of 20 million kilograms. During 2005 when the export quantity was very high the export value remained low which indicates that it was less profitable to export pork in 2005 than any other years. Exports value of pork was slightly fluctuating from 2001 to 2006 before increasing substantially from 2007 to 2009 and decreased again in 2010. Export value of pork increased by over R32 million in 2010 compared to 2001 and decreased by R 13 million compare to 2009 which was the peak..
9

Figure 8: Pork exports without 2005
0
500,000
1,000,000
1,500,000
2,000,000
2,500,000
3,000,000
2001
2002
2003
2004
2006
2007
2008
2009
2010
Years
Kilo
gram
s
0
10,000,000
20,000,000
30,000,000
40,000,000
50,000,000
60,000,000
Ran
ds
Export quantities Exports values
Source: Quantec EasyData. Figure 8 above shows a different trend of pork exports when 2005 is excluded. Export quantities of pork were generally low from 2001 to 2007 and experienced a sharp increase in 2008 before a slight decline in 2009 to 2010.
Figure 9: Pork exports to SADC
0
400,000
800,000
1,200,000
1,600,000
2,000,000
2001
2002
2003
2004
2005
2006
2007
2008
2009
2010
Years
Kilo
gram
s
Angola Democratic Republic of the CongoMauritius MalawiMozambique SeychellesUnited Republic of Tanzania ZambiaZimbabwe
10
Source: Quantec EasyData.

South African pork is mainly exported to SADC countries. Mozambique, Mauritius, Angola, DRC, Seychelles displayed fluctuations from 2001 to 2007. Mauritius commanded the highest share of South African pork of in 2008 & 2010 and Zimbabwe was the highest in 2009.
Figure 10: Pork exports to Eastern, Middle and Western Africa
0
20,000
40,000
60,000
80,000
2001
2002
2003
2004
2005
2006
2007
2008
2009
2010
Years
Kilo
gram
s
Congo Ethiopia Gabon Ghana Nigeria Saint Helena Uganda
Source: Quantec EasyData.
Figure 10 displays that pork produced in South Africa was mainly exported to Nigeria in Western Africa. It commanded the greatest share of South African pork from 2001 to 2010 followed by Saint Helena. Congo obtained the second highest level in 2008 and Uganda was the second highest in 2002.
11

Figure 11: Pork destinations in 2010
Democratic Republic of the
Congo7%
Mauritius33%
Mozambique12%
Nigeria2%
Zimbabwe16%
Not allocated20%
Angola8%
United Arab Emirates
2%
Source: Quantec EasyData. It is noted that South African pork is exported within the continent, mostly to SADC countries which constitutes 76% of the total pork exported, United Arab Emirates from Asia and Nigeria from Western Africa constituted 2% each. 20% of South African pork exports were not allocated during the period of analysis. Values of pork exports from various provinces of South Africa are presented in Figure 12.
12

Figure 12: Value of pork export from Provinces
0
5,000
10,000
15,000
20,000
25,000
30,000
35,000
Years
Thou
sand
Ran
ds
Western Cape 1,272 3,853 3,294 3,722 2,497 1,811 8,146 11,656 14,463 15,616
Eastern Cape 0 4 0 0 0 0 0 0 0 0
Free State 0 0 0 0 0 0 0 1,151 489 0
Kw azulu-Natal 1,937 4,177 1,201 576 481 2,790 2,234 952 3,504 3,160
North West 0 0 0 0 0 0 0 0 1,298 4
Gauteng 4,817 8,091 5,064 3,277 9,105 6,769 9,194 21,101 33,003 20,566
Mpumalanga 95 6 321 19 2 0 0 0 141 460
Limpopo 0 0 0 0 0 0 0 0 0 2
2001 2002 2003 2004 2005 2006 2007 2008 2009 2010
Source: Quantec EasyData. Gauteng province dominated pork exports from 2001 to 2010 followed Western Cape and KwaZulu–Natal Provinces. This is due to the fact that these provinces are main exit points for pork and due to infrastructure developments that facilitate trade. The following figures (Figures 13 - 20) show the value of pork exports from the various districts within 8 (eight) provinces of South Africa.
13

Figure 13: Value of pork exports from Western Cape Province
0
3,000
6,000
9,000
12,000
15,000
18,000
Years
Thou
sand
Ran
ds
City of Cape Town 1,272 3,853 3,294 3,722 2,497 1,811 8,146 11,656 14,463 15,592
Cape Winelands 0 0 0 0 0 0 0 0 0 24
2001 2002 2003 2004 2005 2006 2007 2008 2009 2010
Source: Quantec EasyData. Figure 13 indicates that City of Cape Town metropolitan municipality was a regular exporter and experienced sharp increases from 2007 to 2010. City of Cape Town district is the main exit point in the Western Cape. Cape Winelands district municipality recorded exports during 2010 only.
Figure 14: Value of pork exports from Eastern Cape Province
0
500
1000
1500
2000
2500
3000
3500
4000
Years
Ran
ds
Amatole 0 3671 0 0 0 0 0 0 0 0
2001 2002 2003 2004 2005 2006 2007 2008 2009 2010
Source: Quantec EasyData.
14
From Eastern Cape Province, Amatole district municipality is the only municipality which recorded exports in 2002 and diminished for the other years.

Figure 15: Value of pork exports from Free State Province
0
200,000
400,000
600,000
800,000
1,000,000
1,200,000
1,400,000
Years
Ran
ds
Motheo 0 0 0 0 0 0 0 1,150,809 489,352 0
2001 2002 2003 2004 2005 2006 2007 2008 2009 2010
Source: Quantec EasyData. From Free State Province, Motheo district municipality recorded exports of pork during the period 2008 to 2009 only.
Figure 16: Value of pork exports from KwaZulu-Natal Province
0
500
1,000
1,500
2,000
2,500
3,000
3,500
4,000
Years
Thou
sand
Ran
ds
Ugu 1,139 1,475 0 0 6 0 0 0 0 652
eThekwini 798 2,702 1,201 576 475 2,790 2,234 952 3,504 2,508
2001 2002 2003 2004 2005 2006 2007 2008 2009 2010
Source: Quantec EasyData.
15
From Figure 15, exports for pork occurred mainly in eThekwini and Ugu district municipalities. eThekwini district municipality dominated the trend with the highest values in 2002, 2006 and 2009. This is due to the fact that eThekwini district is the main exit point in KwaZulu–Natal Province. Ugu district municipality recorded fractional exports of pork.

Figure 17: Value of pork export from North West Province
0
200,000
400,000
600,000
800,000
1,000,000
1,200,000
1,400,000
Years
Ran
ds
Southern 0 0 0 0 0 0 0 0 1,298,033 3,576
2001 2002 2003 2004 2005 2006 2007 2008 2009 2010
Source: Quantec EasyData. From North West Province, Southern district municipality recorded exports for pork only in 2009 and 2010.
Figure 18: Value of pork exports from Gauteng Province
0
5,000
10,000
15,000
20,000
25,000
Years
Thou
sand
Ran
ds
Sedibeng 939 2,917 827 0 0 915 2,687 7,223 23,035 10,634
West Rand 374 342 0 20 0 0 0 23 1,186 2,098
Ekurhuleni 1,384 956 897 1,209 2,578 1,245 891 3,644 1,738 2,856
City of Johannesburg 1,294 2,504 3,339 1,470 6,477 4,608 4,141 9,444 6,696 4,315
City of Tshwane 825 1,372 0 578 50 0 1,474 768 348 664
2001 2002 2003 2004 2005 2006 2007 2008 2009 2010
Source: Quantec EasyData. From Gauteng Province, pork exports occurred mainly in City of Johannesburg and Ekurhuleni district municipalities. City of Johannesburg dominated the trend but experiences low exports from 2001 to 2004. It recorded the highest exporter during the periods 2003 to 2008. This is due to the fact that City of Johannesburg is the main exit point to neighbouring countries of South Africa.
16

Sedibeng broke the record in 2009 with an export value of R 23 million and decreased to R 10 million in 2010. City of Tshwane, West Rand and Sedibeng recorded intermittent exports of pork.
Figure 19: Value of pork exports from Mpumalanga Province
0
50,000
100,000
150,000
200,000
250,000
300,000
350,000
Years
Ran
ds
Gert Sibande 0 0 0 0 0 0 0 0 126,831 0
Nkangala 0 0 0 0 0 0 0 0 0 189,700
Ehlanzeni 95,230 6,071 320,580 18,882 2,285 0 257 0 13,863 270,504
2001 2002 2003 2004 2005 2006 2007 2008 2009 2010
Source: Quantec EasyData. Figure 18 shows that, pork exports in Mpumalanga Province all district participated in the export market of pork. All districts recorded fractional exports but Ehlanzeni dominated the export market. Gert Sibande and Nkangala district municipalities recorded exports in 2009 and 2010 respectively. The highest exports value recorded from Ehlanzeni district were in 2001 to 2004, 2006 and 2010. Gert Sibande was the highest in 2009 and Nkangala was the second highest in 2010.
Figure 20: Value of pork exports from Limpopo Province
0
500
1,000
1,500
2,000
2,500
Years
Ran
ds
Vhembe 0 0 0 0 0 0 0 0 0 2,073
2001 2002 2003 2004 2005 2006 2007 2008 2009 2010
Source: Quantec EasyData.
17
Vhembe district municipality from Limpopo Province, recorded small exports of pork during 2010 only.

2.2.2. Share Analysis. Table 1: Share of provincial pork exports to the total RSA pork exports (%). Years Province
2001 2002 2003 2004 2005 2006 2007 2008 2009 2010
Western Cape 15.67 23.89 33.34 49.01 20.66 15.93 41.61 33.44 27.34 39.23 Eastern Cape 0.00 0.02 0.00 0.00 0.00 0.00 0.00 0.00 0.00 0.00 Free State 0.00 0.00 0.00 0.00 0.00 0.00 0.00 3.30 0.93 0.00 KwaZulu-Natal 23.85 25.89 12.16 7.59 3.98 24.54 11.41 2.73 6.62 7.94 North West 0.00 0.00 0.00 0.00 0.00 0.00 0.00 0.00 2.45 0.01 Gauteng 59.31 50.16 51.25 43.16 75.33 59.53 46.97 60.53 62.39 51.66 Mpumalanga 1.17 0.04 3.24 0.25 0.02 0.00 0.00 0.00 0.27 1.16 Limpopo 0.00 0.00 0.00 0.00 0.00 0.00 0.00 0.00 0.00 0.01 Total 100 100 100 100 100 100 100 100 100 100 Source: Calculated from Quantec EasyData. Table 1 indicates that Gauteng province commanded the greatest share in the export of pork followed by Western Cape and KwaZulu–Natal provinces. This is mainly due to the fact that these provinces are the main exit points for pork. Fractional exports for pork were recorded in Eastern Cape, Free State, North West, Mpumalanga and Limpopo provinces. Table 2: Share of district pork exports to the total Western Cape provincial pork exports (%). Years District
2001 2002 2003 2004 2005 2006 2007 2008 2009 2010
City of Cape Town 100 100 100 100 100 100 100 100 100 99.85 Cape Winelands 0 0 0 0 0 0 0 0 0 0.15 Total 100 100 100 100 100 100 100 100 100 1000 Source: Calculated from Quantec EasyData. From Table 2, City of Cape Town Metropolitan municipality commanded 100% share in the export for pork from 2001 to 2009. This may be due to the fact that City of Cape Town is the main exit point for meat in the province. Cape Winelands recorded small exports value during 2010. Table 3: Share of district pork exports to the total Eastern Cape provincial pork exports (%). Years District
2001 2002 2003 2004 2005 2006 2007 2008 2009 2010
Amatole 0 100 0 0 0 0 0 0 0 0 Total 0.00 100 0.00 0.00 0.00 0.00 0.00 0.00 0.00 0.00 Source: Calculated from Quantec EasyData. In the Eastern Cape Province exports for pork occurred only in 2002 from Amatole district municipality.
18

Table 4: Share of district pork exports to the total Free State provincial pork exports (%). Years District
2001 2002 2003 2004 2005 2006 2007 2008 2009 2010
Motheo 0 0 0 0 0 0 0 100 100 0 Total 0 0 0 0 0 0 0 100 100 0 Source: Calculated from Quantec EasyData. Motheo district municipality commanded 100% share of pork exports value in 2008 and 2009. There were no exports records during other years. Table 5: Share of district pork exports to the total KwaZulu–Natal provincial pork exports (%). Years District
2001 2002 2002 2004 2005 2006 2007 2008 2009 2010
Ugu 58.83 35.31 0.00 0.00 1.34 0.00 0.00 0.00 0.00 20.63 eThekwini 41.17 64.69 100 100 98.66 100 100 100 100 79.37 Total 100 100 100 100 100 100 100 100 100 100 Source: Calculated from Quantec EasyData. In KwaZulu–Natal Province, eThekwini metropolitan municipality commanded the greatest share of exports of pork from 2002 to 2010. Intermittent exports were recorded from Ugu district municipality. Table 6: Share of district pork exports to the total North West provincial pork exports (%). Years District
2001 2002 2003 2004 2005 2006 2007 2008 2009 2010
Southern 0 0 0 0 0 0 0 0 100 100 Total 0 0 0 0 0 0 0 0 100 100 Source: Calculated from Quantec EasyData. In North West Province, Southern district municipality commanded the greatest share of exports of pork only in 2009 and 2010. Table 7: Share of district pork exports to the total Gauteng provincial pork exports (%). Years District
2001 2002 2003 2004 2005 2006 2007 2008 2009 2010
Sedibeng 19.50 36.05 16.33 0.00 0.00 13.52 29.23 34.23 69.80 51.70 West Rand 7.76 4.22 0.00 0.61 0.00 0.00 0.00 0.11 3.59 10.20 Ekurhuleni 28.74 11.82 17.72 36.90 28.31 18.39 9.69 17.27 5.27 13.89 City of Johannesburg 26.87 30.95 65.95 44.86 71.13 68.08 45.04 44.76 20.29 20.98 City of Tshwane 17.13 16.96 0.00 17.63 0.55 0.00 16.04 3.64 1.05 3.23 Total 100 100 100 100 100 100 100 100 100 100 Source: Calculated from Quantec EasyData.
19

Table 7 indicates that City of Johannesburg metropolitan municipality commanded the greatest share in the export of pork followed by Ekurhuleni metropolitan municipality. Intermittent exports of pork were recorded in Sedibeng, West Rand and City of Tshwane district municipalities. Table 8: Share of district pork exports to the total Mpumalanga provincial pork exports (%). Years District
2001 2002 2003 2004 2005 2006 2007 2008 2009 2010
Gert Sibande 0 0 0 0 0 0 0 0 90.15 0 Nkangala 0 0 0 0 0 0 0 0 0 41.22 Ehlanzeni 100 100 100 100 100 0 100 0 9.85 58.78 Total 100 100 100 100 100 100 0 100 0 100 Source: Calculated from Quantec EasyData. From Mpumalanga province, Ehlanzeni district municipality commanded 100% share of the export of pork during the periods 2001 to 2005, and 2007. In 2009 Gert Sibande district municipality commanded the greatest share (90%) and Ehlanzeni district municipality had the greatest share (59%) in 2010. Table 9: Share of district pork exports to the total Limpopo provincial pork exports (%). Years District
2001 2002 2003 2004 2005 2006 2007 2008 2009 2010
Vhembe 0 0 0 0 0 0 0 100 100 0 Total 0 0 0 0 0 0 0 100 100 0 Source: Calculated from Quantec EasyData. Vhembe district municipality is the only municipality in Limpopo Province which participated on pork exports and commanded the greatest share in 2009 and 2010.
2.2.3. Imports. South Africa imported approximately 26 million kilograms of pork in 2010 at an estimated value of R 427 million. Figure 26 below show the imports of pork from 20001 to 2010. .
20

Figure 21: Pork imports
0
5
10
15
20
25
30
2001
2002
2003
2004
2005
2006
2007
2008
2009
2010
Years
Mill
ion
Kilo
gram
s
050100150200250300350400450
Mill
ion
Ran
ds
Import Quantities Import Values
Source: Quantec EasyData. Figure 21 shows that from 2001 to 2002 pork exports value were almost stable and in 2003 imports of pork increased substantially in both value and quantity to a peak level in 2005. From 2006 imports fluctuated and declined in 2008 before increasing again in 2009. Generally imports of pork to South Africa were high during the period under review..
Figure 22: Pork imports from European Union
0
2,000
4,000
6,000
8,000
10,000
12,000
2001
2002
2003
2004
2005
2006
2007
2008
2009
2010
Years
Thou
sand
Kilo
gram
s
Belgium Germany Denmark SpainFrance United Kingdom Hungary IrelandItaly Netherlands
Source: Quantec EasyData.
21

Imports for pork in South Africa during the past decade were dominated by France, which remained on the first level from 2001 to 2008. Belgium was the second supplier from 2001 to 2005 and countries like Denmark, Germany and Spain increased their supply for pork significantly from 2006 to 2010.
Figure 23: Pork imports from America
0
4,000
8,000
12,000
16,000
20,000
2001
2002
2003
2004
2005
2006
2007
2008
2009
2010
Years
Thou
sand
Kilo
gram
s
Brazil Canada Chile United States
Source: Quantec EasyData. It is clearly indicated from figure 23 above that Brazil and Canada commanded the highest share of pork imports during the period under Analysis. Brazil commanded the highest shares during the periods 2001, 2003 to 2005 while Canada commanded the highest during the periods 2006 to 2010. Intermittent imports of pork were recorded from Chile and United States.
22

Figure 24: Countries of origin for pork imports in 2010
Belgium6%
Canada23%
Germany45%
Spain8%
France12%
Ireland6%
Source: Quantec EasyData. Figure 24 above indicates that in 2010, Germany commanded the greatest shares of pork imports to South Africa accounting for 45% followed by Canada which obtained 23% and France by 12%.
3. MARKETING CHANNELS / VALUE CHAIN. The value chain starts at primary producer. The pigs are slaughtered at abattoirs. The meat is sold to the butcheries/wholesalers/retailers/processors. The meat can be bought by consumers directly from abattoirs and/or butcheries and/or wholesalers and/or retailers. In some cases the consumer buys live pig and perform abattoir and processing activities him-/herself.
23

Figure 25: Pork Marketing Channels
24
Primary Producers – Farmers
Abattoirs
Wholesalers
Retailers Butcheries
Processors
Imports
CONSUMERS
Exports

4. OPPORUNITIES AND CHALLENGES. Table 10: Opportunities and Challenges OPPORTUNITIES CHALLENGES
Important supplier of quality protein for human health
Very susceptible to world conditions and cheap imports
Industry with tremendous Growth Potential Stiff competition both nationally and internationally
Pro-active in addressing consumer requirements and doing promotions
Health and safety issues
Dedicated social development training programme
Phytosanitary issues
Outbreak of diseases such as swine fever
5. STRENGTHS AND WEAKNESSES.
Strengths.
- The turnaround production time is quicker than red meat production. It is becoming a meat of choice. - Piggeries can be established in relatively small areas. - Feed costs are much lower than other meat production costs. - The demand for pork meat has increased significantly over the years due to the high prices and
unavailability of red meat substitutes.
Weaknesses.
- The industry is susceptible to diseases. Health, safety and phyto-sanitary issues can be inhibitive in terms of growth.
- Shortage of water could affect the cleaning of pens and this could be a challenge in terms of meeting the safety requirements.
- It is more labor intensive than the red meat industry.
25

6. MARKET INTELLIGENCE.
6.1. Export tariffs. Tariffs that different importing countries applied to pork originating from South Africa in 2010 are shown on Table 11. Table 11: Pork export tariffs
2010
Country Product Code Trade regime description.
Applied tariffs
Total ad valorem equivalent tariff (estimated)
Angola & Democratic Republic of Congo
02031100 (Fresh or chilled carcasses and half carcasses of swine) 02032200 (Frozen hams, hams and shoulder cuts thereof of swine, boneless)
MFN Applied MFN Applied
10.00%
10.00%
10.00%
10.00%
Mauritius
02031100 (Fresh or chilled carcasses and half carcasses of swine) 02032200 (Frozen hams, hams and shoulder cuts thereof of swine, boneless)
MFN Applied MFN Applied
0.00%
0.00%
0.00%
0.00%
Mozambique
02031190 (Fresh or chilled carcasses and half carcasses of swine: Outros) 02032200 (Frozen hams, hams and shoulder cuts thereof of swine, boneless)
Preferential tariff for SA Preferential tariff for SA
15.00%
15.00%
15.00%
15.00%
Zimbabwe
0203110000 (Fresh or chilled carcasses and half carcasses of swine) 02032200 (Frozen hams, hams and shoulder cuts thereof of swine, boneless)
MFN Applied MFN Applied
40.00%
40.00%
40.00%
40.00%
Source: Market Access Map.
26
Table 11 indicates that in 2010 South Africa received preferential tariff rate of 15% for pork exports in Mozambique. Mauritius applied the lowest MFN tariff of 0.00%, While Angola and Democratic Republic of

27
Congo (DRC) applied a tariff rate of 10.00%. Zimbabwe applied the highest MFN tariff rates of 40% to pork originating from South Africa.
6.2. Import tariffs. Tariffs that South Africa applied to imports of pork originating from all possible countries in 2010 are shown on Table 12. Table 12: Pork import tariffs
2010 Country Product Code Trade regime description Applied tariffs Total ad valorem
equivalent tariff (estimated)
EU and NAFTA Countries (Belgium,
Canada, France, Germany,
Ireland, Spain, Denmark)
02031100 (Fresh or chilled carcasses and half carcasses of swine) 02031200 (Fresh or chilled hams, shoulders and cuts thereof of swine) 02031910 (Fresh or chilled meat of swine: Rib) 02032100 (Frozen carcasses and half carcasses of swine) 02032200 (Frozen hams, shoulders and cuts thereof of swine) 02032910 (Frozen meat of swine: Rib)
MFN Applied MFN Applied MFN Applied MFN Applied MFN Applied MFN Applied
15.00% or 170.31/Ton whichever is the greater 15.00% or 170.31/Ton whichever is the greater 15.00% or 170.31/Ton whichever is the greater 15.00% or 170.31/Ton whichever is the greater 15.00% or 170.31/Ton whichever is the greater 15.00% or 170.31/Ton whichever is the greater
15.00%
15.00%
0.00%
15.00%
15.00%
0.00%
Source: Market Access Map. Table 12 shows that South Africa applied the same MFN tariff rates to all exporting countries. During 2010 the top exporting countries of pork to South Africa were Belgium, Canada, France, Germany, Ireland, Denmark and Spain. South Africa applied the MFN tariff of 15% to fresh & frozen carcasses and half carcasses of pork and to fresh & frozen hams, shoulders and cuts of pork It applied 0.00% MFN tariff rate on fresh & frozen pork ribs in 2010.

7. PERFORMANCE ANALYSISOF SOUTH AFRICAN PORK INDUSTRY IN 2010.
7.1. Exports. Table 13: List of importing markets for the Pork, fresh, chilled or frozen exported by South Africa in 2010 South Africa’s exports represent 0.02% of world exports for this Pork, fresh, chilled or frozen, its ranking in world exports is 33.
Trade Indicators
Importers Exported
value 2010 (USD
thousand)
Trade balance
2010 (USD
thousand)
Share in South
Africa's exports
(%)
Exported quantity
2010 Quantity
unit Unit value (USD/unit)
Exported growth in
value between
2006-2010 (%, p.a.)
Exported growth in quantity between
2006-2010 (%, p.a.)
Exported growth in
value between
2009-2010 (%, p.a.)
Ranking of partner
countries in world imports
Share of partner
countries in world
imports (%)
Total import growth in value of partner
countries between
2006-2010 (%, p.a.)
Tariff (estimated)
faced by South
Africa (%)
World 5623 -52829 100 1497 Tons 3756 33 30 -11 100 6 Mauritius 1706 1706 30.3 437 Tons 3904 85 78 13 90 0 88 0 Ship stores and bunkers 1118 1118 19.9 258 Tons 4333 2 -4 -30 88 0 15 Zimbabwe 648 648 11.5 211 Tons 3071 499 -62 116 0 259 40 Mozambique 553 553 9.8 179 Tons 3089 54 66 69 157 0 23 14.9 Democratic Republic of the Congo 413 413 7.3 159 Tons 2597 74 63 -35 60 0.1 38 10 Angola 365 365 6.5 112 Tons 3259 4 6 335 38 0.3 30 10 United Arab Emirates 186 186 3.3 21 Tons 8857 65 49 221 56 0.1 11 5 Nigeria 178 178 3.2 26 Tons 6846 37 42 -30 20 Portugal 106 92 1.9 21 Tons 5048 20 1.3 1 0 Saint Helena 71 71 1.3 20 Tons 3550 24 19 97 151 0 25 Ghana 63 63 1.1 9 Tons 7000 119 530 113 0 -14 20
28
Source: ITC calculations based on COMTRADE statistics.

Table 13 shows that during 2010 South Africa exported a total of 1 497 tons of pork (fresh, chilled or frozen) at an average value of US$ 3 756/unit. The major export destinations for pork (fresh, chilled or frozen) originating from South Africa during 2010 were Mauritius and Zimbabwe. The greatest share of South African pork (fresh, chilled or frozen) exports were exported to Mauritius which commanded 30.3% followed by Zimbabwe which commanded 11.5%. South Africa’s pork (fresh, chilled or frozen) exports increased by 30% in value and decreased by 11% in quantity between the periods 2006 and 2010. During the same period, exports of pork (fresh, chilled or frozen) to Mauritius increased by 78% in value and 13% in quantity. Between the period 2009 and 2010, exports of pork (fresh, chilled or frozen) to Mauritius increased by 90% while those to Zimbabwe increased by 116% in value.
29

30

The chart illustrates that between 2006 and 2010; South Africa’s pork (fresh, chilled or frozen) exports to Angola, Malawi, Seychelles, Saint Helena, United Republic of Tanzania, Mauritius and Zambia were growing at a rate that is less than their import growth from the rest of the world. Malawi and Seychelles experiences losses in their annual export growth while other countries experienced gains in the dynamic market of South Africa pork (fresh, chilled or frozen) exports. At the same time, South Africa’s pork (fresh, chilled or frozen) exports to United Arab Emirates (UAE), Democratic Republic of Congo (DRC), Ghana, Mozambique and Zimbabwe were growing at a rate that is greater than their imports from the rest of the world. United Arab Emirates, Mauritius, Democratic Republic of Congo and Zimbabwe represent gains in dynamic market. Ghana represents losses in the declining market of South Africa pork (fresh, chilled or frozen) exports. Countries which experienced the most growing demand of pork are Zimbabwe and Ghana with the annual export growth from South Africa of 499% and 119% respectively.
31

32

The chart shows the prospects for market diversification for pork (fresh, chilled or frozen) exports by South Africa in 2010. The analysis on the figure above shows that Mauritius (30.34%) commanded the greatest shares of South Africa’s pork (fresh, chilled or frozen) exports during the year 2010, followed by Zimbabwe (11.52%).
33
If South Africa is to diversify its pork (fresh, chilled or frozen) exports, the biggest market exists in Portugal as this country commanded the greatest shares of world pork (fresh, chilled or frozen) imports of 1.3% but its import growth is very minimal at 1% rate per annum. The fastest growing market exists in Zimbabwe with the annual import growth of 259%. This makes Zimbabwe to be the biggest prospective market for South African pork exports.

7.2. Imports. Table 14: List of supplying markets for the Pork (fresh, chilled or frozen) imported by South Africa in 2010 South Africa’s imports represent 0.23% of world imports for this Pork (fresh, chilled or frozen) its ranking in world imports is 41.
Trade Indicators
Exporters Imported
value 2010 (USD
thousand)
Trade balance
2010 (USD
thousand)
Share in
South Africa's imports
(%)
Imported quantity
2010 Quantity
unit Unit value (USD/unit)
Imported growth in value between
2006-2010 (%,
p.a.)
Imported growth
in quantity between
2006-2010 (%,
p.a.)
Imported growth in value between
2009-2010 (%,
p.a.)
Ranking of
partner countries in world exports
Share of partner
countries in world exports
(%)
Total export
growth in value of partner
countries between
2006-2010 (%,
p.a.)
Tariff (estimated) applied by
South Africa (%)
World 58452 -52829 100 26106 Tons 2239 8 7 23 100 6 Germany 25386 -25386 43.4 11058 Tons 2296 509 473 167 1 16.3 15 13 Canada 10996 -10996 18.8 5842 Tons 1882 10 13 -45 5 9 4 13 France 7877 -7877 13.5 3013 Tons 2614 -15 -19 -17 9 4.3 1 13 Spain 5314 -5314 9.1 1985 Tons 2677 -2 1 89 4 9.3 12 13 Ireland 3417 -3417 5.8 1541 Tons 2217 30 18 126 16 1 0 13 Belgium 2682 -2682 4.6 1423 Tons 1885 -4 -6 66 7 6.3 4 13 Denmark 2012 -2012 3.4 889 Tons 2263 -26 -31 55 3 12.6 -2 13 Hungary 232 -232 0.4 99 Tons 2343 -61 -37 12 1.7 12 13 Iran (Islamic Republic of) 216 -216 0.4 99 Tons 2182 260 58 0 7 13
34
Source: ITC calculations based on COMTRADE statistics.

Table 14 shows that during 2010 South Africa imported a total of 26 106 tons of pork (fresh, chilled or frozen) at an average value of US$ 2 239/unit. The major origins for pork (fresh, chilled or frozen) imported by South Africa during 2010 were Germany, Canada and France. The greatest share of South African pork (fresh, chilled or frozen) imports were from Germany which commanded 43.4% followed by Canada which commanded 18.8% and France commanded 13.5%. These three countries constitute 76% of South African pork imports. South Africa’s pork (fresh, chilled or frozen) imports increased by 8% in value and 7% in quantity between the periods 2006 and 2010. During the same period, imports for pork (fresh, chilled or frozen) from Germany increased by 509% in value and 473% in quantity; and imports from Canada also increased by 10% in value and 13% in quantity. Between the period 2009 and 2010, South Africa’s imports of pork (fresh, chilled or frozen) increased by 23% in value. During the same period, imports of pork (fresh, chilled or frozen) from Germany increased by 167% while those from Canada decreased by 45% in value.
35

36
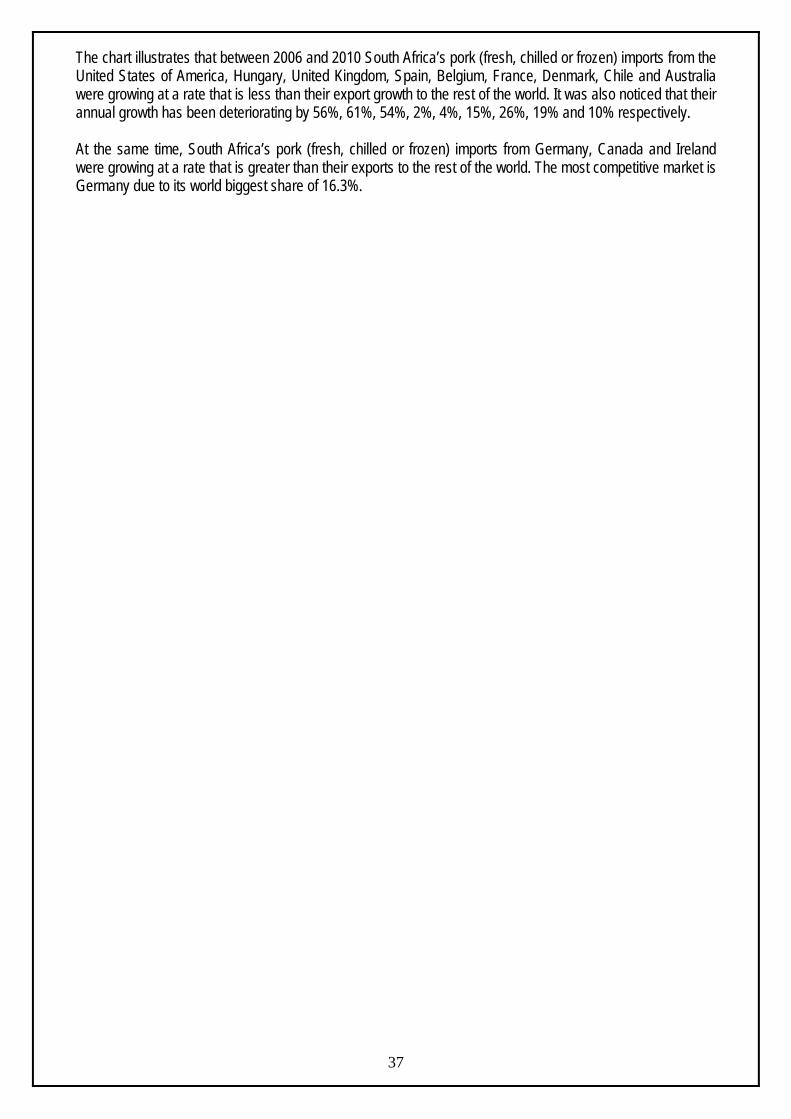
The chart illustrates that between 2006 and 2010 South Africa’s pork (fresh, chilled or frozen) imports from the United States of America, Hungary, United Kingdom, Spain, Belgium, France, Denmark, Chile and Australia were growing at a rate that is less than their export growth to the rest of the world. It was also noticed that their annual growth has been deteriorating by 56%, 61%, 54%, 2%, 4%, 15%, 26%, 19% and 10% respectively. At the same time, South Africa’s pork (fresh, chilled or frozen) imports from Germany, Canada and Ireland were growing at a rate that is greater than their exports to the rest of the world. The most competitive market is Germany due to its world biggest share of 16.3%.
37

38

The chart shows the prospects for diversification of suppliers for pork (fresh, chilled or frozen) imports by South Africa in 2010. The analysis shows that Canada and Germany commanded the greatest shares of South Africa’s pork (fresh, chilled or frozen) imports during the year 2010. Germany is the biggest supplier of pork (fresh, chilled or frozen) with a share of 43.43% of South African import market. If South Africa is to diversify its pork (fresh, chilled or frozen) imports, the most growing supplier exist in Porgugal. Its annual export growth is at 54% and the biggest market exists in United States of America. It has a world share of 14.2% but its annual export growth is restrictive (12%). These countries has minimal shares to South Africa’s import market, therefore they are the biggest prospective suppliers of South African pork.
39

40
8. ACKNOWLEDGEMENTS. The following organizations are acknowledged:
• Directorate: Statistics and Economic Analysis. www.daff.gov.za
• Quantec Easydata www.quantec.co.za
• ITC Market Access Map http://www.macmap.org/SouthAfrica
• ITC Trade Map http://www.trademap.org.
Disclaimer: This document and its contents have been compiled by the Department of Agriculture, Forestry and Fisheries for the purpose of detailing the Pork value chain. Anyone who uses the information as contained in this document does so at his/her own risk. The views expressed in this document are those of the Department of Agriculture, Forestry and Fisheries with regard to the industry, unless otherwise stated. The Department of Agriculture, Forestry and Fisheries therefore accepts no liability that can be incurred resulting from the use of this information.