portable monitoring / diagnostic system based on the...
TRANSCRIPT

International Journal of Computer Applications (0975 – 8887)
Volume 101– No.2, September 2014
1
Portable Monitoring / Diagnostic System based on the
Combining of Real Time WSN with GSM and Internet
Samir Jasim Mohammed
Electrical Engineering Dep. Babylon University
Hilla, Iraq
Mahmoud Shaker Nasr Electrical Engineering Dep.
Babylon University Hilla, Iraq
Ali Jasim Ramadhan Electrical Engineering Dep.
Babylon University Hilla, Iraq
ABSTRACT
The development of the healthcare systems, by combining E-
health, I-health and GSM-health together, recently became the
focus of attention of researchers. In this research, will develop
our research that practically designed in the name of "Real
Time Portable Health Care PP, GSR, BG, EMG with Alarm
System Based on WSN" to assist in the development of the
health situation in the hospitals. The system develops by
supporting GSM and Internet together in the wireless sensor
network (WSN) under ZigBee protocol and by supporting the
printing of medical reports. Where the implemented system
measures the biomedical data utilizing a group of biomedical
sensors, which are patient position sensor (PPS), galvanic skin
response sensor (GSR), blood glucose sensor (BGS) and
electromyography sensor (EMG).
The System monitors the sleep position and skin conductance
(indicator to patient's calm) of the patients in real time with
alarm for each abnormal case in the base station (BS) and
lobbies, and sends SMS alarm to doctor's phone, and it
follows-up patient's glucose rate and diagnosis the patient's
electromyography status. Moreover, it sends the glucose data
to doctor's phone and uploads it to the special web site by
using the GSM and Internet technologies. In addition, it
introduces a printed hard copy medical report. Moreover, the
system stores the patient information and his health data in
order to use it for any archiving process or statistical study.
In the achievement system, three nodes are considered
according to the facilities available but it stays monitor /
diagnosis for an open node number. The system is
implemented practically and applied for some persons under
supervision of the specialist physicians, and the results
obtained are very satisfied and present a great service to
human care. All obtained results are presented in this paper.
Keywords
E-health, I-health, GSM-health, WSN, ZigBee, PPS, GSR,
BGS, EMG.
1. INTRODUCTION A monitoring / diagnosing system uses wireless technology to
send physiological data from the patient's body to the BS in
real time. Where, the patients can wear sensing devices that
sense physiological conditions and send it to their doctors in
real time and can be used GSM and Internet to allow the
doctors monitoring / diagnosing the patients' status remotely.
Due to their flexibility, low power and low cost
characteristics, the WSNs are used in health care [1]. By using
the wireless sensor network (WSN) technology, can deal with
group of biomedical sensors for each one of group of patients
[2]. The wireless sensor networks are consisted by small
electronic devices called nodes, and the functions of them to
sense, transmit and receive a specific signal that is picked up
by the specific sensor that is selected by depending on the
sensing environment [3]. The WSN connects all these nodes
and it may contain 1000's of nodes. Such systems can make
changes in the way we live and work in the near future [4]. By
combining WSN and GSM technologies, they will provide
valuable real time information enabling the doctors to monitor
and analyze a patient's current and previous state of health [5].
Today, the combining of WSN and Internet technologies can
integrate healthcare systems to add more important services
such as diagnosis and monitoring in remote area [6].
In the presented paper, introduces the designed portable real
time wireless medical system for monitoring / diagnosing the
patients' status based on E-health / GSM-health / I-health and
WSN under ZigBee protocol. Where, it is implemented
practically and applied for some persons under supervision of
the specialist medical physician, and the results obtained are
very satisfied and present a great service to human care.
2. OVERALL SYSTEM DESCRIPTION The main goal of the system is for monitoring / diagnostic
patient's sleep position, skin conductance, blood glucose and
electromyography based on real time ZigBee-WSN, GSM,
Internet, alarming and printing report subsystems. Where it
has ability to send SMS alarm in the abnormal case of sleep
position and skin conductance, and sends notification about
blood glucose to doctors' phone by using GSM technology,
and the doctor can follow-up the patient's blood glucose rate
remotely by using Internet technology. The proposed system
based on wireless sensor network (WSN) that collect the
sensing data from the patients nodes and send it wirelessly to
monitoring / diagnostic system in the base station (BS), which
enables the person responsible (doctor) to monitor / diagnostic
the patients remotely.
In the presented system, three nodes (lobbies) are considered
according to the facilities available but it stays monitor /
diagnosis for unlimited patient numbers. The overall proposed
system. Where, the main parts of the proposed system are
Sensing & Data Transceiver, Base Station (BS), GSM and
Internet Subsystems (see Figure 1).

International Journal of Computer Applications (0975 – 8887)
Volume 101– No.2, September 2014
2
Fig. 1. The overall proposed system
2.1 Sensing & Data Transceiver Subsystems
Each patient is represented by a node, which consists of the
required sensors, processor, transceiver and power supply.
2.1.1 Biomedical Sensors Subsystem
The patient node has four sensors, which are patient position
sensor (PPS), galvanic skin response sensor (GSR), blood
glucose sensor (BGS) and electromyography sensor (EMG).
The measurement process for these sensors is explained in
following:
I. Patient Position Measurement
A position sensor is a device that measures the position. It can
be either an absolute position sensor or a relative one
accelerometer or displacement [7]. Where the accelerometer
converts the acceleration from motion or gravity to either
analog or digital signals [8]. Digital, capacitive, 3.3v, ±2g and
3-axis accelerometer is selected as sensor sleep position. The
offset axis is (3.3v / 2g) = 1.65, where if an axis voltage is
above 1.65 it considered positive and other case negative. The
acceleration is packed with DSP function that detect the five
sleep positions. The blocks diagram of it are shown in Figure
(2). Where the voltage of each axis is calculated and
compared between them to calculate the larger axis voltage
that assumed as 1g in DSP function while the others are 0g.
Fig. 2. Accelerometer blocks diagram
The sensing axis will send to the MCU (Pin A4) through I²C
and the MCU programmed to display the real position (see
Table 1). The method for setting the position sensor is shown
in Figure (3).
Table 1 Detection of Sleep Positions
X, Y, Z 0, 1, 0 -1, 0, 0 1, 0, 0 0, -1, 0 0, 0, 1
DSP 1 2 3 4 5
MCU Supine Left Right Prone Stand-Sit
Fig. 3. Setup of position sensor
II. Galvanic Skin Response Measurement
The GSR is one of many electro dermal responses that is a
medical term for changes in skin conductance due to a
psychological condition [9]. The normal skin conductance is
between 2μ Siemens to 10μSiemens [10]. The GSR provides
a measure of skin conductance by attaching two electrodes on
the top of the index and middle fingers and the blocks
diagram of its measurement are shown in Figure (4). Because
of the voltage resulting is high impedance, it is important to
buffer the signal by using the two op-Amp MCP6002. Then, it
is passed through the difference Amp. TI INA114 to calculate
the difference electrode voltage and then filtered to remove
any high frequency noise, where the GSR is a low frequency
(1 - 2Hz) signal. The output signal will feed to the MCU
through the pin (A2) and the MCU will read it and calculate
the skin conductance value.
Fig. 4. GSR blocks diagram
The method of setting the GSR sensor is shown in Figure (5).
Fig. 5. Setup of GSR sensor
III. Blood Glucose Measurement
The glucose is a carbohydrate, which is a source of energy for
the human body. Insulin and glucagon are hormones released
by the pancreas that have opposite effects on human body
[11]. The glucose meter in this work is based on
electrochemical test strips. Where it is implemented by using
PIC16LF178X device and its blocks diagram are shown in
Internet Subsystem
GSM Subsystem Sensing & Data
Transceiver Subsystems
Base Station
Subsystem
PPS
GSR
BGS
EMG

International Journal of Computer Applications (0975 – 8887)
Volume 101– No.2, September 2014
3
Figure (6). Where test strip consists of reference electrode and
working electrode [12].
Fig. 6. Blocks diagram of glucose measurement
The measured current will feed to current to voltage
conversion and filter from above 8 Hz signals, and then feed
to 12-bit ADC. The glucometer starts capturing glucose
voltage at ADC channel, store data in EEPROM and display it
on the LCD after less than 7 seconds of placing the blood
sample as shown in Figure (7). The power to glucose meter
demo board can be supplied from on board lithium battery
(3V CR2032).
Fig. 7. Measuring blood glucose
IV. Electromyography Measurement
Electromyography is the process of recording and analyzing
myoelectric signals that formed by physiological changes in
muscle fiber membranes [13]. The blocks diagram of EMG
measurement are shown in Figure (8). A surface, gelled,
passive electrode and difference op-amp. AD8221 are used
for picking up the EMG signals. The band-pass filter (BPF) of
10 to 500 Hz is used to remove the heartbeats. After rectifying
(HWR) and integrating the signal, it will feed to the MCU
(pin A0) to calculate the EMG values.
Fig. 8. Blocks diagram of EMG measurement
Where the signal can range from 0 to 1.5 mV (RMS) and from
30 to 300 Hz [14]. The method for setting the EMG sensor is
shown in Figure (9).
Fig. 9. Setup of EMG sensor
2.1.2 Processor (MCU) Subsystem
The MCU ATmega328 is used in this work, and the Arduino
platform is selected which contains ATmega328 that is open
source and easy to use hardware and software.
2.1.3 Transceiver Subsystem
In this work, XBee Series 2 module transceiver is used to
connect the patients nodes with BS, where it configured by
using X-CTU program. These XBees (in patients nodes)
configured as End-Devices firmware by using AT command
mode. Because of the ZigBee protocol is supported star,
cluster tree and mesh network topologies, so selected star
topology because it is easy to synchronize, low power and
very low delay.
2.1.4. Power Subsystem
A rechargeable battery is used in the each patient node.
Therefore, there is a limit time for node operation, and to
solve that, the MCU is power ON each sensor that responds
from BS to send its data and then power off it, and used the
(SLEEP_MODE_IDLE) that disable the unnecessary
functions of the MCU. The power consumption of the main
hardware components that used in this system are measured
(see Table 2).
Table 2 Power Consumption of Active and Sleep modes
Comp. MCU PPS GSR BGS EMG XBee
Active 15mA 165µ
A
0.5mA 0A External
0.7mA 40mA
Sleep 0.6mA 0A 0A 0A External
0A 10µA
2.2. Base Station (BS) Subsystem
The base station consists of the Gateway (GW), Computer
(PC) and Printing subsystems.
2.2.1. Gateway (GW) Subsystem
The GW goal is for sending or receiving data to or from the
patients' nodes and passing it to or from the PC in BS. It
consists of two components, which are XBee and its USB
explorer. The XBee in GW is programmed as a coordinator.
In this system, the MCU is programmed as five cases
structures to perform five operations in each node. Therefore,
the GW sends a special case number to the MCU to perform
the specified operation.
2.2.2. Computer (PC) Subsystem
The process of monitoring, analyzing and recording data are
done on the PC. In the implemented system, used LabVIEW
software (SW) to do these processing, because it has a
graphical user interface (GUI) window can handle data
quickly and easily interface with external hardware. The SW
uses serial connection as input and output data, which
interface with the XBee serial connections of the GW. In the
implemented SW, there are three operations implemented on
five GUI windows (see Table 3).
Table 3 GUI Windows Classification
Wind. Nodes
Status
Insertion
Information
PPS
&
GSR
BGS EMG
Oper. Searching Setup Sensing

International Journal of Computer Applications (0975 – 8887)
Volume 101– No.2, September 2014
4
2.2.2.1 Nodes Status GUI Window Operation
This operation detects the node status and performs the
searching for all nodes in the network and stores the active
nodes in a string for the usage by other operations.
2.2.2.2 Insertion & Update Patient's Information
GUI Window Operation
This operation is used to set up the main patient information
that's needed, which are doctor name, patient's name, patient's
gender, patient's age, patient's entry date and doctor's phone.
In the proposed system, the patient information is stored as a
Text file without needing to send it to the MCU and stored in
it, so reduce the system complexity, time delay, increase the
security of the personal data and eliminate of the case of loss
it when the node's battery be empty.
2.2.2.3. Sensing GUI Windows Operation
There are three GUI windows implemented to sense patient's
status and it classified into three operations, which are
monitoring sleep position and skin conductance, following up
blood glucose rate and diagnosing electromyography status.
These operations are the major operation that supported by
searching and set up operations.
2.2.3. Printing Subsystem
Many cases are needed to provide the patient by medical
report about his health status. Therefore, in addition to
analysis and display sensing data in a GUI window, added
ability to print medical reports by using VISUAL BASIC
(VB) software. In the proposed system, report about the
patient's blood glucose levels and electromyography status is
provided to the patient. The implemented program is saved as
exe. File and recall it from the SW. In the following,
explaining to the operation of printing report in BGS and
EMG GUI windows respectively. The Figure 10 shows the
main process of printing report in "BGS" window.
Fig. 10. BGS Printing Report Process
To understand how the print BGS report operation is done,
each process in Figure 10 will discuss in detail as follows:
• Click on "Print The Report" button.
• Call the main program that saved as .exe file.
• Locate saved data Text file that stored in PC at BGS
operation to read it.
• Save the data as a string.
• Locate the saved information Text file that stored in
PC at Setup operation to read it and add it to the
string data above.
• Splitting the data in the string by utilizing the
special characters.
• Display the data in the specified field and display it
graphically, and then print it.
The Figure 11 shows the main process of printing the report in
"EMG" window.
Fig. 11. EMG Printing Report Process
To understand how the print EMG report operation is done,
each process in Figure 11 will discuss in detail as follows:
Click on "Print The Report" button.
Call the main program that saved as .exe file.
Locate saved data Text file that stored in PC at
EMG operation to read it.
Save the data as a string.
Splitting the data in the string by utilizing the
special characters
Display the data graphically, and then print it.
2.3. GSM Subsystem
The GSM subsystem is used for remotely following-up by
sending SMS alarm for any abnormal case of patient's sleep
position and skin conductance, also sends glucose data to
doctor's phone, these services are performed by using personal
phone device only without using any additional GSM modem
or other apparatus, so this method reduces cost, complexity
and delay time of the system that's done by interfacing phone
with PC directly via USB and messages sending procedure
executed by using SMSs AT commands, so doctors be enable
to communicate with BS by using SMS or voice calling to
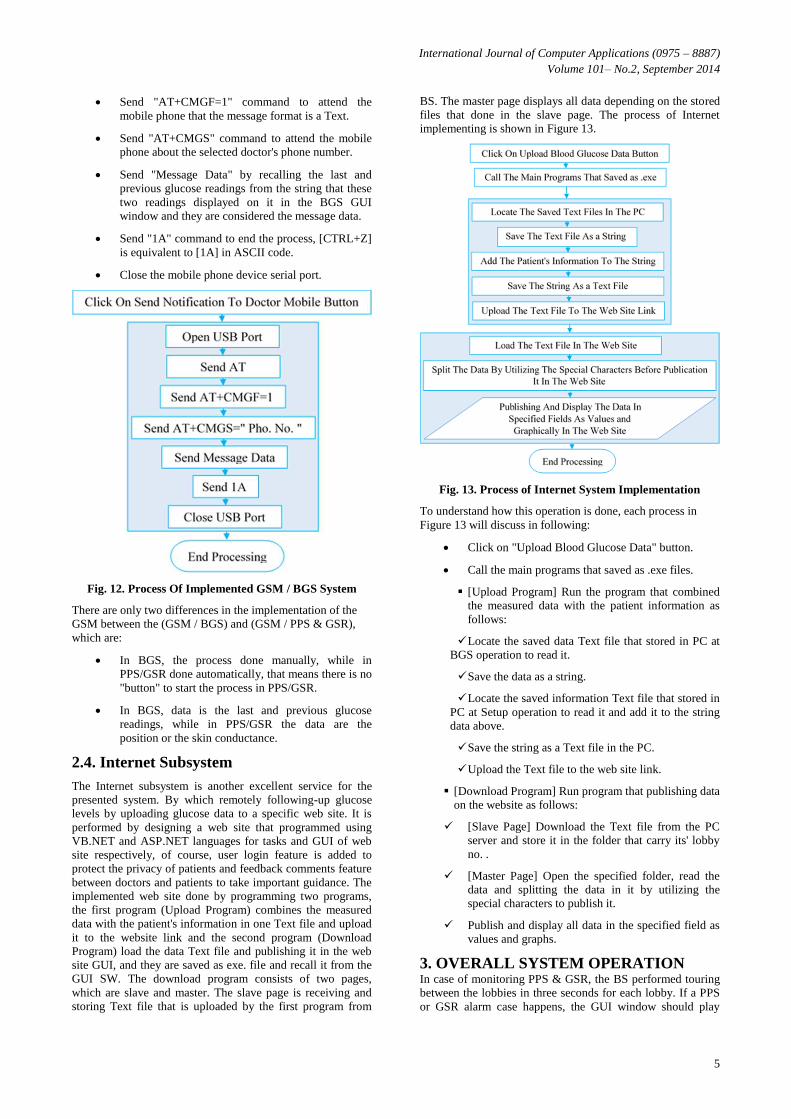
give fast and direct necessary guidance. The process of GSM
system implementation in BGS window is shown in Figure
12. To understand how the GSM operation is done in (PPS &
GSR) window and in (BGS) window, firstly, each process in
Figure 12 will explain in detail as following, and then (PPS &
GSR) implementation process will discussed.
Click on "Send Notification To Doctor Mobile"
button in the BGS GUI window and the Labview
executes automatically the following steps.
Open the mobile phone device serial port.
Send "AT" command to attend the mobile phone to
a new process.
International Journal of Computer Applications (0975 – 8887)
Volume 101– No.2, September 2014
5
Send "AT+CMGF=1" command to attend the
mobile phone that the message format is a Text.
Send "AT+CMGS" command to attend the mobile
phone about the selected doctor's phone number.
Send "Message Data" by recalling the last and
previous glucose readings from the string that these
two readings displayed on it in the BGS GUI
window and they are considered the message data.
Send "1A" command to end the process, [CTRL+Z]
is equivalent to [1A] in ASCII code.
Close the mobile phone device serial port.
Fig. 12. Process Of Implemented GSM / BGS System
There are only two differences in the implementation of the
GSM between the (GSM / BGS) and (GSM / PPS & GSR),
which are:
In BGS, the process done manually, while in
PPS/GSR done automatically, that means there is no
"button" to start the process in PPS/GSR.
In BGS, data is the last and previous glucose
readings, while in PPS/GSR the data are the
position or the skin conductance.
2.4. Internet Subsystem
The Internet subsystem is another excellent service for the
presented system. By which remotely following-up glucose
levels by uploading glucose data to a specific web site. It is
performed by designing a web site that programmed using
VB.NET and ASP.NET languages for tasks and GUI of web
site respectively, of course, user login feature is added to
protect the privacy of patients and feedback comments feature
between doctors and patients to take important guidance. The
implemented web site done by programming two programs,
the first program (Upload Program) combines the measured
data with the patient's information in one Text file and upload
it to the website link and the second program (Download
Program) load the data Text file and publishing it in the web
site GUI, and they are saved as exe. file and recall it from the
GUI SW. The download program consists of two pages,
which are slave and master. The slave page is receiving and
storing Text file that is uploaded by the first program from
BS. The master page displays all data depending on the stored
files that done in the slave page. The process of Internet
implementing is shown in Figure 13.
Fig. 13. Process of Internet System Implementation
To understand how this operation is done, each process in
Figure 13 will discuss in following:
Click on "Upload Blood Glucose Data" button.
Call the main programs that saved as .exe files.
[Upload Program] Run the program that combined
the measured data with the patient information as
follows:
Locate the saved data Text file that stored in PC at
BGS operation to read it.
Save the data as a string.
Locate the saved information Text file that stored in
PC at Setup operation to read it and add it to the string
data above.
Save the string as a Text file in the PC.
Upload the Text file to the web site link.
[Download Program] Run program that publishing data
on the website as follows:
[Slave Page] Download the Text file from the PC
server and store it in the folder that carry its' lobby
no. .
[Master Page] Open the specified folder, read the
data and splitting the data in it by utilizing the
special characters to publish it.
Publish and display all data in the specified field as
values and graphs.
3. OVERALL SYSTEM OPERATION In case of monitoring PPS & GSR, the BS performed touring
between the lobbies in three seconds for each lobby. If a PPS
or GSR alarm case happens, the GUI window should play

International Journal of Computer Applications (0975 – 8887)
Volume 101– No.2, September 2014
6
alarm tone (with indicator) to alert the user in the BS and at
the same time the concerned MCU node is turned ON the
buzzer and the red PPS or GSR LED in the lobby and also
send SMS alarm to doctor's phone. In case of diagnosing
EMG, the MCU sends 821 samples of EMG values for every
60 seconds and the user can resend the request several times,
all that by depending on the specialist doctors that say that the
diagnosis of EMG take a long time about 40 to 60 minutes.
The overall implemented system is shown in Figure (14).
Fig. 14. The Overall Implemented System
4 SYSTEM FEATURES The prototype system has the following features:
• Portable, real time, low power and low cost system.
• Monitoring / diagnosing system and supports
alarming, GSM, Internet and printing subsystems.
• Can add other necessary sensors to the system, and
the system performs searching and storing process.
5 RESULTS As depicted previously, that the presented system is a
prototype and designed for only three patients and the
following results are presented according to real cases.
5.1. Searching Results
Once the system starts the search operation, the active nodes
in the network will display in the specified field as 1,2,3. If
for example node 2 is not active, it displays only nodes 1 and
3. Figure (15) shows the window of searching process.
Fig. 15. Searching results
5.2. Setup Results
After selecting any patient's lobby, for example no.1, the data
are filled as shown in Figure (16), then click on "Save" button.
Fig. 16. Setup results
5.3. Monitoring PPS & GSR Results
In PPS alarm setting, the user selects positions that patient
should not sleep on there, following settings considered for
patient in lobby no.1 (single mode), as example, which are
Left and Prone positions.
The results of actual patient position and skin conductance are
shown in Figures (17, 18, & 19).
In Figure (17) there is no alarm status, while Figure (18)
shows results where patient slept on left position which is not
permissible, and Figure (19) shows the results when GSR
value is abnormal.
Where SMSs alarm of sleep position and skin conductance
that received in the patient's doctor phone are shown in the
Figures (20 & 21) respectively.
If the user selected multi-mode monitoring, the system starts
to display the results in a sequence.
Of course, the alarm system is applicable for all patient nodes.
Fig. 17. Monitoring results with no alarm case
Fig. 18. Monitoring results with PPS alarm case

International Journal of Computer Applications (0975 – 8887)
Volume 101– No.2, September 2014
7
Fig. 19. Monitoring results with GSR alarm case
Fig. 20. SMSs Alarm of The Patient's Sleep Position
Fig. 21. SMSs Alarm of The Patient's Skin Conductance
5.4. Following-Up BGS Results
The user has selected lobby no. 2, as an example, and the
results are shown in Figure 22.
The SMS notification of last and previous glucose measured
that sent to the doctor's phone is shown in Figure 23.
The patient's information and glucose values are uploaded to
the web site, so the doctors can remotely follow-up the
patient's status.
As explained previously, the user must login in the website as
shown in Figure 24. If the user selected the patient's lobby
no.2, as example, the results are displayed in the main website
page as shown in Figure 25.
The hard copy report of the patient's blood glucose status is
shown in Figure 26.
Fig. 22. BGS sensing results
Fig. 23. SMS Notification
Fig. 24. Web Site – Login Page
Fig. 25. Web Site – Main Page
Fig. 26. Glucose Rate Report
5.5. Diagnosing EMG Results
The results in the GUI and hard report are shown in Finger 27
and Figure 28 respectively.

International Journal of Computer Applications (0975 – 8887)
Volume 101– No.2, September 2014
8
Fig. 27. EMG sensing results
Fig. 28. EMG Diagnostic Report
6. DISCUSSION From the obtained results, the following points can be
depicted:
• The process of searching, storing and printing the
reports are done successfully.
• The system is working in real time and the SMSs
sent to the doctor's phone without mistakes.
• Measured more than 20 samples of the glucose for
the same patient and tested the EMG with different
period and sample rate without any problems.
• The process of uploading and logging to the website
are done without errors.
7. CONCLUSION AND FUTURE WORK During the realization of the presented work, the following
notes are depicted as conclusions: the system is designed to
support alarm, GSM, Internet and printer together. The system
is designed in real time, low power and low cost, and to be
portable so used in the hospitals and homes. Can use
MATLAB SW, as an example, to study and analysis the
stored data. In the future, can improve the system by adding
many other sensors and use the implantable glucose sensor to
monitor the patient's blood glucose levels continuously.
Improve the system by design a database of the patients'
health data and information depending on the stored process.
Improve the system by design a data history in the designed
web site.
8. ACKNOWLEDGEMENTS We offer our thanks to the physicians who were consulted
with them in the hospital for their cooperation and advices.
9. REFERENCES [1] Ismail Butun, Salvatore D. Morgera, and Ravi Sankar “A
Survey of Intrusion Detection Systems in Wireless
Sensor Networks”, IEEE, VOL. 16, NO. 1, 2014
[2] Terrance J. Dishongh and Michael McGrath"Wireless
Sensor Networks for Healthcare Applications”, Intel,
ARTECH HOUSE, London, 2010
[3] Jeffrey J. Evans “Undergraduate Research Experiences
with Wireless Sensor Networks”, IEEE, pp. 7 - 12, 2007
[4] John A. Stankovic, “Wireless Sensor Networks”,
University of Virginia, USA, 2006
[5] Nitin P. Jain, Preeti N. Jain and Trupti P. Agarkar “An
Embedded, GSM based, Multipara meter, Real time
Patient Monitoring System and Control - An
Implementation for ICU Patients”, IEEE, pp. 987-992,
2012
[6] Prabakaran C. R., Vijayakuma R. P. and Suryaprakas H.
R. “Web Based Patient Monitoring System Using ARM9
Processor”, IJEEDC, Volume- 1, Issue- 7, Sep-2013
[7] Ajay Kumar Bandi “An Integrated Sensor System For
Early Fall Detection”, MSc. Thesis, Purdue University,
Indiana, 2013
[8] Madhulatha. Kothapu and Ch. Venkat Ratnam
“Automatic Control of Robot by Using MEMS
Technology”, IJPRES, Vol. II/Issue 2 / MAR 2014
[9] G. Shivakumar and P. A. Vijaya “Analysis of Human
Emotions Using Galvanic Skin Response and Finger Tip
Temperature”, IJSE, June 2011
[10] David T. Lykken and Peter H. Venables “Direct
Measurement of Skin Conductance: A proposal For
Standardization”, The Society for Psychophysiological
Research, USA, Vol. 8, No.5, 1971
[11] Miriam Garcia Yanez “Glucose Meter Fundamentals and
Design“, Freescale Semiconductor, Inc., AN4364, 2013
[12] J. Jirka, M. Prauzek and M. Stankus “Glucose Measuring
Device with Advanced Data Processing and Improved
Strip Detection“, Elektronika IR Elektrotechnika, 2013
[13] Peter Konrad “The ABC of EMG - A Practical
Introduction to Kinesiological Electromyography”,
Noraxon INC. USA, April 2005
[14] Nikhil Shrirao “Direct Biocontrol of Telemanipulators
and VR Environments Using SEMG and Intelligent
Systems”, MSc. Thesis, University of Akron, USA, 2006
IJCATM : www.ijcaonline.org