position paper fuel option scenarios
TRANSCRIPT
Position PaperFuel Option Scenarios
October 2021
Certain information set forth in this document contains “forward-looking information”
These statements are not guarantees of future performance and undue reliance should not be placed on them. Such forward-
looking statements necessarily involve known and unknown risks and uncertainties, which may cause actual performance and
financial results in future periods to differ materially from any projections of future performance or result expressed or implied
by such forward-looking statements.
Although forward-looking statements contained in this presentation are based upon what management of the Mærsk
Mc-Kinney Møller Center for Zero Carbon Shipping believes are reasonable assumptions, there can be no assurance that
forward-looking statements will prove to be accurate, as actual results and future events could differ materially from those
anticipated in such statements. The Center undertakes no obligation to update forward-looking statements if circumstances or
management’s estimates or opinions should change except as required by applicable securities laws. The reader is cautioned
not to place undue reliance on forward-looking statements
Page 2
Disclaimer
Page 3
Objective and Scope
The purpose of this paper is to provide supporting documentation to the 2021 Industry Transition Strategy,
detailing particularly assumptions and aspects on the cost, availability and uptake of future fuels. It is not the
purpose of the paper to predict the future fuel blend but rather to make plausible that already today, we can
identify plausible/possible ways of decarbonizing, noting that the future will be different and most likely include
solutions that are more cost-effective than assumed in the present paper.
Several fuels are assumed support the transition. The present analysis only includes a sub-set of possible known
fuels, and more fuels could develop in the future. The real future fuel blend will be – among other aspects such as
national and global politics - dependent on future fuel pathway constraints on primary energy, technology
maturation, and technology cost down. The fuel blend will also depend on regulation and on-board energy
efficiency. This paper investigates scenarios related to these selected techno-economic fuel pathway
constraints
This report should NOT be used to identify one scenario as a prediction of the future. Rather the different shown
scenarios and sensitivities should be considered as a portfolio of results helping to illustrate possibilities,
implications, sensitivities, limitations, dependencies and that the future fuel blends could look very different
depending on the many socio-techno-economic developments along the way. Specifics around individual fuels
are covered in the respective separate fuel position papers

Page 4
Uncertainties in data and scenarios
The techno-economic model, NavigaTE, is used to model the fuel options and the presented scenarios. NavigaTE
and the underlying data is documented separately.
Navigate is based on the principle that a vessel owner will shift to the fuels with the lowest Total-Cost-of-
Ownership (TCO) for the vessel ownership and operation, therefore the fuel cost becomes a deciding factor. The
estimated costs of fuels are based on methods, data and assumptions of high quality but they are still highly
uncertain. For example, there are significant uncertainties related to the improvement of technology performance
and cost (learning curves). While it takes significant developments to enable the new pathways and reach the
assumed learning curves, further radical innovations could increase the competitiveness of certain fuels beyond
assumed developments.
Cost estimates are based on fuel production from large-scale, stand-alone, un-subsidized fuel plants. However,
during the first decades of ramp-up it can be expected that significant volumes of fuel can be produced, realizing
favorable synergies from other processes or achieving subsidies or special opportunities thereby reducing the fuel
production cost as well as the price. The assumed fossil fuel cost is based on market price (forward curve) while
the alternative fuels costs are based on the production cost (including return on investments). Supply-demand in-
balances are not modelled, and sector-competition is implicitly modelled in the assumptions about scale and
availability.
Due to the high uncertainties on cost of future fossil respectively green fuel, the shown carbon tax levels are
correspondingly uncertain.
07
08
16
17
22
26
32
Executive summary
A Path to Zero
Scenarios altering the Path to Zero fuel blend
Biofuels’ availability
Effect of renewable electricity cost on green / blue fuels
Altered hierarchy of e-fuels
Appendix
Agenda
Page 5
32
34
38
40
46
51
57
Appendix
NavigaTE Model Assumptions
Critical Levers
Biofuel Supply Constraints
Renewable Energy Cost and Availability
Vessel Considerations
Supporting data
Agenda
Page 6
Executive Summary
Page 7
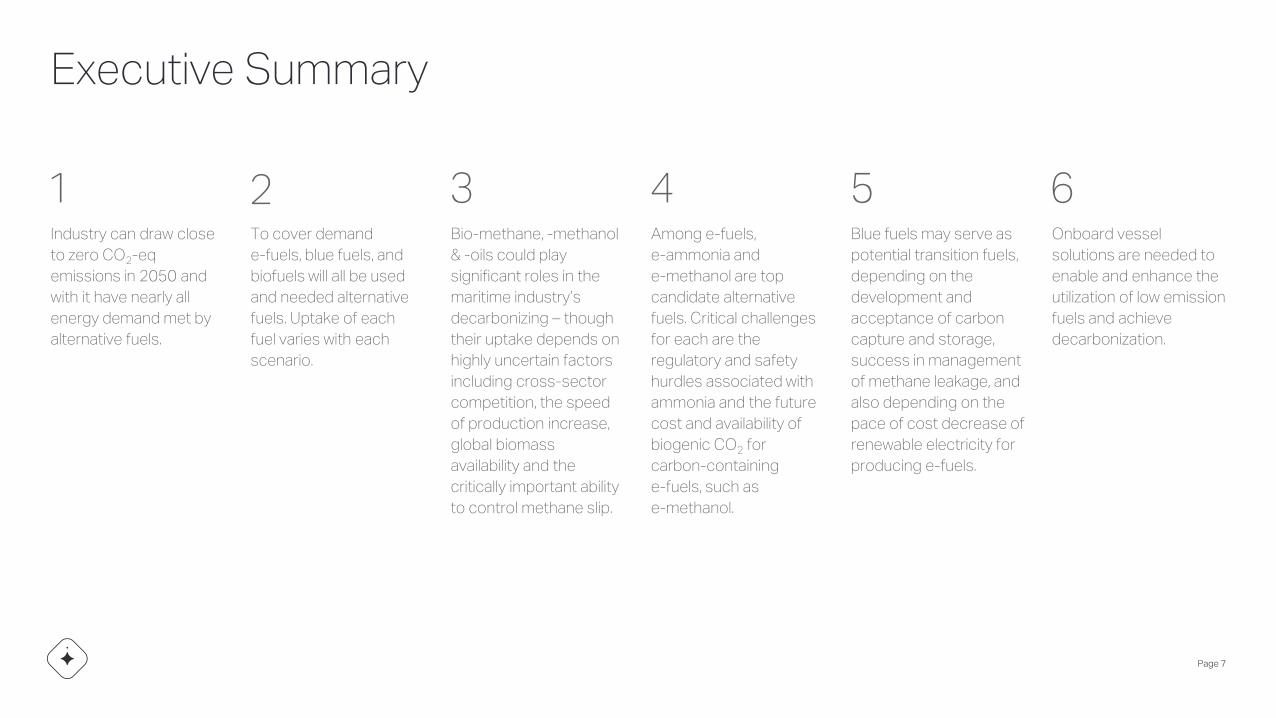
Industry can draw close
to zero CO2-eq
emissions in 2050 and
with it have nearly all
energy demand met by
alternative fuels.
To cover demand
e-fuels, blue fuels, and
biofuels will all be used
and needed alternative
fuels. Uptake of each
fuel varies with each
scenario.
Bio-methane, -methanol
& -oils could play
significant roles in the
maritime industry’s
decarbonizing – though
their uptake depends on
highly uncertain factors
including cross-sector
competition, the speed
of production increase,
global biomass
availability and the
critically important ability
to control methane slip.
Among e-fuels,
e-ammonia and
e-methanol are top
candidate alternative
fuels. Critical challenges
for each are the
regulatory and safety
hurdles associated with
ammonia and the future
cost and availability of
biogenic CO2 for
carbon-containing
e-fuels, such as
e-methanol.
Blue fuels may serve as
potential transition fuels,
depending on the
development and
acceptance of carbon
capture and storage,
success in management
of methane leakage, and
also depending on the
pace of cost decrease of
renewable electricity for
producing e-fuels.
Onboard vessel
solutions are needed to
enable and enhance the
utilization of low emission
fuels and achieve
decarbonization.
1 2 3 4 5 6
07
08
16
17
22
26
32
Executive summary
A Path to Zero
Scenarios altering the Path to Zero fuel blend
Biofuels availability
Effect of renewable electricity cost on green / blue fuels
Altered hierarchy of e-fuels
Appendix
Agenda
Page 8
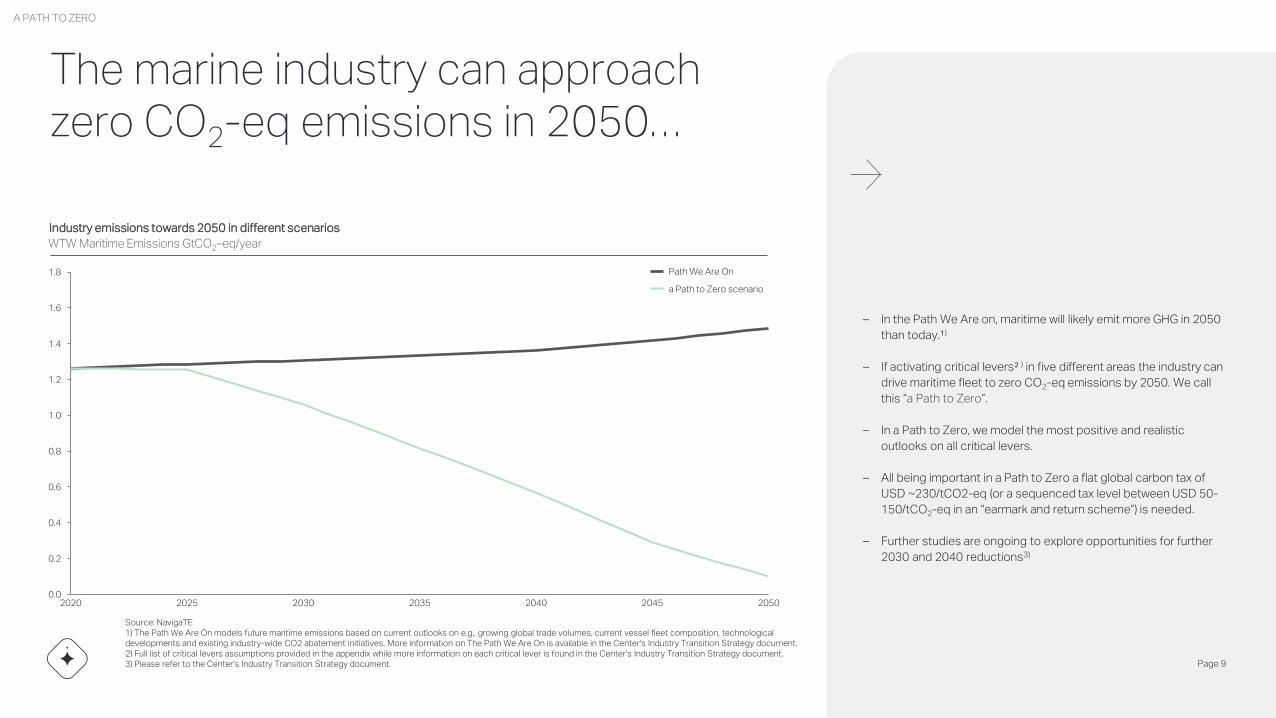
The marine industry can approach zero CO2-eq emissions in 2050…
Source: NavigaTE1) The Path We Are On models future maritime emissions based on current outlooks on e.g., growing global trade volumes, current vessel fleet composition, technological developments and existing industry-wide CO2 abatement initiatives. More information on The Path We Are On is available in the Center’s Industry Transition Strategy document.2) Full list of critical levers assumptions provided in the appendix while more information on each critical lever is found in the Center’s Industry Transition Strategy document.3) Please refer to the Center’s Industry Transition Strategy document.
– In the Path We Are on, maritime will likely emit more GHG in 2050
than today.¹)
– If activating critical levers² ) in five different areas the industry can
drive maritime fleet to zero CO2-eq emissions by 2050. We call
this “a Path to Zero”.
– In a Path to Zero, we model the most positive and realistic
outlooks on all critical levers.
– All being important in a Path to Zero a flat global carbon tax of
USD ~230/tCO2-eq (or a sequenced tax level between USD 50-
150/tCO2-eq in an “earmark and return scheme”) is needed.
– Further studies are ongoing to explore opportunities for further
2030 and 2040 reductions3)
Industry emissions towards 2050 in different scenarios
20452020 2025 2035
0.6
20300.0
20502040
0.2
1.2
0.4
0.8
1.0
1.4
1.6
1.8
WTW Maritime Emissions GtCO2–eq/year
a Path to Zero scenario
Path We Are On
A PATH TO ZERO
Page 9
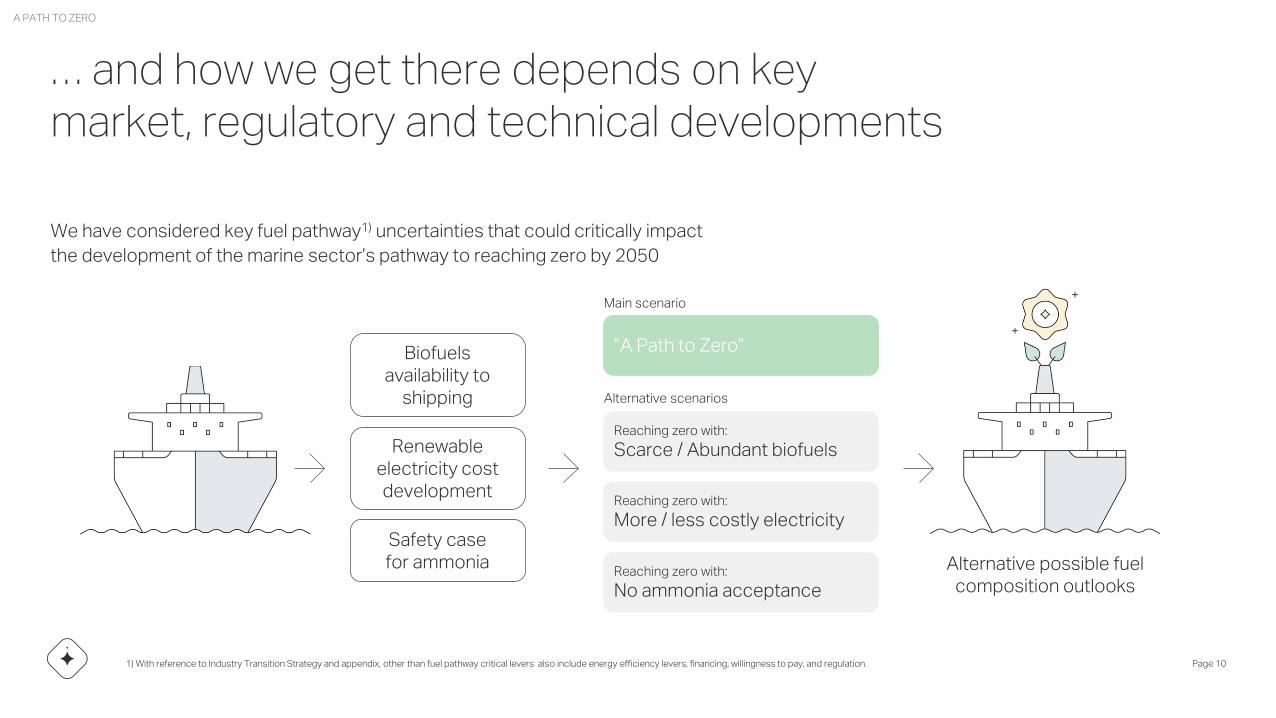
… and how we get there depends on key market, regulatory and technical developments
1) With reference to Industry Transition Strategy and appendix, other than fuel pathway critical levers also include energy efficiency levers, financing, willingness to pay, and regulation. Page 10
Biofuels availability to
shipping
Renewable electricity cost development
Safety casefor ammonia
We have considered key fuel pathway1) uncertainties that could critically impact
the development of the marine sector’s pathway to reaching zero by 2050
“A Path to Zero”
Reaching zero with:
Scarce / Abundant biofuels
Reaching zero with:
More / less costly electricity
Reaching zero with:
No ammonia acceptance
Alternative possible fuel composition outlooks
Alternative scenarios
Main scenario
A PATH TO ZERO

The cost and scalability of future decarbonized fuels is highly uncertain
Page 111) Hydrogen is deemed irrelevant for deep sea shipping and is not further analyzed in this document.
A PATH TO ZERO
Blue hydrogen
Bio-methanol
Green electricity
Natural gas
Biofuel synthesis
Steam methane reforming
Carbon storage
Electrolysis of water
CO2
Blue ammonia
Bio-methane
Bio-oils
Carbon capture
Haber-Bosch process
H2
Synthesis
Synthesis & Liquefaction
Liquefaction
Biomass
Feedstocks Fuel production Fuels
e-Methane
e-Methanol
e-Ammonia
e-Hydrogen
Biowaste
CO2
Page 11
- Currently, we have at least five candidate groups for future alternative fuels: hydrogen, ammonia, methanol, methane and bio-oils
- Each group in turn contains different types of fuels, distinguished by the feedstock and fuel production processes used.
- Renewable energy is used to produce e-fuels, fossil feedstocks are used as a basis to produce blue fuels, while bio-oils include a range of techniques that convert biological material into an oil-like substance
- Carbon dioxide and capture thereof may be regarded as an additional feedstock for methane and methanol influencing cost and scalability
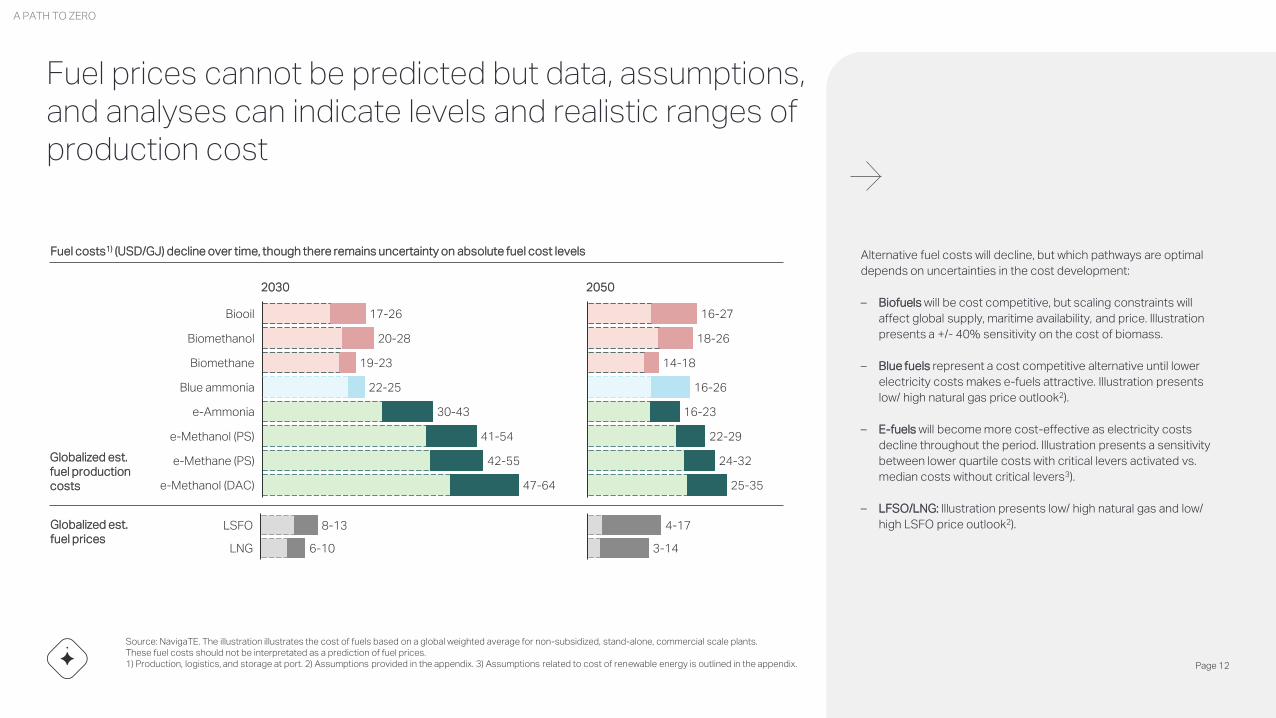
Fuel prices cannot be predicted but data, assumptions, and analyses can indicate levels and realistic ranges of production cost
Page 12
Fuel costs1) (USD/GJ) decline over time, though there remains uncertainty on absolute fuel cost levels
Source: NavigaTE. The illustration illustrates the cost of fuels based on a global weighted average for non-subsidized, stand-alone, commercial scale plants.These fuel costs should not be interpretated as a prediction of fuel prices.1) Production, logistics, and storage at port. 2) Assumptions provided in the appendix. 3) Assumptions related to cost of renewable energy is outlined in the appendix.
2030 2050
Globalized est. fuel production costs
Globalized est. fuel prices
Biooil
e-Ammonia
Biomethanol
Blue ammonia
e-Methanol (PS)
e-Methane (PS)
Biomethane
e-Methanol (DAC)
17-26
20-28
47-64
30-43
19-23
41-54
42-55
22-25
LNG
LSFO 8-13
6-10
4-17
3-14
16-23
16-27
24-32
18-26
14-18
16-26
22-29
25-35
Alternative fuel costs will decline, but which pathways are optimal
depends on uncertainties in the cost development:
– Biofuels will be cost competitive, but scaling constraints will
affect global supply, maritime availability, and price. Illustration
presents a +/- 40% sensitivity on the cost of biomass.
– Blue fuels represent a cost competitive alternative until lower
electricity costs makes e-fuels attractive. Illustration presents
low/ high natural gas price outlook2).
– E-fuels will become more cost-effective as electricity costs
decline throughout the period. Illustration presents a sensitivity
between lower quartile costs with critical levers activated vs.
median costs without critical levers3).
– LFSO/LNG: Illustration presents low/ high natural gas and low/
high LSFO price outlook2).
A PATH TO ZERO
Page 12

Even though the analysis of different fuel
pathways may be largely a technoeconomic
assessment, progress towards decarbonization
will only be possible by addressing the other
various challenges associated with each fuel. A
successful approach to navigating the industry
transition must entail:
– Supporting the regulatory framework to
enable and steer the transition
– Ensuring safety for onboard use
– Achieving the required technological
readiness for fuel production– and for vessel
operation on alternative fuels
– Scaling up the infrastructure and operations
along the supply chain: production, logistics,
storage, and bunkering.
Alternative fuels present challenges beyond just cost reduction, in any path to decarbonization
A PATH TO ZERO
Page 13
Source: MMM Center for Zero Carbon ShippingNote: Emissions reduction impact from direct electrification of ships and nuclear-powered vessels is not modeled in NavigaTE 1.01 Considers onboard fuel supply and storage, fuel conversion and emissions control systems2 Considers fuel toxicity, flammability and explosiveness 3 Includes regulatory framework supporting onboard regulatory aspects, and market mechanisms supporting adoption
Energy Carrier Feedstock availability
Fuel production Fuel storage, logistics, bunkering
Onboard fuel conversion1
Onboard safety and fuel management2
Regulation3
Fossil fuels
e-hydrogen
Blue hydrogen
e-ammonia
Blue ammonia
e-methanol
Bio-methanol
e-methane
Bio-methane
Bio-oils
Mature and proven
Solutions identified
Major challenges remain
Alt
ern
ati
ve f
ue
ls f
or
de
ca
rbo
niz
ati
on

The “A Path to Zero” scenario:
– Assumes an optimistic-reasonable scenario through activation
of all critical levers1)
– Medium biofuel availability (not the scarcer case), low-cost
electricity (not the more costly case), ammonia acceptance, and
blue fuels acceptance.2) Carbon taxed as needed.
– Energy efficiency investments are intensified, decreasing energy
demand towards 2050 even as total volume transported by the
maritime industry increases.
– Ammonia plays a central role, first as blue ammonia and later as
green ammonia. Assume ammonia safety risk is mitigated.
– Biofuels play a role as their value chains reach necessary scale:
bio-methane with a primary role from 2030s, and bio-methanol
and bio-oils impacting the fleet mix from 2040s
– Fossil fuels would be nearly phased out by 2050
Even with the projected levels of fuel cost and its uncertainty, it is possible to decarbonize shipping in multiple scenarios. The example below is assuming that ammonia is enabled to become a fuel.
Full list of critical levers provided in the appendix. Critical levers are fully described in the Industry Transition Strategy. 2) Refer to section titled Scenarios altering the Path to Zero fuel blend.
Fuel composition & energy demand in the “a Path to Zero” in EJ/year
1.3 1.3 1.1 0.8 0.6 0.3 0.1Emissions in
GtCO2eq per year
13.2
2020 20452025
13.1
20502030 2035 2040
13.212.9
12.512.3
11.9
e-Methanol
e-Methane
Biomethanol
e-Ammonia
LNG
Blue Ammonia
Biomethane
Biooils
LSFO
A PATH TO ZERO
Page 14
0
5
10
15
0
5
10
15
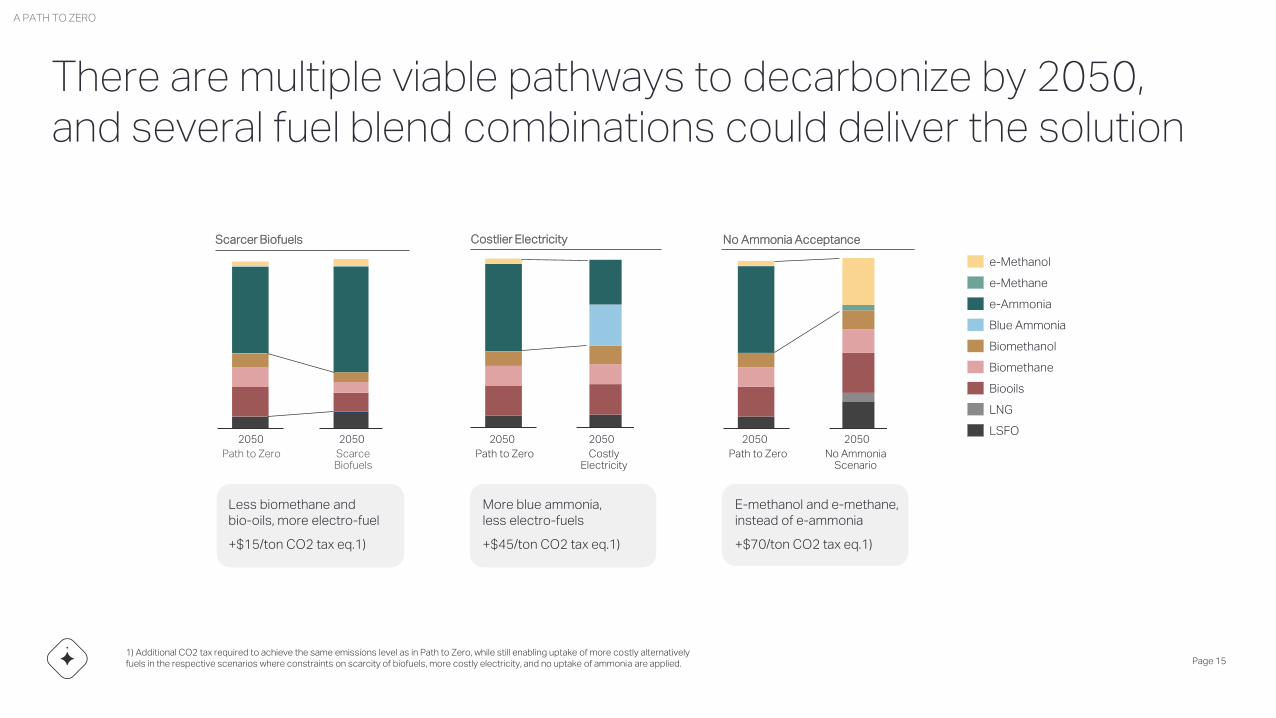
There are multiple viable pathways to decarbonize by 2050, and several fuel blend combinations could deliver the solution
1) Additional CO2 tax required to achieve the same emissions level as in Path to Zero, while still enabling uptake of more costly alternatively fuels in the respective scenarios where constraints on scarcity of biofuels, more costly electricity, and no uptake of ammonia are applied. Page 15
Less biomethane andbio-oils, more electro-fuel
+$15/ton CO2 tax eq.1)
More blue ammonia, less electro-fuels
+$45/ton CO2 tax eq.1)
E-methanol and e-methane, instead of e-ammonia
+$70/ton CO2 tax eq.1)
2050 20502050 2050 20502050
Costlier Electricity No Ammonia Acceptance
e-Methanol
e-Ammonia
e-Methane
Biomethanol
Blue Ammonia
Biomethane
Biooils
LNG
LSFO
Scarce Biofuels
Path to Zero Path to Zero Path to Zero No Ammonia Scenario
Costly Electricity
Scarcer Biofuels
A PATH TO ZERO
07
08
16
17
22
26
32
Executive summary
A Path to Zero
Scenarios altering the Path to Zero fuel blend
Biofuels availability
Effect of renewable electricity cost on green / blue fuels
Altered hierarchy of e-fuels
Appendix
Agenda

Biofuels availability
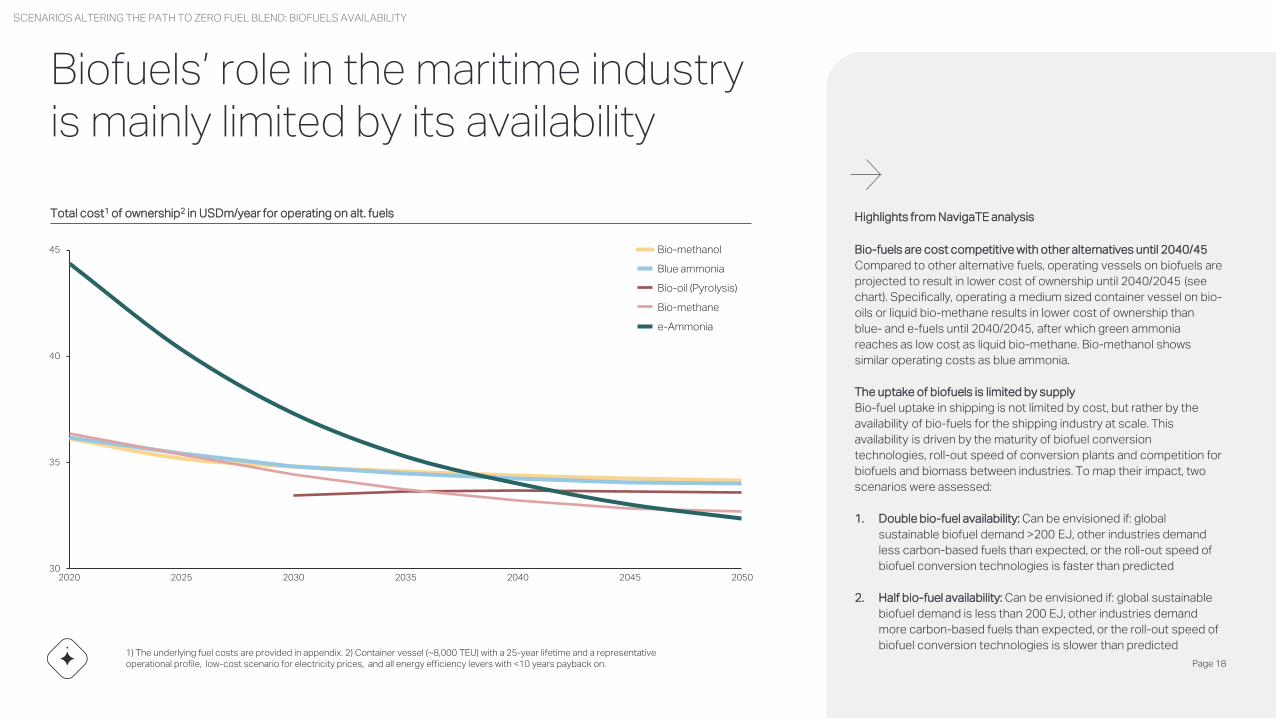
Biofuels’ role in the maritime industry is mainly limited by its availability
1) The underlying fuel costs are provided in appendix. 2) Container vessel (~8,000 TEU) with a 25-year lifetime and a representative operational profile, low-cost scenario for electricity prices, and all energy efficiency levers with <10 years payback on.
Bio-fuels are cost competitive with other alternatives until 2040/45
Compared to other alternative fuels, operating vessels on biofuels are
projected to result in lower cost of ownership until 2040/2045 (see
chart). Specifically, operating a medium sized container vessel on bio-
oils or liquid bio-methane results in lower cost of ownership than
blue- and e-fuels until 2040/2045, after which green ammonia
reaches as low cost as liquid bio-methane. Bio-methanol shows
similar operating costs as blue ammonia.
The uptake of biofuels is limited by supply
Bio-fuel uptake in shipping is not limited by cost, but rather by the
availability of bio-fuels for the shipping industry at scale. This
availability is driven by the maturity of biofuel conversion
technologies, roll-out speed of conversion plants and competition for
biofuels and biomass between industries. To map their impact, two
scenarios were assessed:
1. Double bio-fuel availability: Can be envisioned if: global
sustainable biofuel demand >200 EJ, other industries demand
less carbon-based fuels than expected, or the roll-out speed of
biofuel conversion technologies is faster than predicted
2. Half bio-fuel availability: Can be envisioned if: global sustainable
biofuel demand is less than 200 EJ, other industries demand
more carbon-based fuels than expected, or the roll-out speed of
biofuel conversion technologies is slower than predicted
Total cost1 of ownership2 in USDm/year for operating on alt. fuels Highlights from NavigaTE analysis
30
35
40
45
20352020 2025 2030 20502040 2045
e-Ammonia
Bio-methanol
Bio-methane
Blue ammonia
Bio-oil (Pyrolysis)
SCENARIOS ALTERING THE PATH TO ZERO FUEL BLEND: BIOFUELS AVAILABILITY
Page 18

2040 20502030
Double biofuel availability to the maritime industry increases its uptake, resulting in lower emissions at same CO2 tax
0
5
10
15
Biofuel supply ↑Path to Zero
13.1 13.1
e-Methanol
Bio-methane
e-Methane
Bio-methanol
e-Ammonia
Blue Ammonia
Bio-oils
LNG
LSFO
[EJ/year]
0
5
10
15
12.5
Path to Zero Biofuel supply ↑
12.5
0.0
3.0
0.5
1.0
1.5
4.5
2.0
2.5
3.5
6.0
4.0
14.0
5.0
5.5
6.5
7.0
7.5
8.0
10.5
8.5
9.0
9.5
10.0
11.0
13.0
11.5
12.0
13.5
14.5
15.0
12.5
Path to Zero Biofuel supply ↑
11.9 11.9
1.1 1.1 0.6 0.5 0.1 0.1Emissions in
GtCO2eq per year
Biofuels could play a larger role if supplies are available
With double biofuel availability, the uptake of bio-fuels in shipping
increases significantly. Specifically, biofuel’s share of the total energy
demand from shipping increases from 2 to 5% in 2030, from 13% to
26% in 2040 and from 35% to 56% in 2050. The highest increase in
uptake happens for bio-methane and bio-oils, while bio-methanol
uptake primarily increases in 2040.
Increased biofuel use primarily decrease green and blue fuel use
Higher availability of biofuels results in a 4% point drop in the use of
LSFO in the fleet in 2040 (42 to 38% of fleet energy demand). This is
caused by the existing LSFO vessels that cannot utilise the new fuels.
Bio-oils, which can be used in these vessels directly, are still not
available in sufficient scale to decrease replace LSFO. Instead, the
increased biofuel uptake results in less green ammonia (29% to 22%
in 2040 and 50% to 33% in 2050) and blue ammonia (11%-9% in
2040).
Increased biofuel uptake reduces fleet emissions
When the use of bio-fuels in the fleet increased from improved
availability, the fleet’s total emissions decreased by 8% in 2040 and
40% in 2050 compared to the Path to Zero case. Thus, a slightly
higher emission reduction is achieved at the Path to Zero. Also, a
higher emission reduction will be achievable than in the Path to Zero
case, as the biofuels have lower cost of operation until 2040/2045.
Highlights from scenario analysisImpact on the fleet fuel mix
SCENARIOS ALTERING THE PATH TO ZERO FUEL BLEND: BIOFUELS AVAILABILITY
Page 19

Conversely, half biofuel availability decreases its uptake resulting in higher emissions at same CO2 tax
0
5
10
15
Biofuel supply ↓Path to Zero
13.1 13.1
e-Methanol
Blue Ammonia
e-Methane
Bio-methane
Bio-methanol
e-Ammonia
Bio-oils
LNG
LSFO0
5
10
15
Path to Zero Biofuel supply ↓
12.5 12.5
0.0
5.5
3.5
0.5
1.0
1.5
11.0
10.0
2.5
4.5
2.0
4.0
5.0
6.0
6.5
10.5
7.0
7.5
8.5
14.0
9.0
9.5
11.5
12.0
13.0
12.5
13.5
14.5
15.0
8.0
3.0
Path to Zero Biofuel supply ↓
11.9 11.9
Biofuels could play a smaller role if supply is lower than predicted
If supply of biofuels for shipping is half of the uptake of bio-fuels
decreases 2% to 1% in 2030, from 13% to 7% in 2040 and from 35%
to 21% in 2050.
Low biofuel uptake results in higher fossil, blue and e-fuels use
At lower biofuel availability, the use of LSFO increases from 44% to
45% in 2040, and from 7% to 9% in 2050. In addition, LNG remains in
the fuel blend at 3% in 2040 compared of 0% in the Path to Zero
case. Green ammonia and blue ammonia are both used to a slightly
higher extent in 2040, and green ammonia at a significantly higher
extent in 2050 (61% instead of 50%).
Reduced biofuel uptake increases fleet emissions
At lower biofuel availability the fleet’s total emissions increase by 7%
in 2040 and 10% in 2050 from the Path to Zero case. Thus, a slightly
lower emission reduction is achieved at the same level of carbon tax,
and a slightly higher carbon tax is necessary to reach the same
decarbonisation target: an extra +$15/ton CO2 would be needed.
Also, a lower emission reduction will be achievable than in the Path to
Zero case, as the biofuels have lower cost of operation until
2040/2045.
Highlights from scenario analysisImpact on the fleet fuel mix
[EJ/year]
2040 20502030
1.1 1.1 0.6 0.6 0.1 0.1Emissions in
GtCO2eq per year
SCENARIOS ALTERING THE PATH TO ZERO FUEL BLEND: BIOFUELS AVAILABILITY
Page 20

Three major risks were identified when accelerating the biofuel value
chain for the maritime industry: Roll-out of conversion plants,
competition of biomass and competition for biofuels
Roll-out of conversion plants must accelerate rapidly
Competition of biomass and biofuels could reduce supply for shipping
Most industries are moving towards zero emissions by 2050. Their
energy demand exceeds the amount of global sustainable biomass
projected to be available. Thus, the competition for biomass and
biofuels could drive prices to levels which are unsustainable for the
maritime industry.
To be part of the solution, rapid development in biofuel supply and sustainability control must occur
Feedstocks used for biofuel production must be sourced sustainablyThe sustainability of biofuels is highly dependent on the origin of the biomass used. While a bio-oil based on used
cooking oil, and one based on palm oil, are similar on the molecular level, the use of land space differs. Producing
palm oil results in direct or indirect deforestation releasing high amounts of CO2 to the atmosphere. Thus, the bio-
oil from used cooking oil has low emissions in its production, while the palm oil bio-oils has high emissions.
Recognizing the difference between these feedstocks is a challenge. A vessel-operator needs robust and widely
recognized standards and systems for documenting the sustainability of the bio-fuel production cycle. The road
transport and aviation industries have developed some of these systems already, which the maritime industry
could benefit from modifying and adopting.
Controlling methane loss throughout the value chain will be critical, especially for bio-methaneMethane loss to the atmosphere from production and through use can jeopardize the sustainability of bio-
methane. Leak levels from production of bio-methane can vary significantly from plant to plant, and from country
to country. If bio-methane is to play a role in the decarbonization of the maritime industry, it is critical that regulation
drives both production plants, distribution network owners and vessel owners to minimize methane
loss rates.
1) Standard plant sized (kton fuel/year): Bio-methane: 10, HTL oil: 92, Bio-oils: 75-200 depending on technology, Bio-methanol: 150
0
50
100
150
200
250
36-402021-25 26-30 46-5031-35 41-45
Bio-methane
Bio-methanol
Bio-oils
To reach biofuel supplies
predicted in the Path to
Zero scenario, the roll-out
of conversion plants
supplying the maritime
industry must accelerate
rapidly. 200 new bio-
methane plants supplying
shipping must be built per
year between 2025 and
2035, while bio-oils would
require 30-60 new plants
supplying shipping per
year after 2040 to meet
demand.
New plants supplying shipping, per year[Number of new standard sized1 plants]
Biofuel supply for shipping must increase at unprecedented speedsBiofuel sustainability must be tightly controlled
SCENARIOS ALTERING THE PATH TO ZERO FUEL BLEND: BIOFUELS AVAILABILITY
Page 21
Effect of renewable electricity cost on green / blue fuels

Blue ammonia could play a more prominent role in the transition with a higher renewable electricity cost
0
5
10
15
Path to Zero No reduction
on LCoE
13.1 13.1
e-Methane
Bio-oils
e-Methanol
Blue Ammonia
e-Ammonia
Bio-methanol
Bio-methane
LNG
LSFO
Carbon taxation promotes blue ammonia during the transition period
Although blue ammonia carries an emissions penalty from methane
leaks in upstream production, using it as a fuel nevertheless results in
less net emissions than fossil fuels. Therefore, carbon taxation has a
net positive effect on the uptake of blue ammonia, especially during
the early industry transition.
The role of blue ammonia strongly depends on electricity cost
The Path to Zero scenario features low-cost scenario for supply of
renewable energy1) and results in moderate uptake of blue ammonia.
In contrast, medium-case RES costs (more expensive renewable
electricity) would significantly expand the role for blue ammonia. Without
low-cost RES, the emissions reduction would be less effective than in
the main scenario. In that case, achieving the same emissions target
would require a tax that is $45/ton CO2 higher than the tax in A Path to
Zero. Blue ammonia’s role could also get amplified if it was not possible
to globally supply enough RES to meet demand from all industry sectors.
Regulatory risk: Carbon Capture and Storage2)
A key uncertainty for blue ammonia’s role is the political acceptance
of CCS as an effective practice. The positive climate impact of blue
ammonia hinges on the assumption that stored CO2 is permanent.
However, certifying blue ammonia as a low emissions fuel will require
the establishment of standards to certify that stored carbon is not
escaping over time or otherwise having a negative impact on climate.
Further, methane emissions associated to upstream natural gas
production must be mitigated.
0
5
10
15
No reduction
on LCoE
Path to Zero
12.5 12.5
0
5
10
15
Path to Zero
11.9
No reduction
on LCoE
11.9
1) Corresponding to activated critical lever as per Industry Transition Strategy. Critical levers are listed in appendix.2) From 2030, required storage capacities for blue ammonia start with 0.2 GtCO2eq per year and range up to 0.5 in 2045 of the alternative scenario.
Highlights from scenario analysisImpact on the fleet fuel mix
[EJ/year]
2040 20502030
1.1 1.1 0.6 0.6 0.1 0.1
Emissions in
GtCO2eq per year
SCENARIOS ALTERING THE PATH TO ZERO FUEL BLEND: EFFECT OF RENEWABLE ELECTRICITY COST ON GREEN / BLUE FUELS
Page 23
11.9
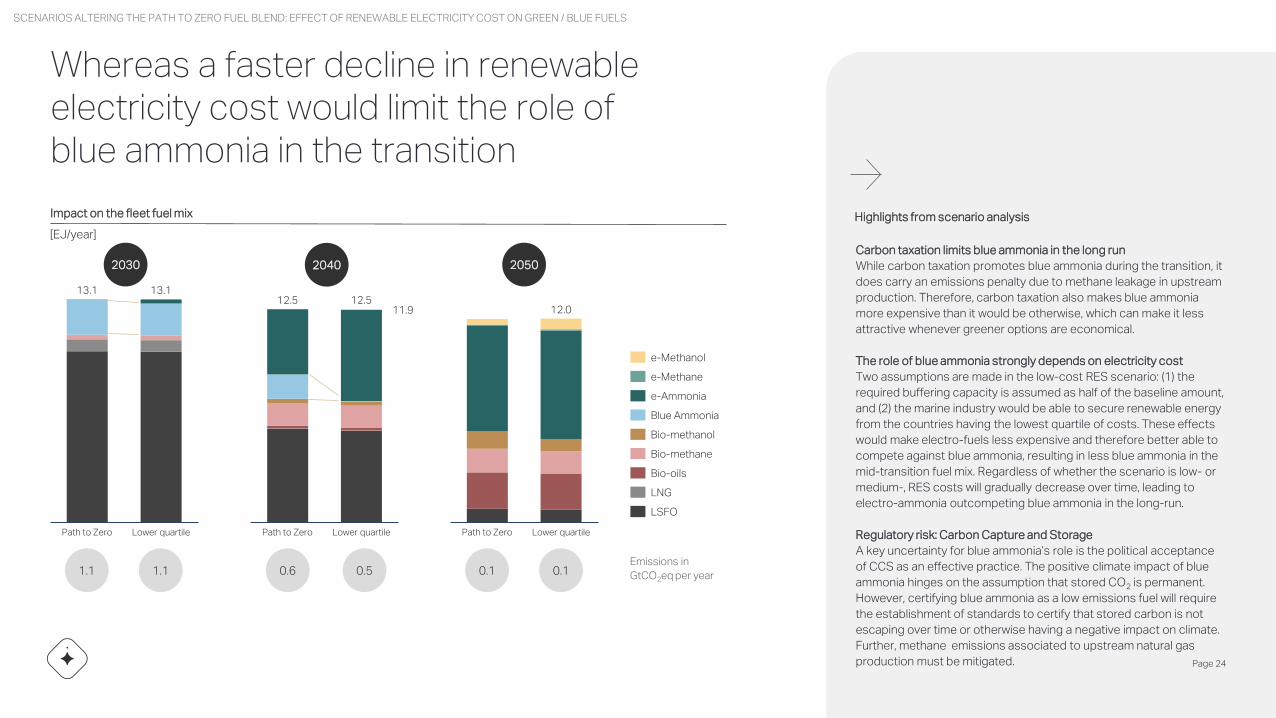
Whereas a faster decline in renewable electricity cost would limit the role of blue ammonia in the transition
0
5
10
15
Lower quartilePath to Zero
13.1 13.1
e-Methanol
e-Methane
e-Ammonia
Blue Ammonia
Bio-methanol
LNG
Bio-methane
Bio-oils
LSFO
Carbon taxation limits blue ammonia in the long run
While carbon taxation promotes blue ammonia during the transition, it
does carry an emissions penalty due to methane leakage in upstream
production. Therefore, carbon taxation also makes blue ammonia
more expensive than it would be otherwise, which can make it less
attractive whenever greener options are economical.
The role of blue ammonia strongly depends on electricity cost
Two assumptions are made in the low-cost RES scenario: (1) the
required buffering capacity is assumed as half of the baseline amount,
and (2) the marine industry would be able to secure renewable energy
from the countries having the lowest quartile of costs. These effects
would make electro-fuels less expensive and therefore better able to
compete against blue ammonia, resulting in less blue ammonia in the
mid-transition fuel mix. Regardless of whether the scenario is low- or
medium-, RES costs will gradually decrease over time, leading to
electro-ammonia outcompeting blue ammonia in the long-run.
Regulatory risk: Carbon Capture and Storage
A key uncertainty for blue ammonia’s role is the political acceptance
of CCS as an effective practice. The positive climate impact of blue
ammonia hinges on the assumption that stored CO2 is permanent.
However, certifying blue ammonia as a low emissions fuel will require
the establishment of standards to certify that stored carbon is not
escaping over time or otherwise having a negative impact on climate.
Further, methane emissions associated to upstream natural gas
production must be mitigated.
0
5
10
15
12.5
Path to Zero Lower quartile
12.5
0
5
10
15
12.0
Path to Zero Lower quartile
Highlights from scenario analysisImpact on the fleet fuel mix
[EJ/year]
2040 20502030
1.1 1.1 0.6 0.5 0.1 0.1Emissions in
GtCO2eq per year
SCENARIOS ALTERING THE PATH TO ZERO FUEL BLEND: EFFECT OF RENEWABLE ELECTRICITY COST ON GREEN / BLUE FUELS
Page 24
Safety and Environmental risks
The largest barrier to utilizing blue ammonia in shipping is that – blue
or not– onboard usage of ammonia poses significant safety and
environmental risks that need to be addressed. Beyond toxicity
hazards, ammonia furthermore awaits the technology readiness for
propulsion, especially the development of an engine capable of
running on ammonia without N2O slip.
Upstream Production risks
Since blue ammonia is produced from natural gas, its upstream
emissions can be nearly as significant as for LNG. Methane is a
potent greenhouse gas, and there are emissions that may be difficult
to control from exploration, drilling, pipelines, etc.
Regulatory risks of CCS
CO2 storage is a technology that is generally considered to be
mature enough to scale commercially. However, there is currently no
global standard for CO2 crediting, and there is potential skepticism
about the long-term efficacy of storage. Certification schemes must
be developed in conjunction with ongoing validation that storage
does not leak.
Political view on the fossil fuel industry
Public sentiment may be disinclined to support policies for a product
that extends the lifetime of fossil industries – especially if the CO2 is
used to recover more oil and gas.
Blue ammonia can be overall beneficial for the transition, but its acceptance may be challenged at various levels
Blue AmmoniaBlue ammonia has been proposed as a more cost-effective, near-term solution for the marine industry’s transition
to low emission fuels. Since it is produced in the same way as conventional ammonia, the only time constraint to
its implementation is validating and certifying that CO2 from the process is permanently stored.
Potentially near-term reduction of carbon footprintSince the technologies for blue ammonia production are established, it may be possible to supply blue ammonia
within the 5-10 years that it will take before demand takes off. Since blue ammonia is up to 80-90% less carbon
intensive than fossil alternatives, it represents a potential near-term solution to decarbonization.
Blue ammonia can accelerate the green transitionIn all RES cost scenarios, electro-fuels will be too expensive to produce in the near-term. Therefore, the fleet
uptake of ammonia fuel could be laboriously slow, if new-builds do not foresee any advantage of purchasing
ammonia-ready vessels. Therefore, in the medium term, the lack of affordable green ammonia will hinder the
transition. However, if blue ammonia would become an option near the start of the transition, then the vessels and
logistics infrastructures could benefit from a head-start to improve the economics of ammonia in the maritime
industry. In this case, greener ammonia could be adopted sooner, and in larger quantities.
…. and RisksBlue Ammonia – Benefits
SCENARIOS ALTERING THE PATH TO ZERO FUEL BLEND: EFFECT OF RENEWABLE ELECTRICITY COST ON GREEN / BLUE FUELS
Page 25

Altered hierarchy of e-fuels
EFFECT OF RENEWABLE ELECTRICITY COST ON GREEN / BLUE FUELS
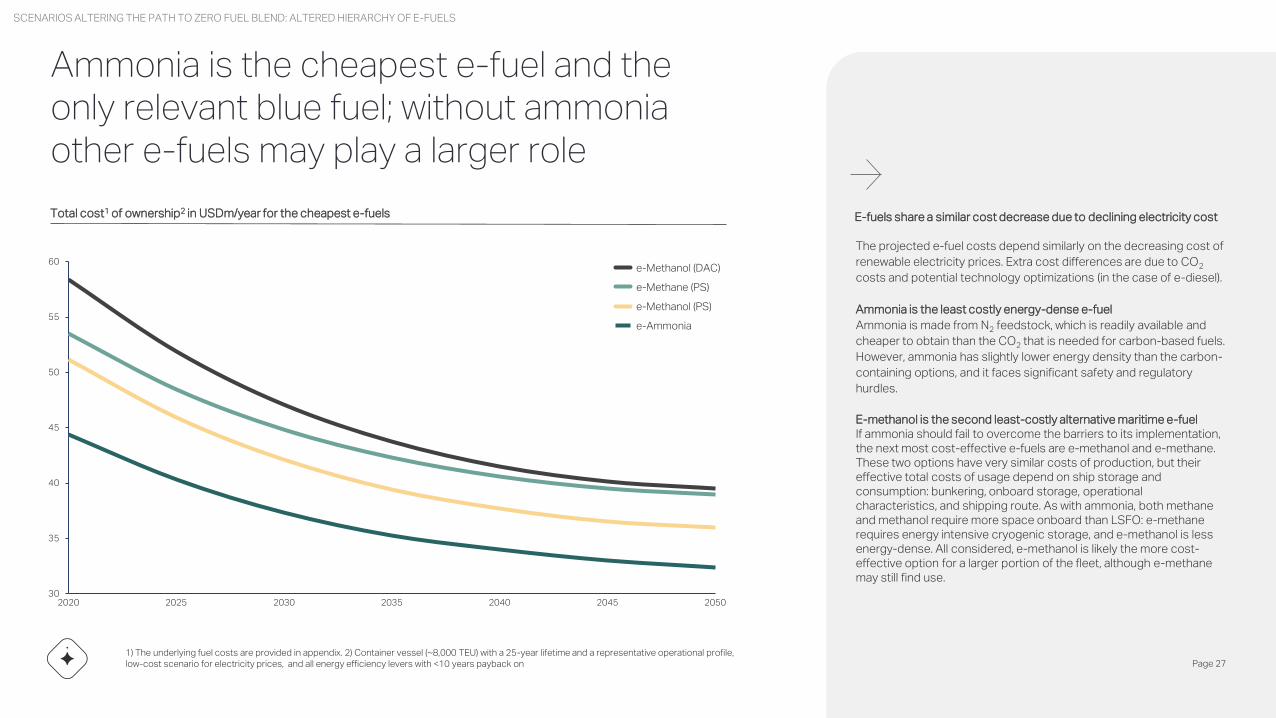
Ammonia is the cheapest e-fuel and the only relevant blue fuel; without ammonia other e-fuels may play a larger role
1) The underlying fuel costs are provided in appendix. 2) Container vessel (~8,000 TEU) with a 25-year lifetime and a representative operational profile, low-cost scenario for electricity prices, and all energy efficiency levers with <10 years payback on
The projected e-fuel costs depend similarly on the decreasing cost of
renewable electricity prices. Extra cost differences are due to CO2
costs and potential technology optimizations (in the case of e-diesel).
Ammonia is the least costly energy-dense e-fuel
Ammonia is made from N2 feedstock, which is readily available and
cheaper to obtain than the CO2 that is needed for carbon-based fuels.
However, ammonia has slightly lower energy density than the carbon-
containing options, and it faces significant safety and regulatory
hurdles.
E-methanol is the second least-costly alternative maritime e-fuelIf ammonia should fail to overcome the barriers to its implementation, the next most cost-effective e-fuels are e-methanol and e-methane. These two options have very similar costs of production, but their effective total costs of usage depend on ship storage and consumption: bunkering, onboard storage, operational characteristics, and shipping route. As with ammonia, both methane and methanol require more space onboard than LSFO: e-methane requires energy intensive cryogenic storage, and e-methanol is less energy-dense. All considered, e-methanol is likely the more cost-effective option for a larger portion of the fleet, although e-methane may still find use.
30
35
40
45
50
55
60
2035 20452020 2025 2030 2040 2050
e-Ammonia
e-Methanol (DAC)
e-Methanol (PS)
e-Methane (PS)
E-fuels share a similar cost decrease due to declining electricity costTotal cost1 of ownership2 in USDm/year for the cheapest e-fuels
SCENARIOS ALTERING THE PATH TO ZERO FUEL BLEND: ALTERED HIERARCHY OF E-FUELS
Page 27

The availability of Point Source CO2 is a key cost determinant of carbon-containing e-fuels
As shown in the fuel options cost curve, carbon-containing electro-fuels will be more costly to produce than
ammonia, since CO2 feedstock is required. This CO2 is only emissions neutral if secured from a biogenic source or
by direct air capture, and it is not as easily extracted as N2. This is because CO2 utilization carries costs related to
capture, compression or liquefication, and transportation. Furthermore, demand for biogenic CO2 will face
competition from other industries, including CCS and carbon credits.
Point source CO2 must be biogenic for low emission fuelsFrom an LCA perspective, the capture and re-use of non-renewable CO2 does not result in a net positive climate impact. Capturing a carbon atom of fossil origin will render a carbon credit to the operator who does the capturing. But if downstream fuel-producers utilize such captured carbon, they must either (a) pay for the value of the credit or (b) bear the burden of its later re-emission as CO2. I.e. the carbon credit cannot be claimed by both the upstream and downstream industries. Therefore, captured non-biogenic carbon is taken on loan: it merely serves as a temporarily energy storage medium, before being re-emitted as CO2 with a net-negative climate impact.
Biogenic CO2 is difficult to capture and utilize today, but it may become easier in the futureThe amount of biogenic CO2 produced today could theoretically supply all that shipping would need. However,
most biomass power plants are small or remote, and therefore the CO2 capture and transport costs are
prohibitive– this effectively means there is a shortage. Moreover, most of today’s biogenic CO2 is uneconomical to
capture because it is emitted in low concentrations.
Despite the near-term undersupply of biogenic CO2, it is envisioned that more biogenic CO2 will be available in the
longer term. This is because bio-methane will likely emerge as a new and widespread resource, replacing natural
gas in grids, thereby increasing the biogenic CO2 availability while also decreasing the costs of capturing and
transporting it.
Direct Air Capture is cost-prohibitive in the near-term; demand will depend on availability of point sources.Direct air capture is a technology for removing CO2 at its low concentrations in ambient air. The result is direct depletion of the greenhouse gas from the atmosphere. DAC is currently at an early stage of commercial readiness, with focus on reducing operating cost. Due to its dependence on low-cost renewable electricity, it may not be economically feasible – compared to point source capture -until late in the industry transition.
Various CO2 dynamics will be interlinked: carbon taxation, carbon crediting, point source CO2 price, and demand for DACIn a future with international CO2 taxation, it is likely that carbon credits will be recognized for removing atmospheric CO2. The ability to globally trade such credits will trigger a demand for emissions offsetting. I.e., it may well cost less for hard-to-abate sectors to buy carbon credits rather than pay a high emissions penalty.Two methods for removing and permanently storing CO2 are DACCS (DAC + Carbon Storage) and BECCS (Bioenergy + Carbon Capture and Storage). The costs of these processes may become lower than some of the CO2 tax levels being considered. Therefore, BECCS/DACCS costs may potentially determine the maximum effective CO2 tax.
Another consequence of such CO2 trading is that the CO2 tax level will determine the CO2 feedstock price for e-methanol etc. To be used for carbon-based electro-fuels, its value as a feedstock would need to be higher than its value in BECCS/DACCS.
SCENARIOS ALTERING THE PATH TO ZERO FUEL BLEND: ALTERED HIERARCHY OF E-FUELS
Page 28
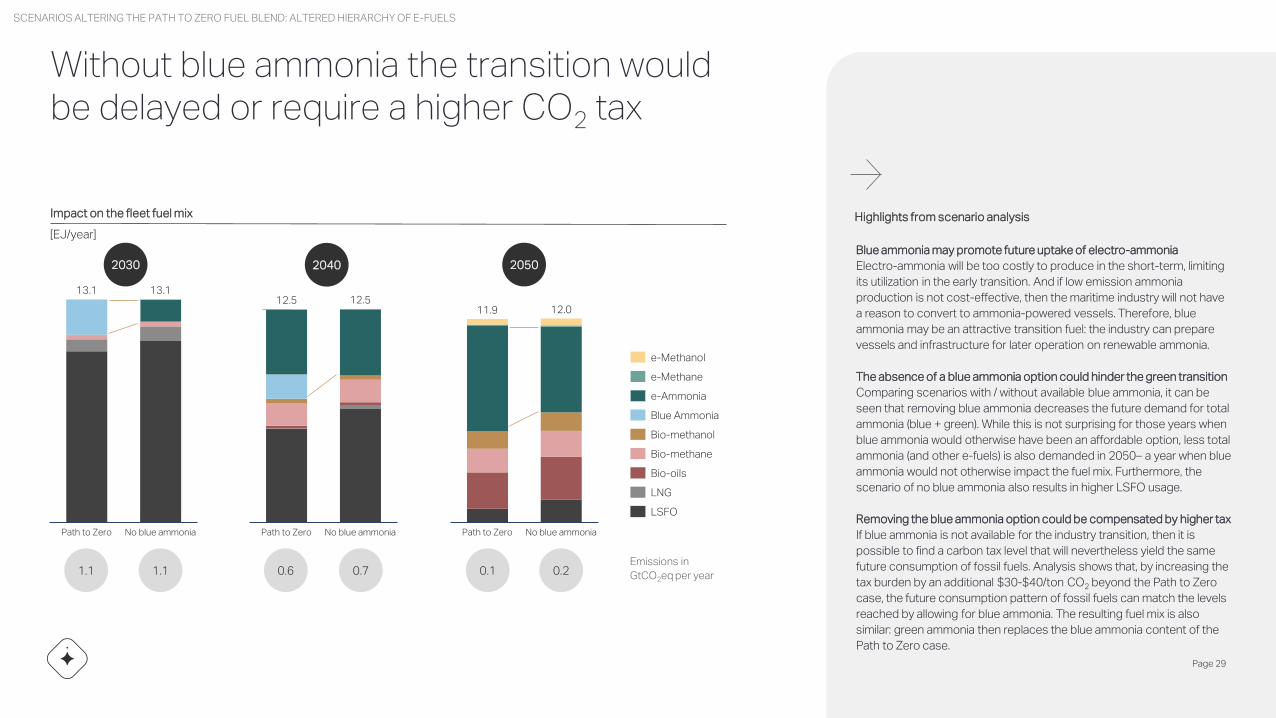
Without blue ammonia the transition would be delayed or require a higher CO2 tax
0
5
10
15
Path to Zero
13.113.1
No blue ammonia
e-Methanol
Bio-methane
LNG
e-Methane
Blue Ammonia
e-Ammonia
Bio-methanol
Bio-oils
LSFO0
5
10
15
Path to Zero No blue ammonia
12.5 12.5
0
5
10
15
12.011.9
No blue ammoniaPath to Zero
Blue ammonia may promote future uptake of electro-ammonia
Electro-ammonia will be too costly to produce in the short-term, limiting
its utilization in the early transition. And if low emission ammonia
production is not cost-effective, then the maritime industry will not have
a reason to convert to ammonia-powered vessels. Therefore, blue
ammonia may be an attractive transition fuel: the industry can prepare
vessels and infrastructure for later operation on renewable ammonia.
The absence of a blue ammonia option could hinder the green transition
Comparing scenarios with / without available blue ammonia, it can be
seen that removing blue ammonia decreases the future demand for total
ammonia (blue + green). While this is not surprising for those years when
blue ammonia would otherwise have been an affordable option, less total
ammonia (and other e-fuels) is also demanded in 2050– a year when blue
ammonia would not otherwise impact the fuel mix. Furthermore, the
scenario of no blue ammonia also results in higher LSFO usage.
Removing the blue ammonia option could be compensated by higher tax
If blue ammonia is not available for the industry transition, then it is
possible to find a carbon tax level that will nevertheless yield the same
future consumption of fossil fuels. Analysis shows that, by increasing the
tax burden by an additional $30-$40/ton CO2 beyond the Path to Zero
case, the future consumption pattern of fossil fuels can match the levels
reached by allowing for blue ammonia. The resulting fuel mix is also
similar: green ammonia then replaces the blue ammonia content of the
Path to Zero case.
Highlights from scenario analysisImpact on the fleet fuel mix
[EJ/year]
2040 20502030
1.1 1.1 0.6 0.7 0.1 0.2Emissions in
GtCO2eq per year
SCENARIOS ALTERING THE PATH TO ZERO FUEL BLEND: ALTERED HIERARCHY OF E-FUELS
Page 29
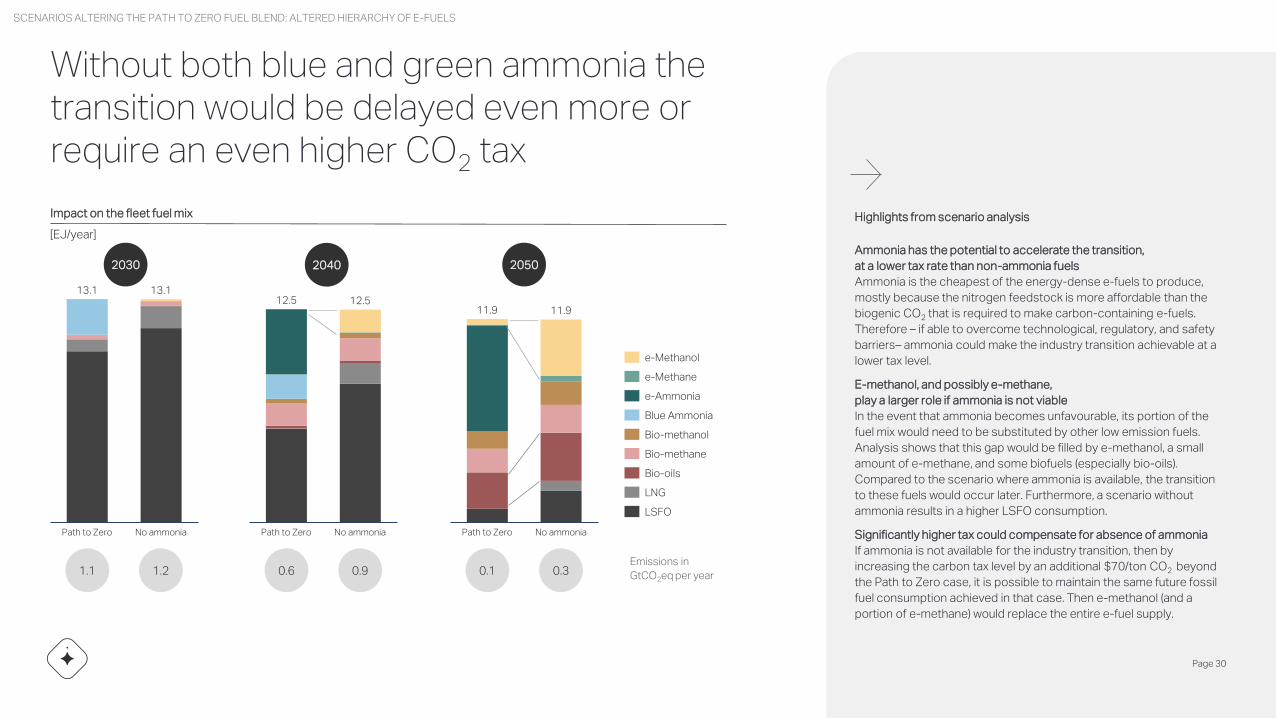
Without both blue and green ammonia the transition would be delayed even more or require an even higher CO2 tax
0
5
10
15
Path to Zero No ammonia
13.113.1
e-Methanol
e-Ammonia
Bio-methanol
e-Methane
Blue Ammonia
Bio-methane
LNG
Bio-oils
LSFO0
5
10
15
12.5
Path to Zero No ammonia
12.5
0
5
10
15
Path to Zero
11.9
No ammonia
11.9
Ammonia has the potential to accelerate the transition,
at a lower tax rate than non-ammonia fuels
Ammonia is the cheapest of the energy-dense e-fuels to produce,
mostly because the nitrogen feedstock is more affordable than the
biogenic CO2 that is required to make carbon-containing e-fuels.
Therefore – if able to overcome technological, regulatory, and safety
barriers– ammonia could make the industry transition achievable at a
lower tax level.
E-methanol, and possibly e-methane,
play a larger role if ammonia is not viable
In the event that ammonia becomes unfavourable, its portion of the
fuel mix would need to be substituted by other low emission fuels.
Analysis shows that this gap would be filled by e-methanol, a small
amount of e-methane, and some biofuels (especially bio-oils).
Compared to the scenario where ammonia is available, the transition
to these fuels would occur later. Furthermore, a scenario without
ammonia results in a higher LSFO consumption.
Significantly higher tax could compensate for absence of ammonia
If ammonia is not available for the industry transition, then by
increasing the carbon tax level by an additional $70/ton CO2 beyond
the Path to Zero case, it is possible to maintain the same future fossil
fuel consumption achieved in that case. Then e-methanol (and a
portion of e-methane) would replace the entire e-fuel supply.
Highlights from scenario analysisImpact on the fleet fuel mix
[EJ/year]
2040 20502030
1.1 1.2 0.6 0.9 0.1 0.3Emissions in
GtCO2eq per year
SCENARIOS ALTERING THE PATH TO ZERO FUEL BLEND: ALTERED HIERARCHY OF E-FUELS
Page 30

Prohibitive DAC cost developments in near future mean biogenic CO2 sources are the source of carbon for carbon-based e-fuels
0
20
40
60
80
100
120
140
160
180
200
220
240
260
280
300
320
340
20302025 2045 20502020 2035 2040
DAC CO2
PS CO2
CO2 is costly for carbon-based e-fuels
The cost of CO2 will significantly contribute to the cost of e-methanol and e-methane – even with decreasing prices for both biogenic point source (PS) CO2 and direct air capture (DAC) CO2.
For one ton of methanol, ~1.5 ton of CO2 is needed, resulting in an additional cost of USD 75-180 per ton of methanol in 2050.
The availability of PS CO2 may be limited by competing demand from other industries.
If CCS and carbon trading are recognized by regulatory bodies, then there may be high demand for PS CO2, for the purpose of offsetting. In that scenario, the carbon tax/credit level could set the market price of CO2– making carbon fuels even costlier.
Cost of CO2 (biogenic point source or direct air capture) in USD/tCO2
SCENARIOS ALTERING THE PATH TO ZERO FUEL BLEND: ALTERED HIERARCHY OF E-FUELS
Page 31
07
08
16
17
22
26
32
Agenda
Executive summary
A Path to Zero
Scenarios altering the Path to Zero fuel blend
Biofuels availability
Effect of renewable electricity cost on green / blue fuels
Altered hierarchy of e-fuels
Appendix
32
34
38
40
46
51
57
Appendix
NavigaTE Model Assumptions
Critical Levers
Biofuel Supply Constraints
Renewable Energy Cost and Availability
Vessel Considerations
Supporting data
Agenda

NavigaTE Model Assumptions
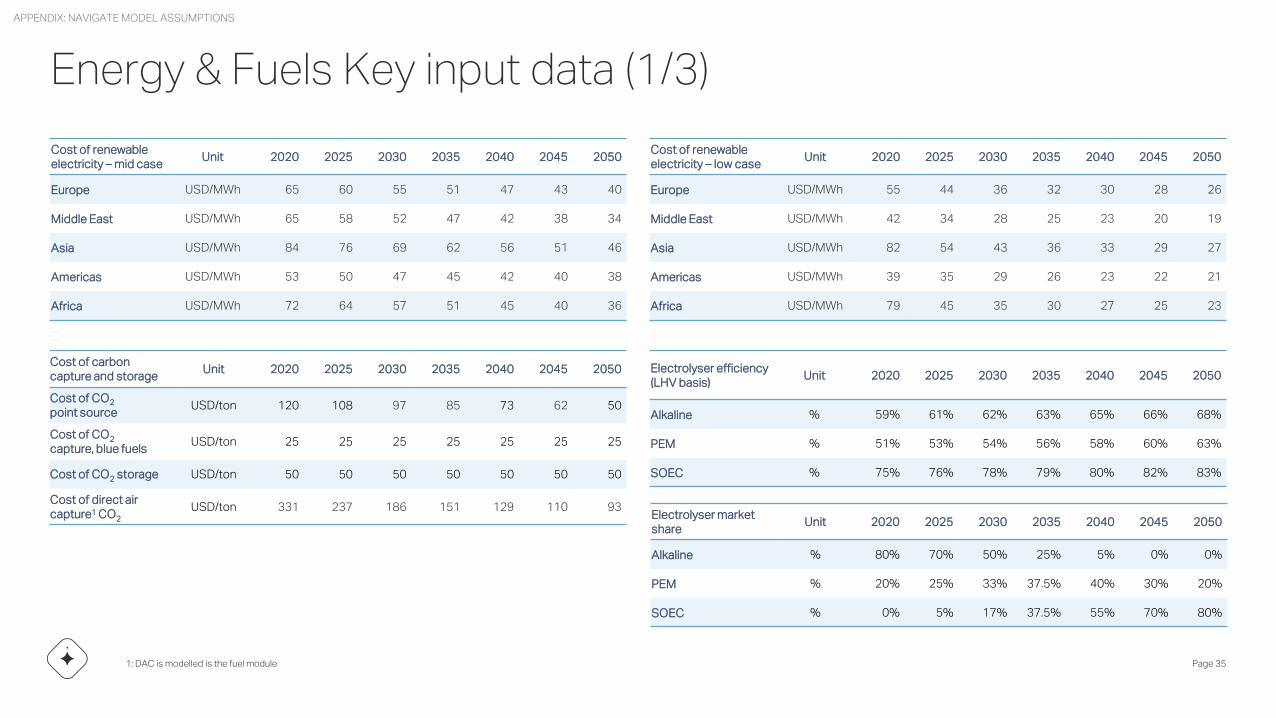
Energy & Fuels Key input data (1/3)
1: DAC is modelled is the fuel module Page 35
Cost of renewable electricity – mid case
Unit 2020 2025 2030 2035 2040 2045 2050
Europe USD/MWh 65 60 55 51 47 43 40
Middle East USD/MWh 65 58 52 47 42 38 34
Asia USD/MWh 84 76 69 62 56 51 46
Americas USD/MWh 53 50 47 45 42 40 38
Africa USD/MWh 72 64 57 51 45 40 36
Cost of renewable electricity – low case
Unit 2020 2025 2030 2035 2040 2045 2050
Europe USD/MWh 55 44 36 32 30 28 26
Middle East USD/MWh 42 34 28 25 23 20 19
Asia USD/MWh 82 54 43 36 33 29 27
Americas USD/MWh 39 35 29 26 23 22 21
Africa USD/MWh 79 45 35 30 27 25 23
Cost of carboncapture and storage
Unit 2020 2025 2030 2035 2040 2045 2050
Cost of CO2
point sourceUSD/ton 120 108 97 85 73 62 50
Cost of CO2
capture, blue fuelsUSD/ton 25 25 25 25 25 25 25
Cost of CO2 storage USD/ton 50 50 50 50 50 50 50
Cost of direct air capture1 CO2
USD/ton 331 237 186 151 129 110 93Electrolyser market share
Unit 2020 2025 2030 2035 2040 2045 2050
Alkaline % 80% 70% 50% 25% 5% 0% 0%
PEM % 20% 25% 33% 37.5% 40% 30% 20%
SOEC % 0% 5% 17% 37.5% 55% 70% 80%
Electrolyser efficiency (LHV basis)
Unit 2020 2025 2030 2035 2040 2045 2050
Alkaline % 59% 61% 62% 63% 65% 66% 68%
PEM % 51% 53% 54% 56% 58% 60% 63%
SOEC % 75% 76% 78% 79% 80% 82% 83%
APPENDIX: NAVIGATE MODEL ASSUMPTIONS
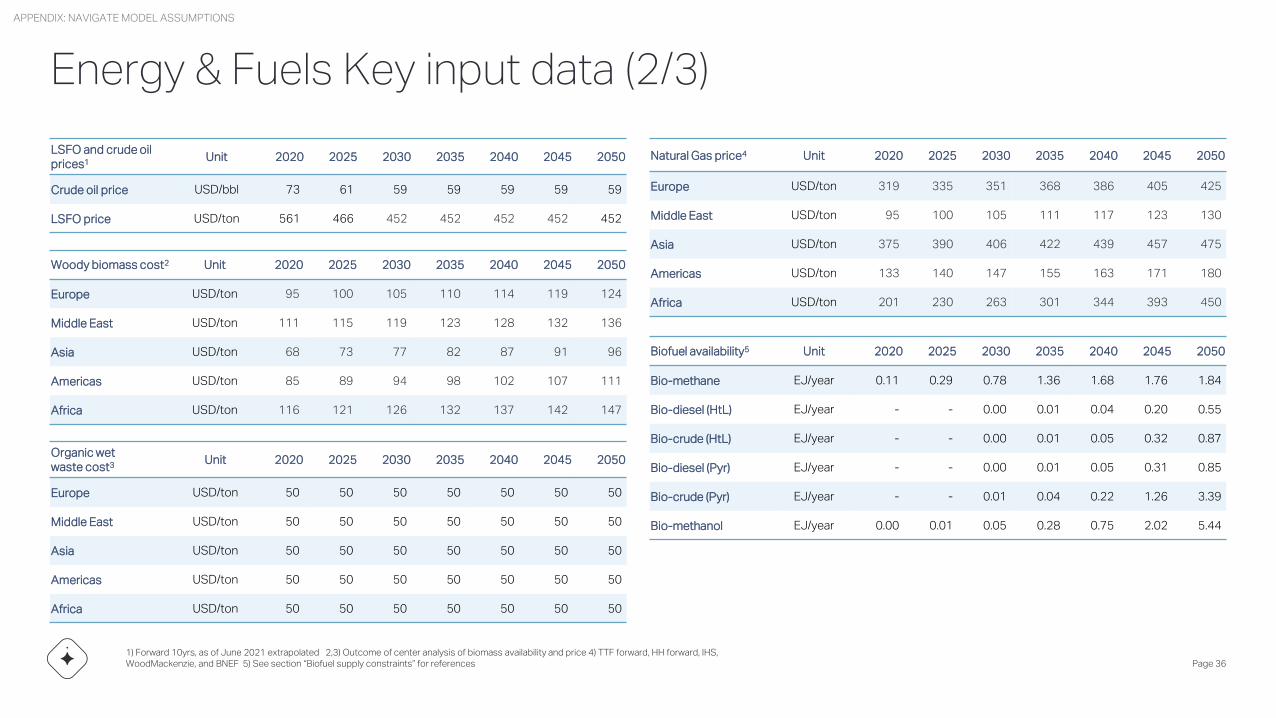
Energy & Fuels Key input data (2/3)
1) Forward 10yrs, as of June 2021 extrapolated 2,3) Outcome of center analysis of biomass availability and price 4) TTF forward, HH forward, IHS, WoodMackenzie, and BNEF 5) See section “Biofuel supply constraints” for references Page 36
LSFO and crude oil prices1 Unit 2020 2025 2030 2035 2040 2045 2050
Crude oil price USD/bbl 73 61 59 59 59 59 59
LSFO price USD/ton 561 466 452 452 452 452 452
Natural Gas price4 Unit 2020 2025 2030 2035 2040 2045 2050
Europe USD/ton 319 335 351 368 386 405 425
Middle East USD/ton 95 100 105 111 117 123 130
Asia USD/ton 375 390 406 422 439 457 475
Americas USD/ton 133 140 147 155 163 171 180
Africa USD/ton 201 230 263 301 344 393 450
Woody biomass cost2 Unit 2020 2025 2030 2035 2040 2045 2050
Europe USD/ton 95 100 105 110 114 119 124
Middle East USD/ton 111 115 119 123 128 132 136
Asia USD/ton 68 73 77 82 87 91 96
Americas USD/ton 85 89 94 98 102 107 111
Africa USD/ton 116 121 126 132 137 142 147
Organic wetwaste cost3 Unit 2020 2025 2030 2035 2040 2045 2050
Europe USD/ton 50 50 50 50 50 50 50
Middle East USD/ton 50 50 50 50 50 50 50
Asia USD/ton 50 50 50 50 50 50 50
Americas USD/ton 50 50 50 50 50 50 50
Africa USD/ton 50 50 50 50 50 50 50
Biofuel availability5 Unit 2020 2025 2030 2035 2040 2045 2050
Bio-methane EJ/year 0.11 0.29 0.78 1.36 1.68 1.76 1.84
Bio-diesel (HtL) EJ/year - - 0.00 0.01 0.04 0.20 0.55
Bio-crude (HtL) EJ/year - - 0.00 0.01 0.05 0.32 0.87
Bio-diesel (Pyr) EJ/year - - 0.00 0.01 0.05 0.31 0.85
Bio-crude (Pyr) EJ/year - - 0.01 0.04 0.22 1.26 3.39
Bio-methanol EJ/year 0.00 0.01 0.05 0.28 0.75 2.02 5.44
APPENDIX: NAVIGATE MODEL ASSUMPTIONS

Energy & Fuels Key input data (3/3)
1) IPCC report 5 methane emission factors used: 28 gCO2eq/MJ for 100y 2,3,4) Sphera 2021: 2nd Life Cycle GHG Emission Study on the Use of LNG as Marine Fuel5) Sphera 2021 + partner & industry dialogue setting methane leak in production today at 1.4%, reducible by 90% by 2050 Page 37
Well-to-tank methane slip GHG potential (100y)1
Unit 2020 2025 2030 2035 2040 2045 2050
LNG2 gCO2eq/MJ 4.5 4.5 4.5 4.5 4.5 4.5 4.5
Blue ammonia3 gCO2eq/MJ 2,4 2,4 2,4 2,4 2,4 2,4 2,4
E-methane4 gCO2eq/MJ 1 1 1 1 1 1 1
Bio-methane5 gCO2eq/MJ 9,0 7,7 6,5 5,2 4,0 2,7 1,5
LSFO and LNG price, scenarios
Unit 2020 2025 2030 2035 2040 2045 2050
Crude oil, baseline USD/bbl 73 61 59 59 59 59 59
LSFO, baseline USD/GJ 13.2 10.9 10.6 10.6 10.6 10.6 10.6
LSFO, low USD/GJ 13.2 9.0 7.9 6.9 5.8 4.7 3.6
LSFO, high USD/GJ 13.2 10.9 13.2 14.3 15.4 16.3 17.2
LNG, baseline USD/GJ 8.2 8.2 8.3 8.4 8.5 8.6 8.8
LNG, low USD/GJ 8.2 6.8 6.2 5.4 4.6 3.8 3.0
LNG, high USD/GJ 8.2 8.2 10.3 11.3 12.3 13.2 14.2
APPENDIX: NAVIGATE MODEL ASSUMPTIONS

Critical Levers
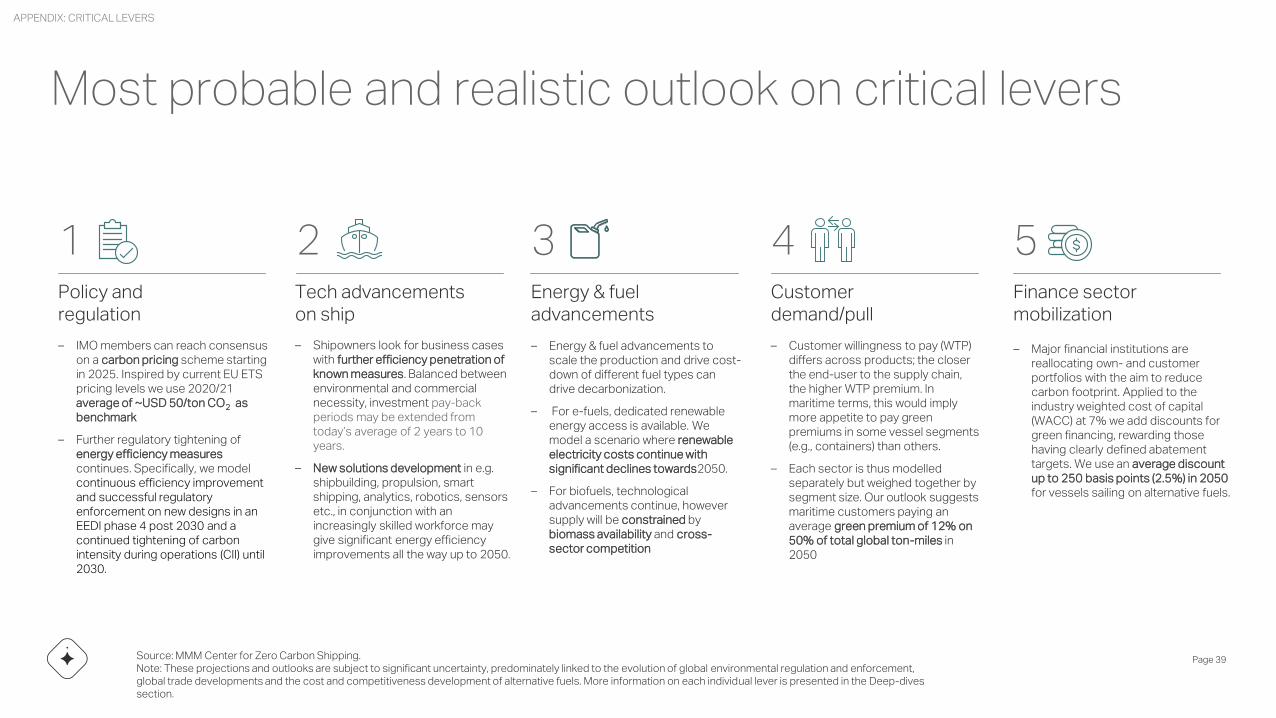
Most probable and realistic outlook on critical levers
Page 39
– IMO members can reach consensus on a carbon pricing scheme starting in 2025. Inspired by current EU ETS pricing levels we use 2020/21 average of ~USD 50/ton CO2 as benchmark
– Further regulatory tightening of energy efficiency measures continues. Specifically, we model continuous efficiency improvement and successful regulatory enforcement on new designs in an EEDI phase 4 post 2030 and a continued tightening of carbon intensity during operations (CII) until 2030.
Policy andregulation
Tech advancements on ship
Energy & fuel advancements
Customer demand/pull
Finance sector mobilization
– Shipowners look for business cases with further efficiency penetration of known measures. Balanced between environmental and commercial necessity, investment pay-back periods may be extended from today’s average of 2 years to 10 years.
– New solutions development in e.g. shipbuilding, propulsion, smart shipping, analytics, robotics, sensors etc., in conjunction with an increasingly skilled workforce may give significant energy efficiency improvements all the way up to 2050.
– Energy & fuel advancements to scale the production and drive cost-down of different fuel types can drive decarbonization.
– For e-fuels, dedicated renewable energy access is available. We model a scenario where renewable electricity costs continue with significant declines towards2050.
– For biofuels, technological advancements continue, however supply will be constrained by biomass availability and cross-sector competition
– Customer willingness to pay (WTP) differs across products; the closer the end-user to the supply chain, the higher WTP premium. In maritime terms, this would imply more appetite to pay green premiums in some vessel segments (e.g., containers) than others.
– Each sector is thus modelled separately but weighed together by segment size. Our outlook suggests maritime customers paying an average green premium of 12% on 50% of total global ton-miles in 2050
– Major financial institutions are reallocating own- and customer portfolios with the aim to reduce carbon footprint. Applied to the industry weighted cost of capital (WACC) at 7% we add discounts for green financing, rewarding those having clearly defined abatement targets. We use an average discount up to 250 basis points (2.5%) in 2050 for vessels sailing on alternative fuels.
1 2 3 4 5
Source: MMM Center for Zero Carbon Shipping. Note: These projections and outlooks are subject to significant uncertainty, predominately linked to the evolution of global environmental regulation and enforcement, global trade developments and the cost and competitiveness development of alternative fuels. More information on each individual lever is presented in the Deep-dives section.
APPENDIX: CRITICAL LEVERS
Biofuel Supply Constraints

We have identified 3 main constraints for the supply of biofuels for the maritime industry
Page 41
Availability ofsustainable biomass
Maximum throughputof biofuel value chains
Competition for biomass andbiofuels between industries
– A limited amount of biomass can be
sourced for biofuels without
compromising sustainability, food
production and biodiversity
– This sets a maximum volume of biofuels
available for all industries
– Most biofuel value chains are still
immature
– Rapid scaling is needed to support
decarbonation of the global industries
– The speed of scaling will determine the
timing of biofuel availability
– Many global industries are decarbonizing
towards 2050
– This creates competition for sustainable
biomass and biofuels
– This may limit the availability of biofuels for
shipping
APPENDIX: BIOFUEL SUPPLY CONSTRAINTS

Maximum biofuel supply is limited by the amount of sustainable biomass
1) Chum et al (2011)≈ 100-300; Lauri et al (2014 ≈ 165; IEA (2017) ≈ 145; Wenzel et al (2014) ≈180; NREL (2021) ≈ 160-1802) Split of biomass from internal center study Page 42
Availability of
sustainable
biomass
Global maximum biofuel supply is limited by the
amount of sustainable biomass suitable for the
conversion technology
– Availability is debated among scientists, but we
see 150-200 EJ sustainable biomass available1
– Energy crops is left out from the analysis, due to their
debatable sustainability from land use, resulting in 120 EJ
– Individual biomass pathways have different suitable
biomass, which defines their maximum supply
– Only biomass within 80 km of an existing gas grid is
deemed suitable for bio-methane, due to the cost of
laying new pipelines. Access to liquefaction and
certificate scheme will be required.
Maximum
throughput of
biofuel value chains
Competition for
biomass and biofuels
between industries
33 EJWood & residues
61 EJAgricultural waste
33 EJWet waste, oils & manure
73 EJEnergy crops
FP oil94 EJ suitable biomass
HTL oil127 EJ suitable biomass
FP crude94 EJ suitable biomass
Bio Methanol127 EJ suitable biomass
Bio-methane38 EJ suitable biomass
HTL Crude127 EJ suitable biomass
Sustainable biomass, globally2
200 EJ
Biomass within 80 km of an existing gas grid
is deemed suitable for bio-methane
APPENDIX: BIOFUEL SUPPLY CONSTRAINTS

Supply of the value chains limited by maximum roll-out speed of conversion plants
1) Projected 3 plants at 100kton/yr in 2030 2) Projected 2 plants at 80/yr in 2030 3) IRENA / ETSAP 4) Combined current production of Ensyn, Empyro, Savon Voima and Green fuel Nordic in 2020 5) Projected 3 plants at 70kton/yr in 2030 6) IEA bio-methane forecast 7) US Biodiesel followed logarithmic growth by formula 10^(log(x)+0,152). This is the highest growth observed, between Global ethanol (0,086), Global biodiesel (0,110), Latin America ethanol (0,027) and EU Biodiesel (0,130). Page 43
Maximum supply of the value chains limited by
maximum roll-out speed of conversion plants
The supply for shipping is limited by how fast supply chains can be scaled.
We deem that the rate limiting step in all value chains is the construction of
new conversion plants. The scaling rate can be split into two phases:
Phase 1: Restricted by technical immaturity (<TRL 9)
When technologies are immature, conversion plants will not be built in high
numbers and large scale due to technical risk – supply is greatly limited.
Phase 2: Restricted by maximum roll-out of conversion plants
Recently matured technologies will roll-out slowly due to remaining
commercial risk, and limited suppliers. When assessing historical roll-out
speeds of biofuels that are technical and commercial mature and granted
government support, these followed exponential growth until reaching a
maximum limit, thus forming an S-curve. In our outlook we simulate a fast
roll-out of the first projects by using the fastest growth rate observed,
that of US Biodiesel from 2003-20167. This bounds the initial roll-out from
0-5% to the maximum potential. To represent a slower global roll-out
after 5%, the growth rate of global ethanol from 2003-20167 was used
from 5%-100%.
2020
FPoil5
HTLoil2
FPcrude4
Bio Methanol3
HTL Crude1
Bio-methane6
20502030 2040
<TRL97
PJMaximum supply grows exponentially
<TRL910PJ
Maximum supply grows exponentially
<TRL99
PJMaximum supply grows exponentially
1 PJ
Maximum supply grows exponentially
<TRL910 PJ
Maximum supply grows exponentially
1.3 EJ
Maximum supply grows exponentially & reaches plateau governed by supply constraints on suitable biomass
Availability of
sustainable
biomass
Maximum
throughput of
biofuel value chains
Competition for
biomass and biofuels
between industries
APPENDIX: BIOFUEL SUPPLY CONSTRAINTS

Biofuel supply for the maritime industry is approximated by biofuel competition with other industries
1) Results of the “Biomass availability study” conducted by the center, Maersk and University of Southern Denmark. Page 44
Maximum fraction of biofuel supply for the
maritime industry is approximated by biofuel
competition with other industries
To simulate competition with other industries, we set a maximum supply
of biofuels which the maritime industry could obtain. The maximum
biofuel supply for shipping was set to 16% of a maximum sustainable
biofuel supply. The 16% fraction stems from shipping capturing twice
as much biofuels as their current fraction of the global non-electrifiable
energy demand (average of low and high scenario - see table on the
right). This is achievable if the maritime industry takes a first mover role
into biofuels, is facing higher willingness to pay, or faces stronger
regulatory incentives than the other industries with non-electrifiable
energy demands.
One exception to this is for bio-methane where 8% was used instead of
16. Drivers that could push the maritime industry to reach a higher
fraction of bio-methane than its relative need may be counteracted by
the higher cost of maritime use due to the requirement for liquefaction,
the loss of methane and additional emissions from methane slip.
Low scenario High scenario
Shipping Up to 20 Up to 20
Plastics 60 120
Peak heating 30 50
Buildings 30 40
Industry 20 40
Aviation 15 20
Cement 0 30
Electricity balancing 10 20
Steel 5 20
Road transport 5 10
Total 175 370
Demand for carbon-based fuels [EJ]1
5-11%of total
Availability of
sustainable
biomass
Maximum
throughput of
biofuel value chains
Competition for
biomass and biofuels
between industries
APPENDIX: BIOFUEL SUPPLY CONSTRAINTS

Biomethane
HTL oilFP oil
FP blend grade
Biomethanol
0
2
4
6
8
10
12
14
16
2020 2025 2030 2035 2040 2045 2050 2055
Based on this analysis, bio-methane could reach significant supply for the maritime industry before 2030 – other biofuels from 2040
1) Assuming 200 EJ of sustainable biomass available globally and an energy conversion of 60%. 2) Based on internal study identifying the amount biomass needed to cover the non-electrifiable energy need of global sectors. Sectors (EJ): Shipping (30), Aviation (30), Road transport (30), Electricity balancing (30), Peak load heating (50), Industry (50), Plastic (90), Cement (30), Steel (20). 3) Maximum supply of 2nd generation FAME/HVO for shipping assessed to 0.2 EJ / 2% of shipping's energy demand. See appendix for documentation Page 45
– Bio-methane is available today and is scalable to supply 6% of the fleet in 2030 - maximum
supply limitations may be reached at 10% of the maritime industry’s energy demand
– Bio-methanol is in limited supply today and could scale to supply 2% of fleets energy need in
2035 (0.3 EJ), and 40% in 2050
– Bio-oils could reach scales able to impact >1% of the fleet fuel mix from 2040:
– FP crude is available in very limited supply today, but could scale faster than the other bio-
oils, thus reaching 1.5% of fleets energy need in 2040 (0.2 EJ) and 25% EJ in 2050 (3 EJ)
– The remaining bio-oils, FP oil and HTL oil and crude, could start scaling near 2030 when
technical maturity is reached and then reach 2% of the fleets energy needs in 2045 (0.3
EJ) and 6% in 2050 (0.8 EJ), individually
– FAME & HVO have been excluded in the first version of the position paper due to low supply
of waste feedstocks3 and the debatable sustainability of food-based bio-fuels
Maritime total fuel demand, modelled in various scenarios
Highlights from supply analysis
[EJ/year]
Maximum supply constraints of biofuels for shipping
APPENDIX: BIOFUEL SUPPLY CONSTRAINTS
Renewable Energy Costand Availability
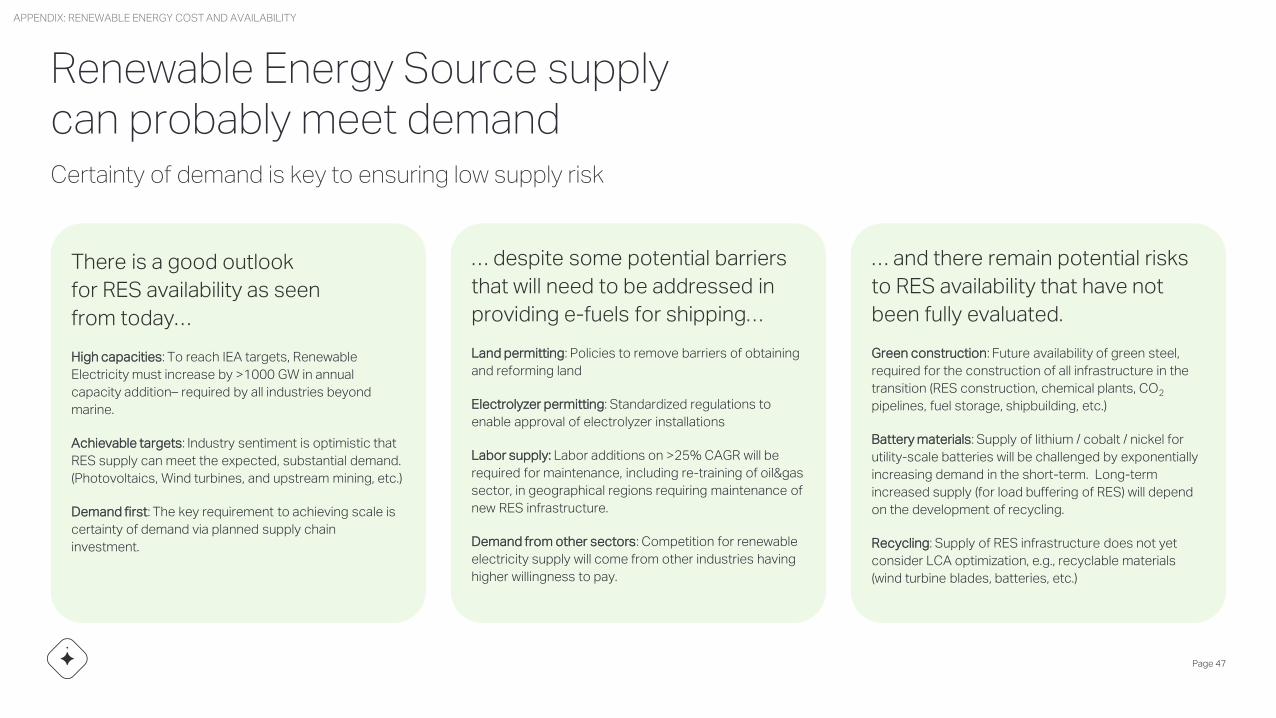
Renewable Energy Source supply can probably meet demand
Page 47
There is a good outlook
for RES availability as seen
from today…
High capacities: To reach IEA targets, Renewable
Electricity must increase by >1000 GW in annual
capacity addition– required by all industries beyond
marine.
Achievable targets: Industry sentiment is optimistic that
RES supply can meet the expected, substantial demand.
(Photovoltaics, Wind turbines, and upstream mining, etc.)
Demand first: The key requirement to achieving scale is
certainty of demand via planned supply chain
investment.
… despite some potential barriers
that will need to be addressed in
providing e-fuels for shipping…
Land permitting: Policies to remove barriers of obtaining
and reforming land
Electrolyzer permitting: Standardized regulations to
enable approval of electrolyzer installations
Labor supply: Labor additions on >25% CAGR will be
required for maintenance, including re-training of oil&gas
sector, in geographical regions requiring maintenance of
new RES infrastructure.
Demand from other sectors: Competition for renewable
electricity supply will come from other industries having
higher willingness to pay.
… and there remain potential risks
to RES availability that have not
been fully evaluated.
Green construction: Future availability of green steel,
required for the construction of all infrastructure in the
transition (RES construction, chemical plants, CO2
pipelines, fuel storage, shipbuilding, etc.)
Battery materials: Supply of lithium / cobalt / nickel for
utility-scale batteries will be challenged by exponentially
increasing demand in the short-term. Long-term
increased supply (for load buffering of RES) will depend
on the development of recycling.
Recycling: Supply of RES infrastructure does not yet
consider LCA optimization, e.g., recyclable materials
(wind turbine blades, batteries, etc.)
Certainty of demand is key to ensuring low supply risk
APPENDIX: RENEWABLE ENERGY COST AND AVAILABILITY

Background: Defining the Cost of electricity
Page 48
Different definitions of “cost” can potentially confuse the assessmentof renewable energy outlook
Spot prices, Marginal Costs, and Levelized costsDifferent information sources sometimes use varying definitions to “cost”, potentially leading to confusion about the real costs of renewable energy. For the purposes of evaluating electro-fuels production for the marine industry, it is important to keep a realistic view of production costs, especially when forecasting future costs–which may exist in different financial and political circumstances.
Prices versus costsIt is firstly important to distinguish costs from prices. By “cost” in this context, we refer to expense that is required in order to create supply, i.e., production cost. “Price” refers to cost experience by the customer rather than the producer, and it is largely determined by competing customers’ willingness to pay– as well as by policies like subsidies and taxation. Production costs are not necessarily reflected by price, since prices can be affected by temporary situations and by policy.
Marginal production costs / Operating costsMarginal costs are sometimes quoted to emphasize the low costs of renewable electricity. An operating cost is the short-term level of expenses for maintaining ongoing supply– after the initial investment in energy infrastructure. Because it explicitly overlooks capital investment, the operating costs alone are not conducive to making economic comparisons.
Spot pricesThe spot price is the price at which the fuel or electricity can be bought at a specific point of time. Spot prices can change for a variety of reasons, e.g., renewable energy is sometimes discussed as having a very low spot price during hours of peak electricity production. Spot prices, or marginal costs, have low relevance for assessing large-scale electro-fuel production. The maritime industry requires such large scales of electricity that production must effectively use all spot prices– including both low price at peak hours and very high price at off-peak.
Subsidized pricesAlready today, electro-fuels could be made at much lower prices than what is forecast… if government partially subsidizes the production.
Current price levels are sometimes reported with the intent of showcasing affordable technologies. However, the subsidized price of a fuel or electricity is not a sustainable price level to consider, in evaluating the future viability of supply.
Levelized costs In order to comparably evaluate future costs, it is most informative to calculate the levelized cost, which includes all relevant costs to investment decisions– especially including the cost of capital, spread over the years of expected production. Meanwhile, extraneous factors, such as subsidies, are excluded.
By including all major cost contributions, the resulting numbers for can be compared against each other on a rational basis (e.g., wind versus PV or other), to inform about required investments and likely market developments.
LCoE (levelized cost of electricity) best indicates the potential to supply
APPENDIX: RENEWABLE ENERGY COST AND AVAILABILITY

Key Assumptions for Renewable Energy Costs
Page 49
Dedicated electricity infrastructure, off-gridE-fuels for the maritime industry would need to be produced in massive quantities, and in locations suitable for marine supply. Therefore, the maritime industry would require a dedicated supply infrastructure. Despite some P2X overtures that peak hours may provide nearly free cost, the maritime industry could not rely solely on peak hours, since e-fuel production requires full-day operation.
It is assumed electro-fuel production rates must be nearly constantChemical-producing plants are not able to shut-down and start-up daily. Even for hypothetical plant designs which might adapt their loads, a low plant uptime means a longer payback time on investment –for a high CAPEX engineered for peak capacity. Regardless, the economics of production would be significantly worsened due to intermittent operation.
Renewable electricity must also be supplied at constant rateThe aforementioned constraint on e-fuel production means that electricity must also be supplied at a constant rate. Therefore, intermittent power sources will require some form of load balancing, in order to achieve stable and economical plant operation. The practice of buffering– with batteries or other storage– is sometimes called “peak shaving”. We assume costs of RES production that include batteries [See details on supporting slide.]
In the low-cost scenario, the required buffering capacity is assumed to be half of the amount in the medium-cost scenario. 0
5
10
15
20
25
30
35
40
45
50
55
60
65
70
75
80
2020 2025 2030 20402035 2045 2050
Medium-cost scenario
Low-cost scenario
Assumptions for calculating representative costs Cost in USD/MWh for Renewable Electricity with Battery
APPENDIX: RENEWABLE ENERGY COST AND AVAILABILITY

Key Assumptions for Renewable Energy Costs
Page 50
Assumptions forcalculating RES costs
Electricity prices are based on future forecasts, with batteries incorporated for buffering
We used Bloomberg New Energy Finance (BNEF) as a source of forecasts for levelized electricity costs (LCoE). This information resource contains cost estimates of renewables energy sources combined with batteries, for multiple countries and for all years to 2050.
For certain countries that did not have battery costs included in the renewable electricity cost estimate, a scaling factor was applied in order to approximate the cost that would include batteries. This scaling factor is based on the global average ratio. On average for our medium-cost scenario, adding battery cost to photovoltaics results in 2.3x of the base cost; whereas for wind power, it results in 1.5x of base cost.
Best technology chosen per region
The renewable energy costs were analyzed for both wind power and photovoltaic power. While each region might use either power source or a combination of both, we assume that the lower cost power option is chosen first. An associated assumption is that combined energy parks (PV + wind) would be designed economically, so that the marginal addition of the more expensive option would not increase the average electricity cost.
For displaying a global average, we choose a weighted average of the 5 regions 40/30/10/10/10, with highest weighting to the lowest cost region.
Country estimates converted to Region estimates
The NavigaTE model uses 5 geographical regions.For each region, it is assumed that the renewable electricity cost can be represented by the median of all constituent countries. The median is preferable to the mean because it more closely represents the lower-cost countries by excluding the most expensive regions which are outliers.
0
20
40
60
80
100
2020 2025 2030 2035 2040 2045 2050
EuropeMiddle EastAsia PacificAmericasAfrica
Cost development in USD/MWh for RES + Battery, by region
Low-cost scenario illustrated
APPENDIX: RENEWABLE ENERGY COST AND AVAILABILITY

Vessel Considerations
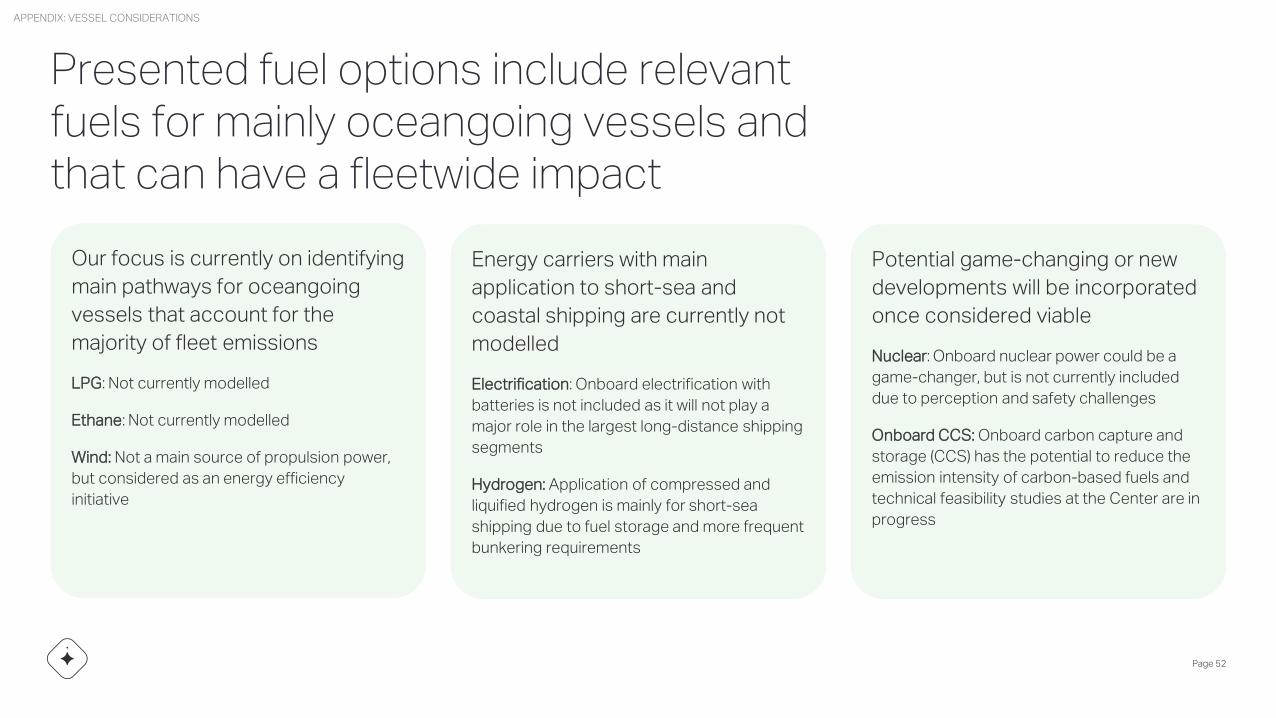
Presented fuel options include relevant fuels for mainly oceangoing vessels and that can have a fleetwide impact
Page 52
Our focus is currently on identifying
main pathways for oceangoing
vessels that account for the
majority of fleet emissions
LPG: Not currently modelled
Ethane: Not currently modelled
Wind: Not a main source of propulsion power,
but considered as an energy efficiency
initiative
Energy carriers with main
application to short-sea and
coastal shipping are currently not
modelled
Electrification: Onboard electrification with
batteries is not included as it will not play a
major role in the largest long-distance shipping
segments
Hydrogen: Application of compressed and
liquified hydrogen is mainly for short-sea
shipping due to fuel storage and more frequent
bunkering requirements
Potential game-changing or new
developments will be incorporated
once considered viable
Nuclear: Onboard nuclear power could be a
game-changer, but is not currently included
due to perception and safety challenges
Onboard CCS: Onboard carbon capture and
storage (CCS) has the potential to reduce the
emission intensity of carbon-based fuels and
technical feasibility studies at the Center are in
progress
APPENDIX: VESSEL CONSIDERATIONS
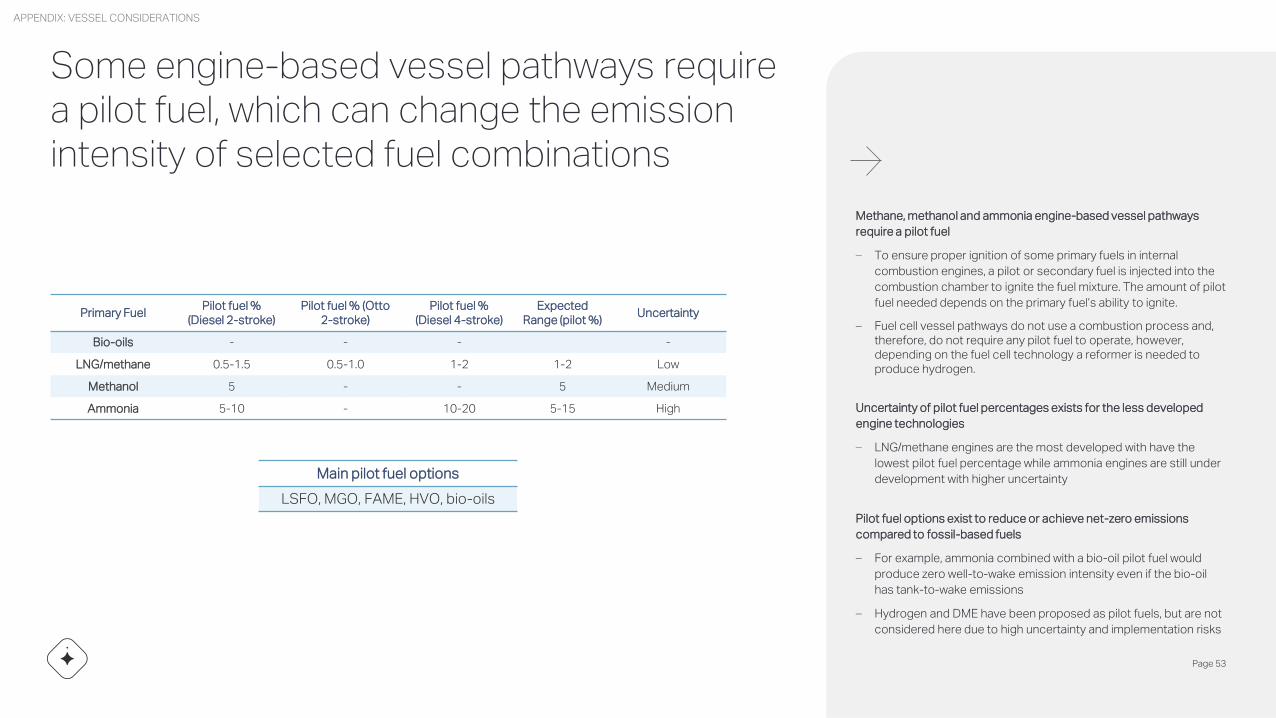
Some engine-based vessel pathways require a pilot fuel, which can change the emission intensity of selected fuel combinations
Primary FuelPilot fuel %
(Diesel 2-stroke)Pilot fuel % (Otto
2-stroke)Pilot fuel %
(Diesel 4-stroke)Expected
Range (pilot %)Uncertainty
Bio-oils - - - -
LNG/methane 0.5-1.5 0.5-1.0 1-2 1-2 Low
Methanol 5 - - 5 Medium
Ammonia 5-10 - 10-20 5-15 High
Methane, methanol and ammonia engine-based vessel pathways
require a pilot fuel
– To ensure proper ignition of some primary fuels in internal
combustion engines, a pilot or secondary fuel is injected into the
combustion chamber to ignite the fuel mixture. The amount of pilot
fuel needed depends on the primary fuel’s ability to ignite.
– Fuel cell vessel pathways do not use a combustion process and, therefore, do not require any pilot fuel to operate, however, depending on the fuel cell technology a reformer is needed to produce hydrogen.
Uncertainty of pilot fuel percentages exists for the less developed
engine technologies
– LNG/methane engines are the most developed with have the
lowest pilot fuel percentage while ammonia engines are still under
development with higher uncertainty
Pilot fuel options exist to reduce or achieve net-zero emissions
compared to fossil-based fuels
– For example, ammonia combined with a bio-oil pilot fuel would
produce zero well-to-wake emission intensity even if the bio-oil
has tank-to-wake emissions
– Hydrogen and DME have been proposed as pilot fuels, but are not
considered here due to high uncertainty and implementation risks
Main pilot fuel options
LSFO, MGO, FAME, HVO, bio-oils
APPENDIX: VESSEL CONSIDERATIONS
Page 53

Vessel fuel flexibility via newbuild preparation, fuel conversion and dual-fuel engine configurations allow for multiple fuel pathways
1) Bio-oil-Ready requires less preparation compared to Methanol-Ready and Ammonia-Ready, which are much more extensive Source: DNV “Maritime Forecast to 2050: Energy Transition Outlook 2021”
Newbuild preparation can be beneficial
depending on the conversion timeline
– Preparation for alternative fuel options at the newbuild phase can
maximize flexibility while minimizing risk and future conversion
costs
Fuel conversion will be possible even without newbuild preparation
– To avoid the risk of stranded assets, conversion to methanol or
ammonia will be possible, however, complexity and cost is
uncertain
Dual-fuel LNG configurations can provide flexibility
– In addition to the potential to convert to ammonia or methanol,
LNG dual-fuel configurations also allow for drop-in usage of bio-
or e-methane
– Investment cost, total lifecycle emissions, and flexibility to be
considered when making vessel decisions
Methanol-Ready
Mono-Fuel(LSFO/MGO)
Available Alternative Fuel Options
Ammonia-Ready
Dual-Fuel LNG(LSFO/MGO + LNG)
Bio-oils
Conversion
MethanolAmmonia
MethaneMethanolAmmonia
Bio-oil-Ready1
Bio-oils
Bio-oil-Ready1
Methanol-Ready
Ammonia-Ready
Conversion
Dual-Fuel Methanol(LSFO/MGO + Methanol)
Methanol
Bio-oil-Ready1
Bio-oils
Ammonia-Ready
Ammonia
Conversion
APPENDIX: VESSEL CONSIDERATIONS
Page 54
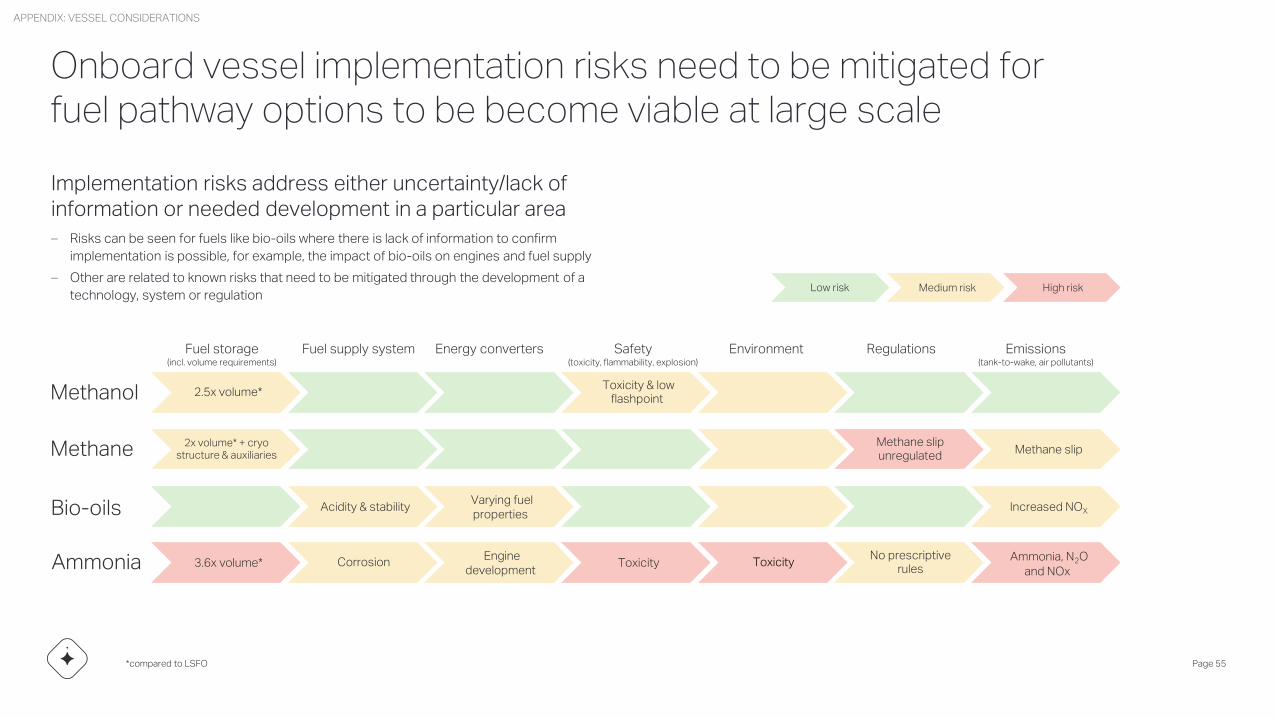
Onboard vessel implementation risks need to be mitigated for fuel pathway options to be become viable at large scale
*compared to LSFO Page 55
Methane
Fuel storage (incl. volume requirements)
Fuel supply system Energy converters Safety(toxicity, flammability, explosion)
Environment
2x volume* + cryostructure & auxiliaries
Methane slip unregulated
Methane slip
Regulations Emissions(tank-to-wake, air pollutants)
Bio-oils Acidity & stabilityVarying fuel properties
Increased NOX
Methanol 2.5x volume*Toxicity & low
flashpoint
Ammonia 3.6x volume* CorrosionEngine
developmentToxicity Toxicity
No prescriptive rules
Ammonia, N2O and NOx
Implementation risks address either uncertainty/lack of information or needed development in a particular area
– Risks can be seen for fuels like bio-oils where there is lack of information to confirm
implementation is possible, for example, the impact of bio-oils on engines and fuel supply
– Other are related to known risks that need to be mitigated through the development of a
technology, system or regulation Low risk Medium risk High risk
APPENDIX: VESSEL CONSIDERATIONS
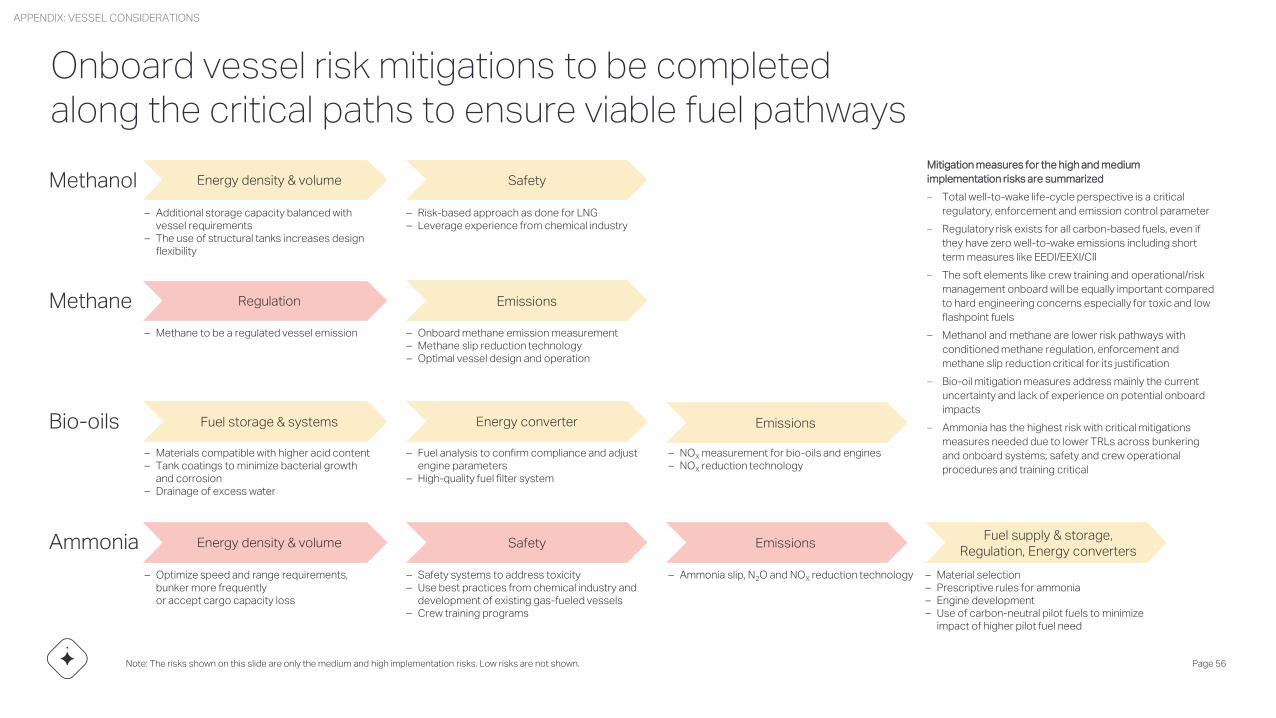
Onboard vessel risk mitigations to be completed along the critical paths to ensure viable fuel pathways
Note: The risks shown on this slide are only the medium and high implementation risks. Low risks are not shown. Page 56
Methane
– Methane to be a regulated vessel emission – Onboard methane emission measurement– Methane slip reduction technology– Optimal vessel design and operation
Regulation Emissions
Bio-oils
– Materials compatible with higher acid content– Tank coatings to minimize bacterial growth
and corrosion– Drainage of excess water
– Fuel analysis to confirm compliance and adjust engine parameters
– High-quality fuel filter system
Fuel storage & systems Energy converter
– NOX measurement for bio-oils and engines – NOX reduction technology
Emissions
Methanol
– Additional storage capacity balanced with vessel requirements
– The use of structural tanks increases design flexibility
– Risk-based approach as done for LNG– Leverage experience from chemical industry
Energy density & volume Safety
Ammonia
– Optimize speed and range requirements, bunker more frequentlyor accept cargo capacity loss
– Safety systems to address toxicity– Use best practices from chemical industry and
development of existing gas-fueled vessels– Crew training programs
Energy density & volume Safety
– Ammonia slip, N2O and NOX reduction technology
Emissions
– Material selection– Prescriptive rules for ammonia– Engine development– Use of carbon-neutral pilot fuels to minimize
impact of higher pilot fuel need
Fuel supply & storage,Regulation, Energy converters
Mitigation measures for the high and medium
implementation risks are summarized
– Total well-to-wake life-cycle perspective is a critical
regulatory, enforcement and emission control parameter
– Regulatory risk exists for all carbon-based fuels, even if
they have zero well-to-wake emissions including short
term measures like EEDI/EEXI/CII
– The soft elements like crew training and operational/risk
management onboard will be equally important compared
to hard engineering concerns especially for toxic and low
flashpoint fuels
– Methanol and methane are lower risk pathways with
conditioned methane regulation, enforcement and
methane slip reduction critical for its justification
– Bio-oil mitigation measures address mainly the current
uncertainty and lack of experience on potential onboard
impacts
– Ammonia has the highest risk with critical mitigations
measures needed due to lower TRLs across bunkering
and onboard systems; safety and crew operational
procedures and training critical
APPENDIX: VESSEL CONSIDERATIONS

Supporting data

Ammonia is the cheapest e-fuel and the only relevant blue fuel. Without ammonia, other e-fuels may play a larger role.
1: LSFO equivalent (1 ton LSFO equals ~42 GJ of energy) 2) Low-cost RES scenario.
0
10
20
30
40
50
60
70
80
90
2020
500
205020352025
4,000
2030 2040 2045
1,000
1,500
2,000
2,500
3,000
3,500
e-Methanol (DAC)
e-Methane (PS)
e-Ammonia
e-Methanol (PS)
E-fuels share a similar cost decrease due to declining electricity cost
The projected e-fuel costs depend similarly on the decreasing cost
of renewable electricity prices. Extra cost differences are due to CO2
costs and potential technology optimizations (in the case of e-
Diesel).
Ammonia is the least costly energy-dense e-fuel
Ammonia is made from N2 feedstock, which is readily available and
cheaper to obtain than the CO2 that is needed for carbon-based
fuels. However, ammonia has slightly lower energy density than the
carbon-containing options, and it faces significant safety and
regulatory hurdles.
E-Methanol and e-methane are produced with similar costsBetween the two options, methanol is slightly less expensive to produce, but e-methane costs declines more quickly because the electrolyzer + plant give more potential to optimize efficiency. Because e-methane and e-methanol are so close in cost, their relative usage will depend on each ship’s design, operation, and route: e-Methane requires cryogenic storage, whereas e-methanol is less energy-dense. All considered, e-methanol is more likely to be the more cost-effective option, although e-methane may still find niche use.
Cost2 in USD/GJ (left) and USD/tLSFOe1 (right) for the cheapest e-fuels
APPENDIX: SUPPORTING DATA
Page 58
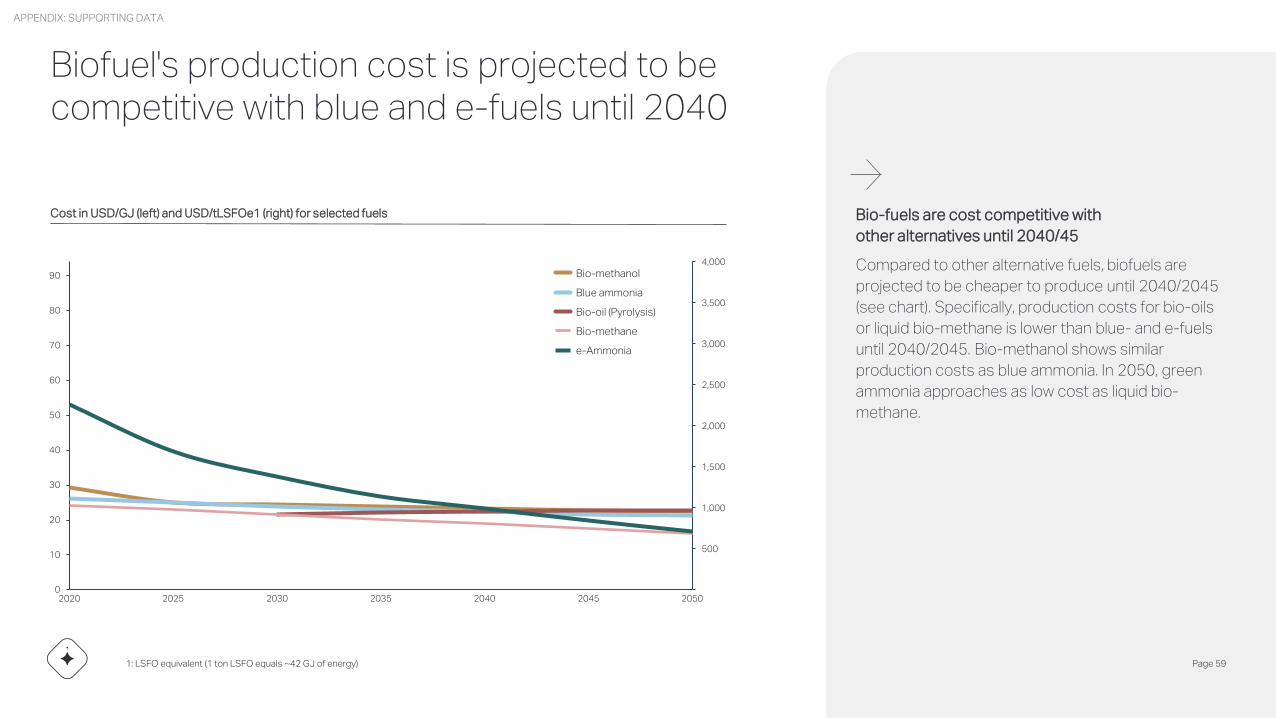
Biofuel's production cost is projected to be competitive with blue and e-fuels until 2040
1: LSFO equivalent (1 ton LSFO equals ~42 GJ of energy)
0
10
20
30
40
50
60
70
80
90
20252020 2040
4,000
2030 20452035 2050
500
1,000
1,500
2,000
3,500
2,500
3,000
Bio-methanol
Bio-oil (Pyrolysis)
Blue ammonia
Bio-methane
e-Ammonia
Bio-fuels are cost competitive with
other alternatives until 2040/45
Compared to other alternative fuels, biofuels are
projected to be cheaper to produce until 2040/2045
(see chart). Specifically, production costs for bio-oils
or liquid bio-methane is lower than blue- and e-fuels
until 2040/2045. Bio-methanol shows similar
production costs as blue ammonia. In 2050, green
ammonia approaches as low cost as liquid bio-
methane.
Cost in USD/GJ (left) and USD/tLSFOe1 (right) for selected fuels
APPENDIX: SUPPORTING DATA
Page 59
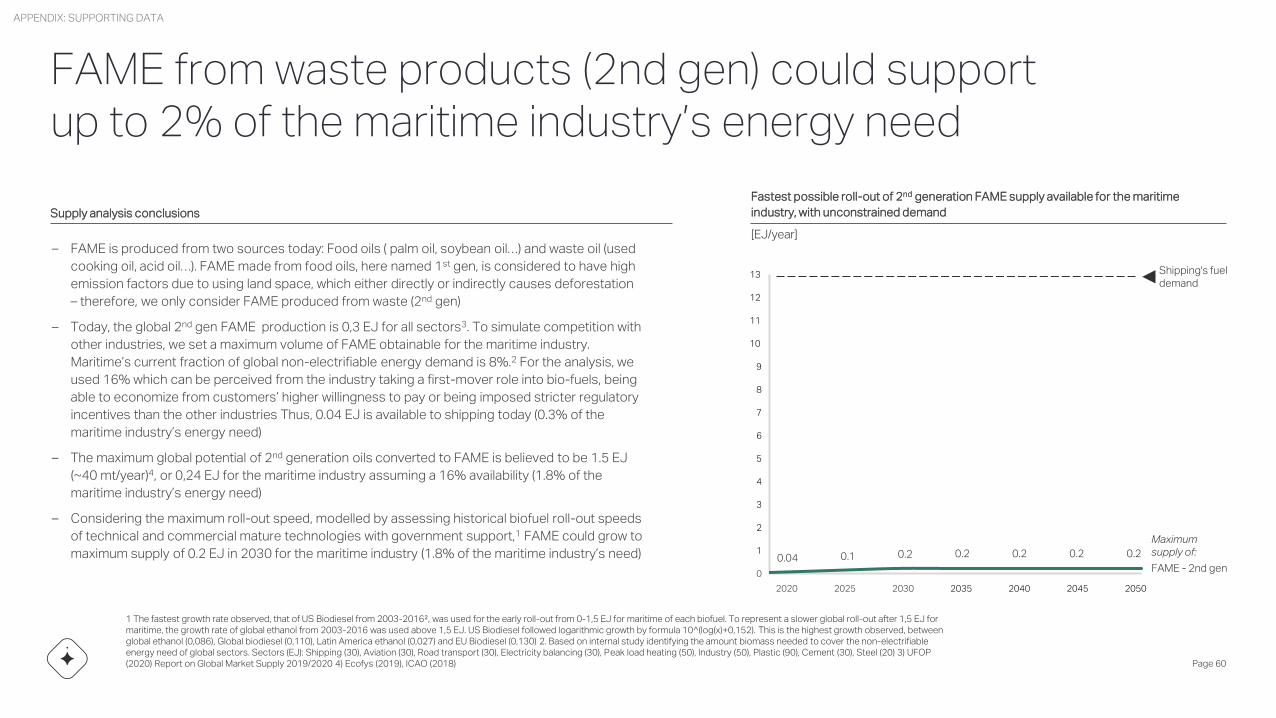
FAME from waste products (2nd gen) could support up to 2% of the maritime industry’s energy need
1 The fastest growth rate observed, that of US Biodiesel from 2003-2016², was used for the early roll-out from 0-1,5 EJ for maritime of each biofuel. To represent a slower global roll-out after 1,5 EJ for maritime, the growth rate of global ethanol from 2003-2016 was used above 1,5 EJ. US Biodiesel followed logarithmic growth by formula 10^(log(x)+0,152). This is the highest growth observed, between global ethanol (0,086), Global biodiesel (0,110), Latin America ethanol (0,027) and EU Biodiesel (0,130) 2. Based on internal study identifying the amount biomass needed to cover the non-electrifiable energy need of global sectors. Sectors (EJ): Shipping (30), Aviation (30), Road transport (30), Electricity balancing (30), Peak load heating (50), Industry (50), Plastic (90), Cement (30), Steel (20) 3) UFOP (2020) Report on Global Market Supply 2019/2020 4) Ecofys (2019), ICAO (2018) Page 60
– FAME is produced from two sources today: Food oils ( palm oil, soybean oil…) and waste oil (used
cooking oil, acid oil…). FAME made from food oils, here named 1st gen, is considered to have high
emission factors due to using land space, which either directly or indirectly causes deforestation
– therefore, we only consider FAME produced from waste (2nd gen)
– Today, the global 2nd gen FAME production is 0,3 EJ for all sectors3. To simulate competition with
other industries, we set a maximum volume of FAME obtainable for the maritime industry.
Maritime’s current fraction of global non-electrifiable energy demand is 8%.2 For the analysis, we
used 16% which can be perceived from the industry taking a first-mover role into bio-fuels, being
able to economize from customers’ higher willingness to pay or being imposed stricter regulatory
incentives than the other industries Thus, 0.04 EJ is available to shipping today (0.3% of the
maritime industry’s energy need)
– The maximum global potential of 2nd generation oils converted to FAME is believed to be 1.5 EJ
(~40 mt/year)4, or 0,24 EJ for the maritime industry assuming a 16% availability (1.8% of the
maritime industry’s energy need)
– Considering the maximum roll-out speed, modelled by assessing historical biofuel roll-out speeds
of technical and commercial mature technologies with government support,1 FAME could grow to
maximum supply of 0.2 EJ in 2030 for the maritime industry (1.8% of the maritime industry’s need)
20302025
0
2050204520402035
4
3
2
1
9
8
7
6
5
13
12
2020
10
11
Shipping's fueldemand
Maximumsupply of:
0.04 0.1 0.2 0.2 0.2 0.2 0.2
FAME - 2nd gen
Supply analysis conclusions
Fastest possible roll-out of 2nd generation FAME supply available for the maritime
industry, with unconstrained demand
[EJ/year]
APPENDIX: SUPPORTING DATA