possibilities for volvo trucks to provide carbon...
TRANSCRIPT

.j
Possibilities for Volvo Trucks to Provide Carbon Footprint Information Derived from Environmental Product Declarations
Master of Science Thesis in the Master Programme Industrial Ecology XIAOXI LI Department of Energy and Environment Division of Environmental Systems Analysis CHALMERS UNIVERSITY OF TECHNOLOGY Göteborg, Sweden, 2009 ESA Report No. 2009:3 ISSN No. 1404-8167

Master Thesis ESA Report 2009:3
Possibilities for Volvo Trucks to Provide Carbon Footprint Information Derived from Environmental
Product Declarations
XIAOXI LI
Division of Environmental Systems Analysis Department of Energy and Environment CHALMERS UNIVERSITY OF TECHNOLOGY
Göteborg, Sweden 2009

Possibilities for Volvo Trucks to Provide Carbon Footprint Information Derived from Environmental Product Declarations XIAOXI LI © Xiaoxi Li ESA Report No. 2009:3 ISSN: 1404-8167 Division of Environmental Systems Analysis Department of Energy and Environment CHALMERS UNIVERSITY OF TECHNOLOGY SE-412 96 Göteborg Sweden Telephone: +46 (0) 31-772 1000 Chalmers Reproservice, Göteborg, 2009

Abstract Along with the increasing awareness on global warming and the greenhouse gases emissions from governments, organizations and individuals, carbon footprint is becoming a new popular concept during the past two years. The concept appears to be rooted in “Ecological Footprint” and now defined as the overall amount of greenhouse gas emissions in terms of CO2 equivalent emitted associated with human’s activities. It could be used to measure individuals’ life, products’ life cycle, organization and carbon reduction projects.
For the product based carbon footprint, there is no universally accepted and commonly understood methodology at present. Several different initiatives are currently working on defining methods and guidelines on how to estimate the carbon footprint. However, many issues are under discussion.
This study is conducted together by Division of Environmental System Analysis in Chalmers and Volvo Technology Corporation. The goal is to investigate on how the carbon footprint could be adapted on the Volvo Trucks’ existing Environmental Product Declaration (EPD) system and to find the possibilities on providing the carbon footprint information based on Volvo Trucks EPD.
The study clarifies what carbon footprint is, in terms of its origin, development and the current situation of carbon footprint methodology developments. A comparison between different methodologies together with review and estimation on Volvo Trucks EPD identify that the current methodologies for carbon footprint accounting are not completely suitable for Volvo Trucks. As the conclusion, a public available GHG emission profile based on Volvo Trucks’ existing EPD is suggested in a short term to fulfil customers’ demand. It would be better for Volvo Trucks to wait for some well-accepted methodologies on carbon footprint. To move further, developing a new PCR for trucks could be considered.
Keywords: carbon footprint, greenhouse gas emission, trucks, life cycle assessment, environmental product declaration
Acknowledgements
As the final past of my study in Industrial Ecology Programme in Chalmers,I sincerely consider this thesis work as the most curious process during my study in Sweden.
This project is financial supported by Volvo and performed together with Volvo Technology (VTEC), Volvo Trucks (VTC) and Environmental System Analysis Division (ESA) at Chalmers. I am very thankful to Volvo and ESA that offered me this opportunity, especially to Lars Mårtensson, who set up the idea of this study.
I would like to manifest my warmest gratitude to all the people have helped me that in one way or another to ensue my work.
Johan Tivander and Johan Erlandsson, I feel very fortunate to have you to be my supervisors. I have learned a lot from you.
Lisbeth Dahllöf, thank you for being my supervisor and contact person in VTEC. You are so kind and have supported me all the way in Volvo.
I also would like to thank to Ellen Riise, Per Hanarp, Elin Eriksson and Roland Clift. I would not be able to complete this thesis work without your kindly help and information.
Last but not least, I am obliged to my parents and my boyfriend, who always supported, motivated and fervently encouraged me during these months.
January, 2009
Xiaoxi Li
Göteborg, Sweden
Contents 1. Introduction ........................................................................................................................... 1
1.1. Background .................................................................................................................. 1 1.2. Aims of the Study......................................................................................................... 2 1.3. Methodology ................................................................................................................ 3 1.4. Limitations ................................................................................................................... 4
2. Carbon Footprint and Related Concepts................................................................................ 5 2.1 Origin and Development .............................................................................................. 5 2.2 Debate on Carbon Footprint Definition ....................................................................... 6 2.3 Related Applications of Product Based CF for Communication ................................. 8
2.2.1 Carbon Labelling ................................................................................................ 8 2.2.2 EPD Climate Declarations................................................................................ 12
3. Comparisons of the CF Methodologies............................................................................... 14 3.1 Overview of the Optional Methodologies................................................................... 15
3.1.1 LCA ISO 14040/14044..................................................................................... 15 3.1.2 Greenhouse Gas Protocol ................................................................................. 15 3.1.3 ISO 14064:2006................................................................................................ 16 3.1.4 New ISO Standard for Carbon Footprint.......................................................... 17 3.1.5 PAS 2050:2008................................................................................................. 18 3.1.6 ISO 14025 and MSR 1999 for EPD Climate Declarations .............................. 18
3.2 The Current Network of Product Carbon Footprint Method Developments .............. 19 3.3 Comparison between PAS 2050 and EPD Standards.................................................. 21
3.3.1 Methodological Issues ...................................................................................... 21 3.3.2 Comparison between PAS and MSR................................................................ 24
3.4 Conclusion on CF Methodologies .............................................................................. 28 4. Volvo Trucks EPD ............................................................................................................... 30
4.1 Introduction of Volvo Trucks EPD.............................................................................. 30 4.2 Methodological Issues in Volvo Trucks EPD ............................................................. 30 4.3 Assessment in Volvo Trucks EPD............................................................................... 32 4.4 Result of Global Warming Potentials in Volvo Trucks EPD....................................... 35 4.5 Evaluation on the Assumption and Estimation Made in Volvo Trucks EPD.............. 37 4.6 PCR for preparing an EPD for “Passenger vehicles” ................................................. 41 4.7 Conclusion on Volvo Trucks EPD .............................................................................. 43
5. Discussion............................................................................................................................ 45 5.1 Counterview and Doubts on Carbon Footprint........................................................... 45
5.1.1 Is Carbon Footprint Enough? ........................................................................... 45 5.1.2 Will Carbon Footprint Affects the Consumers’ Behaviours? .......................... 46
5.2 Future Trend of Carbon Footprint............................................................................... 46 5.2.1 Increasing Interest in Carbon Footprint from Public........................................ 46 5.2.2 Universally Accepted and Commonly Understood Carbon Footprint Methodology Is Required .......................................................................................... 47 5.2.3 Demand on the Product Sector Rules ............................................................... 48
5.3 Issues for CF related with Trucks ............................................................................... 48 6. Conclusion........................................................................................................................... 50
6.1 Motivation of Developing Carbon Footprint Data...................................................... 50 6.2 Potential work ............................................................................................................. 50
References ................................................................................................................................ 52 Personal Contacts ..................................................................................................................... 56 Abbreviations ........................................................................................................................... 57

Appendix 1 Packaging Materials Data..................................................................................... 58 Appendix 2 Eco-profiles of LDPE and PP............................................................................... 59 Appendix 3 CO2eq Emission from Production of Cardboard .................................................. 60 Appendix 4 CO2eq Emission from Electricity Production in Sweden..................................... 61 Appendix 5 Definition of Vehicle Categories .......................................................................... 62
Introduction
1
1. Introduction
1.1. Background Over the past several years, global warming and climate change have become one of the most focused environmental issues in the world. Increased awareness of the scientific findings surrounding global warming has resulted in public awareness. The average global air temperature near the Earth's surface increased 0.74 ± 0.18 °C (1.33 ± 0.32 °F) during the hundred years ending in 2005 (IPCC 2007).
In “Climate Change 2007: Synthesis Report” (IPCC 2007), according to the researches by the Intergovernmental Panel on Climate Change (IPCC), observational evidence from all continents and most oceans shows that many natural systems are being affected by regional climate changes, particularly temperature increases.
IPCC concludes that most of the observed increase in globally averaged temperatures since the mid-twentieth century is very likely due to the observed increase in anthropogenic (man-made) greenhouse gas concentrations. It is reported that the greenhouse gas emissions due to human activities have grown since pre-industrial times, with an increase of 70% between 1970 and 2004.
Basic conclusions have been endorsed by at least thirty scientific societies and academies of science, including all of the national academies of science of the major industrialized countries. While individual scientists have voiced disagreement with some findings of the IPCC, the overwhelming majority of scientists working on climate change agree with the IPCC's main conclusions (Royal Society 2005).
Remaining scientific uncertainties include the amount of warming expected in the future, and how warming and related changes will vary from region to region around the globe. Most national governments have signed and ratified the Kyoto Protocol aimed at reducing greenhouse gas emissions, but there is ongoing political and public debate worldwide regarding what action should be taken.
Along with the increasing awareness on the greenhouse gases emissions from governments, organizations and individuals, a new carbon market was created. Carbon emissions trading is emissions trading specifically for carbon dioxide (calculated in tonnes of carbon dioxide equivalent or tCO2eq) and currently makes up the bulk of emissions trading. It is one of the ways countries can meet their obligations under the Kyoto Protocol to reduce carbon emissions and thereby mitigate global warming. Political organizations, national governments and the United Nations hold responsibility for verifying the carbon quota, credit entitlements and creating carbon policies within an environment where the science and economics of carbon management are continually evolving.
The carbon emission market has witnessed unprecedented growth during recent years since the commenced operation in January 2005 with 15 member states of the European Union participating (now 25 of the 27). It allowed organizations and even individuals to buy their
Introduction
2
credits to offset their own emissions. It is therefore unsurprising that organizations and consultant companies from different countries was increasingly entering the market and at the same time researches on carbon emissions measurement became more and more popular.
Carbon Footprint (CF), as a measurement of the amount of carbon emissions from human activities, has become a tremendously popular concept on responsibility and abatement action against the threat of global climate change over the last few years. Especially in the United Kingdom, carbon footprint is in widespread concern across not only in the media but also in the government and business world.
Due to the increased attention and awareness of climate issues, some large retailers, such as Tesco in UK have decided to label their products with their “carbon footprint” (Mesure 2007). A debate is going on about which methods to use to estimate the carbon footprint for products.
Several different initiatives are currently working on defining methods and guidelines on how to estimate the carbon footprint. So, in many companies there is a need for someone to analyze the options in terms of what is desirable by customers and other stakeholders and what is feasible to implement as an operational tool.
Volvo Trucks Corporation, the second largest heavy-duty truck brand in the world, has worked with environmental issues for decades. Their first environmental policy was developed in 1972, in conjunction with the United Nations’ first conference on the environment. Environmental care has become one of their core values and guiding principles since the early 1990s (Volvo Truck 2008).
Volvo Trucks has an Environmental Product Declaration (EPD) on their FH (Forward control High cab) and FM (Forward control Medium height cab) models. The EPD provides figures and facts on how the trucks affect the environment to the Volvo Trucks customers and others concerned (Volvo Truck 2008). The implementation of EPD was developed and published as an on-line application in the year of 2001, containing information about materials, energy consumption and emissions, which enables the customers to calculate the environmental impact of the production, usage and end of life of a Volvo truck, which also means a truck’s complete life cycle.
Due to the general awareness and increasing use of carbon footprint terminology and methodology, Volvo Trucks is searching for an appropriate methodology to report carbon footprint data. This was the driver to undertake the thesis work presented here.
1.2. Aims of the Study The objective of this thesis project is to find the possibilities on providing the carbon footprint information based on Volvo Trucks existing EPD systems. In order to achieve the objective, some steps are carried out and following questions would be answered during the study.
What is CF and how does CF relate to similar concepts, such as Ecological Footprint, Climate Footprint, Climate declaration, Carbon label, etc.?

Introduction
3
What are the existing methodologies to calculate CF? What are the differences and similarities between them? Is there a dominant methodology currently? Is there any one especially appropriate for Volvo Trucks?
To what extent does the Volvo Trucks’ existing EPD methodology differ from the CF methodologies?
According to the CF methodologies, what should be modified in Volvo Truck’s existing EPD system in order to publish CF data to the customers? For instance, should more detailed data be collected, should the assumption and simplification be changed, or should the method of calculation be switched?
1.3. Methodology The work was divided into two main stages, in line with the aim of the study. The first stage was to get a clear understanding of the CF concept, its optional methodologies and the ongoing initiatives. The second stage mainly focused on the application of CF at Volvo Trucks and specifically how it relates to Volvo Trucks’ implementation of EPD. Information was acquired with the following methods:
Document analysis/literature review
Electronic media/website search
Interviews with four experts from different projects and organizations, who are involved in the related topics and projects. The interviewees were Elin Eriksson from Swedish Environmental Research Institute (IVL), Ellen Riise from SCA (Svenska Cellulosa Aktiebolaget) and Roland Clift from University of Surrey, UK. Each interview took approximately one hour and some e-mails contacts with questions followed up.
In order to find out more information about the Volvo Trucks’ existing EPD and necessary data to improve the system, related companies and persons within the Volvo Group, for instance, Volvo Logistics and Volvo 3P (the business unit within Volvo Group, responsible for Product planning, Product development and Purchasing) were also contacted.
Secondary data from other trucks or related manufacturing companies published on the internet was consulted if some data were unavailable from Volvo. Stena Metall AB was contacted for generic data collection on end-of-life of vehicles.
In this study, two comparative analyses were undertaken. One in terms of differences and similarities between existing methodologies to calculate CF was included in the first stage. In this analysis, methodological issues of the existing methodologies were compared and some key questions on methodological issues were discussed. The other one is comparison between the existing Volvo Trucks EPD and CF methodologies in the second stage. There are several assumptions and estimation in the existing EPD system. Whether they are in alignment with the CF methodologies or not were identified and the key question is how well the estimations
Introduction
4
made in the EPD are suited for the methodologies. Evaluation on some of the loss of information in Volvo’s assessment was given.
1.4. Limitations Currently, many initiatives have been taken by a number of organizations for developing systems and tools related to environmental impact caused by emissions of CO2 or greenhouses gases due to the potential demand of the carbon emission information from customers, supply chains and the market. There is a lot active work ongoing in the area of carbon footprint and related concepts. This thesis will not able to track all the projects and researches which are progressing. It is also conceivable that new output such as new methodology from the ongoing project and new discussion on CF methodologies, which come out during the thesis working period, might not be covered completely by this thesis work.

Carbon Footprint and the Relevant Concepts
5
2. Carbon Footprint and Related Concepts In other to investigate how should Volvo provide the carbon footprint information based on Volvo Trucks existing EPD systems, it is very important to generate a clear understanding on what carbon footprint is and what methodologies are used to measure it. In this chapter, the origin and development of carbon footprint will be stated and some related concepts with carbon footprint will also be introduced, while the methodologies will be discussed in Chapter 3.
2.1 Origin and Development It is difficult to find exactly when and how the concept of carbon footprint was first established. It appears to be rooted in “Ecological Footprint”, which was first academically published by William Rees (Rees 1992).
Rees explained that Ecological Footprint is an estimate of the amount of biologically productive land and sea area needed to regenerate (if possible) the resources a human population consumes and to absorb and render the harmless the corresponding waste, given by the prevailing technology and current understanding.
From this definition, the term “footprint” suggests a measurement or expression on the consumed resources used in area-based units. Think about carbon dioxide based on the understanding of the concept of Ecological Footprint. Whenever human activities involve the burning of fossil fuels, carbon dioxide is emitted. This waste will accumulate in the atmosphere, contributing to global climate change, unless it can be captured and stored by nature (for instance, plants and rocks) or using carbon capture technology. The Global Footprint Network (Global Footprint Network 2008), an organization that compiles 'National Footprint Accounts' on an annual basis, therefore defined carbon footprint as a measurement of the demand on biocapacity that results from burning fossil fuels in terms of the amount of forest area required to sequester these carbon dioxide emissions.
However, it seemed that this definition has not spread extensively in public, while another understanding became dominating: the amount of CO2 that people emitted during the daily life and the contribution they have made. To help people to understand the impact of their personal behaviours on global warming, the sum of CO2 emissions, which are induced by the person’s activities, is evaluated. This became the origin of the concept “Carbon Footprint” as it is understood by most people nowadays, instead of the one which measures the demand on biocapacity.
At present, various online calculators have emerged in multitude to help the laypeople to estimate their personal “carbon footprint.” “Act on CO2” calculator from Directgov (Directgov 2008), the website of the UK government providing information and online services for the public, and the carbon calculator from IVL, Swedish Environmental Institute (IVL 2008), are two of examples among them. A Carbon Footprint Toolkit (BP 2006) was even launched by BP Education Service in Nov 2006, as a way to teach young students from
Carbon Footprint and the Relevant Concepts
6
eleven years old to fifteen about carbon emissions, its impacts, how to reduce the emissions and the alternative energy. There is even a consulting company who had trademarked the carbon footprint concept and took it as their company name in 2005 (Carbon Footprint Ltd. 2005).
2.2 Debate on Carbon Footprint Definition Weidema (2008) pointed out that carbon footprint has not been driven by research but rather has been promoted by non-governmental organizations (NGOs), companies and various private initiatives. This has resulted in many definitions by different actors and suggestions as how CF should be calculated. Some issues that have been discussed are described below.
First of all, should a carbon footprint include just carbon dioxide emissions or other greenhouse gas emissions as well? Should it be restricted to carbon-based gases or could it include substances that do not have carbon in their molecule, e.g. N2O?
Wiedmann and Minx (2007) argued a carbon footprint should only consider CO2 in the analysis but no other greenhouse gases. They explained that it was well known that there are other substances with greenhouse warming potential. However, except Methane (CH4), many of those are either not based on carbon or are more difficult to quantify because of data availability. It will not be very meaningful to have a partially aggregated indicator, which includes just two of a number of relevant greenhouse gases. Moreover, a comprehensive greenhouse gas indicator should include all the greenhouse gases and should be for example termed “climate footprint”. Otherwise they would select a more practical and clear solution, which include only CO2.
However, their opinion was not totally in agreement with most of the CF definition, which they could found before January 2008. In Wiedmann and Minx’s study, it was showed that not only CO2 but also other greenhouse gases are normally included into the carbon footprint measurement by most definitions, due to the purpose to evaluate the climate change and global warming impact from human activities.
Also some discussions are focused on the unit of carbon footprint. Obviously, carbon footprint will not be measured in area-based units as Ecological Footprint, its linguistically close relative, which is expressed in hectares or ‘global hectares’. Quantified measure in tonnes of CO2 equivalents is commonly accepted, although Geoffrey Hammond (2007) argued that those who favour precision in the mass unit should campaign for it to be called 'carbon weight', or some similar term.
Therefore, the baseline of carbon footprint definition is that it represents a measure on the amount of greenhouse gas emissions, which have the impact on climate change and global warming, associated with human activities, directly and indirectly. But the precise definitions vary, depending on the different level of the assessment. It could be measured e.g. by person from the individuals’ perspectives, by organization from operational perspective, or by activity from a project’s perspective, or even by a product from the productions’ perspectives.

Carbon Footprint and the Relevant Concepts
7
The general definition of individual carbon footprint is a measure of the impact human activities have on climate changes in a certain time frame in terms of the amount of greenhouse gases produced, measured in units of carbon dioxide. Usually it is calculated for the time period of a year. This personal carbon footprint could be made up of the sum of two parts, the direct/primary footprint and the indirect/secondary footprint
The primary footprint is a measure of individual’s direct emissions of CO2 from the burning of fossil fuels including domestic energy consumption and transportation (e.g. car and plane). While the secondary footprint is a measure of the indirect CO2 emissions from the products which are used by individuals, including those associated with their manufacture and final disposal.
The pie chart in Figure 1.1 shows the main elements that make up the total of an average person’s carbon footprint in developed countries (Carbon Footprint Ltd. 2007). This definition for individual’s carbon footprint is commonly used by the consultant companies and most of the online carbon footprint calculators.
Figure 1.1 Breakdown of a typical person’s carbon footprint from Carbon FootprintTM (2007)
The definition of carbon footprint on the product level is not as clear as the individual level. More discussion are directly related to its application, how to calculate a single product’s carbon footprint. Should the carbon footprint reflect all life cycle impacts of goods and services used? If yes, where should the boundary be drawn and how can these impacts be quantified?
According to the definition from European Platform of Life Cycle Assessment, the production based Carbon footprint is ‘the overall amount of carbon dioxide (CO2) and other greenhouse gas emissions (e.g.CH4, N2O, etc.) associated with a product along its supply-chain and sometimes including from use and end-of-life recovery and disposal’ (EPLCA 2007). In other
Carbon Footprint and the Relevant Concepts
8
words, a carbon footprint is a life cycle assessment with the analysis limited to emissions that have an effect on climate change.
Based on the driver of this thesis work, only production based carbon footprint will be focused in the following chapters.
2.3 Related Applications of Product Based CF for Communication As a carbon emission measurement, carbon footprint could not only help to calculate the amount of the greenhouse gas emissions but also offer a tool for industries to communicate. Some relevant concepts have similar applications and could be considered as the ways to communicate carbon footprint data. According to ISO 14020, there are three types of “Environmental Label and Declaration” which could be utilized as the communication tools based on the LCA results and this series of ISO standards are listed as follows:
ISO 14021 Environmental labels and declarations -- Type I environmental labelling -- Principles and procedures (ISO 1999)
ISO 14024 Environmental labels and declarations -- Self-declared environmental claims (Type II environmental labelling) (ISO 1999)
ISO 14025 Environmental labels and declarations -- Type III environmental declarations -- Principles and procedures (ISO 2006)
Carbon labelling, one related concept of carbon footprint, therefore could be used as one kind of Type I Environmental Labelling, while the EPD Climate Declarations could be considered as the corresponding application of Type III Environmental Declaration.
2.2.1 Carbon Labelling
Being as one related concept of carbon footprint, carbon labels give specific information about the carbon emission associated with the production or use of a product. They belong to the category Type I Environmental labelling, voluntary and developed by organizations or consulting companies. Those labels intent to help customers make environmental-friendly choices on daily consuming and could also encourage businesses to cut products’ carbon emissions. Furthermore, other companies in the supply chain to the products might be influenced to make their contribution to the global warming as well.
There are many different organizations or companies all over the world working with carbon labelling, such as Carbon Trust (UK), Carbon counted (Canada), The Climate Conservancy (US) and Carbon Reduction Institute (Australia).
The various carbon labels might base on different methodologies which were mainly developed by their own, but all of the carbon labels could be organized in three groups: low-carbon seal, carbon score and carbon rating.
a) Low-Carbon Seal

Carbon Footprint and the Relevant Concepts
9
Low carbon seal is a seal of approval awarded to those who have reached some certain standards of a low carbon requirement within a product category. Such seals are easy to understand, but will not allow consumers to compare sealed products. For example, it is difficult for the customers to compare between a piece of beef and a bag of beans when they are all given a certain label.
One example of such low carbon seal is NoCO2/Carbon Neutral Products (Carbon Reduction Institute 2008) in Figure 1.2, certified by the Carbon Reduction Institute (CRI), Australia. Organizations certified as NoCO2 are accredited carbon neutral businesses. The CRI accounts the total operational emissions as well as the emissions embodied in the products it sells and uses for the organizations. Measures for reduction of carbon emissions should be taken and carbon credits should be bought to offset the unavoidable carbon emission to make the organization carbon neutral. A product displaying the Carbon Neutral Product logo should had all its lifecycle’s carbon emissions offset prior to purchase and can only be offered by NoCO2 certified organizations which are completely carbon neutral.
The emissions accountings CRI implement follow industry best practice and are in compliance with the Greenhouse Gas Protocol (developed by the World Business Council for Sustainable Development and the World Resources Institute, see chapter 3).
Figure 1.2 Carbon Neutral Products logo and NoCO2 logo
In Sweden, there is also an ongoing work within KRAV and Svenskt Sigill (the Swedish Seal) to develop a climate label. KRAV is an incorporated association developing organic standards in Sweden and promote a KRAV label (KRAV 2008), while Svenskt Sigill is a wholly owned subsidiary of the Federation of Swedish Farmers and its Svenskt Sigill label is a food quality label which guarantees the food that has been produced on farms (Swenskt Sigill 2008).
KRAV label (in Figure 1.3) is the most well known environmental label applied on consumer food products in Sweden. It is awarded to the producers who adhere to a set of rules of practice agreed to be less harmful to the environment than conventional food production. And inspections are carried out yearly by the KRAV organisation, in order to ensure the productions achieve the rules insistently.
Figure 1.3 KRAV Label

Carbon Footprint and the Relevant Concepts
10
Yet nothing has been decided on precise rules of the climate label methodology other than a clear project aim that “to reduce the climate impact by creating a marking system for food where the consumers make a conscious climate choice and businesses can strengthen their competitiveness.” There are some draft proposals contain general standards which intent to limit the activities having large negative climate impact, but further information about this ongoing project is not available (KRAV 2008).
b) Carbon Score
The idea behind carbon score labels is to mark the numbers in the label and make it possible to compare across product categories and brands. However, carbon scores may need a consentaneous and standardized measurement methodology and actual company data.
The Carbon Trust’s carbon reduction label (2008) is one example of the carbon score label, see Figure 1.4. It is at the forefront of consumer-based carbon management. In 2001, Carbon Trust was set up by UK government as an independent company. Their first carbon label, which shows “carbon footprint” embodied in a product, was introduced in the UK in March 2007. Examples of products which carried the label are Walkers Crisps, Innocent Smoothies and Boots Shampoos. Carbon Trust also developed their methodology describing how they carried out their projects and calculate the carbon footprint. This methodology has also made contribution to the on-going PAS 2050 project (See chapter 3), which is carried out together by Carbon Trust, Defra (Department for Environment, Food and Rural Affairs, UK) and the British Standards Institute (BSI).
Figure 1.4 Carbon Trust’s carbon reduction label
Similar labels could be found in other countries, for instance, the CarbonCounted version of the carbon label, which started in January 2007 in Canada (CarbonCounted 2008). It uses the whole supply chain to determine the amount of carbon dioxide emitted to bring a product to market. CarbonConnect is a web-based, third-party audited carbon footprint and carbon labelling network, developed by a not-for-profit organization. This third party certified system developed their own open standard, trying to eliminate the need for heavy auditing associated with values determined when the companies use isolated accounting methods. The method also addresses how to consistently apply the smaller details such as the heating, cooling, lighting and etc. in the shops or dealers where the products are sold (CarbonCounted 2008).
In December 2007, a new carbon footprint project on European Eco-label, the EU flower, was launched, aiming to develop a carbon footprint measurement toolkit for potential applicants who would like to apply for a new Eco-label license. The new label format is suggested to combine the existing EU flower with the carbon footprint of the product side by

Carbon Footprint and the Relevant Concepts
11
side, see Figure 1.5. Life Cycle Engineering (LCE), an Italy consulting company, in cooperation with the Swedish Environmental Management Council (SEMCo), was entrusted by European Commission to perform this project. The aim of this project is to develop and deliver a calculation tool for those applicants who would like to get the new eco-label with the carbon footprint data.
Figure 1.5 Suggestion for a new EU eco-label logo from EU eco-label carbon footprint measurement toolkit project
As a result of limited time and resources on this project, the project did not achieve to deliver complete toolkits for CF calculation. Only few selected product groups were covered in the toolkit. The new label in Figure 1.5 has only been suggested as an option for commutating the carbon footprint information. Therefore, the project might be considered as a failing attempt on developing a carbon footprint label but the experiences might be used as references in the future studies.
c) Carbon Rating
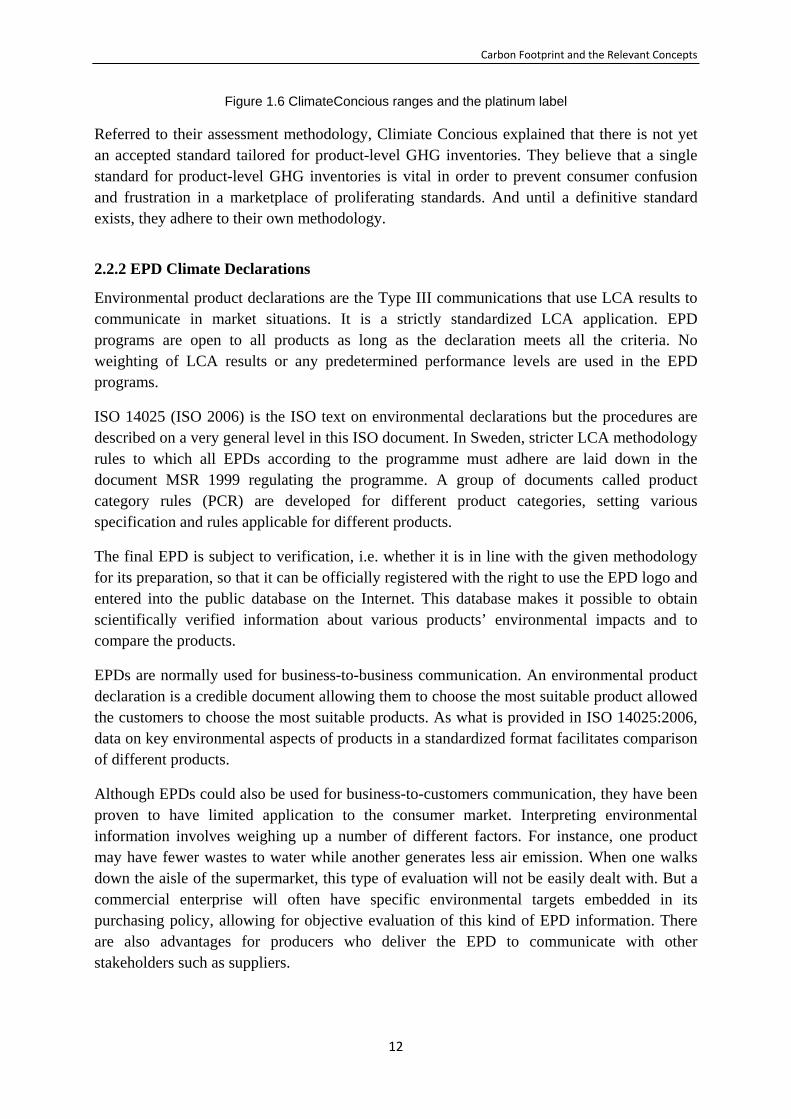
Carbon rating is a kind of labelling which gives a rank on the performance of products. For example, a low-carbon product would score 5 stars whereas a high-carbon product would only rate 1 star. It allows comparisons between different brands, but the average product’s score is needed. Here is an example from The Climate Conservancy in US.
The Climate Conscious rating (The Climate Conservancy 2008) is based on the concept of GHG intensity and developed to permit the comparison of an assessed product's lifecycle GHG emissions over time to similar products for consumers. For example, if the assessment attributes 1.3 kilograms of CO2eq emissions to an assessed product and the product’s retail value is 5 dollars, its GHG intensity would be 260 grams of CO2eq gas for every dollar of product value. If the average product in the same economic sector has a GHG intensity of 520 grams of CO2eq per dollar of product value, the assessed product’s GHG intensity could be normalized as 50% less than the industry average. Thus, its Climate Conscious rating would be 50%. To simplify this calculation for presentation to consumers, rated products will be labelled as shown in Figure 1.6.
10-40%, Climate ConsciousTM Silver 41-70%, Climate ConsciousTM Gold > 70%, Climate ConsciousTM Platinum
CO2 Emission
=?
Carbon Footprint and the Relevant Concepts
12
Figure 1.6 ClimateConcious ranges and the platinum label
Referred to their assessment methodology, Climiate Concious explained that there is not yet an accepted standard tailored for product-level GHG inventories. They believe that a single standard for product-level GHG inventories is vital in order to prevent consumer confusion and frustration in a marketplace of proliferating standards. And until a definitive standard exists, they adhere to their own methodology.
2.2.2 EPD Climate Declarations
Environmental product declarations are the Type III communications that use LCA results to communicate in market situations. It is a strictly standardized LCA application. EPD programs are open to all products as long as the declaration meets all the criteria. No weighting of LCA results or any predetermined performance levels are used in the EPD programs.
ISO 14025 (ISO 2006) is the ISO text on environmental declarations but the procedures are described on a very general level in this ISO document. In Sweden, stricter LCA methodology rules to which all EPDs according to the programme must adhere are laid down in the document MSR 1999 regulating the programme. A group of documents called product category rules (PCR) are developed for different product categories, setting various specification and rules applicable for different products.
The final EPD is subject to verification, i.e. whether it is in line with the given methodology for its preparation, so that it can be officially registered with the right to use the EPD logo and entered into the public database on the Internet. This database makes it possible to obtain scientifically verified information about various products’ environmental impacts and to compare the products.
EPDs are normally used for business-to-business communication. An environmental product declaration is a credible document allowing them to choose the most suitable product allowed the customers to choose the most suitable products. As what is provided in ISO 14025:2006, data on key environmental aspects of products in a standardized format facilitates comparison of different products.
Although EPDs could also be used for business-to-customers communication, they have been proven to have limited application to the consumer market. Interpreting environmental information involves weighing up a number of different factors. For instance, one product may have fewer wastes to water while another generates less air emission. When one walks down the aisle of the supermarket, this type of evaluation will not be easily dealt with. But a commercial enterprise will often have specific environmental targets embedded in its purchasing policy, allowing for objective evaluation of this kind of EPD information. There are also advantages for producers who deliver the EPD to communicate with other stakeholders such as suppliers.
Carbon Footprint and the Relevant Concepts
13
In order to better meet to various market and customer requirements, the concept of "single-issue EPDs" was introduced by the international EPD® system introduced, as a digest of an entire EPD with the ambition to adjust the information into a simpler format.
“Climate declaration is an example of ‘single-issue EPDs’ which describes the emissions of greenhouse gases, expressed as CO2 equivalents for a product's life cycle.” Definition of climate declaration could be found on the website of the international network for EPDs. The climate declaration is therefore based on the verified results from LCA-based information in accordance with ISO 14025, with the same characteristics of the normal EPDs (The international EPD®system 2008).
In January 2008, the international network for EPDs - the Global Type III Environmental Product Declarations Network (GEDnet) sent out a questionnaire to get feedback on this concept and the suggested climate declarations and also to collect information on how to improve and modify them, in order to better adjust and develop the climate declarations to suit various needs. Six examples, such as bottled milk from Granarolo, are also selected among some existing climate declarations and attached with the questionnaires to ask for responses (GEDnet 2008). Some responses argued that climate declaration should not be a stand-alone document, but a sub-document of a full certified EPD, which has been accepted by GEDnet already (GEDnet 2008).
Comparisons of the CF Methodologies
14
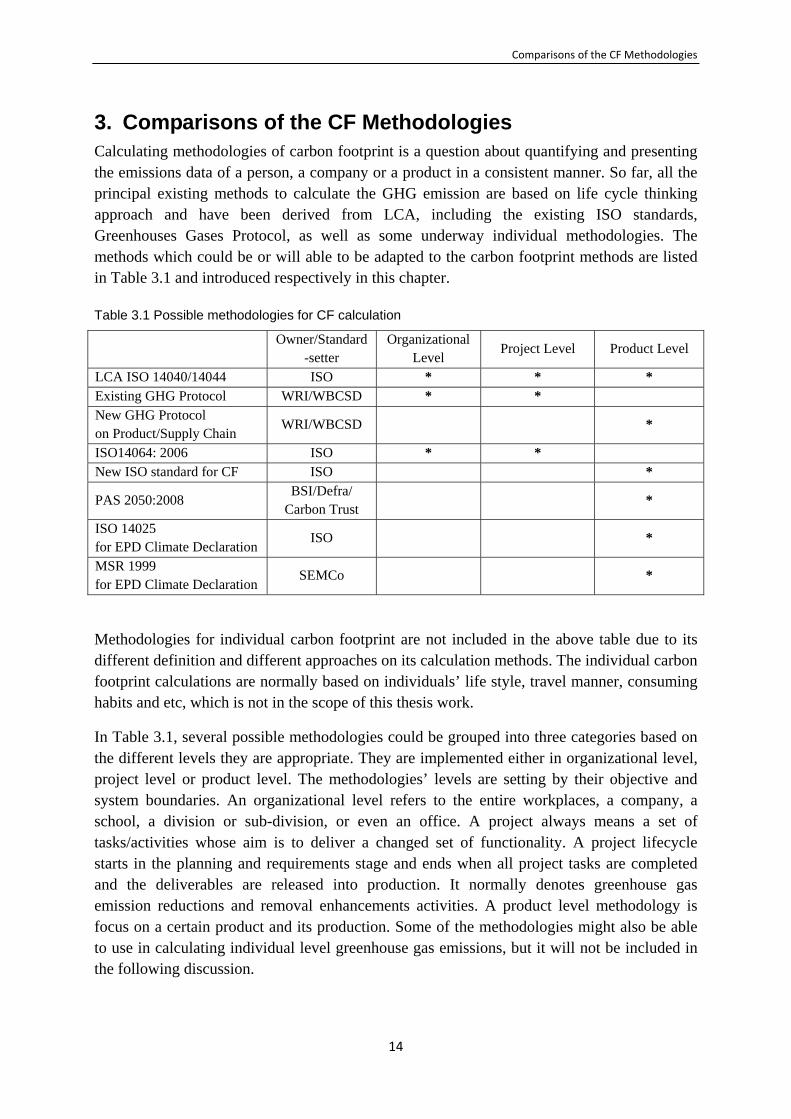
3. Comparisons of the CF Methodologies Calculating methodologies of carbon footprint is a question about quantifying and presenting the emissions data of a person, a company or a product in a consistent manner. So far, all the principal existing methods to calculate the GHG emission are based on life cycle thinking approach and have been derived from LCA, including the existing ISO standards, Greenhouses Gases Protocol, as well as some underway individual methodologies. The methods which could be or will able to be adapted to the carbon footprint methods are listed in Table 3.1 and introduced respectively in this chapter.
Table 3.1 Possible methodologies for CF calculation
Owner/Standard
-setter Organizational
Level Project Level Product Level
LCA ISO 14040/14044 ISO * * * Existing GHG Protocol WRI/WBCSD * * New GHG Protocol on Product/Supply Chain
WRI/WBCSD *
ISO14064: 2006 ISO * * New ISO standard for CF ISO *
PAS 2050:2008 BSI/Defra/
Carbon Trust *
ISO 14025 for EPD Climate Declaration
ISO *
MSR 1999 for EPD Climate Declaration
SEMCo *
Methodologies for individual carbon footprint are not included in the above table due to its different definition and different approaches on its calculation methods. The individual carbon footprint calculations are normally based on individuals’ life style, travel manner, consuming habits and etc, which is not in the scope of this thesis work.
In Table 3.1, several possible methodologies could be grouped into three categories based on the different levels they are appropriate. They are implemented either in organizational level, project level or product level. The methodologies’ levels are setting by their objective and system boundaries. An organizational level refers to the entire workplaces, a company, a school, a division or sub-division, or even an office. A project always means a set of tasks/activities whose aim is to deliver a changed set of functionality. A project lifecycle starts in the planning and requirements stage and ends when all project tasks are completed and the deliverables are released into production. It normally denotes greenhouse gas emission reductions and removal enhancements activities. A product level methodology is focus on a certain product and its production. Some of the methodologies might also be able to use in calculating individual level greenhouse gas emissions, but it will not be included in the following discussion.

Comparisons of the CF Methodologies
15
In this chapter, a comparative analysis is also carried out to evaluate the state of the art of different methodologies and approaches which are currently in use to calculate the carbon footprint.
3.1 Overview of the Optional Methodologies
3.1.1 LCA ISO 14040/14044
ISO 14040/14044 are the LCA principles and guidelines in the ISO 14000 family. They are the basement of all the LCA programs and referenced by the other methodologies listed in this chapter.
ISO 14040 describes the principles and framework for LCA, providing a clear overview of the practice, applications and limitations of LCA. It does not include the LCA techniques in detail and does not specify methodologies for the individual phases of LCA, while the ISO 14044 specifies requirements and provides guidelines in different phases, including preparation, conduct, critical review of life cycle inventory analysis and interpretation of LCA results.
3.1.2 Greenhouse Gas Protocol
The Greenhouse Gas Protocol (GHG Protocol) is widely used as international accepted practice for government and business to understand, quantify and manage greenhouse gas emissions. According to The GHG Protocol Initiative, the GHG Protocol has been utilized by more than 1,000 organizations over the world to develop their GHG inventories in 2001. It is also adopted by Emissions Trading Scheme in EU and UK (The GHG Protocol Initiative 2008).
The GHG Protocol is developed under the partnership between the World Business Council for Sustainable Development (WBCSD) and the World Resources Institute (WRI).
It was launched in 1998 and the first edition was published in 2001. Its core steering group comprised of members from environmental groups (such as WWF, Pew Center on Global Climate Change, The Energy Research Institute) and from industry (such as Norsk Hydro, Tokyo Electric, Shell) to guide its development process. A suite of calculation tools to assist companies in calculating their GHG emissions upon the standards are also developed, including cross sector tools and some sector specific tools (The GHG Protocol Initiative 2008).
The existing GHG Protocol consists primarily of two separate standards: one is Corporate Accounting and Reporting Standards, for private and public sector organizations, the other is Project Accounting Protocol and Guidelines, for quantifying the greenhouse gas benefits of climate change mitigation projects.

Comparisons of the CF Methodologies
16
Figure 3.1 Overview of scopes and emissions across a value chain Adopted from GHG Protocol’s Corporate Standard (The GHG Protocol Initiative 2004)
In GHG Protocol’s Corporate Standard (The GHG Protocol Initiative 2004), three scopes are defined for organizations to calculate their GHG emissions. As presented in Figure 3.1, Scope 1 covers the direct emission from the operation of the company and Scope 2 refers to indirect emission from the generation of electricity which is purchased and consumed in the company. There two scopes are required to report separately according to GHG Protocol, while the Scope 3, including all the other indirect emissions, such as productions of the components from supplier, employee business travel and waste disposals, is only an option category.
In order to guide the calculation of Scope 3, a third standard for supply chain GHG emission and/or life cycle GHG emissions was launched in June 2008 due to the rapidly growing demand for such a standard from GHG Protocol’s stakeholders. The final sign off of the standard is scheduled to be delivered in May 2010 (The GHG Protocol Initiative 2008).
3.1.3 ISO 14064:2006
The ISO 14064 standards are the latest additions to the ISO 14000 family of International Standards for environmental management up to now. This ISO 14064 standard is developed under the collaboration with WRI and WBCSD, the standard-setters of GHG Protocol. There are three parts in this series:
ISO 14064-1:2006, Greenhouse gases – Part 1: Specification with guidance at the organization level for the quantification and reporting of greenhouse gas emissions and removals.
ISO 14064-2:2006, Greenhouse gases – Part 2: Specification with guidance at the project level for the quantification, monitoring and reporting of greenhouse gas emission reductions and removal enhancements.
ISO 14064-3:2006, Greenhouse gases – Part 3: Specification with guidance for the validation and verification of greenhouse gas assertions.
Comparisons of the CF Methodologies
17
ISO 14064 standards were published on March 2006 by ISO and designed to help organizations and governments in measuring, reporting and verifying GHG emissions. It details internationally agreed requirements on what needs to be done in GHG accounting and verification efforts. Being an independent, voluntary accounting standard, ISO 14064 is deliberately policy neutral and could be used for emission trading.
Among the three standards of 14064, it is worthy of notice that 14064-1, Specification with Guidance at the Organization Level for Quantification and Reporting of Greenhouse Gas Emissions and Removals, was developed based on the Greenhouse Gases Protocol which was introduced in the chapter 3.1.2. Therefore they have very similar scopes and approaches.
But unlike the GHG Project Protocol, ISO 14064 gives guidance but does not describe the exact requirements. Examples are common stated in GHG protocol, outlining how to undertake the GHG accounting and reporting in different procedures, while the requirements are usually only in general terms in ISO 14064. For example, when ISO pointed out additional calculation or consideration is needed, it does not express the specific tool or methods which are required or recommended to use. They are usually open up for different GHG according program to define by themselves under the ISO standard.
3.1.4 New ISO Standard for Carbon Footprint
In June 2008, at the annual ISO TC 207-meeting in Bogota, Colombia, ISO decided to work on carbon footprint of products and started building up a new standard for quantification and communication of carbon footprint.
There are several approaches and methods which have already covered the same areas, including the existing ISO standards for LCA, product declarations and greenhouse gas accounting (ISO 14040/44, ISO 14025 and ISO 14064) as well as those possible new individual methodologies under development. Why there is a need for this additional standard?
Being a topic of high public interest, different attempts are emerging for calculating carbon footprint. Harmonization of approaches is highly desirable under such situation. From the industry’s perspective, the credible product comparisons need a more common, well-accepted methodology.
Ellen Riise, the technical expert from Sweden in ISO, also explained that because of the limitation of an ISO documents’ length, there are some issues open up in the existing ISO standard and compromise sentences are also used. However, a carbon footprint standard should go more into details of the LCA standard.
Now the new ISO standard for carbon footprint is under preparing process. As the world's largest developer and publisher of international standards, ISO is a network of the national standards institutes of 157 countries, one member per country. Thereby, it is time consuming for ISO to develop a new standard. The new ISO work proposal will be finished in the end of October 2008, and the first meeting for the steering group will be held in January 2009. Generally, the formal approval of the resulting draft International Standard will take about

Comparisons of the CF Methodologies
18
one year, afterward the agreed text could be published as a new ISO standard. Ellen Riise mentioned that the new standard for carbon footprint will probably come out in 2012.
3.1.5 PAS 2050:2008
PAS 2050:2008 is a Publically Available Specification (PAS) developed by British Standards Institution (BSI), co-sponsoring with Defra (Department for Environment, Food and Rural Affairs, UK) and the Carbon Trust for the measurement of the embodied GHG of products and services across their life cycle. It has gained great attention among the underway methodologies during its development. It is not intent to be used as a standard but actually a methodology to calculate carbon footprint and for a variety of both formal and informal processes in order to improve and communicate the GHG performance of products and services.
This methodology is in response to market interest in understanding the contribution that products and services make to climate change and the requirement for a standardized, consistent method organizations can use for measurement. Carbon Trust’s methodology on GHG emission is utilized as the basis of PAS 2050. The development of PAS 2050 was commenced in June 2007. After different stages of consultation from extensive stakeholder, it was published in the end of October 2008.
3.1.6 ISO 14025 and MSR 1999 for EPD Climate Declarations
As introduced in Chapter 2.2.2, ISO 14025 is the basement of the Environmental project declarations. EPDs closely follow the ISO14025:2006 Type III environmental declarations and are considered as an application of the ISO 14025. As a single issue EPD, climate declaration is also based on this ISO standard.
As the guideline of EPD, ISO 14025 is described on a very general level and very open for different environmental declarations programs. It does not have the status of a standard, but is a technical report to be applied provisionally so that information and experience from its practical use may be collected (Baumann & Tillman, 2004). Therefore a stricter standard is needed to describe the procedures and rules for a specific EPD programme. In this purpose, MSR 1999 was developed by Swedish Environmental Management Council (SEMCo).
Also the Product Category Rules (PCR) plays an important role in global EPD system. PCRs are usually developed by companies and organizations in co-operation with each other, sometime it is prepared by a single company. The developed PCRs are published on the global website and considered as a reference and rules for the products in the same product groups. If there is not any PCR that fit the product, the EPD producer will need to prepare its own PCR document and get it accepted. The PCRs make it possible for the products to compare in a certain category due to the same requirements on the methodologies.
At present, a project to develop “ready-made” Basic PCR modules is performing by the Swedish Environmental Management Council (SEMCo) and the Swedish Environmental Research Institute (IVL). The purpose of the project is to decrease the workload and cost of

Comparisons of the CF Methodologies
19
PCR development and facilitate the work of EPD programs. The modules is planned to be suitable for all possible upstream processes as a PCR guideline will also be developed.
As stated by the international EPD®system (2008), the future ISO standard for carbon footprint will take the ISO 14044 on LCA and ISO 14025 on EPD as the quantification piece and communication piece of the basis. Figure 3.2 shows the relationships between the different ISO standards and their application rules.
Figure 3.2 Relationships between the different ISO standards and the application rules
3.2 The Current Network of Product Carbon Footprint Method Developments In this section, the current network of the developments on product carbon footprint methodologies is explained. A general map as Figure 3.3 could be drawn to show the main actors in the network and the connections between the actors.
Figure 3.3 Main actors in the current product carbon footprint method development networks
ISO 14040/14044
ISO 14025
MSR 1999
PCR New ISO for carbon footprint
Quantification PieceCommunication Piece

Comparisons of the CF Methodologies
20
From chapter 3.1, it could be found that ISO, GHG protocol and the international EPD®system are the three main networks who have involved into the carbon footprint methodological studies.
ISO network is much broader than the other two networks. BSI, as the national standard institute from UK, is a member of ISO. Therefore PAS 2050 project was presented at the ISO annual meeting and expected by BSI to perform as a basement of the new ISO carbon footprint standard. Technical supports of ISO come from different countries and different industries. For example, Ellen Riise, one of the interviewees during this thesis work, as area environmental manager in SCA, could present a perspective from the paper industry.
Official partners of GHG protocol are mainly from governments in Asia, South America and North America, which means several national programs in those regions adopt GHG protocol. It also has more than 100 corporate users worldwide, including automobile manufacturers, energy services, consuming goods manufacturers and etc, as well as other non-corporate users. After the GHG Protocol’s Corporate Standard was adopted as the basis for ISO 14064-1 in 2006, ISO and GHG Protocol has built up a relationship with ISO. December 3rd, 2007, WRI and WBSCD, the standard-setters of GHG Protocol, together with ISO, have signed a Memorandum of Understanding to jointly promote both global standards, which sequentially facilitate their cooperation.
The international EPD®system has fewer members than ISO and GHG protocol networks. SEMCo is playing a very active role in this network. SEMCo is one of the main contributors of the international EPD system and climate declaration and also involved in the EU eco-label CF toolkit project. Moreover, it is reported both on the website of the international EPD®system and SEMCo that the EU eco-label CF measurement toolkit project has been provided to the EU-Commission and advices were suggested on making use of climate declarations for future development of eco-labelling. Because the EPD is developed under ISO standard (ISO 14025), the EPD network is also considered as an important resource for ISO network.
Roland Clift explained in the interview that the product carbon footprint studies in UK were first driven by retailers (for instance, Tesco) and consultant companies (for instance, Carbon Trust) in 2007. In a supply chain’s point of view, retailers are involved into carbon footprint studies earlier than industries. Some consultant companies are also working on the similar area of carbon footprint, as mentioned in Chapter 2.2.1, some of which are even involved into the underway projects. Carbon Trust and The Climate Conservancy could be found in the focus group participants of GHG Protocol Product and Supply Chain Standard. It could be supposed that a few industries are also involved in carbon footprint studies as co-operators of the above three networks. It could also be assumed that there would be many industry companies paying special attention to carbon footprint methodology development progresses, not only Volvo Trucks.
Comparisons of the CF Methodologies
21
3.3 Comparison between PAS 2050 and EPD Standards As stated at the beginning of the existing GHG protocol, “From the perspective of a business developing a GHG inventory, and applies equally to other types of organizations with operations that give rise to GHG emission, e.g., NGOs, government agencies, and universities”, the GHG Protocol is mainly from a corporate and project level. As mentioned in chapter 3.1.3, GHG protocol has been used as a basis for building up ISO 14064. Comparing with GHG Protocol, ISO 14064 is very similar in scope and approach. It is also for organization level or project level usage and not suitable for a product.
PAS 2050, EPD and new GHG Protocol Product/Supply Chain Standard clearly defined their application in product level. It is not disputed that these methodologies are focus on the product level and will be more suitable for Volvo Trucks, from a production’s perspective.
In another aspect, the methodologies could also be defined as guidelines, application descriptions or tools. All ISO standards are belonging to the guidelines as well as the GHG Protocol, while MSR 1999 and PAS 2050 draft are the application descriptions. Besides the EU eco-label CF measurement toolkit, GHG Protocol also provide their own tools for calculate carbon emissions. Some other tools could be found from different consultant companies or organizations as well.
Due to the uncertainties of the ongoing progresses of the new GHG protocol, new ISO standard and the limitation of the result from EU eco-label CF measurement toolkit project, a comparison analysis will be carried out especially between the existing PAS 2050 and the MSR 1999 which is the Swedish application guideline for EPD. During the comparison in this chapter, PAS and MSR will be used instead of PAS 2050 and MSR 1999 for short.
3.3.1 Methodological Issues
Both the PAS and MSR are based on life cycle assessment methodologies. Since 1980s, LCA methodologies have been researched. Now, they are well developed and have been established on a general level. However, problems still exist, particularly in specific applications. Those methodological issues also have been embodied in the carbon footprint application. Therefore, the methodological issues are introduced in this section and the methodology comparison will mainly focus on these methodological issues.
a) Functional unit
In a LCA, functional unit of the examined product systems have to be clearly determined. A functional unit (i.e. one ton of product) must be defined which serves as a reference unit for all input and output streams and the potential environmental effects. When comparing different products or procedures, it is of particular importance that the criteria of the functional equivalence, because only functionally equivalent systems can be compared. Also differences in the environmental effects of alternative systems can be directly assigned to the products or procedures only if the function of the considered systems is equivalent.
Comparisons of the CF Methodologies
22
b) System boundary definition
Different LCA studies can apparently obtain different results depending on the definition of system boundaries. The choices of system boundaries could always be related to the difficulties in searching for good data. One may have to even wait to decide the exact details of system boundaries until enough information has been collected during inventory analysis. Several dimensions as following need to be specified.
• Boundaries in relation to natural systems • Geographical boundaries • Time boundaries • Boundaries within the technical systems
- Boundaries related to production capital, personnel, etc. Cut-off criteria - Boundaries in relation to other products’ life cycles. Requires allocation procedures.
(Adapted from The Hitch Hiker’s Guide to LCA, H Baumann & A-M Tillman, 2004)
The system boundary definition is the central problem of the carbon footprint. It also has influence on many other issues. The problems on the boundaries within the technical systems should be paid special attention to. Two important issues, cut-off criteria and allocation procedures will be discussed separately.
c) Cut-off criteria
In order to reduce the extent and complexity of the study frame to a practicable degree, the balance scope is sometimes limited to a scale that fits the question properly. Usually, for a normal LCA study, with the help of sensitivity analyses and performance criteria it is determined whether a material stream can be cut off. For a standardized methodology, there will be some requirements as well as settings for cut-off criteria.
d) Allocation choices
The life cycle of the product is linked in networks. Allocation problem happens when several products or functions share the same process or processes. Allocation of environmental burdens the impacts between different outputs from the system. The allocation choices often result in ambivalence. If possible, allocations should be avoided. The two methods for allocation in practice, partitioning and system expansion should be clearly set, especially when recycling or reuse occur.
This issue is very important for a carbon footprint method. In ISO 14044 and 14025, there is not clear description on allocation, where it is unnecessarily open for misinterpretations. With the current state of the carbon footprint practice, it is a need for a much clearer and simpler wording to clarify the rules of allocation, in order to facilitate the comparison among different products.
e) Data quality
A lot of data is collected during the inventory phase of the assessment. A full life cycle assessment calls for different data including primary data from the plants as well as secondary

Comparisons of the CF Methodologies
23
data mainly from databases. There may be difficulties in finding good data. A lack of information may often happen and causes uncertainty. In many situations, the cut-off criteria are set due to the availability of data.
It is always preferable to use high quality data, which means accurate, credible and complete, following the data requirements in the standards.
f) Certification
Not all the LCAs are subject to certification and the review could be different in different forms and under different requirements. For a certified EPD programme, certification is a seriously crucial procedure. It is intended to enhance the credibility and quality of the programme. Moreover, the norms which are asked to be reviewed could have to ensure comparability between the programme and other similar products.
Whether certification is needed and how to implement the certification should be explained in the CF standards.
g) Land use
Land use by agriculture, forestry, mining, house-building or industry results to different environmental impacts, especially on carbon emissions and storage. Along with the increasing interest and application on biofuels, impact from land use changes is brought to widespread attention. Risks on deforestation and the conversion of other natural areas are increased as result of crop production displaced through biofuel development. The quantification of direct land use changes is rather well understood and can be based on land cover data in LCA, while indirect land use changes has not covered by any GHG balancing scheme yet because the methods and data requirement are not fully developed (Uwe 2007). Such indirect land use could be deforestation for new soy production to “replace” soy that are utilized to produce biofuels but no longer exported. Whether the changes in the carbon content of soils or biomass, or emissions of non-CO2 GHG from soils, due to changes in land use should be included in the LCA programme and to what extent and how to calculate them should be classified in the methodologies.
h) Other
Other issues might also exist for LCA programmes as well as carbon footprint calculation. Carbon offset, as the financial instrument representing a reduction in greenhouse gas emissions might be adopted by companies, typically generated from renewable energy and energy efficiency projects. It is normally not allowed to include the carbon offset in LCA programme. The offset mechanisms may invest in projects that reduce emissions in developing countries as an alternative to more expensive emission reductions in their own countries. The development of global market enhances the trading of renewable energy across borders. It is difficult to distinguish and estimate displacements effects. For example, the share of are utilized for producing biomass for export will reflects the origin yields. How to calculate those impacts should be identified in the methodologies.

Comparisons of the CF Methodologies
24
3.3.2 Comparison between PAS and MSR
Based on the several methodological issues introduced above, different setting for PCR and MSR are identified and discussed.
a) Functional unit
PAS require the GHG emission calculations carried out in terms of the mass of CO2eq per functional unit. It is in particular explained that for services of goods delivering a service, the functional unit should present per unit of service provided.
Similar setting could be found in MSR with in particular note that the length of life of a product is required to take into account.
b) System boundaries
Life cycle thinking is the base of the two methods. Both PAS draft and MSR cover all the phases “from cradle to gate” for raw materials and semi-manufactured products and cover “from cradle to grave” for the end products.
In MSR, a separation is made, dividing the whole products’ life cycle into two phases, manufacturing and use phase, due to the likely lack of information on distribution and end of life handling. Compared with MSR, see Table 3.2, PAS is more detailed on the different processes with a list of descriptions and requirements comprising of raw materials, energy, manufacturing and service delivery, storage, transport, use phase, recycle and reuse, and final disposal. Storage is specific stated in PAS and the only process which is mentioned in MSR but not in PAS is the maintenance.
Table 3.2 Comparison between PAS and MSR_1
PAS MSR Processes in the system boundaries
raw materials, energy consumption, manufacturing and service delivery, storage, transport, use phase, recycle and reuse, final disposal
Manufacturing phase (from raw materials acquisition to manufacturing), Use phase (from distribution to recycling or final disposal )
Geographical boundaries
Mentioned in data quality issue Not specified
Time boundaries Mentioned in data quality issue Maintenance not more than 3 years
In PAS, System Boundary section (Chapter 6, PAS 2050) also does not include any geographical boundaries requirements or time boundaries requirements. However, in Data section (Chapter 7, PAS 2050) geographical specificity and time-related coverage are suggested, which means data that are geographically-specific and time-specific to the product being assessed shall be preferred.
Compared with PAS, there is no clear setting for geographical or time boundaries in MSR. But it is specially referred that the environmental impact from maintenance and production of spare parts with a life cycle more than three years need not to be included.

Comparisons of the CF Methodologies
25
b) Cut-off criteria
For the cut-off criteria, PAS and MSR have quite similar rules. In both PAS and MSR, loss of information that does not contribute with more than 1% of the total impact is accepted, which means some minor contributions could be excluded if the inputs accounting for 1% or less.
Capital goods is one of the focused cut-off criteria. It includes buildings, machinery, vehicles etc used to produce the products. In practice it is rare that production of capital goods is included since more data to be collected makes it not quite feasible. In both PAS and MSR, it is clearly pointed out that the production of capital goods is excluded.
Personal-related aspects are another topic. Processes require personnel and personnel need food, transportation and so on. Usually the personnel-related environmental impact is not included in LCA, as what is set in MSR.
PAS also refer to this topic. Compared with MSR, four related issues are set in the cut-off criteria as following. It did not exclude the personnel generally all round, so questions on personnel travels exist.
• Human energy inputs to processes and/or preprocessing (e.g. if fruit is picked by hand rather than by machinery);
• Transport of consumers to and from the point of retail purchase; • Transport of employees to and from their normal place of work; • Animals providing transport services.
(Adapted from PAS 2050, Chapter 6, BSI, 2008)
c) Allocation choices
For the allocation choices, one key issue is whether system expanding is allowed or not. This method of avoiding allocation, as advocated in ISO14044, in not applicable within the framework of the system for EPD. In MSR, system expanding is clearly inhibitive. When choosing allocation rules, MSR recommends three principles.
• For multi-output (processes that results in several products), economic allocation could be used or it could also based on the way in which resource use and pollutant emissions change following quantitative modifications in products or functions.
• For multi-input, physical allocation could be used, which based on the relationship between how the output from the process is affected by changes in the different input flows.
• For open loop recycling, no allocation should be made for materials subject to recycling.
(Adapted from MSR 1999, SEMCo, 2000)
In PAS, allocation is separately explained in different processes, which clarifies all the processes which might need allocation, including co-production, emission from waste, emission from energy, emission from transport, use of recycled material and recycling and emissions associated with reuse and remanufacture. Many of those processes could be grouped into the three situations which have been listed in MSR. Co-production belongs to multi-output, all the emission from waste, combustion of methane, emission from transportation are multi-input, and open loop recycling/reuse could be addressed in the open
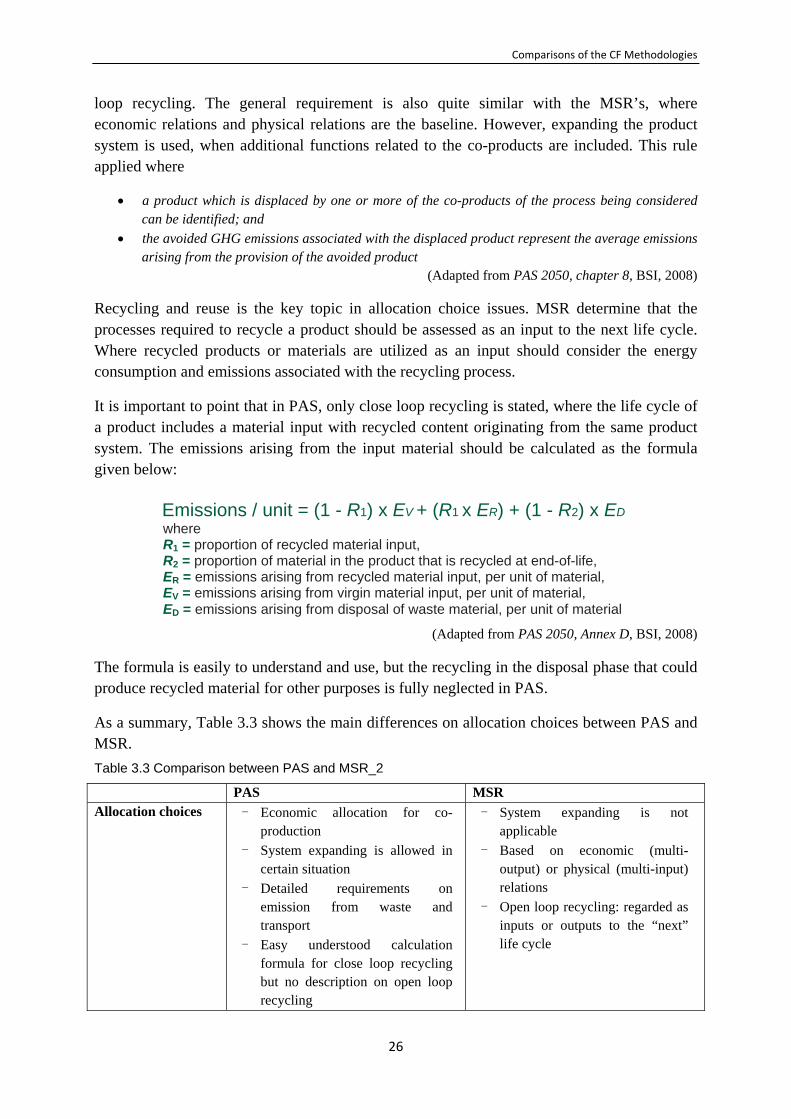
Comparisons of the CF Methodologies
26
loop recycling. The general requirement is also quite similar with the MSR’s, where economic relations and physical relations are the baseline. However, expanding the product system is used, when additional functions related to the co-products are included. This rule applied where
• a product which is displaced by one or more of the co-products of the process being considered can be identified; and
• the avoided GHG emissions associated with the displaced product represent the average emissions arising from the provision of the avoided product
(Adapted from PAS 2050, chapter 8, BSI, 2008)
Recycling and reuse is the key topic in allocation choice issues. MSR determine that the processes required to recycle a product should be assessed as an input to the next life cycle. Where recycled products or materials are utilized as an input should consider the energy consumption and emissions associated with the recycling process.
It is important to point that in PAS, only close loop recycling is stated, where the life cycle of a product includes a material input with recycled content originating from the same product system. The emissions arising from the input material should be calculated as the formula given below:
(Adapted from PAS 2050, Annex D, BSI, 2008)
The formula is easily to understand and use, but the recycling in the disposal phase that could produce recycled material for other purposes is fully neglected in PAS.
As a summary, Table 3.3 shows the main differences on allocation choices between PAS and MSR. Table 3.3 Comparison between PAS and MSR_2
PAS MSR Allocation choices - Economic allocation for co-
production - System expanding is allowed in
certain situation - Detailed requirements on
emission from waste and transport
- Easy understood calculation formula for close loop recycling but no description on open loop recycling
- System expanding is not applicable
- Based on economic (multi-output) or physical (multi-input) relations
- Open loop recycling: regarded as inputs or outputs to the “next” life cycle
Emissions / unit = (1 - R1) x EV + (R1 x ER) + (1 - R2) x ED where R1 = proportion of recycled material input, R2 = proportion of material in the product that is recycled at end-of-life, ER = emissions arising from recycled material input, per unit of material, EV = emissions arising from virgin material input, per unit of material, ED = emissions arising from disposal of waste material, per unit of material

Comparisons of the CF Methodologies
27
d) Data quality
In both two documents, rules on data quality are set. Specific data/primary data which means the plant specific data is required in the processes owned or operated by the EPD or PAS producers. A list of databases that could be referred in the programme is given in PAS as well.
MSR is even stricter on the use phase. Primary data is required generally, but generic data should be used in use phase and waste handling phases. Besides, data from use phase should be based on documents tests, verified studies, or recommendations concerning suitable product use.
In MSR, a limitation is set that the total generic data used instead of specific data must not exceed 10%. Description and motivation is also needed to explain why different types of information are used.
While in PAS, it is regulated that primary data should be used where the organization implementing contribute 10% or more to the upstream GHG emissions. Those calculations should be based on processes that owned, operated or controlled by the same organization, which means if several suppliers are owned by one company, their emissions should be considered as a whole. When their emissions in total contribute more than 10% of the entire upstream GHG emissions, primary data is required. Therefore, for a product with huge use phase which contributes most of the emissions, PAS has a stricter rule than MSR on the percentage of general data used in the upstream processes.
The following table shows the biggest differences between PAS and MSR on data quality.
Table 3.4 Comparison between PAS and MSR_3
PAS MSR Data Quality
- Primary data requirement not apply to downstream emission
- Primary data should be used for process which contributes more than 10% of the upstream emission
- Generic data should be used in use phase and waste handling phases.
- Generic data instead of specific data must not exceed 10% of the contribution
- More requirements relies on PCR
e) Certification
Since the certification is a crucial procedure for a certified EPD, tasks for and competence requirements on accredited certification bodies were listed in the appendix of MSR documents, which clearly set the rules on how to verify the EPD programme, including the scope of the examination, verification procedure and the items which are required to examine.
In PAS, there are not requirements on the certification, but certification is suggested. Competence requirements for independent third party certification, other party verification and self verification could be found. PAS listed the relevant ISO standard for the certification
Comparisons of the CF Methodologies
28
bodies and different forms of disclosure are also schemed, according to the certification bodies.
f) Land use
Not any description about land use changes could be found in MSR. Correspondingly, in PAS separate section is used to describe the approach of land use. All the GHG emission from direct land use change that is associated with the input of the upstream of the production is under consideration. The IPCC Guidelines for National Greenhouse Gas Inventories is used as the rules of calculating the land use impact and indirect impact from land use is excluded. According the basic rule of conservative assumption, if the former land use before the changes is unknown, the worst case should be used. Also, although the GHG released from biogenic carbon sources should be excluded in the calculation, but the GHG released from land use changes is not included in such case.
g) Others
MSR does not include any information related to carbon offset, while in PAS carbon offset schemes is not allowed as a baseline. It is the intention that the GHG offset projects should not be considered prior to the GHG accounting of the production process. PAS also clarifies that any renewable energy utilization which leads to lower GHG emissions does not belong to offsetting.
3.4 Conclusion on CF Methodologies Based on the comparison between PAS and MSR documents, it could be concluded that PAS is very detailed, especially in production and storage phase, while MSR is less spelled out. It could be comprehended in respect that PCR documents could explain different requirements in detail for each product categories.
Compared with MSR, PAS is even more detailed and particular. Instead of defining a more generic framework and setting of criteria guidelines, PAS intended to define and stipulate one specific methodology in technical detail for greenhouse gases. However, it is not possible to be sufficiently robust for serving the various applications. PAS describes the processes exhaustively, but tendency could be identified. Not like other processes such as storage and energy uses, the use phase is quite limited and maintenance is disregarded. It is difficult to find any methods in PAS for open loop recycling and the data requirements for upstream are not easily applied on large amount of suppliers. Though it is aimed to cover all the categories, PAS still is a methodology focusing on consumer products but not suitable for long life products, such as trucks. As it is mainly based on the greenhouse gas emission calculation standard from Carbon Trust, which has been already adopted in some retailers, PAS is quite localized.
On the other hand, MSR is a little bit too general for a carbon footprint calculation because it covers multiple issues but not specially focus on GHG emissions. Land use and other specific issues which are crucial for a carbon footprint accounting could not be found in the MSR
Comparisons of the CF Methodologies
29
documents. Also it is a specific application guideline for communication, so the format of the EPD and the different procedures to complete and present a certified EPD is emphasized. It does not focus on details but set a series of general and flexible rules which could be further specified depending on the applications. Therefore, the PCRs become very important as the complements. The PCRs sets detailed rules and help different industry to deal with their sector specific issues.
Overall, four of the CF methodologies which have been introduced in this chapter could be notable for calculating CF for products. ISO 14025:2006 together with MSR1999 and PAS 2050 are current available while new ISO for carbon footprint and new GHG Protocol for supply chain could also be considered in two or three years. The comparison between PAS 2050 and MSR1999 shows that PAS 2050 might be more suitable for consumer products. Meanwhile, MSR1999 still relies on the PCR to specify the detail requirements. It is hard to forecast the development process of new ISO standard and the new GHG Protocol, but all the methodological issues which have been discussed in this chapter should be covered in these two standards.
Volvo Trucks EPD
30
4. Volvo Trucks EPD In previous chapter, the possible CF methodologies are stated and PAS and MSR are specifically compared. PAS is more likely a method for consumer products. But EPD might pay an important role in the development of new ISO standard. In this chapter, Volvo Trucks EPD is reviewed and compared with MSR requirements. A published PCR for passenger vehicles are also referenced due to the lack of PCR for trucks. The main purpose of the review and comparison is to find out how well the estimations made in Volvo Trucks EPD are suited for the potential carbon footprint methodology.
4.1 Introduction of Volvo Trucks EPD Volvo Trucks was one of the first manufacturers in the world to create their EPD. In 1998, the first EPD programme was launched in Sweden. The ISO text for Type III environment declaration (ISO 14025) came out in 2000. In 2001, Volvo Truck published their EPD, which was used for Volvo FH and Volvo FM trucks.
This EPD is based on a screening LCA, dealing with the Volvo truck FH/FM for European market. The study is split up into sixteen parts, each of which covers one of the sixteen modules of the truck. So environmental hot spots are identified during the study and further improvements on their environmental performance could be taken for each module.
It has been proved in the EPD that the fuel consumption during use phase is extremely important and production of module 50, the engine production is the main contributor of the total environmental impact during the manufacturing. However, Volvo Trucks still believes every part of the whole life cycle should be worked on rather than only focus on the fuel issues. Therefore, continuous work is carried out yearly in order to keep Volvo Trucks EPD updated since 2001.
In this chapter, the latest edition which was updated in June 2008 is reviewed with special focus on global warming results.
4.2 Methodological Issues in Volvo Trucks EPD In order to compare with the possible standards, the methodological issues discussed in chapter 3 are used to analyze Volvo Trucks EPD in this section.
a) Functional unit
Volvo Trucks EPD utilize one truck’s lifetime as the functional unit. It is assumed in Volvo Trucks EPD that one Volvo truck could be driven for 1.25 million km before it goes to the finial disposal. It is based on the driving distance of Euro 4 and Euro 5 standards.

Volvo Trucks EPD
31
b) System boundaries
Volvo Trucks EPD covers all the phases from cradle to grave, including materials and production, use, maintenance and disposal. In their LCA report, the processes are described in Table 4.1:
Table 4.1 Process description of Volvo Trucks EPD, Volvo Trucks, 2001
Process Name Process Description
Materials Total inventory of the materials in each module. From the extraction of the raw materials to the manufacture of the materials used both in our suppliers’ plants and in our own production plants in Europe. Transport is also included.
Production Environmental data from all five Volvo Trucks production plants in Europe, including transports.
Use Production of diesel and exhaust emissions during the trucks lifetime (1,250,000 km).
Maintenance Materials used during the usage, or service life of a truck.
End of life Most of the materials in the truck, mainly steel and aluminium are recycled. Batteries and oils are also recycled, while the remainders of the materials are disposed of as landfill.
In this EPD programme, material and component suppliers are mainly from European countries except a few from USA and Brazil. Five Volvo plants are involved and environmental data such as energy consumption, material uses, emissions to air and water, and etc were reported from these five plants. The plants are located in Umeå, Köping, Skövde, Tuve in Sweden and Gent in Belgium. Cabs, gearboxes, front axles, castings, engines and frames are produced in the four plants in Sweden and the trucks are assembled in Tuve and Gent.
c) Cut-off criteria
Two items of criteria are set in the EPD that could be cut off. One is the additional modules which might be added as customers’ requirements. It would bring large various if the additional modules are considered. The other item is that the surface treatment of screws is excluded, because the weight of screws and nuts only accounts for approximately 2% of the total weight of a truck.
d) Allocation choice
In Volvo Trucks EPD, partitioning is applied based on mass on resource consumption and emissions associated with the multiple processes. System expansion is used in allocation for recycling and reuse, which is not allowed in certified EPD and MSR1999. The recycled materials are assumed to replace the new materials as input of the production and therefore fewer resources, including raw materials and energy were used in the material and production.
Volvo Trucks EPD
32
The counteraction of the resource consumption is represented as the negative values on different environmental impact indicators.
e) Certification
Volvo Trucks EPD has not been certified and no implementation of certification is planned.
f) Data and the assumption
Volvo Trucks uses LCAiT software and all the data of material production is based on the global databases and the weight of the material used in a truck. GaBi, another LCA software with compatible is also used in recent years. Specific data is used in Volvo’s plants while no specific data used from the suppliers manufacturing. It is estimated that production at the suppliers manufacturing sites has the same value as the production at Volvo internal sites.
g) Land use and others
Not any land use and other specific issues manifest in Volvo Trucks EPD.
4.3 Assessment in Volvo Trucks EPD Figure 4.1 shows the full life cycle flowchart of the production of the Volvo FH/FM trucks.

Volvo Trucks EPD
33
Figure 4.1 Full life cycle flowchart of Volvo Trucks
The truck’s whole life cycle comprises material and production phase, use phase and end of life (EoL) phase. The material and production phase could be considered as phase “from cradle to gate”. Maintenance is included in the use phase. EoL phase covers recycling, reuse

Volvo Trucks EPD
34
and final disposal. In Table 4.2, the descriptions of assessment used in Volvo Trucks EPD for the corresponding processes in Figure 4.1 are presented.
Table 4.2 Detailed processes description of Volvo Trucks EPD
Process Name Detailed Assessment Description 1 Material production Data used from LCI data in LCAiT 2a Transport from Material production to
external components manufacturing - Estimated together with the external components production (3a in Figure 4.1) - Estimated that the external components production incl. transport has the same value as the internal components production (3b in Figure 4.1) incl. the Transport within Volvo (4b in Figure 4.1)
2b Transport from Material production to internal components manufacturing
- Calculated together with Transport from external components manufacturing to Volvo assembly(4a in Figure 4.1) as ‘Transport to Volvo’ in a whole - The calculation is carried out by countries.
3a External components production - No specific data from the suppliers - Estimated that production at the suppliers manufacturing sites has the same value as the production at Volvo (3b in Figure 4.1)
3b Internal components production Specific data used from Volvo Truck’s five manufacturing plants
4a transport from external components manufacturing to Volvo assembly
- Calculated together with Transport from Material production to internal components manufacturing (2b in Figure 4.1) as ‘Transport to Volvo’ in a whole - The calculation is carried out by countries.
4b transport from internal components manufacturing to Volvo assembly
Calculated as the ‘Transport within Volvo’
5 Volvo Assembly - Specific data used from Volvo Truck’s five manufacturing plants - Packaging is excluded
6 Transport from Volvo assembly plants to the dealers
Excluded due to the lack of information
7 Dealers The emission from storage phase is excluded. It is assumed that no lightening or heating needed during the storage.
8 Transport from Dealers to customers Assume that no extra transport needed in this process 9 Use phase - Fuel consumption, exhaust emission and maintenance
are all included. - Data based on the Volvo instructions and also from certain service workshops - Transport for the spare parts is excluded
10 Transport from customers to disassembly plants
Excluded due to the lack of information
11 Disassembly Excluded due to the lack of information 12 Transport from disassembly plants to
Recycling plants Excluded due to the lack of information
13 Recycling - Steel and aluminium (most of the materials of the truck) are recycled and used to make new production

Volvo Trucks EPD
35
materials - Batteries and oils are also recycled - the replaced parts from maintenance is excluded - System expanding is used. The reduced impact from materials that replaced by reused material is included as negative values.
14 Transport from disassembly plants to landfill
Excluded due to the lack of information
15 Final disposal Assume there is not any waste from the landfill and the waste are treated without leakage.
According to the above figure and table, several processes have not been covered or assumed that could be neglected. Among those processes, the cut-off on the transport from dealers to customers, the storage process and landfill are quite reasonable. The transport from deals to customers could be considered as a part of driving, which has been covered in the use phase. There are hardly any heating, lighting or other electricity uses to store the trucks in the open air. And the end-of-life vehicles residual parts which go to landfill are almost inert. Other processes listed as following should be checked if the environmental impact is under the limit of 1% contributions accounting.
- Some transport, mainly aftermarket transport, including transport to deals, customers, disassembly and landfill
- Packaging materials
- Disassembly process, in particular the energy consumption when disassembling
- Final disposal of the plastics used in the trucks
- Spare parts, the materials and production of spare parts are covered, but recycling and transport of the spare parts is excluded
Besides, the suppliers manufacturing, including the transport of materials to the manufacturing sites, is assumed to have the same impact as internal manufacturing including internal transports. The calculation was made based on the economical values. However the employee who took responsibility on the calculation was retired and there were no documents left to explain the estimation.
Due to the availability of information, not all the above issues are assessed and estimated in this study.
4.4 Result of Global Warming Potentials in Volvo Trucks EPD In the EPD, the Global Warming Potentials assessment is related to the area of carbon footprint. The total carbon emission of a truck in its life is 1,313,616 kg CO2eq, based on the assessment descriptions in Chapter 4.2. The greenhouse gas emission impacts from different processes are listed in Table 4.3.

Volvo Trucks EPD
36
Table 4.3 GWP results from Volvo Trucks EPD
Process Name GWP (kgCO2eq) Material production 8,710Suppliers manufacturing - Transport from Material production to external components manufacturing - External components production in suppliers sites
1,810
Transport to Volvo - Transport from Material production to internal components manufacturing - Transport from external components manufacturing to Volvo assembly
879
Volvo manufacturing - Internal components manufacturing - Volvo Assembly
945
Transport within Volvo 865Use phase - Fuel consumption - Exhaust emission
1,303,331 220,873
1,082,458Maintenance 1,826End of Life -4,750
Total 1,313,616Total*(without Recycling) 1,318,366
The GWP value on End of Life phase is -4,750 kg CO2eq per truck, which indicates the reduced global warming impact from the replacement of the recycled materials. In Figure 4.5, it clearly shows that the use phase is the main phase which contributes most of the emissions, as it is well-known in the trucks industry. It represents more than 98% of the total global warming impact of the whole life cycle, while material and production phase only stands for 1.00% of total impact.
98.64%
1.00%0.36%
Material and ProductionUse phaseEnd of life
Figure 4.2 Pie chart on the contribution from different phases
For Volvo manufacturing, it only accounts for 0.07% of the total impact, which is less than 1% and would be considered as no material contribution in MSR, which means it could be excluded in the calculation. See Table 4.4.

Volvo Trucks EPD
37
Table 4.4 Contribution from different phases to the total Global warming impact
Process Name GWP /kg CO2eq Percentage (excluded EoL phase)
Material 8,710 0.66% Suppliers’ manufacturing* 1,810 0.14% Transport 1,744 0.13% Volvo manufacturing 945 0.07% Use phase 1,303,331 98.86% Maintenance 1,826 0.14% Total*(without Recycling) 1,318,366 - *The transport from materials to suppliers is included in the suppliers’ manufacturing
According to the “cradle to gate” data shown in Figure 4.3, among all the phases in material and production, Volvo Manufacturing only represents 7.2% of the total impact of the whole material and production phases and a large proportion of the contribution comes from materials, which stands for 65.9%.
65.9%13.7%
13.2%7.2%
Materialsuppliers manufacturingTransportVolvo manufacturing
Figure 4.3 Pie chart on the contribution from different phases in material and production
4.5 Evaluation on the Assumption and Estimation Made in Volvo Trucks EPD In chapter 4.2, some issues are identified that were excluded in the Volvo Trucks EPD, including the aftermarket transport, packaging materials, energy consumption in disassembly process, leakage from landfill and disposal of spare parts. Also environmental performances of suppliers manufacturing is still unknown.
Due to the availability of information, not all the above issues could be estimated. Some of the issues are discussed in this section and the evaluation shows how some issues influence on the whole life cycle global warming impact.
4.5.1 Suppliers
There are approximately 1,900 suppliers of Volvo 3P, two third of which could be assumed as suppliers for Volvo Trucks while the rest is for other companies in Volvo Group. The 1,260 suppliers provide approximately 9,700 different parts. Up to now, there is no indication on any trend for vehicle manufacturers to require the environmental data from their suppliers.

Volvo Trucks EPD
38
Such specific environmental data might need to be collected with the help of Volvo. It might be preferable if some of the suppliers have implemented a LCA program or EPD and then the more accurate assumption could be made based on the data from those suppliers. General data could also be used, if LCA has been made for some certain components by other researches.
In this study, the quantitative evaluation could not be made due to that Volvo Trucks’ Bill of Materials (BOM) was unavailable. With BOM, suppliers and the relevant components from each supplier would be easily indentified, which is the primarily work for estimating the environmental data of suppliers.
Experiences could be learnt from Tomas Rydberg at IVL, who did a complete LCA of jeep type of vehicles produced by Hyundai in Korea. The methodology involved a training seminar, which called for all the suppliers to attend. Questionnaires were designed to collect data from the suppliers. In total, two person years at IVL and one person year at Hyundai were spent on this project. To collect the data from Volvo Trucks’ suppliers, one day per one supplier could be referenced. Then it would be a time consuming task for Volvo. Based on the results of the existing EPD, CO2eq emitted from suppliers’ manufacturing only accounts for 0.15% of the whole life cycle including use phase. It is then reasonable to be cut off according to MSR.
4.5.2 Materials for Packaging
At present, Volvo Technology has just built up some databases for waste generated by Volvo plants, but they are still relatively new and the data is incomplete, due to the failure on reporting the data by waste contractors, who take away normal waste from the assembly work. The waste, including wood, plastics and combustible wastes, are basically the composition from the packaging of different components. Around 50% of the combustible wastes are assumed to be packaging as well by the people at Tuve from waste handling suppliers. Therefore, a brief assumption could be made based on the databases for waste in Volvo’s four plants in Sweden.
The total weight of packaging materials used is about 53.1 kg per truck, consisting of 15.6 kg well and plastics, 13.2 kg wood and 24.3 kg combustible wastes. Assume the combustible wastes are also consisting of plastics and wood which have not been sorted. Therefore the combustible wastes could be normalized into the plastics and wood materials, see Table 4.5.
Table 4.5 Normalization of the combustible wastes into plastics and wood materials
Item Before normalization After normalization Plastics 15.6 kg 28.8 kg Wood 13.2 kg 24.3 kg Combustible wastes 24.3 kg* - *The normalization of the combustible wastes is based on the rate of plastics and wood
Assume that all the plastics materials for Volvo trucks’ packaging are from Europe and are only low density polyethylene (LDPE) and Polypropylene (PP), while all the wood materials for packaging are cardboard.
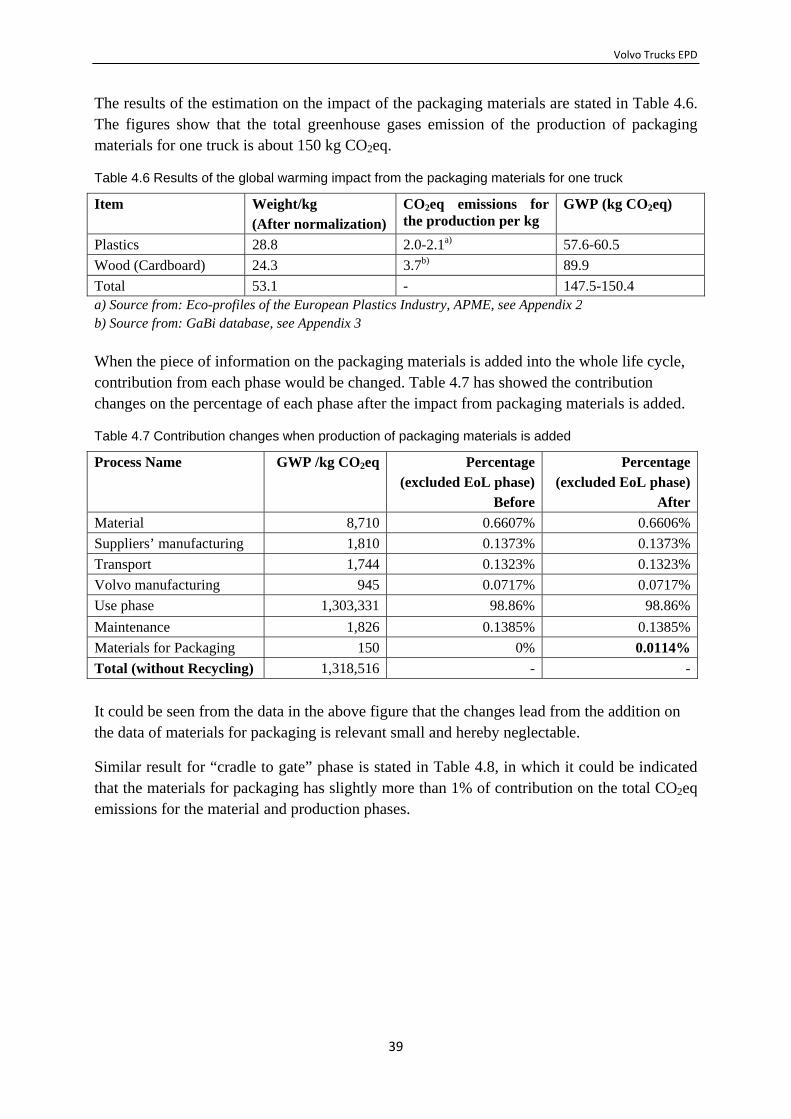
Volvo Trucks EPD
39
The results of the estimation on the impact of the packaging materials are stated in Table 4.6. The figures show that the total greenhouse gases emission of the production of packaging materials for one truck is about 150 kg CO2eq.
Table 4.6 Results of the global warming impact from the packaging materials for one truck
Item Weight/kg (After normalization)
CO2eq emissions for the production per kg
GWP (kg CO2eq)
Plastics 28.8 2.0-2.1a) 57.6-60.5 Wood (Cardboard) 24.3 3.7b) 89.9 Total 53.1 - 147.5-150.4 a) Source from: Eco-profiles of the European Plastics Industry, APME, see Appendix 2 b) Source from: GaBi database, see Appendix 3 When the piece of information on the packaging materials is added into the whole life cycle, contribution from each phase would be changed. Table 4.7 has showed the contribution changes on the percentage of each phase after the impact from packaging materials is added.
Table 4.7 Contribution changes when production of packaging materials is added
Process Name GWP /kg CO2eq Percentage(excluded EoL phase)
Before
Percentage(excluded EoL phase)
AfterMaterial 8,710 0.6607% 0.6606%Suppliers’ manufacturing 1,810 0.1373% 0.1373%Transport 1,744 0.1323% 0.1323%Volvo manufacturing 945 0.0717% 0.0717%Use phase 1,303,331 98.86% 98.86%Maintenance 1,826 0.1385% 0.1385%Materials for Packaging 150 0% 0.0114%Total (without Recycling) 1,318,516 - -
It could be seen from the data in the above figure that the changes lead from the addition on the data of materials for packaging is relevant small and hereby neglectable.
Similar result for “cradle to gate” phase is stated in Table 4.8, in which it could be indicated that the materials for packaging has slightly more than 1% of contribution on the total CO2eq emissions for the material and production phases.

Volvo Trucks EPD
40
Table 4.8 Contribution changes for production related phases when assessed issues are added
Process Name GWP /kg CO2eq Percentage(excluded EoL phase)
Before
Percentage(excluded EoL phase)
AfterMaterial 8,710 65.94% 65.20%Suppliers’ manufacturing 1,810 13.70% 13.55%Transport 1,744 13.20% 13.05%Volvo manufacturing 945 7.154% 7.074%Materials for Packaging 150 0% 1.123%Total 13,359 - - 4.5.3 End of Life Phase
In general, truck producers does not have the responsibility for the recycling of materials at present and the treatment of end of life trucks is quite complex. In Sweden, every year about 37,000 vehicles are registered out of usage. 48% of them are exported, 41% are dismantled and the rest are not in traffic, reregister as other vehicles or have not been notice in use for two year. (Lundqvist 2004) Usually, different spare parts are dismantled and then go to the second hand spare part market. Remaining materials, glasses and plastics are also recycled after shredding and separation.
a) Transport to disassembly
EGARA, the European umbrella association for the national associations of automotive recyclers in Europe, suggests the most environment friendly way of recycling is dismantling the components and spare parts and reusing them by testing, controlling, classifying and registering. (EGARA 2008) EGARA has fourteen national associations of automotive recyclers in Europe, which means end-of-life vehicles are probably treated locally or at least in the same country or the close countries from where the vehicles are out of use. Transport from consumers to disassembly would be relevant few.
b) Energy consumption during disassembly process
Dismantling, shredding and separating are the main processes during the disassembly work for the end-of-life vehicles. For a Volvo FH12/FM12 truck with a total weight of 7,000 kg, about 6,344 kg are dismantled out of an end-of-life truck and the rest goes to shredding and separating processes(Wendin M; Klintbom P. 2003). According to Stefan Söderglöd from Stena Metall AB, approximately 50 kWh is used for one ton input of average scrap from Stena Gotthard's shredding facility in Huddinge. Then the energy consumption for shredding is about 118,080 MJ. Based on the Swedish average data for electricity production in Volvo Trucks EPD (See Appendix 4), 12.88 g CO2eq emission is produced during the production of 1MJ electricity in Sweden. Therefore 1,521 kg CO2eq would be emitted in to atmosphere due to the energy consumption during the shredding process.
Volvo Trucks EPD
41
c) Recycling of the plastics
In Volvo Trucks EPD, most of the metals in the truck as well as batteries and oils are recycled while rest of the materials is assumed to go to landfill. However, some of the materials should be collected and recycled or reused instead of going to landfill, for instance, the plastics. In Sweden, sorted burnable wastes are not allowed to landfill under the regulation on land filling of waste (Lundqvist 2004), which means the plastics would be either recycled or incinerated. In other European countries, which have different regulations, some plastics might be sent to landfill and then CO2 emission would be leaked during the land filling, for example, combustion of methane arising from landfill.
4.6 PCR for preparing an EPD for “Passenger vehicles” Groups of products usually differ in their inherent performance, which need specific rules in order to make the EPD comparable. The PCRs ensure that common and harmonized rules are followed and similar procedures are used when EPD operators create an EPD programme. Therefore, the PCR documents, as complementary to general standards and requirements, are specially developed and utilized.
Up to 2008, 77 PCRs could be found from the website of the international EPD system and more than 20 product categories are covered. (The international EPD®system 2008) Another 27 PCRs are under development, 25 of which are under preparation. In the category of transportation equipment, only PCR on passenger vehicles has been developed by Macroscopio S.p.A., Italy in 2005(Macroscopio S.p.A 2005). This PCR refers to vehicle category M (Vehicle Categories Definition, see Appendix 5), “motor vehicles with at least four wheels designed and constructed for the carriage of passengers”.
Before a new PCR for trucks come out, the PCR for passenger vehicles could draw a general picture for the measurement of vehicles. It will still make sense to go into the requirements on several methodological issues of this PCR and compare Volvo Trucks EPD to it.
In this PCR for passenger vehicles, not all the parts of a passenger vehicle are included in the system boundaries. Main parts which are included are showed in Figure 4.6. Some components are considered as optional parts and should be excluded, since it will be variable from different models. If one of those components is calculated in the EPD, statement and notes are required in the declaration. Spare parts are also excluded but should be declared in the EPD.
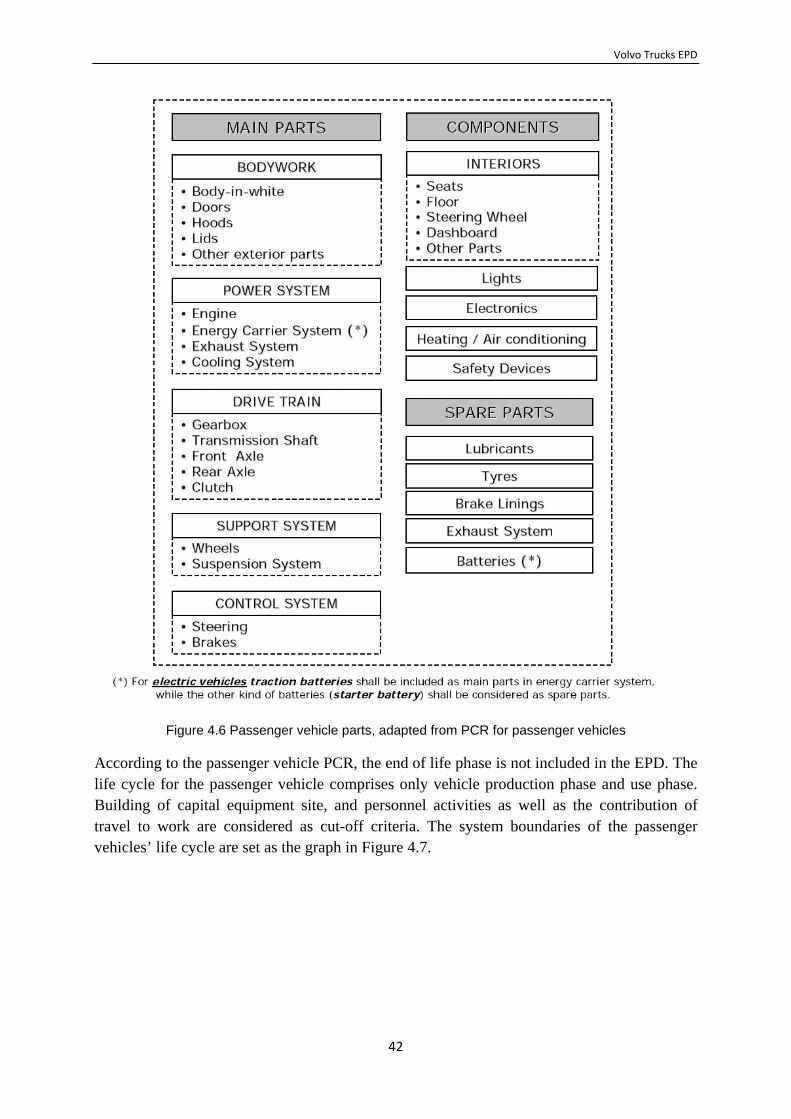
Volvo Trucks EPD
42
Figure 4.6 Passenger vehicle parts, adapted from PCR for passenger vehicles
According to the passenger vehicle PCR, the end of life phase is not included in the EPD. The life cycle for the passenger vehicle comprises only vehicle production phase and use phase. Building of capital equipment site, and personnel activities as well as the contribution of travel to work are considered as cut-off criteria. The system boundaries of the passenger vehicles’ life cycle are set as the graph in Figure 4.7.

Volvo Trucks EPD
43
Figure 4.7 System boundaries in PCR for passenger vehicles, adapted from PCR for passenger vehicles
For data quality, the PCR also requires the contribution of all the calculations based on generic data to each impact category should not be more than 10% of the total contribution.
Comparing with the PCR for passenger vehicles, Volvo Trucks EPD covers more parts of the vehicle. Even the optional parts and excluded parts listed in Figure 4.l are assessed in Volvo Trucks EPD. As stated in this PCR, disposal as well as the transport to disposal is excluded in the system boundary. See Figure 4.7.
In 2000, European Parliament and of the Council announced the directive to put an ultimate goal on the end-of-life vehicle residues which go into landfills at only 5% of the total weight in 2015. And from 2006, for all end-of life vehicles, the reuse and recovery shall achieve to a minimum of 85% by an average weight per vehicle (the European Parliament and of the Council of EU 2000). It means all manufacturing would be force to improve material usage and design for recycling. It might be one of the reason that end of life phase is excluded in the PCR, because almost of the materials of the vehicles would be commonly recycled and the rest which go to landfill are mainly inert.
Improvement on Volvo Trucks EPD therefore would only lie in the data quality that the general data should not exceed 10%.
4.7 Conclusion on Volvo Trucks EPD As an EPD, Volvo Trucks EPD fits MSR documents quite well, expect the end of life phase. Although the treatment of allocation in CF methodologies is still under discussion it would fit the MSR even better if the end-of-life phase could be recalculated without expanding the boundaries and exclude the upstream of the virgin materials that has been replaced by recycled materials.
Based on the result of GWP in Volvo Trucks EPD, all the phases contribute relatively little on the global warming impact, comparing with the use phase. Based on the rules of MSR on

Volvo Trucks EPD
44
material contribution, such phase as Volvo manufacturing and transports which represent less than 1% of the total impact could even be cut-off. It also would be unnecessary to append all the lacked phases as a result of their negligible impact. However, it is unclear about the treatment on the use phase in the CF methodologies, whether the use phase is required to be included, excluded or should be reported separately. If the use phase should be stated solely, some of the phases with lack of information will need to be considered. Among those losses of information, the environmental performance on suppliers has the most significant influence on the total impact in the Volvo Trucks EPD. It is calculated under an economic assumption, however, how this assumption is applied is not clearly stated which is required by the MSR. Materials for packaging should also be added although the impact is quite small.
Besides, general data are commonly used in Volvo Trucks EPD. If the use phase is excluded, the requirement on the percentage of specific data is difficult to achieve, highly due to the complexity of a truck with many components from many suppliers. In MSR, general data should be less than 10% of the contribution on the entire impact, while PAS has a looser limitation that only requires 60% on the specific data.
At present, no specific PCR for trucks has been developed. And Volvo Trucks EPD is not a certified EPD. It basically fits the MSR, but if Volvo Trucks would like to make the EPD certified, a new PCR for trucks should be developed first.

Discussion
45
5. Discussion In previous chapters, carbon footprint and its methodologies have been introduced as well as Volvo Trucks EPD. In this chapter, discussion is developed into three parts, covering the counterview and doubts of carbon footprint, the potential development of carbon footprint and the further work for Volvo on their carbon footprint calculation. The conclusion is also conferred in this chapter.
5.1 Counterview and Doubts on Carbon Footprint
5.1.1 Is Carbon Footprint Enough?
For the experts working with full detailed LCA, it is thought-provoking whether problems could be captured in such a single indicator like carbon footprint. PlasticsEurope, the association of European plastics manufactures pointed out that carbon footprint tells only about carbon emissions but nothing about total environmental impact: “Many other factors, such as acidification, ozone depletion, energy consumption, soil and water pollution and etc. need to be considered, in order to get an all round picture.” (PlasticsEurope 2008)
Is one indicator of only greenhouse gases enough? Compared with the multiple indicator approach in LCA, it is crude to focus on the global warming potential alone, which may give a misleading picture on the impacts. Weidema (Bo P. Weidama 2008; Weidama B 2008) showed one example in his study. Bio-fuels, which will have a low carbon footprint, might give customers an impression of an environmental friendly product, neglecting its negative land use impacts and pressure on forests and global food supplies. As a matter of fact, land use has been considered as an important issue for the development of carbon footprint methodologies. Up to now, it is still under discussion in different on-going projects and need to be fixed up appropriately.
Being a communication tool, carbon footprint is seized on by companies to build a competitive advantage and deliver messages on the environmental performance of the product. The ordinary customers mostly as laypeople, when invited to compare products with carbon footprint, will likely evaluate the sustainability performance of products on the basis of their carbon footprint purely. PlasticsEurope thought the expectation on doing the right thing for the environment may be led to make precisely the wrong choices. They mentioned especially the decision about packaging is an example that shows not only environmental but also economic and social dimensions should be taken into account. Instead of simply comparing carbon footprint, a balance between the functional benefits of materials, cost, end-of-life treatment, and a whole host of other factors should be found, in order to attain sustainable production and consumption. Therefore, they presented their opinion that a more complete LCA will be fairer, more comprehensive and more transparent in their area (PlasticsEurope 2008).
In another aspect, the concept of carbon footprint is easy to understand by the consumers. It is still better to have such a single issue indicator than to have nothing, since the public might
Discussion
46
not be able to hold too much concern on different environmental issues. It will be easier to focus on one or few.
5.1.2 Will Carbon Footprint Affects the Consumers’ Behaviours?
When looking back to the eco-label development, the labelling activities might have succeeded to make a positive effect on product development and product benchmarking in terms of improved environmental performance, but meanwhile had little effect on consumer purchasing. Roland Clift pointed out that even in Sweden, one of the countries with relatively high environmental awareness, only 2 to 3% of private consumption was eco-labelled products and services. In his opinion, eco-labels do not mean a lot for the end consumers, majority of which are the laypeople. While the negative labelling, which expresses the serious environmental impacts of the products, have greater influence. Will situation be the same for carbon footprint? Will carbon footprint has strong influence on the behaviour of customers as expected?
It will be fascinating to see how consumers respond. Will they even take notice of the carbon footprint? But before that, it is important to make sure that the carbon footprint is given in a meaningful context. People may not make any sense of a number stating for example 141 grams of CO2 for a bottle of shampoo. Some early reactions from retailers such as Boots in UK showed that the consumers fail to understand the information. According to a survey of Boots’ customers, 44% of the customers confused the label with fair trade, although a majority thought it is important to have some figure which is given on the emission during the items’ production (Deans 2008).
“The real purchasing choices are made (or at least constrained) by the retailers who decide what is available.” Clift argued in his study. Being in the industrialized societies, people buy products especially consumer goods by the basketful, what is on the shelves or what is available for home delivery dictate the purchasing in nowadays. For product carbon footprint, the study was raised by retailers such as Tesco, the largest supermarket chain in Britain at the moment. In January 2007, Terry Leahy, the CEO of Tesco, expressed that their customers are ready and willing to do more against climate change if they could make it easier and affordable (Leahy 2007). For the retailers and other actors in the supply chain, carbon footprint could help them to find the hot spot during the entire supply chain and might empower them to improve their environmental performance, make informed choices and drive a market for low-carbon products.
5.2 Future Trend of Carbon Footprint
5.2.1 Increasing Interest in Carbon Footprint from Public
Carbon footprint becomes more popular not only in Europe but also all over the world. In August 2008, a plan on labelling consumer goods with carbon footprint has been stated in Japan by the trade ministry in bid to raise public awareness on global warming. The project will start in April 2009, covering some selected range of products, such as beverages and
Discussion
47
detergents. More than 20 companies have joined in the project, including the leading retailer Aeon and beer production company Sapporo Breweries, who will show their carbon footprint labels at an environmental friendly products exhibition in the end of 2008. (AFP 2008)
It is easily perceived that carbon footprint would be paid more attention in the future three to five years, along with the development of correlated approaches and methodologies.
The basic reason of the rapid increase in popularity of carbon footprint is the increased climate change awareness in society. Another reason lay on the transition to a “low carbon economy” (UK Secretary of State for Trade and Industry 2003) or “low carbon society” (Japan National Institute for Environmental Studies) which has been presented as important strategies in many countries. The low carbon economy is a popular term that refers to an economy which has a minimal output of GHG emissions into the biosphere. (Wikipedia 2008) It could be understood in many ways such as low fossil fuel usage, minimum waste, efficient resources utilization or high awareness and compliance with environmental and social responsibility initiatives (The Low Carbon Economy Ltd 2008). Margot Wallström (Wallström 2004), the European Commissioner responsible for Environment, also gave a speech on European Business Summit held in Brussels in 2004, advocating fresh ideas and practical plans for developing a low carbon economy. New policies are consequentially needed to face the new reality, which calls for special concerns on the global warming issue. Carbon footprint apparently has been considered as one of the approaches that could help to enhance the understanding to the environmental issue and to some extent lead a “low carbon thinking” among the consumers as well as the actors in the product supply chain.
5.2.2 Universally Accepted and Commonly Understood Carbon Footprint Methodology Is Required
In July 2008, France proposed an idea of incorporating a carbon element into the EU energy label scheme in the council of ministers on European commission plans for a greener EU product policy (ENDS Europe DAILY 2008). It was a proposal that might lead to a mandatory EU carbon labelling of products. However, the idea was opposed by at least six countries including the UK, Denmark, Hungary and Romania so that it was likely to be dropped. Although why the proposal was opposed is unclear, lack of a harmonized, developed and feasible methodology of carbon footprint might be one of the reasons at present.
According to an article about climate labelling on the local newspaper Göteborgs-Posten in Gothenburg (2008), Tesco also had to slow down on its labelling plan. They first planned to label all their 70,000 products with carbon footprint in January 2007, however the ambitions has been lowered down to only 30 of them instead to see the response. There are high possibilities that the application processes made Tesco realize labelling plan was not that easy as they used to think.
Even though consultant companies as Carbon Trust has already built up their own system to help the retailers calculate carbon footprint, confusion on methodological issues still exists. To what extent should the method cover the entire life cycle of the product is one of the main
Discussion
48
issues. For instance, whether use phase and end of life phase should be included, needs to be clarified. Simultaneity, the system boundaries also determine the requirement of data quality. Full life cycle thinking might require more general data, so the limitation on general data might need to be re-considered. Public databases for LCA are involved in the development of carbon footprint methodologies and collaboration is inevitable. Moreover, how to deal with land use and carbon offset issues in carbon footprint calculation is under discussion.
PlasticsEurope also argued different assumptions might make CF difficult to compare. Whether realistic assumptions, optimistic or idealized scenario are taken in assessment brings varieties on the result (PlasticsEurope 2008). In order to make the carbon footprint results comparable, such assumption issue should also be clearly restricted.
Harmonization of methods is needed, which is the one of motivations to launch the underway projects for new methodologies. Within the unclear situation, it might not be easy to calculate carbon footprint.
5.2.3 Demand on the Product Sector Rules
When thinking about to what extent should the method cover the entire life cycle of the product, another question come out as well. To what extent do products from specific product categories contribute to the overall global warming impact?
It is definitely not meaningful to compare two products in different product categories. And there won’t be any methodology that is suitable for all the products. Some companies, for instance, Fujitsu Services in UK, expressed that industry leaders should work together to agree common standards for calculating carbon footprints in their own area (Marshall 2008).
EPD depends a lot upon product category rules (PCR), and so would new ISO and new GHG protocol likewise. Stronger function is expected from ISO for the sector rules and GHG protocol also listed sector specific issues in the technical topics which are desiderated to be settled. All of these have indicated the importance of the product sector rules.
5.3 Issues for CF related with Trucks According to Lars Mårtensson, Environmental Director of Volvo Trucks, the demand for carbon footprint of Volvo Trucks from the customers is increasing, some of which are from customers of Volvo Trucks’ customers. Who is concerning it? Trucks are used in transport industry from different perspective – independent, family-owned and managed companies. It would be foreseeable that the concern on carbon footprint of trucks might be raised, along with the current fad of carbon footprint among the retails and then the spread of the ideas on having a low carbon logistics.
For the end users of the consumer products, people will not able to know the details of carbon footprint of the products they buy. What they could get is probably only the carbon footprint information on the products’ package in terms of different labels as discussed in chapter 2. While the producers themselves conduct calculation and provide the carbon footprint, or they

Discussion
49
pay consulting companies to do it. Based on PAS 2050, in order to account for the carbon footprint of the transport process, specific data on transport distance and fuel consumption is needed, which may not be known by the carbon footprint producers. Then the logistics companies are involved and it may result in the demand on carbon footprint information to vehicle manufacturing companies, such as Volvo Trucks
However, is the carbon footprint information from Volvo Trucks really required? What kind of information should be provided to satisfy the demand from Volvo Trucks’ customers? As it is known, trucks are considered as capital goods for the logistics companies. In practice it is rare that production of capital goods is included when producing a LCA programme, because more data to be collected makes it not quite feasible. In both PAS 2050 and MSR standard, production of capital goods is clearly stated to be excluded, see chapter 3.3.2, which means the production process of trucks actually would not be necessary to consider for calculating carbon footprint of the products that the trucks are carrying. In point of fact, one may easily get confused on how to deal with the CF accounting related with trucks or other transport without a clear CF methodology.
What is more, as the result from Volvo Trucks’ EPD, the use phase represents the largest part of the total greenhouses emission from the entire life cycle of the trucks. However the trucks manufacturing companies has no responsibility on the usage of trucks but rather the people how plan the routes and drive the trucks, for instance, the logistics companies.
Nowadays, Volvo Trucks are working hard on fuel issues to not only help its customers to reduce fuel consumption and increase fuel-efficient, but also actively search for other fuel alternatives. In the future, with the offer on other fuels, the proportion of contribution on carbon footprint from use phase in trucks’ life cycle might able to be decreased. Obviously, there is still a long way to go.

Conclusion
50
6. Conclusion Based on the above discussion and the review of Volvo Trucks EDP in chapter 4, the suggestions for Volvo Trucks are addressed in this section for the further work on carbon footprint.
6.1 Motivation of Developing Carbon Footprint Data Before making decision on implementing a carbon footprint calculation project, it is necessary to have a clear motivation why Volvo would like to develop their carbon footprint data.
In one hand, carbon footprint is applied as a communication tool, while the function of communication is covered by the EPD system that Volvo Trucks has. The rationale for also providing a carbon footprint profile could be questioned as it may be seen as an easy response to the current focus on the environmental issue of climate change. On the other hand, it would not be very difficult to deliver the carbon footprint data once the methodology is clear, since carbon footprint profile can be derived as a sub-document from the EPD documents to some extent. Potential work will be addressed in the next section.
6.2 Potential work As introduced in Chapter 3, different projects are under progressing. Figure 5.1 in the following shows their scheduled publishing dates.
Figure 5.1 Timetable of different projects
PAS 2050 is at the forefront. The PCR Basic Modules for EPD and climate declaration is due to be finalized soon in November 2008. Both new GHG Protocol standard and ISO standard for products will spend more time and will be available in May 2010 and Early in 2012, respectively. Although it will be able to implement PAS 2050 into application in the first instance, it might not be suitable for Volvo Truck to adopt. The earlier actions on product carbon footprint shows the main CF developers currently firstly focus on testing the reaction on consumer products. Not any examples on communication for business to business could be found, using PAS 2050 as the accounting methodology.
Early 2012
PAS 2050
PCR Basic Modules
GHG Protocol Product/Supply Chain Standard
ISO Standard on Carbon Footprint
for Products
Oct 2008 Nov 2008
May 2010

Conclusion
51
Since Volvo Trucks EPD is developed accreditation with ISO 14025, it is logical for Volvo to choose to use ISO standard based on EPD system. So far, there is not any indication that points out the relationships between the GHG Protocol and new ISO standard, but the cooperation between the two networks might bring in some agreement or consistency on the methodologies. It will be interesting to wait for the new GHG Protocol standard because the previous GHG Protocol standards are good at setting examples to explain the detail calculation work. But ISO might still be the first choice to refer to. It also might be easier to get a certified climate deceleration or carbon footprint if Volvo Trucks EPD is certified.
Before the new ISO standard and new GHG Protocol come out, the demand from customers on GHG emission could be fulfilled by extracting GHG emission data from the existing EPD system. A separated profile on GHG emissions based on the result of Volvo Trucks EPD might be simpler to understand and more desirable for those customers who have special concerns on global warming.
No matter which methodology Volvo would like to adopt in the future, some kind of product sector rules for truck will be crucial, especially for a certified carbon footprint. The PCR for certified EPD is preferable to be developed by the industry sector, which means the truck industry should go together on it. Volvo could wait for the truck industry to develop such kind of document, and could also table a proposal to the industry and try to make contact with other companies. If other companies would not like to participate, then Volvo is allowed to develop the PCR for its own. According to the experiences from SCA, one year might be forecast to spend for Volvo Truck to develop the PCR for EPD with others (excluding public consultation), depending on the resources and a common understanding among the participators on what EPD and PCR are. While if Volvo Truck has to do it solely, it might cost even less time. Also the PCR on passenger vehicles could also be a reference for Volvo to make the new PCR for trucks.
After the new PCR for trucks or the standards come out, it could be clear on the treatment of use phase and the requirement on data quality. It is hard to draw any conclusion at present that the loss of information needs to be completed. However, it could be meaningful to check the environmental performances of some suppliers’ manufacturing to make a better assumption on their contribution.
Overall, this study presents a picture of the current study of carbon footprint and its methodologies. For Volvo Trucks, the existing EPD system has displayed Volvo’s attitude on environmental work and could be utilized as a good basis for the future carbon footprint accounting. A public available GHG emission profile based on Volvo Trucks EPD is suggested in a short term to fulfil customers’ demand. Before the well-accepted methodologies on carbon footprint come out, wait-and-see strategy could be taken. And a further project for developing a new PCR for trucks could be considered, depending on the available resources in Volvo Trucks.
The author of this report hopes that the study may be considered as inspiration for Volvo Trucks’ carbon footprint calculating project or their future EPD work.

References
52
References (2008). GÖTEBORGS‐POSTEN. Gothenburg. AFP. (2008). "Japan to label goods' carbon footprints: official." Retrieved 2008‐08‐19, from http://afp.google.com/article/ALeqM5ivGWDJ‐UGbtYjPYqsJDUh0YXb3Eg. Bo P. Weidama, M. T., Per Christensen, jannick Schmidt, and Soren Lokke (2008). "Carbon Footprint, A Catalyst for Life Cycle Assessment?" Journal of Industrial Ecology 12(1): 4. BP. (2006). "Carbon Footprint Toolkit " Retrieved 2008‐06‐08, from http://www.bp.com/genericResource.do?categoryId=8043&contentId=7037374&Page=new#preview. Carbon Footprint Ltd. (2005). Retrieved 2008‐10‐30, from http://www.carbonfootprint.com/. Carbon Footprint Ltd. (2007). "What is A Carbon Footprint." Retrieved 2008‐06‐08, from http://www.carbonfootprint.com/carbonfootprint.html. Carbon Reduction Institute. (2008). "Carbon Neutral Products." Retrieved 2008‐06‐12, from http://www.noco2.com.au/web/page/products. Carbon Trust. (2008). "Carbon Reduction Label." Retrieved 2008‐06‐12, from http://www.carbontrust.co.uk/carbon/briefing/carbon_label.htm. CarbonCounted. (2008). "CarbonCounted Carbon Label System." Retrieved 2008‐06‐12, from http://www.carboncounted.com/. Deans, D. (2008). "Carbon labels –A green mark too far?" Retrieved 2008‐08‐24, from http://www.climatechangecorp.com/content.asp?ContentID=5111. Directgov. (2008). "Act on CO2 calculator." Retrieved 2008‐08‐11, from http://actonco2.direct.gov.uk/index.html. EGARA. (2008). "European Group of Automotive Recycling Associations." Retrieved 2008‐10‐13, from http://www.egaranet.org/. ENDS Europe DAILY. (2008). "French Presidency to Drop Carbon Labelling Plan." Retrieved 2008‐09‐19, from http://www.endseuropedaily.com/articles/index.cfm?action=index&intTermID=66. EPLCA. (2007). "CARBON FOOTPRINT ‐ what it is and how to measure it." Retrieved 2008‐06‐08, from http://lca.jrc.ec.europa.eu/Carbon_footprint.pdf. GEDnet. (2008). "Available Climate Declarations." Retrieved 2008‐06‐10, from http://www.environdec.com/pageId.asp?id=520&menu=5,17,0. GEDnet. (2008). "Results from GEDnet's questionnaire on climate declarations." Retrieved 2008‐08‐12, from http://www.gednet.org/pdf/2008‐04‐14_gednet_climate_declarations.pdf. Global Footprint Network. (2008). "Humanity's Carbon Footprint " Retrieved 2008‐06‐08, from http://www.footprintnetwork.org/gfn_sub.php?content=app_carbon_footprint.

References
53
Hammond, G. (2007). Time to give due weight to the 'carbon footprint' issue. Nature. 445: 256. IPCC (2007). Summary for Policymakers: A report of Working Group I of the Intergovernmental Panel on Climate Change. ISO (1999). ISO 14024:1999, Environmental labels and declarations ‐‐ Type I environmental labelling ‐‐ Principles and procedures. International Organization for Standardization. ISO (2006). ISO 14025:2006 Environmental labels and declaration‐ Type III environmental declaration, International Organization for Standardization. IVL. (2008). "IVL's carbon calculator." from http://www.climate.ivl.se/default.aspx. Japan National Institute for Environmental Studies. "Japan Low Carbon Society Scenario towards 2050." Retrieved 2008‐10‐21, from http://2050.nies.go.jp/index.html. KRAV. (2008). "KlimatprojektetIn in English." Retrieved 2008‐10‐03, from http://www.krav.se/sv/Klimat/klimat/In‐English/. KRAV. (2008). "KRAV." Retrieved 2008‐10‐03, from http://www.krav.se/sv/System/Spraklankar/In‐English/KRAV‐/. Leahy, T. (2007). "TESCO, Carbon and the Consumer." Retrieved 2008‐09‐10, from http://www.tesco.com/climatechange/speech.asp. Lundqvist, U. (2004). Design for recycling in the Transport sector ‐ Future scenarios and challenges. CPM Report. Gothenburg. Macroscopio S.p.A (2005). Product Category Rules for preparing an environmental product declaration (EPD) for "Passenger Vehicles". Marshall, R. (2008). "CIOs confused over how to calculate carbon footprint." Retrieved 2008‐08‐08, from http://www.whatpc.co.uk/itweek/news/2223606/cios‐confused‐calculate‐carbon. Mesure, S. (2007). "Tesco invests £500m to create 'green consumer revolution'." Retrieved 2008‐06‐22, from http://www.independent.co.uk/news/business/news/tesco‐invests‐163500m‐to‐create‐green‐consumer‐revolution‐432797.html. PlasticsEurope (2008). The 'Carbon Footprint' ‐ an unreliable indicator of environemntal sustainability. Brussels, PlasticsEurope ‐ Assiocation of Plastics Manufacturers. Rees, W. E. (1992). "Ecological footprints and appropriated carrying capacity: what urban economics leaves out." Environment and Urbanisation 4(2): 10. Royal Society (2005). "A guide to facts and fictions about climate change." Royal Society (March 2005). Swenskt Sigill. (2008). "About Swedish Seal of Quality." Retrieved 2008‐10‐03, from http://www.svensktsigill.com/website2/1.0.2.0/441/1/index.php. The Climate Conservancy (2008). "CLIMATE CONSCIOUS METRIC."
References
54
the European Parliament and of the Council of EU (2000). 2000/53/EC Directive on End‐of‐Life Vehicles. t. E. P. a. o. t. Council. The GHG Protocol Initiative. (2004). "A Corporate Accounting and Reporting Standard (Revised Edition)." Retrieved 2008‐09‐07, from http://www.ghgprotocol.org/standards/corporate‐standard. The GHG Protocol Initiative. (2008). "About the GHG Protocol." from http://www.ghgprotocol.org/about‐ghgp. The GHG Protocol Initiative. (2008). "All Tools." Retrieved 2008‐09‐26, from http://www.ghgprotocol.org/calculation‐tools/all‐tools. The GHG Protocol Initiative. (2008). "Product and Supply Chain." Retrieved 2008‐09‐07, from http://www.ghgprotocol.org/standards/product‐and‐supply‐chain‐standard. The international EPD®system. (2008). "Climate declarations." Retrieved 2008‐06‐11, from http://www.environdec.com/pageId.asp?id=500. The international EPD®system. (2008). "ISO starts work on carbon footprinting based on the concept of EPDs." Retrieved 2008‐09‐14, from http://www.environdec.com/pageID.asp?id=160&newsId=418. The international EPD®system. (2008). "Search for PCR." Retrieved 2008‐09‐22, from http://www.environdec.com/pageId.asp?id=110&menu=3,7,0. The Low Carbon Economy Ltd. (2008). " About a Low Carbon Economy." Retrieved 2008‐08‐27, from
http://www.lowcarboneconomy.com/LCE/AboutALowCarbonEconomy. Thomas Wiedmann, J. M. (2007). A definition of 'Carbon Footprint'. June 2007. ISA UK Research Report. Durham, UK, Certer for Integrated Sustainability Analysis. UK Secretary of State for Trade and Industry (2003). Our energy future ‐ creating a low carbon economy Uwe, F. (2007). GHG Accounting for Biofuels: Considering CO2 from Leakage; Extended and updated version. Darmstadt (Germany), Oeko‐Institut. Volvo Truck. (2008). "Our Environmental Commitment." Retrieved 2008‐06‐06, from http://www.volvo.com/trucks/global/en‐gb/aboutus/environmental_care/environmental_care.htm. Volvo Truck (2008). "Volvo Truck's Environmental Product Declaration." Wallström, M. (2004). "Towards a low carbon economy". European Business Summit. Brussels. Weidama B, e. a. (2008). "Carbon Footprint, A Catalyst for Life Cycle Assessment?" Journal of Industrial Ecology 12(1): 4. Wendin M; Klintbom P. (2003). End of Life for Trucks in Europe and Materials Recycling, Volvo Technolgoy Corp.

References
55
Wikipedia. (2008). "Low‐carbon economy." Retrieved 2008‐08‐27, from http://en.wikipedia.org/wiki/Low‐carbon_economy.

Personal Contacts
56
Personal Contacts
Elin Eriksson M.Sc. Researcher
IVL Swedish Environmental Research Institute Ltd.
Ellen Riise Area Manager
SCA
Lars Mårtensson Environmental Director
Volvo Trucks
Lena Tingnäs-Wernlund BMS Process Leader
Volvo 3P
Maria Varbeva-Daley PAS 2050 Project Manager
BSI Standards Solutions
Per Hanarp Environmental Engineer
Volvo Technology Corporation
Roland Clift Distinguished Professor of Environmental Technology
University of Surrey, UK
Member of PAS 2050 Steering Group
Thomas Ekvall Researcher
IVL Swedish Environmental Research Institute Ltd.
(Used to work in Volvo Technology Corp. and also joined in the Volvo Trucks EPD development work.)

Abbreviations
57
Abbreviations
BSI British Standards Institute
CF Carbon Footprint
CH4 Methane
CO2 Carbon Dioxide
CO2eq Carbon Dioxide equivalents
EoL End of Life
EPD Environmental Product Declaration
FH Forward control High cab
FM Forward control Medium Height cab
GEDnet the Global Type III Environmental Product Declarations Network
GHG Greenhouse gases
GWP Global warming potential
IPCC Intergovernmental Panel on Climate Change
ISO International Organization for Standardization
IVL Swedish Environmental Research Institute
LCA Life cycle assessment
N2O Nitrous Oxide
PAS Publically Available Specification
PCR Product category rules
SEMCo Swedish Environmental Management Council

Appendix
58
Appendix 1 Packaging Materials Data
Packaging materials collected from Volvo Truck’s plants
Tuve
(2007) Umeå (2007)
Skövde (2008*) Köping Total
Well [ton] 83 207 424 58 Soft plastics [ton] 64 190.67 3 Hard plastics [ton] 66.67 Combustible [ton] 732 648 861.33 266 Wood [ton] 183 131 376 46 Produced units 29117 60772 90000 82062 Total packaging per truck [kg] ** 21.71 11.95 16.53 2.92 53.11Plastic and well per truck [kg] 2.85 4.46 7.57 0.74 15.62Wood per truck [kg] 6.28 2.16 4.18 0.56 13.1850% combustible per truck [kg] 12.57 5.33 4.79 1.62 24.31 * Jan-Sept normalised to whole year 2008 ** Assumption 50% combustible is packaging waste Source from: Volvo Technology Corp.

Appendix
59
Appendix 2 Eco-profiles of LDPE and PP Carbon dioxide equivalents corresponding to the gross air emissions for the production of 1 kg of low density polyethylene(LDPE). (Totals may not agree because of rounding) Type From From From From From From Totals fuel prod'n fuel use transport process biomass fugitive (mg) (mg) (mg) (mg) (mg) (mg) (mg)20 year equiv 1400000 980000 7400 370000 -11 <1 2700000100 year equiv 870000 970000 7400 230000 -11 <1 2100000500 year equiv 670000 970000 7400 180000 -11 <1 1800000 Carbon dioxide equivalents corresponding to the gross air emissions for the production of 1 kg of polypropylene(PP). (Totals may not agree because of rounding) Type From From From From From From Totals fuel prod'n fuel use transport process biomass fugitive (mg) (mg) (mg) (mg) (mg) (mg) (mg)20 year equiv 860000 940000 8100 620000 -3 <1 2400000100 year equiv 540000 930000 8100 490000 -3 <1 2000000500 year equiv 410000 920000 8100 440000 -3 <1 1800000 Source from: Eco‐profiles of the European Plastics Industry, developed by Association of Plastics Manufacturers in Europe (APME)

Appendix
60
Appendix 3 CO2eq Emission from Production of Cardboard
Cardboard Made of Virgin Fibres Type of emission
Factor kg CO2eq/kg substance
Emission from 1 kg of Cardboard /kg
Result kg CO2eq/kg cardboard
CO2 1 3.71149 3.71149CH4 21 0.000173 0.003633N2O 310 0.000000962 0.000298 Total CO2eq in kg 3.715421 Source from: GaBi database Thomas Ekvall, Elin Eriksson, Mikael Kullman and Göran Svensson, Chalmers Industriteknik, Göteborg, Sweden, Autumn 1992

Appendix
61
Appendix 4 CO2eq Emission from Electricity Production in Sweden
Activity Name: Electricity, Swedish average (large industries) Category: Cradle to gate
Type of emission
Factor kg CO2eq/kg substance
Emission generated during 1 MJ electricity production /g
Result kg CO2eq/ MJ electricity
CO2 1 12.49 12.49CH4 21 0.018 0.38N2O 310 0.00005 0.016 Total CO2eq /g 12.88 Swedish electricity production
The data on Swedish electricity production comes from Vattenfall AB. The electricity mix consists of the following: • 44.2 % Hydropower • 48.6 % Nuclear power • 6.6 % Combined heat and power with a conventional steam cycle with a circulating
fluidisation bed, equipped with flue gas condensing equipment (CFB-KVV), fired with wood fuel
• 0.4 % Oil condensing power • 0.1 % Gas turbine power • 0.1% Wind power Source from: Volvo Trucks EPD, 2008

Appendix
62
Appendix 5 Definition of Vehicle Categories
Definition of Vehicle Categories (Directive 2001/116/EEC)
Vehicle categories are defined according to the following international classification:
1. Category M: Motor vehicles with at least four wheels used for the carriage of passengers
Category M1: Vehicles used for the carriage of passengers and comprising no more than eight seats in addition to the driver’s seat
Category M2: Vehicles used for the carriage of passengers and comprising more than eight seats in addition to the driver’s seat, and having a maximum mass not exceeding 5 tonnes
Category M3: Vehicles used for the carriage of passengers and comprising more than eight seats in addition to the driver’s seat, and having a maximum mass exceeding 5 tonnes
2. Category N: Motor vehicles with at least four wheels used for the carriage of goods
Category N1: Vehicles used for the carriage of goods and having a maximum mass not exceeding 3.5 tonnes
Category N2: Vehicles used for the carriage of goods and having a maximum mass exceeding 3.5 tonnes but not exceeding 12 tonnes
Category N3: Vehicles used for the carriage of goods and having a maximum mass exceeding 12 tonnes
3. Category O: Trailers (including semi-trailers)
Category O1: Trailers with a maximum mass not exceeding 0.75 tonnes
Category O2: Trailers with a maximum mass exceeding 0.75 tonnes but not exceeding 3.5 tonnes
Category O3: Trailers with a maximum mass exceeding 3.5 tonnes but not exceeding 10 tonnes
Category O4: Trailers with a maximum mass exceeding 10 tonnes
Source from: European Automobile Manufacturers’ Association (ACEA)