post-meeting packet
TRANSCRIPT
John M. Colmers Chairman
Herbert S. Wong, Ph.D.
Vice-Chairman
George H. Bone, M.D.
Stephen F. Jencks,
M.D., M.P.H.
Jack C. Keane
Bernadette C. Loftus, M.D.
Thomas R. Mullen
Donna Kinzer
Executive Director
Stephen Ports Principal Deputy Director
Policy and Operations
David Romans Director
Payment Reform and Innovation
Gerard J. Schmith Deputy Director
Hospital Rate Setting
Sule Calikoglu, Ph.D. Deputy Director
Research and Methodology
Health Services Cost Review Commission 4160 Patterson Avenue, Baltimore, Maryland 21215
Phone: 410-764-2605 · Fax: 410-358-6217 Toll Free: 1-888-287-3229
hscrc.maryland.gov
State of Maryland Department of Health and Mental Hygiene
515th MEETING OF THE HEALTH SERVICES COST REVIEW COMMISSION Jan 14, 2015
EXECUTIVE SESSION
12:30 p.m. (The Commission will begin in public session at 12:30 p.m. for the purpose of, upon motion and
approval, adjourning into closed session. The open session will resume at 1PM.)
1. Status of Medicare Data Submission and Reconciliation – Authority General Provisions Article, § 3-104
PUBLIC SESSION OF THE HEALTH SERVICES COST REVIEW COMMISSION
1:00 p.m.
1. Review of the Minutes from the Executive Session and Public Meeting on December 10, 2014
2. Executive Director’s Report
3. New Model Monitoring
4. Docket Status – Cases Closed 2278A – Johns Hopkins Health System 2279A – MedStar Health 2280A – Johns Hopkins Health System 2281A – Riverside Health
5. Docket Status – Cases Open 2265A – Holy Cross Hospital 2282A – University of Maryland Medical Center 2283A - Johns Hopkins Health System 2284R – Garrett County Memorial Hospital 2285R – Johns Hopkins Bayview Medical Center 2286A - Johns Hopkins Health System
6. Final Recommendation for Modifications to the MHAC program for FY 2017 - Approved
7. Final Recommendation on the NSPII Program - Approved as amended and noted on title page.
8. MHA Letter and Staff Comments regarding Mid-Year Update and Staff
9. Work Group Updates
10. Hearing and Meeting Schedule
Closed Session Minutes Of the
Health Services Cost Review Commission
December 10, 2014
Upon motion made in public session, Chairman Colmers called for adjournment into closed session to discuss the following items:
1. Organizing staff and the role of the Commission in regard to the Certificate of Need process;
2. Status of Medicare data submission and reconciliation; 3. Review of Commission’s internal process for considering legislation.
The Closed Session was called to order at 12:07 p.m. and held under the authority of Sections 3‐104, and 3‐305 of the General Provisions Article. In attendance, in addition to Chairman Colmers, were Commissioners Bone, Jencks, Keane, Loftus, Mullen, and Wong. In attendance representing staff were Donna Kinzer, David Romans, Steve Ports, Sule Calikoglu, Ellen Englert, and Dennis Phelps. Also attending were Leslie Schulman and Stan Lustman, Commission counsel.
Item One Stan Lustman, Commission counsel and Donna Kinzer, Executive Director, summarized and the Commission discussed the role of the Commission in the Certificate of Need process. – Authority: General Provisions Article, § 3‐104 and 3‐305(b) (7)
Item Two David Romans, Director‐Payment Reform and Innovation, presented an updated analysis of Medicare per beneficiary data. – Authority: General Provisions Article, § 3 – 104
Item Three Steve Ports, Principal Deputy Director‐Policy and Operations, reviewed the Commission’s internal process for considering legislation. – Authority: General Provisions Article, § Article 3 – 104 Closed Session was adjourned at 1:00 p.m.
MINUTES OF THE 514th MEETING OF THE
HEALTH SERVICES COST REVIEW COMMISSION
DECEMBER 10, 2014 Chairman John Colmers called the public meeting at 12:00pm. Commissioners George H. Bone, M.D., Stephen F. Jencks, M.D., MPH, Jack C. Keane, Bernadette C. Loftus, M.D., Tom Mullen and Herbert S. Wong Ph.D. were also in attendance. Upon motion made by Commissioner Wong and seconded by Commissioner Mullen, the meeting was moved to the Executive Session to discuss those issues enumerated on the agenda notice. Chairman Colmers reconvened the public meeting at 1:08pm.
REPORT OF THE DECEMBER 10, 2014 EXECUTIVE SESSION
Dennis Phelps, Associate Director-Audit & Compliance, summarized the minutes of the December 10, 2014 Executive Session.
ITEM I
REVIEW OF THE MINUTES FROM OCTOBER 15, 2014 EXECUTIVE SESSION AND PUBLIC MEETING
The Commission voted unanimously to approve the minutes of the November 12, 2014 Executive Session and the Public Meeting.
ITEM II EXECUTIVE DIRECTOR’S REPORT
Ms. Donna Kinzer, Executive Director, stated that staff has received the Global Budget compliance projections from all hospitals, along with their plans to be in compliance with the December 31st mid-year targets. While volume trends in December could affect the actual results, each hospital expressed its intent to comply with the targets that are part of the global budget. Staff is working to develop a utilization trend analysis derived from the case mix data. Staff is also correcting discrepancies in the outpatient data submitted and determining how to present volume trends on cancer drugs and radiation therapy which has been a challenge due to “cycle billing.” Ms. Kinzer noted that staff is close to presenting this analysis to the Commission.
Ms. Kinzer reported on the progress of the staff’s evaluation of a request from the University of Maryland St Joseph Medical Center (the Hospital) for a market share adjustment and an advance on this adjustment. The Staff is also evaluating the Hospital’s financial performance as the Hospital indicates that it is experiencing accelerating financial losses.
The Hospital was formerly operated by Catholic Health Initiatives. On December 12, 2012, The University of Maryland Medical System acquired all of the assets of St. Joseph Medical Center from Catholic Health Initiatives and renamed the Hospital, the University of Maryland St. Joseph Medical Center. Before the acquisition, the Hospital had been losing patients and experiencing financial losses stemming from heart stent issues. During the fiscal year ended June 30, 2014, staff met with representatives of the Hospital and University of Maryland Medical System to discuss the Hospital’s financial performance. HSCRC and the Hospital entered into a Global Budget Agreement separately from the remainder of the University of Maryland Medical System hospitals; this was done to enable the ongoing evaluation of the Hospital. In the second half of fiscal year 2014, the Hospital experienced significant growth and requested a market share adjustment relative to this growth under the provisions of the Global Budget Revenue (GBR) agreement. The Hospital submitted a calculation of its estimated market share growth. Staff has been evaluating the change in in-state volumes to determine whether the change in volume represents a “shift” from another regulated facility or just growth in volumes. Staff has made a preliminary determination that that there has been a market shift to the Hospital. When applying a 50% variable cost factor to the volume change, Staff calculated a potential net increase of approximately $10 million in patient revenue for the six month period. Revenue neutrality is the desired goal for market shift adjustments. In developing GBR budgets for the surrounding hospitals that compete with the University of Maryland St. Joseph Medical Center, staff did not provide population adjustments, because these facilities were showing volume decreases in the first half of the fiscal year. Staff expects that these “withholds” will contribute toward funding the FY 2014 market shift adjustment, if provided to St. Joseph Medical Center. The Hospital has indicated that its volume growth has continued to accelerate in FY 2015, as have its losses. As a result, the Hospital has requested a market share advance for FY 2015. Staff is analyzing the Hospital’s case mix data in evaluating the request. Staff intends to continue to evaluate the Hospital’s plans to improve its financial position and the appropriate market shift adjustment. Staff will update the Commission at the January meeting. Ms. Kinzer stated that on December 8, 2014, Staff received a request from the Maryland Hospital Association requesting a mid-year rate update on behalf of its constituent hospitals for infrastructure investment. Staff does not agree with the characterization of the FY 2015 update outlined in the letter, because it does not discuss the impact of the MHIP assessment reduction and the uncompensated care reduction in lowering hospital rates. Given the current performance of hospitals and the pace and magnitude of change in uncompensated care levels resulting from
Medicaid enrollment under the Affordable Care Act, staff did not expect to make a mid-year adjustment. Staff will discuss this issue with the Payment Work Group, together with the evaluation of uncompensated care and other impacts of enrollment expansion. Staff did not expect to have a recommendation ready for the January Commission meeting. Ms. Kinzer noted that for the months of December and January, staff expects to focus on finalizing the quality programs and to continue its focus on market shift calculations. Ms. Kinzer presented an update on the activities of several workgroups: The Payment Workgroup for the month of December and January will focus on the market share adjustment. The group will also begin to address uncompensated care, the 2016 update and other topics. The care coordination work group will be meeting on Friday January 12th. Group recommendations are anticipated by March. Provider Alignment workgroup efforts will resume this month, with the assistance of Health Management Associates and other consulting resources. Staff will provide more detail on plans and timelines at the January Commission meeting.
ITEM III NEW MODEL MONITORING
Mr. David Romans, Director Payment Reform and Innovation, stated that Monitoring Maryland Performance (MMP) for the new All-Payer Model for the month of October will focus on fiscal year (July 1 through June 30) as well as calendar year results. Mr. Romans reported that for the four months ended October 31, 2014, All-Payer total gross revenue increased by 3.05% over the same period in FY 2013. All-Payer total gross revenue for Maryland residents increased by 3.64%; this translates to a per capita growth of 2.94%. All-Payer gross revenue for non-Maryland residents decreased by 2.48%. Mr. Romans reported that for the 10 months of the calendar year ended October 31, 2014, All-Payer total gross revenue increased by 2.20% over the same period in FY 2013. All- Payer total gross revenue for Maryland residents increased by 2.52%; this translates to a per capita growth of 1.83. %. All-Payer gross revenue for non-Maryland residents decreased by .93%. Mr. Romans reported that for the four months ended October 31, 2014, Medicare Fee-For-Service gross revenue increased by 2.75% over the same period in FY 2013. Medicare Fee-For-Service for Maryland residents increased by 3.42%; this translates to a per capita growth increase of 1.83%. Maryland Fee-For-Service gross revenue for non-residents decreased by 4.17%. Mr. Romans reported that for the ten months of the calendar year ended October 31, 2014, Medicare Fee-For-Service gross revenue increased by 2.13%. Medicare Fee-For-Service for Maryland residents increased by 2.32%; this translates to a per capita growth decrease of .93%.
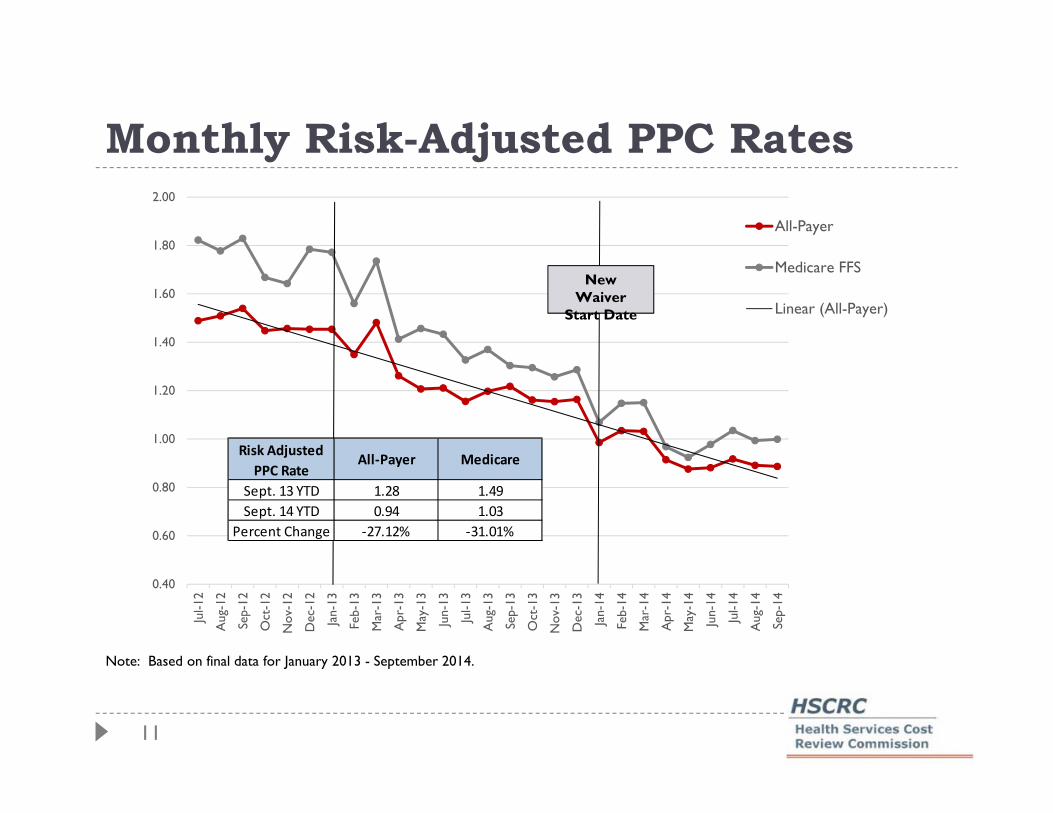
Maryland Fee-For-Service gross revenue for non-residents increased by 0.03%. According to Mr. Romans, for the four months of the calendar year ended October 31, 2014, unaudited average operating profit for acute hospitals was 3.08%. The median hospital profit was 4.52%, with a distribution of 1.24% in the 25th percentile and 7% in the 75th percentile. Dr. Alyson Schuster, Associate Director Data & Research, presented a quality report update on the Maryland Hospital Acquired Conditions program based upon final Potentially Preventable Complications (PPCs) and Readmission data and discharges through September 2014.
The final All-Payer risk adjusted PPC rate for September 2014 YTD decreased by approximately 27% from the September 2013 YTD risk adjusted PPC rate.
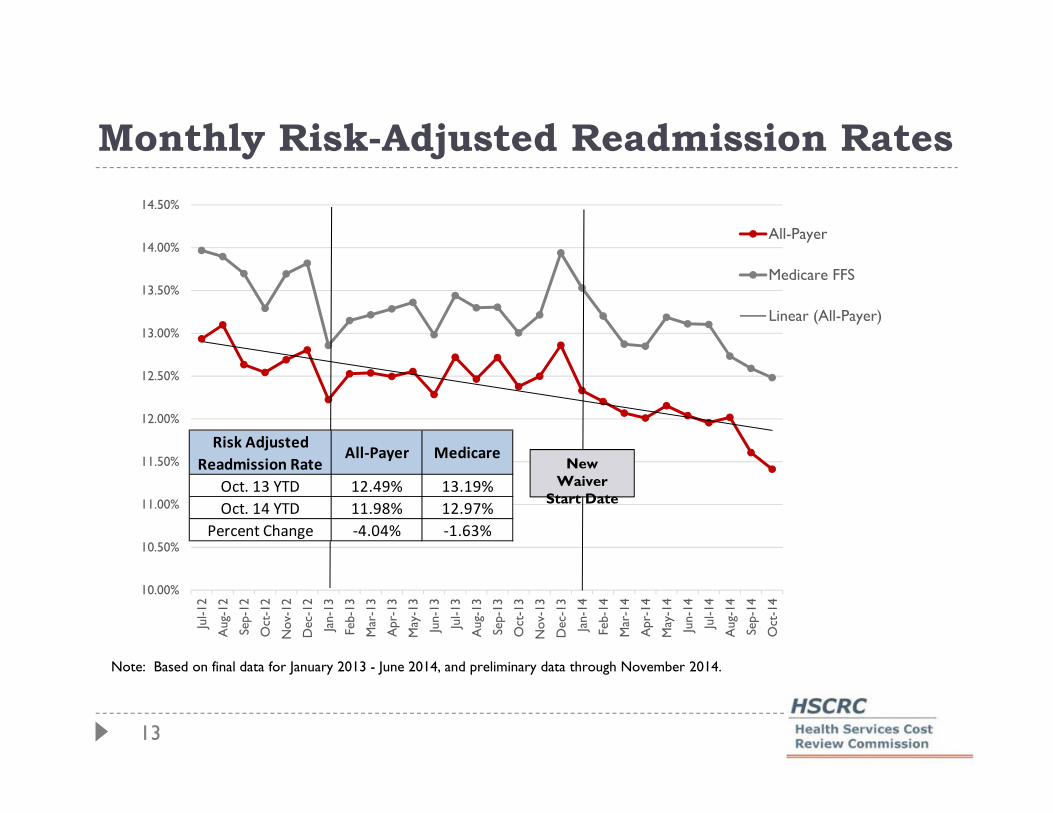
The final All-Payer risk adjusted readmission rate for September 2014 YTD decreased by
approximately 3.60% from the September 2013 YTD risk adjusted readmission rate. Dr. Schuster noted that Medicare data were not available this month.
ITEM IV DOCKET STATUS CASES CLOSED
2257A- MedStar Health 2269A- Johns Hopkins Health System 2267A- St. Agnes Health, Maryland General Hospital, Meritus Health Western Maryland Health System and Holly Cross Health 2274A- Johns Hopkins Health System 2275A- Johns Hopkins Health System 2276A- Johns Hopkins Health System 2277A- University of Maryland Medical Center
ITEM V
2278A- Johns Hopkins Health System
Johns Hopkins Health System (the “System”), on behalf its member hospitals Johns Hopkins Hospital, and Johns Hopkins Bayview Medical Center (the “Hospitals”), filed an application on November 14, 2014 requesting continued participation in an amended global rate arrangement for solid organ and bone marrow transplant services and cardiovascular services with Olympus Managed Health beginning January 1, 2015. Staff recommends that the Commission approve the Hospitals’ application for an alternative method of rate determination for solid organ and bone marrow transplant services and cardiovascular services for one year beginning January 1, 2015, and that the approval be
contingent upon the execution of the standard Memorandum of Understanding. The Commission voted unanimously to approve staff’s recommendation. Chairman Colmers recused himself from the discussion and vote.
2279A- MedStar Health
MedStar Health on behalf of Franklin Square Hospital, Good Samaritan Hospital, Harbor Hospital and Union Memorial Hospital (The "Hospitals”) filed an application on November 20, 2014 seeking approval for MedStar Family Choice (“MFC”) to participate in the Centers for Medicare and Medicaid Services (CMS) approved Medicare Advantage Plan. MFC is the MedStar entity that assumes the risk under this contract. The Hospitals are requesting an approval for two years beginning January 1, 2015. Staff recommends that the Commission approve the Hospitals’ request to participate in the CMS’ Medicare Part C Medicare Advantage Program for a period of one year beginning January 1, 2015, and that the approval be contingent upon the execution of the standard Memorandum of Understanding.
The Commission voted unanimously to approve staff’s recommendation.
2280A-Johns Hopkins Health System
Johns Hopkins Health System (the “System”), on behalf its member hospitals Johns Hopkins Hospital, Johns Hopkins Bayview Medical Center, and Howard County General Hospital (the “Hospitals”), filed an application on November 21, 2014 requesting continued participation in a revised global price arrangement for solid organ and bone marrow transplant services and cardiovascular services with Life Trac (a subsidiary of Allianz Insurance Company of North America). The Hospitals are requesting an approval for one year beginning January 1, 2015. Staff recommends that the Commission approve the Hospitals’ application for an alternative method of rate determination for solid organ and bone marrow transplant services and cardiovascular services for one year beginning January 1, 2015, and that the approval be contingent upon the execution of the standard Memorandum of Understanding. The Commission voted unanimously to approve staff’s recommendation. Chairman Colmers recused himself from the discussion and vote.
2281A-Riverside Health of Maryland
On December 2, 2014, Riverside Health (“Riverside”), on behalf of LifeBridge Health and Adventist Healthcare (the Hospitals), filed an application seeking approval for Riverside to
continue to participate in the Medicaid Health Choice Program. Riverside is the entity that will assume the risk under the contract. While Riverside has participated in the Health Choice program in CYs 2013 and 2014, this is its first ARM application with the Commission. The Hospitals are requesting an approval for one year beginning January 1, 2015. Staff recommends approval of this alternative rate application for one-year period beginning January 1, 2015. Since sustained losses over an extended period of time may be construed as a loss contract necessitating termination of the arrangement, staff will continue to monitor financial performance for CY 2014 and the expected financial status into CY2015. Staff also recommends that Riverside report to Commission staff (on or before the September 2015 Commission meeting) on actual CY 2014 experience, preliminary CY 2015 financial performance (adjusted seasonality) of the MCO, as well as its projection for CY 2016. Finally, approval is contingent upon the execution of the standard Memorandum of Understanding. The Commission voted unanimously to approve staff’s recommendation.
ITEM VI
DRAFT RECOMMENDATION FOR MODIFICATION TO THE MHAC PROGRAM FY 2017
Ms. Diane Feeney, Associate Director Quality Initiatives, presented the staff’s draft recommendation for modifications to the Maryland Hospital Acquired Conditions (MHAC) Program for FY 2017 (See “Draft Recommendations for Modifying the Maryland Hospital Acquired Conditions program for FY2017” on the HSCRC website). The MHAC program was implemented in the state FY 2011. In order to enhance our ability to incentivize hospital care improvements and meet the MHAC reduction targets in the All-Payer model demonstration contract that began on January 1, 2014, Commission staff developed recommendations with significant changes to the MHAC existing policy within the context of the Performance Measurement and Payment Models Workgroup activity. The Commission approved the updated recommendations at the April 2014 meeting which modified the measurement, scoring and payment scaling methodologies to translate scores into rate adjustments for the MHAC initiative. These updates were effective for performance in calendar year 2014 (beginning January 1, 2014) and are to be applied to FY 2016 rates for each hospital. Among these changes were measuring hospital performance using observed to expected ratio values for each PPC rather than the additional incremental cost of the PPCs measured at each hospital, and shifting from relative scaling to pre-established PPC performance targets for payment adjustments. The revised approach also established a statewide MHAC improvement target with tiered amounts of revenue at risk based on whether or not the target is met, and the allocation of rewards for FY 2016 consistent with the amount of revenue in penalties collected This recommendation proposes to continue with the current MHAC initiative methodology for FY 2017 with updates to the policy that allow for rewards not limited to the penalties collected, and to the statewide improvement target for applying tiered scaling amounts.
Based on work completed to date on updating the MHAC program for 2017, staff makes the following draft recommendations.
The statewide reduction target should be set at 7% comparing FY 2014 to CY 015 risk adjusted PPC rates.
The program should continue to use a tiered approach where a lower level of revenue at risk is set if the statewide target is met versus not met as modelled in FY 2016 policy.
Rewards should be distributed only if the statewide target is met, and should not be limited to penalties collected.
As this is a draft recommendation, no Commission action is necessary.
ITEM VII DRAFT RECOMMENDATIONS FOR MODIFICATIONS TO THE READMISSION
REDUCTION INCENTIVE PROGRAM FOR FY 2017
Dr. Schuster presented staff’s draft recommendations for modifications to the Readmission Reduction Incentive Program (RRIP) for FY 2017 (See “Draft Recommendation for Updating the Hospital Readmission Reduction Incentive Program for FY 2017” on the HSCRC website). The United States health care system currently experiences an unacceptably high rate of unnecessary hospital readmissions. These excessive readmissions are a symptom of our fragmented payment system and result in considerable unnecessary cost and substandard care quality. Maryland’s readmission rates are high compared to the national levels for Medicare. The CMMI All-Payer Model Agreement (or “waiver”), which began on January 1, 2014, has established readmission reduction targets that require Maryland hospitals to be equal to or below rates of Medicare readmissions by 2018, with annual progress toward this goal. In order to enhance our ability to incentivize hospital care improvements and meet the target, the Commission approved the Hospital Readmission Reduction Incentive Program policy to be applied to FY 2016 rates where hospitals achieving at least a 6.76% inter-hospital readmission reduction target for CY 2014 performance compared to CY2013 performance would earn an additional 0.5% in revenue. Staff provided the following draft recommendations for a readmission reduction incentive program for CY 2015 performance applied to rate year 2017:
Adopt a payment incentive program with both rewards for hospitals achieving or exceeding the benchmark and payment reductions for hospitals with readmission rate increases or failure to make adequate improvements.
Use a tiered approach where a statewide Medicare readmission target must be met to avoid maximum penalties at risk for the program.
Continue to set a benchmark for a minimum required readmission rate reduction where rewards may be earned based on all payer readmission reductions.

Develop readmission reduction targets for CY 2015 compared to CY 2013 readmission rates by March 2014, taking into consideration the final Medicare rates obtained from the MMI.
Ms. Traci LaValle, Vice President of Rate Setting Maryland Hospital Association, expressed many concerns with the RRIP recommendation. According to MHA, Staff should consider excluding psych, Oncology and, non-Medicare patients, so as to be more comparable with the national Medicare rate. MHA plans to bring examples of hospital resources invested in reducing readmissions to the January meeting As this is a draft recommendation, no Commission action is necessary.
ITEM VIII DRAFT RECOMMENDATIONS FOR TOTAL AMOUNT AT RISK FOR QUALITY PROGRAMS FOR FY 2017 Dr. Sule Calikoglu, PH.D, Deputy Director of Research and Methodology, presented staff’s draft recommendations for total amount at risk for quality programs for FY 2017 (See “Draft Recommendation for Aggregate Revenue Amount At-Risk Under Maryland Hospital Quality Programs for FY 2017” on the HSCRC website). The HSCRC quality-based payment methodologies are important policy tools with the potential to provide strong incentives for hospitals to improve their quality performance over time. Each of the current policies for quality-based payment programs holds revenue at risk directly related to specified performance targets. The Quality Based Reimbursement (QBR) program employs revenue neutral scaling of hospitals in allocating rewards and reductions based on performance, with the net increases in rates for better performing hospitals funded by net decreases in rates for poorer performing hospitals For the Maryland Hospital Acquired Conditions (MHAC) program, hospital performance is measured using observed to expected ratio values for each component measure, and revenue allocations are performed using pre-established performance targets. The revenue at risk and reward structure are based on a tiered approach that requires statewide targets to be met for higher rewards and reduced reductions. The Readmission Shared Savings Program reduces each hospital's approved revenues prospectively based on its risk adjusted readmission rates. The hospital Readmission Reduction Incentive Program policy initiated in FY 2015 is designed to be a positive incentive program to reward hospitals that achieve a specified readmission reduction target. For FY 2017, staff is proposing to strengthen this program by increasing the amount of revenue at risk and including both rewards and reductions. Similar to

the MHAC program, staff is proposing the use of a tiered approach that requires statewide targets to be met for higher rewards and reduced penalties. Potentially Avoidable Utilization reductions are applied to global budgets to reduce allowed volume growth based on the percent ofrevenue associated with potentially avoidable utilization for each hospital. This draft recommendation proposes the amount of hospital revenue at-risk for the following programs: 1. Quality-Based Reimbursement; 2. Maryland Hospital Acquired Conditions; and, 3. Readmission Reduction Incentive Program. The Shared Savings for Readmissions and Potentially Avoidable Utilization programs that also hold revenue at risk based on performance are determined annually commensurate with the hospital rate update factor process. Based on current quality results for CY 2014 YTD and discussions with CMMI on HSCRC quality programs, staff’s position and rationale for revenue amounts at risk for FY 2017 are outlined as follows:
Quality Based Reimbursement- 2% maximum penalty. This matches Medicare’s Value Based Purchasing (VBP) program and increases the incentive for hospitals to improve Hospital Consumer Assessment of Healthcare Providers and Systems (HCAHPS) scores, which continue to be low compared to the nation.
MHAC- 4% maximum penalty if statewide improvement target is not met; 1% maximum penalty and revenue neutral rewards up to 1% if statewide improvement target is met. This continues the current FY 2016 at risk revenue levels that resulted in significant quality improvements.
Readmission Shared Savings Program- 2% scaled maximum penalty and 0.5% reward for hospitals which reduced readmission rates at or better than the minimum improvement target if the statewide Medicare readmission target is not met; 1% scaled maximum penalty and 1% reward for hospitals which reduced readmission rates at or better than the minimum improvement target if the statewide Medicare readmission target is met. The decision to add reductions and increase potential rewards is based on staff and stakeholder concerns regarding the CY 2014 YTD improvement and the fact that almost one third of hospitals have had an increase in their readmission rate.
Dr. Calikoglu stated that staff will convene meetings of the Performance Measurement and Payment Workgroup to deliberate and further refine quality based programs’ aggregate amount at risk and individual component program details prior to the January 2015 Commission meeting, As this is a draft recommendation, no Commission action is necessary. ITEM IX
DRAFT REPORT AND RECOMMENDATION ON THE NSP II PROGRAM
Ms. Claudine Williams, Associate Director Policy Analysis presented staff’s draft report and recommendation concerning the Nurse Support Program II (NSP II) program. (See “Nurse
Support Program II Outcomes Evaluation FY 2006 – FY 2015and Recommendations for Future Funding” on The HSCRC website). The NSP II was designed to increase the number of hospital bedside nurses. This goal is achieved by expanding academic capacity, including the number of faculty available to teach in Maryland’s nursing programs while simultaneously supporting student success. The NSP II has two components, a competitive institutional grant and statewide initiatives. Nine rounds of Competitive Institutional Grant awards totaling $63,373,650 were granted between fiscal years 2006 and 2015. Statewide initiatives provided $27,997,338 to 950 graduate nursing students and faculty across the State in the form of scholarships, fellowships, or grants to help them begin or enrich careers as faculty in Maryland schools/departments of nursing. Fifteen community colleges and eleven universities across all geographic regions and types of programs participated in the NSP II. All Maryland nursing programs received one or more institutional grant. Staff recommendations for the NSP II program going forward are as follows:
Renew NSP II funding for five years, FY 2015 through FY 2020. Establish a work group to develop specific goals for a competitive institutional grant
program and statewide initiatives based on the Institute of Medicine (IOM) recommendations.
Adopt goals and metrics that address the following IOM recommendations: Increase the proportion of nurses with baccalaureate degree to 80% of all RNs in
the workforce. Double the number of nurses with a doctorate by 2020. Ensure that nurses engage in lifelong learning Prepare and enable nurses to lead change to advance health
Purchase software to manage and report on outcomes data Review current NSP II statute, particularly the term “bedside nurse” to ensure that it
meets the move towards a coordinated care model. As this is a draft recommendation, no Commission action is necessary. ITEM X
DRAFT REPORT ON MEDICAID SAVINGS RESULTING FROM ALL-PAYER MODEL
Mr. Romans presented a draft report on the Medicaid savings resulting from the All-Payer Model (see “Medicaid Savings Calculation CY 2014” on the HSCRC website). Mr. Romans stated that the HSCRC and DHMH, in consultation with the Maryland Hospital Association (MHA), are required to develop a methodology for calculating any general fund savings generated by the Maryland All-Payer Model Contract. Mr. Romans noted that based on the new All-Payer Model, the State savings for the first six months of CY 2014 is approximately $14.5 million.

Mr. Romans noted that Chesapeake Regional Information System for Our Patients (CRISP) will be working with Medicaid/HSCRC staff to refine and improve the process for linking Medicaid eligibility files with HSCRC hospital charge data. Also, DHMH, HSCRC, and MHA staff will monitor results quarterly and review methodological issues (e.g., changes to assessments, presumptive eligibility) in preparation for the CY 2015 savings calculation.
ITEM XI FINAL RECOMMENDATIONS ON MODIFYING MEDICAID CURRENT FINANCING
CALCULATION FOR CY 2015
Mr. Phelps presented staff’s final recommendation on the Medical Assistance Program’s (MAP’s) request to modify the calculations of current financing deposits for FY 2015 (See “Staff Recommendation Request by the Medical Assistance Program to Modify the Calculation of Current Financing Deposits for FY 2015”) on the HSCRC website. As a result of continuing budget shortfalls, on February 24, 2014, MAP requested an exception to the approved current financing calculation for FY 2014. MAP requested that it be permitted to increase the current financing amounts on deposit with each hospital by the HSCRC update factor (2.41%) for FY 2015. MAP also proposed that there will be changes in the current financing formula once the new claims system is implemented. Based on the current condition of the MAP budget, staff recommends that the Commission approve MAP’s request to increase current financing by 2.41%. Staff also recommends that the approval be subject to the requirement that MAP continue to report annually on the status of the implementation of its new claims system. The Commission voted unanimously to approve staff’s recommendation.
ITEM XII
HEARING AND MEETING SCHEDULE
January 14, 2015 Times to be determined, 4160 Patterson Avenue HSCRC Conference Room February 11, 2015 Times to be determined, 4160 Patterson Avenue HSCRC Conference Room There being no further business, the meeting was adjourned at 4:00 pm.
1
Executive Director’s Report
Health Services Cost Review Commission
January 14, 2015
Maryland TPR Hospital Collaborative Receives AHA Living the Vision Award On December 17, AHA President and CEO Rich Umbdenstock presented the Carolyn Boone Lewis Living the Vision award to the Maryland TPR Collaborative for its work to improve the health of communities through actions that go beyond traditional hospital care. The ten hospitals involved in the Maryland Total Patient Revenue system formed the collaborative in 2010 to reshape their approach to health care. Their inspiring efforts to reduce costs, increase access to primary care, and share best practices in a way that all hospitals can learn from resulted in the Collaborative being selected for this important recognition. We congratulate these ten hospitals for their extraordinary efforts and leadership.
Board of Public Works Action on FY 2015 State Budget On Wednesday, January 7, 2015, the Board of Public Works approved a package of cuts and transfers proposed by the Governor to reduce the FY 2015 State Budget shortfall by more than $400 million. This action includes a 2% reduction to all state agencies, which will result in approximately $113 million in savings during the current fiscal year and $86 million of targeted cuts.
An additional $200 million is intended through savings from fund transfers and spending reductions, which require the approval of the General Assembly or other entities during the 2015 session.
DHMH has targeted cuts of approximately $39 million, which include reducing physician evaluation and management (E&M) reimbursement rates from 100% to 87% of Medicare rates, and reducing developmental disabilities and mental health provider rate increases. Other DHMH-related actions total $59 million and include:
• $8 million in assumed savings to Medicaid from a reduction in hospital rates as the result of a reduction in hospital uncompensated care costs. This would be contingent on Commission action.
2
• $45 million transfer from the non-federal portion of the MHIP fund to support increased Medicaid enrollment, including those who enrolled from the MHIP program.
Potential 340 B Expansion HSCRC staff is considering the possibility of recommending a change in our statute that would allow affiliated hospitals to take advantage of the same 340B programs that are available in other states. This potential change would allow a system to offer outpatient cancer drugs at multiple related regulated hospital campuses, but to bill the services through a single regulated campus. There are strict requirements that are associated with these arrangements. If pursued, this may give hospitals an opportunity for cost reductions that can be passed on to patients and purchasers, as well as service delivery improvements. We will keep the Commission informed relative to our progress in researching this potential change.
Update and Proposed GBR Modification for University of Maryland St. Joseph Medical Center Situation-- At the December meeting, the HSCRC staff reported that it is evaluating a request from the University of Maryland St. Joseph Medical Center (the Hospital) for a change in its global budget. The HSCRC staff has evaluated this request and is continuing to evaluate the Hospital's financial performance. This report is being provided to update the Commission on our continuing review, to present the Staff's proposed adjustment to the Hospital's global budget, to answer questions that the Commission has regarding the situation, and to receive input from the Commission regarding our approach and our ongoing interaction with the Hospital. Background-- HSCRC and the Hospital entered into a Global Budget Revenue agreement for the year ended June 30, 2014. This agreement was maintained separate from the GBR for the remainder of the University of Maryland Medical System hospitals to enable ongoing evaluation of the Hospital in light of potential changes in market share and the Hospital's unfavorable financial performance. In negotiating GBR agreements, HSCRC staff informed hospitals that it did not anticipate making market shift adjustments (MSAs) for the year ended June 30, 2014. However, given the financial condition of University of Maryland St. Joseph Medical Center, and the rapid rise in its volumes in the first six months of the fiscal year, the HSCRC staff entertained the possibility of making a prospective market shift adjustment to the Hospital's GBR for the rate year beginning July 1, 2014. The Hospital is requesting a prospective adjustment relative to the second half of FY 2014 to reflect the new volume level that includes this shift, an
3
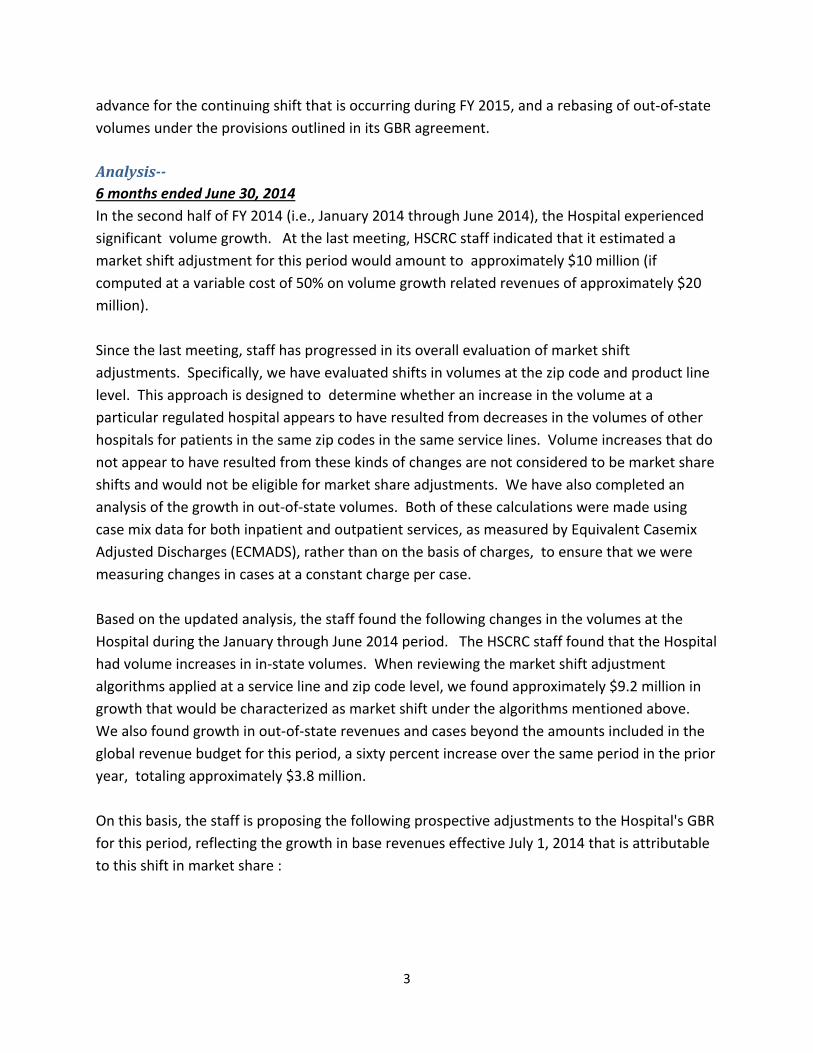
advance for the continuing shift that is occurring during FY 2015, and a rebasing of out-of-state volumes under the provisions outlined in its GBR agreement. Analysis-- 6 months ended June 30, 2014 In the second half of FY 2014 (i.e., January 2014 through June 2014), the Hospital experienced significant volume growth. At the last meeting, HSCRC staff indicated that it estimated a market shift adjustment for this period would amount to approximately $10 million (if computed at a variable cost of 50% on volume growth related revenues of approximately $20 million). Since the last meeting, staff has progressed in its overall evaluation of market shift adjustments. Specifically, we have evaluated shifts in volumes at the zip code and product line level. This approach is designed to determine whether an increase in the volume at a particular regulated hospital appears to have resulted from decreases in the volumes of other hospitals for patients in the same zip codes in the same service lines. Volume increases that do not appear to have resulted from these kinds of changes are not considered to be market share shifts and would not be eligible for market share adjustments. We have also completed an analysis of the growth in out-of-state volumes. Both of these calculations were made using case mix data for both inpatient and outpatient services, as measured by Equivalent Casemix Adjusted Discharges (ECMADS), rather than on the basis of charges, to ensure that we were measuring changes in cases at a constant charge per case. Based on the updated analysis, the staff found the following changes in the volumes at the Hospital during the January through June 2014 period. The HSCRC staff found that the Hospital had volume increases in in-state volumes. When reviewing the market shift adjustment algorithms applied at a service line and zip code level, we found approximately $9.2 million in growth that would be characterized as market shift under the algorithms mentioned above. We also found growth in out-of-state revenues and cases beyond the amounts included in the global revenue budget for this period, a sixty percent increase over the same period in the prior year, totaling approximately $3.8 million. On this basis, the staff is proposing the following prospective adjustments to the Hospital's GBR for this period, reflecting the growth in base revenues effective July 1, 2014 that is attributable to this shift in market share :
4
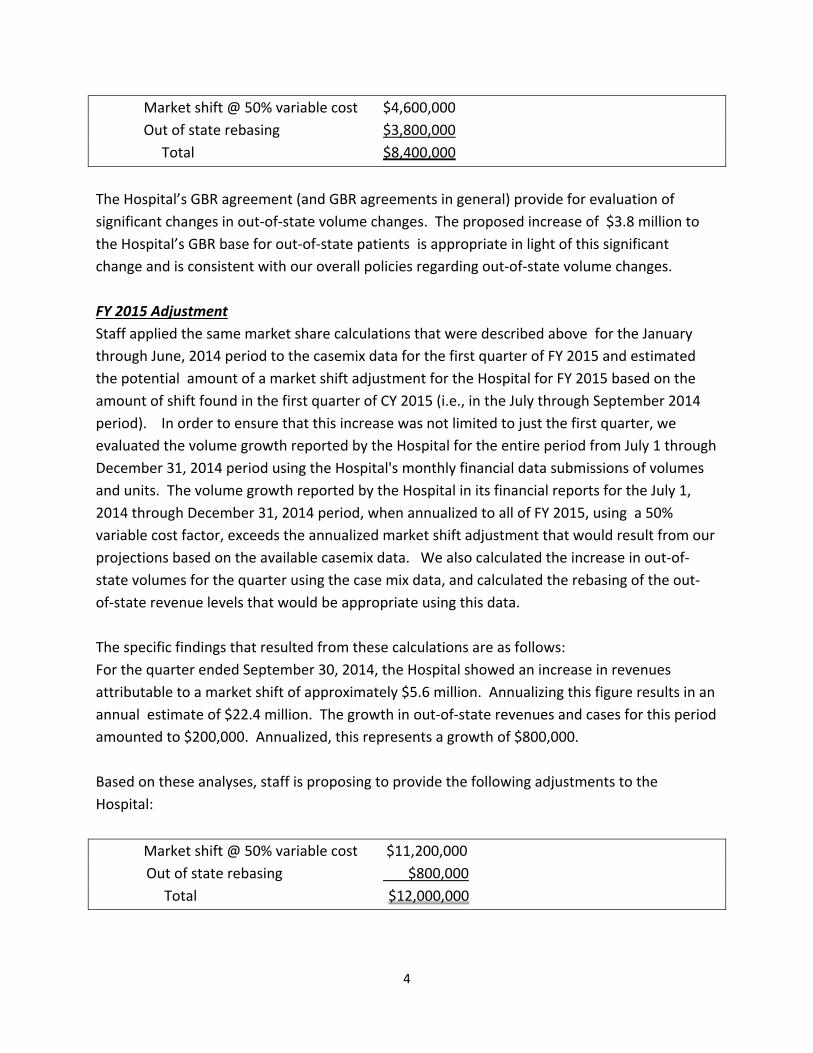
Market shift @ 50% variable cost $4,600,000 Out of state rebasing $3,800,000 Total $8,400,000 The Hospital’s GBR agreement (and GBR agreements in general) provide for evaluation of significant changes in out-of-state volume changes. The proposed increase of $3.8 million to the Hospital’s GBR base for out-of-state patients is appropriate in light of this significant change and is consistent with our overall policies regarding out-of-state volume changes. FY 2015 Adjustment Staff applied the same market share calculations that were described above for the January through June, 2014 period to the casemix data for the first quarter of FY 2015 and estimated the potential amount of a market shift adjustment for the Hospital for FY 2015 based on the amount of shift found in the first quarter of CY 2015 (i.e., in the July through September 2014 period). In order to ensure that this increase was not limited to just the first quarter, we evaluated the volume growth reported by the Hospital for the entire period from July 1 through December 31, 2014 period using the Hospital's monthly financial data submissions of volumes and units. The volume growth reported by the Hospital in its financial reports for the July 1, 2014 through December 31, 2014 period, when annualized to all of FY 2015, using a 50% variable cost factor, exceeds the annualized market shift adjustment that would result from our projections based on the available casemix data. We also calculated the increase in out-of-state volumes for the quarter using the case mix data, and calculated the rebasing of the out-of-state revenue levels that would be appropriate using this data. The specific findings that resulted from these calculations are as follows: For the quarter ended September 30, 2014, the Hospital showed an increase in revenues attributable to a market shift of approximately $5.6 million. Annualizing this figure results in an annual estimate of $22.4 million. The growth in out-of-state revenues and cases for this period amounted to $200,000. Annualized, this represents a growth of $800,000. Based on these analyses, staff is proposing to provide the following adjustments to the Hospital: Market shift @ 50% variable cost $11,200,000 Out of state rebasing $800,000 Total $12,000,000
5
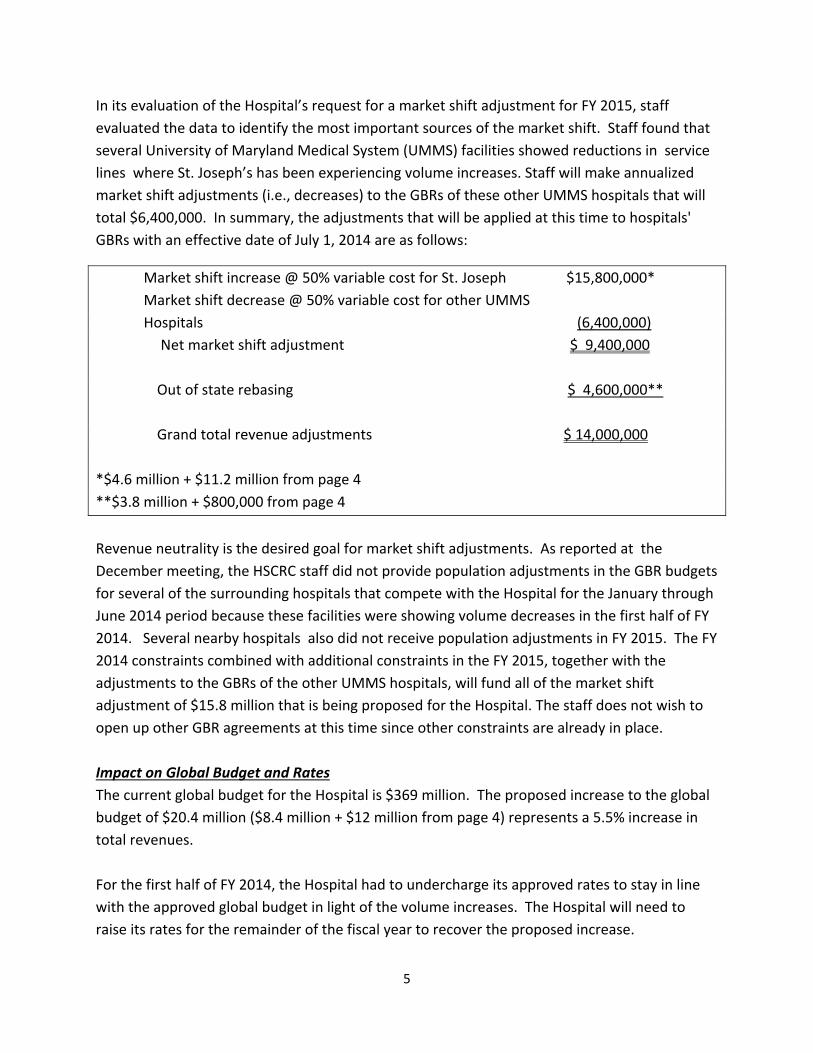
In its evaluation of the Hospital’s request for a market shift adjustment for FY 2015, staff evaluated the data to identify the most important sources of the market shift. Staff found that several University of Maryland Medical System (UMMS) facilities showed reductions in service lines where St. Joseph’s has been experiencing volume increases. Staff will make annualized market shift adjustments (i.e., decreases) to the GBRs of these other UMMS hospitals that will total $6,400,000. In summary, the adjustments that will be applied at this time to hospitals' GBRs with an effective date of July 1, 2014 are as follows:
Market shift increase @ 50% variable cost for St. Joseph $15,800,000* Market shift decrease @ 50% variable cost for other UMMS
Hospitals (6,400,000) Net market shift adjustment $ 9,400,000 Out of state rebasing $ 4,600,000** Grand total revenue adjustments $ 14,000,000 *$4.6 million + $11.2 million from page 4 **$3.8 million + $800,000 from page 4 Revenue neutrality is the desired goal for market shift adjustments. As reported at the December meeting, the HSCRC staff did not provide population adjustments in the GBR budgets for several of the surrounding hospitals that compete with the Hospital for the January through June 2014 period because these facilities were showing volume decreases in the first half of FY 2014. Several nearby hospitals also did not receive population adjustments in FY 2015. The FY 2014 constraints combined with additional constraints in the FY 2015, together with the adjustments to the GBRs of the other UMMS hospitals, will fund all of the market shift adjustment of $15.8 million that is being proposed for the Hospital. The staff does not wish to open up other GBR agreements at this time since other constraints are already in place. Impact on Global Budget and Rates The current global budget for the Hospital is $369 million. The proposed increase to the global budget of $20.4 million ($8.4 million + $12 million from page 4) represents a 5.5% increase in total revenues. For the first half of FY 2014, the Hospital had to undercharge its approved rates to stay in line with the approved global budget in light of the volume increases. The Hospital will need to raise its rates for the remainder of the fiscal year to recover the proposed increase.
6
Financial Condition The staff has continued to meet with the Hospital's leadership. The Hospital has supplied requested financial and operational information. The Hospital and the UMMS system have established board committees to oversee the improvement plans for the Hospital. As the Hospital stated at the December 2014 Commission meeting and in the submitted information, it will need to make significant improvements in operations and financial performance beyond market share adjustments and rebasing of out-of-state revenues provided through the GBR agreement. Leadership has begun a comprehensive evaluation of performance, including hospital operations, physician operations, and credit and collections effectiveness. We reviewed the year-to-date financial performance and projections for the FY 2015. The Hospital has indicated that it will need to improve the performance of the Hospital and affiliated entities by $60 million. The Hospital is formulating its plans for improvement. Staff agrees that there are opportunities for improvement. Commission Questions The Commission asked about the impetus for volume growth and the nature of that volume growth at St. Joseph. St. Joseph has experienced significant volume growth in calendar year 2014 in orthopedics, cardiac surgery and cardiology, and obstetrics. Relative to cardiac surgery, cardiology, and orthopedics, the Hospital has reported to the staff that it has not increased its employment of physicians in these specialties since 2012. The number of employed obstetrics practitioners has increased by 6 positions since 2012 including physicians and other professionals. This obstetrics change reflects the restructuring of the obstetrics market in Baltimore City last year as one hospital discontinued its obstetrics program, another Baltimore City hospital modified its program, and volumes were shifted to St. Joseph. Although a substantial level of the volume resulted from shifts from other hospitals, not all of the volume growth was recognized as a shift. In light of the history of St. Joseph cardiology utilization under prior ownership, the Commission asked about the sources of volume growth. Relative to out-of-state growth, a portion of the growth is attributable to referrals in cardiac volumes from one hospital system and its physicians as well as increases in orthopedic cases. The staff learned that the Hospital is operating under a five year Corporate Integrity Agreement (CIA) with the federal Department of Health and Human Services, Office of Inspector General (OIG). The CIA is meant to allow the OIG to monitor the organization for a period with strict requirements in order to ensure that the conditions that led to the settlement cease to exist.
7
These agreements and reviews are confidential. HSCRC staff was briefed and was provided a summary of the latest external review through November 2013. The 2014 review report is in the process of being finalized. We also were provided an internal review for 2014. Based on our review of those confidential documents, there is nothing that staff wishes to communicate to Commissioners regarding any evidence of inappropriate utilization. Staff notes that Potentially Avoidable Utilization (PAU) levels at St. Joseph are lower than the State average, similar to GBMC's. St. Joseph has an active program to focus on readmissions, MHACs, and other PAUs. Staff has not yet completed a review of a sample of the physician contracts. It intends to conduct these reviews to determine the consistency of the contracts with the principles of the Triple Aim, which supports health care delivery improvement for the benefit of patients and purchasers.
Conclusion-- Staff's plans are to make a market shift adjustment for St. Joseph as outlined above, and to rebase its out-of-state revenues based on current performance. It also plans to reduce other UMMS global budgets indicated above for market shift reductions, and to hold revenue constraints in place for nearby hospitals that already had constraints in population adjustments due to volume reductions.
Staff will continue to meet with leadership to evaluate progress on financial and operational improvements as well as PAUs. Staff will review a summary of the 2014 CIA evaluation when complete. Staff will also continue to evaluate reporting of uncompensated care for St. Joseph by fiscal year end. Staff will complete its evaluation of a sample of contracts to determine their consistency with the balanced values of the Triple Aim.
Flu Situation During the last few weeks of 2014, HSCRC staff began to hear about an escalation of the flu. The increased incidence of flu has been causing an increase in emergency room visits and hospitalizations in Maryland, and most of the nation. In late December and early January, some hospitals reached maximum staffed occupancy and emergency rooms were crowded and on bypass. HSCRC staff is focused on addressing the following concerns.
• HSCRC is committed to ensuring that hospitals have adequate resources to address patient needs. HSCRC staff is monitoring the situation closely to determine the need for adjustments to global budgets.
8
• If the flu escalation in Maryland were worse than the nation, this could affect our Medicare savings. It is important to monitor the situation, and work with the Center for Medicare and Medicaid Innovation (CMMI) to address this if necessary.
• Finally, while staff is aware of some deficiencies in the flu vaccines provided this season, we wish to point out the importance of increasing vaccination levels in preventing illness, hospitalizations and deaths. The costs of flu treatment can be very significant, and the evidence shows the potential for significant reduction in hospitalizations when increased levels of vaccination are provided.
Background The HSCRC is sensitive to the potential for epidemics to affect hospital utilization and costs in unpredictable ways. Hospitals need to have the requisite resources to take care of patients in these circumstances, and the HSCRC is focused on assuring that these financial requirements are met. Staff first recognized the potential for epidemics when developing the Admission Readmission agreements with hospitals. Recognition of the potential for such events was subsequently incorporated into both Total Patient Revenue (TPR) and Global Budget Revenue (GBR) agreements. These agreements are designed to enable the HSCRC and hospitals to work together in extraordinary circumstances to adjust budgets on a one time basis for such events.
For the majority of hospitals, the global budget base period was FY 2012-2013, which was a high flu season. Some hospitals have a global base period of calendar year 2013. Staff will evaluate flu levels relative to the base years. For the most recent fiscal year 2013-2014, flu levels were lower and hospitals recognized a positive financial impact from the lower levels of cases when their GBR revenue base was calculated. Analysis The HSCRC staff has a number of tools at its disposal to help assess the impact of the flu season. First, the Maryland Department of Health and Mental Hygiene (DHMH) monitors a number of parameters to track influenza, including monitoring visits to sentinel outpatient settings for influenza-like illness (ILI), ED visits for ILI, hospitalizations for influenza, flu test results at sentinel clinical laboratories, and testing at the DHMH Laboratories Administration. DHMH also monitors for ILI among volunteers throughout the state who report symptoms weekly through the Maryland Resident Influenza Tracking System (MRITS). DHMH monitors other indicators as well. Maryland-specific surveillance data are published weekly in a surveillance report that is available on the DHMH website. DHMH also participates in national surveillance in concert with the Centers for Disease Control and Prevention (CDC), which also tracks and publishes the progression of flu on a weekly basis. In addition, CRISP collects near real time ADT data for admissions, ER visits, and all other hospitalizations that could be utilized to track the incidence
9
of changes in hospitalizations, if necessary. Finally , the HSCRC began collecting monthly case mix data from hospitals during 2014. HSCRC staff receive data shortly after the end of each month. With such little lag in claims data combined with the usual conclusion of the high flu season by the end of February, staff is in a good position to work with hospitals to adjust budgets if needed.
The most recent DHMH surveillance report summary stated the following:
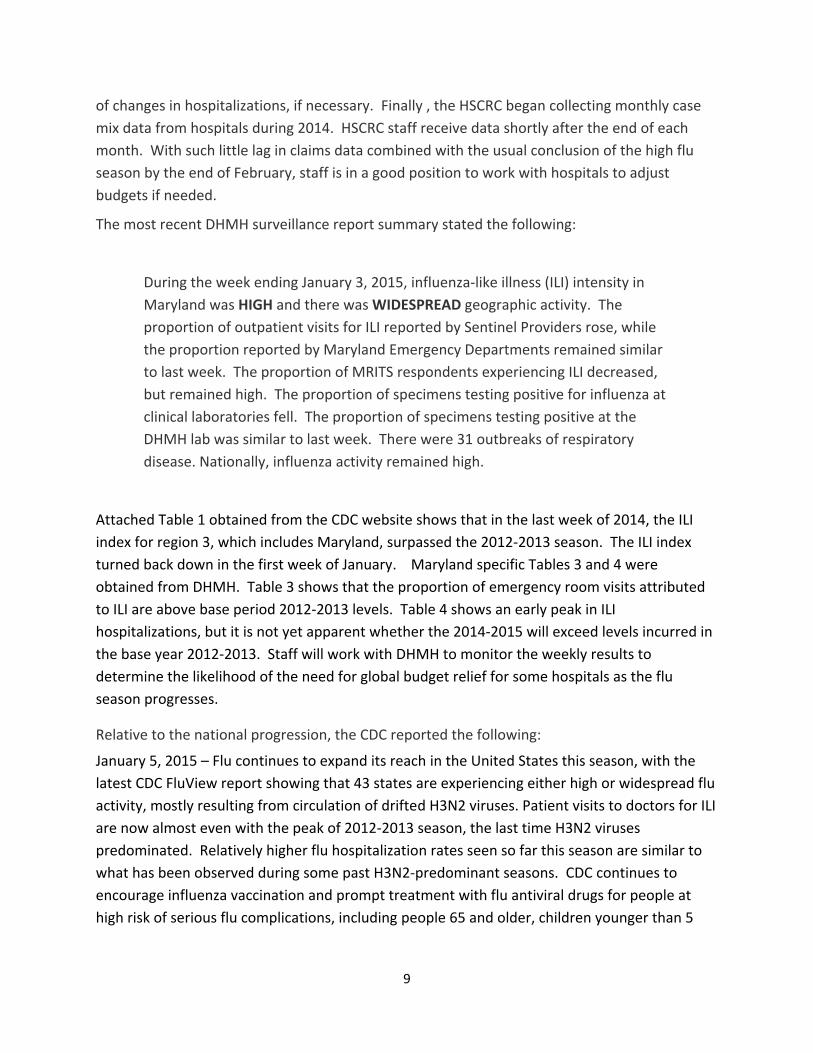
During the week ending January 3, 2015, influenza-like illness (ILI) intensity in Maryland was HIGH and there was WIDESPREAD geographic activity. The proportion of outpatient visits for ILI reported by Sentinel Providers rose, while the proportion reported by Maryland Emergency Departments remained similar to last week. The proportion of MRITS respondents experiencing ILI decreased, but remained high. The proportion of specimens testing positive for influenza at clinical laboratories fell. The proportion of specimens testing positive at the DHMH lab was similar to last week. There were 31 outbreaks of respiratory disease. Nationally, influenza activity remained high.
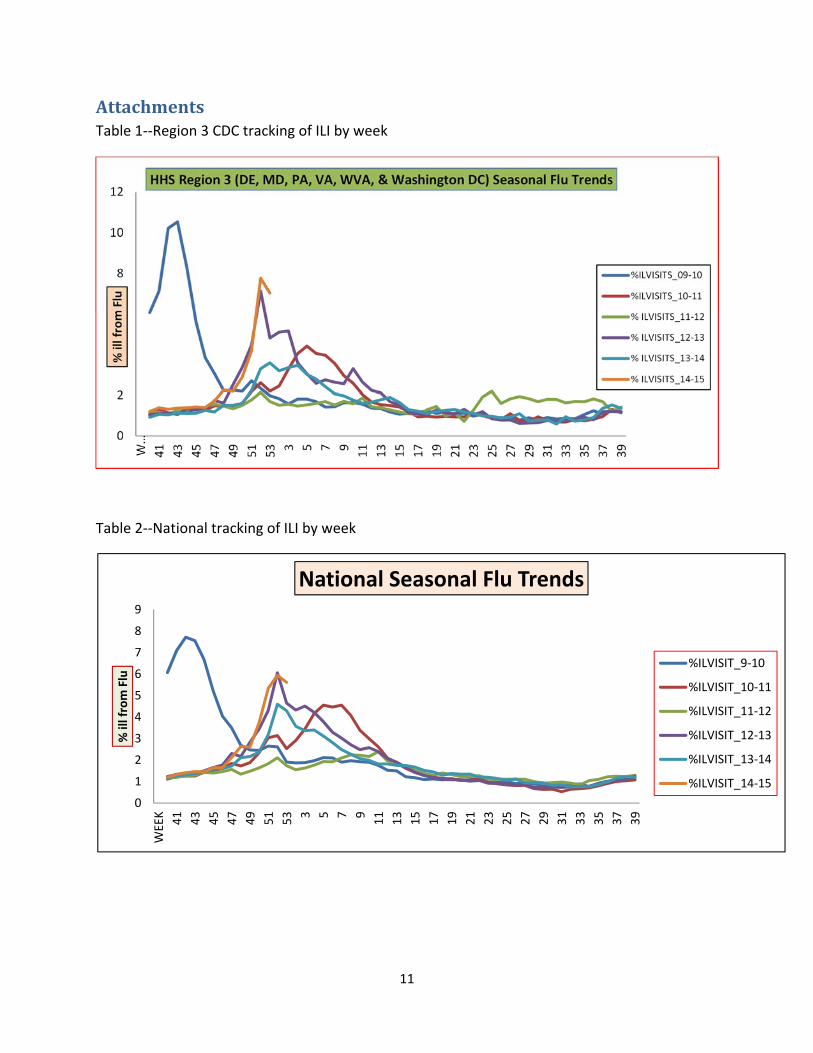
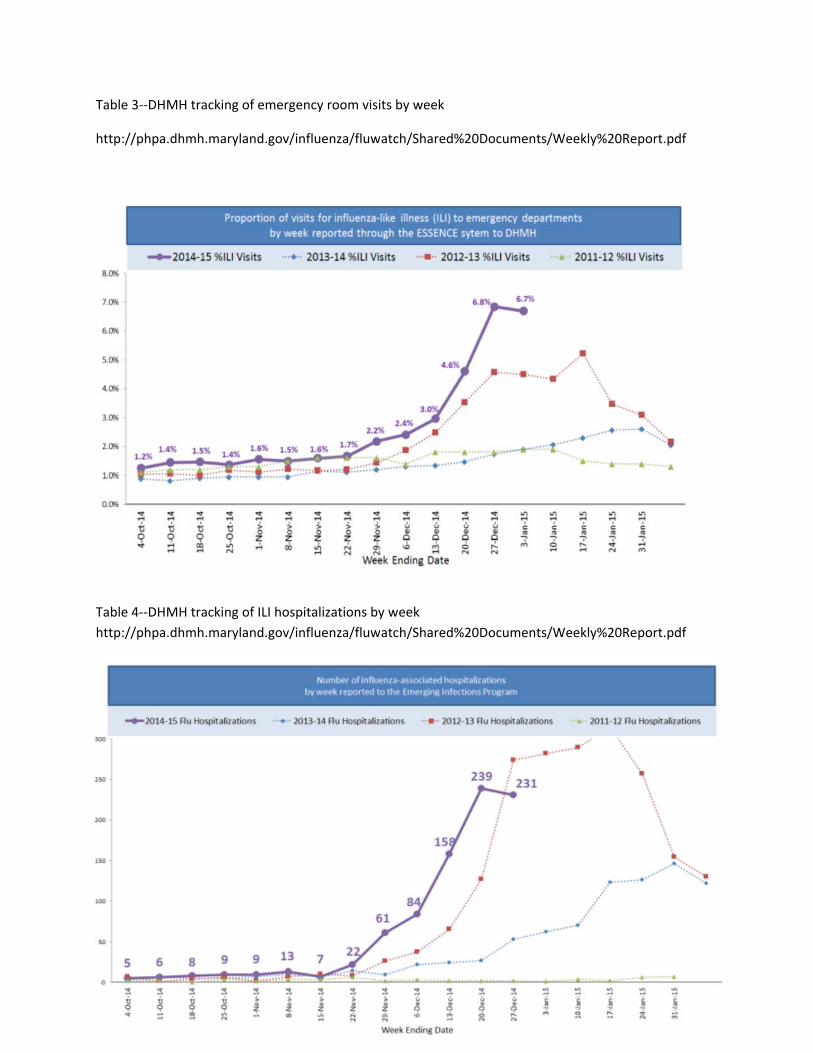
Attached Table 1 obtained from the CDC website shows that in the last week of 2014, the ILI index for region 3, which includes Maryland, surpassed the 2012-2013 season. The ILI index turned back down in the first week of January. Maryland specific Tables 3 and 4 were obtained from DHMH. Table 3 shows that the proportion of emergency room visits attributed to ILI are above base period 2012-2013 levels. Table 4 shows an early peak in ILI hospitalizations, but it is not yet apparent whether the 2014-2015 will exceed levels incurred in the base year 2012-2013. Staff will work with DHMH to monitor the weekly results to determine the likelihood of the need for global budget relief for some hospitals as the flu season progresses.
Relative to the national progression, the CDC reported the following:
January 5, 2015 – Flu continues to expand its reach in the United States this season, with the latest CDC FluView report showing that 43 states are experiencing either high or widespread flu activity, mostly resulting from circulation of drifted H3N2 viruses. Patient visits to doctors for ILI are now almost even with the peak of 2012-2013 season, the last time H3N2 viruses predominated. Relatively higher flu hospitalization rates seen so far this season are similar to what has been observed during some past H3N2-predominant seasons. CDC continues to encourage influenza vaccination and prompt treatment with flu antiviral drugs for people at high risk of serious flu complications, including people 65 and older, children younger than 5
10
years (and especially those younger than 2 years), pregnant women and any person with certain health conditions."
Conclusion Flu associated utilization has the potential to impact hospitals' global budgets. HSCRC staff will be especially attentive to this situation during the next six to eight weeks, and will make adjustments to individual hospital's global budgets if needed. It should be recognized that FY 2014 was a light flu season compared to most hospitals' base year of FY 2013, and that hospitals benefitted from this. HSCRC staff will also assess the need to address the situation with CMMI once the flu season is complete. HSCRC encourages hospitals to work with public health officials and affiliated providers to increase anti-influenza vaccine rates in light of the potential for reducing avoidable illness burden, deaths, and costs.
11
Attachments Table 1--Region 3 CDC tracking of ILI by week
Table 2--National tracking of ILI by week
0
2
4
6
8
10
12
W…
41 43 45 47 49 51 53 3 5 7 9 11 13 15 17 19 21 23 25 27 29 31 33 35 37 39
% il
l fro
m F
lu
HHS Region 3 (DE, MD, PA, VA, WVA, & Washington DC) Seasonal Flu Trends
%ILVISITS_09-10
%ILVISITS_10-11
% ILVISITS_11-12
% ILVISITS_12-13
% ILVISITS_13-14
% ILVISITS_14-15
0
1
2
3
4
5
6
7
8
9
WEE
K 41 43 45 47 49 51 53 3 5 7 9 11 13 15 17 19 21 23 25 27 29 31 33 35 37 39
% il
l fro
m F
lu
National Seasonal Flu Trends
%ILVISIT_9-10
%ILVISIT_10-11
%ILVISIT_11-12
%ILVISIT_12-13
%ILVISIT_13-14
%ILVISIT_14-15
12
Table 3--DHMH tracking of emergency room visits by week
http://phpa.dhmh.maryland.gov/influenza/fluwatch/Shared%20Documents/Weekly%20Report.pdf
Table 4--DHMH tracking of ILI hospitalizations by week http://phpa.dhmh.maryland.gov/influenza/fluwatch/Shared%20Documents/Weekly%20Report.pdf
1
Monitoring Maryland Performance Financial Data
Year to Date thru November 2014

2
Gross All Payer Revenue GrowthYear to Date (thru November 2014) Compared to Same Period in Prior Year
1.34% 1.50%1.87% 1.82%
-3.67%
-1.63%
-4.00%
-3.00%
-2.00%
-1.00%
0.00%
1.00%
2.00%
3.00%
FY 2015 CY 2014
All-Payer Year-to-Date Gross Revenue Growth
AllRevenue
In State
Out of State
All Revenue
In State
Out of State
3
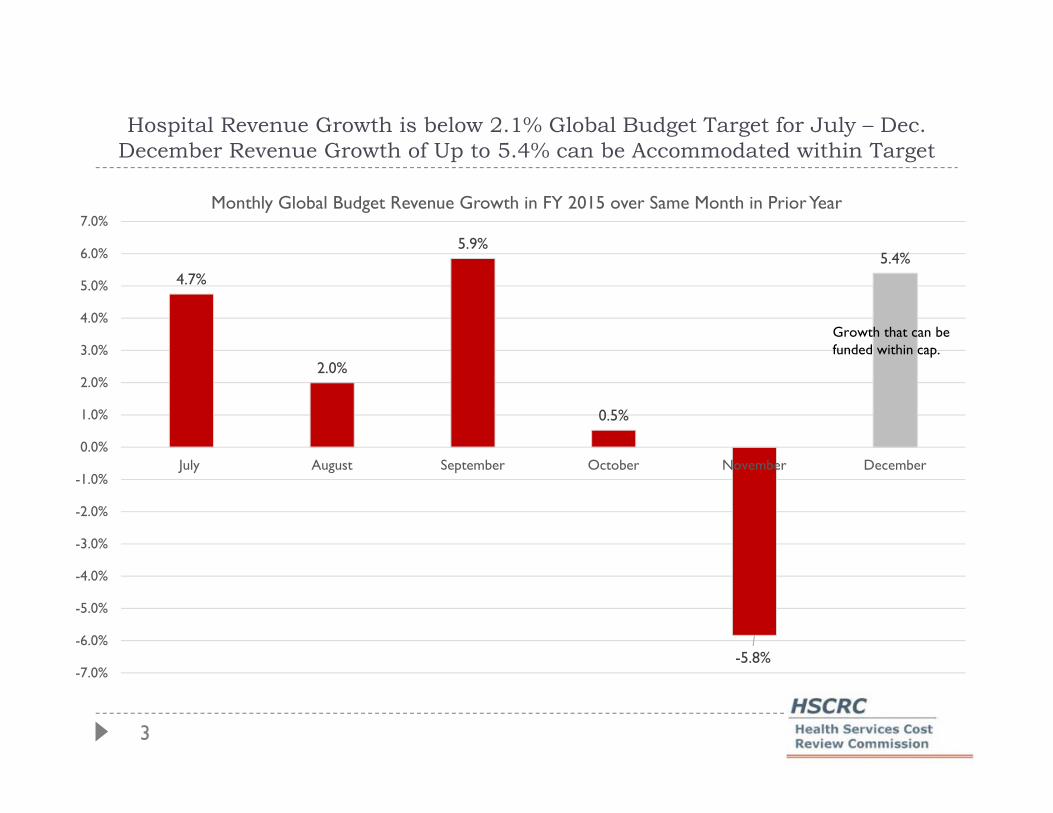
Hospital Revenue Growth is below 2.1% Global Budget Target for July – Dec. December Revenue Growth of Up to 5.4% can be Accommodated within Target
4.7%
2.0%
5.9%
0.5%
-5.8%
5.4%
-7.0%
-6.0%
-5.0%
-4.0%
-3.0%
-2.0%
-1.0%
0.0%
1.0%
2.0%
3.0%
4.0%
5.0%
6.0%
7.0%
July August September October November December
Monthly Global Budget Revenue Growth in FY 2015 over Same Month in Prior Year
Growth that can befunded within cap.

4
Gross Medicare Fee-for-Service Revenue GrowthYear to Date (thru November 2014) Compared to Same Period in Prior Year
1.03%1.40%
1.79% 1.68%
-6.82%
-1.62%
-8.00%
-7.00%
-6.00%
-5.00%
-4.00%
-3.00%
-2.00%
-1.00%
0.00%
1.00%
2.00%
3.00%
FY 2015 CY 2014
Medicare Year-to-Date Gross Revenue Growth
All Revenue
In State
Out of State
Out of State
AllRevenue
In State

5
Per Capita Growth RatesFiscal Year 2015 and Calendar Year 2014
Calendar and Fiscal Year trends to date are below All-Payer Model Guardrail for per capita growth.
1.22%
-1.37%
1.17%
-1.55%
-4.00%
-2.00%
0.00%
2.00%
4.00%
6.00%
All-Payer In-State Fiscal Year YTD Medicare FFS In-State FY YTD All-Payer In-State Calendar YearYTD
Medicare FFS In-State CY YTD
Population Data from Estimates Prepared by Maryland Department of Planning FFS = Fee-for-Service
Fiscal Year Calendar Year
6
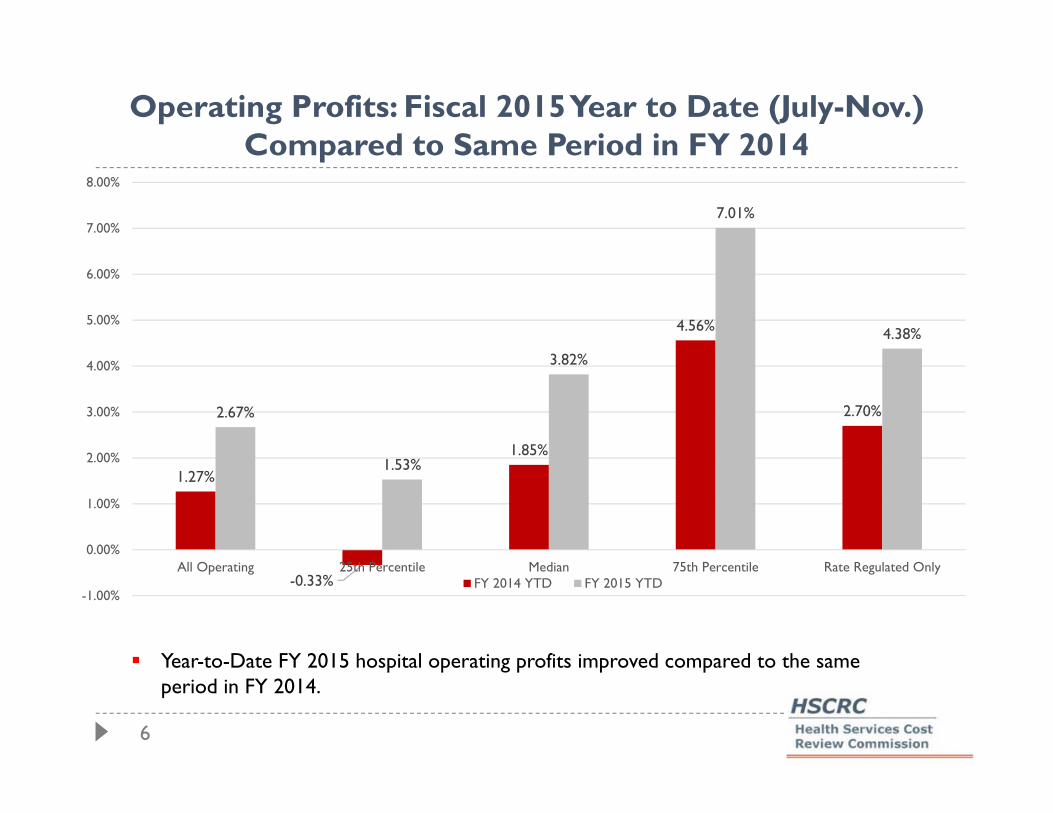
Operating Profits: Fiscal 2015 Year to Date (July-Nov.) Compared to Same Period in FY 2014
Year-to-Date FY 2015 hospital operating profits improved compared to the same period in FY 2014.
1.27%
-0.33%
1.85%
4.56%
2.70%2.67%
1.53%
3.82%
7.01%
4.38%
-1.00%
0.00%
1.00%
2.00%
3.00%
4.00%
5.00%
6.00%
7.00%
8.00%
All Operating 25th Percentile Median 75th Percentile Rate Regulated OnlyFY 2014 YTD FY 2015 YTD
7
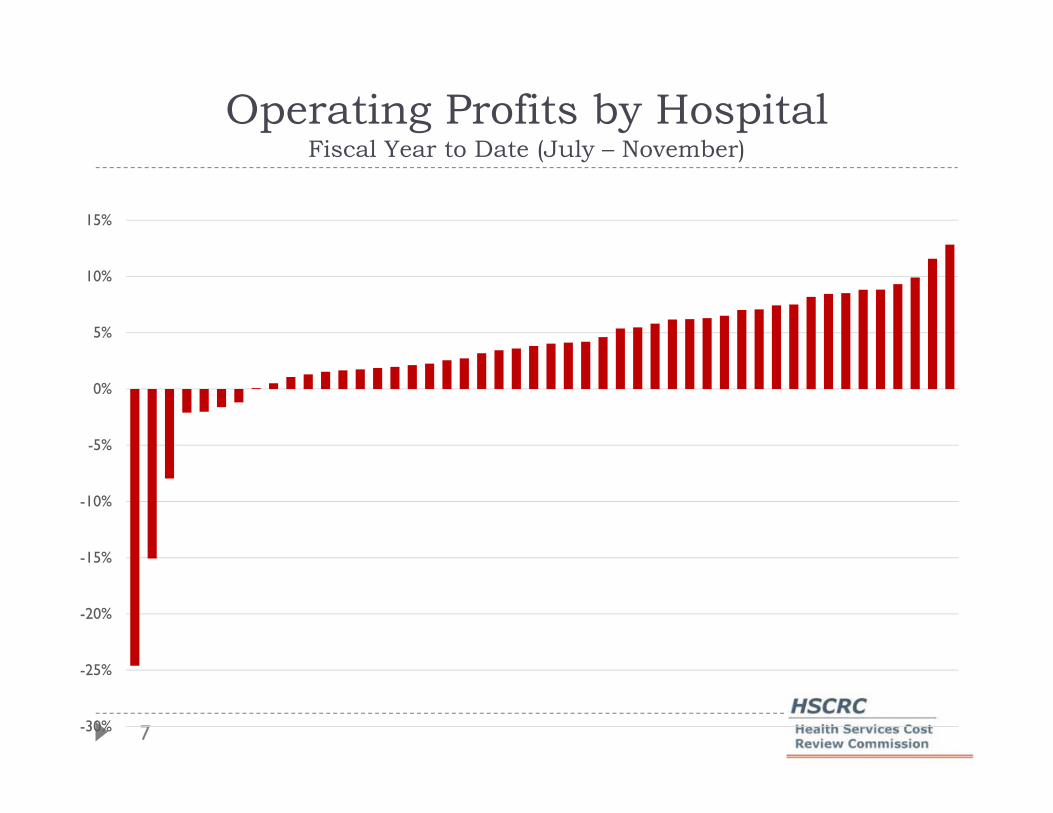
Operating Profits by HospitalFiscal Year to Date (July – November)
-30%
-25%
-20%
-15%
-10%
-5%
0%
5%
10%
15%

8
Purpose of Monitoring Maryland PerformanceEvaluate Maryland’s performance against All-Payer Modelrequirements:
All-Payer total hospital per capita revenue growth ceilingfor Maryland residents tied to long term state economic growth(GSP) per capita 3.58% annual growth rate
Medicare payment savings for Maryland beneficiaries comparedto dynamic national trend. Minimum of $330 million in savings over5 years
Patient and population centered-measures and targets topromote population health improvement Medicare readmission reductions to national average 30% reduction in preventable conditions under Maryland’s Hospital Acquired
Condition program (MHAC) over a 5 year period Many other quality improvement targets
9
Data Caveats Data revisions are expected. For financial data if residency is unknown, hospitals report this as a
Maryland resident. As more data becomes available, there may beshifts from Maryland to out-of-state.
Many hospitals are converting revenue systems along withimplementation of Electronic Health Records. This may cause someinstability in the accuracy of reported data. As a result, HSCRC staffwill monitor total revenue as well as the split of in state and out ofstate revenues.
All-payer per capita calculations for Calendar Year 2014 and Fiscal 2015 rely on Maryland Department of Planning projections of population growth of .64% (updated December 2014). Medicare per capita calculations use actual trends in Maryland Medicare beneficiary counts as reported monthly to the HSCRC by CMMI.
10
Monitoring Maryland Performance Quality Data
January Commission Meeting Update
11
Monthly Risk-Adjusted PPC Rates
0.40
0.60
0.80
1.00
1.20
1.40
1.60
1.80
2.00Ju
l-12
Aug
-12
Sep-
12
Oct
-12
Nov
-12
Dec
-12
Jan-
13
Feb-
13
Mar
-13
Apr
-13
May
-13
Jun-
13
Jul-1
3
Aug
-13
Sep-
13
Oct
-13
Nov
-13
Dec
-13
Jan-
14
Feb-
14
Mar
-14
Apr
-14
May
-14
Jun-
14
Jul-1
4
Aug
-14
Sep-
14
All-Payer
Medicare FFS
Linear (All-Payer)
Note: Based on final data for January 2013 - September 2014.
NewWaiver
Start Date
Risk Adjusted
PPC RateAll‐Payer Medicare
Sept. 13 YTD 1.28 1.49
Sept. 14 YTD 0.94 1.03
Percent Change ‐27.12% ‐31.01%
12
-60%
-50%
-40%
-30%
-20%
-10%
0%
10%
20%
30%
40%
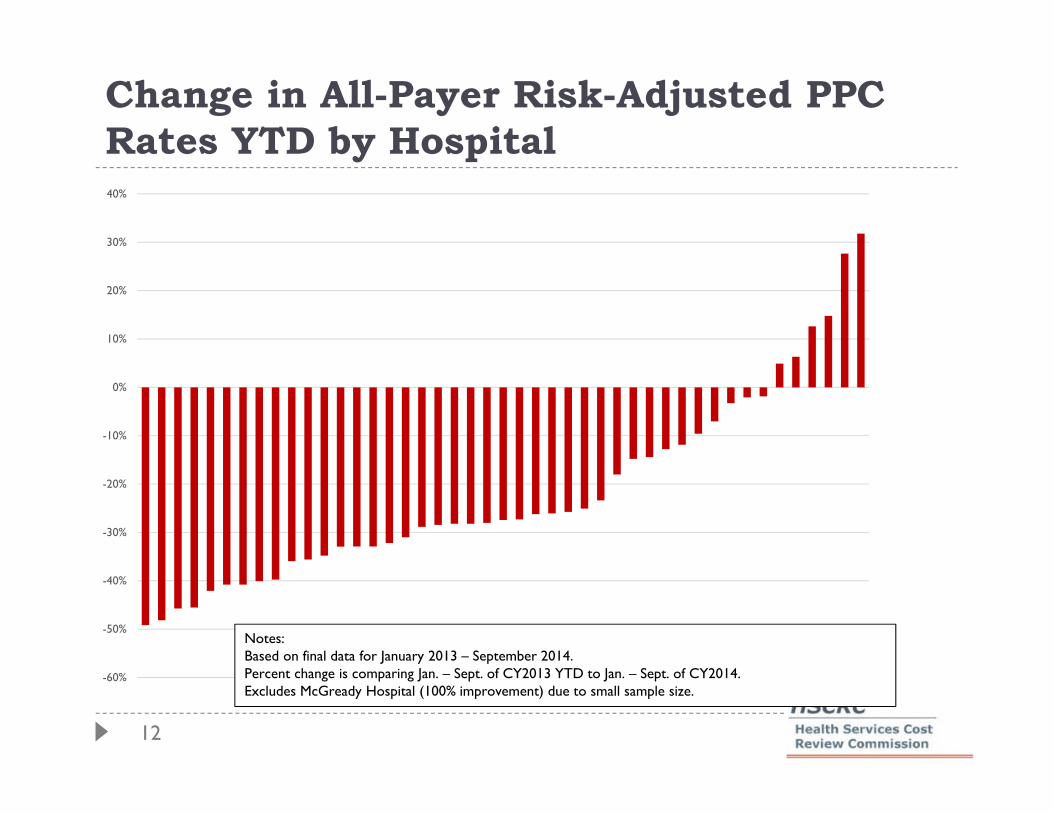
Change in All-Payer Risk-Adjusted PPC Rates YTD by Hospital
Notes:Based on final data for January 2013 – September 2014.Percent change is comparing Jan. – Sept. of CY2013 YTD to Jan. – Sept. of CY2014.Excludes McGready Hospital (100% improvement) due to small sample size.
13
Monthly Risk-Adjusted Readmission Rates
10.00%
10.50%
11.00%
11.50%
12.00%
12.50%
13.00%
13.50%
14.00%
14.50%Ju
l-12
Aug
-12
Sep-
12
Oct
-12
Nov
-12
Dec
-12
Jan-
13
Feb-
13
Mar
-13
Apr
-13
May
-13
Jun-
13
Jul-1
3
Aug
-13
Sep-
13
Oct
-13
Nov
-13
Dec
-13
Jan-
14
Feb-
14
Mar
-14
Apr
-14
May
-14
Jun-
14
Jul-1
4
Aug
-14
Sep-
14
Oct
-14
All-Payer
Medicare FFS
Linear (All-Payer)
Note: Based on final data for January 2013 - June 2014, and preliminary data through November 2014.
NewWaiver
Start Date
Risk Adjusted
Readmission RateAll‐Payer Medicare
Oct. 13 YTD 12.49% 13.19%
Oct. 14 YTD 11.98% 12.97%
Percent Change ‐4.04% ‐1.63%

14
-35%
-30%
-25%
-20%
-15%
-10%
-5%
0%
5%
10%
15%
20%
Change in All-Payer Risk-Adjusted Readmission Rates YTD by Hospital
Notes:Based on final data for January 2013 – September 2014 and preliminary data for July – November 2014. Percent change is comparing Jan. – Oct. of CY2013 YTD to Jan. – Oct. of CY2014.
Goal of 6.76% Reduction
(15 hospitals are on track to meeting
goal)

15
12.98%13.17%
12.64% 12.61% 12.64%12.46% 12.41% 12.54%
12.31% 12.19%
11.66%
10.0%
10.5%
11.0%
11.5%
12.0%
12.5%
13.0%
13.5%
Unadjusted Readmission Rate by Quarter
-10%-9%-8%-7%-6%-5%-4%-3%-2%-1%0%
Q1 2013 Q2 2013 Q3 2013 Q4 2013 Q1 2014 Q2 2014 Q3 2014
Percent Change Compared to Previous Year
Readmit Rate Readmissions Index Admits Only
For July – Sept. 2014, there has been over a 9% reduction in the number
of readmissions compared to July – Sept. 2013
16
-30%
-20%
-10%
0%
10%
20%
30%
0%
5%
10%
15%
20%
25%
30%
ST. M
AR
YM
ERC
YFT
. WA
SHIN
GTO
NBO
N S
ECO
UR
SU
NIO
N M
EMO
RIA
LN
OR
TH
WES
TU
M S
T. J
OSE
PHM
CC
REA
DY
SIN
AI
CH
EST
ERT
OW
NH
ARF
ORD
UM
MC
MID
TO
WN
CA
RR
OLL
CO
UN
TY
ST. A
GN
ESLA
UR
EL R
EGIO
NA
LA
NN
E A
RU
ND
ELD
OC
TO
RS
CO
MM
UN
ITY
HO
PKIN
S BA
YVIE
WR
EHA
B &
ORT
HO
BWM
CG
OO
D S
AM
AR
ITA
NH
OW
AR
D C
OU
NT
YW
EST
ERN
MA
RY
LAN
DG
.B.M
.C.
PRIN
CE
GEO
RG
EH
ARB
OR
MO
NTG
OM
ERY
GEN
ERA
LFR
AN
KLI
N S
QU
AR
EJO
HN
S H
OPK
INS
UN
IV. O
F M
AR
YLA
ND
AT
LAN
TIC
GEN
ERA
LG
ARR
ETT
CO
UN
TY
PEN
INSU
LA R
EGIO
NA
LW
ASH
ING
TO
N A
DV
ENTI
STSO
UT
HER
N M
AR
YLA
ND
UN
ION
OF
CEC
IL C
OU
NT
HO
LY C
RO
SSSH
AD
Y G
RO
VE
CH
ARL
ES R
EGIO
NA
LU
PPER
CH
ESA
PEA
KE
MER
ITU
SC
ALV
ERT
DO
RC
HES
TER
FRED
ERIC
K M
EMO
RIA
LSU
BUR
BAN
EAST
ON
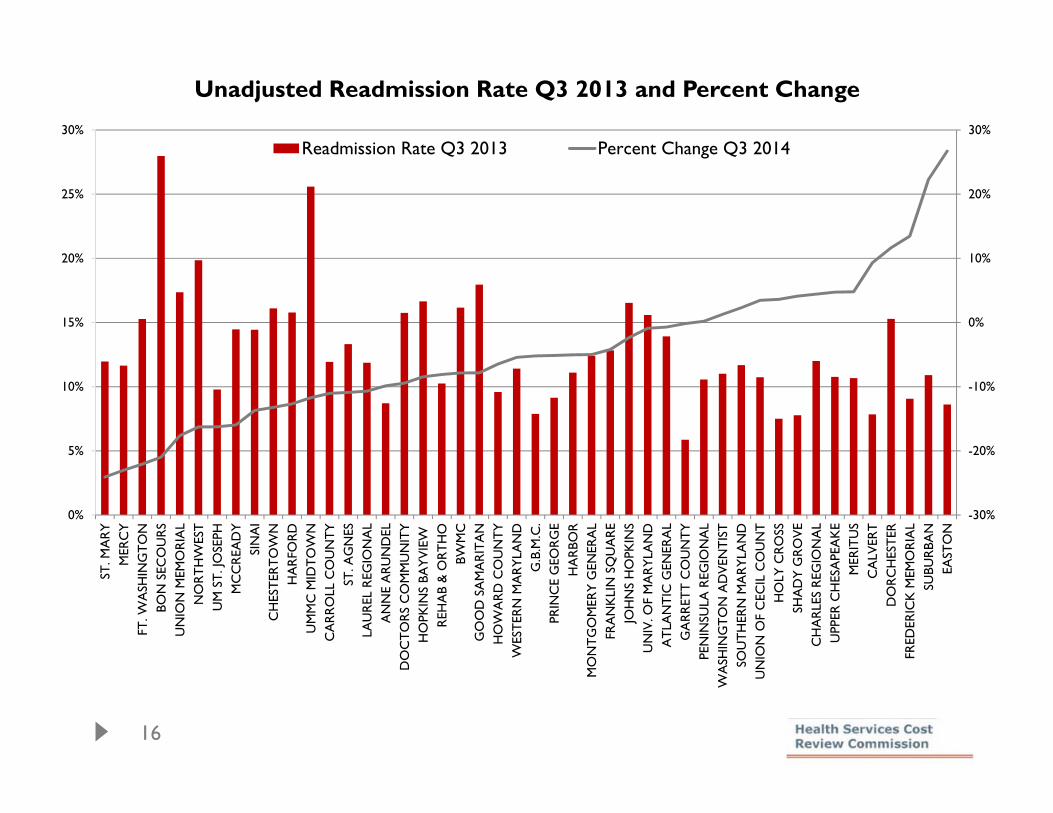
Unadjusted Readmission Rate Q3 2013 and Percent Change
Readmission Rate Q3 2013 Percent Change Q3 2014
17
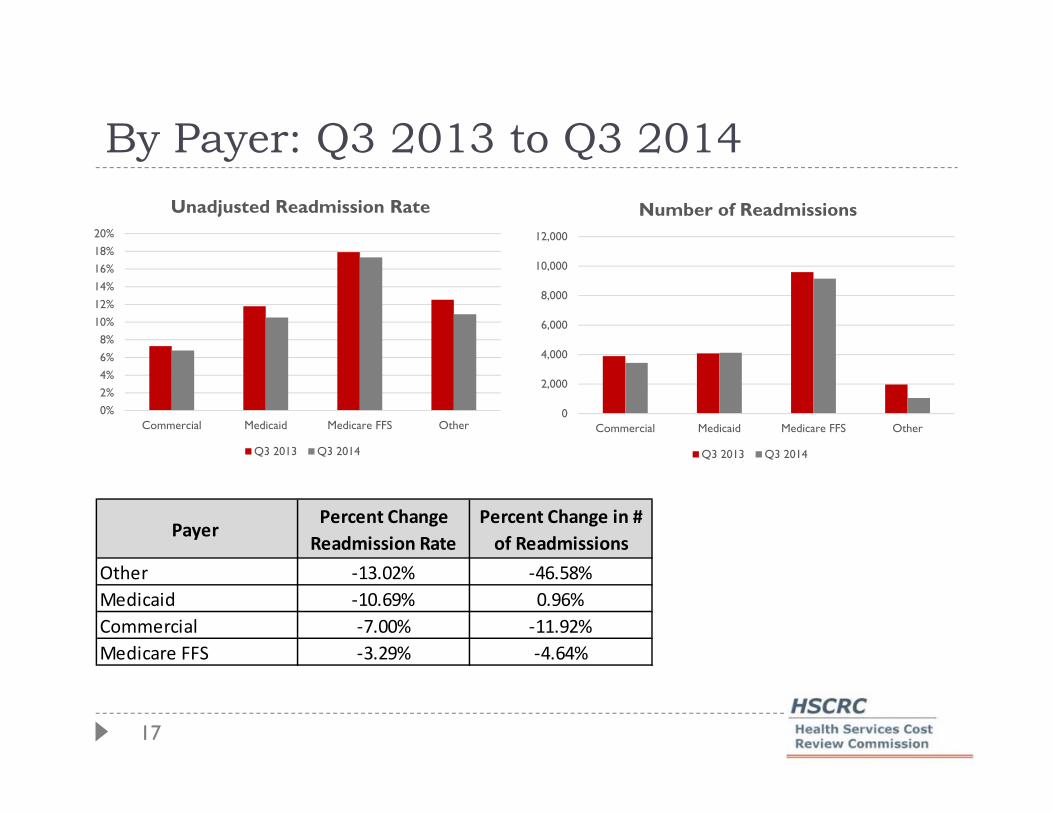
By Payer: Q3 2013 to Q3 2014
0%2%4%6%8%
10%12%14%16%18%20%
Commercial Medicaid Medicare FFS Other
Unadjusted Readmission Rate
Q3 2013 Q3 2014
0
2,000
4,000
6,000
8,000
10,000
12,000
Commercial Medicaid Medicare FFS Other
Number of Readmissions
Q3 2013 Q3 2014
Payer Percent Change
Readmission Rate
Percent Change in #
of Readmissions
Other ‐13.02% ‐46.58%
Medicaid ‐10.69% 0.96%
Commercial ‐7.00% ‐11.92%
Medicare FFS ‐3.29% ‐4.64%
18
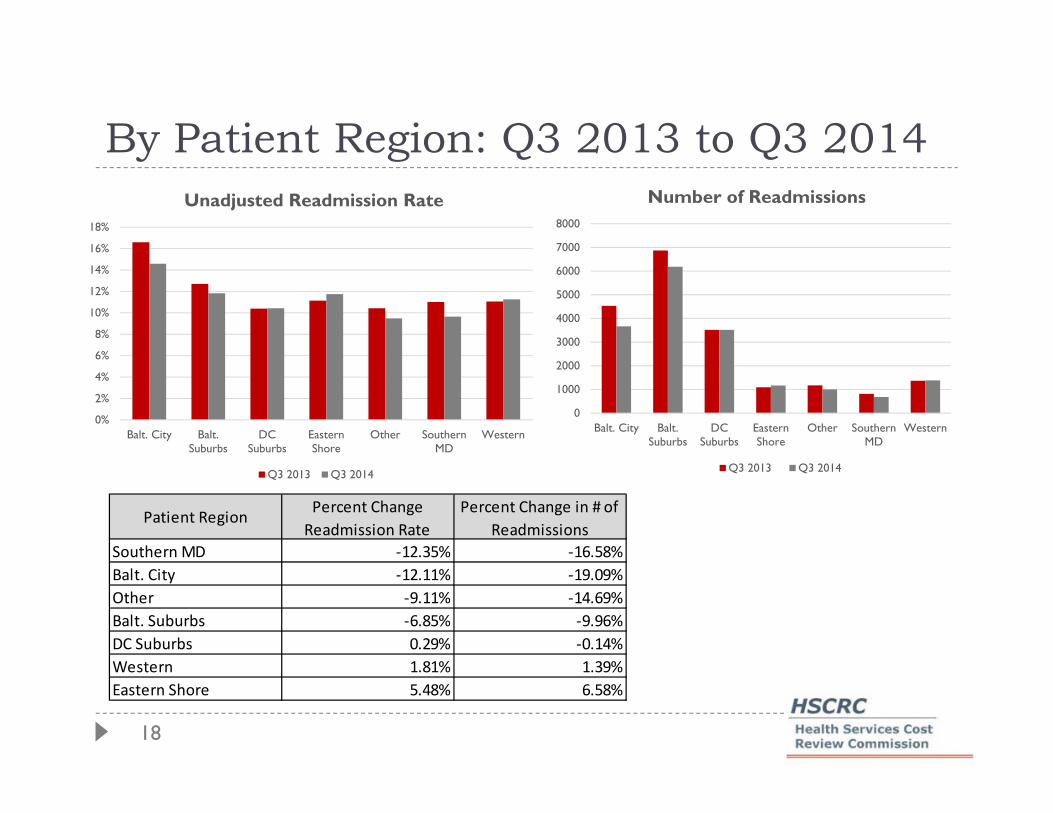
By Patient Region: Q3 2013 to Q3 2014
0%
2%
4%
6%
8%
10%
12%
14%
16%
18%
Balt. City Balt.Suburbs
DCSuburbs
EasternShore
Other SouthernMD
Western
Unadjusted Readmission Rate
Q3 2013 Q3 2014
0
1000
2000
3000
4000
5000
6000
7000
8000
Balt. City Balt.Suburbs
DCSuburbs
EasternShore
Other SouthernMD
Western
Number of Readmissions
Q3 2013 Q3 2014
Patient RegionPercent Change
Readmission Rate
Percent Change in # of
Readmissions
Southern MD ‐12.35% ‐16.58%
Balt. City ‐12.11% ‐19.09%
Other ‐9.11% ‐14.69%
Balt. Suburbs ‐6.85% ‐9.96%
DC Suburbs 0.29% ‐0.14%
Western 1.81% 1.39%
Eastern Shore 5.48% 6.58%
19
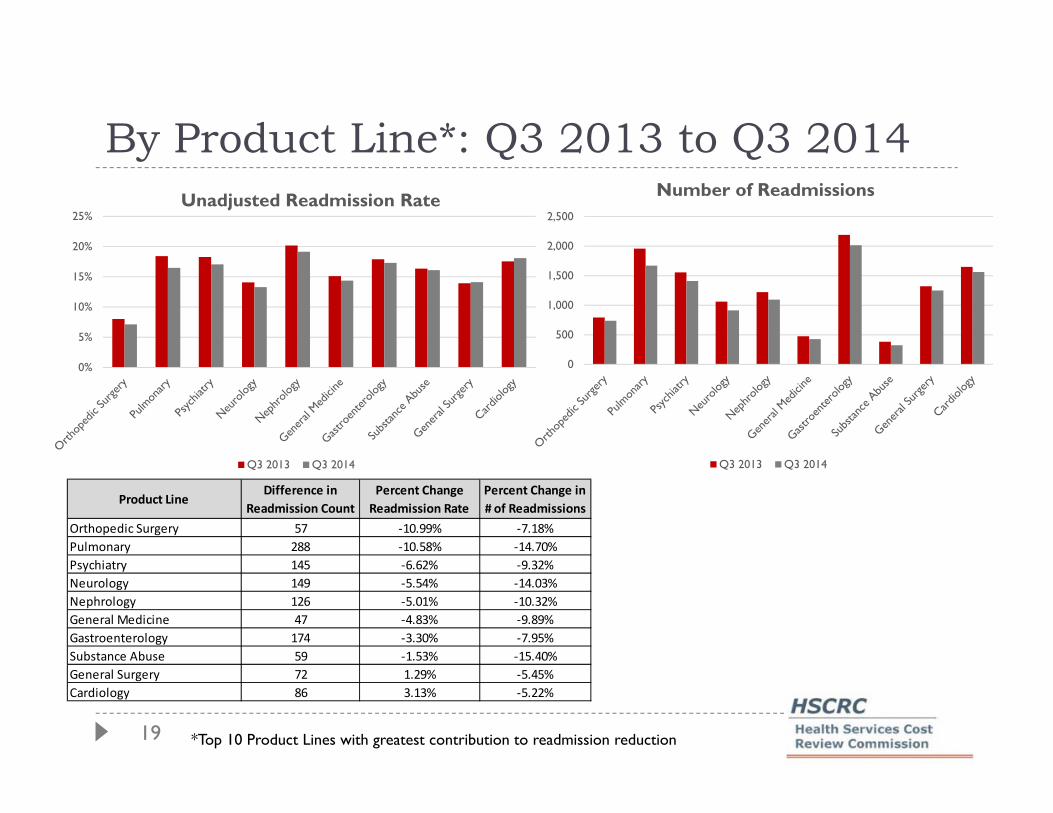
By Product Line*: Q3 2013 to Q3 2014
0%
5%
10%
15%
20%
25%Unadjusted Readmission Rate
Q3 2013 Q3 2014
0
500
1,000
1,500
2,000
2,500
Number of Readmissions
Q3 2013 Q3 2014
*Top 10 Product Lines with greatest contribution to readmission reduction
Product LineDifference in
Readmission Count
Percent Change
Readmission Rate
Percent Change in
# of Readmissions
Orthopedic Surgery 57 ‐10.99% ‐7.18%
Pulmonary 288 ‐10.58% ‐14.70%
Psychiatry 145 ‐6.62% ‐9.32%
Neurology 149 ‐5.54% ‐14.03%
Nephrology 126 ‐5.01% ‐10.32%
General Medicine 47 ‐4.83% ‐9.89%
Gastroenterology 174 ‐3.30% ‐7.95%
Substance Abuse 59 ‐1.53% ‐15.40%
General Surgery 72 1.29% ‐5.45%
Cardiology 86 3.13% ‐5.22%

Cases Closed
The closed cases from last month are listed in the agenda
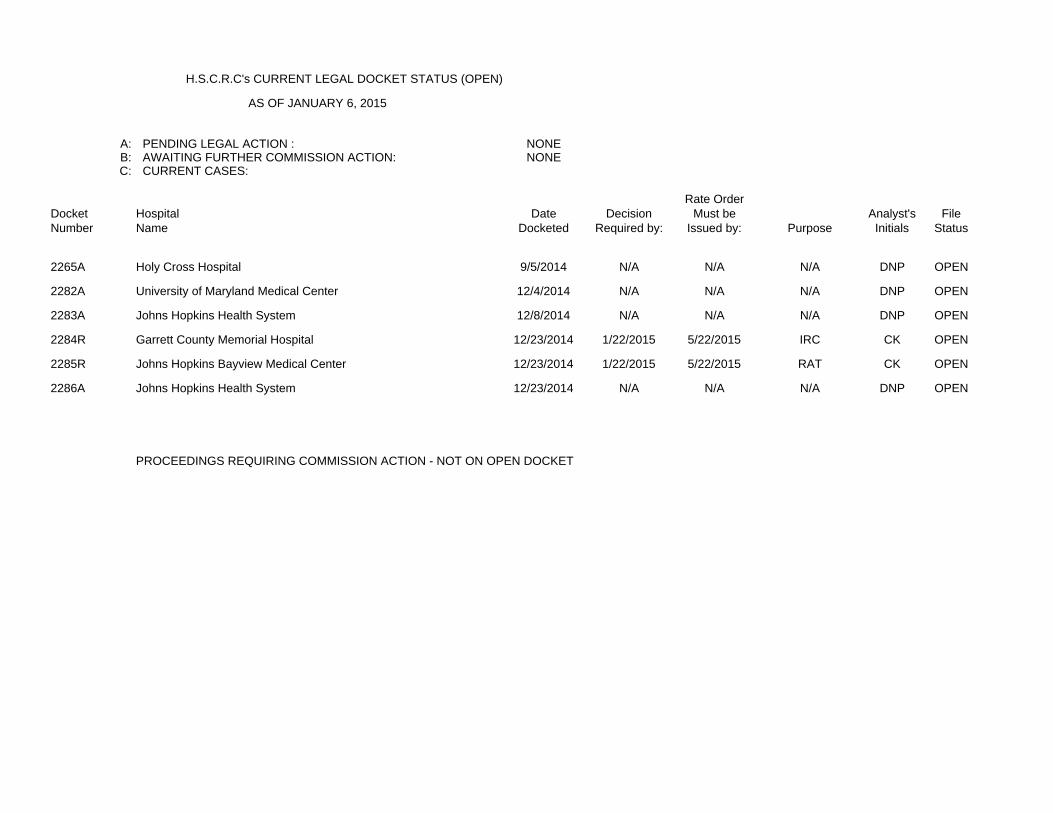
H.S.C.R.C's CURRENT LEGAL DOCKET STATUS (OPEN)
AS OF JANUARY 6, 2015
A: PENDING LEGAL ACTION : NONEB: AWAITING FURTHER COMMISSION ACTION: NONEC: CURRENT CASES:
Rate OrderDocket Hospital Date Decision Must be Analyst's FileNumber Name Docketed Required by: Issued by: Purpose Initials Status
2265A Holy Cross Hospital 9/5/2014 N/A N/A N/A DNP OPEN
2282A University of Maryland Medical Center 12/4/2014 N/A N/A N/A DNP OPEN
2283A Johns Hopkins Health System 12/8/2014 N/A N/A N/A DNP OPEN
2284R Garrett County Memorial Hospital 12/23/2014 1/22/2015 5/22/2015 IRC CK OPEN
2285R Johns Hopkins Bayview Medical Center 12/23/2014 1/22/2015 5/22/2015 RAT CK OPEN
2286A Johns Hopkins Health System 12/23/2014 N/A N/A N/A DNP OPEN
PROCEEDINGS REQUIRING COMMISSION ACTION - NOT ON OPEN DOCKET
IN RE: THE APPLICATION FOR * BEFORE THE MARYLAND HEALTH
ALTERNATIVE METHOD OF RATE * SERVICES COST REVIEW
DETERMINATION * COMMISSION
UNIVERSITY OF MARYLAND * DOCKET: 2014
MEDICAL CENTER * FOLIO: 2092
BALTIMORE, MARYLAND * PROCEEDING: 2282A
Staff Recommendation - Approved
January 14, 2015
I. INTRODUCTION
The University of Maryland Medical Center (“Hospital”) filed an application with the
HSCRC on December 4, 2014 requesting approval to continue its participation in a global rate
arrangement with BlueCross and BlueShield Association Blue Distinction Centers for selected
solid organ transplant services for a period of one year beginning January 1, 2015.
II. OVERVIEW OF APPLICATION
The contract will be held and administered by University Physicians, Inc. (UPI), which is
a subsidiary of the University of Maryland Medical System. UPI will manage all financial
transactions related to the global price contract including payments to the Hospital and bear all
risk relating to services associated with the contract.
III. FEE DEVELOPMENT
The hospital portion of the global rates was developed by calculating historical charges
for patients receiving the procedures for which global rates are to be paid. The remainder of the
global rate is comprised of physician service costs. Additional per diem payments were
calculated for cases that exceed a specific length of stay outlier threshold.
IV. IDENTIFICATION AND ASSESSMENT OF RISK
The Hospital will submit bills to UPI for all contracted and covered services. UPI is
responsible for billing the payer, collecting payments, disbursing payments to the Hospital at its
full HSCRC approved rates, and reimbursing the physicians. The Hospital contends that the
arrangement between UPI and the Hospital holds the Hospital harmless from any shortfalls in
payment from the global price contract.
V. STAFF EVALUATION
Staff believes that the Hospital can achieve favorable performance under this
arrangement.
VI. STAFF RECOMMENDATION
The staff recommends that the Commission approve the Hospital’s application for an

alternative method of rate determination for blood and bone marrow transplant services, for a
one year period commencing January 3, 2015. The Hospital will need to file a renewal
application for review to be considered for continued participation.
Consistent with its policy paper regarding applications for alternative methods of rate
determination, the staff recommends that this approval be contingent upon the execution of the
standard Memorandum of Understanding ("MOU") with the Hospital for the approved contract.
This document would formalize the understanding between the Commission and the Hospital,
and would include provisions for such things as payments of HSCRC-approved rates, treatment
of losses that may be attributed to the contract, quarterly and annual reporting, confidentiality of
data submitted, penalties for noncompliance, project termination and/or alteration, on-going
monitoring, and other issues specific to the proposed contract. The MOU will also stipulate that
operating losses under the contract cannot be used to justify future requests for rate increases.

IN RE: THE APPLICATION FOR * BEFORE THE MARYLAND HEALTH
ALTERNATIVE METHOD OF RATE * SERVICES COST REVIEW
DETERMINATION * COMMISSION
JOHNS HOPKINS HEALTH * DOCKET: 2014
SYSTEM * FOLIO: 2093
BALTIMORE, MARYLAND * PROCEEDING: 2283A
Staff Recommendation - Approved
January 14, 2015
I. INTRODUCTION
On December 8, 2014, Johns Hopkins Health System (“System”) filed a renewal
application on behalf of its member hospitals (the “Hospitals”) requesting approval from the
HSCRC to continue participation in a revised global rate arrangement for cardiovascular
procedures with Global Excel Management, Inc. The Hospitals request that the Commission
approve the arrangement for an additional year beginning February 1, 2015.
II. OVERVIEW OFAPPLICATION
The contract will continue to be held and administered by Johns Hopkins HealthCare,
LLC ("JHHC"), which is a subsidiary of the System. JHHC will continue to manage all financial
transactions related to the global price contract including payments to the Hospitals and bear all
risk relating to regulated services associated with the contract.
III. FEE DEVELOPMENT
The hospital portion of the global rates was developed by calculating mean historical
charges for patients receiving the procedures for which global rates are to be paid. The
remainder of the global rate is comprised of physician service costs. Additional per diem
payments were calculated for cases that exceed a specific length of stay outlier threshold.
IV. IDENTIFICATION AND ASSESSMENTOF RISK
The Hospitals will continue to submit bills to JHHC for all contracted and covered
services. JHHC is responsible for billing the payer, collecting payments, disbursing payments
to the Hospitals at their full HSCRC approved rates, and reimbursing the physicians. The System
contends that the arrangement among JHHC, the Hospitals, and the physicians holds the
Hospitals harmless from any shortfalls in payment from the global price contract. JHHC
maintains it has been active in similar types of fixed fee contracts for several years, and that
JHHC is adequately capitalized to bear the risk of potential losses.

V. STAFF EVALUATION
Staff found that there was no experience under the arrangement for the last year.
However, staff believes that the Hospitals can achieve favorable performance under this
arrangement.
VI. STAFF RECOMMENDATION
The staff recommends that the Commission approve the Hospitals’ application for
an alternative method of rate determination for cardiovascular services for a one year period
commencing February 1, 2015. The Hospitals will need to file a renewal application for review
to be considered for continued participation. Consistent with its policy paper regarding
applications for alternative methods of rate determination, the staff recommends that this
approval be contingent upon the execution of the standard Memorandum of Understanding
("MOU") with the Hospitals for the approved contract. This document would formalize the
understanding between the Commission and the Hospitals, and would include provisions for
such things as payments of HSCRC-approved rates, treatment of losses that may be attributed to
the contract, quarterly and annual reporting, confidentiality of data submitted, penalties for
noncompliance, project termination and/or alteration, on-going monitoring, and other issues
specific to the proposed contract. The MOU will also stipulate that operating losses under the
contract cannot be used to justify future requests for rate increases.
IN RE: THE APPLICATION FOR * BEFORE THE MARYLAND HEALTH
ALTERNATIVE METHOD OF RATE * SERVICES COST REVIEW
DETERMINATION * COMMISSION
JOHNS HOPKINS HEALTH * DOCKET: 2014
SYSTEM * FOLIO: 2096
BALTIMORE, MARYLAND * PROCEEDING: 2286A
Staff Recommendation - Approved
January 14, 2015

I. INTRODUCTION
Johns Hopkins Health System (“System”) filed an application with the HSCRC on
December 23, 2014, on behalf of its member hospitals, Johns Hopkins Hospital, Johns Hopkins
Bayview Medical Center, and Howard County General Hospital (the “Hospitals”) for an
alternative method of rate determination, pursuant to COMAR 10.37.10.06. The System requests
approval from the HSCRC to continue to participate in a revised global rate arrangement for
solid organ and bone marrow transplants with Optum Health, a division of United HealthCare
Services, for a period of one year beginning February 1, 2015.
II. OVERVIEW OF APPLICATION
The contract will continue to be held and administered by Johns Hopkins HealthCare,
LLC ("JHHC"), which is a subsidiary of the System. JHHC will manage all financial
transactions related to the global price contract including payments to the System hospitals and
bear all risk relating to regulated services associated with the contract.
III. FEE DEVELOPMENT
The hospital portion of the global rates was developed by calculating mean historical
charges for patients receiving the procedures for which global rates are to be paid. The remainder
of the global rate is comprised of physician service costs. Additional per diem payments were
calculated for cases that exceed a specific length of stay outlier threshold.
IV. IDENTIFICATION ANDASSESSMENT OF RISK
The Hospitals will continue to submit bills to JHHC for all contracted and covered
services. JHHC is responsible for billing the payer, collecting payments, disbursing payments to
the Hospitals at their full HSCRC approved rates, and reimbursing the physicians. The System
contends that the arrangement among JHHC, the Hospitals, and the physicians holds the
Hospitals harmless from any shortfalls in payment from the global price contract. JHHC
maintains it has been active in similar types of fixed fee contracts for several years, and that
JHHC is adequately capitalized to bear risk of potential losses.
V. STAFF EVALUATION
The staff reviewed the experience under this arrangement for the last year and found it to
be slightly unfavorable. However, after review of the revised arrangement, staff believes that the
Hospitals will be able to achieve a favorable outcome moving forward.
VI. STAFF RECOMMENDATION
The staff recommends that the Commission approve the Hospitals' application for an
alternative method of rate determination for solid organ and bone marrow transplant services for
a one year period commencing February 1, 2015. The Hospitals will need to file a renewal
application for review to be considered for continued participation.
Consistent with its policy paper regarding applications for alternative methods of rate
determination, the staff recommends that this approval be contingent upon the execution of the
standard Memorandum of Understanding ("MOU") with the Hospitals for the approved contract.
This document would formalize the understanding between the Commission and the Hospitals,
and would include provisions for such things as payments of HSCRC-approved rates, treatment
of losses that may be attributed to the contract, quarterly and annual reporting, confidentiality of
data submitted, penalties for noncompliance, project termination and/or alteration, on-going
monitoring, and other issues specific to the proposed contract. The MOU will also stipulate that
operating losses under the contract cannot be used to justify future requests for rate increases.
Final Recommendation for Modifying the Maryland Hospital Acquired Conditions Program for FY 2017 Health Services Cost Review Commission
4160 Patterson Avenue Baltimore, MD 21215 (410) 764‐2605
January 14, 2015
This final staff recommendations was approved by the Commission at the public meeting on January 14, 2015.

Final Staff Recommendation for Modifying the Maryland Hospital Acquired Conditions Program
1
A. Introduction
The HSCRC quality-based payment methodologies are important policy tools for providing strong incentives for hospitals to improve their quality performance over time.
The MHAC program was implemented in state FY 2011. In order to enhance our ability to incentivize hospital care improvements and meet the MHAC reduction targets in the CMMI All-payer model demonstration contract that began on January 1, 2014, Commission staff developed recommendations with significant changes to the MHAC existing policy within the context of the Performance Measurement and Payment Models Workgroup activity. The Commission approved the updated recommendations at the April 2014 meeting that modified the measurement, scoring and payment scaling methodologies to translate scores into rate adjustments for the MHAC initiative. These updates were effective for performance in calendar year 2014 (beginning January 1, 2014) and are to be applied to FY 2016 rates for each hospital. Among these changes were measuring hospital performance using observed to expected ratio values for each PPC rather than the additional incremental cost of the PPCs measured at each hospital, and shifting from relative scaling to pre-established PPC performance targets for payment adjustments. The revised approach also established a statewide MHAC improvement target with tiered amounts of revenue at risk based on whether or not the target is met, and the allocation of rewards for FY 2016 consistent with the amount of revenue in penalties collected.
This recommendation proposes to continue with the current MHAC initiative methodology for FY 2017 with updates to the policy that allow for rewards not limited to the penalties collected, and to the statewide improvement target for applying tiered scaling amounts.
B. Background
1. Centers for Medicare & Medicaid Services (CMS) Hospital Acquired Conditions (HAC) Program
The federal HAC program began in FFY 2012 when CMS disallowed an increase in DRG payment for cases with added complications in 14 narrowly defined categories. Beginning in FFY 2015, CMS established a second HAC program, which reduces payments of hospitals with scores in the top quartile for the performance period on their rate of Hospital Acquired Conditions as compared to the national average. In FY 2015, the maximum reduction is one percent of total DRG payments.
The CMS HAC measures for FY 2016 are listed in Appendix I.
2. MHAC Measures, Scaling and Magnitude at Risk to Date
The MHAC program currently uses 65 Potentially Preventable Complications (PPCs) developed by 3M Health Information Systems. In the process of developing the MHAC updated recommendations for FY 2016, staff vetted several guiding principles for the revised MHAC program that overlap significantly with those identified by the MHA. They include:

Final Staff Recommendation for Modifying the Maryland Hospital Acquired Conditions Program
2
• Program must improve care for all patients, regardless of payer. • Breadth and impact of the program must meet or exceed the Medicare national program in
terms of measures and revenue at risk. • Program should identify predetermined performance targets and financial impact. • First year target for the program must be established in context of the trends of complication
reductions seen in the previous years as well as the need to achieve the new All-payer model goal of a 30% cumulative reduction by 2018.
• Program should prioritize high volume, high cost, opportunity for improvement and areas of national focus.
• Program design should encourage cooperation and sharing of best practices. • Program scoring method should hold hospitals harmless for lack of improvement if
attainment is highly favorable. • Hospitals should have ability to track progress during the performance period.
To achieve a policy that supports the guiding principles, staff’s approved recommendations effective for CY 2014 performance and applied to rate year FY 2016 (see detailed description in Appendix II) included: • Using Observed (O)/Expected (E) value for each PPC to measure each hospitals’
performance • Establishing appropriate exclusion rules to enhance measurement fairness and stability. • Prioritizing PPCs that are high cost, high volume, have opportunity to improve, and are of
national concern in the final hospital score through grouping the PPCs and weighting the scores of PPCs in each group commensurate with the level of priority.
• Calculating rewards/penalties using preset positions on the scale based on the base year scores.
• Based on performance trends and CMMI contract goals, establishing annual statewide targets with tiered scaling, with a statewide target set at 8% improvement with 1% of permanent revenue at risk if the target is met, and 4% at risk and no rewards paid if the target is missed; penalties were limited to 0.5% of permanent inpatient revenue statewide. C. Assessment
HSCRC continues to solicit input from stakeholder groups comprising the industry and payers to determine appropriate direction regarding areas of needed updates to the programs. These include the measures used, and the program’s methodology components. The Performance Measurement Workgroup has deliberated pertinent issues and potential changes to Commission policy for FY 2017 that may be necessary to enhance our ability to continue to improve quality of care and reduce costs caused by hospital acquired complications, as well as to achieve the reduction target set forth in the contract with CMMI— a 30% reduction in MHACs over five years. In its October to December meetings, the Workgroup discussed issues related to:
• PPC measurement trends, • Present on admission (POA) auditing, • The stability of the PPC measures themselves over time,
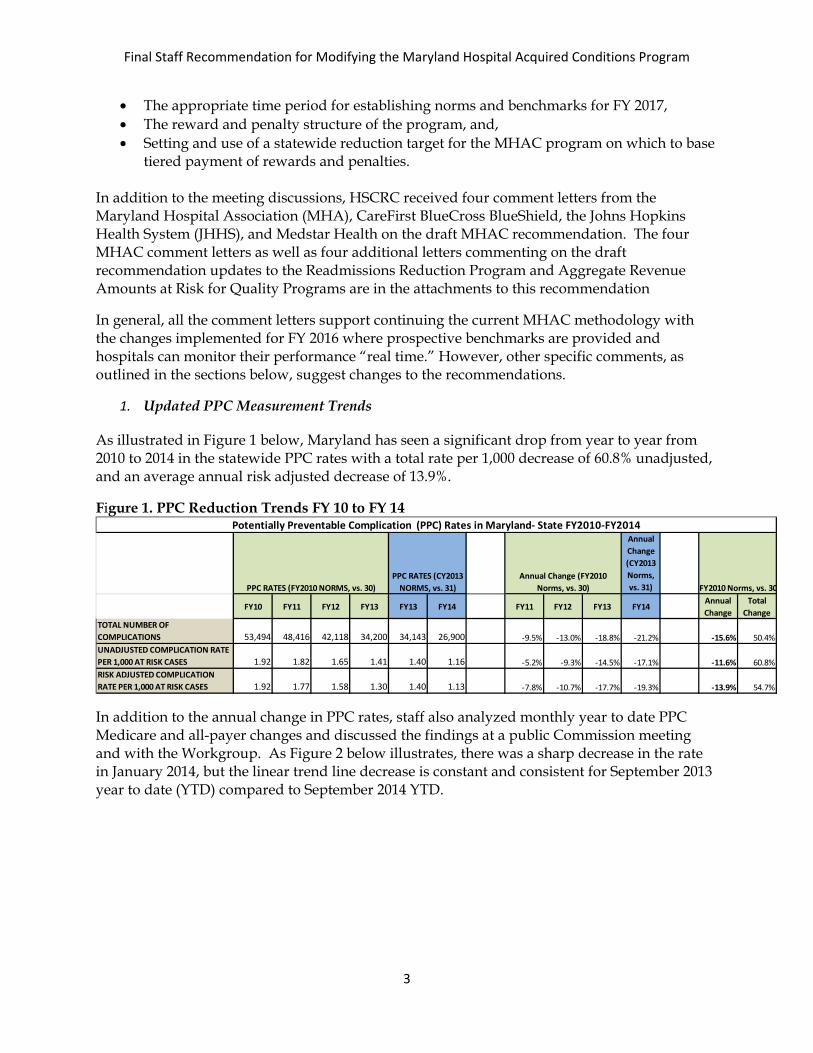
Final Staff Recommendation for Modifying the Maryland Hospital Acquired Conditions Program
3
• The appropriate time period for establishing norms and benchmarks for FY 2017, • The reward and penalty structure of the program, and, • Setting and use of a statewide reduction target for the MHAC program on which to base
tiered payment of rewards and penalties.
In addition to the meeting discussions, HSCRC received four comment letters from the Maryland Hospital Association (MHA), CareFirst BlueCross BlueShield, the Johns Hopkins Health System (JHHS), and Medstar Health on the draft MHAC recommendation. The four MHAC comment letters as well as four additional letters commenting on the draft recommendation updates to the Readmissions Reduction Program and Aggregate Revenue Amounts at Risk for Quality Programs are in the attachments to this recommendation
In general, all the comment letters support continuing the current MHAC methodology with the changes implemented for FY 2016 where prospective benchmarks are provided and hospitals can monitor their performance “real time.” However, other specific comments, as outlined in the sections below, suggest changes to the recommendations.
1. Updated PPC Measurement Trends
As illustrated in Figure 1 below, Maryland has seen a significant drop from year to year from 2010 to 2014 in the statewide PPC rates with a total rate per 1,000 decrease of 60.8% unadjusted, and an average annual risk adjusted decrease of 13.9%.
Figure 1. PPC Reduction Trends FY 10 to FY 14
In addition to the annual change in PPC rates, staff also analyzed monthly year to date PPC Medicare and all-payer changes and discussed the findings at a public Commission meeting and with the Workgroup. As Figure 2 below illustrates, there was a sharp decrease in the rate in January 2014, but the linear trend line decrease is constant and consistent for September 2013 year to date (YTD) compared to September 2014 YTD.
Annual Change (CY2013 Norms, vs. 31)
FY10 FY11 FY12 FY13 FY13 FY14 FY11 FY12 FY13 FY14Annual Change
Total Change
TOTAL NUMBER OF COMPLICATIONS 53,494 48,416 42,118 34,200 34,143 26,900 -9.5% -13.0% -18.8% -21.2% -15.6% 50.4%UNADJUSTED COMPLICATION RATE PER 1,000 AT RISK CASES 1.92 1.82 1.65 1.41 1.40 1.16 -5.2% -9.3% -14.5% -17.1% -11.6% 60.8%RISK ADJUSTED COMPLICATION RATE PER 1,000 AT RISK CASES 1.92 1.77 1.58 1.30 1.40 1.13 -7.8% -10.7% -17.7% -19.3% -13.9% 54.7%
Potentially Preventable Complication (PPC) Rates in Maryland- State FY2010-FY2014
PPC RATES (FY2010 NORMS, vs. 30)Annual Change (FY2010
Norms, vs. 30)PPC RATES (CY2013
NORMS, vs. 31) FY2010 Norms, vs. 30
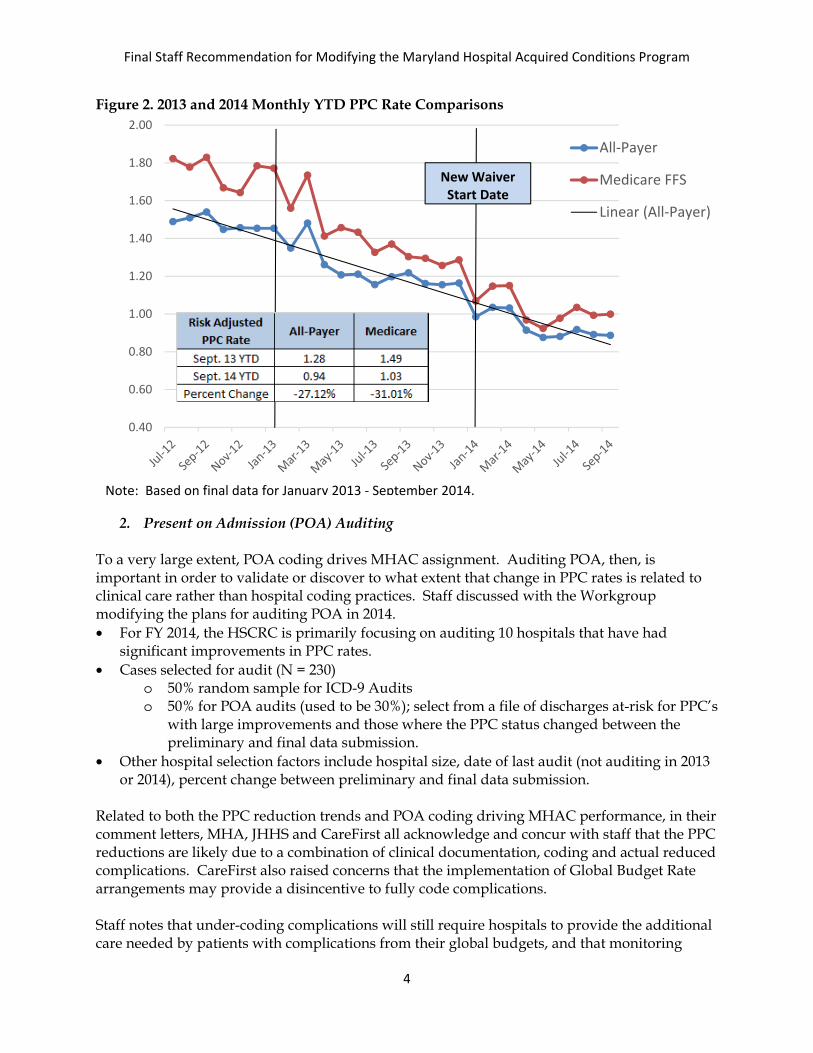
Final Staff Recommendation for Modifying the Maryland Hospital Acquired Conditions Program
4
Figure 2. 2013 and 2014 Monthly YTD PPC Rate Comparisons
2. Present on Admission (POA) Auditing To a very large extent, POA coding drives MHAC assignment. Auditing POA, then, is important in order to validate or discover to what extent that change in PPC rates is related to clinical care rather than hospital coding practices. Staff discussed with the Workgroup modifying the plans for auditing POA in 2014. • For FY 2014, the HSCRC is primarily focusing on auditing 10 hospitals that have had
significant improvements in PPC rates. • Cases selected for audit (N = 230)
o 50% random sample for ICD-9 Audits o 50% for POA audits (used to be 30%); select from a file of discharges at-risk for PPC’s
with large improvements and those where the PPC status changed between the preliminary and final data submission.
• Other hospital selection factors include hospital size, date of last audit (not auditing in 2013 or 2014), percent change between preliminary and final data submission.
Related to both the PPC reduction trends and POA coding driving MHAC performance, in their comment letters, MHA, JHHS and CareFirst all acknowledge and concur with staff that the PPC reductions are likely due to a combination of clinical documentation, coding and actual reduced complications. CareFirst also raised concerns that the implementation of Global Budget Rate arrangements may provide a disincentive to fully code complications. Staff notes that under-coding complications will still require hospitals to provide the additional care needed by patients with complications from their global budgets, and that monitoring
0.40
0.60
0.80
1.00
1.20
1.40
1.60
1.80
2.00
All-Payer
Medicare FFS
Linear (All-Payer)
Note: Based on final data for January 2013 - September 2014.
New Waiver Start Date
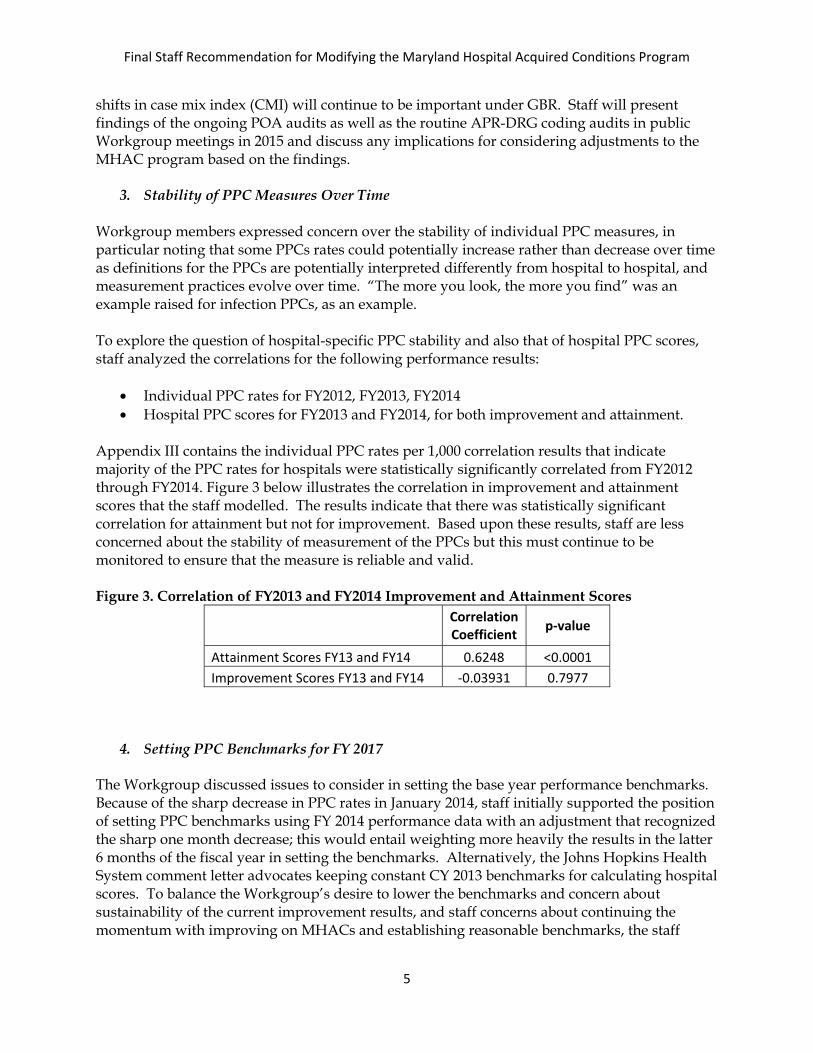
Final Staff Recommendation for Modifying the Maryland Hospital Acquired Conditions Program
5
shifts in case mix index (CMI) will continue to be important under GBR. Staff will present findings of the ongoing POA audits as well as the routine APR-DRG coding audits in public Workgroup meetings in 2015 and discuss any implications for considering adjustments to the MHAC program based on the findings.
3. Stability of PPC Measures Over Time Workgroup members expressed concern over the stability of individual PPC measures, in particular noting that some PPCs rates could potentially increase rather than decrease over time as definitions for the PPCs are potentially interpreted differently from hospital to hospital, and measurement practices evolve over time. “The more you look, the more you find” was an example raised for infection PPCs, as an example. To explore the question of hospital-specific PPC stability and also that of hospital PPC scores, staff analyzed the correlations for the following performance results:
• Individual PPC rates for FY2012, FY2013, FY2014 • Hospital PPC scores for FY2013 and FY2014, for both improvement and attainment.
Appendix III contains the individual PPC rates per 1,000 correlation results that indicate majority of the PPC rates for hospitals were statistically significantly correlated from FY2012 through FY2014. Figure 3 below illustrates the correlation in improvement and attainment scores that the staff modelled. The results indicate that there was statistically significant correlation for attainment but not for improvement. Based upon these results, staff are less concerned about the stability of measurement of the PPCs but this must continue to be monitored to ensure that the measure is reliable and valid. Figure 3. Correlation of FY2013 and FY2014 Improvement and Attainment Scores
Correlation Coefficient p-value
Attainment Scores FY13 and FY14 0.6248 <0.0001 Improvement Scores FY13 and FY14 -0.03931 0.7977
4. Setting PPC Benchmarks for FY 2017 The Workgroup discussed issues to consider in setting the base year performance benchmarks. Because of the sharp decrease in PPC rates in January 2014, staff initially supported the position of setting PPC benchmarks using FY 2014 performance data with an adjustment that recognized the sharp one month decrease; this would entail weighting more heavily the results in the latter 6 months of the fiscal year in setting the benchmarks. Alternatively, the Johns Hopkins Health System comment letter advocates keeping constant CY 2013 benchmarks for calculating hospital scores. To balance the Workgroup’s desire to lower the benchmarks and concern about sustainability of the current improvement results, and staff concerns about continuing the momentum with improving on MHACs and establishing reasonable benchmarks, the staff
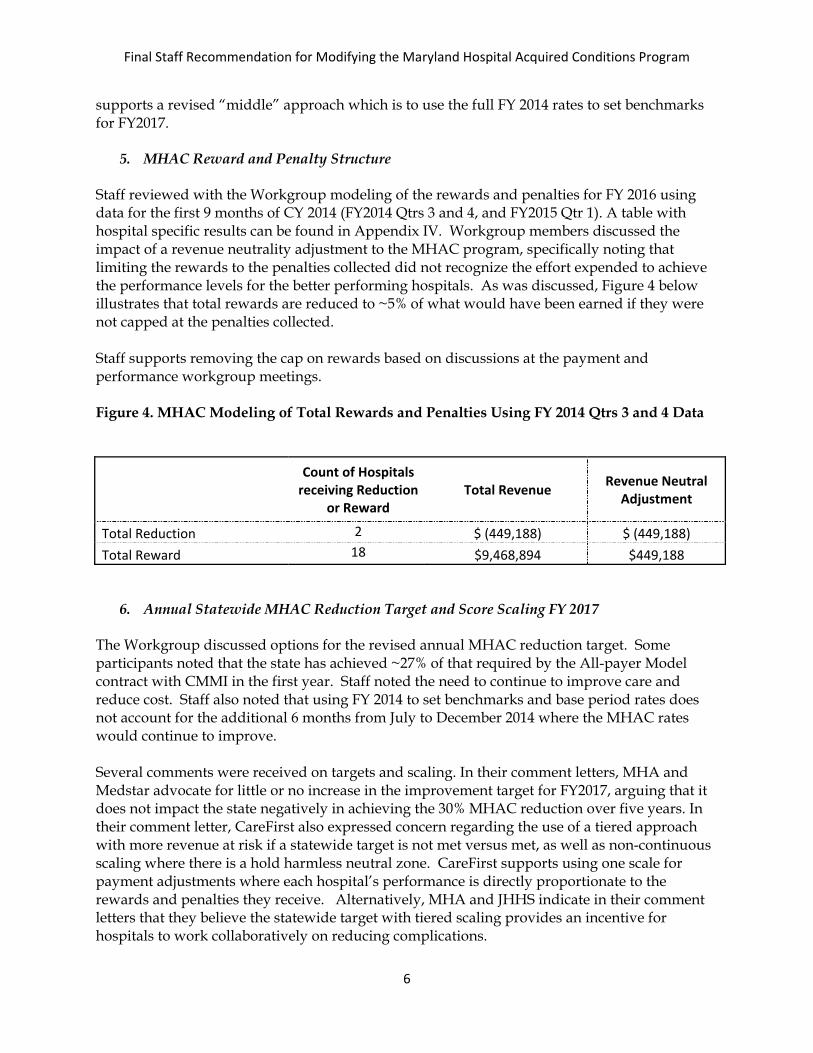
Final Staff Recommendation for Modifying the Maryland Hospital Acquired Conditions Program
6
supports a revised “middle” approach which is to use the full FY 2014 rates to set benchmarks for FY2017.
5. MHAC Reward and Penalty Structure
Staff reviewed with the Workgroup modeling of the rewards and penalties for FY 2016 using data for the first 9 months of CY 2014 (FY2014 Qtrs 3 and 4, and FY2015 Qtr 1). A table with hospital specific results can be found in Appendix IV. Workgroup members discussed the impact of a revenue neutrality adjustment to the MHAC program, specifically noting that limiting the rewards to the penalties collected did not recognize the effort expended to achieve the performance levels for the better performing hospitals. As was discussed, Figure 4 below illustrates that total rewards are reduced to ~5% of what would have been earned if they were not capped at the penalties collected. Staff supports removing the cap on rewards based on discussions at the payment and performance workgroup meetings. Figure 4. MHAC Modeling of Total Rewards and Penalties Using FY 2014 Qtrs 3 and 4 Data
Count of Hospitals receiving Reduction
or Reward Total Revenue Revenue Neutral
Adjustment
Total Reduction 2 $ (449,188) $ (449,188) Total Reward 18 $9,468,894 $449,188
6. Annual Statewide MHAC Reduction Target and Score Scaling FY 2017 The Workgroup discussed options for the revised annual MHAC reduction target. Some participants noted that the state has achieved ~27% of that required by the All-payer Model contract with CMMI in the first year. Staff noted the need to continue to improve care and reduce cost. Staff also noted that using FY 2014 to set benchmarks and base period rates does not account for the additional 6 months from July to December 2014 where the MHAC rates would continue to improve. Several comments were received on targets and scaling. In their comment letters, MHA and Medstar advocate for little or no increase in the improvement target for FY2017, arguing that it does not impact the state negatively in achieving the 30% MHAC reduction over five years. In their comment letter, CareFirst also expressed concern regarding the use of a tiered approach with more revenue at risk if a statewide target is not met versus met, as well as non-continuous scaling where there is a hold harmless neutral zone. CareFirst supports using one scale for payment adjustments where each hospital’s performance is directly proportionate to the rewards and penalties they receive. Alternatively, MHA and JHHS indicate in their comment letters that they believe the statewide target with tiered scaling provides an incentive for hospitals to work collaboratively on reducing complications.
Final Staff Recommendation for Modifying the Maryland Hospital Acquired Conditions Program
7
Staff continues to advocate for a target of 7% improvement from FY2015 to CY2015, which is equal to 5% annual improvement rate and on par with the improvement trends the state has been observing and reduced from last year’s annual improvement target of 8%. Staff also advocates for no change in the scaling approach by keeping constant the tiered score scaling with no rewards if the statewide target is not met (Appendix V). Using a tiered approach provides strong incentives for collaboration between hospitals to share best practices and continue to improve to ensure the statewide target is achieved. While MHAC scaling is based on rewards and penalties for hospitals at the tail end of the scores and holds hospitals with scores in the middle harmless, revenue reduction programs (Potentially Avoidable Utilization, and Readmission Shared Savings) are based on a continuous scale where all hospitals receive reductions in proportion to their performance.
D. Recommendations
Based on the work completed to date on updating the MHAC program for FY 2017, staff makes the following recommendations:
1. The statewide reduction target should be set at 7 % comparing FY2014 to CY2015 risk adjusted PPC rates.
2. The program should continue to use a tiered approach where a lower level of revenue at risk is set if the statewide target is met versus not met as modelled in FY2016 policy.
3. Rewards should be distributed only if the statewide target is met, and should not be limited to the penalties collected.
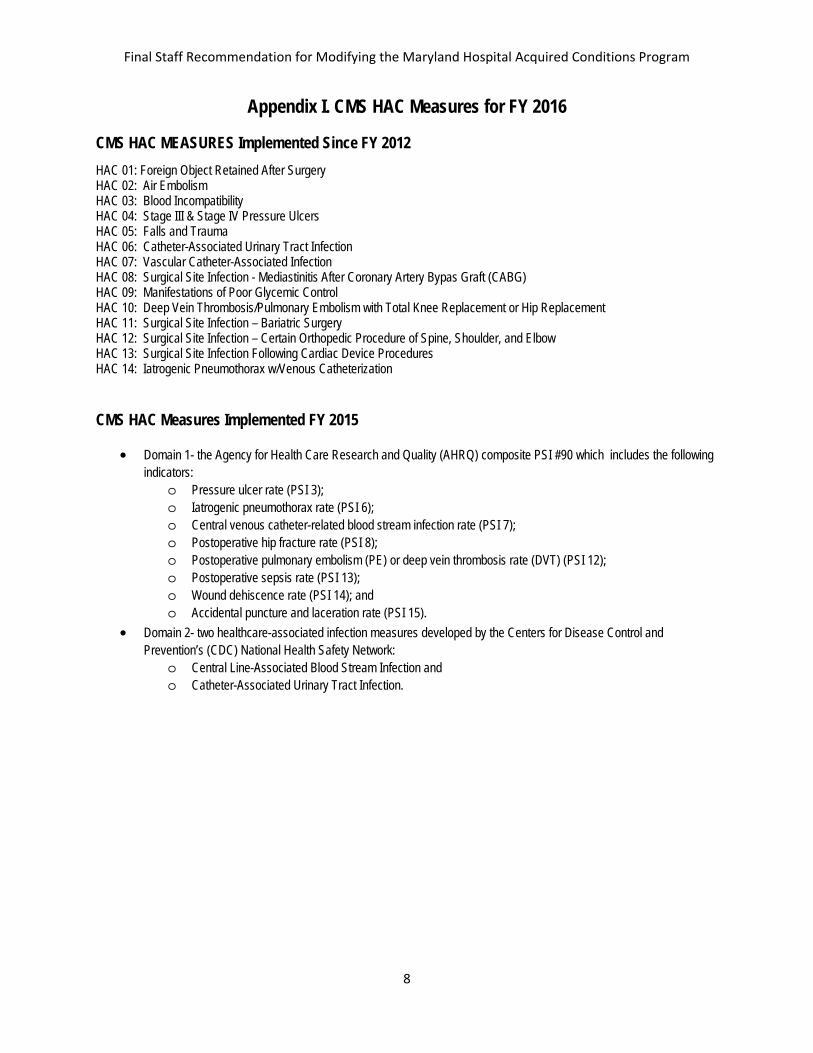
Final Staff Recommendation for Modifying the Maryland Hospital Acquired Conditions Program
8
Appendix I. CMS HAC Measures for FY 2016
CMS HAC MEASURES Implemented Since FY 2012 HAC 01: Foreign Object Retained After Surgery HAC 02: Air Embolism HAC 03: Blood Incompatibility HAC 04: Stage III & Stage IV Pressure Ulcers HAC 05: Falls and Trauma HAC 06: Catheter-Associated Urinary Tract Infection HAC 07: Vascular Catheter-Associated Infection HAC 08: Surgical Site Infection - Mediastinitis After Coronary Artery Bypas Graft (CABG) HAC 09: Manifestations of Poor Glycemic Control HAC 10: Deep Vein Thrombosis/Pulmonary Embolism with Total Knee Replacement or Hip Replacement HAC 11: Surgical Site Infection – Bariatric Surgery HAC 12: Surgical Site Infection – Certain Orthopedic Procedure of Spine, Shoulder, and Elbow HAC 13: Surgical Site Infection Following Cardiac Device Procedures HAC 14: Iatrogenic Pneumothorax w/Venous Catheterization
CMS HAC Measures Implemented FY 2015
• Domain 1- the Agency for Health Care Research and Quality (AHRQ) composite PSI #90 which includes the following indicators:
o Pressure ulcer rate (PSI 3); o Iatrogenic pneumothorax rate (PSI 6); o Central venous catheter-related blood stream infection rate (PSI 7); o Postoperative hip fracture rate (PSI 8); o Postoperative pulmonary embolism (PE) or deep vein thrombosis rate (DVT) (PSI 12); o Postoperative sepsis rate (PSI 13); o Wound dehiscence rate (PSI 14); and o Accidental puncture and laceration rate (PSI 15).
• Domain 2- two healthcare-associated infection measures developed by the Centers for Disease Control and Prevention’s (CDC) National Health Safety Network:
o Central Line-Associated Blood Stream Infection and o Catheter-Associated Urinary Tract Infection.
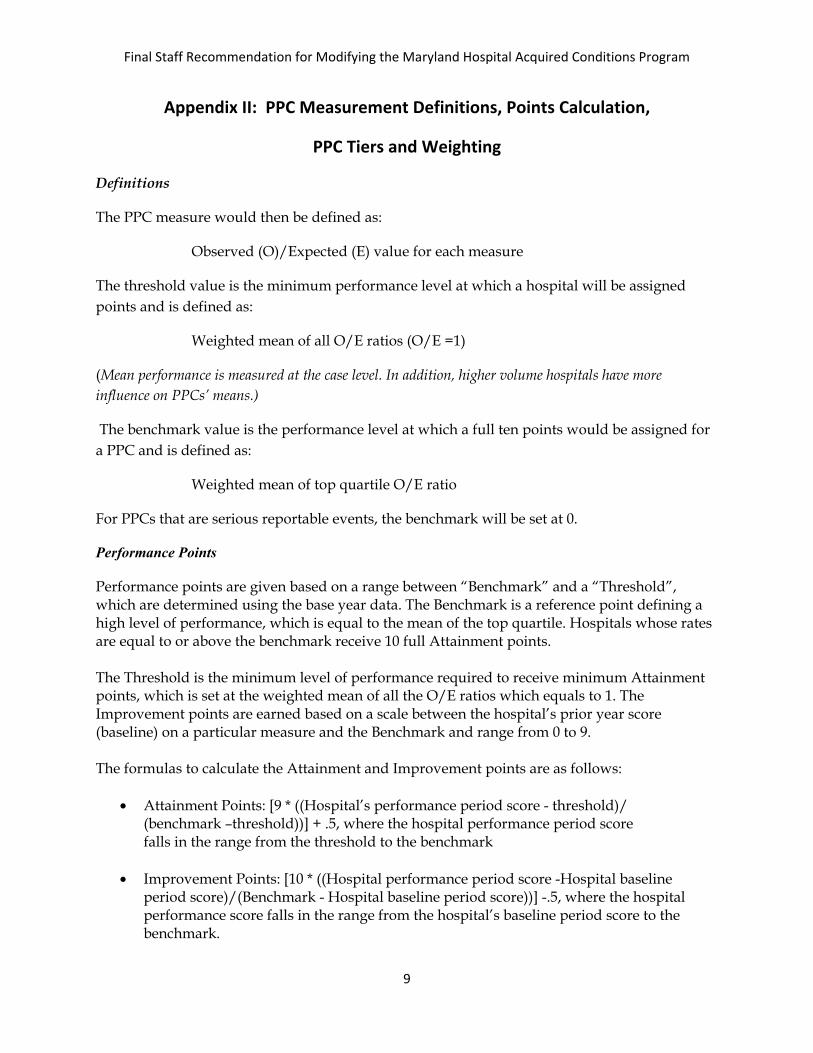
Final Staff Recommendation for Modifying the Maryland Hospital Acquired Conditions Program
9
Appendix II: PPC Measurement Definitions, Points Calculation,
PPC Tiers and Weighting
Definitions
The PPC measure would then be defined as:
Observed (O)/Expected (E) value for each measure
The threshold value is the minimum performance level at which a hospital will be assigned points and is defined as:
Weighted mean of all O/E ratios (O/E =1)
(Mean performance is measured at the case level. In addition, higher volume hospitals have more influence on PPCs’ means.)
The benchmark value is the performance level at which a full ten points would be assigned for a PPC and is defined as:
Weighted mean of top quartile O/E ratio
For PPCs that are serious reportable events, the benchmark will be set at 0.
Performance Points Performance points are given based on a range between “Benchmark” and a “Threshold”, which are determined using the base year data. The Benchmark is a reference point defining a high level of performance, which is equal to the mean of the top quartile. Hospitals whose rates are equal to or above the benchmark receive 10 full Attainment points. The Threshold is the minimum level of performance required to receive minimum Attainment points, which is set at the weighted mean of all the O/E ratios which equals to 1. The Improvement points are earned based on a scale between the hospital’s prior year score (baseline) on a particular measure and the Benchmark and range from 0 to 9. The formulas to calculate the Attainment and Improvement points are as follows:
• Attainment Points: [9 * ((Hospital’s performance period score - threshold)/ (benchmark –threshold))] + .5, where the hospital performance period score falls in the range from the threshold to the benchmark
• Improvement Points: [10 * ((Hospital performance period score -Hospital baseline
period score)/(Benchmark - Hospital baseline period score))] -.5, where the hospital performance score falls in the range from the hospital’s baseline period score to the benchmark.
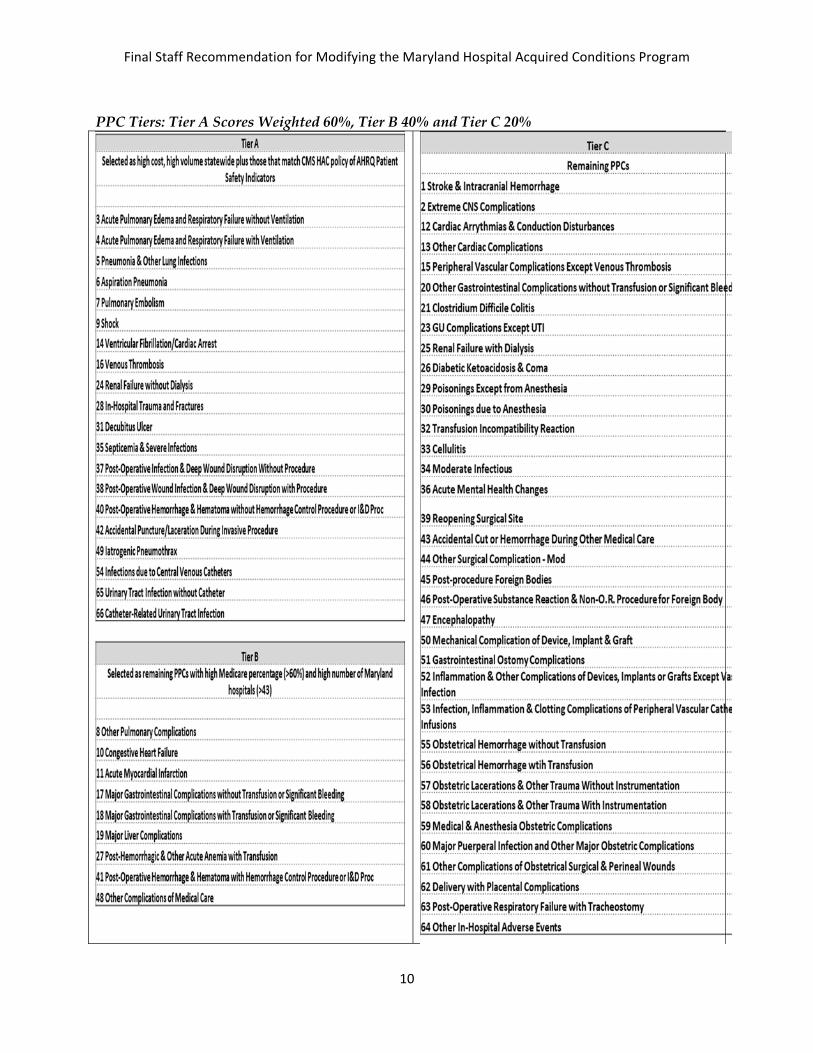
Final Staff Recommendation for Modifying the Maryland Hospital Acquired Conditions Program
10
PPC Tiers: Tier A Scores Weighted 60%, Tier B 40% and Tier C 20%
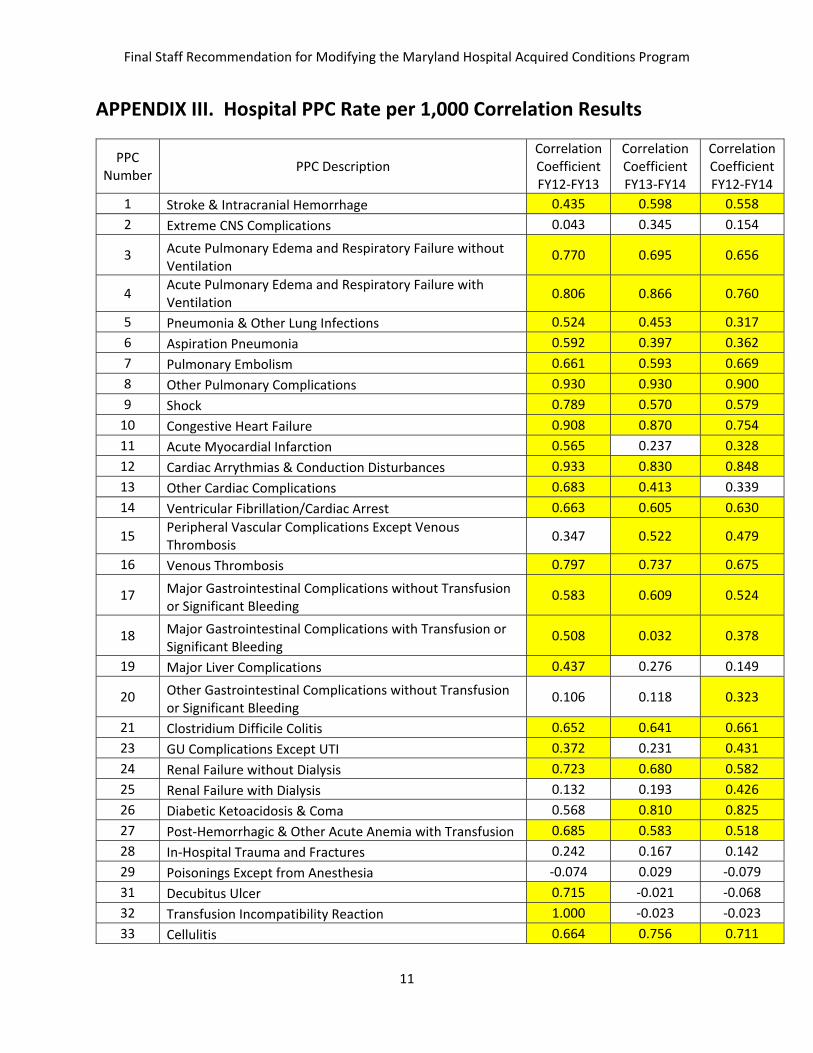
Final Staff Recommendation for Modifying the Maryland Hospital Acquired Conditions Program
11
APPENDIX III. Hospital PPC Rate per 1,000 Correlation Results
PPC Number PPC Description
Correlation Coefficient FY12-FY13
Correlation Coefficient FY13-FY14
Correlation Coefficient FY12-FY14
1 Stroke & Intracranial Hemorrhage 0.435 0.598 0.558 2 Extreme CNS Complications 0.043 0.345 0.154
3 Acute Pulmonary Edema and Respiratory Failure without Ventilation
0.770 0.695 0.656
4 Acute Pulmonary Edema and Respiratory Failure with Ventilation 0.806 0.866 0.760
5 Pneumonia & Other Lung Infections 0.524 0.453 0.317 6 Aspiration Pneumonia 0.592 0.397 0.362 7 Pulmonary Embolism 0.661 0.593 0.669 8 Other Pulmonary Complications 0.930 0.930 0.900 9 Shock 0.789 0.570 0.579
10 Congestive Heart Failure 0.908 0.870 0.754 11 Acute Myocardial Infarction 0.565 0.237 0.328 12 Cardiac Arrythmias & Conduction Disturbances 0.933 0.830 0.848 13 Other Cardiac Complications 0.683 0.413 0.339 14 Ventricular Fibrillation/Cardiac Arrest 0.663 0.605 0.630
15 Peripheral Vascular Complications Except Venous Thrombosis 0.347 0.522 0.479
16 Venous Thrombosis 0.797 0.737 0.675
17 Major Gastrointestinal Complications without Transfusion or Significant Bleeding
0.583 0.609 0.524
18 Major Gastrointestinal Complications with Transfusion or Significant Bleeding
0.508 0.032 0.378
19 Major Liver Complications 0.437 0.276 0.149
20 Other Gastrointestinal Complications without Transfusion or Significant Bleeding
0.106 0.118 0.323
21 Clostridium Difficile Colitis 0.652 0.641 0.661 23 GU Complications Except UTI 0.372 0.231 0.431 24 Renal Failure without Dialysis 0.723 0.680 0.582 25 Renal Failure with Dialysis 0.132 0.193 0.426 26 Diabetic Ketoacidosis & Coma 0.568 0.810 0.825 27 Post-Hemorrhagic & Other Acute Anemia with Transfusion 0.685 0.583 0.518 28 In-Hospital Trauma and Fractures 0.242 0.167 0.142 29 Poisonings Except from Anesthesia -0.074 0.029 -0.079 31 Decubitus Ulcer 0.715 -0.021 -0.068 32 Transfusion Incompatibility Reaction 1.000 -0.023 -0.023 33 Cellulitis 0.664 0.756 0.711
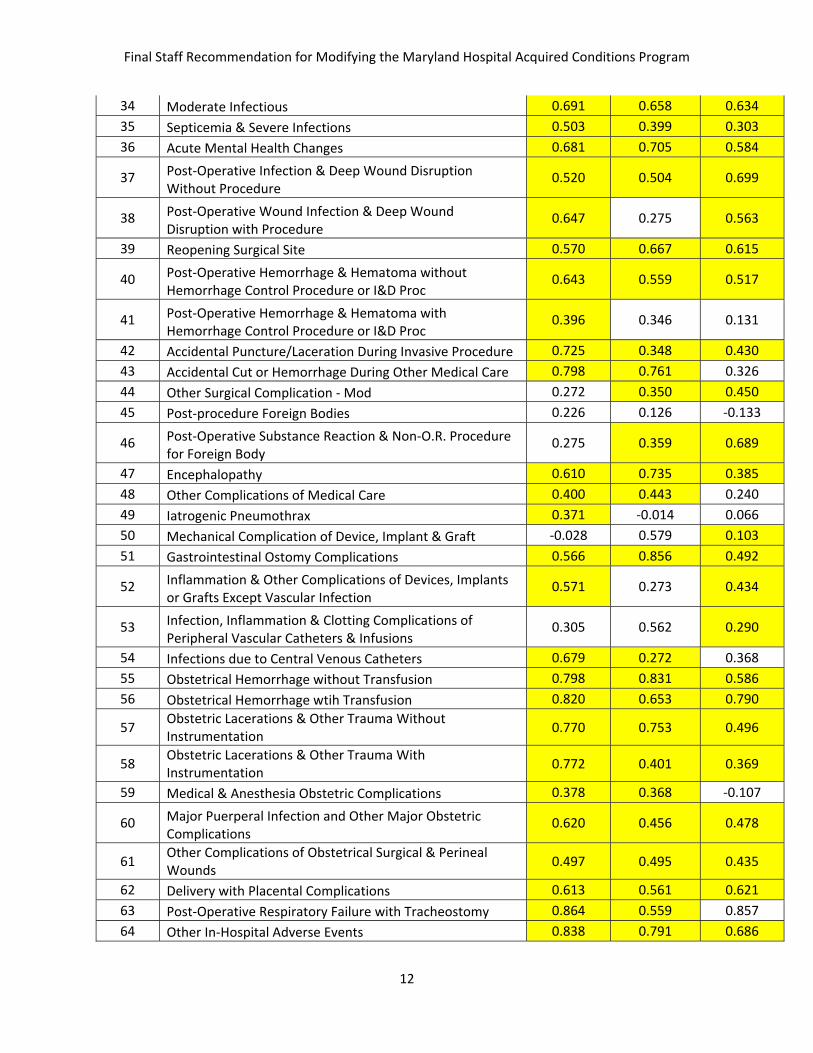
Final Staff Recommendation for Modifying the Maryland Hospital Acquired Conditions Program
12
34 Moderate Infectious 0.691 0.658 0.634 35 Septicemia & Severe Infections 0.503 0.399 0.303 36 Acute Mental Health Changes 0.681 0.705 0.584
37 Post-Operative Infection & Deep Wound Disruption Without Procedure
0.520 0.504 0.699
38 Post-Operative Wound Infection & Deep Wound Disruption with Procedure
0.647 0.275 0.563
39 Reopening Surgical Site 0.570 0.667 0.615
40 Post-Operative Hemorrhage & Hematoma without Hemorrhage Control Procedure or I&D Proc
0.643 0.559 0.517
41 Post-Operative Hemorrhage & Hematoma with Hemorrhage Control Procedure or I&D Proc
0.396 0.346 0.131
42 Accidental Puncture/Laceration During Invasive Procedure 0.725 0.348 0.430 43 Accidental Cut or Hemorrhage During Other Medical Care 0.798 0.761 0.326 44 Other Surgical Complication - Mod 0.272 0.350 0.450 45 Post-procedure Foreign Bodies 0.226 0.126 -0.133
46 Post-Operative Substance Reaction & Non-O.R. Procedure for Foreign Body
0.275 0.359 0.689
47 Encephalopathy 0.610 0.735 0.385 48 Other Complications of Medical Care 0.400 0.443 0.240 49 Iatrogenic Pneumothrax 0.371 -0.014 0.066 50 Mechanical Complication of Device, Implant & Graft -0.028 0.579 0.103 51 Gastrointestinal Ostomy Complications 0.566 0.856 0.492
52 Inflammation & Other Complications of Devices, Implants or Grafts Except Vascular Infection
0.571 0.273 0.434
53 Infection, Inflammation & Clotting Complications of Peripheral Vascular Catheters & Infusions
0.305 0.562 0.290
54 Infections due to Central Venous Catheters 0.679 0.272 0.368 55 Obstetrical Hemorrhage without Transfusion 0.798 0.831 0.586 56 Obstetrical Hemorrhage wtih Transfusion 0.820 0.653 0.790
57 Obstetric Lacerations & Other Trauma Without Instrumentation 0.770 0.753 0.496
58 Obstetric Lacerations & Other Trauma With Instrumentation 0.772 0.401 0.369
59 Medical & Anesthesia Obstetric Complications 0.378 0.368 -0.107
60 Major Puerperal Infection and Other Major Obstetric Complications
0.620 0.456 0.478
61 Other Complications of Obstetrical Surgical & Perineal Wounds 0.497 0.495 0.435
62 Delivery with Placental Complications 0.613 0.561 0.621 63 Post-Operative Respiratory Failure with Tracheostomy 0.864 0.559 0.857 64 Other In-Hospital Adverse Events 0.838 0.791 0.686

Final Staff Recommendation for Modifying the Maryland Hospital Acquired Conditions Program
13
65 Urinary Tract Infection without Catheter 0.663 0.861 0.618 66 Catheter-Related Urinary Tract Infection 0.365 0.301 0.209
Statistically Significant at p < 0.05 Results for PPC30 not presented and McGready was removed from analysis.

Final Staff Recommendation for Modifying the Maryland Hospital Acquired Conditions Program
14
APPENDIX IV.
HOSPITAL ID
HOSPITAL NAME
Estimated Inpatient Revenue
(FY15*2.6%)
Base Year Score
Final Score Jan-Sept
% Improvement
in Base Scores
% Scaling Adjustment
$ Scaling Adjustment
$ Revenue Neutral Scaling
Adjustment
% Revenue Neutral
Adjustment
210062 SOUTHERN MARYLAND $ 163,208,213 0.29 0.40 38% -0.21% (337,672)$ (337,672)$ -0.21%210016 WASHINGTON ADVENTIST $ 161,698,669 0.42 0.44 4% -0.07% (111,516)$ (111,516)$ -0.07%210051 DOCTORS COMMUNITY $ 136,225,391 0.33 0.46 39% 0.00% -$ -$ 0.00%210023 ANNE ARUNDEL $ 310,117,075 0.37 0.46 24% 0.00% -$ -$ 0.00%210022 SUBURBAN $ 181,410,188 0.17 0.46 170% 0.00% -$ -$ 0.00%210033 CARROLL COUNTY $ 138,209,278 0.40 0.48 19% 0.00% -$ -$ 0.00%210048 HOWARD COUNTY $ 167,386,497 0.22 0.48 118% 0.00% -$ -$ 0.00%210034 HARBOR $ 124,002,220 0.45 0.48 7% 0.00% -$ -$ 0.00%210044 G.B.M.C. $ 201,533,345 0.26 0.49 87% 0.00% -$ -$ 0.00%210055 LAUREL REGIONAL $ 77,501,975 0.47 0.51 9% 0.00% -$ -$ 0.00%
210043BALTIMORE WASHINGTON MEDICAL CENTER $ 223,155,126 0.29 0.52 79% 0.00% -$ -$ 0.00%
210005 FREDERICK MEMORIAL $ 189,480,763 0.40 0.52 30% 0.00% -$ -$ 0.00%210004 HOLY CROSS $ 319,596,342 0.29 0.52 81% 0.00% -$ -$ 0.00%210049 UPPER CHESAPEAKE HEALTH $ 148,917,096 0.36 0.53 48% 0.00% -$ -$ 0.00%210057 SHADY GROVE $ 228,731,775 0.51 0.54 5% 0.00% -$ -$ 0.00%
210017 GARRETT COUNTY $ 18,724,074 0.69 0.54 -22% 0.00% -$ -$ 0.00%210018 MONTGOMERY GENERAL $ 87,652,208 0.39 0.54 38% 0.00% -$ -$ 0.00%210024 UNION MEMORIAL $ 242,505,500 0.26 0.54 110% 0.00% -$ -$ 0.00%210015 FRANKLIN SQUARE $ 285,691,170 0.39 0.55 40% 0.00% -$ -$ 0.00%210010 DORCHESTER $ 25,127,935 0.45 0.55 21% 0.00% -$ -$ 0.00%210006 HARFORD $ 47,089,618 0.37 0.56 51% 0.00% -$ -$ 0.00%210002 UNIVERSITY OF MARYLAND $ 863,843,449 0.30 0.56 88% 0.00% -$ -$ 0.00%210027 SYSTEM $ 184,484,266 0.35 0.58 66% 0.00% -$ -$ 0.00%210056 GOOD SAMARITAN $ 180,861,011 0.57 0.58 3% 0.00% -$ -$ 0.00%210008 MERCY $ 233,163,594 0.34 0.59 75% 0.00% -$ -$ 0.00%210038 UMMC MIDTOWN $ 133,787,811 0.44 0.60 37% 0.00% -$ -$ 0.00%210003 PRINCE GEORGE $ 177,243,165 0.45 0.61 35% 0.00% -$ -$ 0.00%210011 ST. AGNES $ 239,121,556 0.38 0.61 62% 0.00% -$ -$ 0.00%210009 JOHNS HOPKINS $ 1,292,515,919 0.18 0.62 244% 0.05% 680,272$ 32,271$ 0.00%210019 PENINSULA REGIONAL $ 233,728,496 0.26 0.63 142% 0.11% 246,030$ 11,671$ 0.00%210032 UNION HOSPITAL OF CECIL COUNT $ 67,852,189 0.34 0.65 91% 0.21% 142,847$ 6,776$ 0.01%210012 SINAI $ 429,154,679 0.26 0.67 158% 0.32% 1,355,225$ 64,290$ 0.01%210001 MERITUS $ 187,434,497 0.26 0.67 158% 0.32% 591,898$ 28,079$ 0.01%210037 EASTON $ 94,828,132 0.43 0.67 57% 0.32% 299,457$ 14,206$ 0.01%210035 CHARLES REGIONAL $ 76,338,049 0.54 0.68 26% 0.37% 281,245$ 13,342$ 0.02%210058 REHAB & ORTHO $ 69,104,846 0.33 0.68 107% 0.37% 254,597$ 12,078$ 0.02%210063 UM ST. JOSEPH $ 216,335,128 0.29 0.69 137% 0.42% 910,885$ 43,211$ 0.02%210029 HOPKINS BAYVIEW MED CTR $ 356,396,901 0.33 0.69 110% 0.42% 1,500,619$ 71,187$ 0.02%210061 ATLANTIC GENERAL $ 38,640,762 0.56 0.69 24% 0.42% 162,698$ 7,718$ 0.02%210040 NORTHWEST $ 142,186,717 0.24 0.73 206% 0.63% 898,021$ 42,601$ 0.03%210028 ST. MARY $ 69,520,305 0.56 0.74 33% 0.68% 475,665$ 22,565$ 0.03%210013 BON SECOURS $ 78,212,787 0.58 0.75 29% 0.74% 576,305$ 27,339$ 0.03%210030 CHESTERTOWN $ 29,416,674 0.80 0.76 -6% 0.79% 232,237$ 11,017$ 0.04%210060 FT. WASHINGTON $ 17,776,133 0.45 0.77 72% 0.84% 149,694$ 7,101$ 0.04%210039 CALVERT $ 67,385,287 0.48 0.80 66% 1.00% 673,853$ 31,966$ 0.05%210045 MCCREADY $ 3,734,618 0.78 1.00 28% 1.00% 37,346$ 1,772$ 0.05%
Total Reduct (449,188)$ (449,188)$ Total Award 9,468,894$ 449,188$
0.047438328
2b. CY2014 Jan-September Final Data- MHAC Scaling Modeling

Final Staff Recommendation for Modifying the Maryland Hospital Acquired Conditions Program
15
Appendix V. MHAC Score Tiered Scaling of Final MHAC Scores
Final MHAC Score Below State Quality Target
Exceed State Quality Target
Scores less than or equal to 0.17 -4.00% -1.00% 0.18 -3.88% -0.97% 0.19 -3.76% -0.93% 0.20 -3.65% -0.90% 0.21 -3.53% -0.86% 0.22 -3.41% -0.83% 0.23 -3.29% -0.79% 0.24 -3.18% -0.76% 0.25 -3.06% -0.72% 0.26 -2.94% -0.69% 0.27 -2.82% -0.66% 0.28 -2.71% -0.62% 0.29 -2.59% -0.59% 0.30 -2.47% -0.55% 0.31 -2.35% -0.52% 0.32 -2.24% -0.48% 0.33 -2.12% -0.45% 0.34 -2.00% -0.41% 0.35 -1.88% -0.38% 0.36 -1.76% -0.34% 0.37 -1.65% -0.31% 0.38 -1.53% -0.28% 0.39 -1.41% -0.24% 0.40 -1.29% -0.21% 0.41 -1.18% -0.17% 0.42 -1.06% -0.14% 0.43 -0.94% -0.10% 0.44 -0.82% -0.07% 0.45 -0.71% -0.03% 0.46 -0.59% 0.00% 0.47 -0.47% 0.00% 0.48 -0.35% 0.00% 0.49 -0.24% 0.00% 0.50 -0.12% 0.00% 0.51 0.00% 0.00% 0.52 0.00% 0.00% 0.53 0.00% 0.00% 0.54 0.00% 0.00%

Final Staff Recommendation for Modifying the Maryland Hospital Acquired Conditions Program
16
0.55 0.00% 0.00% 0.56 0.00% 0.00% 0.57 0.00% 0.00% 0.58 0.00% 0.00% 0.59 0.00% 0.00% 0.60 0.00% 0.00% 0.61 0.00% 0.00% 0.62 0.00% 0.05% 0.63 0.00% 0.11% 0.64 0.00% 0.16% 0.65 0.00% 0.21% 0.66 0.00% 0.26% 0.67 0.00% 0.32% 0.68 0.00% 0.37% 0.69 0.00% 0.42% 0.70 0.00% 0.47% 0.71 0.00% 0.53% 0.72 0.00% 0.58% 0.73 0.00% 0.63% 0.74 0.00% 0.68% 0.75 0.00% 0.74% 0.76 0.00% 0.79% 0.77 0.00% 0.84% 0.78 0.00% 0.89% 0.79 0.00% 0.95% Scores greater than or equal to 0.80 0.00% 1.00%
Penalty threshold: 0.51 0.46 Reward Threshold No rewards 0.61
*Minimum and maximum scaling scores based on CY 2013 Final Data Attainment Scores. Not changed for RY17 MHAC Program.

See MHAC Final Policy Figures Excel File posted or sent separately.

January 5, 2015 Dianne Feeney Associate Director, Quality Initiatives Health Services Cost Review Commission 4160 Patterson Avenue Baltimore, Maryland Dear Ms. Feeney: On behalf of the 64 hospital and health system members of the Maryland Hospital Association (MHA), we appreciate the opportunity to comment on the proposed changes to the Draft Recommendation for Modifying the Maryland Hospital Acquired Conditions Program for FY 2017. We are pleased with the progress the hospital field has made over calendar year 2014 and want to continue working to make the improvements that have been gained in 2014 more deeply embedded in routine practice. The reductions in complications over the past year demonstrate that the policy is well structured to support hospitals’ efforts to reduce patient harm, and as such we support your recommendation that the structure of the program remain essentially unchanged. Setting the scoring targets and associated payment impacts at the start of the year allows hospitals to track progress throughout the year and clearly understand the payment impacts. Considering the substantial improvement hospitals have made in complications over the first three quarters of this calendar year, we believe that the improvement target should be lower, and the revenue at risk should shift toward readmissions, where it’s not clear we are achieving our goal. At most hospitals, quality and care management leaders are responsible for both Maryland Hospital Acquired Conditions (MHACs) and readmissions, so holding steady on the complication reductions achieved this year without pushing for more would allow hospitals to direct more of their shared resources to readmissions reduction. Over the coming months we will convene physicians, nurses, coders, and documentation specialists to share care practices that have been successful in reducing complications, and to review the internal hospital guidelines physicians use to identify conditions or diagnoses that could result in assignment of a complication to a case. For example, when determining whether a patient is experiencing kidney injury, some hospitals may use the Acute Kidney Injury Network’s modified RIFLE (risk, injury, failure, loss, and end-stage kidney disease) staging system, while others may base the diagnosis on blood levels of important markers of kidney function such as creatinine or cystatin C. This work differs from the “present on admission” coding reviews in that it is a more fundamental look at the criteria hospitals use to determine when a complication is diagnosed. Our goal with these clinical groups is twofold: to attempt to come to agreement on the criteria that are used to identify conditions, and to spread the implementation of practices that have reduced patient harm. To the extent that hospitals adopt or implement the successful practices, we will see further reductions in complications. The work to agree upon standard definitions for conditions that trigger assignment of a complication could lower or increase complication rates. Both the adoption of uniform guidelines
Dianne Feeney January 5, 2015 Page 2
and the spread of successful practices are important steps toward our longer term goal of reducing complications, particularly those that cause the most harm to patients. Several potentially preventable complications (PPC) have very low expected values either because the number of cases at risk is small, or the nature of the occurrence is rare. If the expected value is very low the occurrence of a single complication disproportionately affects the hospital’s score. At a recent Performance Measurement Work Group meeting, the possibility of grouping those PPCs into a single combined measurement was mentioned. We believe that idea has merit and would support pursuing such an approach. Thank you for the opportunity to participate in this process and to comment on this recommendation. If you have any questions, please contact me. Sincerely, Traci La Valle Vice President


January 5, 2015 Dianne Feeney Associate Director, Quality Initiatives Health Services Cost Review Commission 4160 Patterson Avenue Baltimore, Maryland Dear Ms. Feeney: On behalf of the 64 hospital and health system members of the Maryland Hospital Association (MHA), we appreciate the opportunity to comment on the proposed changes to the Draft Recommendation for Updating the Hospital Readmission Reduction Incentive Program for FY 2017. Crafting a payment policy recommendation is difficult at a time when significant questions remain about the difference between Maryland’s readmissions rate and the national rate in both the calendar year 2013 base period and in the calendar year 2014 performance period. We support the Health Services Cost Review Commission (HSCRC) staff’s intention to postpone setting the readmissions target until calendar year 2013 base year data is validated, likely by March, and we appreciate the recent decision to postpone until February a final readmission payment policy recommendation to allow time for additional analysis. However, we believe that a decision on a final readmission payment policy should be postponed beyond February to allow time to complete the necessary analyses. Our primary concern is that a revised readmissions payment policy must not slow the good work underway at Maryland’s hospitals to address the root causes of hospital readmissions. In this comment letter, we will outline what we know about readmission rates, and Maryland’s rates in particular; what we don’t yet know about the drivers of readmissions and the opportunities to improve; and, we will propose a way to develop a payment policy with incentives that reward hospitals for providing the best care for patients and supports hospitals’ focus on areas where there is the most opportunity and need to improve. Our recommendation is that we postpone final approval of a fiscal year 2017 readmissions payment policy until we’ve been able to answer these important questions. What We Know about Readmission Rates
Maryland’s historic readmissions rate is higher than the nation. From June 2009 through June 2012, the most recent period available on Medicare readmission rates at the Medicare website Hospital Compare, readmission rates for heart failure, pneumonia, and heart attack across Maryland’s hospitals in the aggregate were among the highest in the nation. In that same period, Maryland’s mortality rates for the same conditions were the second lowest in the nation. This finding is consistent with what has been reported in the literature.1
1 Divergent trends in survival and readmission following a hospitalization for heart failure in the Veterans Affairs health care system 2002 to 2006. Journal of the American College of Cardiology (7/2010); In a study of hospitals within the Veteran Affairs health care system, reported that at the patient level, mortality after an admission for HF declined from 2002 to 2006 while readmission increased. Are All Readmissions Bad Readmissions? New England Journal of Medicine (7/2010); A higher occurrence of readmissions after index admissions for heart failure was associated with lower risk-adjusted 30-day mortality. Our
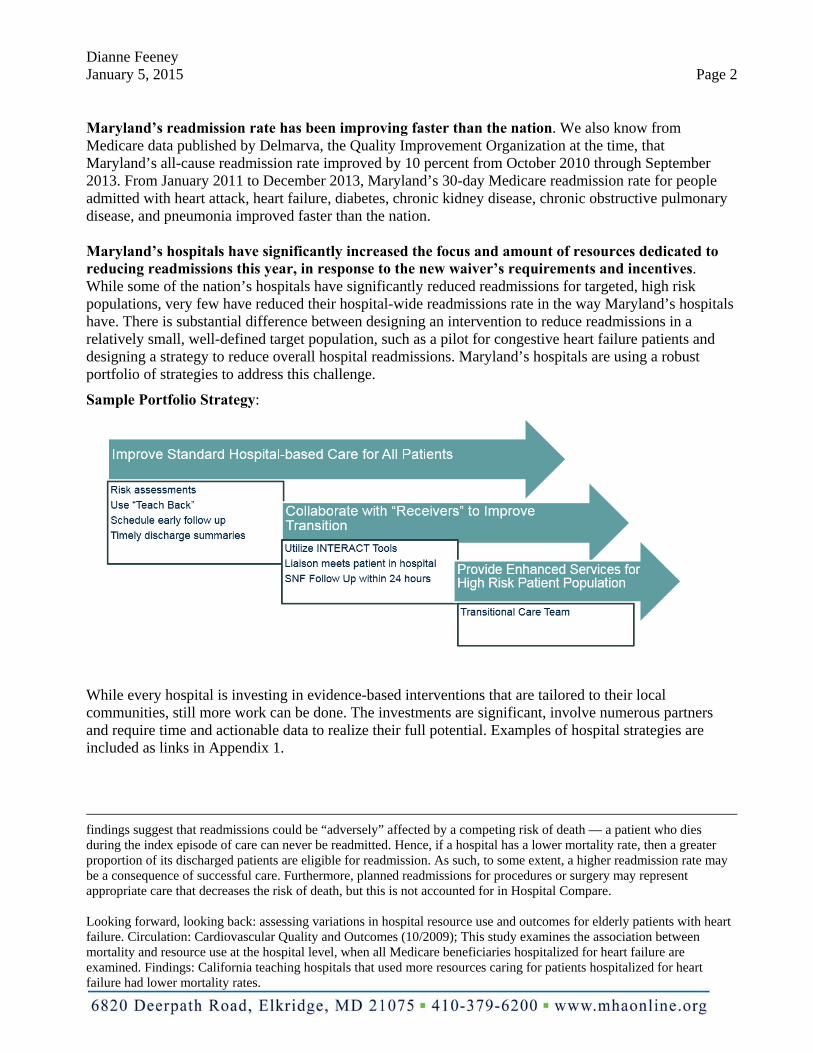
Dianne Feeney January 5, 2015 Page 2
Maryland’s readmission rate has been improving faster than the nation. We also know from Medicare data published by Delmarva, the Quality Improvement Organization at the time, that Maryland’s all-cause readmission rate improved by 10 percent from October 2010 through September 2013. From January 2011 to December 2013, Maryland’s 30-day Medicare readmission rate for people admitted with heart attack, heart failure, diabetes, chronic kidney disease, chronic obstructive pulmonary disease, and pneumonia improved faster than the nation. Maryland’s hospitals have significantly increased the focus and amount of resources dedicated to reducing readmissions this year, in response to the new waiver’s requirements and incentives. While some of the nation’s hospitals have significantly reduced readmissions for targeted, high risk populations, very few have reduced their hospital-wide readmissions rate in the way Maryland’s hospitals have. There is substantial difference between designing an intervention to reduce readmissions in a relatively small, well-defined target population, such as a pilot for congestive heart failure patients and designing a strategy to reduce overall hospital readmissions. Maryland’s hospitals are using a robust portfolio of strategies to address this challenge.
Sample Portfolio Strategy:
While every hospital is investing in evidence-based interventions that are tailored to their local communities, still more work can be done. The investments are significant, involve numerous partners and require time and actionable data to realize their full potential. Examples of hospital strategies are included as links in Appendix 1.
findings suggest that readmissions could be “adversely” affected by a competing risk of death — a patient who dies during the index episode of care can never be readmitted. Hence, if a hospital has a lower mortality rate, then a greater proportion of its discharged patients are eligible for readmission. As such, to some extent, a higher readmission rate may be a consequence of successful care. Furthermore, planned readmissions for procedures or surgery may represent appropriate care that decreases the risk of death, but this is not accounted for in Hospital Compare. Looking forward, looking back: assessing variations in hospital resource use and outcomes for elderly patients with heart failure. Circulation: Cardiovascular Quality and Outcomes (10/2009); This study examines the association between mortality and resource use at the hospital level, when all Medicare beneficiaries hospitalized for heart failure are examined. Findings: California teaching hospitals that used more resources caring for patients hospitalized for heart failure had lower mortality rates.
Dianne Feeney January 5, 2015 Page 3
What We Don’t Know about Readmission Rates
We do not yet know the magnitude of the difference in Maryland’s readmissions rate compared to the nation, for the calendar year 2013 base period or for any part of the calendar year 2014 measurement period. Data sources put the gap between 1.55 to 2.56 percentage points. The Delmarva Foundation for Medical Care as the Medicare Quality Improvement Organization produced quarterly utilization reports using Medicare data as required under the Centers for Medicare & Medicaid Services (CMS) contract Scope of Work. Based on data released in their June 6, 2014 report, Maryland’s 30-day all cause annual readmission rate for calendar year 2013 was 18.96 percent compared to the nation’s rate of 17.41 percent; a difference of less than 9 percent or 1.55 percentage points. However, recent comparisons HSCRC staff shared at a Performance Measurement Work Group meeting based on calendar year 2013 data received from the Center for Medicare and Medicaid Innovation (CMMI) indicate Maryland readmission rates were at 20.65 percent in Maryland compared to 18.09 percent nationally--a base year gap just over 14 percent or 2.56 percentage points. Between the two data sources, the discrepancy in the Maryland to national base year gap is more than 5 percent. More recent data from CMMI indicates that the base year gap is closer to the Delmarva data than the data shared with the Performance Measurement Work Group. The recent CMMI data indicates the base year gap is 11.53 percent or 1.94 percentage points. Looking at the recent CMMI data on the performance year, Maryland is continuing to reduce readmission rates faster than the nation and is close to or may have outpaced the national rate of improvement by one-fifth of the base year gap, thereby possibly meeting the calendar year 2014 readmissions waiver target. We do not yet know how much of the gap between Maryland and national rates is due to errors or differences in measurement method. The difference between Maryland and national readmissions rates may be due, at least in part, to the inclusion of a larger proportion of high-risk individuals in the data set. Most concerning is that the state does not yet have sufficient data to verify base year readmission rates, nor 2014 performance year results. Further, it is not clear whether the data provided by the CMMI has appropriately handled Maryland’s psychiatric units within acute care hospitals that are paid under the Maryland hospital payment system, but would not be paid under the Inpatient Prospective Payment System (IPPS) were they located outside of Maryland. Because the national data includes only hospitals paid under IPPS but not those cases receiving psychiatric care and associated with the claims paid under the Medicare Inpatient Psychiatric Prospective Payment System, we believe there is a higher proportion of people with behavioral health conditions in Maryland’s readmission data, and the presence of a behavioral health condition significantly increases the risk of readmission. It’s also not clear to what extent Maryland’s reduced admissions should be accounted for in a readmissions payment policy. There are many moving parts to the incentives in the new waiver. Maryland’s hospitals have significantly reduced admissions and lowered costs for all payers. With this change, hospitals also recognize that the patients who remain in the hospital are sicker and often have more comorbidities. While reducing readmissions for this population is an imperative, data analysis needs to inform payment policies that are consistent with the goals of the waiver and enable an accurate assessment of performance. While patients are more complex, our hospitals have not wavered from their commitment to innovate beyond their four walls to address patient needs, as shown in the examples we highlight in the Appendix. As a field, we also recognize that focusing on all-payer readmissions, not just Medicare readmissions, is simply the right thing to do. As HSCRC analysis shows, all-payer readmissions is consistent with the trends in Medicare readmissions and solidly linked to waiver success – not only for the Medicare readmissions metric, but the limits on all-payer spending growth. Recognition that Maryland’s hospitals could be lowering costs and improving quality, and just not meeting an arbitrary readmissions reduction goal (not informed by data), is concerning in light of the agreement hospitals

Dianne Feeney January 5, 2015 Page 4
signed on to and the field’s unwavering passion to get it right. We do not know how to best structure readmissions performance incentives beyond those that exist in the global budget. The existing HSCRC readmissions payment policy adjusts expected readmissions rates for severity of illness and accounts for planned readmissions. However, because readmissions are also strongly associated with factors that we cannot yet measure well at the hospital level, such as health literacy, support at home, and the income and resources of the neighborhood in which a person lives, we don’t know which Maryland hospitals have the most opportunity to reduce readmission rates and which are performing well relative to other hospitals with similar patient characteristics.2 Well-developed community partnerships, particularly those with primary care physicians, are critical to reducing readmissions. Brian Jack, MD, Professor and Vice Chair, Department of Family Medicine, Boston University School of Medicine, Boston Medical Center, and founder of Project RED said, “Safe readmission reduction can only happen if hospitals have well developed community-based partners, particularly primary care partners, willing and able to care for patients in the community. More effort to ensuring that this primary care safety net is available for patients is needed.”3 The concern with the proposed policy is that applying penalties--potentially large penalties--to hospitals because they did not improve at the uniform targeted rate is that the Commission could inadvertently harm a hospital’s ability to provide services and interventions to the high-risk individuals who most need support. In federal Value-Based Purchasing, Hospital Acquired Conditions and in Maryland’s comparable programs, it is broadly accepted that outcome measures should be adjusted for clinical severity and comorbidities, including conditions that are “present on admission,” as these affect outcomes independent of the quality of care provided. Sociodemographic factors, like poverty, limited English proficiency, and homelessness, are also “present on admission.” Unlike pre-existing medical conditions, these social factors are not directly affected by health care interventions, but will directly affect certain outcomes, such as 30-day
2 Neighborhood Socioeconomic Disadvantage and 30-Day Rehospitalization (Annals of Internal Medicine, 12/2014); Living in a severely disadvantaged neighborhood predicts rehospitalization as powerfully as the presence of illnesses, such as peripheral vascular disease or chronic pulmonary disease, and more powerfully than being on Medicaid or having diabetes.” Hospital Readmissions: Necessary Evil or Preventable Target for Quality Improvement (Annals of Surgery, 10/2014); “High volume cancer centers have higher readmission rates….and may not be an appropriate marker for quality improvement.” The Medicare Hospital Readmissions Reduction Program: Potential Unintended Consequences for Hospitals Serving Vulnerable Populations. (Health Services Research, 6/2014); “Both dual eligible status and share of MC discharges have a positive effect on risk adjusted readmission rates.” Socioeconomic status and readmissions: Evidence from an urban teaching hospital. (Health Affairs, 5/2014); Patients living in high-poverty neighborhoods were 24 percent more likely than others to be readmitted, after demographic characteristics and clinical conditions were adjusted for.” Variation in the Risk of Readmission Among Hospitals: The Relative Contribution of Patient, Hospital and Inpatient Provider Characteristics. (Journal of General Internal Medicine, 12/2013);“Patient characteristics are the dominant contributor to the variation in risk of readmissions among hospitals…findings add to the accumulating evidence that hospitals may not be the appropriate sole target for placing accountability for excess readmissions.”
3 Readmission News (August 2014 )

Dianne Feeney January 5, 2015 Page 5
readmissions. This concern is clearly reflected in the National Quality Forum’s Expert Panel report on the need for sociodemographic adjustments for payment programs:
Just as quality measures for readmission aim to account for differences between patients in disease severity that affect repeat hospitalization, the Panel thought that factors related to social disadvantage … that affect risk for readmission should also be accounted for. … A measure of true performance accounts for the level of challenge posed by the patient to achieve an outcome, whether clinical or sociodemographic.
Moving Forward
Maryland’s hospitals are committed to improving care for all patients while they are inside the hospital walls and as they transition to home and to lower levels of care. Performing well on readmissions demonstrates our commitment to this important outcome, and helps us achieve the financial savings required under the waiver demonstration. We recommend that HSCRC staff and hospitals work together to answer the data and measurement questions, and to better understand the patient and hospital characteristics that may help to identify for targeted improvement efforts subpopulations with relatively high readmission rates. The results of the data validation and analysis should then inform the structure of incentives within a readmissions payment policy so that hospital payment adjustments are commensurate with successful levels of effort. In addition to closely following the work on socio-demographic factors that the National Quality Forum and CMS are pursuing, we recommend an analysis that begins with the data that we can access. MHA recommends no change to the current readmissions payment policy until MHA and HSCRC have the opportunity to:
1. Analyze a combination of variables for their potential use to classify and assign Maryland’s hospitals to peer groups. We believe an analysis that includes socio-economic and demographic indicators (by linking resident zip codes with data sets in the public domain such as census data on urbanicity, and poverty levels) will inform payment policies that have the right incentives and that recognizes the variations in hospitals’ opportunity to improve. While we appreciate HSCRC’s efforts to consider Medicaid status, we think the analysis was incomplete. Specifically, the analysis does not address whether having a higher percentage of Medicaid patients impacts a hospital’s readmission rate. The analysis is simply focused on whether readmission rates at Maryland hospitals with a larger Medicaid population changed more (or less) over one year. That is a different question from whether those that care for more Medicaid patients tend to have higher readmissions rates. The HSCRC analysis is not sufficient for constructing a payment policy in a state where readmission rates have been steadily declining over the last several years.
2. Given Maryland’s strong performance with mortality and the financial savings already realized, an
analysis using the Charlson Comorbidity Index (CCI) could be informative. CCI is considered a gold standard as a risk adjustment variable and is commonly used to account for severity of illness and multiple chronic conditions (similar to APR-DRGs), and can also be used to estimate comorbidity-adjusted life expectancy.

Dianne Feeney January 5, 2015 Page 6
3. While we understand and appreciate the need for safeguarding protected health information, transparency of CMMI readmission data is needed to appropriately compare Maryland with the nation. It would be helpful if MHA could review the SAS code used to pull the national readmissions data so that, when we have questions of what types of hospitals and cases are included, the detailed methodology contained in the SAS code can inform our validation process.
Considering the investments hospitals have made in their communities to reduce readmissions, the potential harm that would be done by imposing more financial risks, the uncertainties around the base year readmissions gap, uncertainties about Maryland’s rate of improvement relative to the nation thus far in calendar year 2014, and the significant incentives under global budgets, we recommend the reward-only policy continue for a second year while we address the socio-demographic questions, the data validation issues, and the best path forward. Implementing a more aggressive penalty structure before validating our performance creates a ham-fisted corrective action plan that does not identify or target areas that need focus, and does it before knowing whether corrective action is even required. While we recognize the critical importance of payment polices supporting success under the waiver, changing this policy without adequate data, analysis, and a reasonable amount of time for hospitals to analyze and respond to the changes is not helpful to the state’s overall success, nor to the collaborative nature that has allowed us to accomplish so much in such a short time. We appreciate the Commission’s consideration of our comments and look forward to continuing to work with HSCRC staff toward our shared goals. Sincerely,
Traci La Valle Vice President

Dianne Feeney January 5, 2015 Page 7
Appendix 1 Examples of Hospital Strategies to Reduce Hospital Wide All Payer Readmissions Frederick Memorial Hospital http://www.hscrc.state.md.us/documents/md-maphs/wg-meet/cc/2014-12-12/3-Frederick-Memorial-Hospital.pdf Johns Hopkins Health System http://www.hscrc.state.md.us/documents/md-maphs/wg-meet/jt-mtg-2014-03-27/8-A-Deutschendorf-HSCRC-Presentation.pdf Sinai Hospital http://dhmh.maryland.gov/mchrc/Documents/Hospital%20Community%20Partnership%20Forums/HCAM%20Presentation.pdf Additional resources and examples http://www.modernhealthcare.com/article/20141206/MAGAZINE/312069983/global-budgets-pushing-maryland-hospitals-to-target-population-health http://www.mhaonline.org/resources/video-resources/video-resources http://www.mhaonline.org/quality/transitions-handle-with-care

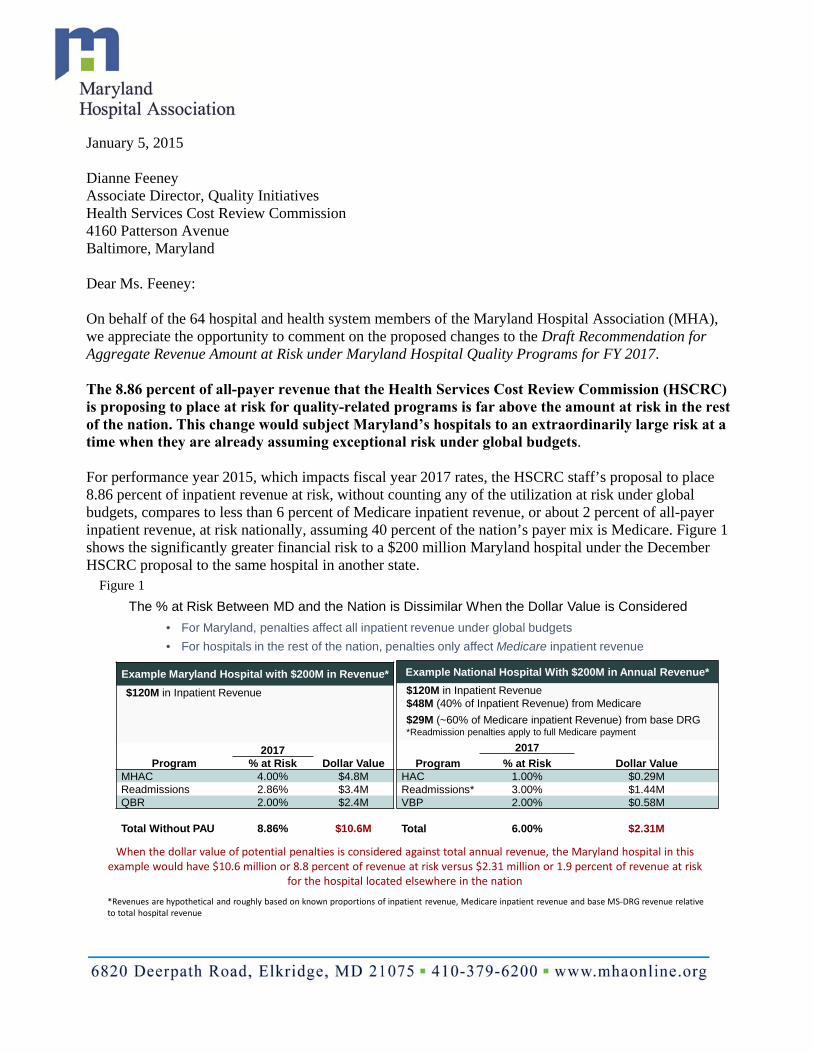
January 5, 2015 Dianne Feeney Associate Director, Quality Initiatives Health Services Cost Review Commission 4160 Patterson Avenue Baltimore, Maryland Dear Ms. Feeney: On behalf of the 64 hospital and health system members of the Maryland Hospital Association (MHA), we appreciate the opportunity to comment on the proposed changes to the Draft Recommendation for Aggregate Revenue Amount at Risk under Maryland Hospital Quality Programs for FY 2017. The 8.86 percent of all-payer revenue that the Health Services Cost Review Commission (HSCRC) is proposing to place at risk for quality-related programs is far above the amount at risk in the rest of the nation. This change would subject Maryland’s hospitals to an extraordinarily large risk at a time when they are already assuming exceptional risk under global budgets. For performance year 2015, which impacts fiscal year 2017 rates, the HSCRC staff’s proposal to place 8.86 percent of inpatient revenue at risk, without counting any of the utilization at risk under global budgets, compares to less than 6 percent of Medicare inpatient revenue, or about 2 percent of all-payer inpatient revenue, at risk nationally, assuming 40 percent of the nation’s payer mix is Medicare. Figure 1 shows the significantly greater financial risk to a $200 million Maryland hospital under the December HSCRC proposal to the same hospital in another state.
The % at Risk Between MD and the Nation is Dissimilar When the Dollar Value is Considered
• For Maryland, penalties affect all inpatient revenue under global budgets
• For hospitals in the rest of the nation, penalties only affect Medicare inpatient revenue
Example Maryland Hospital with $200M in Revenue*
$120M in Inpatient Revenue
2017Program % at Risk Dollar Value
MHAC 4.00% $4.8MReadmissions 2.86% $3.4MQBR 2.00% $2.4M
Total Without PAU 8.86% $10.6M
Example National Hospital With $200M in Annual Revenue*
$120M in Inpatient Revenue$48M (40% of Inpatient Revenue) from Medicare
$29M (~60% of Medicare inpatient Revenue) from base DRG *Readmission penalties apply to full Medicare payment
2017
Program % at Risk Dollar ValueHAC 1.00% $0.29MReadmissions* 3.00% $1.44MVBP 2.00% $0.58M
Total 6.00% $2.31M
*Revenues are hypothetical and roughly based on known proportions of inpatient revenue, Medicare inpatient revenue and base MS‐DRG revenue relative to total hospital revenue
When the dollar value of potential penalties is considered against total annual revenue, the Maryland hospital in this example would have $10.6 million or 8.8 percent of revenue at risk versus $2.31 million or 1.9 percent of revenue at risk
for the hospital located elsewhere in the nation
Figure 1

Dianne Feeney January 5, 2015 Page 2 The HSCRC staff recommendation seeks to justify this greater financial risk in two ways:
The Center for Medicare and Medicaid Innovation (CMMI) requires Maryland to reallocate revenue based on quality performance on a similar scale with the nation; and
By contract, Maryland’s aggregate amounts at risk for quality-related programs must be on par with the nation over a cumulative period that extends beyond the years in which the new waiver demonstration would be in place. The cumulative period would begin with a performance period in 2012, which corresponds to fiscal year 2014, and presumably extend through the calendar year 2018 performance period which would apply to fiscal year 2020 payment adjustments.
We strongly disagree. Neither assertion is supported by the language or the spirit of the agreement between the state of Maryland and CMMI and, as mentioned earlier, this interpretation places an unduly large amount of revenue at risk for Maryland’s hospitals. Attempting to shoehorn Maryland’s demonstration into the confines of the national payment system with this overly aggressive policy is out of step with the Advisory Council’s recommendations that hospital budgets and related policies be set to include incentives for hospitals to manage patients, and allow hospitals flexibility to achieve targets without heavy regulatory intervention. Furthermore, failure to achieve quality programs’ risk amounts commensurate with national risk amounts is not one of the events that trigger a consequence within the waiver agreement. To uphold the good faith and cooperation required for a successful demonstration, we strongly believe that input from the hospital field is required when interpreting the language of the waiver demonstration contract. It is important to reconcile the revenue at risk assumptions for quality programs with CMMI and the hospital field before any decisions are made by Commissioners about the fiscal year 2017 quality program at risk amounts. In addition, Maryland hospitals’ utilization risk under global budgets needs to be accounted for in the same way that the national “efficiency measure” used in the Value-Based Purchasing Program counts towards the sum of the aggregate amount at risk. A fair accounting of the avoidable utilization risk in global budgets is not only appropriate, it helps lower the risk on the other measures in Quality-Based Reimbursement, which are not directly tied to the readmissions and complications metrics under the waiver agreement. It also mitigates concerns with the metric itself, as mentioned in our September 22 comment letter on Quality-Based Reimbursement program recommendations. We also recommend shifting a portion of the revenue at risk from Maryland Hospital Acquired Conditions to readmissions, to reflect Maryland’s performance on hospital acquired conditions over the past year and the less clear performance on readmissions relative to our target. Thank you for the opportunity to participate in this process and to comment on this recommendation. If you have any questions, please contact me. Sincerely,
Michael B. Robbins Senior Vice President
Nurse Support Program II:Final Recommendation

Agenda
• Recommendations for Next Cycle• Response to Commissioner Questions
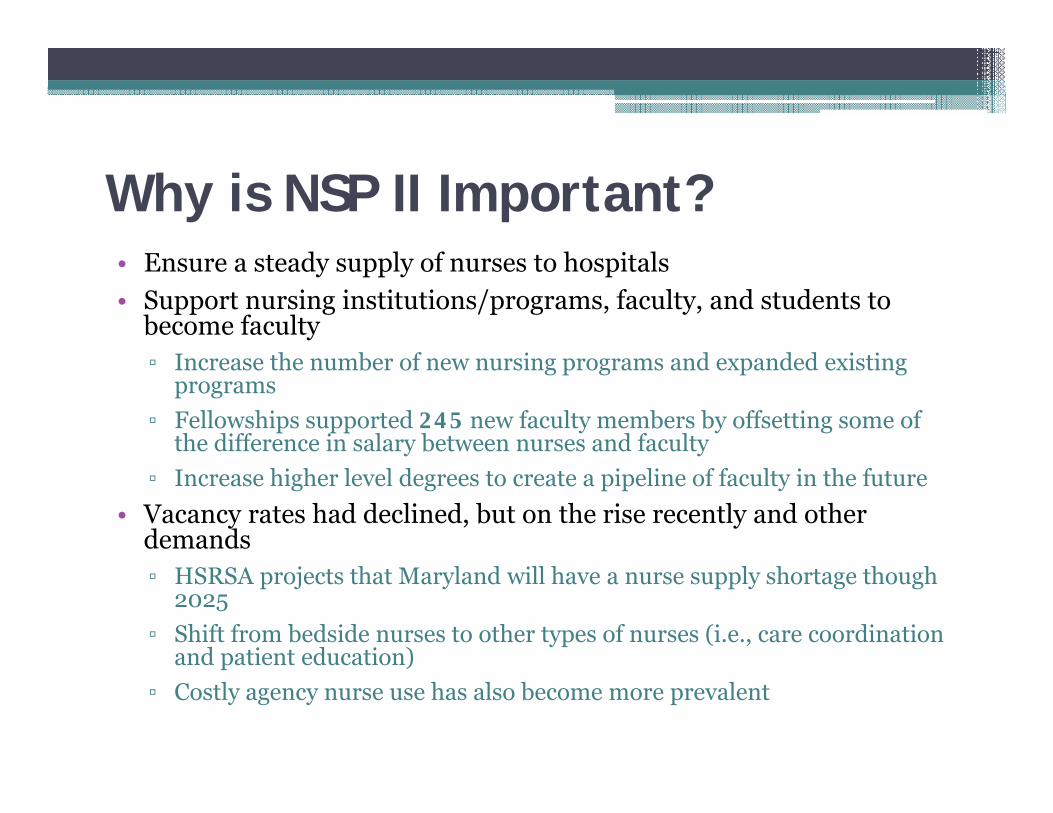
Why is NSP II Important?• Ensure a steady supply of nurses to hospitals• Support nursing institutions/programs, faculty, and students to
become faculty▫ Increase the number of new nursing programs and expanded existing
programs▫ Fellowships supported 245 new faculty members by offsetting some of
the difference in salary between nurses and faculty▫ Increase higher level degrees to create a pipeline of faculty in the future
• Vacancy rates had declined, but on the rise recently and other demands▫ HSRSA projects that Maryland will have a nurse supply shortage though
2025▫ Shift from bedside nurses to other types of nurses (i.e., care coordination
and patient education)▫ Costly agency nurse use has also become more prevalent
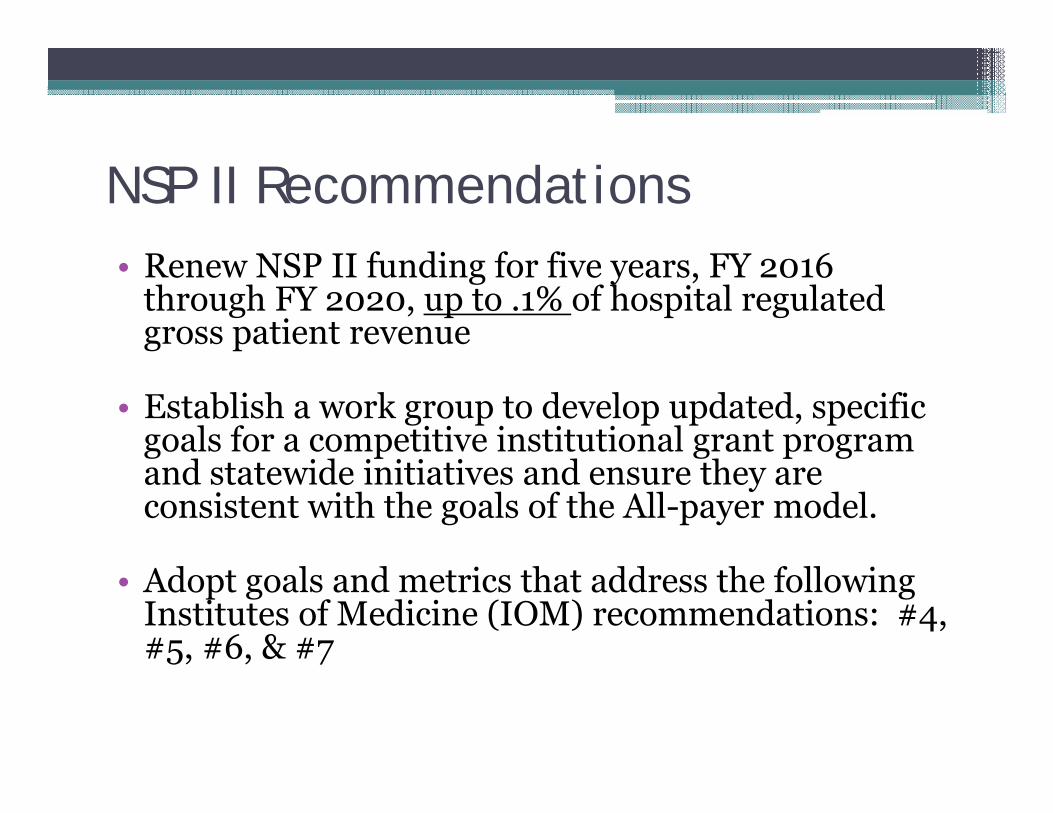
NSP II Recommendations• Renew NSP II funding for five years, FY 2016
through FY 2020, up to .1% of hospital regulated gross patient revenue
• Establish a work group to develop updated, specific goals for a competitive institutional grant program and statewide initiatives and ensure they are consistent with the goals of the All-payer model.
• Adopt goals and metrics that address the following Institutes of Medicine (IOM) recommendations: #4, #5, #6, & #7

NSP II Recommendations • Acquire software to manage and report on
outcomes data.
• Review current NSP II Statute in the General Assembly Education Article, Section §11-405, particularly the term “bedside nurses” to ensure that the statute meets the current needs of health care and the movement to coordinated care models.

Questions and Answers
• How does Maryland growth compare to national growth?▫ HRSA (2014) reported Maryland nurse workforce
increased 38% between 2008-2012 while nationally, the nursing workforce increase was only 28%.
▫ Between 2008-2013, Maryland nursing graduates increased by 43%, compared to 20% nationally .
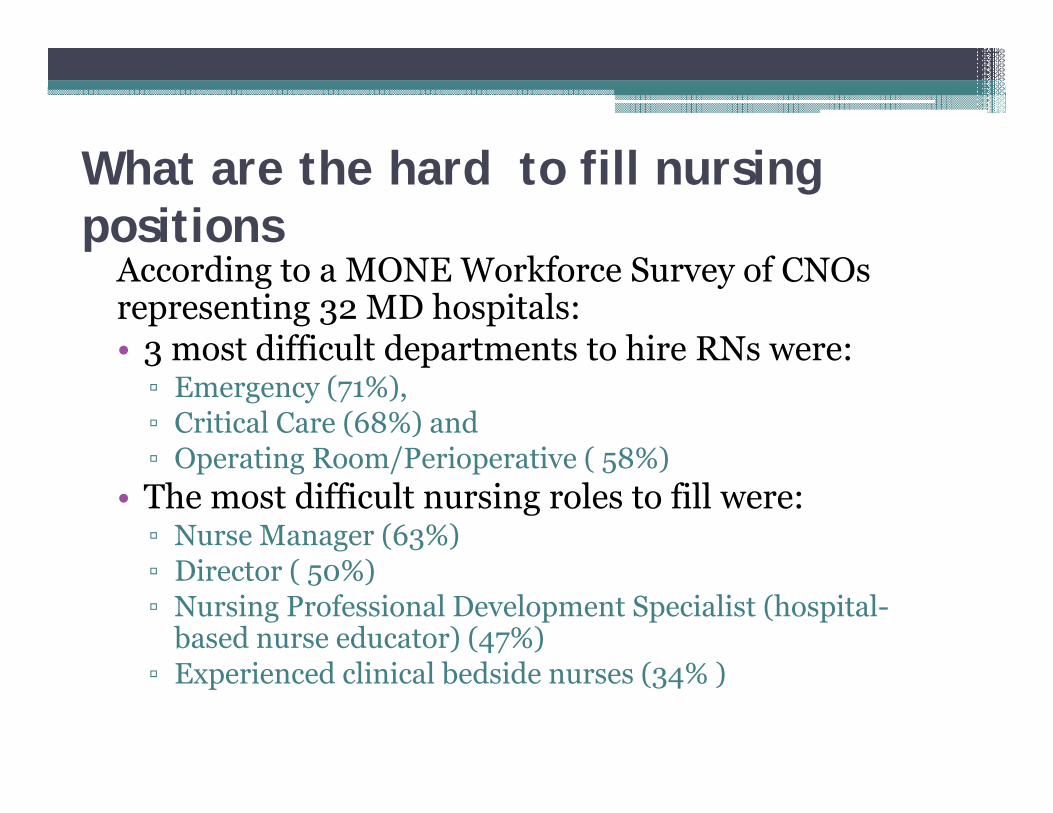
What are the hard to fill nursing positions
According to a MONE Workforce Survey of CNOs representing 32 MD hospitals:• 3 most difficult departments to hire RNs were: ▫ Emergency (71%), ▫ Critical Care (68%) and ▫ Operating Room/Perioperative ( 58%)
• The most difficult nursing roles to fill were:▫ Nurse Manager (63%)▫ Director ( 50%) ▫ Nursing Professional Development Specialist (hospital-
based nurse educator) (47%) ▫ Experienced clinical bedside nurses (34% )

Is Maryland a net importer and net exporter of RNs? • We don’t have a definitive answer to this
question
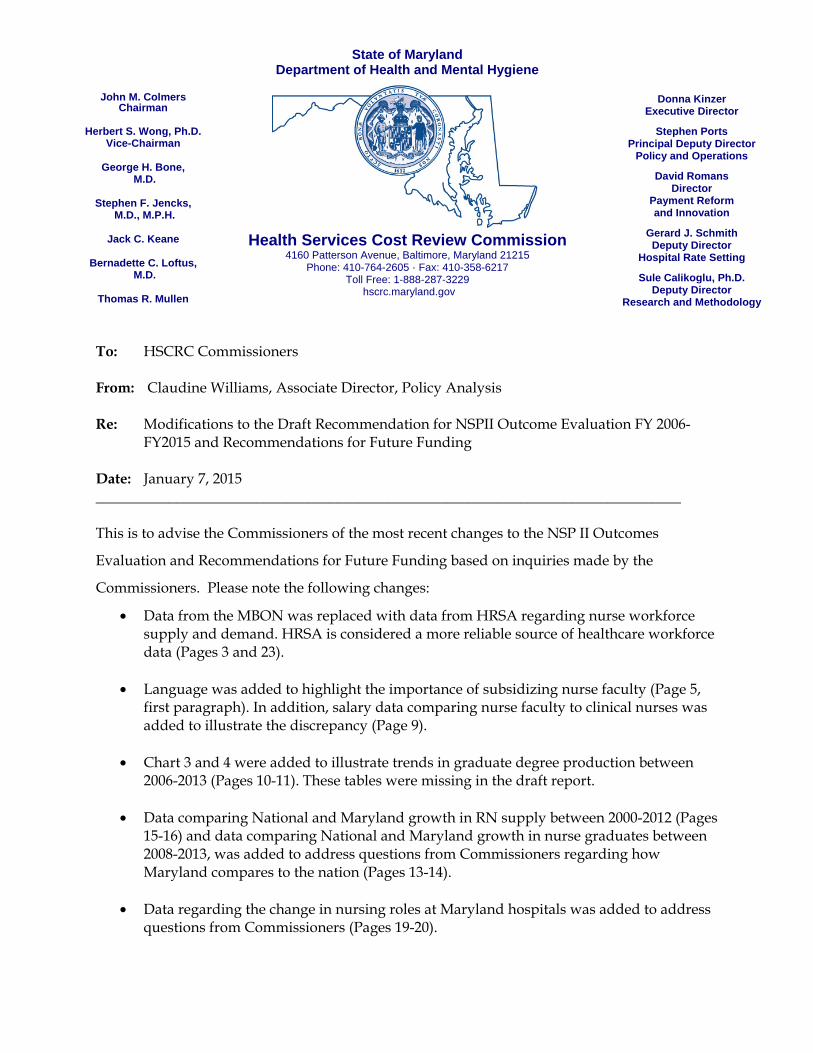
John M. Colmers Chairman
Herbert S. Wong, Ph.D.
Vice-Chairman
George H. Bone, M.D.
Stephen F. Jencks,
M.D., M.P.H.
Jack C. Keane
Bernadette C. Loftus, M.D.
Thomas R. Mullen
Donna Kinzer
Executive Director
Stephen Ports Principal Deputy Director
Policy and Operations
David Romans Director
Payment Reform and Innovation
Gerard J. Schmith Deputy Director
Hospital Rate Setting
Sule Calikoglu, Ph.D. Deputy Director
Research and Methodology
Health Services Cost Review Commission 4160 Patterson Avenue, Baltimore, Maryland 21215
Phone: 410-764-2605 · Fax: 410-358-6217 Toll Free: 1-888-287-3229
hscrc.maryland.gov
State of Maryland Department of Health and Mental Hygiene
To: HSCRC Commissioners From: Claudine Williams, Associate Director, Policy Analysis Re: Modifications to the Draft Recommendation for NSPII Outcome Evaluation FY 2006-
FY2015 and Recommendations for Future Funding Date: January 7, 2015 ________________________________________________________________________________ This is to advise the Commissioners of the most recent changes to the NSP II Outcomes
Evaluation and Recommendations for Future Funding based on inquiries made by the
Commissioners. Please note the following changes:
• Data from the MBON was replaced with data from HRSA regarding nurse workforce supply and demand. HRSA is considered a more reliable source of healthcare workforce data (Pages 3 and 23).
• Language was added to highlight the importance of subsidizing nurse faculty (Page 5, first paragraph). In addition, salary data comparing nurse faculty to clinical nurses was added to illustrate the discrepancy (Page 9).
• Chart 3 and 4 were added to illustrate trends in graduate degree production between 2006-2013 (Pages 10-11). These tables were missing in the draft report.
• Data comparing National and Maryland growth in RN supply between 2000-2012 (Pages 15-16) and data comparing National and Maryland growth in nurse graduates between 2008-2013, was added to address questions from Commissioners regarding how Maryland compares to the nation (Pages 13-14).
• Data regarding the change in nursing roles at Maryland hospitals was added to address questions from Commissioners (Pages 19-20).

1 | P a g e
Nurse Support Program II (NSP II) Outcomes Evaluation FY 2006 - FY 2015 and Recommendations for Future Funding
Health Services Cost Review Commission 4160 Patterson Avenue Baltimore, MD 21215
410-764-2605
January 14, 2015
These final staff recommendations were approved by the Commission, with clarification for recommendation #1 that the funding is up to 0.1%, at the public meeting on January 14, 2015.
2 | P a g e
EXECUTIVE SUMMARY
Nurse Support Program II (NSP II) Outcomes Evaluation FY 2006 – FY 2015 and
Recommendations for Future Funding
The Nurse Support Program II (NSP II) is designed to increase the number of hospital
bedside nurses by mitigating barriers to nursing education enrollments and graduation. This goal
is achieved by expanding academic capacity, including the number of faculty available to teach
in Maryland’s nursing programs while simultaneously supporting student success. The NSP II
has two components, a competitive institutional grant and statewide initiatives. Nine rounds of
Competitive Institutional Grant awards totaling $63,374,650 were awarded between fiscal years
2006 and 2015. Statewide initiatives provided $27,997,338 to 950 graduate nursing students and
faculty across the State in the forms of scholarships, fellowships, or grants to help them begin or
enrich careers as faculty in Maryland schools/departments of nursing. Fifteen community
colleges and eleven universities across all geographic regions and types of programs participated
in the NSP II. All Maryland nursing programs received one or more institutional grant awards.
Notable program outcomes include:
• New Nursing Faculty Fellowships resulted in the recruitment and retention of 245 new
faculty members (lecture and clinical) at 12 universities and 7 community colleges.
Forty-four percent (44%) were from underrepresented groups in nursing. The retention of
new full-time faculty is 88%.
• Bachelor degree program (BSN) enrollments were 4,086 in 2005 rising to 6,832 in 2013,
a 67% increase. Associate degree (ADN) enrollments rose 27% from 9,507 in 2005 to
12,971 in 2013 with assistance from NSP II programs.
• BSN graduates steadily increased from 1,127 graduates in 2006 to 1,615 graduates in
2013. ADN graduates steadily increased from 1,090 in 2006 to 1,726 graduates in 2013.
• Over 5,800 or 27% of 20,967 total Maryland new pre-licensure nurse graduates can be
directly tied to competitive institutional grant program outcomes from 2006-2014.
• The number of new pre-licensure nurse graduates passing the National Council Licensure
Examination for Registered Nurses (NCLEX-RN) exam on the first attempt has steadily
increased from 1,566 in 2005 to 2,598 in 2013. Just as important, the first attempt pass
rates have remained consistent even as access to programs increased indicating
3 | P a g e
maintenance and improvements in Maryland’s nursing education programs during a time
of unprecedented expansion.
• According to the U.S. Department of Health and Human Services Health Resources and
Services Administration (HRSA) report released mid December 2014 (after the
December 10, 2014 Commission meeting), the Maryland nurse workforce increased 38%
between 2008-2012. Nationally, the increase was 28%. Even with these gains, Maryland
is one of 16 states projected to have a significant shortfall of RNs by 2025 (HRSA, 2014).
HRSA data is generally considered the most reliable available healthcare workforce data
for national comparisons.
The NSP II has been successful in increasing the number of available hospital bedside
nurses. However, there are indicators that suggest the nursing workforce shortage in Maryland is
not fully resolved. Current issues impacting the State’s nursing workforce include predicted
nurse retirements – especially those delayed by economic recession that is now correcting,
changes in patient care related to the State’s Medicare waiver and the federal Affordable Care
Act, hospital migration to magnet status which is associated with better patient outcomes, and
changes in hospital health care delivery to a care coordination model. We recommend that the
Health Services Cost Review Commission consider five actions, regarding the future direction of
the NSP II.
1. Renew NSP II funding at 0.1% of hospital regulated gross patient revenue for five
years, FY 2016 through FY 2020.
2. Establish a work group to develop updated, specific goals for a competitive
institutional grant program and statewide initiatives.
3. Adopt goals and metrics that address the following Institutes of Medicine (IOM)
recommendations: #4, #5, #6, & #7 (Refer to the Recommendations Section for full
detail on the IOM recommendations).
4. Purchase software to manage and report on outcomes data.
5. Review current NSP II statute, particularly the term “bedside nurses” to ensure that
the statute meets the current needs of health care and movement to coordinated care
models.
4 | P a g e
EXECUTIVE BRIEF
Nurse Support Program II (NSP II) Outcomes Evaluation FY 2006 – 2015 and Recommendations for Future Funding
INTRODUCTION
The Health Services Cost Review Commission (HSCRC) established the Nurse Support
Program II (NSP II) on May 4, 2005. The NSP II, administered by the Maryland Higher
Education Commission (MHEC) in collaboration with the HSCRC, is designed to increase the
State’s academic capacity to graduate more nursing students, and is complementary to the Nurse
Support Program I (NSP I), a hospital based program. The NSP II is funded through pooled
assessments totaling up to 0.1% of hospital regulated gross patient revenue over a ten year period
ending June 30, 2015. The NSP II employs an effective three-prong strategy for increasing the
number of nurses in the State with the ultimate goal of reducing hospital costs. These goals were
achieved by increasing the number of nursing lecture and clinical faculty, supporting schools and
departments of nursing in expanding academic capacity and curriculum, and providing supports
to enhance nursing enrollments and graduation. This Executive Brief describes program
outcomes including program impact on the State’s nursing workforce. Findings related to nurse
supply and demand, the State’s academic capacity to increase enrollments and graduation in
nursing programs, entry to practice, and the preparation of teaching and clinical faculty are
presented. An examination of current and future nurse workforce issues, post NSP II, is
presented as well. The Executive Brief concludes with recommendations for the future of the
program.
Program Inception and Purpose
Maryland was one of five states to be granted a Medicare waiver in 1977 which
exempted the State from traditional Medicare payments (codified in Section 1814 (b) of the
Social Security Act). The HSCRC was established as an independent state agency with full rate
setting authority over all general acute care hospitals in Maryland. The HSCRC has the authority
to adapt the rate system to changing dynamics within health care. As such, it provides a flexible
and stable funding source for the NSP I for hospitals and NSP II for Schools/Departments of
Nursing, as part of its larger mission to control costs and ensure the quality of health services.
Today, Maryland is the only state that continues to set its own hospital rates for all payers.

5 | P a g e
In 2003, the nursing shortage in Maryland was worsening despite the efforts of the NSP I
hospital based programs. Vacancy rates exceeded 15%, and the cost of agency nurses was over
$144 million (Heller & Sweeney, 2003). There were not enough new nursing graduates to meet
hospital workforce demand. Leaders from hospitals and educational institutions realized that a
shortage of nursing faculty was restricting the capacity of schools to admit and educate more
nurses to meet market demand. The shortage of faculty was due, in part, to the significant salary
discrepancy between nurses in practice and nurse faculty/educators, and incentives would be
necessary to attract clinical nurses to academic positions. A group of stakeholders interested in
statewide solutions helped establish NSP II to satisfy the needs of hospitals for bedside nurses
through education focused programs that would grow capacity by increasing the numbers of
nursing faculty and nursing students.
In 2006, MHEC and the Maryland Board of Nursing (MBON) completed The Maryland
Nursing Program Capacity Study requested by Senate Bill 511 (Chapter 487, Acts of 2005).
This study built upon the work of the Center for Health Workforce Development and the
Statewide Commission on Nursing, which concluded its work in 2006. The Nurse Support
Program II was established in State statute (Annotated Code of Maryland, Education Article §11-
405, Nurse Support Program Assistance Fund) and funded through HSCRC rates. A
Memorandum of Understanding (MOU) between the HSCRC and the Maryland Higher
Education Commission was established, whereby MHEC was charged to administer the NSP II
programs under the auspices of the HSCRC. The MOU identified the purpose of the NSP II to:
1) increase the number of bedside nurses in Maryland hospitals; and 2) expand the capacity of
Maryland nursing schools to produce qualified nurses to work in Maryland. These goals were
achieved through a competitive institutional grant program and statewide initiatives. Statewide
initiatives include activities supporting students and faculty while the competitive institutional
grant program increased capacity of the nursing programs (HSCRC and MHEC MOU, 2006).
Creating a diverse nursing faculty and workforce are also goals for the program.
Competitive Institutional Grant Program and Statewide Initiatives
Two types of programs are supported by the NSP II. These include the Competitive
Institutional Grant Program and Statewide Initiatives. A brief description of each type of
program follows.
Competitive Institutional Grant Program. Competitive institutional grants are

6 | P a g e
designed to increase the structural capacity of Maryland nursing schools through shared
resources, innovative educational designs, and streamlined processes to produce more
nurse faculty, and nursing undergraduate and graduate nurses. Grants support activities such
as the establishment of new degree programs, curriculum enhancement and redesign, student
retention initiatives, and simulation and other productivity enhancing instructional technologies.
The grants also contribute to the creation of a more diverse nursing faculty and workforce.
Many grant projects prepare more graduate level nurses qualified to serve as lecturers
and/or clinical faculty at Maryland's higher education institutions.
Statewide Initiatives. Statewide initiatives include the New Nurse Faculty
Fellowships (NNFF), the Nurse Educator Doctoral Grants for Practice and Dissertation
Research (NEDG), and the Hal and Jo Cohen Graduate Nursing Faculty Scholarship and
Living Expenses Grant (GNF/LEG). The NNFF provides funding for newly hired nursing
faculty to support their research and teaching. Funds assist faculty with the work necessary
to gain tenure, and support faculty retention. The NEDG provides funds to support doctoral
nursing students during their critical final phase of graduate study — the dissertation or
capstone project. Research suggests that this is a critical retention junction as many
students drop out at this point. The NEDG, a relatively new program, appears to positively
impact retention and completion. The Hal and Jo Cohen graduate financial aid programs
provide powerful incentives for currently practicing nurses, and others to pursue graduate
level education and pursue faculty positions in both classroom and/or clinical settings.
Program Sunset and Evaluation Methodology
New funding that supports the NSP II ends in FY 2015. At the request of the HSCRC,
MHEC and HSCRC staff conducted a comprehensive program review. Assistance was
provided by a Nursing Faculty Advisory Group, representatives of the Maryland Hospital
Association, and NSP I Nurse Residency leaders with the Maryland Organization of Nurse
Executives. NSP II competitive institutional grant recipients were instrumental in the collection
of project outcomes data and collaborated with nurse executive leaders on hospital based
measures.
Data was collected and compiled for all NSP II funded projects for all years of activity
where data was available. Excel and SPSS were used to compile and analyze the data. Both
quantitative and qualitative data analysis was applied, most notably descriptive statistics, case
7 | P a g e
study, and thematic analysis. Outcomes were compared to project goals. A summary of important
outcomes is discussed in the following section. Findings on the most successful strategies utilized
by NSP II and suggested revisions for improvement are included in the review of activities and
outcomes.
NSP II PROGRAM EVALUATION AND OUTCOMES 2006-2014
Competitive Institutional Grants Overview
Nine rounds of institutional competitive grants were awarded between July 1, 2005 and June
30, 2014, totaling $63,374,650. A total of 109 institutional multi-year grants were awarded through a
competitive review process. Fifteen community colleges and eleven universities received funding.
Grant recipients included schools or departments of nursing at public universities including the State's
four historically black institutions, independent colleges and universities, and community colleges.
The distribution of awards was geographically diverse with three institutions in Western Maryland,
two institutions on the Eastern Shore, three institutions in Northern Maryland, and one institution in
Southern Maryland. The remaining institutions are located in the central region of the state and
Baltimore City. Grant recipients received funds in installments over the life of the grant contingent
upon adequate yearly progress. Forty-one (41) projects have successfully concluded allowing for a
detailed analysis of the strategies used by the most successful awardees. Sixty-eight (68) awards
remain open, some with annual payments extending into FY 2017 (with funds accrued through FY
2015). While these projects have not yet concluded, annual outcomes to date are included in the data
analysis.
Statewide Initiatives Overview
There were eight funding cycles for the NNFF and GNF/LEG. There were two funding cycles
for the NEDG. A total of $27,997,338 has been disbursed to date through these programs. Nurses
either committed to become nursing faculty through attainment of graduate education, or advanced
their careers (tenure-track) as faculty by earning a doctorate, or joined an institution as a new faculty
member. A description of each program within the Statewide Initiatives follows.
New Nursing Faculty Fellowships (NNFF). The Nurse Support Program II provides funding
for New Nursing Faculty Fellowships to newly hired faculty. These fellowships assisted Maryland
nursing programs in recruiting and retaining new nursing faculty to produce the additional nursing
graduates required by Maryland's hospitals. Since FY 2007, 245 new faculty members have been
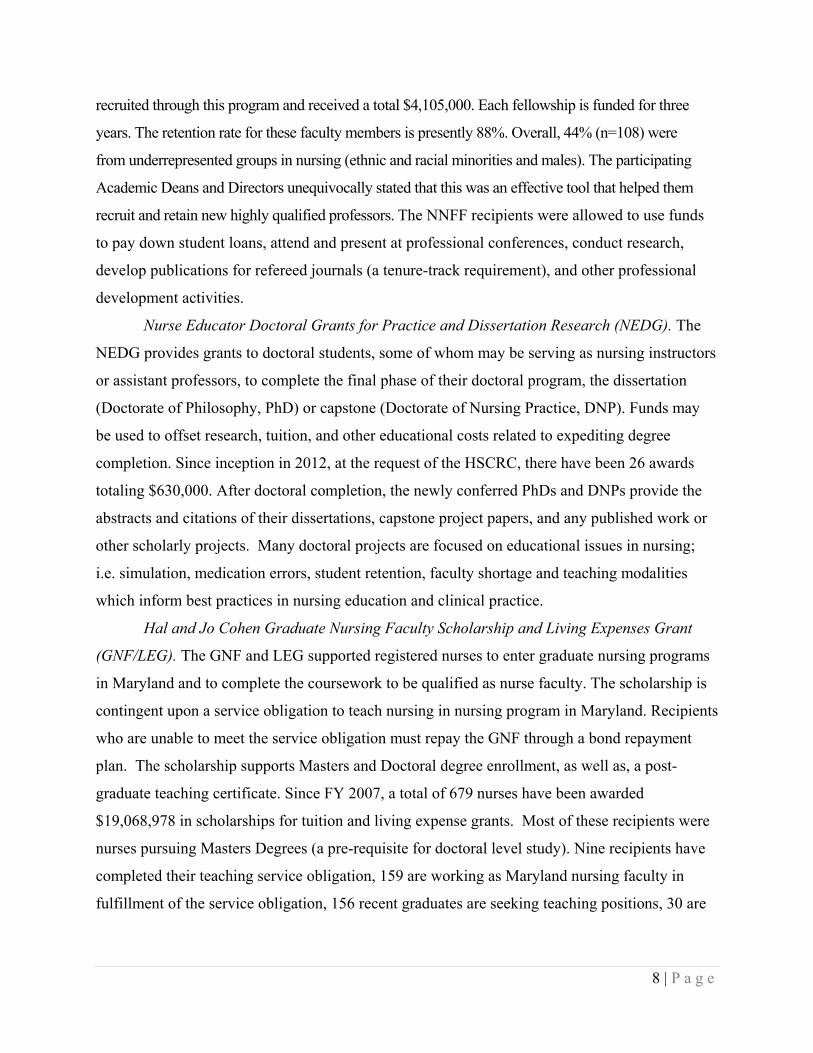
8 | P a g e
recruited through this program and received a total $4,105,000. Each fellowship is funded for three
years. The retention rate for these faculty members is presently 88%. Overall, 44% (n=108) were
from underrepresented groups in nursing (ethnic and racial minorities and males). The participating
Academic Deans and Directors unequivocally stated that this was an effective tool that helped them
recruit and retain new highly qualified professors. The NNFF recipients were allowed to use funds
to pay down student loans, attend and present at professional conferences, conduct research,
develop publications for refereed journals (a tenure-track requirement), and other professional
development activities.
Nurse Educator Doctoral Grants for Practice and Dissertation Research (NEDG). The
NEDG provides grants to doctoral students, some of whom may be serving as nursing instructors
or assistant professors, to complete the final phase of their doctoral program, the dissertation
(Doctorate of Philosophy, PhD) or capstone (Doctorate of Nursing Practice, DNP). Funds may
be used to offset research, tuition, and other educational costs related to expediting degree
completion. Since inception in 2012, at the request of the HSCRC, there have been 26 awards
totaling $630,000. After doctoral completion, the newly conferred PhDs and DNPs provide the
abstracts and citations of their dissertations, capstone project papers, and any published work or
other scholarly projects. Many doctoral projects are focused on educational issues in nursing;
i.e. simulation, medication errors, student retention, faculty shortage and teaching modalities
which inform best practices in nursing education and clinical practice.
Hal and Jo Cohen Graduate Nursing Faculty Scholarship and Living Expenses Grant
(GNF/LEG). The GNF and LEG supported registered nurses to enter graduate nursing programs
in Maryland and to complete the coursework to be qualified as nurse faculty. The scholarship is
contingent upon a service obligation to teach nursing in nursing program in Maryland. Recipients
who are unable to meet the service obligation must repay the GNF through a bond repayment
plan. The scholarship supports Masters and Doctoral degree enrollment, as well as, a post-
graduate teaching certificate. Since FY 2007, a total of 679 nurses have been awarded
$19,068,978 in scholarships for tuition and living expense grants. Most of these recipients were
nurses pursuing Masters Degrees (a pre-requisite for doctoral level study). Nine recipients have
completed their teaching service obligation, 159 are working as Maryland nursing faculty in
fulfillment of the service obligation, 156 recent graduates are seeking teaching positions, 30 are
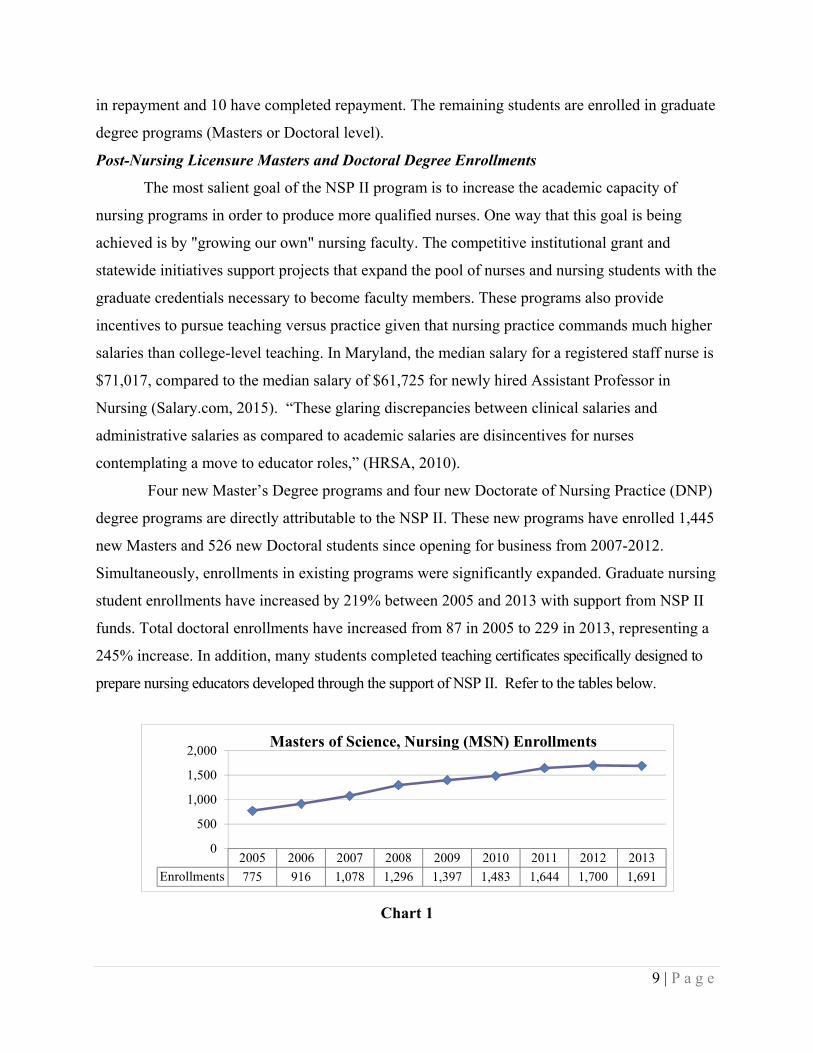
9 | P a g e
in repayment and 10 have completed repayment. The remaining students are enrolled in graduate
degree programs (Masters or Doctoral level).
Post-Nursing Licensure Masters and Doctoral Degree Enrollments
The most salient goal of the NSP II program is to increase the academic capacity of
nursing programs in order to produce more qualified nurses. One way that this goal is being
achieved is by "growing our own" nursing faculty. The competitive institutional grant and
statewide initiatives support projects that expand the pool of nurses and nursing students with the
graduate credentials necessary to become faculty members. These programs also provide
incentives to pursue teaching versus practice given that nursing practice commands much higher
salaries than college-level teaching. In Maryland, the median salary for a registered staff nurse is
$71,017, compared to the median salary of $61,725 for newly hired Assistant Professor in
Nursing (Salary.com, 2015). “These glaring discrepancies between clinical salaries and
administrative salaries as compared to academic salaries are disincentives for nurses
contemplating a move to educator roles,” (HRSA, 2010).
Four new Master’s Degree programs and four new Doctorate of Nursing Practice (DNP)
degree programs are directly attributable to the NSP II. These new programs have enrolled 1,445
new Masters and 526 new Doctoral students since opening for business from 2007-2012.
Simultaneously, enrollments in existing programs were significantly expanded. Graduate nursing
student enrollments have increased by 219% between 2005 and 2013 with support from NSP II
funds. Total doctoral enrollments have increased from 87 in 2005 to 229 in 2013, representing a
245% increase. In addition, many students completed teaching certificates specifically designed to
prepare nursing educators developed through the support of NSP II. Refer to the tables below.
2005 2006 2007 2008 2009 2010 2011 2012 2013Enrollments 775 916 1,078 1,296 1,397 1,483 1,644 1,700 1,691
0
500
1,000
1,500
2,000 Masters of Science, Nursing (MSN) Enrollments
Chart 1
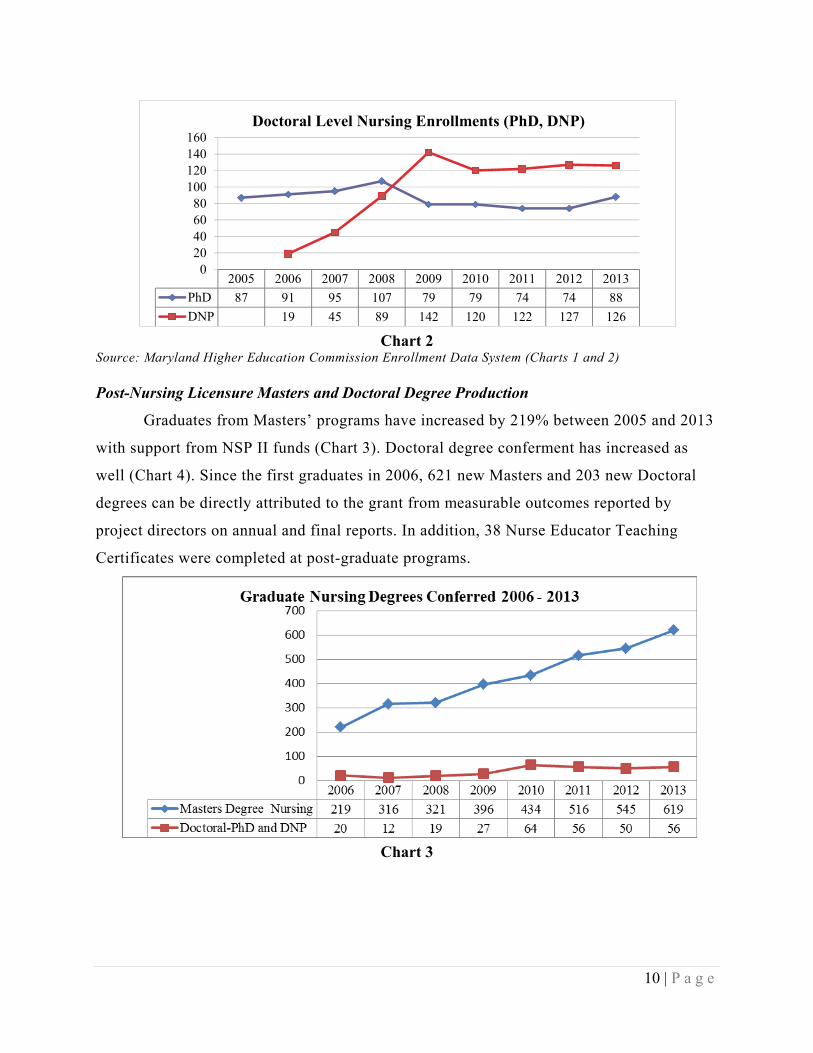
10 | P a g e
2005 2006 2007 2008 2009 2010 2011 2012 2013PhD 87 91 95 107 79 79 74 74 88DNP 19 45 89 142 120 122 127 126
020406080
100120140160
Doctoral Level Nursing Enrollments (PhD, DNP)
Chart 2
Source: Maryland Higher Education Commission Enrollment Data System (Charts 1 and 2) Post-Nursing Licensure Masters and Doctoral Degree Production
Graduates from Masters’ programs have increased by 219% between 2005 and 2013
with support from NSP II funds (Chart 3). Doctoral degree conferment has increased as
well (Chart 4). Since the first graduates in 2006, 621 new Masters and 203 new Doctoral
degrees can be directly attributed to the grant from measurable outcomes reported by
project directors on annual and final reports. In addition, 38 Nurse Educator Teaching
Certificates were completed at post-graduate programs.
Chart 3
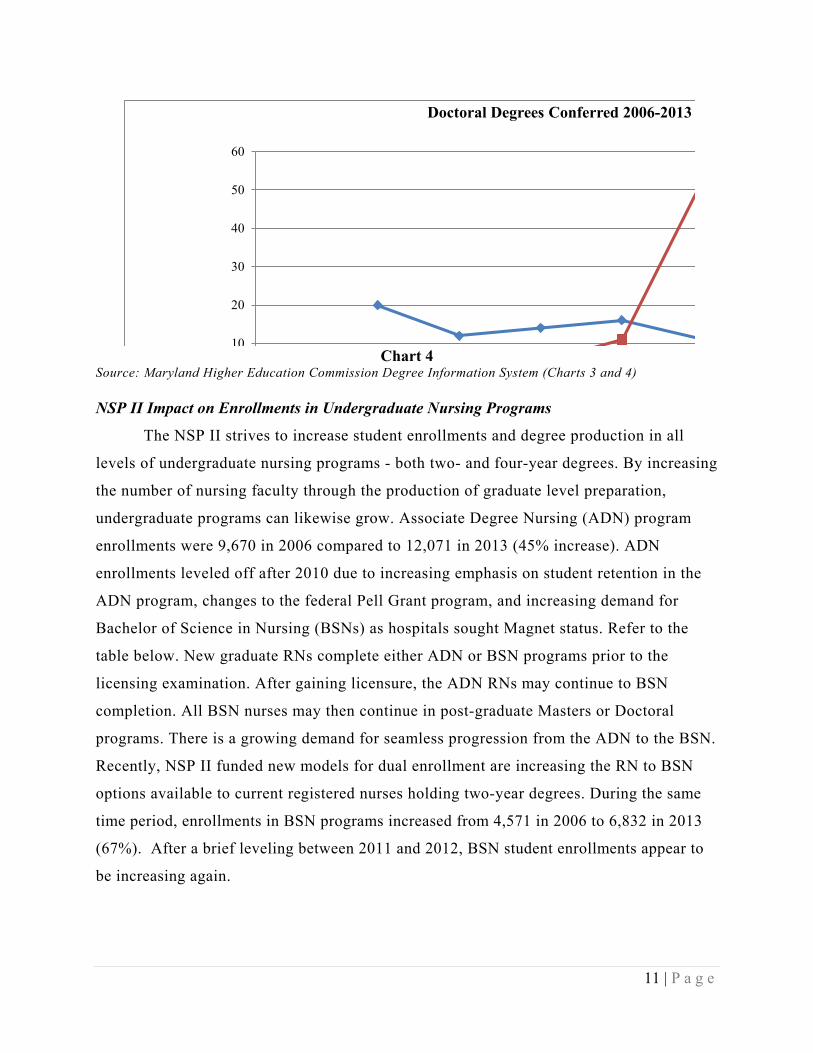
11 | P a g e
10
20
30
40
50
60
Doctoral Degrees Conferred 2006-2013
Chart 4
Source: Maryland Higher Education Commission Degree Information System (Charts 3 and 4) NSP II Impact on Enrollments in Undergraduate Nursing Programs
The NSP II strives to increase student enrollments and degree production in all
levels of undergraduate nursing programs - both two- and four-year degrees. By increasing
the number of nursing faculty through the production of graduate level preparation,
undergraduate programs can likewise grow. Associate Degree Nursing (ADN) program
enrollments were 9,670 in 2006 compared to 12,071 in 2013 (45% increase). ADN
enrollments leveled off after 2010 due to increasing emphasis on student retention in the
ADN program, changes to the federal Pell Grant program, and increasing demand for
Bachelor of Science in Nursing (BSNs) as hospitals sought Magnet status. Refer to the
table below. New graduate RNs complete either ADN or BSN programs prior to the
licensing examination. After gaining licensure, the ADN RNs may continue to BSN
completion. All BSN nurses may then continue in post-graduate Masters or Doctoral
programs. There is a growing demand for seamless progression from the ADN to the BSN.
Recently, NSP II funded new models for dual enrollment are increasing the RN to BSN
options available to current registered nurses holding two-year degrees. During the same
time period, enrollments in BSN programs increased from 4,571 in 2006 to 6,832 in 2013
(67%). After a brief leveling between 2011 and 2012, BSN student enrollments appear to
be increasing again.
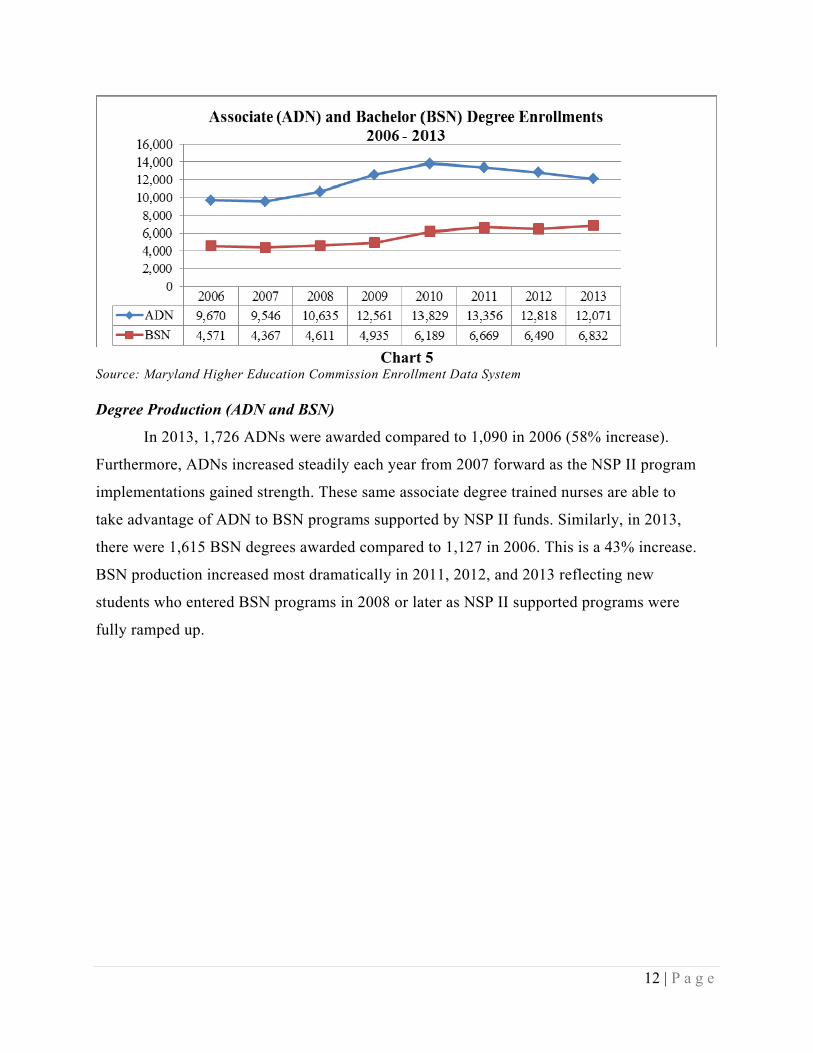
12 | P a g e
Chart 5
Source: Maryland Higher Education Commission Enrollment Data System Degree Production (ADN and BSN)
In 2013, 1,726 ADNs were awarded compared to 1,090 in 2006 (58% increase).
Furthermore, ADNs increased steadily each year from 2007 forward as the NSP II program
implementations gained strength. These same associate degree trained nurses are able to
take advantage of ADN to BSN programs supported by NSP II funds. Similarly, in 2013,
there were 1,615 BSN degrees awarded compared to 1,127 in 2006. This is a 43% increase.
BSN production increased most dramatically in 2011, 2012, and 2013 reflecting new
students who entered BSN programs in 2008 or later as NSP II supported programs were
fully ramped up.

13 | P a g e
Chart 6 Source: Maryland Higher Education Commission, Degree Information System
The overall number of nursing graduates in Maryland has increased by 43%,
compared to a national increase of 21% between 2008 and 2013 (Chart 7). While some
undergraduate nursing degree increase is attributable to natural growth, data provided by
NSP II competitive institutional grant project directors suggest that over 5,800 or 27% of all
undergraduate nursing degrees produced between 2006-2013 are directly attributable to
the NSP II competitive institutional grant program focused on student retention initiatives,
redesigned curriculum options, and new programs. This number does not include the
number of new students admitted and graduated due to an increase in the number of faculty
recruited through statewide initiatives. In addition, a new NSP II funded RN (ADN) to BSN
program in western Maryland and expansion of similar existing programs produced 506 new
BSNs who were formerly RNs with two-year degree credentials.

14 | P a g e
Chart 7 Source: Maryland Higher Education Commission Degree Information System. HRSA. (2014). The Future of the Nursing Workforce: National-and State-Level Projections, 2012-2025. NCLEX Pass Rates
The number of Maryland nursing graduates passing NCLEX exams on the first attempt
has steadily increased over the course of the NSP II Program from a baseline of 1,566 in 2005
to 2,598 in 2013. This represents a 66% increase in the number of newly licensed RNs passing
licensure on the first attempt across the state. The percentage of students passing the NCLEX in
one or more attempts was 87% in 2005 and 86% in 2013 suggesting that even as access to
nursing programs expanded, quality as demonstrated by the NCLEX pass rate has been
reasonably maintained.
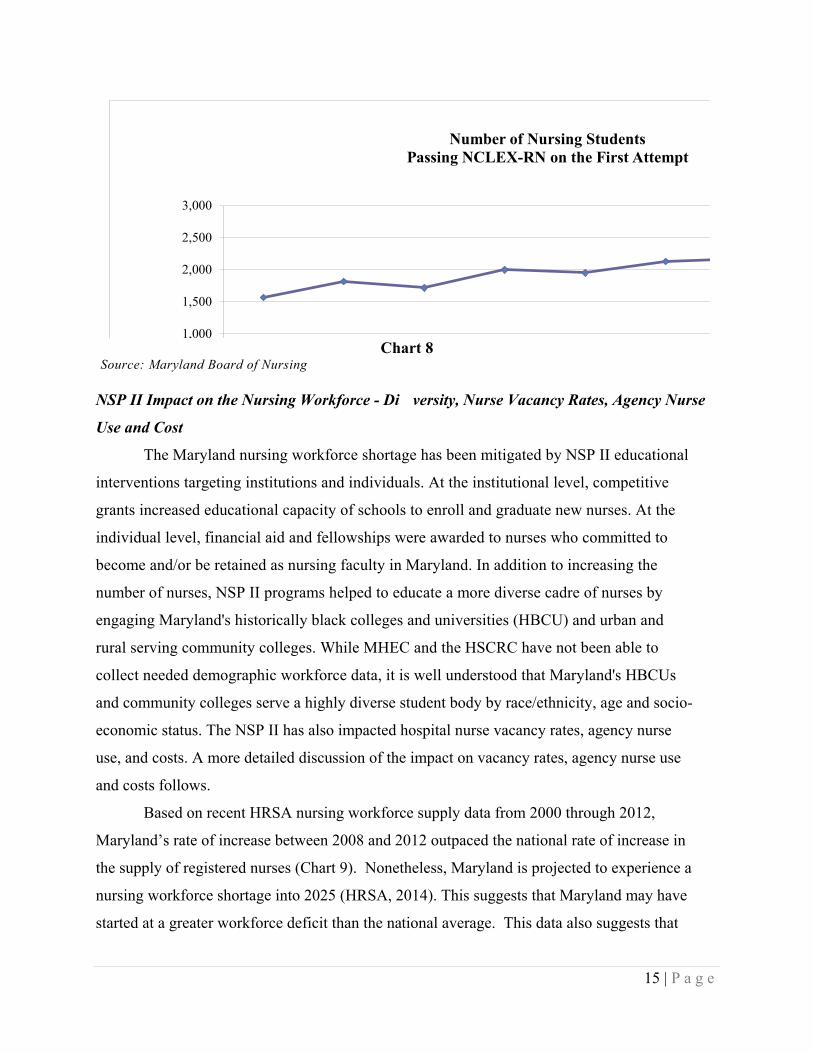
15 | P a g e
1,000
1,500
2,000
2,500
3,000
Number of Nursing Students Passing NCLEX-RN on the First Attempt
Chart 8
Source: Maryland Board of Nursing
NSP II Impact on the Nursing Workforce - Di versity, Nurse Vacancy Rates, Agency Nurse
Use and Cost
The Maryland nursing workforce shortage has been mitigated by NSP II educational
interventions targeting institutions and individuals. At the institutional level, competitive
grants increased educational capacity of schools to enroll and graduate new nurses. At the
individual level, financial aid and fellowships were awarded to nurses who committed to
become and/or be retained as nursing faculty in Maryland. In addition to increasing the
number of nurses, NSP II programs helped to educate a more diverse cadre of nurses by
engaging Maryland's historically black colleges and universities (HBCU) and urban and
rural serving community colleges. While MHEC and the HSCRC have not been able to
collect needed demographic workforce data, it is well understood that Maryland's HBCUs
and community colleges serve a highly diverse student body by race/ethnicity, age and socio-
economic status. The NSP II has also impacted hospital nurse vacancy rates, agency nurse
use, and costs. A more detailed discussion of the impact on vacancy rates, agency nurse use
and costs follows.
Based on recent HRSA nursing workforce supply data from 2000 through 2012,
Maryland’s rate of increase between 2008 and 2012 outpaced the national rate of increase in
the supply of registered nurses (Chart 9). Nonetheless, Maryland is projected to experience a
nursing workforce shortage into 2025 (HRSA, 2014). This suggests that Maryland may have
started at a greater workforce deficit than the national average. This data also suggests that
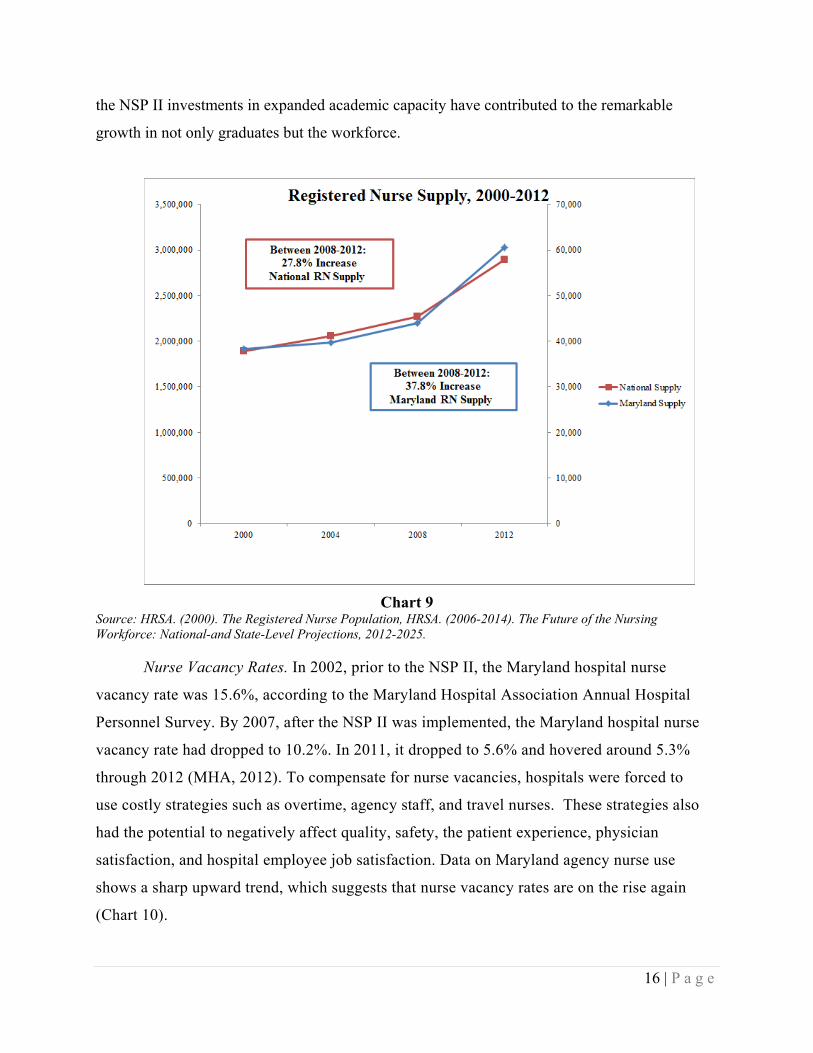
16 | P a g e
the NSP II investments in expanded academic capacity have contributed to the remarkable
growth in not only graduates but the workforce.
Chart 9 Source: HRSA. (2000). The Registered Nurse Population, HRSA. (2006-2014). The Future of the Nursing Workforce: National-and State-Level Projections, 2012-2025.
Nurse Vacancy Rates. In 2002, prior to the NSP II, the Maryland hospital nurse
vacancy rate was 15.6%, according to the Maryland Hospital Association Annual Hospital
Personnel Survey. By 2007, after the NSP II was implemented, the Maryland hospital nurse
vacancy rate had dropped to 10.2%. In 2011, it dropped to 5.6% and hovered around 5.3%
through 2012 (MHA, 2012). To compensate for nurse vacancies, hospitals were forced to
use costly strategies such as overtime, agency staff, and travel nurses. These strategies also
had the potential to negatively affect quality, safety, the patient experience, physician
satisfaction, and hospital employee job satisfaction. Data on Maryland agency nurse use
shows a sharp upward trend, which suggests that nurse vacancy rates are on the rise again
(Chart 10).

17 | P a g e
Agency Nurse Use. The NSP II appears to have had some positive impact on the
costly use of agency nurses by Maryland hospitals. Agency nurse use declined sharply
between 2008 and 2011 but is currently on the rise (HSCRC, 2014). Agency nurse use
increases costs to hospitals struggling to permanently fill positions and meet patient service
levels. Current agency nurse rates range from $55 to $78 per hour depending on area of
practice, contract status and schedule. This is a sharp contrast with the average staff nurse’s
base salary of approximately $36 to $40 per hour. Maryland hospitals vary in full time
nurses and nursing hours. In 2012, there were 22,365 RNs employed at 67 hospitals (AHA
2012). Using an average of 334 RNs, the difference in the average cost of nurse hours
between agency RNs and full time employee RNs at an average hospital could be
$16,673,280. In the three years since the NSP I evaluation report, agency nurse use has
risen substantially, due in part to hospital’s efforts to adjust to the new Medicare waiver
requirement. As nurses left positions, hospitals were more selective in hiring replacement
nurses. Furthermore, hospital nurse leaders report hiring is increasing this year, after the
contractions of services and changes within the industry in the last two years (HSCRC &
MHEC meeting, 10/27/14).
Statewide Agency Nurse Use: Costs and FTEs
Chart 10
Source: HSCRC Wage and Salary Survey
18 | P a g e
FUTURE DIRECTIONS FOR THE NSP II
Evolving Issues Impacting Maryland’s Hospital Nursing Workforce
In considering Maryland’s hospital nursing workforce needs and implications for the
possible renewal and revision of the NSP II program, several changes in the healthcare landscape
are noted. These include changes in the federal healthcare programs, best practice
recommendations from the Institutes of Medicine, the changing roles of nurses, and the increased
emphasis on quality and patient satisfaction. A discussion of the impact of these changes, the
projected job openings through 2022, potential nursing shortages, and changing demographics
will follow.
Federal Programs. In 2010, the federal Affordable Care Act (ACA) was signed into law.
It represents the most significant change to national health care laws since the 1965 enactment of
Medicare and Medicaid programs. The ACA currently provides insurance coverage to 67,000
Marylanders who previously lacked health insurance; however, this number is expected to grow.
This estimate does not include newly eligible Medicaid recipients from the expanded income
requirements, or the estimated 90,000 primary adult care eligible citizens that were not covered
for non-emergent hospital services before the ACA was enacted. The ACA will increase demand
for nurses as it strives to build a health care system that meets the national “Triple Aim” for
healthcare – better health, better care, and lower cost.
The HSCRC collaborated with the Centers for Medicare and Medicaid Services to
modernize the State’s Medicare waiver in January 2014. Hospitals now operate on value of
services model rather than a volume model. Rates are tied to improvements in the health care
quality, population health, and per-capita cost growth. As a result, unnecessary and potentially
avoidable services and procedures that formerly brought revenue now increase cost; preventative
services and primary care now become key to reducing avoidable utilization. This means that
developing strategies that help individuals stay healthy, reduce hospital readmissions, and
prevent avoidable adverse outcomes are essential in the ultimate success of the new All-payer
model. Hospital-based nurses providing interventions to improve coordinated recovery and
transition to home can make dramatic differences in care, and at the same time reduce cost. As
the largest group of health professionals, nurses have many opportunities to influence patient
outcomes. This shift also requires new training in the form of continuing education, nurse
preparation program curriculum revisions, and nurse educator knowledge.
19 | P a g e
IOM Recommendations for Nursing. In 2010, The Future of Nursing: Leading Change,
Advancing Health report was released by the Institutes of Medicine (IOM) in partnership with
the Robert Wood Johnson Foundation. The report articulated the importance of nurses in
providing safe, quality, accessible, affordable, and patient-centered care, and offered eight
recommendations for action by states. Nursing leaders in Maryland formed the Maryland Action
Coalition to promote the implementation of the recommendations as a blueprint for the nursing
profession. Since the 2010 release of the IOM report recommending an increase in the number of
BSN prepared nurses to 80% of all RNs by 2020, it has taken three years to improve from 50%
to 55%. Beginning in 2014, hospitals seeking magnet hospital recognition must have an action
plan and demonstrate progress toward achieving the 80% of nursing staff with BSN goal. The
push behind more highly educated nurses is based on recent studies that suggest higher levels of
nurse education are linked to better patient outcomes. For example, one study showed a 10%
increase in the BSN workforce proportion reduced the odds of patient mortality by 10.9%
(Yakusheva, et al., 2014).
Changing Role of Nurses and Hospital Nurses in Particular. Hospital nurses are at the
forefront of moving from practices based purely on acute care admission frameworks, towards
models based on health promotion and population health. Hospitals have or are restructuring to
provide for “whole person” health care delivery. Continuity of care across acute and chronic
conditions can be managed through a partnership among providers, payers and patients/families.
The care coordination models demonstrate improved outcomes in the acute care inpatient
settings when RN care coordinators, primary care physicians, other members of the health team
and patient/family interact openly and participate in decision-making. Collaboration between
patient and provider partners leads to better self-care management, improved functional health
and reduced readmissions. Nurses are central to care coordination for their clinical expertise,
critical thinking, and organizational skills (Hajewski & Shirey, 2014). Nurses are positioned to
coordinate transitions to home because they are the largest group of care providers, spend the
most time interacting with patients, and are integral to safe discharge planning through
identifying specific factors that may require attention within the patient’s home environment.
According to a recent survey of hospital nursing executives, over half (N=17/32; 53%) of the
respondents plan to create new nursing job classifications in the coming year. The anticipated
new roles included hiring of Care Navigator (N=9/14; 64%), Clinical Documentation Specialist
20 | P a g e
(N=9/14; 64%), Care Coordinator (N=7/14; 50%), and Quality and Patient Safety Specialist
(N=7/14; 50%) (MONE Survey, 2015).
Emphasis on Quality and Data. The Department of Health and Human Services (DHHS,
2014) reported on 2011-2012 data from the National Database of Nursing Quality Indicators
(NDNQI) on nurses’ impact on patients. Through quality focused initiatives, nurses saved $4
billion in health care spending, decreased the hospital acquired conditions by 9%, reduced
readmissions for Medicare patients by 8%, prevented 560,000 patient injuries, and saved 15,000
lives. Maryland is one of 14 states that increased the number of data points collected to be
reported nationally. The nurse sensitive quality measures link nursing services with quality of
care, patient outcomes and cost of care. The Magnet designation through the American Nurses
Credentialing Center (ANCC) recognizes hospitals for nursing excellence. Hospitals’
commitment to staffing with highly trained nurses and putting them in leadership positions
which allow them to have substantial input into patient safety issues is a benchmark for
consumers seeking care. Patient experience as measured by Maryland HCAHPS scores for CY
2012 was compared among Magnet designated and non-Magnet designated acute care hospitals.
As seen below, Magnet designated hospitals HCAHPS scores were consistently higher than non-
Magnet designated hospitals. For 2012, Magnet designated hospitals scores ranged from 1.64%
to 7.92% higher. Statistically significant differences were found for overall hospital rating,
willingness to recommend the hospital and discharge teaching indicating patients had a better
experience at a hospital with Magnet designation.
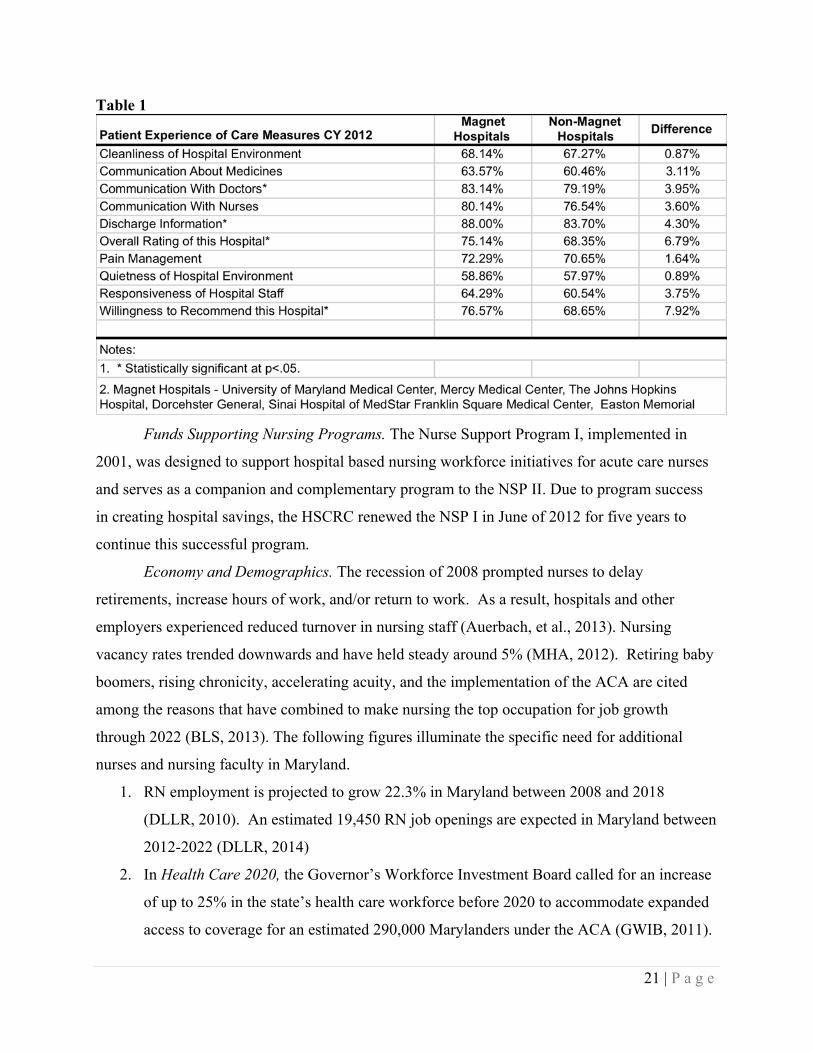
21 | P a g e
Funds Supporting Nursing Programs. The Nurse Support Program I, implemented in
2001, was designed to support hospital based nursing workforce initiatives for acute care nurses
and serves as a companion and complementary program to the NSP II. Due to program success
in creating hospital savings, the HSCRC renewed the NSP I in June of 2012 for five years to
continue this successful program.
Economy and Demographics. The recession of 2008 prompted nurses to delay
retirements, increase hours of work, and/or return to work. As a result, hospitals and other
employers experienced reduced turnover in nursing staff (Auerbach, et al., 2013). Nursing
vacancy rates trended downwards and have held steady around 5% (MHA, 2012). Retiring baby
boomers, rising chronicity, accelerating acuity, and the implementation of the ACA are cited
among the reasons that have combined to make nursing the top occupation for job growth
through 2022 (BLS, 2013). The following figures illuminate the specific need for additional
nurses and nursing faculty in Maryland.
1. RN employment is projected to grow 22.3% in Maryland between 2008 and 2018
(DLLR, 2010). An estimated 19,450 RN job openings are expected in Maryland between
2012-2022 (DLLR, 2014)
2. In Health Care 2020, the Governor’s Workforce Investment Board called for an increase
of up to 25% in the state’s health care workforce before 2020 to accommodate expanded
access to coverage for an estimated 290,000 Marylanders under the ACA (GWIB, 2011).
Table 1
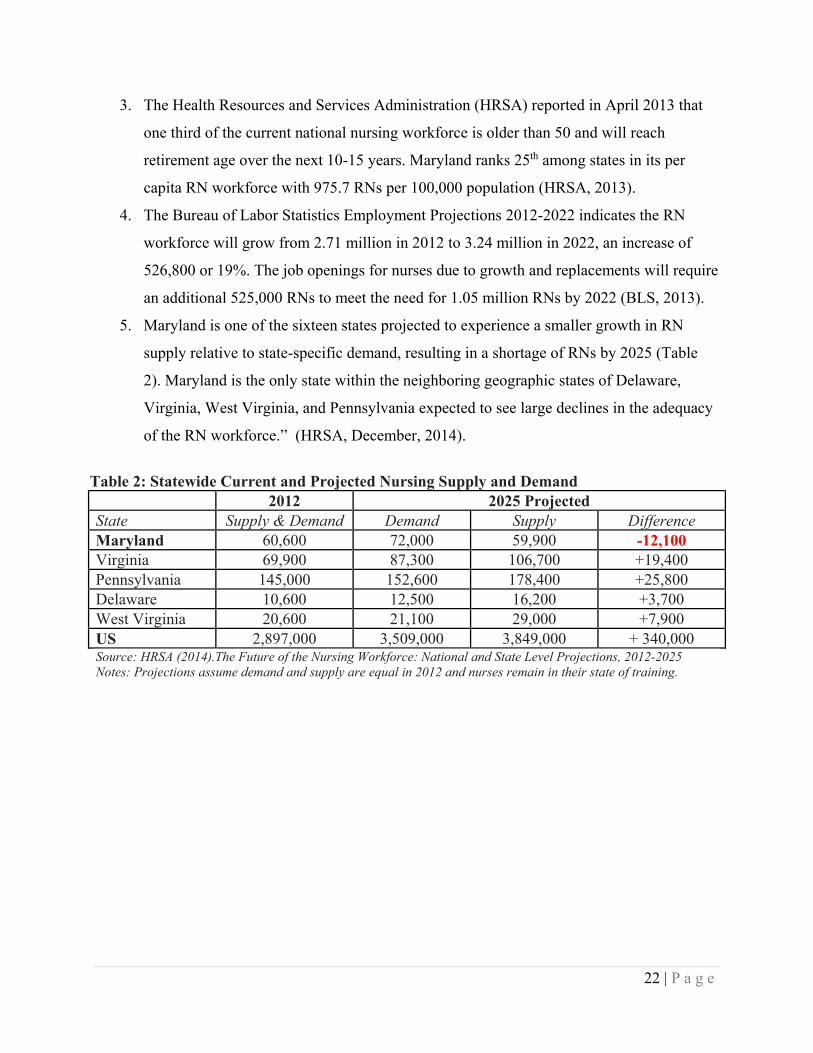
22 | P a g e
3. The Health Resources and Services Administration (HRSA) reported in April 2013 that
one third of the current national nursing workforce is older than 50 and will reach
retirement age over the next 10-15 years. Maryland ranks 25th among states in its per
capita RN workforce with 975.7 RNs per 100,000 population (HRSA, 2013).
4. The Bureau of Labor Statistics Employment Projections 2012-2022 indicates the RN
workforce will grow from 2.71 million in 2012 to 3.24 million in 2022, an increase of
526,800 or 19%. The job openings for nurses due to growth and replacements will require
an additional 525,000 RNs to meet the need for 1.05 million RNs by 2022 (BLS, 2013).
5. Maryland is one of the sixteen states projected to experience a smaller growth in RN
supply relative to state-specific demand, resulting in a shortage of RNs by 2025 (Table
2). Maryland is the only state within the neighboring geographic states of Delaware,
Virginia, West Virginia, and Pennsylvania expected to see large declines in the adequacy
of the RN workforce.” (HRSA, December, 2014).
Table 2: Statewide Current and Projected Nursing Supply and Demand 2012 2025 Projected State Supply & Demand Demand Supply Difference Maryland 60,600 72,000 59,900 -12,100 Virginia 69,900 87,300 106,700 +19,400 Pennsylvania 145,000 152,600 178,400 +25,800 Delaware 10,600 12,500 16,200 +3,700 West Virginia 20,600 21,100 29,000 +7,900 US 2,897,000 3,509,000 3,849,000 + 340,000 Source: HRSA (2014).The Future of the Nursing Workforce: National and State Level Projections, 2012-2025 Notes: Projections assume demand and supply are equal in 2012 and nurses remain in their state of training.

23 | P a g e
STAFF RECOMMENDATIONS FOR THE NSP II GOING FORWARD
Recommendation 1: Renew NSP II funding for five years, FY 2016 through FY 2020.
The NSP II has been a successful strategy for increasing and sustaining the State’s
academic capacity to produce nursing graduates while simultaneously maintaining the quality of
those graduates as indicated by NCLEX pass rates. This goal has been achieved by increasing
nursing faculty ranks through a “grow your own” program, adding new graduate level nursing
programs, creating an educator certificate to help practitioners become effective nursing
teachers, and by providing the necessary academic support and financial aid to attract nurses to
graduate level education. At the same time, undergraduate programs including ADN to BSN
programs have been implemented to ensure a strong supply of entry level nurses into the
workforce.
Even so, with today’s healthcare landscape it is unclear that nursing workforce demands
have been met. In fact, based on the considerations outlined in the evolving issues section above,
data suggest the need for more highly trained nurses will continue to escalate which in turn will
challenge nurse preparation programs to update curriculum, offer innovative instructional
delivery, and increase enrollments. According to a sample of 50% (n=13) of Maryland Nursing
Programs’ 2012 reports, 1,120 qualified nursing applicants are still turned away due to
enrollment limits (Maryland Deans and Directors, 2014). The NSP I, which was recently
renewed, supports ongoing education for staff nurses with the goal of increasing nursing quality
placing further pressure on nursing education programs. Therefore, MHEC and HSCRC jointly
propose to renew the NSP II funding up to 0.1% of hospital regulated gross patient revenue for five
years, FY 2016 through FY 2020, with the following recommendations.
Recommendation 2: Establish a work group to develop specific goals for a competitive institutional grant program and statewide initiatives based on IOM recommendations.
Assuming a renewal for the NSP II, the program content of a new NSP II Phase 2 should
be changed to address the evolving needs of hospitals and healthcare providers in Maryland. In
developing revised and possibly new NSP II programs, it is imperative to take the changes in
healthcare, as noted in the previous sections, into account. The ACA, in particular will have
significant impact on the role of nurses in hospitals (and other settings) as hospitals move toward
care coordination and improving health management models. Furthermore, selected
24 | P a g e
recommendations from the IOM can serve as guidelines to enhance the quality of care. The key
messages in the IOM report suggest that states should strive to 1) Improve education systems so
that they promote seamless academic progression across broadly independent community college
systems and university systems for nurses to achieve higher levels of education and training; and
2) Engage in effective workforce planning and policy making that requires better data collection
and an improved information infrastructure. We recommend that although the program should
still contain competitive institutional grants and statewide initiatives, the goals and initiatives
should be updated to address these issues. These new goals should be set through a collaborative
workgroup established by the HSCRC and MHEC.
Recommendation 3: Adopt goals and metrics that address the following Institutes of Medicine (IOM) recommendations: #4, #5, #6, & #7
The following IOM Recommendations should serve as drivers for a new NSP II Phase 2.
IOM Recommendation #4: Increase the proportion of nurses with a baccalaureate degree
to 80 % of all RNs in the workforce. As reported above, Maryland nursing programs are
expanding enrollments and graduates, but the number of seats available in RN-BSN programs is
unclear. A concerted effort in the Competitive Institutional Grants needs to be directed through a
specific initiative to address the 58% of Maryland’s new nurse graduates with Associate
Degrees. Meeting the goal of 80% BSN by 2020 will take seamless academic progression. NSP
II has funded several models for dual enrollment to assist students in connecting with a
university BSN program while enrolled in the community college. Metrics need to be developed
to track the number of RN-BSN completions and the number of RN-BSN openings across
Maryland. At present, graduations are not always identified as either new undergraduate BSN or
RN to BSN completions. Efforts to increase BSN prepared nurses should take into consideration
strategies to increase the diversity of the nursing workforce in race/ethnicity, gender and
geographic distribution. NSP II statute clearly supports increasing underrepresented groups in
nursing to more closely mirror the population for whom they provide health services.
IOM Recommendation #5: Double the number of nurses with a doctorate by 2020. Adding
to the cadre of nurse faculty, nurse researchers and advanced practice nurses is important to the
future of the nursing workforce. A broad goal is ensuring at least 10% of all BSN graduates
matriculate into a master’s or doctoral level program within five years of graduation. Continued
funding for scholarships for tuition and all fees, faculty fellowships and grants for educational
25 | P a g e
loan repayments, and completion of doctoral dissertations are key to maintaining the growth in
graduate programs reflected in this report. Identifying promising undergraduates at earlier career
points and guiding them into faculty roles is a specific goal for faculty as they mentor the
younger generation of nurses.
IOM Recommendation #6: Ensure that nurses engage in lifelong learning. Academic
administration should provide support for all nursing faculty members to participate in
continuing professional development. Demonstrations of educational excellence include
obtaining and maintaining credentials and evidence of competence in practice, teaching and
research. Foster a culture of lifelong learning and provide resources for inter-professional
education.
IOM Recommendation #7: Prepare and enable nurses to lead change to advance health.
Nursing education programs and nursing associations should prepare the nursing workforce to
assume leadership roles across all levels. Healthcare decision makers should make room for
nurses on boards and commissions to help make health decisions.
Recommendation 4: Purchase software to manage and report on outcomes data.
There are several administrative and operational issues to be considered as part of the
administration of a new NSP II Phase 2. These recommendations stem from “lessons learned” in
the administration of both the NSP I and NSP II, as well as emerging needs for evidence based
practice in nursing education and workforce outcomes. One way to address some of these issues
may be through a small competitive research grant program. Outcomes measures and data
management are critical to making informed policy and programmatic decisions. In addition,
software tools are needed to manage and analyze a high volume of outcomes data from the NSP
II (and NSP I) projects. An investment in such software could also improve staff productivity by
increasing ease of analysis and reporting.
Effort must be made to identify metrics that link the ”Triple Aim” with nurse sensitive
measures and nursing workforce programs to demonstrate the connection of nursing
professionals with population health delivery. Over the last 3 years, several multi-hospital studies
added substantial support for a hospital-level association of nurse educational levels with patient
outcomes. It was found that hospitals with a 10% higher BSN proportion had a 4%–7% lower
30-day mortality, reduced complication rates and better outcomes on length-of-stay (LOS),
26 | P a g e
measures of failure to rescue, congestive heart failure mortality, pressure ulcers, postoperative
deep vein thrombosis or pulmonary embolism (Yakusheva, et al., 2014). MHEC and the
HSCRC should investigate and possibly purchase the Efforts to Outcomes software or some
similar software for the evaluation of NSP II over the next five year period.
Recommendation 5: Review current NSP II statute, particularly the term “bedside nurses” to ensure that it meets the move toward a coordinated care model.
Determine whether amended statutory language needs to be submitted to the Governor
and Legislature particularly the definition of “bedside nurses” given the shift towards
coordinated care approaches. The relevant statute is found at General Assembly Education
Article, Section §11-405.
CONCLUSION
The NSPII program has been successful in improving the pipeline for nurses and
reducing the need for hospitals to depend on expensive nurse staff agencies. However, a
combination of the recovery in the economy, the implementation of the Affordable Care Act, and
the recent approval of the new All-payer model in Maryland, nursing functions and demands are
changing. The NSP II program can be one tool to help Maryland alter its nurse workforce to
meet these new demands. During the course of this evaluation, it became clearly evident that
there is a continued need for coordinated nursing related data.
Recommendations in two key reports in 2011, Health Care 2020 and the Sunset Review:
Evaluation of the State Board of Nursing, focused on improved nursing data infrastructure in
Maryland. The current Maryland Longitudinal Data System for education may serve as a model
for this type of coordinated data collection. Although there was much discussion on IOM
Recommendation 8 (build an infrastructure for the collection and analysis of inter-professional
health care workforce data), this was not an issue that the NSP II can tackle alone. While outside
the scope of the NSP II, but nonetheless related to its work, the State should charge agencies
within the state such as DHMH, MBON, MHEC, DLLR and GWIB to determine the best
method of addressing data infrastructure. It represents a larger need within health workforce
management and should be reviewed by a task force composed of representatives from multiple
agencies and organizations.

27 | P a g e
REFERENCES
American Hospital Association (2012). AHA Annual Survey. Received September, 2014. Allan, J., Crowley, C., Ports, S., & Aldebron, J. (2010). Developing a statewide solution to the faculty shortage in Maryland. Journal of Nursing Regulation, 1(3), 15-19. Auerbach, D.I., Staiger, D.O., Muench, U. & Buerhaus, P.I. (2013). The nursing workforce in an era of health reform. New England Journal of Medicine, 368(16), 1470-1472. Doi: 10.1056/NEJMMpl301694. Governor’s Workforce Investment Board (November, 2011). Preparing Maryland’s Workforce for Health Reform: Health Care 2020. Accessed at http://www.gwib.maryland.gov/pub/healthreformcare2020.pdf Hajewski, C. & Shirey,M. (2014). Care coordination: a model for the acute care hospital setting. Journal of Nursing Administration, 44(11), 577-85. Health Services Cost Review Commission, Maryland’s All Payer Hospital Payment System, Executive Summary, Dr. Hal Cohen. Accessed at http://www.hscrc.state.md.us/documents/HSCRC_PolicyDocumentsReports/GeneralInformation/MarylandAll-PayorHospitalSystem.pdf Health Services Cost Review Commission, Wage and Salary Report 2014. Heller, B & Sweeney, D. (2003. Maryland’s Nursing Shortage: A Workforce Crisis. Center for Health Workforce Development, University of Maryland, Baltimore, M.D. Accessed at http://www.scribd.com/doc/99152/Nursing-Shortage Institute for Health Care Improvement, IHI Triple Aim, Accessed at http://www.ihi.org/Engage/Initiatives/TripleAim/Pages/default.aspx
Institute of Medicine. (2010). The Future of Nursing: leading change advancing health. Washington, DC: The National Academies Press.
Maryland Board of Nursing (2013). NCLEX Pass/Fail Rates by Education Program in the State of Maryland. Accessed at http://www.mbon.org/education/nclex_rn_stats_fy13.pdf Maryland Department of Labor, Licensing and Regulation, Healthcare Practitioners and Technical Occupations- Maryland Occupational Projections-2012-2022. Accessed at http://www.dllr.state.md.us/lmi/iandoproj/occgroup29.shtml Maryland Higher Education Commission (2014). Nurse Support Program II. Accessed at http://www.mhec.state.md.us/Grants/NSPII/NSPII.asp Maryland Hospital Association, Annual Hospital Personnel Survey Report, CY 2012.

28 | P a g e
Maryland Organization of Nurse Executives, Workforce Survey, completed January 5, 2015 Nurse Support Program II Advisory Group, meeting at HSCRC on October 27, 2014, personal communication of members with HSCRC and MHEC staff on nursing data and implications. Median Salaries for Nursing Positions in Maryland. Salary.com Accessed at Sunset Review: Evaluation of the State Board of Nursing (October, 2011). Maryland Department of Legislative Services, Office of Policy Analysis, Annapolis, Maryland. Accessed at http://dls.state.md.us/data/polanasubare/polanasubare_sunrev/Full-Nursing-2011.pdf Salary.com Salary Wizard - Do you know what you're worth? (2015, January 7). Retrieved from http://swz.salary.com/SalaryWizard/Asst-Professor-Nursing-Salary-Details-Baltimore-MD.aspx?&yearsofexperience=0 Salary.com Salary Wizard - Do you know what you're worth? (2015, January 7).Retrieved from http://swz.salary.com/SalaryWizard/Staff-Nurse-RN-Salary-Details-Baltimore-MD.aspx?&yearsofexperience=0 The Maryland Nursing Program Capacity Study (2006) Maryland Higher Education Commission and Maryland Board of Nursing, Report requested by Senate Bill 511. Accessed at https://www.mhec.state.md.us/publications/nursecapstud1006.pdf U.S. Department of Health and Human Services, Health Resources and Services Administration, National Advisory Council on Nurse Education and Practice. The Impact of the Nursing Faculty Shortage on Nursing Education and Practice. Rockville, Maryland. 2010. http://www.hrsa.gov/advisorycommittees/bhpradvisory/nacnep/Reports/ninthreport.pdf U.S. Department of Health and Human Services, Health Resources and Services Administration, National Center for Health Workforce Analysis. The Future of the Nursing Workforce: National- and State-Level Projections, 2012-2025. Rockville, Maryland, 2014. http://bhw.hrsa.gov/healthworkforce/supplydemand/nursing/workforceprojections/nursingprojections.pdf U.S. Department of Health and Human Services. Health Resources and Services Administration, The Registered Nurse Population, Findings from the 2008 National Sample Survey of Registered Nurses, September, 2010, Rockville, Maryland. 2010 http://bhpr.hrsa.gov/healthworkforce/rnsurveys/rnsurveyfinal.pdf U.S. Department of Health and Human Services, Health Resources and Services Administration, Bureau of Health Professions, National Center for Health Workforce Analysis. (2013). The US Nursing Workforce: Trends in Supply and Education. Washington, D.C. Accessed at http://bhpr.hrsa.gov/healthworkforce/reports/nursingworkforce/nursingworkforcefullreport.pdf
29 | P a g e
U.S. Department of Health and Human Services (May, 2014). New HHS Data Shows Major Strides Made in Patient Safety, Leading to Improved Care and Savings, Accessed at http://innovation.cms.gov/Files/reports/patient-safety-results.pdf U.S. Department of Labor, Bureau of Labor Statistics, Occupational Outlook Handbook, Registered Nurses, 2012-2022. Accessed at http://www.bls.gov/ooh/healthcare/registered-nurses.htm Yakusheva, O., Lindrooth, R. & Weiss, M. (2014). Economic evaluation of the 80% baccalaureate nurse workforce recommendation: a patient-level analysis. Medical Care, 52(10), 864-869.
January 6, 2015 Steve Ports Deputy Directory, Policy and Operations Health Services Cost Review Commission 4160 Patterson Avenue Baltimore, Maryland 21215 Dear Mr. Ports: On behalf of the 64 members of the Maryland Hospital Association (MHA), we appreciate the opportunity to comment in support of the Nurse Support Program II (NSP II) Outcomes Evaluation FY 2006 – FY 2015 and Recommendations for Future Funding. Since its inception, NSP II has positively impacted nursing programs by expanding capacity and supporting student success. MHA’s Who Will Care? Fund for Nurse Education, established in 2006, shared these goals and worked to double the number of RN graduates in Maryland. Despite these investments and significant achievements, we know that the nursing workforce shortage in Maryland is not fully resolved. According to the Health Resources and Services Administration, Maryland currently ranks 25th among states in its per capita RN workforce. Maryland’s modernized waiver committed our hospitals to leading the nation and achieving the elusive Triple Aim of healthier communities, better care, and lower costs. If it is successful, Maryland’s system will serve as a model for the nation; accordingly, our investment in the health care professionals who are integral to our success should match our commitment to these goals. We must develop and invest in programs that keep individuals healthy, reduce hospital readmissions, improve patient experience of care, and prevent avoidable complications. We were pleased to see staff’s recognition of the need to prepare nurses for work involving population health, including patient centered medical home models, home care, care management, nursing homes, and other care settings. In order to ensure that the transformation efforts continue to progress, we believe it is necessary to continue to support these vital health care professionals as they work to meet the needs of a dynamic and evolving health care delivery system. Thank you for the opportunity to comment on this recommendation. If you have any questions, please contact me. Sincerely, Nicole Dempsey Stallings Vice President, Policy & Data Analytics
Gateway to Service 7600 FLOWER AVENUE, TAKOMA PARK, MD 20912 P 301-891-4005 F 301-891-4167 WWW.WAU.EDU
December 22, 2014 John Colmers Health Services Cost Review Commission 4160 Patterson Avenue Baltimore, MD 21215 Mr. Colmers: Washington Adventist University (WAU) is a proud recipient of Nurse Support Program II (NSP II) funding. Funding from this program has enabled WAU to increase the number and diversity of didactic and clinical faculty, as well as the number and diversity of nursing graduates. Programmatic funding resulted in a partnership between the University and Dimensions Healthcare System and Doctor’s Community Hospital. WAU writes this letter in support of the continuation of the Nurse Support Program. Since 1904, the nursing program at Washington Adventist University (formerly Columbia Union College) has delivered undergraduate nursing instruction. NSP II Program funding has allowed the institution to: 1. increase the qualifications of beside RNs 2. provide mentoring support and financial assistance to RNs enrolled in both BSN and MSN programs, and 3. increase the number of didactic and/or clinical nursing faculty As a grant recipient that has benefited significantly from NSP II funding, it is difficult to imagine the impact of a lack of funding to the NSP II program. Funding through this program has enabled programs, such as ours to help address the nursing shortage in the State of Maryland. It is our hope that funding support will continue for the Nurse Support Program II so that nursing programs throughout the State of Maryland will have the opportunity to shape the future of the nursing workforce. Karen Benn Marshall Karen Benn Marshall, Ed.D. Dean, School of Health Professions, Science and Wellness


10901 Little Patuxent Pkwy. Columbia, MD 21044-3197
443-518-1000 MD Relay – 711
www.howardcc.edu
January 5, 2015 Mr. John Colmers, Chairman Health Services Cost Review Commission 4160 Patterson Avenue Baltimore, Maryland 21215 Dear Mr. Colmers, I am writing today to express my support of continued funding for NSPII through FY2020. The NSP II grants have been instrumental in the development of pathways for academic progression and increasing the number of registered nurses in Maryland. The Nurse Education Program at Howard Community College is a recipient of a competitive institutional grant to develop a Military to Associate Degree Nursing Pathway Sequence. This project is designed to increase the number of registered nurses at the bedside by creating a Military to ADN Pathway Sequence that capitalizes on the healthcare training and vast experiences of the medics and corpsmen. This initiative is projected to increase enrollment into the associate degree nursing program by up to 16 students annually. Continued funding will help nurse educators to offer nursing programs that meet the needs of the community and provide for an educated workforce. Thank you. Sincerely,
Patricia A. Sipe, RN, M.Ed., CNE Director, Nurse Education Program Professor, Nursing Howard Community College 443-518-4985 [email protected]
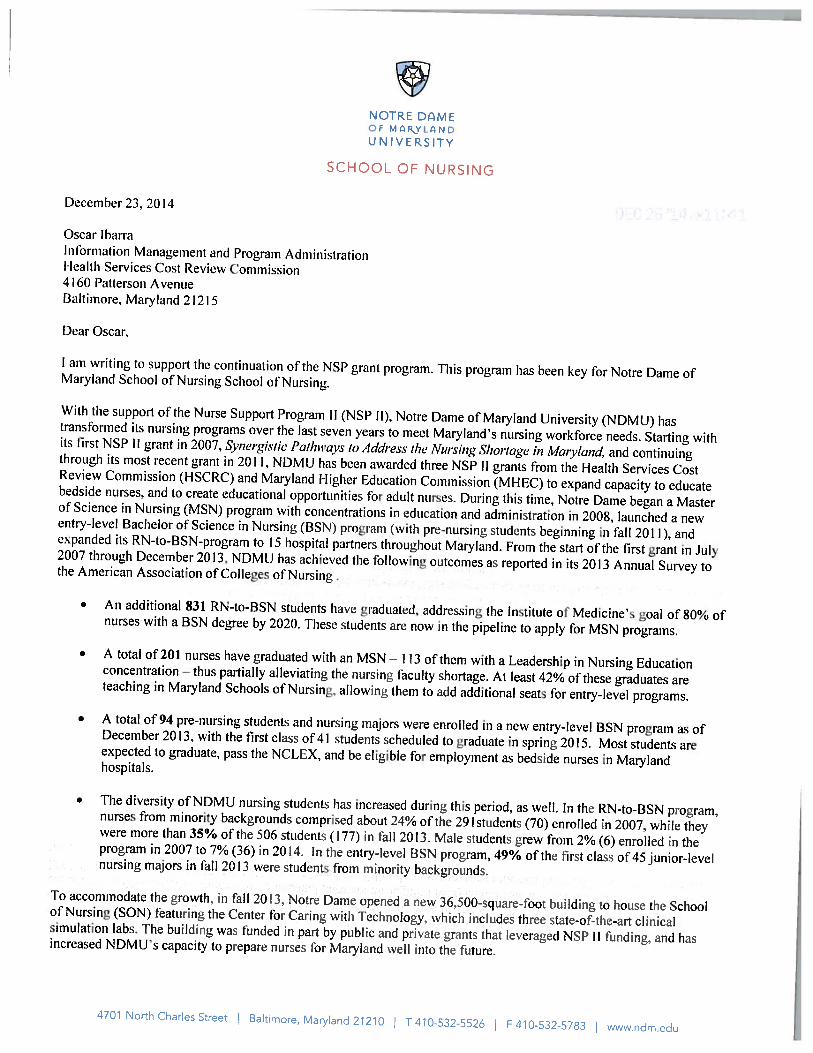
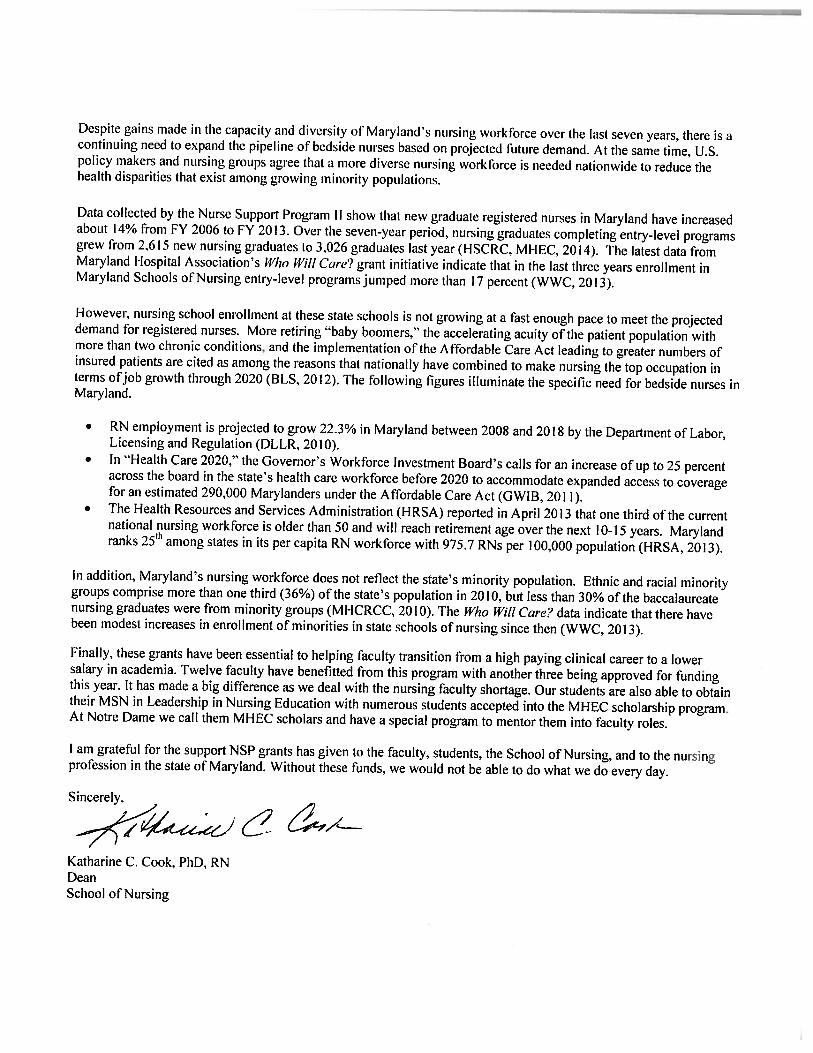

January 7, 2015 John Colmers, Chairman, HSCRC 4160 Patterson Avenue Baltimore, MD Dear Mr. Colmers,
Anne Arundel Community College would like to express its ongoing support for the NSP II program. Thanks to the previous grants received, the nursing program has been able to expand its simulation capabilities and retention initiatives to assist students in their success. We have increased our enrollments over the last 8 years by 42% and the grants received have enabled us to continue our success as demonstrated by our high NCLEX pass rates and improving graduation rates.
Anne Arundel Community College is committed to educating
nurses for the future of Maryland’s health and we feel that continuation of the NSP II program provides institutions with funds to expand and improve our capabilities.
Sincerely, Beth Batturs Martin, RN, MSN Director of Nursing and Healthcare Initiatives Anne Arundel Community College 101 College Parkway Arnold, MD 21012 [email protected] 410-777-7352
December 6, 2014 To: Mr. John Colmers, Chairman Health Services Cost Review Commission (HSCRC) From: Judith E. Stetson, Ph.D., RN. Director of Chesapeake College/MGW Nursing Re: Support for Continuation of Nurse Support Program II (NSP II) I am writing in full support of continuing the efforts made possible through the HSCRC Nurse Support II Program (NSP II). These funds have had a major positive impact on the entire nursing community at state and local levels. As Director of Nursing at a small community college serving five counties on the eastern mid-shore region of Maryland, I welcome the opportunity to share specifically how the generous funding has benefited our program. Funding provided a full time retention specialist and many resources to support student success. For example, funds were utilized to purchase a software package developed by Unbound Medicine to place information related to pharmacology, illnesses, signs and symptoms, teaching plans and the latest research literally at the students’ fingertips. The program also flagged essential information that students could expect to find on the NCLEX exam. The program provided students with an excellent resource to acquire, manage and share essential nursing knowledge. Retention rates in the program improved from 50% to 76% over the five year period of the grant. NCLEX first time pass rates over the period of the grant were stable between 90% and 97.6%. Equally significant is the positive impact NSP II funds have had on our nursing faculty. We have a total of 9 full – time nursing faculty. Over the course of the grant period, six full-time nursing faculty received “New Nurse Faculty Fellowships.” The purpose of that funding was to recruit talented young nurses into the educator role and off-set the large number of nurse educators near retirement age. The average age of nursing faculty at Chesapeake College has decreased while ethnic diversity among our faculty has increased. In addition, NSP II funds have made it possible for four of our full time faculty to pursue their education at the doctoral level. Currently, two of the nine full-time nursing faculty have earned doctoral degrees. In the next two years, it is projected that six of our nine full time faculty (66%) will be prepared at the doctoral level. This academic progression significantly benefits the particular individual, the entire profession and most importantly, health care in the global community. In summary, the efforts of NSP II are timely and visionary. I fully support continuing this initiative, and offer support on behalf of the entire Chesapeake College/MGW Nursing Program. Chesapeake College highly values the partnership we shared with NSP II, and deeply appreciates the many benefits these funds have provided our students and our program.


HENSON SCHOOL OF SCIENCE AND TECHNOLOGY Department of Nursing Salisbury, MD 21801
410-543-6401 TTY 410-543-6083 FAX 410-548-3313
November 26, 2014
Mr. John Colmers, Chairman Health Services Cost Review Commission 4160 Patterson Avenue Baltimore, Maryland 21215 Dear Mr. Colmers, I am writing on behalf of the Department of Nursing at Salisbury University in support of the continuation of the NSP-II programs. The NSP-II programs have been instrumental in recruitment and retention of new nurse faculty to support expanded enrollments in our accelerated 2nd BS degree program and the development and launch of our DNP program, the only one located on the Eastern Shore of Maryland and the first post-BS to DNP entry option in the State of Maryland. Eight new nursing faculty have been supported by the New Nurse Faculty Fellowship (38% of our faculty), and three have received Nurse Educator Doctoral Grants expediting completion of their doctoral education. The NSP-II program has also funded several institutional grants including a collaborative with two area hospitals (Peninsula Regional Medical Center and Atlantic General Hospital) to create shared hospital clinical faculty positions moving clinical experts into positions as educators with responsibilities for teaching students and staff. We were also the recipients of a second institutional grant collaborative with Chesapeake and Sojourner-Douglass Colleges to develop the Eastern Shore Faculty Academy and Mentoring Initiative. This project trains expert bachelor’s prepared registered nurses to become part-time clinical faculty using online instruction, simulations and mentoring activities. To date, thirty nine new part-time clinical faculty have graduated from the Academy and are prepared for teaching assignments with one of the partner schools. Finally, we received a generous NSP-II grant to expand the availability of doctoral education in nursing to those on the Eastern Shore and throughout Maryland. As a result of this grant, we were able to launch our post-MS to DNP in Fall 2012 and our post-BS to DNP in Fall 2014, all in a distance accessible format with very limited trips to campus. We will graduate nine new DNPs in May 2015, two of whom are also completing requirements for certification as family nurse practitioners. All of these initiatives have been aimed at addressing the nursing shortage in Maryland, through creating new roles in education, increasing the supply of part-time clinical faculty, and increasing availability and access to doctoral education. Each of these projects has connected directly to increased student enrollments and graduations, at both the undergraduate and graduate levels. None of the projects would have been
HENSON SCHOOL OF SCIENCE AND TECHNOLOGY Department of Nursing Salisbury, MD 21801
410-543-6401 TTY 410-543-6083 FAX 410-548-3313
possible without the NSP-II program. It is a forward-thinking program that has benefitted the citizens of the State immeasurably. As you know, the “gray tsunami” has not yet arrived so our needs for highly qualified registered nurses in Maryland will only continue to grow. I heartily endorse continuation of the NSP-II program and hope you will too-it is vital to our ability to respond to the workforce needs of the State.
Sincerely,
Lisa A. Seldomridge, PhD, RN Chair and Professor of Nursing Salisbury University Salisbury, Maryland [email protected]
CC: [email protected].
Office of the Dean
655 West Lombard Street
Suite 505
Baltimore, MD 21201
410706 6741
www.nursing.umaryland.edu
November 14, 2014 John Colmers Chairman, Health Services Cost Review Commission 3910 Keswick Road Suite N-2200 Baltimore, MD 21211 Dear Chairman Colmers,
As Dean of the University of Maryland School of Nursing (UMSON), I would like to take this opportunity to
thank the Health Services Cost Review Commission and the Maryland Higher Education for the funding
support provided to our faculty and students through the Nurse Support Program II (NSPII). To date, our
School of Nursing has been awarded over $10.6 million in funding to support new educational programming,
clinical site expansion, and faculty development initiatives. We are especially proud of the impact that the
current funding has had on nursing education at our School and our ability to increase the pipeline of nurses
who hold a baccalaureate degree or higher. But more remains to be done.
The Affordable Care Act, described as the biggest overhaul of the U.S. health care system since the passage of
Medicare and Medicaid in 1965, is aimed at increasing health care coverage to all Americans while also cutting
costs and improving efficiency of the country’s health care system.
Its success may well depend on nurses. We need to know how we can be part of the solution to achieve
better patient outcomes at a more reasonable cost. We need to do more to prevent disease; provide chronic
care management to an aging, sicker, and more diverse population; and offer end-of-life care that emphasizes
comfort and compassion. Across all settings, we must do more to prepare ourselves for the future.
Nursing has a central role to play in realizing the promise of health reform—a transformed health system that
provides wide access to essential health services while improving quality and controlling costs. Simply put,
these national goals cannot be achieved without maximizing the contributions of nurses.
There are ongoing and future needs for a well-educated nursing workforce, including faculty. We need to
continue to emphasize the need for doctorally-prepared nursing faculty. The evolving nursing shortage, the
greying of the nursing faculty, and a large “brain drain” of experienced faculty expected in the next 5-10 years
as retirements dramatically increase (those who stayed during the recent economic downturn are now
seriously ready to retire!) are all reasons we need to have well-educated nursing faculty to prepare the next
generation of nurses who will care for populations, communities, individuals and families within the new
models of care delivery. This education should span initial academic preparation for teaching as well as
ongoing professional development of current faculty to assure currency with contemporary educational
practices and to optimize maximizing of technologic resources to support learning.
It appears that although the NSP II grants were originally conceptualizing bedside nursing to hospital based
nursing, there is now an opportunity to potentially broaden future funding to go across the care continuum,
from population/community to ambulatory to hospital to nursing homes and beyond.
As you evaluate the current NSPII Program, I would like to respectfully offer some suggestions for future areas
of focus for NSPII funding:
Advancing nurse led care coordination across the continuum. Care coordination is central to training
BS, CNL and advanced practice students.
Support for education at the DNP advanced practice level with a focus on primary care (including
mental health). For example, 1) funds to secure optimal primary care clinical rotations which are critical
to capacity building in the FNP, PNP and AGPCNP programs and 2) funds to recruit and retain faculty in
those programs.
Support for academic/clinical practice partnerships (in particular practice focused faculty positions at
the RN and NP level) to increase clinical learning sites.
Support to start a nurse managed health center for the purposes of clinical education at all levels
(focusing on issues needed to support the Maryland Medicare Waiver… transitions, chronic disease, care
management, population health).
Development of an educational focus on care management and care coordination either within the
CPH curriculum or the HSLM curriculum; as a certificate program; or as a focus area in the post-master’s
DNP program.
Focusing part of the NSP call on clinical simulation as an avenue to increase capacity. The recent
outcomes from the National Council of State Boards of Nursing’s s longitudinal multi-site study on the
efficacy of simulation as a replacement for traditional clinical hours.
Promoting care collaboratives between academic and clinical partnerships to focus on improving nurse
sensitive outcomes, transitions of care and nursing processes.
Initiatives that include preparation for teaching as part of doctoral programs in nursing.
Health promotion and disease prevention by (a) supporting doctoral level nursing education for
population health care (community and public health) and primary care for underserved, and (b)
supporting systems which hire doctorally-prepared community/public health and primary care nurses
through faculty practice arrangements in which faculty will precept doctoral students in these roles.
Opportunities for interprofessional learning and practice.
Thank you for this opportunity to comment.
Sincerely,
Jane Kirschling, PhD, RN, FAAN Dean and Professor, School of Nursing University Director Interprofessional Education University of Maryland, Baltimore
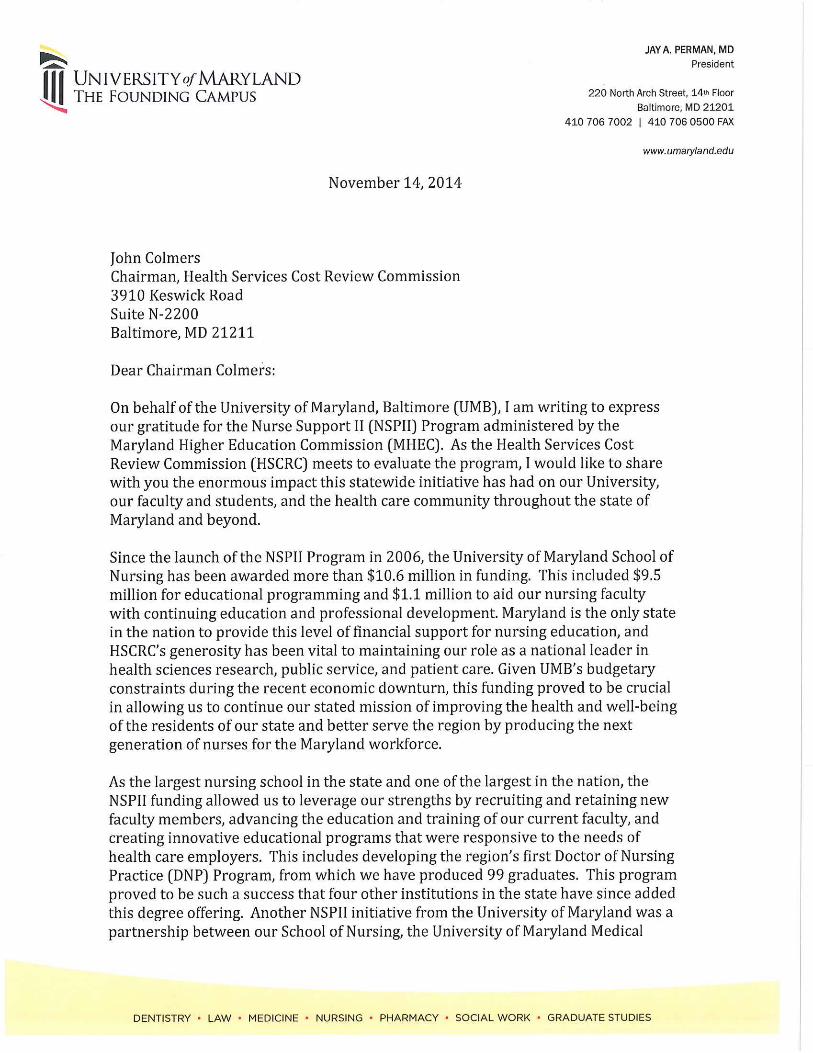

Staff Comments Regarding MHA Letter Requesting a Mid-Year Rate Increase
Overview Maryland Hospital Association has requested an across the board rate increase for Maryland Hospitals effective January 1, 2015. This amount is requested to support additional infrastructure investments of hospitals to advance the changes that will be required for the success of the All Payer Model that was initiated on January 1, 2014.
HSCRC Rate Setting Since the Initiation of the All Payer Model By July 1, 2014, all hospitals had entered into a global budget agreement with HSCRC. These agreements provide a stable revenue base for hospitals, assuring that the maximum revenue growth requirement can be assured and that hospitals will be able to reinvest savings accrued under the Model.
Effective July 1, 2014, the HSCRC approved a rate increase that provided a full inflation update to hospitals of 2.41%1, a population adjustment, an infrastructure adjustment for global budget hospitals2 of .325% (for a total of .65% including the adjustment provided at the time of initiating the global budget) and a reduction for readmissions savings of .2%. The opening of Holy Cross Germantown Hospital is also expected to increase hospital revenues in the State by an estimated .4% for the year. In total, this provided approximately 3.67% in expected revenue increases, prior to considering any unforeseen adjustments. Offsetting these increases were two reductions-- a reduction of .45% related to reducing the MHIP assessment effective October 1, and a net reduction in uncompensated care of approximately .64%. (The uncompensated care adjustment reflected a 1.02% reduction in expected uncompensated care due to increased enrollment in Medicaid partially offset an increase of .38% based on hospitals' actual 2013 uncompensated care levels over 2012 levels.)
The approved increase was within the all payer revenue growth limit and also within a range that could result in savings to Medicare, based on national Medicare hospital growth projections per beneficiary obtained from the Office of the Actuary.
Analysis Performance Monitoring HSCRC staff has been monitoring performance under the All Payer Model, including:
• Hospital financial performance 1 Unlike prior years, there was no offset for expected productivity improvement, because hospitals would be expected to reduce utilization, thereby creating savings for consumers and purchasers 2 Total Patient Revenue hospitals did not receive an infrastructure adjustment, but were provided an incentive for adopting the model at the time of initiation of their agreements.

• All Payer revenue increases • The impact of Medicaid and other enrollment expansion under ACA • Performance relative to quality improvement targets • Hospital utilization levels
Hospital financial performance has improved and operating margins for FY 2014 averaged 2.52% percent. For FY 2015, operating margins have averaged 2.67 percent through November 2014. These performance levels are an improvement relative to recent levels of profitability. All Payer revenue is within model limits and quality is improving, although hospitals are falling short of the readmission reduction targets that were set for the calendar year 2014 by HSCRC. HSCRC staff has been monitoring the impact of the expansion of ACA. Based on our evaluation of the reduction in self pay and charity revenues, hospitals are overfunded for uncompensated care since coverage is well beyond the amount included in the uncompensated care offset. However, there is a "pop up" in utilization that may be attributed to the expansion. HSCRC staff is currently analyzing the extent of the increase and will continue to monitor whether it is a temporary increase representing pent up demand or of a more permanent nature. Staff is also focused on hospital utilization trends, including factors that may be epidemic in nature. While we were informed that there may be requirements to fund Ebola costs, we have not yet been presented with any such requests. Influenza has the potential to drive admissions and costs above expected levels. Staff is monitoring reports of the Center for Disease Control. Influenza for 2014-2015 is above 2013-2014 levels to date, on par with 2012-2013 levels. Hospitals benefitted from lower influenza levels in FY 2014 under their global budgets. HSCRC staff will continue to track influenza levels and monitor the impact on hospital utilization. It is too early to tell what, if any, relief hospitals will need for influenza burden.
Monitoring of Medicare Savings Staff has been working with Center for Medicare and Medicaid Innovation (CMMI) staff to obtain Medicare performance reports. CMMI reports hospital payments and beneficiaries on a monthly basis, but these reports have the expected lag of about three months due to claims processing timelines. HSCRC was recently granted a data use agreement (DUA), that will allow verification and analysis of these reports. On December 17, the State approved a contract with a third party vendor to help HSCRC staff conduct this analysis. Based on approved rate levels for FY 2014, HSCRC staff expected favorable performance relative to Medicare for January through June of 2014. The July through December performance levels versus Medicare are uncertain, with the rate increase that occurred July 1 for Maryland hospitals and the inpatient rate decrease that occurred for Medicare effective October 1. By the end of March 2015,
HSCRC staff expects to see relatively complete claims data from Medicare. Staff will be initiating work with contractors in January to evaluate the data CMMI has provided.
Infrastructure Requirements Maryland Hospital Association has suggested a .75% across the board rate increase for infrastructure. No analytic support has been provided to justify additional infrastructure needs beyond the .65% provided to most hospitals, along with the funds that should be freed up for infrastructure from reduced avoidable utilization. In past Commission meetings and in the recent Advisory Council meetings, Commissioners expressed an interest in regional cooperation, including a focus on integrating efforts with physicians, long-term care facilities, and community based organizations.
Under the direction of the Commission, the staff has initiated three multi-stakeholder efforts to make recommendations on care coordination and infrastructure, provider alignment, and consumer education and outreach. Under the BRFA, there was $15 million earmarked for potential efforts to support the new All Payer Model. HSCRC and DHMH expect to use approximately $2 million for regional planning efforts. HSCRC staff will seek recommendations from the Care Coordination Work Group and Alignment Work Group regarding infrastructure requirements to support state-wide initiatives. Regional planning efforts may shed more light on infrastructure needs.
Maryland's Economy According to the Bureau of Economic Analysis3, Maryland's expected GDP growth for 2013 is estimated to be 1.8%, making it 47th in the nation. The growth in the local economy does not appear to be a driver for increased hospital rates. A mid-year rate increase would also further erode the Medicaid budget.
Staff Assessment of Request HSCRC staff appreciates the efforts that hospitals and others are making to ensure the success of the new All Payer Model. HSCRC staff appreciates the tremendous opportunity in front of us to improve care for Marylanders and moderate costs for purchasers. Changing delivery models and integrating provider and community resources will take both focus and investment. This will require all parties working together to be agile and to succeed while achieving the goals of the new All Payer Model.
HSCRC staff does not support granting a mid-year rate increase since there is no financial crisis, hospitals were provided full funding of inflation without productivity offset for FY 2015, the impact of ACA on uncompensated care and hospital utilization is under evaluation, the recent State economic performance is worse than expected, and there are other unanticipated factors that require evaluation.
3 http://www.bea.gov/newsreleases/regional/gdp_state/gsp_newsrelease.htm
Furthermore, it is also too early to assess the Medicare results and the trend line that will develop from the rate increase approved July 1, 2014.
HSCRC should continue to work with stakeholders to understand infrastructure needs. Infrastructure resources from hospital savings as well as resources outside of hospitals should be considered, in addition to those that might be funded from rate increases. HSCRC may want to consider approaches to funding that support collaboration among hospitals in regional areas, as well as collaborations with other providers and community resources.

December 5, 2014
John M. Colmers Chairman, Health Services Cost Review Commission 3910 Keswick Road Suite N-2200 Baltimore, Maryland 21211 Dear Chairman Colmers: At its June 11, 2014 public meeting, the Health Services Cost Review Commission (HSCRC) voted to establish “the update factor for a 6 month period to allow for consideration of calendar year performance…(to) monitor and review results on an ongoing basis and make changes as needed on January 1st.” Furthermore, the “Commissioners decided to postpone additional infrastructure funding until January, when better information will be available on the first year status of the waiver and the effectiveness of the initial infrastructure funding can be evaluated.”1 As we near completion of the first full year under the state’s new all-payer demonstration model, it is important to recall the final recommendations from the HSCRC’s Advisory Council, which advised the Commission to “...strike a balance between near-term cost control, which is paramount, and making the required investments in physical and human infrastructure necessary for success. If we do not meet the near-term targets, there will be no long-term program. But, if we fail to make the needed infrastructure investments, we will not have the toolkit of reforms necessary to achieve lasting success” and “(g)iven the challenging targets in this initiative, goals should be set in the aggregate as close to the targets as practicable based on the degree of comfort that individual targets will be met.”2 There is sufficient information now available to the Commission to re-visit its original action. On behalf of our 65 hospital and health system members, the Maryland Hospital Association (MHA) requests that the Commission increase rates statewide, by 0.75 percent, effective January 1, 2015. We make this request in light of the following:
1) Maryland’s hospitals have outperformed the limits Maryland’s hospitals will significantly outperform the all-payer model limits in the first calendar year. Projected Maryland hospital spending per capita for the year is 2.01 percent - 44 percent below the waiver’s 3.58% per capita limit. Further, although the five-year cumulative savings requirement of $330 million did not anticipate savings in the first year of the new model, Center for Medicare & Medicaid Innovation data show Maryland’s hospitals on target to generate between $30 million and $40 million of savings this year alone. The
1 Minutes of the 509th meeting of the Health Services Cost Review Commission, June 11, 2014 2 Advisory Council final report dated January 31, 2014, p.6
John M. Colmers December 5, 2014 Page 2
results of calendar year 2014 are clear: Maryland’s hospitals are outperforming the financial targets of the new model.
2) A January 1 rate adjustment creates no risk of exceeding the waiver’s financial limits Aggregate Maryland hospital revenue is capped under the Global Budget Revenue /Total Patient Revenue (GBR/TPR) payment model. Under the old waiver, hospital revenues increased as volume increased, so limiting hospital rates did not guarantee hospital revenue control. This is no longer the case: hospital revenues cannot exceed the collective GBR/TPR caps. A January 1 increase in rates does not threaten Maryland’s ability to meet the new waiver’s revenue ceiling. The GBR/TPR methodologies cap revenue, both prices and volume, providing stable and predictable costs for payers no longer at risk for increased hospital volume. Moreover, when the original update was considered last June, not all hospitals had completed individual global budget contracts with the Commission that would ensure individual spending ceiling compliance; those agreements are now in place in every hospital in the state, with all applicable Maryland hospital revenues capped.
3) Investing in care coordination and population health infrastructure is essential to waiver success The spending limits included in the new waiver along with the global budget limits were intended to be aggressive, creating incentives for hospitals and health systems to dramatically change the way they provide hospital care and health care in their communities. And that is exactly what is happening in Maryland. But moving rapidly from volume-based to value-based payment requires significant and immediate change and investment in new health care delivery models. A January 1 rate adjustment would help ensure and speed the needed investments. The HSCRC Advisory Council underscored to this Commission the essential investment in care coordination activities needed for Maryland to be successful under the new waiver, including activities outside the regulated hospital environment. Care coordinators, community health workers, transportation services, behavioral health services, population health-related information technology and data analytics are just a few examples of the new investments required for the five year success under the new model. The need for these investments was acknowledged by the Commission, when GBR hospitals received slightly higher global budgets to help fund needed new infrastructure. As Maryland’s hospitals will significantly outperform the all-payer financial requirements this year, now is the time to release additional funds by way of a mid-year rate increase to facilitate those investments.
4) Hospital margins have improved, but remain vulnerable As reflected in the attached chart, hospital operating margins have increased this year, but previous declines in 2012 and 2013, forced severe operational cutbacks and created for hospitals an unstable financial footing. As Maryland’s hospitals embrace the new value-based model, they must do better with less, controlling health care spending in accordance

John M. Colmers December 5, 2014 Page 3
with the triple aim. However, hospitals are only beginning to recover from these recent downturns and a six-year history of below-inflation updates. Maryland’s hospitals are doing their part to meet the objectives of the waiver and lower health care costs for everyone. But all stakeholders, including health plans and the public, share responsibility for transforming care in Maryland. A 0.75 percent mid-year rate increase balances population health investment needs with cost containment. Maryland hospital financial performance is well below the waiver’s ceiling. We ask the state and the HSCRC to partner with hospitals to invest now to leverage even greater savings and performance improvement as the new waiver model evolves.
We appreciate the Commission’s consideration of this critically important issue. If you have any questions, please contact me. Sincerely, Carmela Coyle President & CEO Maryland Hospital Association Attachment
cc: Herbert Wong, PhD, Vice Chairman George H. Bone, MD Stephen F. Jencks, MD, MPH Jack C. Keane Donna Kinzer, Executive Director Bernadette Loftus, MD Thomas R. Mullen

December 30, 2014 John M. Colmers Chairman, Health Services Cost Review Commission 3910 Keswick Road Suite N-2200 Baltimore, Maryland 21211 Dear Chairman Colmers: Following up on Maryland hospitals' December 5 request for a 0.75 percent hospital rate increase effective January 1, 2015, we ask the Commission to act on this request at your January 14, 2015 public meeting. Commissioners did not consider our request at your December public meeting. Instead, staff asked the HSCRC’s Payment Models Workgroup to "analyze" our request and make a recommendation to the Commission. Delegation of this issue to this workgroup is inappropriate. We ask that the Commission act promptly and approve our request in January. The authority to determine updates and timing rests solely with the Commission. The Payment Models Workgroup was created to make recommendations on the structure of new payment models and how the Commission might change its historic approach to annual rate updates. Important guidance was provided by the workgroup to the Commission in the spring of 2014. Maryland hospitals' request is not for new structures or payment policies. In fact, off cycle update adjustments have been made by the Commission in the past. Our request is that the Commission honor its June 11, 2014 commitment to revisit at mid year the approved annual update amount, considering strong calendar year 2014 waiver performance and hospitals' additional critical infrastructure investment needs. Waiver performance for 2014 is now clear: Maryland hospitals will save Medicare some $53 million to $65 million in the first year of the new model, exceeding both the first and second year savings goal; Maryland hospital spending will grow at about 2.0 percent per capita, well below the 3.58 percent per capita ceiling. Every hospital in the state is now governed by a global budget -- a goal not expected to be achieved for years -- and, as a result, the Commission has certainty today over statewide hospital revenue growth. The fact that every hospital selected a global budget approach demonstrates that Maryland hospitals are “all in” on a new way to pay for and provide hospital and health care in our state. But that new approach challenges Maryland’s hospitals, and requires them -- and no other stakeholder -- to assume significant financial and organizational risk in transforming the delivery system. In order for Maryland to succeed, hospitals need to invest in new services, new staff, new data analytics capabilities and more. Maryland hospitals must retool to address not only the acute care needs of patients, but the broader health care needs and non-clinical barriers that must be overcome to meet the tight constraints of the new waiver. Now is the time for the state and the Commission to be our partner and invest a small portion of the return
John M. Colmers December 30, 2014 Page 2
already generated to allow for the investments hospitals need to make now to ensure Maryland's future success under the waiver. The Commission’s own Advisory Council recommended setting rates as close to the per capita ceiling as possible to allow hospitals to make investments that will ensure long term success. Maryland's hospitals are exceeding all of the financial goals of the new waiver. Our ability to succeed on the more difficult goal of reducing Maryland's readmissions rate will depend on new investments, new relationships, new partnerships and new ways of coordinating care in the community, outside of the hospital. Success in Maryland will only become more difficult, because our pace of improvement must continue to outpace the rest of the nation. That won't happen unless we invest in change now. We urge the Commission to act on our request at the January public meeting. If you have any questions, please contact me or Mike Robbins. Sincerely,
Carmela Coyle President & CEO Maryland Hospital Association Attachment
cc: Herbert Wong, PhD, Vice Chairman George H. Bone, MD Stephen F. Jencks, MD, MPH Jack C. Keane Bernadette Loftus, MD Thomas R. Mullen Donna Kinzer, Executive Director
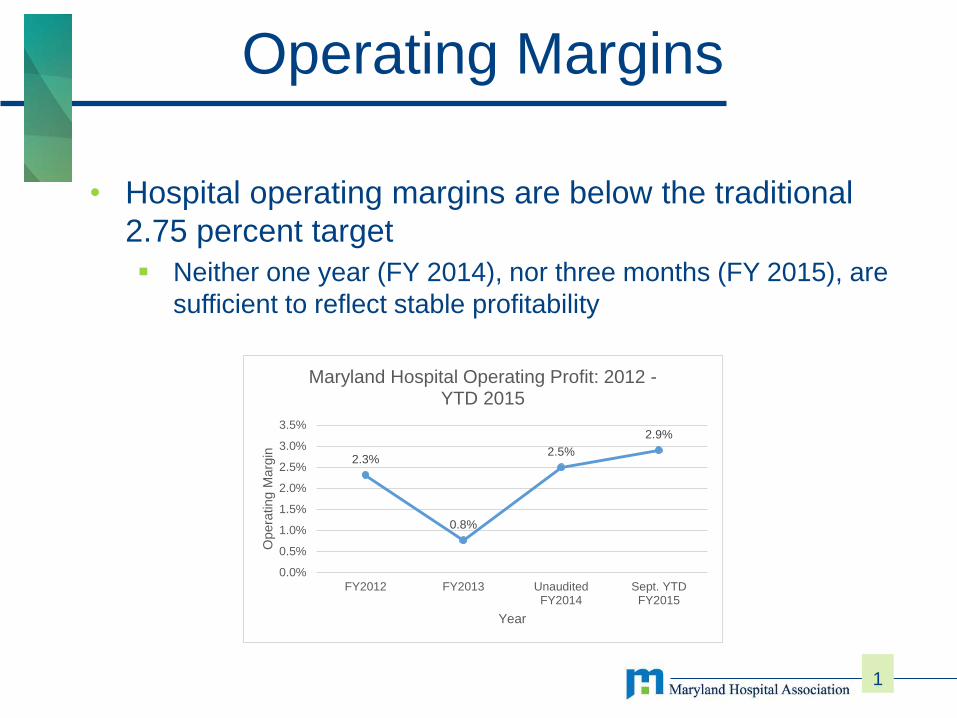
• Hospital operating margins are below the traditional 2.75 percent target Neither one year (FY 2014), nor three months (FY 2015), are
sufficient to reflect stable profitability
1
Operating Margins
2.3%
0.8%
2.5%
2.9%
0.0%
0.5%
1.0%
1.5%
2.0%
2.5%
3.0%
3.5%
FY2012 FY2013 UnauditedFY2014
Sept. YTDFY2015
Ope
ratin
g M
argi
n
Year
Maryland Hospital Operating Profit: 2012 -YTD 2015
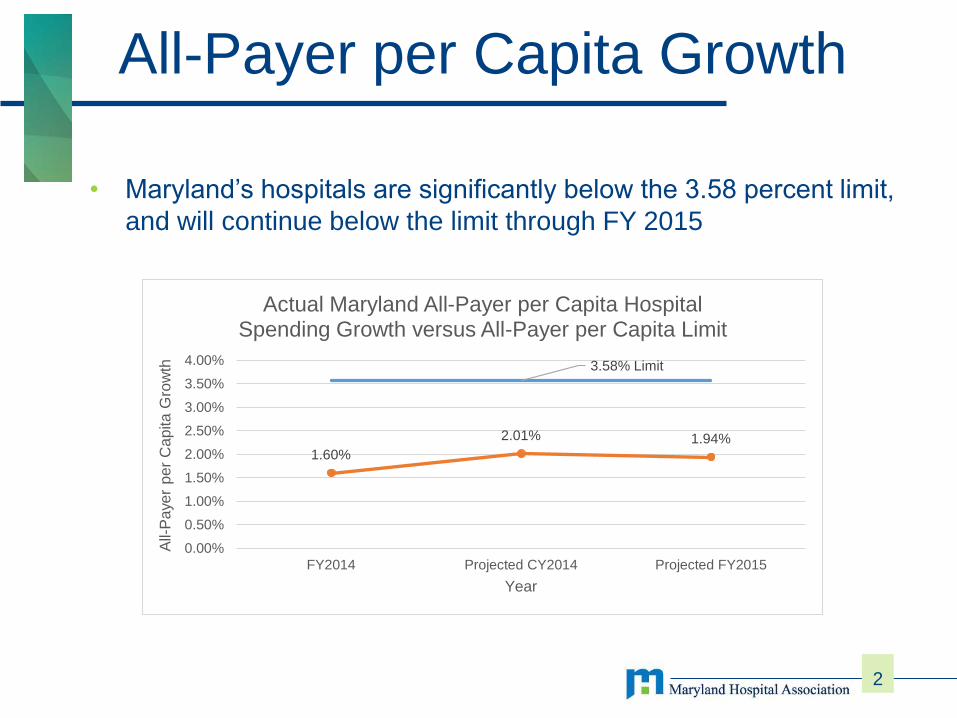
• Maryland’s hospitals are significantly below the 3.58 percent limit,
and will continue below the limit through FY 2015
2
All-Payer per Capita Growth
3.58% Limit
1.60%2.01% 1.94%
0.00%
0.50%
1.00%
1.50%
2.00%
2.50%
3.00%
3.50%
4.00%
FY2014 Projected CY2014 Projected FY2015
All-
Pay
er p
er C
apita
Gro
wth
Year
Actual Maryland All-Payer per Capita Hospital Spending Growth versus All-Payer per Capita Limit
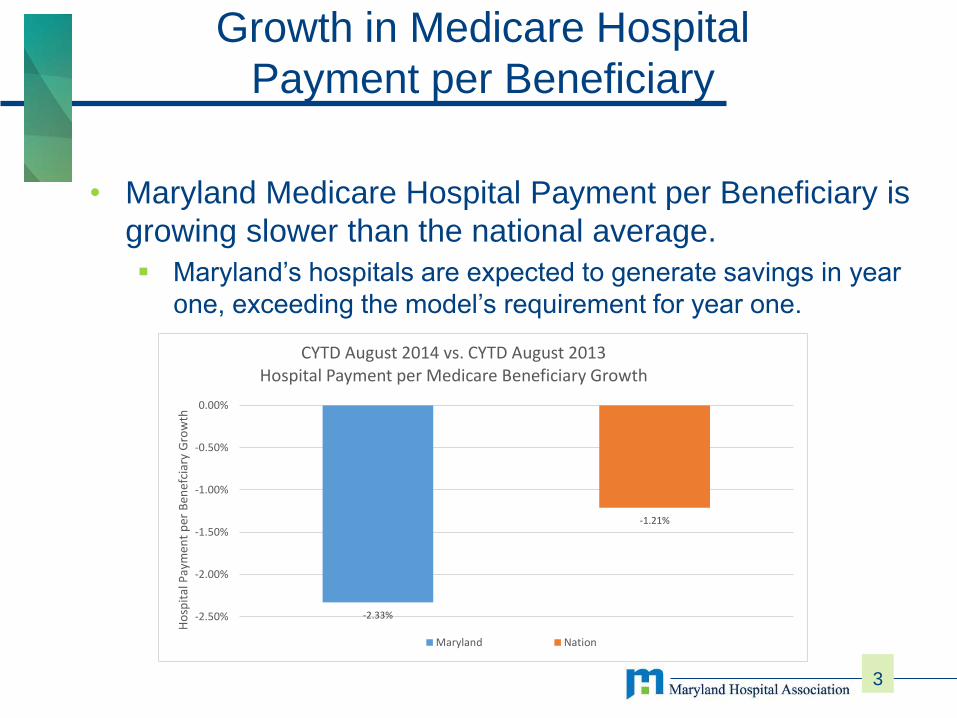
• Maryland Medicare Hospital Payment per Beneficiary is growing slower than the national average. Maryland’s hospitals are expected to generate savings in year
one, exceeding the model’s requirement for year one.
3
Growth in Medicare Hospital Payment per Beneficiary
-2.33%
-1.21%
-2.50%
-2.00%
-1.50%
-1.00%
-0.50%
0.00%
Ho
spit
al P
aym
ent
per
Ben
efci
ary
Gro
wth
CYTD August 2014 vs. CYTD August 2013Hospital Payment per Medicare Beneficiary Growth
Maryland Nation


Update on Work Groups
• Consumer Engagement• Care Coordination
• Payment Models Work Group • GBR Market Shift Draft
Principles• GBR Transfer Adjustment
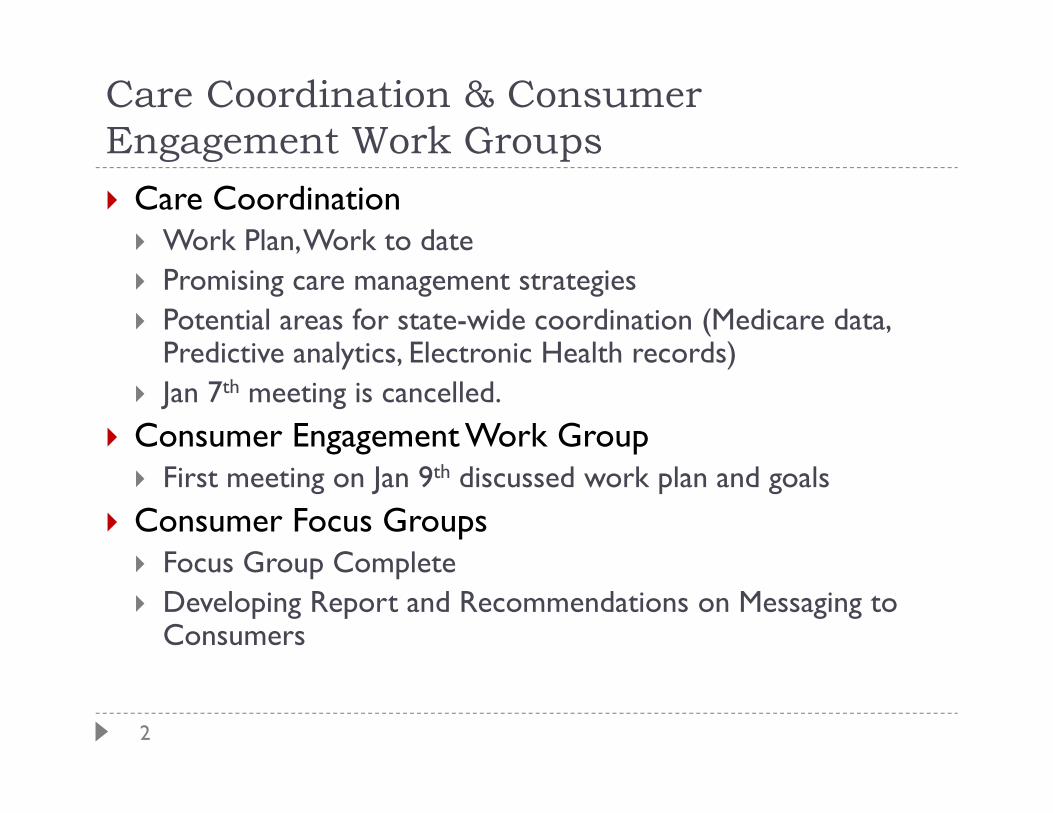
2
Care Coordination & Consumer Engagement Work Groups Care Coordination Work Plan, Work to date Promising care management strategies Potential areas for state-wide coordination (Medicare data,
Predictive analytics, Electronic Health records) Jan 7th meeting is cancelled.
Consumer Engagement Work Group First meeting on Jan 9th discussed work plan and goals
Consumer Focus Groups Focus Group Complete Developing Report and Recommendations on Messaging to
Consumers
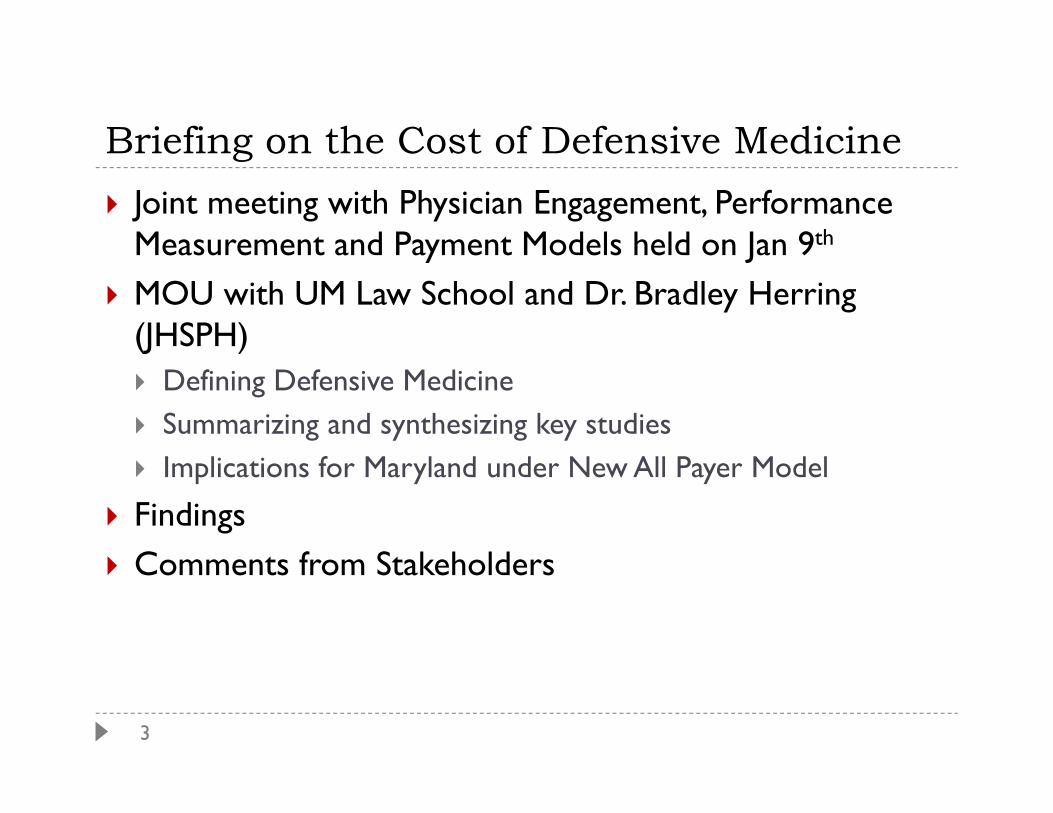
3
Briefing on the Cost of Defensive Medicine Joint meeting with Physician Engagement, Performance
Measurement and Payment Models held on Jan 9th
MOU with UM Law School and Dr. Bradley Herring (JHSPH) Defining Defensive Medicine Summarizing and synthesizing key studies Implications for Maryland under New All Payer Model
Findings Comments from Stakeholders
4
Payment Models Work Group December 15th
Market Shift Principles GBR Transfer Adjustments Principles for off-cycle adjustments Aggregate revenue at risk in value-based programs
Market Shift Subgroup FY2013 and FY2014 data distributed for verifications and
modeling Resubmissions
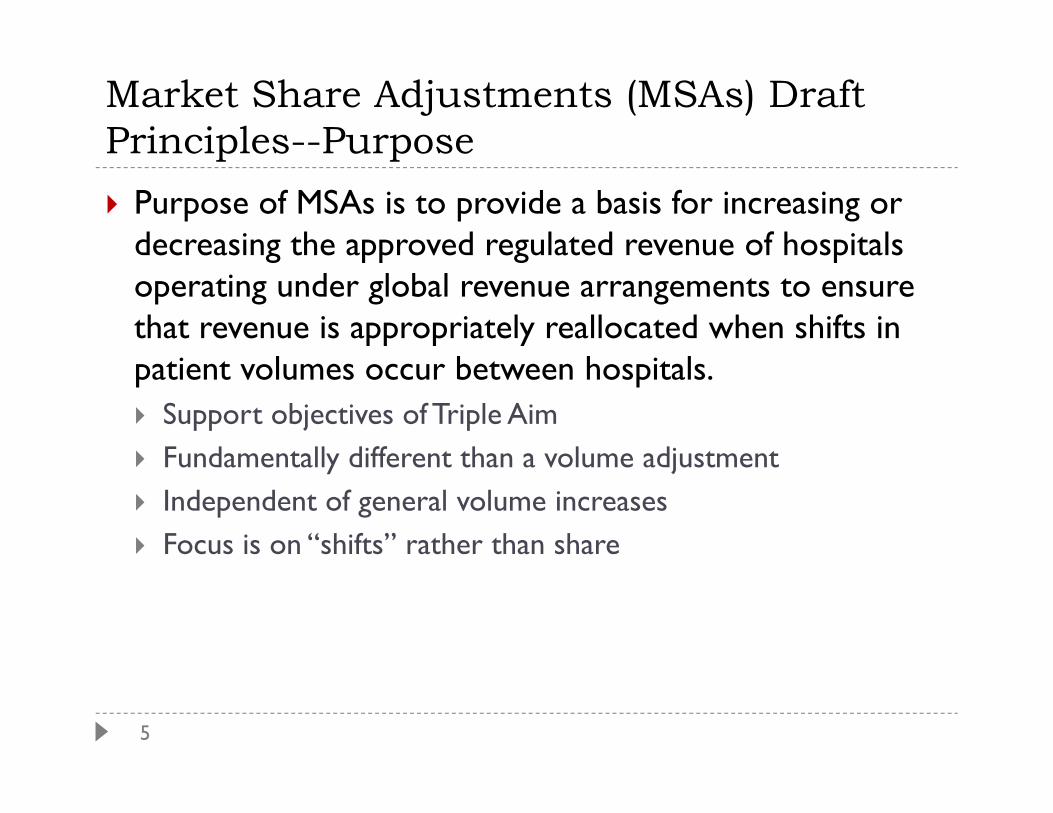
5
Market Share Adjustments (MSAs) Draft Principles--Purpose Purpose of MSAs is to provide a basis for increasing or
decreasing the approved regulated revenue of hospitals operating under global revenue arrangements to ensure that revenue is appropriately reallocated when shifts in patient volumes occur between hospitals. Support objectives of Triple Aim Fundamentally different than a volume adjustment Independent of general volume increases Focus is on “shifts” rather than share
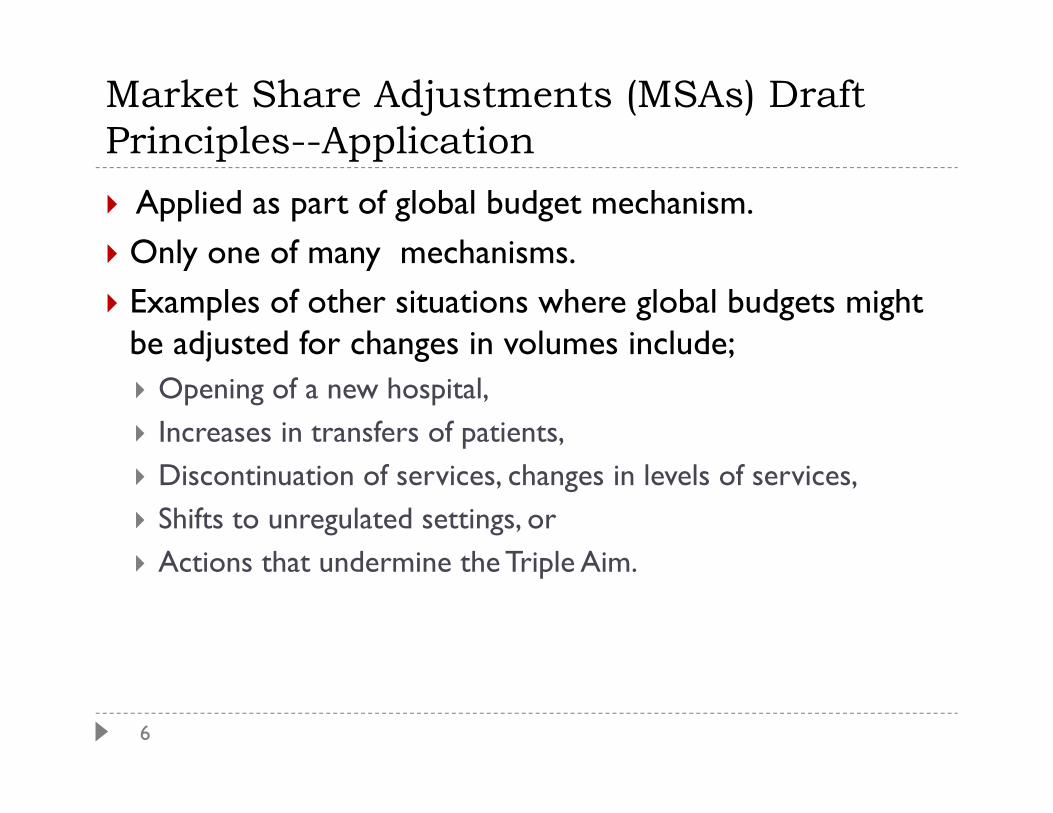
6
Market Share Adjustments (MSAs) Draft Principles--Application Applied as part of global budget mechanism. Only one of many mechanisms. Examples of other situations where global budgets might
be adjusted for changes in volumes include; Opening of a new hospital, Increases in transfers of patients, Discontinuation of services, changes in levels of services, Shifts to unregulated settings, or Actions that undermine the Triple Aim.
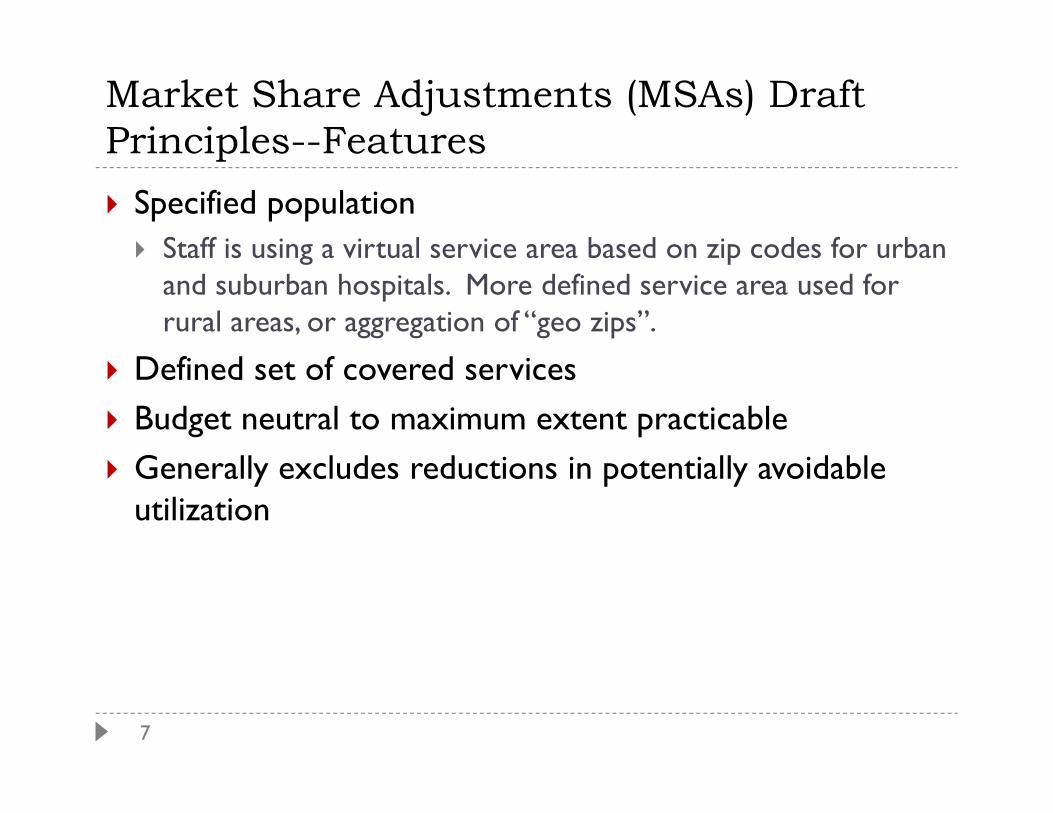
7
Market Share Adjustments (MSAs) Draft Principles--Features Specified population Staff is using a virtual service area based on zip codes for urban
and suburban hospitals. More defined service area used for rural areas, or aggregation of “geo zips”.
Defined set of covered services Budget neutral to maximum extent practicable Generally excludes reductions in potentially avoidable
utilization
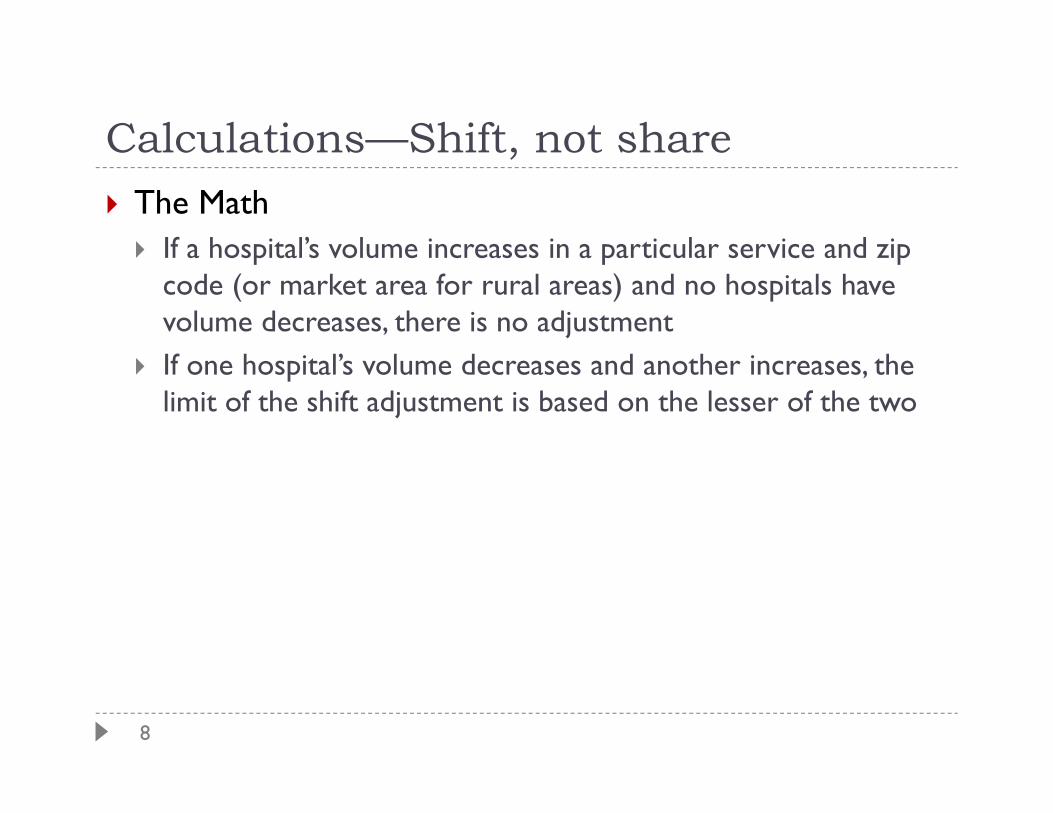
8
Calculations—Shift, not share The Math If a hospital’s volume increases in a particular service and zip
code (or market area for rural areas) and no hospitals have volume decreases, there is no adjustment
If one hospital’s volume decreases and another increases, the limit of the shift adjustment is based on the lesser of the two
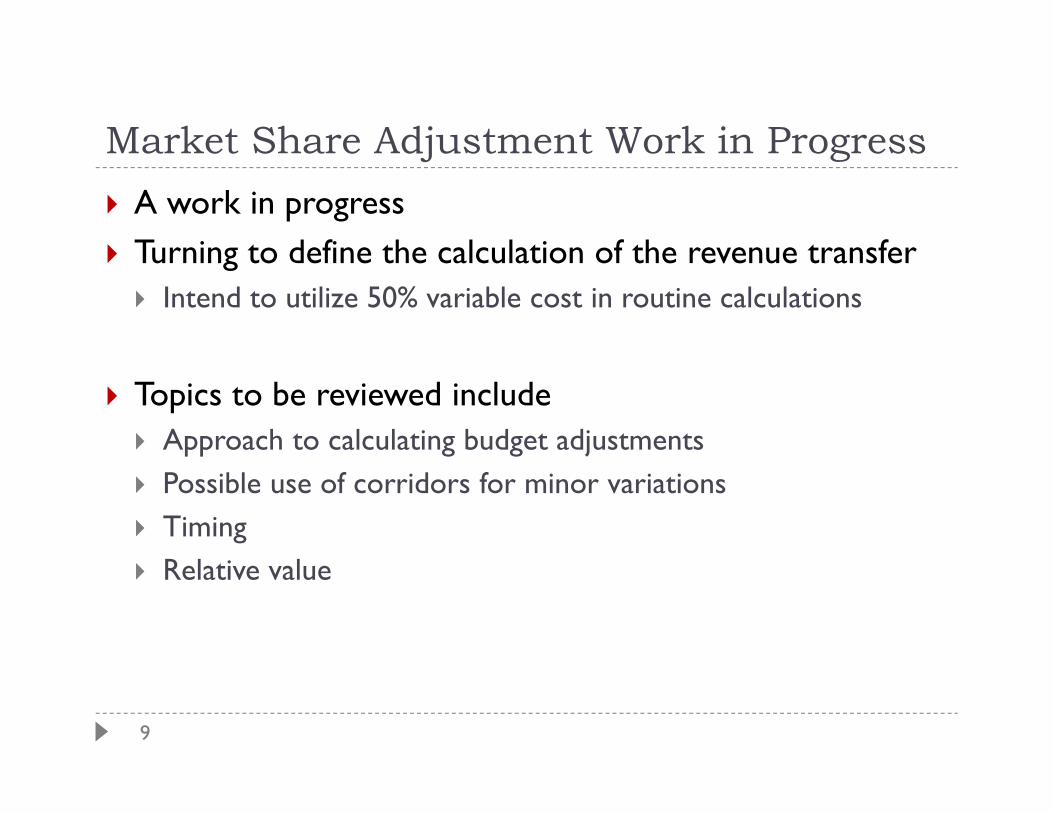
9
Market Share Adjustment Work in Progress A work in progress Turning to define the calculation of the revenue transfer Intend to utilize 50% variable cost in routine calculations
Topics to be reviewed include Approach to calculating budget adjustments Possible use of corridors for minor variations Timing Relative value

10
GBR Transfer Adjustments Recap Payment Models Work Group and Transfer Subgroup
meetings since June Focused on ensuring access to care for complex cases
and patient protections Worked to develop transfer cases payment adjustments
to GBR revenues based on variation from the baseline transfer rates to academic medical centers (AMCs)
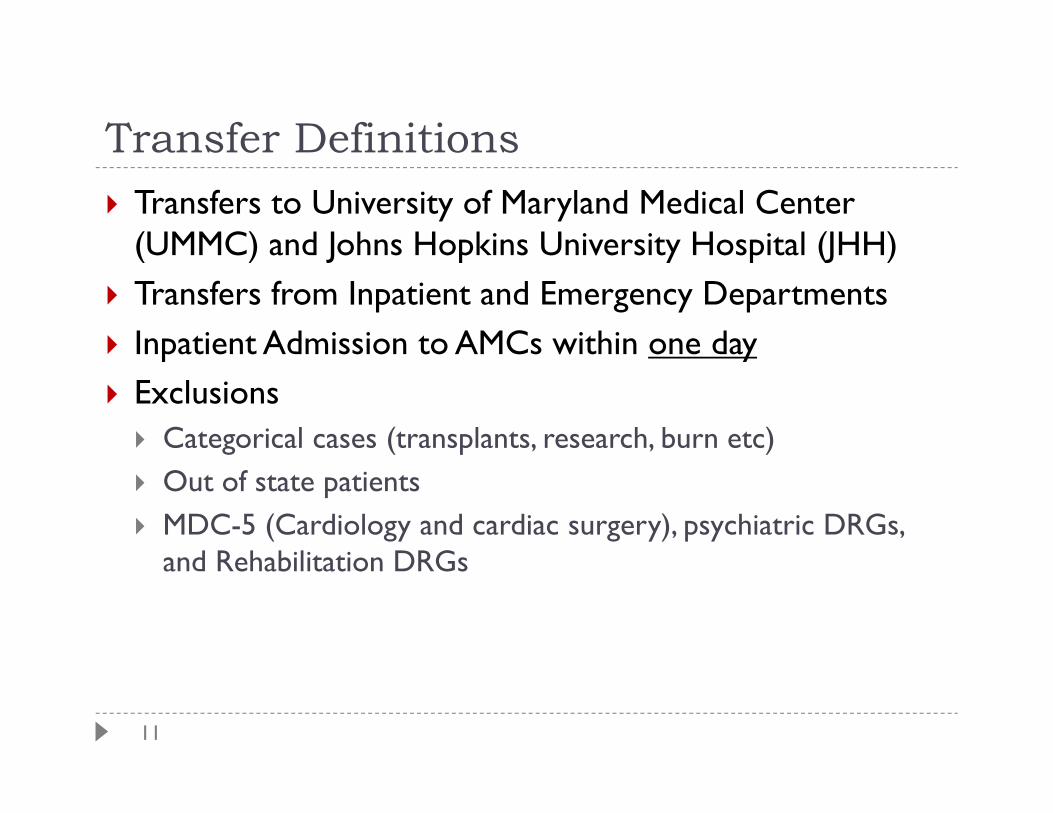
11
Transfer Definitions Transfers to University of Maryland Medical Center
(UMMC) and Johns Hopkins University Hospital (JHH) Transfers from Inpatient and Emergency Departments Inpatient Admission to AMCs within one day Exclusions Categorical cases (transplants, research, burn etc) Out of state patients MDC-5 (Cardiology and cardiac surgery), psychiatric DRGs,
and Rehabilitation DRGs

12
GBR Transfer Adjustments Average cost of transfer calculated separately for transfers from
ED and transfers from inpatient in the base year
AMC adjustments Quarterly adjustment to budget based on rate of change
compared to the base period
Sending hospital adjustments Annual adjustments to budgets Adjustments for hospitals with more than 10% increase and at
least 10 additional cases If statewide transfers increase by more than 5% ($5 million
payment to AMCs), quarterly adjustments and lowering the threshold to 5%.
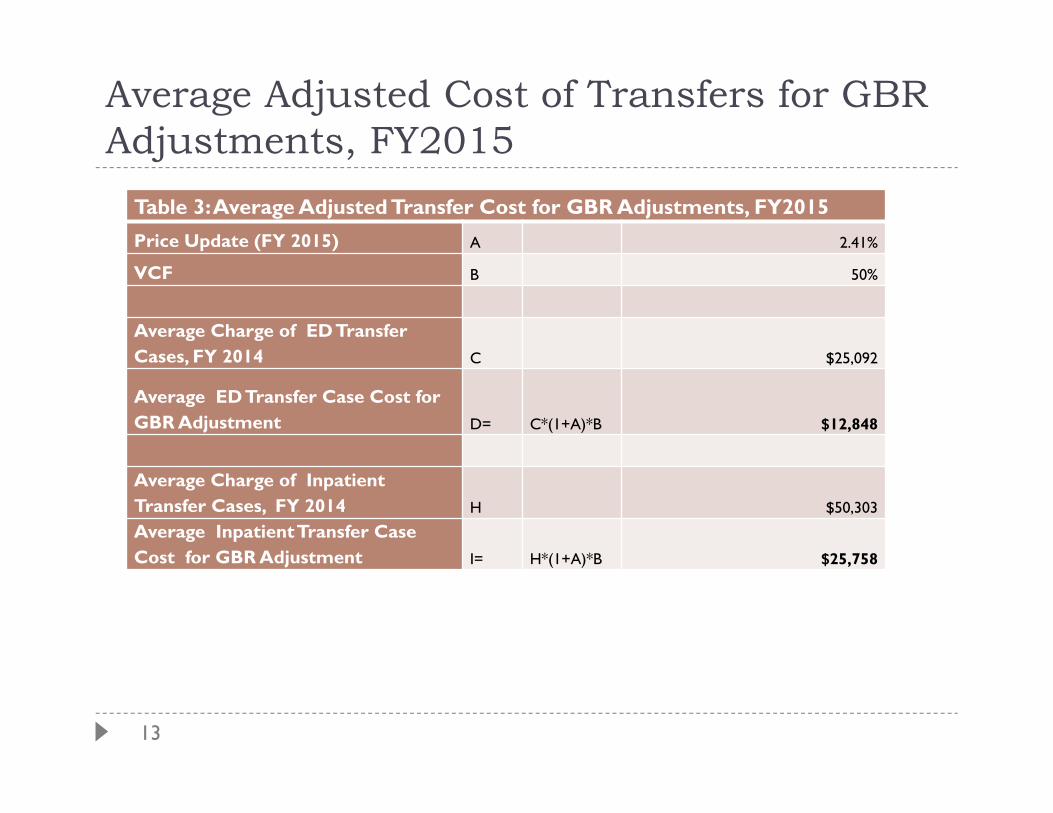
13
Average Adjusted Cost of Transfers for GBR Adjustments, FY2015
Table 3: Average Adjusted Transfer Cost for GBR Adjustments, FY2015Price Update (FY 2015) A 2.41%
VCF B 50%
Average Charge of ED Transfer Cases, FY 2014 C $25,092
Average ED Transfer Case Cost for GBR Adjustment D= C*(1+A)*B $12,848
Average Charge of Inpatient Transfer Cases, FY 2014 H $50,303
Average InpatientTransfer Case Cost for GBR Adjustment I= H*(1+A)*B $25,758

DRAFT DOCUMENT FOR COMMISSION DISCUSSION Principles for Market Share Adjustments under Global Revenue Models
1
This draft document, prepared in conjunction with the Payment Models Work Group, contains principles for consideration as market share adjustments are developed and applied. It is a work in progress and may be modified as the approaches and calculations for adjustments are finalized.
Introduction The Market Share Adjustments (MSAs) mechanism is part of a much broader set of tools that link global budgets to populations and patients under the State's new All-Payer Model.
The specific purpose of MSAs is to provide a basis for increasing or decreasing the approved regulated revenue of Maryland hospitals operating under Global Budget Revenue (GBR) rate arrangements to ensure that revenue is appropriately reallocated when shifts in patient volumes occur between hospitals as a result of efforts to achieve the Triple Aim of better care, better health, and lower costs. MSAs under a global budget revenue system are fundamentally different from a volume adjustment. Hospitals under a population-based payment system have a fixed budget for providing services to the population in their service area. By definition, a global budget is not fixed if it is subject to volume adjustments. Therefore, it is imperative that MSAs reflect shifts in patient volumes independent of general volume increases in the market. Additionally, MSAs should not be so sensitive that they respond to random fluctuations in the volume of services at individual hospitals.
This document lays out the principles governing the development of MSA mechanisms that will be applied as part of Maryland’s global budget system—the specific adjustments are being developed and are expected to evolve over time.
Overview In order for an MSA to be consistent with a population-based approach, it should have certain features such as the following:
• A specified population from which hospitals’ market shares will be calculated; • A defined set of covered services of the MSA ; and • An MSA approach that is budget neutral to the maximum extent practicable and/or results in
demonstrably higher quality.
DRAFT DOCUMENT FOR COMMISSION DISCUSSION Principles for Market Share Adjustments under Global Revenue Models
2
The MSA should not hinder the global budget incentive to eliminate marginal services that do not add value, are unnecessary or result from better community based care. Therefore, MSAs should not be applied for such appropriate reductions in utilization. MSAs are just one mechanism necessary to account for changes in levels and patterns of utilization. The global budget agreements also contain mechanisms intended to ensure the continued provision of needed services for Maryland patients including:
• Population/Demographic Adjustments: Changing demographics may result in growth in the demand for services. The annual update factor adjusts revenue to capture changes in overall population. Annual hospital level population adjustments will capture changes in total population/demographics in each patient service area.
• Annual Update Provides Flexibility to Fund Innovation/New Services/Growth in Selected Quaternary Services: Targeted funding can be provided through the Update Process. For example, the new Holy Cross Germantown Hospital was partially funded from the general update process. Consideration is given to annual budget changes for quaternary services such as transplants, burns, and highly specialized cancer care for Johns Hopkins Hospital and University Hospital Center under their global budget agreements.
• Transfers to Johns Hopkins Hospital, University Hospital Center, and Shock Trauma Center: Adjustments will be made for increases in transfers to these centers to ensure that resources are available to treat patients needing the specialized care provided in these settings.
• Potentially Avoidable Utilization (PAU): PAU is excluded from the market share analysis and will be analyzed separately. Exclusion of PAU from the general market share analysis avoids the potential to reward a hospital that increased PAU at the expense of a hospital that appropriately reduced PAU. A PAU focused analysis, when warranted, will allow an assessment PAU reductions that are not driven by improvements in population health, such as diversion of patients to an unregulated setting, transfer of patients due to changes in referral patterns by purchasers, or a less favorable change in service delivery (eliminating or contracting service lines that have high PAU volumes) that should not be rewarded.
The basis for distinguishing between desirable and undesirable utilization changes is the Triple Aim of the new system: to improve health care outcomes, enhance patient experiences, and control costs. MSAs, together with other global budget agreement provisions and HSCRC policies, will need to focus on efforts that support the Triple Aim.
Examples of actions that help achieve the Triple Aim are those that result from:
• Providing high quality hospital care resulting in fewer hospital-acquired conditions; • Making efforts to improve care coordination and patient discharge planning resulting in fewer
re-hospitalizations;
DRAFT DOCUMENT FOR COMMISSION DISCUSSION Principles for Market Share Adjustments under Global Revenue Models
3
• Promoting the provision of care in the most appropriate setting, resulting in fewer initial hospitalizations for ambulatory care sensitive conditions and conditions that can be treated equally effectively in other settings at lower cost; and
• Providing services in a lower cost settings without compromising patient care.
Possible examples of actions that undermine the Triple Aim and should be avoided include:
• Prompting patients with unprofitable service needs to seek care elsewhere or reducing the volume of non-profitable services below the amount needed by patients within the hospital’s service area;
• Reducing capacity or service ability to the point of creating long waiting lists or delays; • Under investing in new technology or modes of care proven to be efficient ways of improving
patient health, safety or quality; and • Reducing the total level of a hospital’s medical staff or the quality of affiliated providers to the
point of compromising patient care.
Similarly, the MSA together with other mechanisms and policies must distinguish between increases in utilization at any given hospital that should be recognized and those that should not be recognized. For example, hospitals should receive increases to their approved regulated revenue in circumstances that result in a shift of patient volumes that are beyond the hospital’s control, such as the closure of a service at a particular hospital and resulting relocation of patients receiving that service to another facility, or other discrete and readily identifiable events. As long as the financial drivers of the shift are transparent and value based, hospitals should also receive a market share adjustment if organizations such as Health Maintenance Organizations, Accountable Care Organizations or Primary Care Medical Homes direct their members to the facility to improve efficiency, cost-effectiveness and quality.
The MSA policy should not encourage shifts in volume that are not clearly relatable to improvements in the overall value of care, such as marketing or acquisition strategies that merely shift the location or ownership of resources without increasing access, improving outcomes, or reducing costs in a geographic area. In February 2014, the Commission reduced the variable cost factor for volume changes from 85% to 50% for services provided outside of global budgets that are subject to the All Payer Model. Applying this lower variable cost factor to market share adjustments will contribute to limiting incentives to increase volume through strategies that do not improve care or value.
Guiding Principles In developing its MSA approach, the HSCRC should follow certain guiding principles. These include:
DRAFT DOCUMENT FOR COMMISSION DISCUSSION Principles for Market Share Adjustments under Global Revenue Models
4
1. Provide clear incentives
1.1. Promote the three part aim 1.2. Emphasize value, recognizing that this concept will take some time to develop 1.3. Promote investments in care coordination 1.4. Encourage appropriate utilization and delivery of high quality care 1.5. Avoid paying twice for the same service
2. Reinforce the maintenance of services to the community.
2.1. Encourage competition to promote responsive provision of services 2.2. Competition should be based on value 2.3. Revenue should generally follow the patient 2.4. Support strategies pursued by entities such as ACOs, PCMH, and MCOs seeking to direct
patients to low cost, high quality settings
3. Changes constituting market share shifts should be clearly defined.
3.1. Volume increase alone is not a market share change. 3.2. Market share shifts should be evaluated in combination with the overall volume trend to
ensure that shift has occurred, rather than volume growth 3.3. If one hospital has higher volume and other hospitals serving the same area do not have
corresponding declines in volume, a market share shift should not be awarded. 3.4. Increases in the global budget of one hospital should be funded fully by the decrease in
other hospitals’ budgets 3.5. Market share changes should reflect services provided by the hospital 3.6. Substantial reductions at a facility may result in a global budget reduction even if not
accompanied by shift to other facilities in service area. (Investigate shift to unregulated, limitations on types of procedures)
3.7. Closures of services or discrete readily identifiable events should result in a global budget adjustment and a market share adjustment as needed
3.8. Market shifts in Potentially Avoidable Utilization (PAU) should be evaluated separately1
1 There are limited circumstances where HSCRC might want to recognize a market shift in PAUs. For example, if an HMO moved all of its patients from one facility to another, there may be an appropriate shift in revenue for some level of PAU cases. Similarly, if a PCMH changed its hospital affiliation, there may be a shift in PAU volumes from one facility to another.

DRAFT DOCUMENT FOR COMMISSION DISCUSSION Principles for Market Share Adjustments under Global Revenue Models
5
Topics to Be Reviewed after Methodology Development for Calculating Shift 1. Adjust budgets for substantial shift in market share 2. Use corridors to avoid shifts for minor variations 3. Adjust budgets gradually to reflect the fixed nature of capital and other costs 4. Timing of market share adjustments 5. Relative value of market shifts
Market Share Shift Calculation Based on the principles listed above:
• Both volume and market share at a hospital must have increased to receive a positive market share adjustment.
• Both volume and market share at a hospital must have decreased to receive a negative market share adjustment.
The developed algorithms applied should compare changes in volume at Hospital ABC to net change in volume for the other hospitals serving the market.
Hospital ABC for Service Area
Aggregate of Other Hospitals for Service Area
Market Share Adj. for Hospital ABC
Volume Increase Volume Increase No Volume Decrease Volume Decrease No Volume Increase Volume Decrease Yes - Increase: Hospital ABC increase = The lesser of the
increase at ABC or the net aggregate decrease at other hospitals with patients from the service area. Example 1: ABC = +40 Rest of Area = -30 Market Share Adjustment of 30 cases to ABC. Example 2: ABC = +40 Rest of Area = -70 Market Share Adjustment of 40 cases to ABC.
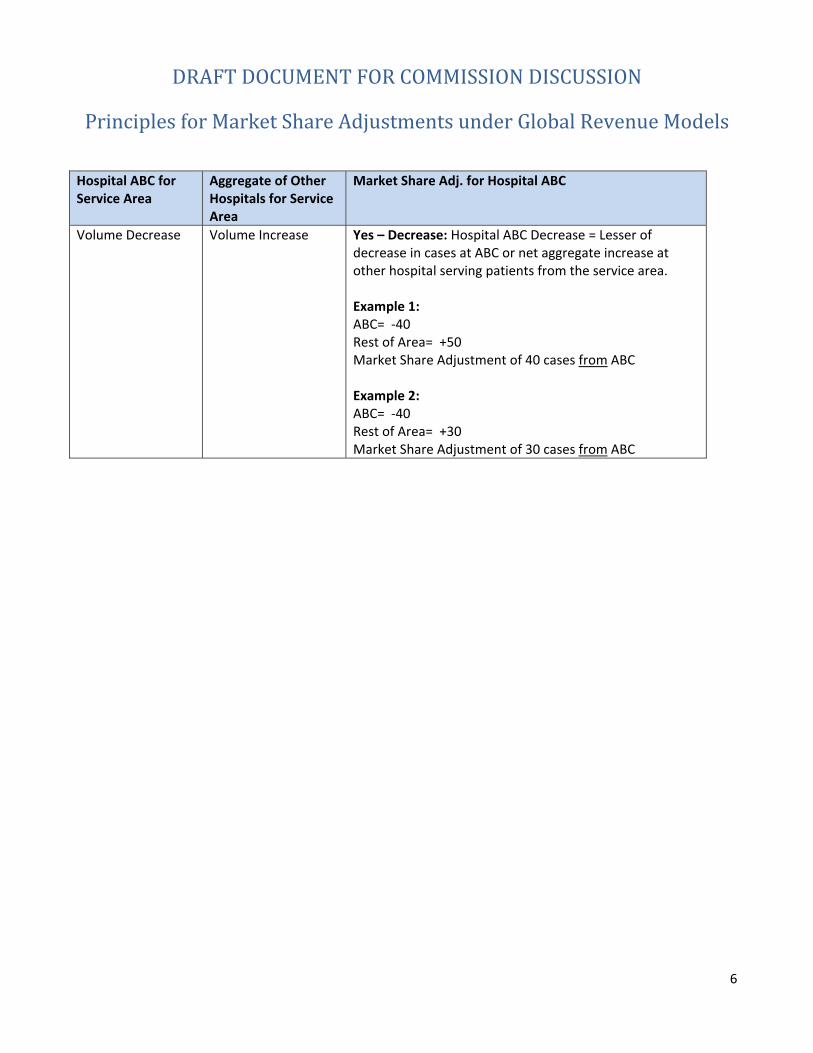
DRAFT DOCUMENT FOR COMMISSION DISCUSSION Principles for Market Share Adjustments under Global Revenue Models
6
Hospital ABC for Service Area
Aggregate of Other Hospitals for Service Area
Market Share Adj. for Hospital ABC
Volume Decrease Volume Increase Yes – Decrease: Hospital ABC Decrease = Lesser of decrease in cases at ABC or net aggregate increase at other hospital serving patients from the service area. Example 1: ABC= -40 Rest of Area= +50 Market Share Adjustment of 40 cases from ABC Example 2: ABC= -40 Rest of Area= +30 Market Share Adjustment of 30 cases from ABC
01/14/15
1
Transfer Cases Payment Adjustment under Global Revenue Models
Introduction Under the new All-Payer Model, inter-hospital transfers are an area of concern that must be addressed to ensure that revenue appropriately follows the patient when changes to transfer rates occur and that resources are readily available to care for complex cases. As academic medical centers (AMCs) providing quaternary services, Johns Hopkins Hospital and University of Maryland Medical Center play a distinct role in the health care system by handling a large proportion of highly acute cases, accepting regional referrals, and serving as centers for clinical and technological innovation in the State. For global models to be successful in Maryland, different regulatory treatment must be given to specific areas of service at these AMCs that will allow them to function effectively within this new payment structure. Under global models, hospitals are incentivized to lower expenses and volume by taking measures to reduce avoidable utilization and promote care management and quality improvement. This may result in community hospitals transferring complex cases to AMCs in order to get patients the advanced care they need and reduce the high costs associated with those patients. Patients transferred to AMCs are often critically ill patients or patients with highly specialized care not available at the transferring hospitals whose access to care should be ensured. Utilizing AMCs as regional referral centers may improve outcomes for critically ill patients and thus be beneficial to the entire Maryland health system. AMCs must have the capacity to take on a possible influx of complex cases without facing financial penalty under a global model. Global budgets change financial incentives. Hospitals have reduced incentives to keep highly complex cases that are beyond their capabilities in order to garner revenue. Additionally there is a risk that hospitals could take steps to avoid complex cases altogether. HSCRC has included a number of requirements in global budget agreements to monitor and curb against such outcomes including:
• Review of changes in severity levels or case mix of patients treated, with possible revenue reductions for declines;
• Review of volume declines beyond a specified level; and • Potential revenue adjustments for shifts of services between hospitals (referred to as the
Market Share Adjustment).
While each of these measures will detect overall changes to utilization patterns, the relatively small number of complex cases makes transfers a special category of focus. HSCRC wants to ensure that financial policies are in place early on in the process of global budget implementation in order to respond to potential changing patterns, to support the transfer of patients based on their clinical needs, and to ensure that the receiving entities have the capacity to take on the possible influx of complex cases without facing financial penalty under a global model.
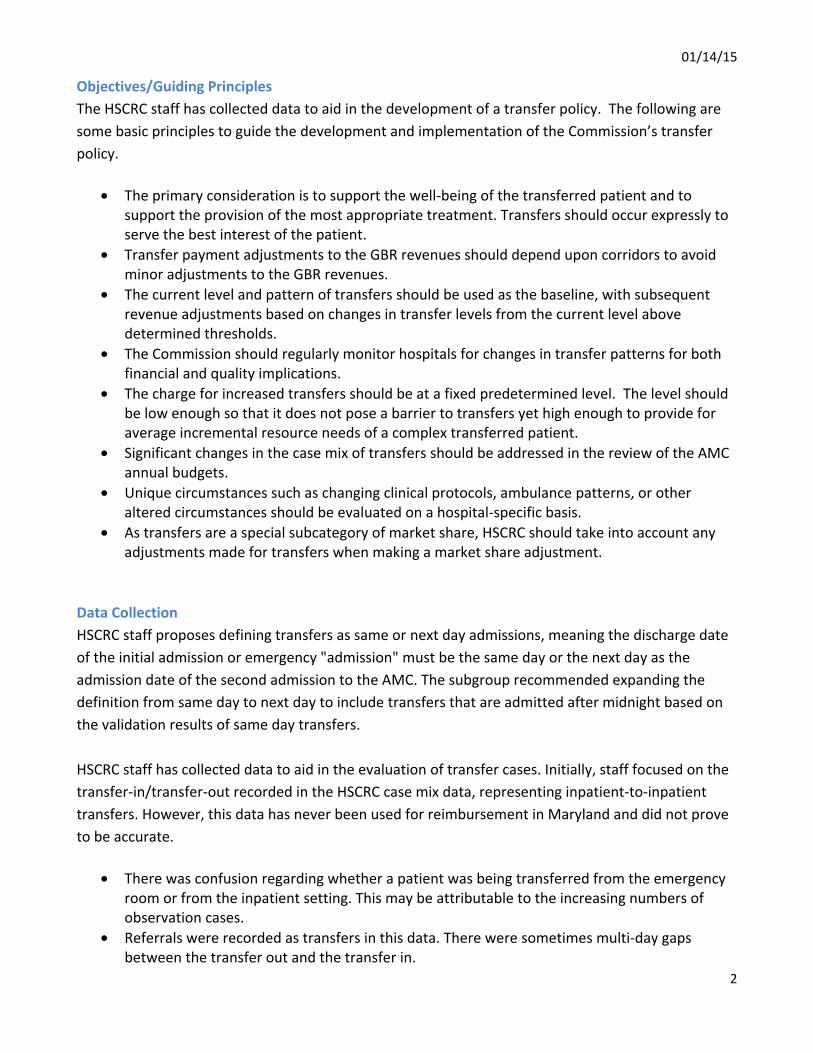
01/14/15
2
Objectives/Guiding Principles The HSCRC staff has collected data to aid in the development of a transfer policy. The following are some basic principles to guide the development and implementation of the Commission’s transfer policy.
• The primary consideration is to support the well-being of the transferred patient and to support the provision of the most appropriate treatment. Transfers should occur expressly to serve the best interest of the patient.
• Transfer payment adjustments to the GBR revenues should depend upon corridors to avoid minor adjustments to the GBR revenues.
• The current level and pattern of transfers should be used as the baseline, with subsequent revenue adjustments based on changes in transfer levels from the current level above determined thresholds.
• The Commission should regularly monitor hospitals for changes in transfer patterns for both financial and quality implications.
• The charge for increased transfers should be at a fixed predetermined level. The level should be low enough so that it does not pose a barrier to transfers yet high enough to provide for average incremental resource needs of a complex transferred patient.
• Significant changes in the case mix of transfers should be addressed in the review of the AMC annual budgets.
• Unique circumstances such as changing clinical protocols, ambulance patterns, or other altered circumstances should be evaluated on a hospital-specific basis.
• As transfers are a special subcategory of market share, HSCRC should take into account any adjustments made for transfers when making a market share adjustment.
Data Collection HSCRC staff proposes defining transfers as same or next day admissions, meaning the discharge date of the initial admission or emergency "admission" must be the same day or the next day as the admission date of the second admission to the AMC. The subgroup recommended expanding the definition from same day to next day to include transfers that are admitted after midnight based on the validation results of same day transfers. HSCRC staff has collected data to aid in the evaluation of transfer cases. Initially, staff focused on the transfer-in/transfer-out recorded in the HSCRC case mix data, representing inpatient-to-inpatient transfers. However, this data has never been used for reimbursement in Maryland and did not prove to be accurate.
• There was confusion regarding whether a patient was being transferred from the emergency room or from the inpatient setting. This may be attributable to the increasing numbers of observation cases.
• Referrals were recorded as transfers in this data. There were sometimes multi-day gaps between the transfer out and the transfer in.

01/14/15
3
• The record of transfers-out did not align with the record of transfers-in.
In order to overcome these problems, HSCRC staff has used the master patient index (MPI) provided from Chesapeake Regional Information System for our Patients (CRISP) to track patient flow from one hospital to another. In doing so, patients were tracked with direct transfers from emergency room settings as well as inpatient settings. HSCRC staff will request that selected hospitals review this data to ensure that transfers are being properly identified.
DATA VALIDATION RESULTS INCOMPLETE DRAFT The table below provides results from the process of reconciling transfer-out records of transferring hospitals with transfer-in reducers of AMCs based on data provided to HSCRC as of 10/01/2014. In general, the information received from transferring hospitals validates the measurement counts (Table 1). On the other hand, AMCs indicated that they have found additional transfer cases that were not included in the HSCRC transfer case list (Table 2). Some of these additional transfer cases sent by the University of Maryland Medical Center (UMMC) do not have CRISP ID (3% of transfer cases identified by HSCRC), which was further analyzed in partnership with CRISP.

01/14/15
4
ID Sending Hospital Name
Total Number of Included Cases
Total Number of Cases Disagreed
Percent Disagree
Total Number of Additional Transfers Sent
Total Number of Additional Transfers met the Inclusion Criteria
Percent Additional
Total Number of Additional Transfers Send - Inpatient
CRISP ID NOT FOUND- Inpatient
Additional Transfers that met the Inclusion Criteria from Inpatient
Total Number of Additional Transfers Send - Outpatient
CRISP ID NOT FOUND-Outpatient
Additional Transfers that met the Inclusion Criteria from Outpatient
210012 SINAI 237 55 23% 0 0 0% 0210033 CARROLL COUNTY 511 23 5% 0 0 0% 0210005 FREDERICK MEMORIAL 398 15 4% 0 0 0% 0210051 DOCTORS COMMUNITY 153 4 3% 0 0 0% 0210035 CHARLES REGIONAL 38 0 0% 1186 0 0% 13 0 1173 0 0
210043
BALTIMORE WASHINGTON MEDICAL CENTER 127 0 0% 776 0 0% 37 3 0 725 11 0
210049UPPER CHESAPEAKE HEALTH 137 0 0% 659 0 0% 90 0 569 0 0
210006 HARFORD 44 0 0% 389 0 0% 37 0 0 352 0 0210030 CHESTERTOWN 28 0 0% 252 2 0% 5 0 247 0 2210010 DORCHESTER 20 0 0% 247 1 0% 5 0 242 0 1210037 EASTON 82 0 0% 239 1 0% 26 1 0 213 1 1210063 UM ST. JOSEPH 50 0 0% 111 0 0% 10 2 0 99 1 0210038 UMMC MIDTOWN 42 0 0% 78 0 0% 19 0 59 0 0210008 MERCY 283210015 FRANKLIN SQUARE 419
210018MONTGOMERY GENERAL 59
210024 UNION MEMORIAL 215210028 ST. MARY 79210034 HARBOR 299210044 G.B.M.C. 224
210056GOOD SAMARITAN HOSPITAL 375
210058 REHAB & ORTHO 10210062 SOUTHERN MARYLAND 95
210088QUEEN ANNE'S EMERGENCY CENTER 69
218992UNIVERSITY OF MD SHOCK TRAUMA
Total 3,994 97 2% 3937 4 0% 242 6 0 3679 13 4
Table 1: Validation Results from Referring Hospitals
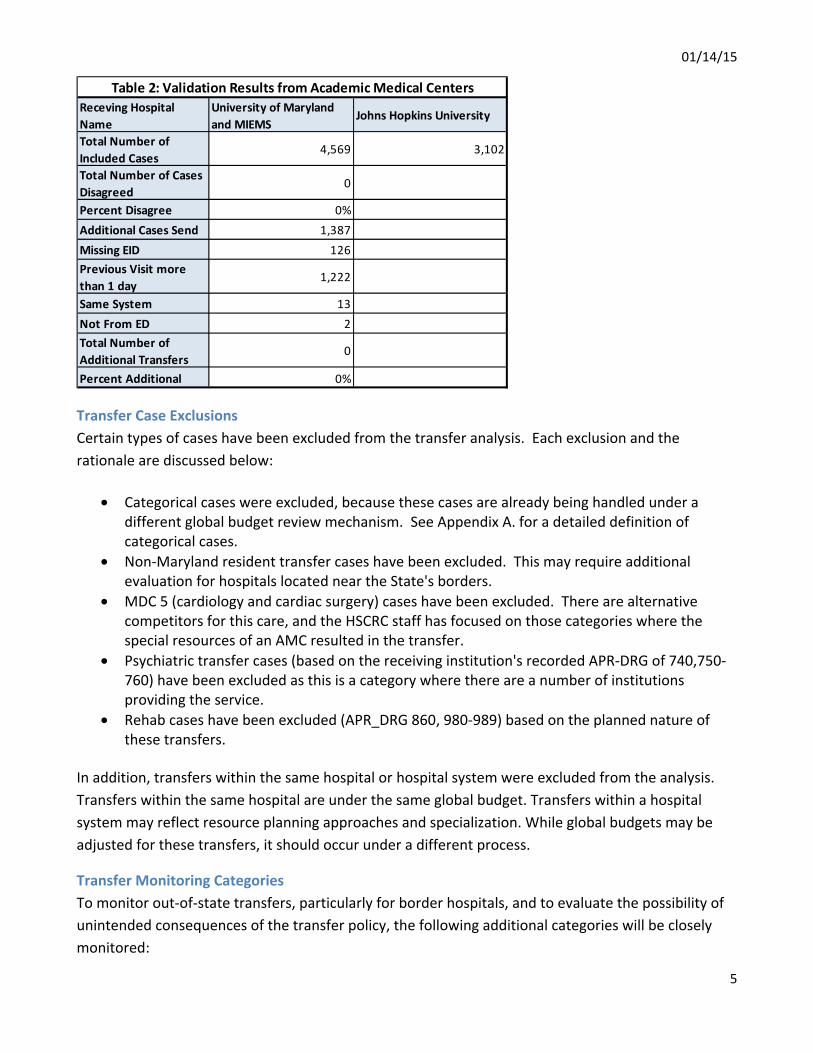
01/14/15
5
Transfer Case Exclusions Certain types of cases have been excluded from the transfer analysis. Each exclusion and the rationale are discussed below:
• Categorical cases were excluded, because these cases are already being handled under a different global budget review mechanism. See Appendix A. for a detailed definition of categorical cases.
• Non-Maryland resident transfer cases have been excluded. This may require additional evaluation for hospitals located near the State's borders.
• MDC 5 (cardiology and cardiac surgery) cases have been excluded. There are alternative competitors for this care, and the HSCRC staff has focused on those categories where the special resources of an AMC resulted in the transfer.
• Psychiatric transfer cases (based on the receiving institution's recorded APR-DRG of 740,750-760) have been excluded as this is a category where there are a number of institutions providing the service.
• Rehab cases have been excluded (APR_DRG 860, 980-989) based on the planned nature of these transfers.
In addition, transfers within the same hospital or hospital system were excluded from the analysis. Transfers within the same hospital are under the same global budget. Transfers within a hospital system may reflect resource planning approaches and specialization. While global budgets may be adjusted for these transfers, it should occur under a different process.
Transfer Monitoring Categories To monitor out-of-state transfers, particularly for border hospitals, and to evaluate the possibility of unintended consequences of the transfer policy, the following additional categories will be closely monitored:
Receving Hospital Name
University of Maryland and MIEMS
Johns Hopkins University
Total Number of Included Cases
4,569 3,102
Total Number of Cases Disagreed
0
Percent Disagree 0%Additional Cases Send 1,387Missing EID 126Previous Visit more than 1 day
1,222
Same System 13Not From ED 2Total Number of Additional Transfers
0
Percent Additional 0%
Table 2: Validation Results from Academic Medical Centers

01/14/15
6
1. Transfers that are excluded from payment adjustments 2. Transfers to out-of-state providers 3. Levels of ED Diversion 4. Case mix intensity of transfer cases 5. Length of stay of transfer cases in sending and receiving hospitals
Transfer Payment Measures HSCRC staff proposes the following measurement for the payment adjustments:
AMC GBR Transfer Adjustments On a quarterly basis, AMC GBR budgets are adjusted by the increase or decrease in transfer cases net of population adjustment weighted by the average adjusted cost per transfer case. The average adjusted cost is calculated as the base year average charge *Price Update*Variable Cost Factor. The adjustments are done separately for patient transferred from inpatient setting and from emergency departments based on the recommendations from the sub-workgroup. Table 3 below provides the calculation for FY 2015 GBR adjustments using FY2014 transfer rates. Table 3: Average Adjusted Transfer Cost for FY2015 GBR adjustments Price Update (FY 2015) A 2.41%VCF B 50% Transfers From ED Average Charge of Transfer Cases in FY 2014 C $25,092 Average Transfer Case Adjustment D= C*(1+A)*B $12,848 Transfers From Inpatient Average Charge of Transfer Cases in CY2013 H $50,303 Average Transfer Case Adjustment I= H*(1+A)*B $25,758
Average Adjusted Transfer Cost for FY 2015
Sending Hospital GBR Transfer Adjustments Sending hospital transfer rates will be monitored on a quarterly basis and the GBR revenues will be reduced on an annual basis by the increase in transfer cases weighted by the average adjusted cost per transfer case. The average adjusted cost for these adjustments will be determined according to the formula stated in AMC adjustment section above. If cumulative payment adjustments to the AMCs exceed 5% of the base year transfer charges, HSCRC staff may adjust the transferring hospital GBR budgets during the course of the fiscal year. Otherwise, transfer adjustments will be

01/14/15
7
implemented on an annual basis. For hospitals with increases above a 10% threshold and with at least 10 additional transfers, those cases above the 10% threshold will be charged to the budget of the sending GBR hospital, thereby reducing the GBR revenue for the preceding year for that hospital. If the net amount of transfers for the entire State does not exceed an increase of 5% of the base transfers, then no reductions will be made for transfers below a 10% threshold. If the net transfer amount exceeds an increase of 5%, then the excess over 5% will be deducted on a per case basis for those hospitals with increases in transfer cases between 5% and 10%. Table 4 below illustrates the sample calculation for sending hospitals. Table 4: Example GBR Transfer Payment Adjustment Calculation for Sending Hospitals Average Cost of Transfers
From ED A 12,885$ From Inpatient B 25,806$
Base Year Transfer Cases for Hospital AFrom ED C 100
From Inpatient D 100Total E= C+D 200
Current Year Transfer Cases for Hospital AFrom ED F 120
From Inpatient G 110Total H=F+G 230
Tranfer Case Growth I=H-E 30
Base Year Total Transfer CostFrom ED J=A*C 1,288,523$
From Inpatient K=B*D 2,580,634$ Total L=J+K 3,869,156$
Current Year Total Transfer CostFrom ED M=A*F 1,546,227$
From Inpatient N=B*G 2,838,697$ Total O=M+N 4,384,924$
Transfer Cost Growth ($) P=O-L 515,768$ 10% Transfer Cost Threshold R=L*10% 386,916$ GBR transfer Payment Adjustment S=P-L (128,852)$
If State tranfer Cost Growth>5%5% Transfer Cost Threshold T=L*5% 193,458$
GBR transfer Payment Adjustment U=P-T (322,310)$
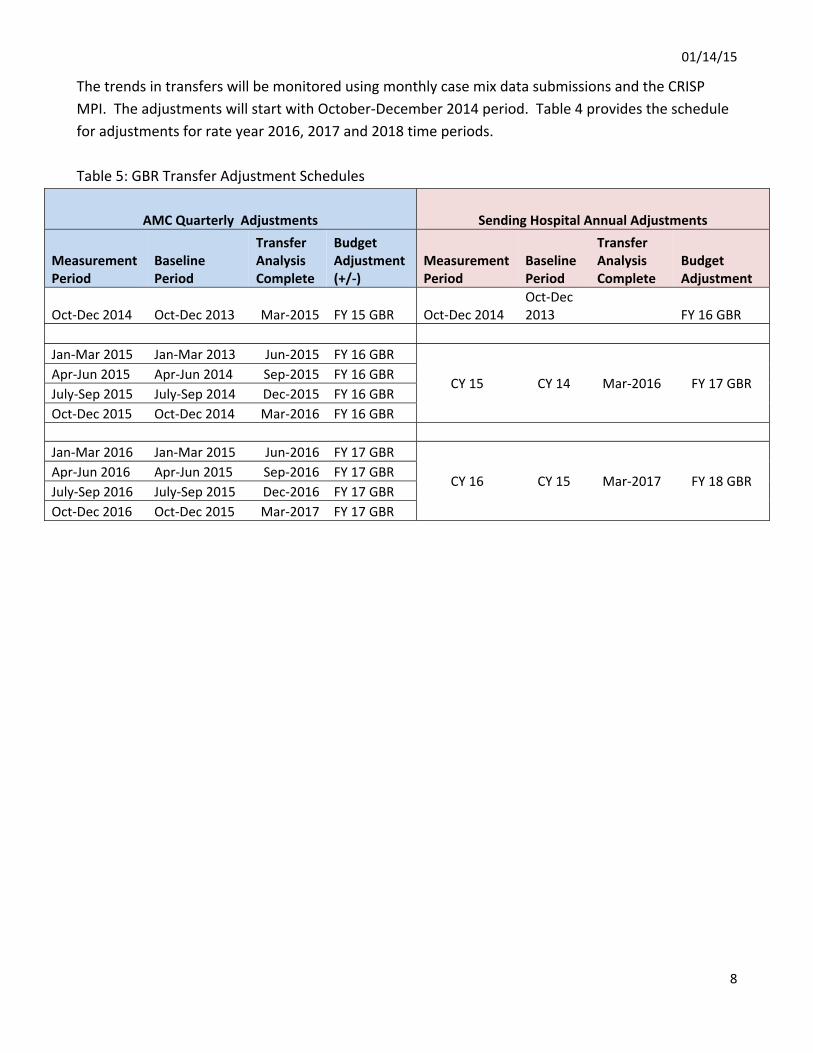
01/14/15
8
The trends in transfers will be monitored using monthly case mix data submissions and the CRISP MPI. The adjustments will start with October-December 2014 period. Table 4 provides the schedule for adjustments for rate year 2016, 2017 and 2018 time periods. Table 5: GBR Transfer Adjustment Schedules
AMC Quarterly Adjustments Sending Hospital Annual Adjustments
Measurement Period
Baseline Period
Transfer Analysis Complete
Budget Adjustment (+/-)
Measurement Period
Baseline Period
Transfer Analysis Complete
Budget Adjustment
Oct-Dec 2014 Oct-Dec 2013 Mar-2015 FY 15 GBR Oct-Dec 2014 Oct-Dec 2013 FY 16 GBR
Jan-Mar 2015 Jan-Mar 2013 Jun-2015 FY 16 GBR
CY 15 CY 14 Mar-2016 FY 17 GBR Apr-Jun 2015 Apr-Jun 2014 Sep-2015 FY 16 GBR July-Sep 2015 July-Sep 2014 Dec-2015 FY 16 GBR Oct-Dec 2015 Oct-Dec 2014 Mar-2016 FY 16 GBR
Jan-Mar 2016 Jan-Mar 2015 Jun-2016 FY 17 GBR
CY 16 CY 15 Mar-2017 FY 18 GBR Apr-Jun 2016 Apr-Jun 2015 Sep-2016 FY 17 GBR July-Sep 2016 July-Sep 2015 Dec-2016 FY 17 GBR Oct-Dec 2016 Oct-Dec 2015 Mar-2017 FY 17 GBR

01/14/15
9
Appendix: Data Analysis Results (Data updated on December 18th, 2014)
UMMS MIEMSS JHH Non-AMCTotal Same Day Transfers
8,423 2,927 7,385 34,731 53,466 100% 35%
Transfer Exclusions
1. Same Hospital 689 429 1414 12144 14,676 27% -
2.Same System 2923 845 1514 6231 11,513 22% -
3.Non-Resident 201 123 189 764 1,277 2% -
4. MDC 5 714 23 649 2272 3,658 7% 38%
5.Rehab 0 0 7 1928 1,935 4% 0%
6.Pysch 638 1 229 4018 4,886 9% 18%7.Categorical Exclusions
27 0 12 127 166 0% 23%
Sam DayTransfers Included in the Analysis
3,231 1,506 3,371 7,247 15,355 29% 53%
Table 6: Same Day Transfers Exclusions , FY 2014Receiving Hospital
TotalPercent
TotalAMC Percent
Counts are mutually exclusive in hieratical order as displayed in the table. *Burn cases at Johns Hopkins Bayview Hospital.
Table 7: Same Day Transfers by Source FY 2014
Number of Transfers Average Charge Total Charge
Source All
Source All
Source All From
ED From
Inpatient From
ED From
Inpatient From ED From Inpatient
Receiving Hospital 1,718 1,513 3,231 $26,473 $45,861 $35,552 $45,481,296 $69,387,963 $114,869,259 UMMS
MIEMSS 1,216 290 1,506 $28,175 $73,843 $36,969 $34,260,354 $21,414,370 $55,674,723
JHH 2,272 1115 3,387 $22,563 $50,457 $31,745 $51,262,129 $56,259,273 $107,521,401
Total 5,206 2,918 8,124 $25,164 $50,398 $34,228 $131,003,778 $147,061,605 $278,065,383
Non-AMC 5,345 2,283 7,628 $11,024 $18,083 $13,137 $58,922,148 $41,283,694 $100,205,842
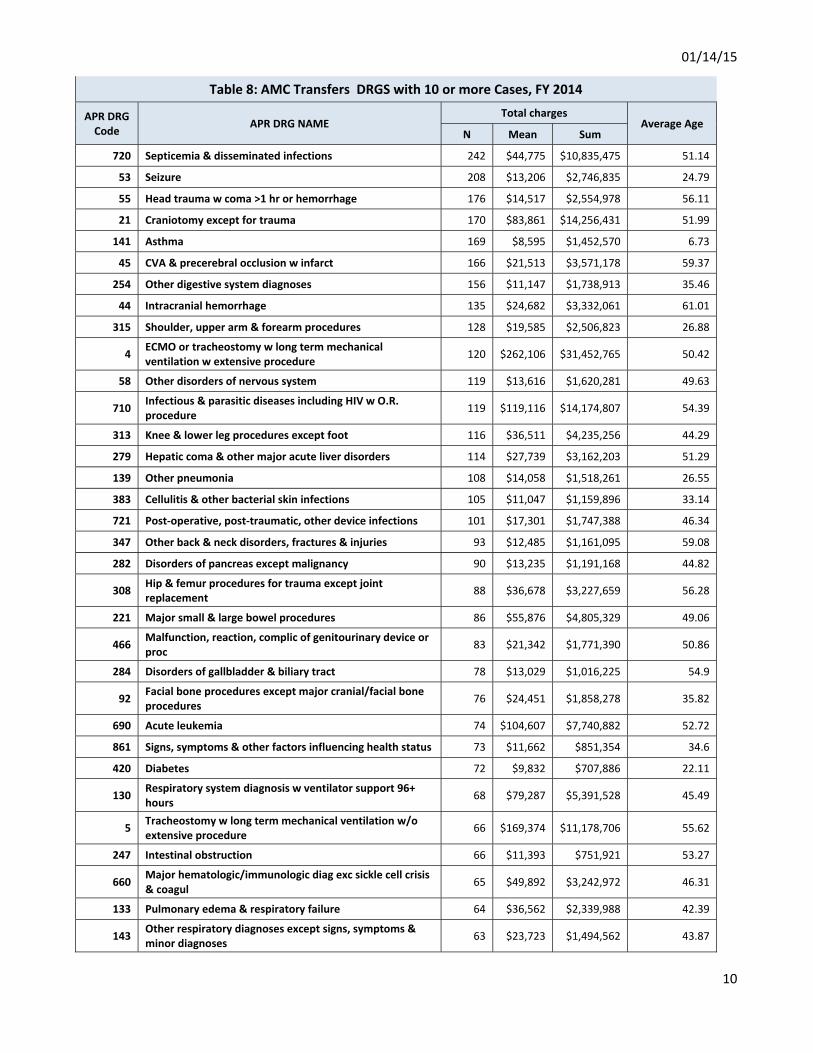
01/14/15
10
Table 8: AMC Transfers DRGS with 10 or more Cases, FY 2014
APR DRG Code APR DRG NAME
Total charges Average Age
N Mean Sum
720 Septicemia & disseminated infections 242 $44,775 $10,835,475 51.14
53 Seizure 208 $13,206 $2,746,835 24.79
55 Head trauma w coma >1 hr or hemorrhage 176 $14,517 $2,554,978 56.11
21 Craniotomy except for trauma 170 $83,861 $14,256,431 51.99
141 Asthma 169 $8,595 $1,452,570 6.73
45 CVA & precerebral occlusion w infarct 166 $21,513 $3,571,178 59.37
254 Other digestive system diagnoses 156 $11,147 $1,738,913 35.46
44 Intracranial hemorrhage 135 $24,682 $3,332,061 61.01
315 Shoulder, upper arm & forearm procedures 128 $19,585 $2,506,823 26.88
4 ECMO or tracheostomy w long term mechanical ventilation w extensive procedure 120 $262,106 $31,452,765 50.42
58 Other disorders of nervous system 119 $13,616 $1,620,281 49.63
710 Infectious & parasitic diseases including HIV w O.R. procedure 119 $119,116 $14,174,807 54.39
313 Knee & lower leg procedures except foot 116 $36,511 $4,235,256 44.29
279 Hepatic coma & other major acute liver disorders 114 $27,739 $3,162,203 51.29
139 Other pneumonia 108 $14,058 $1,518,261 26.55
383 Cellulitis & other bacterial skin infections 105 $11,047 $1,159,896 33.14
721 Post-operative, post-traumatic, other device infections 101 $17,301 $1,747,388 46.34
347 Other back & neck disorders, fractures & injuries 93 $12,485 $1,161,095 59.08
282 Disorders of pancreas except malignancy 90 $13,235 $1,191,168 44.82
308 Hip & femur procedures for trauma except joint replacement 88 $36,678 $3,227,659 56.28
221 Major small & large bowel procedures 86 $55,876 $4,805,329 49.06
466 Malfunction, reaction, complic of genitourinary device or proc 83 $21,342 $1,771,390 50.86
284 Disorders of gallbladder & biliary tract 78 $13,029 $1,016,225 54.9
92 Facial bone procedures except major cranial/facial bone procedures 76 $24,451 $1,858,278 35.82
690 Acute leukemia 74 $104,607 $7,740,882 52.72
861 Signs, symptoms & other factors influencing health status 73 $11,662 $851,354 34.6
420 Diabetes 72 $9,832 $707,886 22.11
130 Respiratory system diagnosis w ventilator support 96+ hours 68 $79,287 $5,391,528 45.49
5 Tracheostomy w long term mechanical ventilation w/o extensive procedure 66 $169,374 $11,178,706 55.62
247 Intestinal obstruction 66 $11,393 $751,921 53.27
660 Major hematologic/immunologic diag exc sickle cell crisis & coagul 65 $49,892 $3,242,972 46.31
133 Pulmonary edema & respiratory failure 64 $36,562 $2,339,988 42.39
143 Other respiratory diagnoses except signs, symptoms & minor diagnoses 63 $23,723 $1,494,562 43.87

01/14/15
11
Table 8: AMC Transfers DRGS with 10 or more Cases, FY 2014
APR DRG Code APR DRG NAME
Total charges Average Age
N Mean Sum
720 Septicemia & disseminated infections 242 $44,775 $10,835,475 51.14
813 Other complications of treatment 63 $12,508 $787,999 50.14
252 Malfunction, reaction & complication of GI device or procedure 62 $17,874 $1,108,169 50.4
283 Other disorders of the liver 61 $17,719 $1,080,840 48.66
351 Other musculoskeletal system & connective tissue diagnoses 61 $10,780 $657,550 40.87
281 Malignancy of hepatobiliary system & pancreas 59 $21,494 $1,268,162 61.19
138 Bronchiolitis & RSV pneumonia 58 $11,589 $672,182 1.79
662 Sickle cell anemia crisis 58 $16,084 $932,888 25.76
812 Poisoning of medicinal agents 58 $10,875 $630,729 22.19
711 Post-op, post-trauma, other device infections w O.R. procedure 56 $56,729 $3,176,822 53.61
248 Major gastrointestinal & peritoneal infections 53 $19,831 $1,051,050 44.06
463 Kidney & urinary tract infections 53 $10,466 $554,712 42.53
41 Nervous system malignancy 52 $20,199 $1,050,363 57.83
566 Other antepartum diagnoses 52 $12,014 $624,738 26.81
460 Renal failure 51 $34,194 $1,743,876 55.57
280 Alcoholic liver disease 50 $24,102 $1,205,082 53.16
791 O.R. procedure for other complications of treatment 49 $41,892 $2,052,688 56
342 Fractures & dislocations except femur, pelvis & back 48 $9,017 $432,798 43.31
225 Appendectomy 47 $16,686 $784,233 13.47
930 Multiple significant trauma w/o O.R. procedure 47 $18,527 $870,780 53.89
317 Tendon, muscle & other soft tissue procedures 46 $60,051 $2,762,347 44.65
54 Migraine & other headaches 45 $7,305 $328,717 35.71
115 Other ear, nose, mouth,throat & cranial/facial diagnoses 45 $11,811 $531,510 33.49
121 Other respiratory & chest procedures 45 $55,303 $2,488,656 50.67
253 Other & unspecified gastrointestinal hemorrhage 45 $13,929 $626,820 58.47
844 Partial thickness burns w or w/o skin graft 45 $4,532 $203,922 3.47
241 Peptic ulcer & gastritis 44 $18,624 $819,449 49.11
384 Contusion, open wound & other trauma to skin & subcutaneous tissue 44 $8,204 $360,984 35.36
113 Infections of upper respiratory tract 43 $6,495 $279,297 18.35
22 Ventricular shunt procedures 42 $52,554 $2,207,265 33.79
82 Eye disorders except major infections 42 $10,181 $427,598 41.48
346 Connective tissue disorders 42 $31,436 $1,320,314 49.55
691 Lymphoma, myeloma & non-acute leukemia 41 $44,529 $1,825,676 56.41
57 Concussion, closed skull Fx nos,uncomplicated intracranial injury, coma < 1 hr or no coma 40 $8,633 $345,306 28.45
663 Other anemia & disorders of blood & blood-forming organs 40 $9,822 $392,883 27.9

01/14/15
12
Table 8: AMC Transfers DRGS with 10 or more Cases, FY 2014
APR DRG Code APR DRG NAME
Total charges Average Age
N Mean Sum
720 Septicemia & disseminated infections 242 $44,775 $10,835,475 51.14
301 Hip joint replacement 39 $55,642 $2,170,047 67.95
135 Major chest & respiratory trauma 38 $14,077 $534,944 65.45
245 Inflammatory bowel disease 38 $19,777 $751,513 29.47
249 Non-bacterial gastroenteritis, nausea & vomiting 38 $10,128 $384,858 34.37
344 Osteomyelitis, septic arthritis & other musculoskeletal infections 38 $28,683 $1,089,950 47.13
912 Musculoskeletal & other procedures for multiple significant trauma 38 $59,225 $2,250,559 46.87
20 Craniotomy for trauma 37 $49,633 $1,836,428 56.86
23 Spinal procedures 37 $72,891 $2,696,980 59
48 Peripheral, cranial & autonomic nerve disorders 37 $17,722 $655,728 45.32
951 Moderately extensive procedure unrelated to principal diagnosis 37 $66,105 $2,445,891 50.32
137 Major respiratory infections & inflammations 37 $29,814 $1,103,126 40.22
724 Other infectious & parasitic diseases 37 $23,307 $862,342 43.35
42 Degenerative nervous system disorders exc mult sclerosis 36 $37,565 $1,352,347 54.5
134 Pulmonary embolism 36 $23,795 $856,624 49.06
240 Digestive malignancy 36 $17,968 $646,844 60.97
561 Postpartum & post abortion diagnoses w/o procedure 36 $3,332 $119,947 27.97
98 Other ear, nose, mouth & throat procedures 34 $16,642 $565,843 40.97
114 Dental & oral diseases & injuries 34 $9,195 $312,636 40.5
136 Respiratory malignancy 34 $29,671 $1,008,822 64.21
321 Cervical spinal fusion & other back/neck proc exc disc excis/decomp 34 $62,146 $2,112,950 60.59
723 Viral illness 34 $15,565 $529,193 25.38
52 Nontraumatic stupor & coma 33 $49,099 $1,620,273 52.61
24 Extracranial vascular procedures 32 $60,245 $1,927,833 55.91
950 Extensive procedure unrelated to principal diagnosis 32 $84,876 $2,716,044 50.41
220 Major stomach, esophageal & duodenal procedures 32 $56,937 $1,821,982 56.28
251 Abdominal pain 31 $7,419 $229,980 38.68
144 Respiratory signs, symptoms & minor diagnoses 30 $16,279 $488,361 36.5
243 Other esophageal disorders 30 $10,179 $305,357 38.1
263 Laparoscopic cholecystectomy 30 $21,101 $633,037 43.07
309 Hip & femur procedures for non-trauma except joint replacement 30 $69,911 $2,097,340 40.97
364 Other skin, subcutaneous tissue & related procedures 30 $20,356 $610,687 39.73
468 Other kidney & urinary tract diagnoses, signs & symptoms 29 $15,700 $455,296 49.31
229 Other digestive system & abdominal procedures 28 $43,209 $1,209,854 47.79
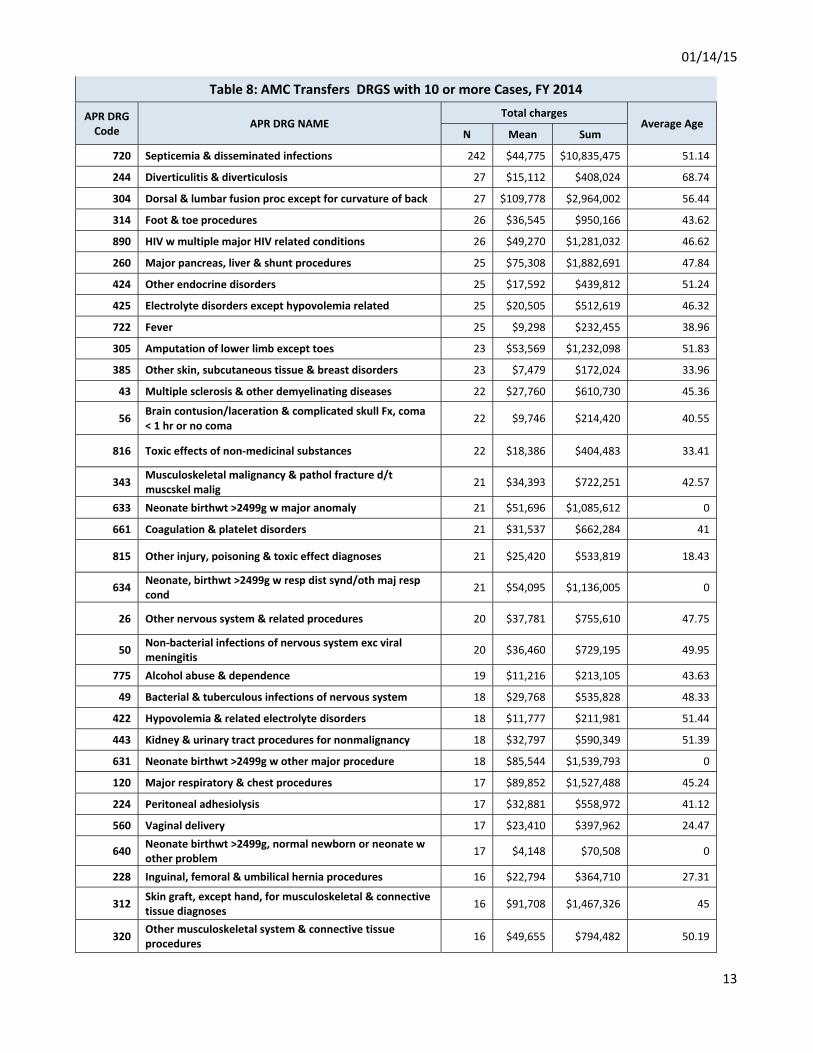
01/14/15
13
Table 8: AMC Transfers DRGS with 10 or more Cases, FY 2014
APR DRG Code APR DRG NAME
Total charges Average Age
N Mean Sum
720 Septicemia & disseminated infections 242 $44,775 $10,835,475 51.14
244 Diverticulitis & diverticulosis 27 $15,112 $408,024 68.74
304 Dorsal & lumbar fusion proc except for curvature of back 27 $109,778 $2,964,002 56.44
314 Foot & toe procedures 26 $36,545 $950,166 43.62
890 HIV w multiple major HIV related conditions 26 $49,270 $1,281,032 46.62
260 Major pancreas, liver & shunt procedures 25 $75,308 $1,882,691 47.84
424 Other endocrine disorders 25 $17,592 $439,812 51.24
425 Electrolyte disorders except hypovolemia related 25 $20,505 $512,619 46.32
722 Fever 25 $9,298 $232,455 38.96
305 Amputation of lower limb except toes 23 $53,569 $1,232,098 51.83
385 Other skin, subcutaneous tissue & breast disorders 23 $7,479 $172,024 33.96
43 Multiple sclerosis & other demyelinating diseases 22 $27,760 $610,730 45.36
56 Brain contusion/laceration & complicated skull Fx, coma < 1 hr or no coma 22 $9,746 $214,420 40.55
816 Toxic effects of non-medicinal substances 22 $18,386 $404,483 33.41
343 Musculoskeletal malignancy & pathol fracture d/t muscskel malig 21 $34,393 $722,251 42.57
633 Neonate birthwt >2499g w major anomaly 21 $51,696 $1,085,612 0
661 Coagulation & platelet disorders 21 $31,537 $662,284 41
815 Other injury, poisoning & toxic effect diagnoses 21 $25,420 $533,819 18.43
634 Neonate, birthwt >2499g w resp dist synd/oth maj resp cond 21 $54,095 $1,136,005 0
26 Other nervous system & related procedures 20 $37,781 $755,610 47.75
50 Non-bacterial infections of nervous system exc viral meningitis 20 $36,460 $729,195 49.95
775 Alcohol abuse & dependence 19 $11,216 $213,105 43.63
49 Bacterial & tuberculous infections of nervous system 18 $29,768 $535,828 48.33
422 Hypovolemia & related electrolyte disorders 18 $11,777 $211,981 51.44
443 Kidney & urinary tract procedures for nonmalignancy 18 $32,797 $590,349 51.39
631 Neonate birthwt >2499g w other major procedure 18 $85,544 $1,539,793 0
120 Major respiratory & chest procedures 17 $89,852 $1,527,488 45.24
224 Peritoneal adhesiolysis 17 $32,881 $558,972 41.12
560 Vaginal delivery 17 $23,410 $397,962 24.47
640 Neonate birthwt >2499g, normal newborn or neonate w other problem 17 $4,148 $70,508 0
228 Inguinal, femoral & umbilical hernia procedures 16 $22,794 $364,710 27.31
312 Skin graft, except hand, for musculoskeletal & connective tissue diagnoses 16 $91,708 $1,467,326 45
320 Other musculoskeletal system & connective tissue procedures 16 $49,655 $794,482 50.19

01/14/15
14
Table 8: AMC Transfers DRGS with 10 or more Cases, FY 2014
APR DRG Code APR DRG NAME
Total charges Average Age
N Mean Sum
720 Septicemia & disseminated infections 242 $44,775 $10,835,475 51.14
349 Malfunction, reaction, complic of orthopedic device or procedure 16 $26,234 $419,745 58.19
140 Chronic obstructive pulmonary disease 15 $10,785 $161,780 66.53
142 Interstitial lung disease 15 $23,020 $345,294 57.87
223 Other small & large bowel procedures 15 $46,177 $692,660 29.33
341 Fracture of pelvis or dislocation of hip 15 $10,430 $156,452 58.4
540 Cesarean delivery 15 $27,199 $407,991 28.53
911 Extensive abdominal/thoracic procedures for mult significant trauma 15 $100,263 $1,503,940 33
70 Orbital procedures 14 $20,028 $280,394 44.5
262 Cholecystectomy except laparoscopic 14 $45,902 $642,627 66
340 Fracture of femur 14 $8,823 $123,525 31.79
380 Skin ulcers 14 $23,798 $333,167 58.14
423 Inborn errors of metabolism 14 $23,125 $323,751 20
681 Other O.R. procedures for lymphatic/hematopoietic/other neoplasms 14 $67,501 $945,010 58.57
694 Lymphatic & other malignancies & neoplasms of uncertain behavior 14 $27,793 $389,095 55.43
40 Spinal disorders & injuries 13 $18,247 $237,212 60
47 Transient ischemia 13 $9,162 $119,112 54.23
952 Nonextensive procedure unrelated to principal diagnosis 13 $32,407 $421,289 58.08
222 Other stomach, esophageal & duodenal procedures 12 $30,657 $367,882 4.42
401 Pituitary & adrenal procedures 12 $54,971 $659,657 48.92
461 Kidney & urinary tract malignancy 12 $12,078 $144,936 67.75
892 HIV w major HIV related condition 12 $15,473 $185,676 41.5
80 Acute major eye infections 11 $16,008 $176,086 46.36
242 Major esophageal disorders 11 $18,475 $203,230 51.91
316 Hand & wrist procedures 11 $23,597 $259,572 23.73
381 Major skin disorders 11 $5,999 $65,993 34.45
421 Malnutrition, failure to thrive & other nutritional disorders 11 $13,870 $152,573 16.18
447 Other kidney, urinary tract & related procedures 11 $60,732 $668,052 47.18
465 Urinary stones & acquired upper urinary tract obstruction 11 $8,440 $92,837 42.45
513 Uterine & adnexa procedures for non-malignancy except leiomyoma 11 $21,029 $231,319 37.18
773 Opioid abuse & dependence 11 $5,288 $58,173 41.91
46 Nonspecific CVA & precerebral occlusion w/o infarct 10 $7,424 $74,240 47.8
51 Viral meningitis 10 $13,044 $130,442 20.9

01/14/15
15
Table 8: AMC Transfers DRGS with 10 or more Cases, FY 2014
APR DRG Code APR DRG NAME
Total charges Average Age
N Mean Sum
720 Septicemia & disseminated infections 242 $44,775 $10,835,475 51.14
131 Cystic fibrosis - pulmonary disease 10 $12,182 $121,824 20.9
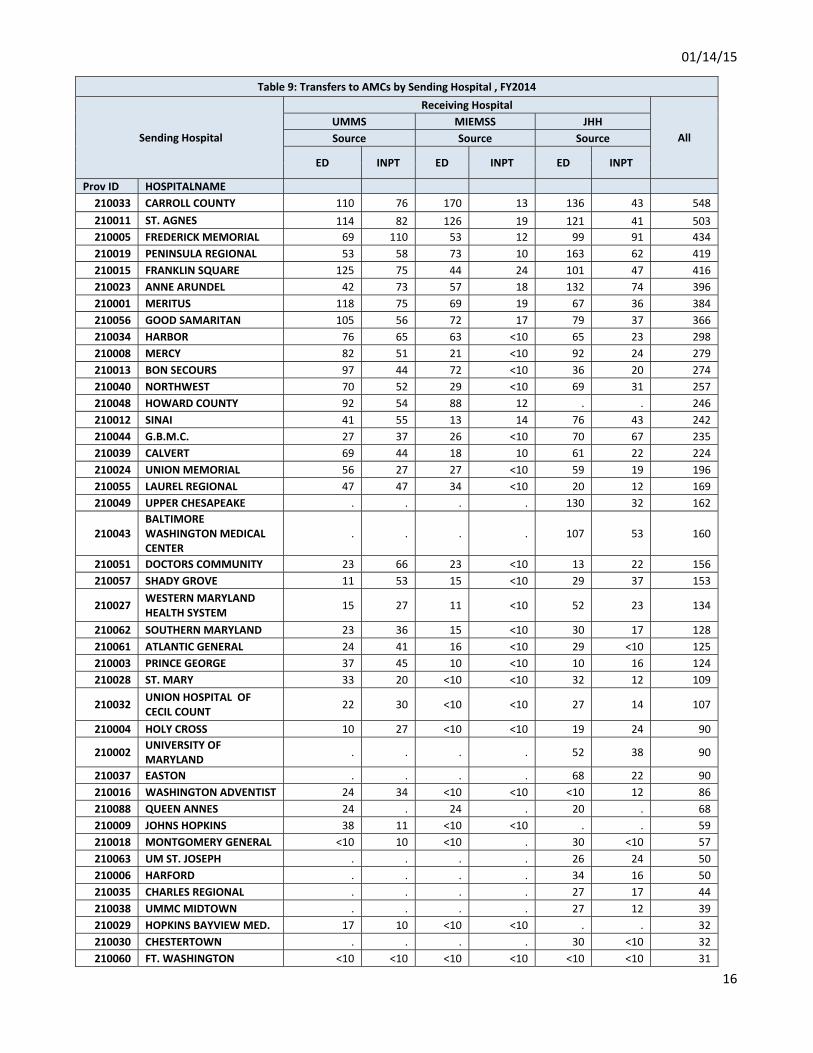
01/14/15
16
Table 9: Transfers to AMCs by Sending Hospital , FY2014
Sending Hospital
Receiving Hospital
All UMMS MIEMSS JHH Source Source Source
ED INPT ED INPT ED INPT
Prov ID HOSPITALNAME 210033 CARROLL COUNTY 110 76 170 13 136 43 548 210011 ST. AGNES 114 82 126 19 121 41 503 210005 FREDERICK MEMORIAL 69 110 53 12 99 91 434 210019 PENINSULA REGIONAL 53 58 73 10 163 62 419 210015 FRANKLIN SQUARE 125 75 44 24 101 47 416 210023 ANNE ARUNDEL 42 73 57 18 132 74 396 210001 MERITUS 118 75 69 19 67 36 384 210056 GOOD SAMARITAN 105 56 72 17 79 37 366 210034 HARBOR 76 65 63 <10 65 23 298 210008 MERCY 82 51 21 <10 92 24 279 210013 BON SECOURS 97 44 72 <10 36 20 274 210040 NORTHWEST 70 52 29 <10 69 31 257 210048 HOWARD COUNTY 92 54 88 12 . . 246 210012 SINAI 41 55 13 14 76 43 242 210044 G.B.M.C. 27 37 26 <10 70 67 235 210039 CALVERT 69 44 18 10 61 22 224 210024 UNION MEMORIAL 56 27 27 <10 59 19 196 210055 LAUREL REGIONAL 47 47 34 <10 20 12 169 210049 UPPER CHESAPEAKE . . . . 130 32 162
210043 BALTIMORE WASHINGTON MEDICAL CENTER
. . . . 107 53 160
210051 DOCTORS COMMUNITY 23 66 23 <10 13 22 156 210057 SHADY GROVE 11 53 15 <10 29 37 153
210027 WESTERN MARYLAND HEALTH SYSTEM 15 27 11 <10 52 23 134
210062 SOUTHERN MARYLAND 23 36 15 <10 30 17 128 210061 ATLANTIC GENERAL 24 41 16 <10 29 <10 125 210003 PRINCE GEORGE 37 45 10 <10 10 16 124 210028 ST. MARY 33 20 <10 <10 32 12 109
210032 UNION HOSPITAL OF CECIL COUNT 22 30 <10 <10 27 14 107
210004 HOLY CROSS 10 27 <10 <10 19 24 90
210002 UNIVERSITY OF MARYLAND . . . . 52 38 90
210037 EASTON . . . . 68 22 90 210016 WASHINGTON ADVENTIST 24 34 <10 <10 <10 12 86 210088 QUEEN ANNES 24 . 24 . 20 . 68 210009 JOHNS HOPKINS 38 11 <10 <10 . . 59 210018 MONTGOMERY GENERAL <10 10 <10 . 30 <10 57 210063 UM ST. JOSEPH . . . . 26 24 50 210006 HARFORD . . . . 34 16 50 210035 CHARLES REGIONAL . . . . 27 17 44 210038 UMMC MIDTOWN . . . . 27 12 39 210029 HOPKINS BAYVIEW MED. 17 10 <10 <10 . . 32 210030 CHESTERTOWN . . . . 30 <10 32 210060 FT. WASHINGTON <10 <10 <10 <10 <10 <10 31

01/14/15
17
Table 9: Transfers to AMCs by Sending Hospital , FY2014
Sending Hospital
Receiving Hospital
All UMMS MIEMSS JHH Source Source Source
ED INPT ED INPT ED INPT
Prov ID HOSPITALNAME 210022 SUBURBAN <10 <10 <10 . . . 19 210010 DORCHESTER . . . . 12 <10 15 210017 GARRETT COUNTY . <10 . <10 <10 <10 <10 210058 REHAB & ORTHO . . . . . <10 <10 210045 MCCREADY <10 . <10 . <10 . <10 210333 BOWIE HEALTH <10 . <10 . <10 . <10
Total 1,718
1,513
1,216
290
2,271
1,115
8,123

01/14/15
18
Table 10: CY 2014 TYD Quarterly Trends
Transfer Cases Annual Growth Rates Calendar Year To Date
2013 2014 2013 2014
Calendar Quarter Calendar Quarter Calendar Quarter Calendar Quarter
Receiving Hospital 1 2 3 4 1 2 3 3 4 1 2 3 CY 13 CY 14 Change
Count Change
%
Number of Cases
1_UMMS 753 795 831 866 745 789 676 16.1% 9.1% -1.1% -0.8% -18.7% 2,379 2,210 -169 -7.1%
2_MIEMSS 361 401 425 349 357 375 375 15.8% -3.9% -1. 1% -6. 5% -11.8% 1,187 1,107 -80 -6.7%
3_JHH 800 838 886 795 792 898 896 18.4% -1.4% -1.0% 7.2% 1.1% 2,524 2,586 62 2.5%
Average Charge
1_UMMS $38,259 $ 32,147 $30,156 $ 29,826 $42,122 $ 40,998 $ 38,085 9.7% -2.6% 10.1% 27.5% 26.3% $100,563 $121,205 $20,642 20.5%
2_MIEMSS $29,816 $ 37,730 $35,938 $ 37,189 $37,921 $ 37,128 $ 40,168 36.0% 32.5% 27.2% -1.6% 11.8% $103,485 $115,217 $11,732 11.3%
3_JHH $31,169 $ 29,992 $33,026 $ 32,611 $29,742 $ 30,804 $ 34,297 19.8% 16.6% -4.6% 2.7% 3.8% $94,187 $94,843 $656 0.7%
Total Charges
1_UMMS $28,809,383 $ 25,556,691 $25,059,871 $ 25,829,002 $31,380,777 $ 32,347,174 $ 25,745,554 27.3% 6.2% 8.9% 26.6% 2.7% $79,425,945 $89,473,505 $ 10,047,559 12.7%
2_MIEMSS $10,763,632 $ 15,129,838 $15,273,826 $ 12,979,057 $13,537,670 $ 13,923,145 $ 15,062,885 57.5% 27.4% 25.8% -8.0% -1.4% $41,167,296 $42,523,700 $ 1,356,404 3.3%
3_JHH $24,935,219 $ 25,132,982 $29,261,230 $ 25,925,552 $23,555,420 $ 27,661,922 $ 30,730,487 41.9% 15.0% -5.5% 10.1% 5.0% $79,329,431 $81,947,829 $ 2,618,398 3.3%
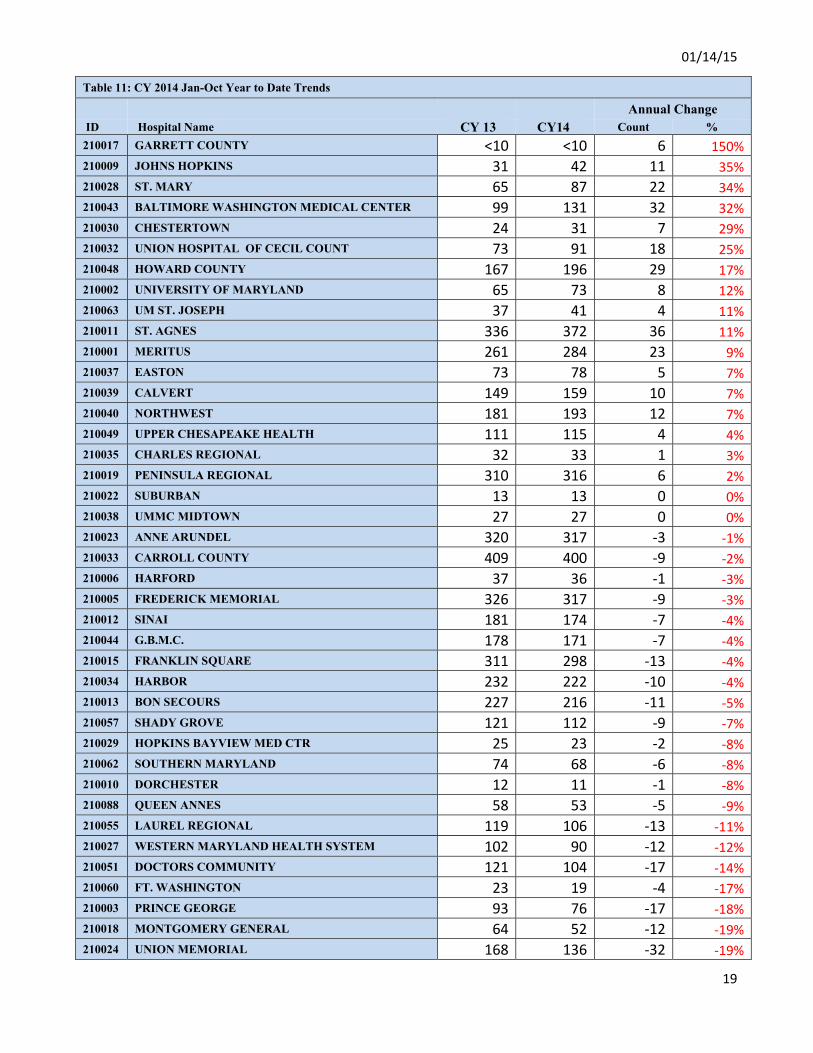
01/14/15
19
Table 11: CY 2014 Jan-Oct Year to Date Trends Annual Change ID Hospital Name CY 13 CY14 Count % 210017 GARRETT COUNTY <10 <10 6 150%210009 JOHNS HOPKINS 31 42 11 35%210028 ST. MARY 65 87 22 34%210043 BALTIMORE WASHINGTON MEDICAL CENTER 99 131 32 32%210030 CHESTERTOWN 24 31 7 29%210032 UNION HOSPITAL OF CECIL COUNT 73 91 18 25%210048 HOWARD COUNTY 167 196 29 17%210002 UNIVERSITY OF MARYLAND 65 73 8 12%210063 UM ST. JOSEPH 37 41 4 11%210011 ST. AGNES 336 372 36 11%210001 MERITUS 261 284 23 9%210037 EASTON 73 78 5 7%210039 CALVERT 149 159 10 7%210040 NORTHWEST 181 193 12 7%210049 UPPER CHESAPEAKE HEALTH 111 115 4 4%210035 CHARLES REGIONAL 32 33 1 3%210019 PENINSULA REGIONAL 310 316 6 2%210022 SUBURBAN 13 13 0 0%210038 UMMC MIDTOWN 27 27 0 0%210023 ANNE ARUNDEL 320 317 -3 -1%210033 CARROLL COUNTY 409 400 -9 -2%210006 HARFORD 37 36 -1 -3%210005 FREDERICK MEMORIAL 326 317 -9 -3%210012 SINAI 181 174 -7 -4%210044 G.B.M.C. 178 171 -7 -4%210015 FRANKLIN SQUARE 311 298 -13 -4%210034 HARBOR 232 222 -10 -4%210013 BON SECOURS 227 216 -11 -5%210057 SHADY GROVE 121 112 -9 -7%210029 HOPKINS BAYVIEW MED CTR 25 23 -2 -8%210062 SOUTHERN MARYLAND 74 68 -6 -8%210010 DORCHESTER 12 11 -1 -8%210088 QUEEN ANNES 58 53 -5 -9%210055 LAUREL REGIONAL 119 106 -13 -11%210027 WESTERN MARYLAND HEALTH SYSTEM 102 90 -12 -12%210051 DOCTORS COMMUNITY 121 104 -17 -14%210060 FT. WASHINGTON 23 19 -4 -17%210003 PRINCE GEORGE 93 76 -17 -18%210018 MONTGOMERY GENERAL 64 52 -12 -19%210024 UNION MEMORIAL 168 136 -32 -19%
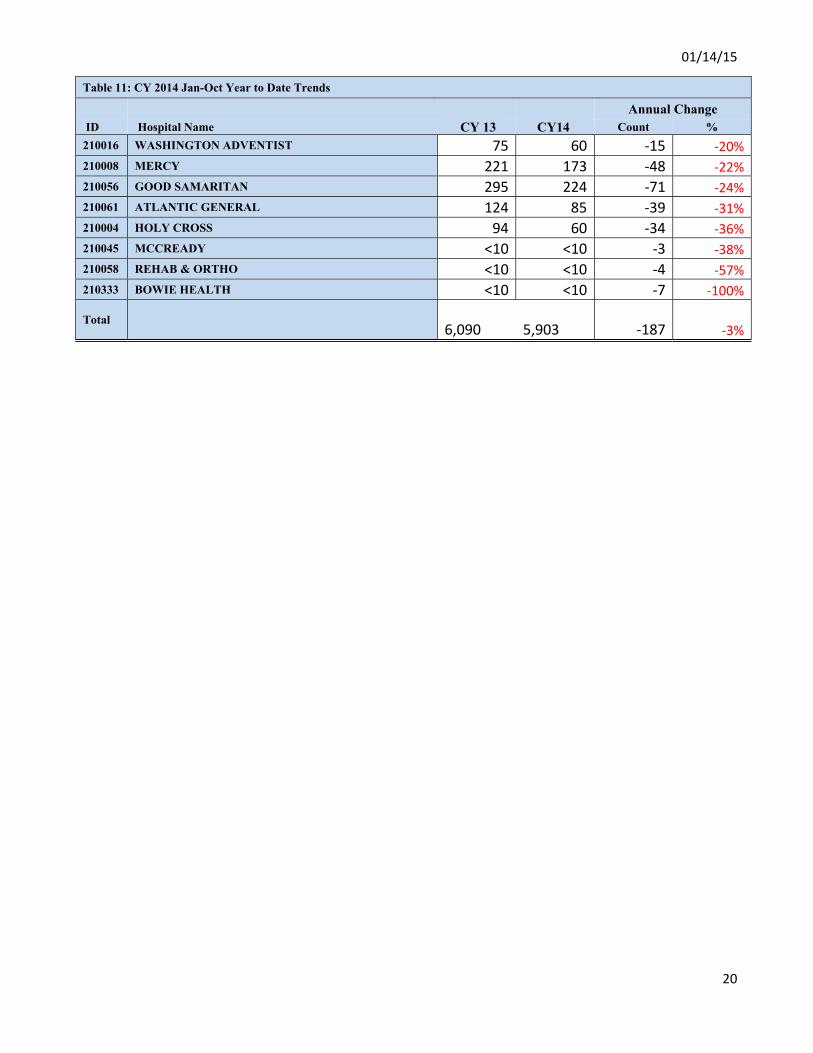
01/14/15
20
Table 11: CY 2014 Jan-Oct Year to Date Trends Annual Change ID Hospital Name CY 13 CY14 Count % 210016 WASHINGTON ADVENTIST 75 60 -15 -20%210008 MERCY 221 173 -48 -22%210056 GOOD SAMARITAN 295 224 -71 -24%210061 ATLANTIC GENERAL 124 85 -39 -31%210004 HOLY CROSS 94 60 -34 -36%210045 MCCREADY <10 <10 -3 -38%210058 REHAB & ORTHO <10 <10 -4 -57%210333 BOWIE HEALTH <10 <10 -7 -100%
Total 6,090
5,903 -187 -3%
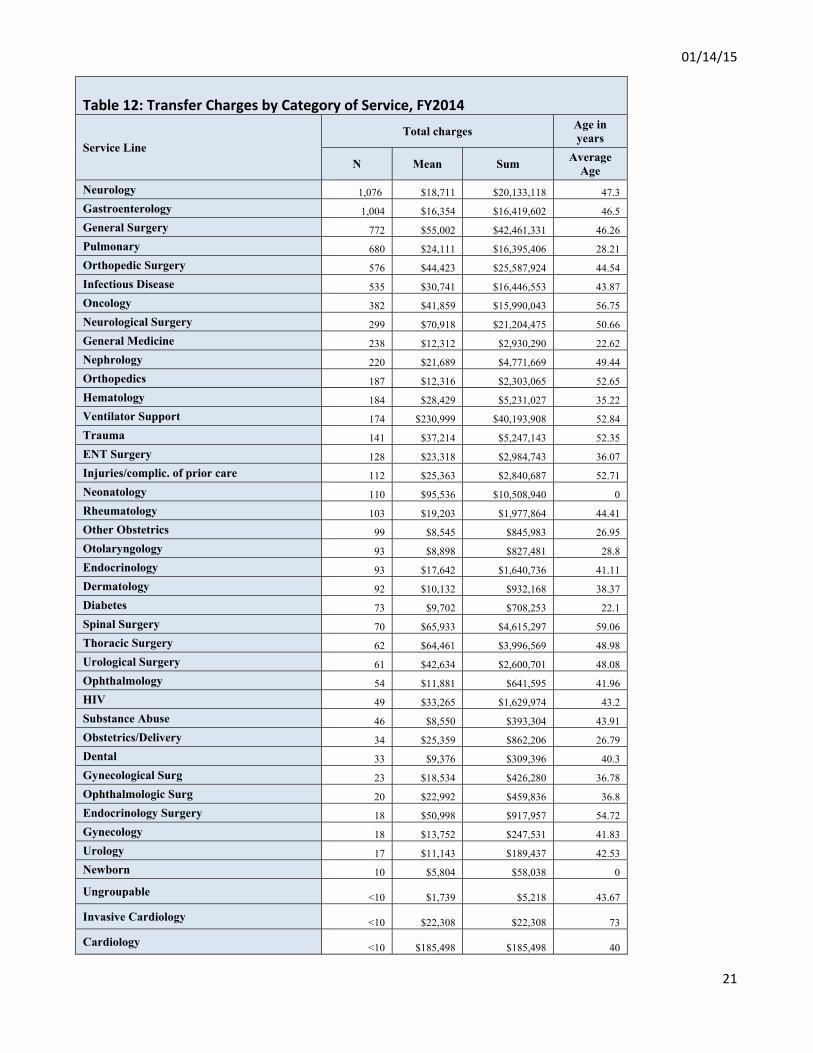
01/14/15
21
Table 12: Transfer Charges by Category of Service, FY2014
Service Line Total charges Age in
years
N Mean Sum Average Age
Neurology 1,076 $18,711 $20,133,118 47.3 Gastroenterology 1,004 $16,354 $16,419,602 46.5 General Surgery 772 $55,002 $42,461,331 46.26 Pulmonary 680 $24,111 $16,395,406 28.21 Orthopedic Surgery 576 $44,423 $25,587,924 44.54 Infectious Disease 535 $30,741 $16,446,553 43.87 Oncology 382 $41,859 $15,990,043 56.75 Neurological Surgery 299 $70,918 $21,204,475 50.66 General Medicine 238 $12,312 $2,930,290 22.62 Nephrology 220 $21,689 $4,771,669 49.44 Orthopedics 187 $12,316 $2,303,065 52.65 Hematology 184 $28,429 $5,231,027 35.22 Ventilator Support 174 $230,999 $40,193,908 52.84 Trauma 141 $37,214 $5,247,143 52.35 ENT Surgery 128 $23,318 $2,984,743 36.07 Injuries/complic. of prior care 112 $25,363 $2,840,687 52.71 Neonatology 110 $95,536 $10,508,940 0 Rheumatology 103 $19,203 $1,977,864 44.41 Other Obstetrics 99 $8,545 $845,983 26.95 Otolaryngology 93 $8,898 $827,481 28.8 Endocrinology 93 $17,642 $1,640,736 41.11 Dermatology 92 $10,132 $932,168 38.37 Diabetes 73 $9,702 $708,253 22.1 Spinal Surgery 70 $65,933 $4,615,297 59.06 Thoracic Surgery 62 $64,461 $3,996,569 48.98 Urological Surgery 61 $42,634 $2,600,701 48.08 Ophthalmology 54 $11,881 $641,595 41.96 HIV 49 $33,265 $1,629,974 43.2 Substance Abuse 46 $8,550 $393,304 43.91 Obstetrics/Delivery 34 $25,359 $862,206 26.79 Dental 33 $9,376 $309,396 40.3 Gynecological Surg 23 $18,534 $426,280 36.78 Ophthalmologic Surg 20 $22,992 $459,836 36.8 Endocrinology Surgery 18 $50,998 $917,957 54.72 Gynecology 18 $13,752 $247,531 41.83 Urology 17 $11,143 $189,437 42.53 Newborn 10 $5,804 $58,038 0
Ungroupable <10 $1,739 $5,218 43.67
Invasive Cardiology <10 $22,308 $22,308 73
Cardiology <10 $185,498 $185,498 40
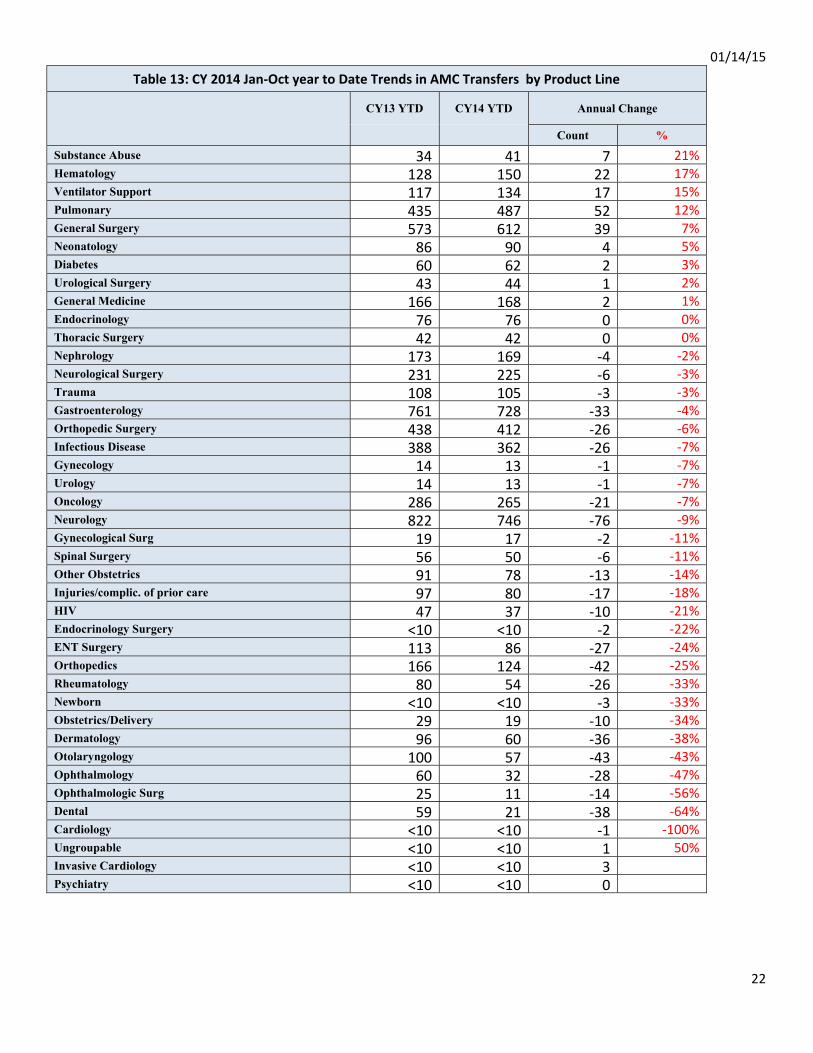
01/14/15
22
Table 13: CY 2014 Jan-Oct year to Date Trends in AMC Transfers by Product Line
CY13 YTD CY14 YTD Annual Change
Count % Substance Abuse 34 41 7 21%Hematology 128 150 22 17%Ventilator Support 117 134 17 15%Pulmonary 435 487 52 12%General Surgery 573 612 39 7%Neonatology 86 90 4 5%Diabetes 60 62 2 3%Urological Surgery 43 44 1 2%General Medicine 166 168 2 1%Endocrinology 76 76 0 0%Thoracic Surgery 42 42 0 0%Nephrology 173 169 -4 -2%Neurological Surgery 231 225 -6 -3%Trauma 108 105 -3 -3%Gastroenterology 761 728 -33 -4%Orthopedic Surgery 438 412 -26 -6%Infectious Disease 388 362 -26 -7%Gynecology 14 13 -1 -7%Urology 14 13 -1 -7%Oncology 286 265 -21 -7%Neurology 822 746 -76 -9%Gynecological Surg 19 17 -2 -11%Spinal Surgery 56 50 -6 -11%Other Obstetrics 91 78 -13 -14%Injuries/complic. of prior care 97 80 -17 -18%HIV 47 37 -10 -21%Endocrinology Surgery <10 <10 -2 -22%ENT Surgery 113 86 -27 -24%Orthopedics 166 124 -42 -25%Rheumatology 80 54 -26 -33%Newborn <10 <10 -3 -33%Obstetrics/Delivery 29 19 -10 -34%Dermatology 96 60 -36 -38%Otolaryngology 100 57 -43 -43%Ophthalmology 60 32 -28 -47%Ophthalmologic Surg 25 11 -14 -56%Dental 59 21 -38 -64%Cardiology <10 <10 -1 -100%Ungroupable <10 <10 1 50%Invasive Cardiology <10 <10 3 Psychiatry <10 <10 0
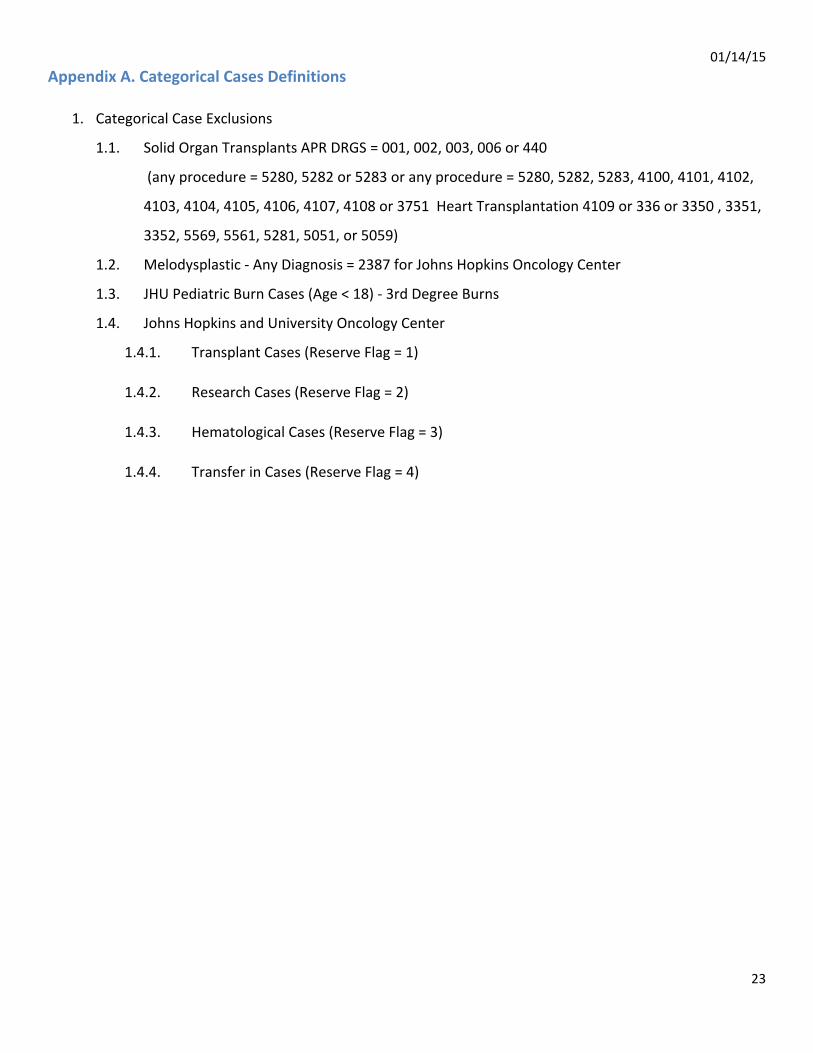
01/14/15
23
Appendix A. Categorical Cases Definitions
1. Categorical Case Exclusions
1.1. Solid Organ Transplants APR DRGS = 001, 002, 003, 006 or 440
(any procedure = 5280, 5282 or 5283 or any procedure = 5280, 5282, 5283, 4100, 4101, 4102,
4103, 4104, 4105, 4106, 4107, 4108 or 3751 Heart Transplantation 4109 or 336 or 3350 , 3351,
3352, 5569, 5561, 5281, 5051, or 5059)
1.2. Melodysplastic - Any Diagnosis = 2387 for Johns Hopkins Oncology Center
1.3. JHU Pediatric Burn Cases (Age < 18) - 3rd Degree Burns
1.4. Johns Hopkins and University Oncology Center
1.4.1. Transplant Cases (Reserve Flag = 1)
1.4.2. Research Cases (Reserve Flag = 2)
1.4.3. Hematological Cases (Reserve Flag = 3)
1.4.4. Transfer in Cases (Reserve Flag = 4)

See Excel File:
9d‐ Transfer Tables ‐ 20150107
John M. Colmers Chairman
Herbert S. Wong, Ph.D.
Vice-Chairman
George H. Bone, M.D.
Stephen F. Jencks,
M.D., M.P.H.
Jack C. Keane
Bernadette C. Loftus, M.D.
Thomas R. Mullen
Donna Kinzer
Executive Director
Stephen Ports Principal Deputy Director
Policy and Operations
David Romans Director
Payment Reform and Innovation
Gerard J. Schmith Deputy Director
Hospital Rate Setting
Sule Calikoglu, Ph.D. Deputy Director
Research and Methodology
Health Services Cost Review Commission 4160 Patterson Avenue, Baltimore, Maryland 21215
Phone: 410-764-2605 · Fax: 410-358-6217 Toll Free: 1-888-287-3229
hscrc.maryland.gov
State of Maryland Department of Health and Mental Hygiene
TO: Commissioners FROM: HSCRC Staff DATE: January 7, 2015 RE: Hearing and Meeting Schedule
February – To Be Determined Time to be determined, 4160 Patterson Avenue (Tentatively Feb. 11) HSCRC/MHCC Conference Room
March 11, 2015 Time to be determined, 4160 Patterson Avenue
HSCRC/MHCC Conference Room
Please note that Commissioner’s binders will be available in the Commission’s office at 11:45 a.m. The Agenda for the Executive and Public Sessions will be available for your review on the Thursday before the Commission meeting on the Commission’s website at http://www.hscrc.maryland.gov/commission-meetings-2015.cfm Post-meeting documents will be available on the Commission’s website following the Commission meeting.