post-stroke locomotor rehabilitation: evidence- …c.ymcdn.com/sites/ locomotor rehabilitation:...
TRANSCRIPT

Post-Stroke Locomotor Rehabilitation Evidence-Based Frameworks for Clinical Decision Making
Mark G Bowden PhD PT
FPTA Annual Conference
September 15 2012
Overview
bull What is required for successful locomotor rehabilitation
ndash Systematic outcome measurement
ndash Intensity
ndash Training to be specific to the task
ndash Adherence to principles of neuromuscular plasticity
bull What does evidence-based practice tell us about locomotor rehabilitation
bull Where to go from here and what will future generations of therapeutic practice include
Significance of Problem
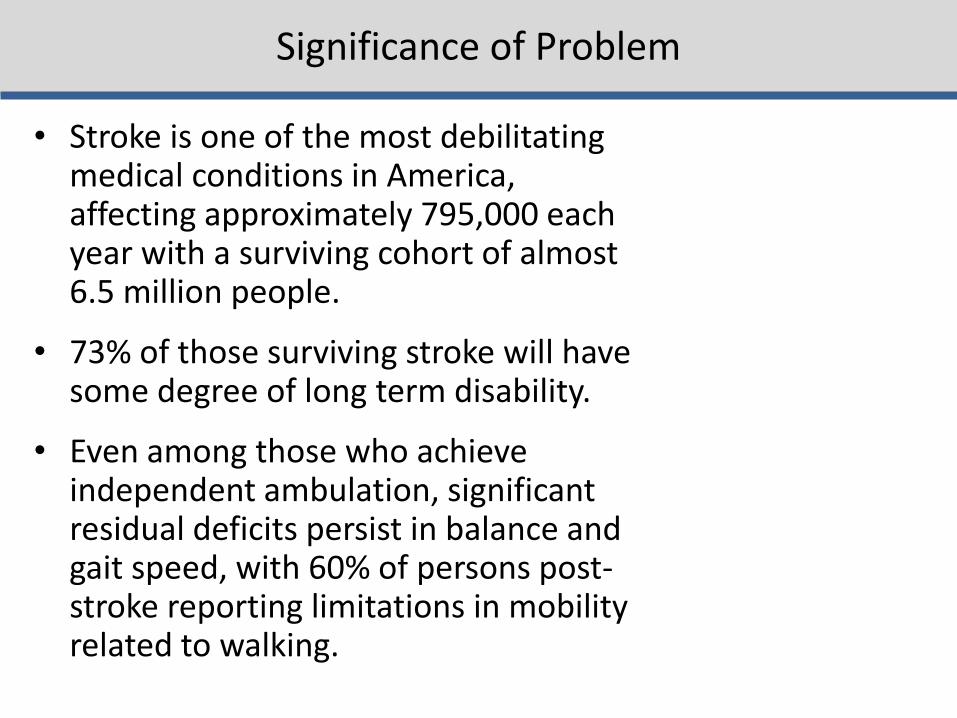
bull Stroke is one of the most debilitating medical conditions in America affecting approximately 795000 each year with a surviving cohort of almost 65 million people
bull 73 of those surviving stroke will have some degree of long term disability
bull Even among those who achieve independent ambulation significant residual deficits persist in balance and gait speed with 60 of persons post-stroke reporting limitations in mobility related to walking
Stroke Deficits
bull Disruption of motor pathways leads to decreased motor unit activation
bull Disuse atrophy in the skeletal
bull ldquoMaladaptive plasticityrdquo
All lead to inadequate force generation and abnormal timing
ndash Decreased support
ndash Poor limb advancement
ndash Poor weight advancement
Chronic Conditions
bull Continued atrophy and plastic changes
bull Contractures
bull Spasticity ()
bull Decreased cardiovascular fitness and endurance
Where are we currently with locomotor rehabilitation
bull Since the 1928 work of Santiago Ramoacuten y Cajal famed neuroscientist the prevailing assumption has been that the central nervous system (CNS) is hard-wired non-malleable and incapable of repairing itself
bull Clinicians have selected compensation as a rehabilitation strategy for non-remediable deficits of strength voluntary motor control sensation and balance
1 Promote maximum capacity muscle strength range and endurance in muscles that can
be voluntarily-activated above and below the lesion
2 Compensate for non-remediable deficits of paralysis and weakness by using braces and assistive devices
3 Teach new behavioral strategies or skills for ambulation and mobility
Compensation Strategies
ICF model of Rehabilitation
Recovery versus Compensation
Neural Movement
Functional
What amp when is ldquorecoveryrdquo
Neural Control of Walking
How we walk central control of muscle activity during human walking Nielsen JB Neuroscientist 2003 Jun9(3)195-204 Review
Control of movement
bull Descending drive from the brain via corticospinal tracts
bull Network in spinal cord capable of generating basic rhythmic patterns of movement
ndash Supraspinal influences (more than other animals) ndash Peripheral sensory influences
bull Direct corticospinal projects to spinal motoneurons has developed for bipedalism
Role of motor cortex in human walking
bull Activation increased for ndash Obstacles ndash Startingstopping ndash Complicated environments
bull Information from cortex to spinal cord may go through corticospinal (CS) tracts but may use other tracts as well
Adapted from Dobkin 2004
Thomas and Gorassini 2005
Effect of locomotor training on descending drive
Thomas and Gorassini 2005
Spinal Rhythm Generator
bull Definitely present in cats bull May be activated in deafferented animals in the
brainstem (mesencephalic and subthalamic locomotor regions MLR and SLR)
Therefore basic patterns can be activated by nonpatterned and nonspecific descending drive from the brainstem This network can recruit and coordinate muscles on its own However does this same network exists in humans
Do bipedal human have a central pattern generator in the same way as seen in the cat
Studies in humans with complete SCI (no descending drive to peripheral muscle) demonstrate walking patterns and muscle activation consistent with normal walking
None of these individuals has learned to walk off of the treadmill
Harkema 1997
Pattern Generation
Role of sensory feedback
1 Sensory feedback may help to drive the active motoneurons
2 May contribute to corrective reflexes following sudden perturbations
3 May provide essential error signals that inform the brain of differences between the intended movement and the actually executed movementhellipmay update future movements (motor learning)
ldquoThere is no reason to suggest that human walking is generated only by the spinal cord and that the corticospinal tract only makes a significant contribution in relation to voluntary modification of the gait pattern
Nor is there any reason to suggest that the motor cortex alone is
responsible for the activation of the muscles during walking without any contribution from the spinal cord neuronal circuitries
Human bipedal walkinghellipis based on an integration of the activity of
spinal neuronal circuitries with sensory feedback signals and descending motor commandsrdquo
Nielsen 2003
Nielson 2003
Central Control Centers
for control of walking
(from Nielsen 2003) Muscle
activation comes directly
from the cortex as well as
spinal CPGs and is
modulated at each location
by afferent input
Behavioral Output
Sohellip
The most effective locomotor rehab should
bull Train volitional cognitive approaches
bull Normalize sensory inputs and
bull Take advantage of pattern generation circuitry
Experience-Dependent Plasticity
Principles of experience-dependent neural plasticity implications for rehabilitation after brain damage Kleim JA Jones TA J Speech Lang Hear Res 2008 Feb51(1)S225-39
Neuroplasticity
bull ldquoPersistent changes within the central nervous system that result from prior experiences and influence future motor behaviors (Wolpaw and Tennissen 2001)rdquo
bull Brain activation bull Axonal growth bull Sprouting bull Synaptic transmission bull Protein upregulation
bull Therapy can capitalize on the central nervous systemrsquos ability to learn and reorganize to restore function that has already been compromised or lost
bull Driven by changes in behavioral sensory and cognitive experiences
bull Learning happens even in the absence of rehabilitation Therefore as therapists we must drive plasticity in the direction to promote recovery of function
The following are 10 principles of neuromotor change
Principle 1 Use it or lose it - Neural circuits not used will degrade and change
Principle 2 Use it and improve it - Training provides enhancement of function
Nudo 2005
Principle 3 Specificity
bull The type of rehabilitation dictates the type of plasticity
Hodgson et al 1994
Principle 4 Repetition matters
bull Repetition is required for lasting neural changes (ie motor learning)
bull Not just acquisition of the skill but repeated use of the skill over time
Mean number of steps per therapy session 357 (95 CI = 296ndash418) (Lang 2009)
Mean number taken per day in healthy individual 5117 (Bassett
2010)
Principle 5 Intensity matters
bull Sufficient training intensity is required for lasting neural changes (ie motor learning)
Pienemann 2004
WHAT IS INTENSITY FOR WALKING
Principle 6 Time matters
bull Plastic changes require a process over time and do not alter instantaneously
bull Certain time periods post injury may be most beneficial
Gene expression
Synapse formation
Motor map reorganization
Principle 7 Salience matters
bull The system must weigh the importance of any given situation in order to facilitate motor learning (motivation attention emotion etc relate to degree of plasticity)
Principle 8 Age matters bull Potentiation synaptogenesis reorganization all
hampered bull Aging marked by neuronal and synaptic atrophy
Principle 9 Transference
bull ldquoThe ability of plasticity within one set of neural circuits to promote concurrent or subsequent plasticityrdquo
Principle 10 Interference
bull ldquoRefers to the ability of plasticity within a given neural circuitry to impede the induction of new or expression of existing plasticity within that same circuitryhellipimpairing learningrdquo (ex maladaptive plasticity)
Sohellip
The most effective locomotor rehab should
bull Activate desired neural circuitry
bull Be specific to the task
bull Be repetitive intense for appropriate duration
bull Be important to the individual
What does neuroplasticity look like in a clinical intervention
LT Guidelines
bull Guideline 1 Maximize weight bearing on the legs
bull Guideline 2 Afford the sensory experience consistent with walking
bull Guideline 3 Optimize kinematics for each motor task
bull Guideline 4 Maximize recovery and independence minimize compensation
ldquoTrain like you walkrdquo
hellipadded Guidelines
bull Systematic
bull Intensive
bull Progressive
bull Repetitive
bull Document outcomes
hellipplus Plasticity
bull Use it or lose it
bull Use it and improve it
bull Specificity
bull Repetition matters
bull Intensity matters
bull Time matters
bull Salience matters
bull Age matters
bull Transference
bull Interference
So what is ldquoevidence-based practicerdquo
Top Stroke Rehabil 2008 May-Jun15(3)227-46 Links Application of evidence-based practice strategies current
trends in walking recovery interventions poststroke Tilson JK Settle SM Sullivan KJ ldquoRehabilitation effectiveness is enhanced when the clinician can 1 determine the best available interventions 2 for the appropriate subset of patients and 3 apply them at the correct dose and timepoint of recoveryrdquo
Framework
Step 1 Convert the need for information into a focused and searchable clinical question
Narrow question for bull Patient or patient population bull Intervention bull Outcome of interest
ldquoPICOrdquo Population Intervention Comparison (alternate intervention) Outcome of interest
Step 2 Find the best possible research evidence to answer your question
Pubmed
PEDro (Physiotherapy Evidence Database)
National Guidelines Clearinghouse
Canadian Stroke Network
Cochrane Collaboration (wwwcochraneorgreviews)
Step 3 Critically appraise the research evidence for validity and applicability
Assess evidence level and grade
Step 4 Integrate the critically appraised research evidence with clinical expertise and the patients unique biology circumstances and values
ldquoClinical trials do not provide the answers on how to rehabilitate
patientsrdquo bull Inform bull Provide a framework for practice bull Integrate with clinical expertise bull Integrate with patients unique circumstances values and
preferences Partner with patient family and caregivers
Step 5 Evaluate the effectiveness and efficacy of our efforts in Steps 1-4 and identify ways to improve them in the future
bull Monitor impact
bull Use standardized outcome measures
bull Build on each experience
bull PubMedrsquos MyNCBI service set up auto alerts for emerging literature of interest
Examples in stroke literature
Question 1 Aerobic conditioning and walking recovery poststroke
Recommendations
bull High quality (level 1a) and clinically relevant (grade A) research evidence that aerobic conditioning is effective for improving walking speed and endurance poststroke
bull Small body of evidence (conflicting grades A and C) of clinical relevance of impact on disability and QOL
bull Unclear of dose
bull Recommend breaking down by severity and chronicity
Question 2 Ankle-foot-orthosis prescription with an without functional electrical stimulation for walking recovery post-stroke
Recommendations
bull Level 2 grade B evidence that non-FES AFOs are effective for small
changes in walking speed bull Increased
ndash patient independence ndash Perception of safety ndash Confidence
bull Level 1a grade A evidence for improved gait velocity with FES-enabled AFO devices
bull Implanted FES has one RCT supporting lebel 1b grade A evidence for improved walking speed
Questionable functional independence QOL and long-term implications
Question 3 Treadmill training with body weight support for walking recovery post-stroke
BREAK
Locomotor Experience Applied Post-Stroke
bull 5 year
bull Phase-III
bull Single-blinded
bull Multi-site
bull Randomized Clinical Trial
bull If in addition to usual care to determine if a specialized locomotor training program that includes BWST as a treatment modality can produce clinically significant changes in walking speed in individuals post-stroke compared to Home Exercise Program
bull To determine effect of timing (early vs late severity (moderate vs severe) and duration (12- 24- 36-sessions)
Screening at 260plusmn116 days post-stroke 2-month baseline = point of randomization The bars indicate 95 confidence interval
Walking speed trajectory by intervention group and severity at screening 2-(baseline) 6- and 12-months post-stroke
Duncan et al 2011
Walking Speed at 6 Months
bull Six months after stroke Early-LTP (025plusmn021 ms) and HEP (023plusmn020 ms) groups had similar gains in walking speed and sustained these gains at 1 year
bull The Late-LTP group (which only received usual care from 2 to 6 months) improved by 013plusmn014 ms at 6 months
Statistically and Clinically Significant Changes in Outcomes from 2 mos to 12 mos post-stroke
Item
Early-LTP
(n=139)
Late-LTP
(n=143)
HEP
(n=126)
Overall
p-value
Comfortable Walking Speed
(msec) 023plusmn020 024plusmn023 025plusmn022 067
6 minute Walking Distance (m) 732plusmn694 790plusmn751 852plusmn729 045
Step Activity Monitor (SAM) ndash
Median of average number
stepsday [25th -75th percentile]
858
[-253 2422]
1022
[-111 3009]
1471
[435 3481] 010
Stroke Impact Scale (SIS)
Participation
(range = 0-100)
171plusmn259 131plusmn220 144plusmn206 038
SIS ADLIADL (range = 0-100) 96plusmn195 94plusmn172 145plusmn190 007
SIS Mobility (range = 0-100) 137plusmn216 120plusmn191 142plusmn203 0685
Fugl-Meyer LE Score (range
= 0-34) 17plusmn39 15plusmn37 25plusmn43 013
Berg Score (range = 0-56) 80plusmn78 59plusmn91 83plusmn878 006
No differences in improvements across treatment groups HIGHLY clinically relevant improvements
Preplanned Secondary Analysis of 6 Month Outcomes
Item LTP
(n=139)
HEP
(n=126)
UC
(n=143)
Overall
p-value
Comfortable Walking Speed (msec) 025plusmn021 023plusmn020 013plusmn014 lt00001
6 minute Walking Distance (m) 818plusmn628 759plusmn693 410plusmn474 lt00001
Step Activity Monitor (SAM) ndash Median
of average number stepsday [25th -
75th percentile]
1017
[-102 2209]
1357
[84 3382]
566
[-362 2043] 00367
Stroke Impact Scale (SIS) Participation
(range = 0-100) 118plusmn267 146plusmn229 77plusmn205 00384
SIS ADLIADL (range = 0-100) 98plusmn172 130plusmn169 70plusmn178 00516
SIS Mobility (range = 0-100) 153plusmn214 149plusmn200 70plusmn157 00006
Fugl-Meyer LE Score
(range = 0-34) 22plusmn34 24plusmn41 13plusmn33 01196
Berg Score (range = 0-56) 88plusmn81 79plusmn85 53plusmn70 00018
Activities Specific Balance Confidence
Score (range=0-100) 138plusmn208 156plusmn194 62plusmn202 00013
Late-LTP (usual care) experienced approximately HALF the improvement of early intervention groups
Falls and Falls Rate
The most common minor adverse event was falls
bull 576 of individuals experienced 1 fall
bull 34 experienced multiple falls
bull 6 experienced an injurious fall
bull More multiple falls in early-LTP group than late-LTP or HEP (plt007)
LEAPS in the context of EBP
For patients in the first year post-stroke who can walk 10 feet but are not walking at speeds gt08 ms (18 mph)
This randomized trial provides strong and high quality evidence that
Structured progressive locomotor training (including BWSTT) is not superior to a structured strengthening and balance exercise program for walking recovery
Either structured program is more effective than usual care at 6 months post-stroke
Both interventions have low risks of adverse events but structured exercise program in the home results in fewer adverse events compared to locomotor training
Current Therapeutic Approaches
bull Activity-based therapies
ndash Robotic interventions
bull Task-specific interventions
bull Aerobic training
bull Muscle Strengthening
bull FES (neuroprosthetics)
bull Virtual Rehabilitation
Results Similar outcomes for final walking speed were found for the different prevailing treatment methods Treatment gains were likewise comparable and generally insufficient for upgrading patientsrsquo functional community walking capacity
Conclusions Different treatment methods exist for poststroke gait
rehabilitation Their availability mode of application and costs vary yet outcomes are largely similar Therefore choosing an appropriate method may be guided by a pragmatic approach Simple ldquolow technologyrdquo and conventional exercise to date is at least as efficacious as more complex strategies such as treadmill and robotic-based interventions
Similarities for success
bull Intensity
bull Repeatability
Obstacles
bull Adverse personal effects
bull Decreased cardiovascular potential
bull Condition of peripheral muscle
bull Heterogeneity of sample
bull Responders versus non-responders
Current Therapeutic Approaches
bull Activity-based therapies
ndash Robotic interventions
bull Task-specific interventions
bull Aerobic training
bull Muscle Strengthening
bull FES (neuroprosthetics)
bull Virtual Rehabilitation
000
1000
2000
3000
4000
5000
6000
7000
8000
Pre Week1 Week2 Week3 Week4 Week5 Week6 Week7 Week8 Week9 Week10 Week11 Post
Self
-Se
lect
ed
Wal
kin
g Sp
ee
d (
cms
)
Mean Walking Speed
Responders versus Non-Responders
0
20
40
60
80
100
120
140
Pre Week1 Week2 Week3 Week4 Week5 Week6 Week7 Week8 Week9 Week10 Week11 Post
Self
-Se
lect
ed
Wal
kin
g Sp
ee
d (
cms
)
Individual Walking Speed
PL1
4
5
7
9
10
11
12
13
14
15
17
18
19
20
21
22
24
What does EBP tell us about current clinical decision making
ldquoPre-gaitrdquo Sequencing
Bridging
Kneeling
Sit-to-stand
Sitting Quadruped
Standing
Modified plantigrade
Half-kneeling
WALKING
Arch Phys Med Rehabil 1989 Oct70(10)755-62 Links Standing balance training effect on balance and locomotion in
hemiparetic adults Winstein CJ Gardner ER McNeal DR Barto PS Nicholson DE
Training symmetrical standing did not lead to symmetrical gait
performancehelliplocomotor pattern was only minimally affected by static balance exercises
Remember Hodgsonrsquos cats those trained to stand could stand
and not step while those trained to step could not stand
Standing = Walking What about BALANCE
Exp Brain Res 2006 Jun172(1)35-48 Epub 2006 Jan 24 Links A direct comparison of local dynamic stability during unperturbed standing and walking Kang HG Dingwell JB
bull Local dynamic stability properties were significantly different when comparing standing versus walking
bull COP divergence measures only significantly correlated with standing
TASK SPECIFICITY MATTERS
hellipBut is that all that matters
bull Strengthening and power training
bull Cardiovascular training
bull Dynamic balance training
bull Motor control training
Elements of Optimized Walking Programs
Advancing Locomotor Rehabilitation Measurement in Physical Therapy
Practice
bull Recovery versus compensation how can measurement distinguish the two
bull Physical performance vs mechanisms of response
bull How does your standardized ldquomeasurementrdquo help guide clinical decision making
Guiding Questions
Numeric Rating Scale (NRS)
The patient rates pain on a scale from 0 to 10
Questions regarding traditional ldquoMeasurementrdquo
1) Does improvement in a measure imply that the patient ldquorecoveredrdquo neuromotor function or simply more efficiently compensated for impaired underlying body functions
2) Does the measurement assist clinical decision making by differentiating between a variety of treatment options
Historically locomotor rehabilitation measurement has incorporated assessments using
1) rating scales
2) timed movement tasks
3) laboratory based outcomes
How may technological advances improve clinical measurement capabilities
Rating Scales
bull Often based on summary scores
ndash Lose individual item sensitivity
ndash Unable to measure subtle changes in control
bull Makes no comments on mechanisms
bull No information on recovery vs compensation or guiding of treatment plan
Timed Movement Tasks
bull Timed up and Go
bull 6 minute walk test (distance)
bull 10 meter walk test (speed)
Many many very positive elements of these tests
ndash Simple to measure
ndash Inexpensive
ndash Reliable and valid
ndash Sensitive
ndash Specific
Walking Speed ishellip
bull ldquohellipalmost the perfect measurerdquo (Wade 1992)
ndash Reliable (Richards 1996)
ndash Valid (Steffen 2002)
ndash Sensitive (van Iersel 2008)
ndash Specific (Harada1995)
ndash Correlates with
bull Functional ability (Perry1995)
bull Balance confidence (Mangione2007)
Walking Speed Predictive
ndash Future health status (Studenski
2003 Purser 2005)
ndash Functional decline (Brach 2002)
bull Hospitalization (Montero-Odasso
2005)
bull Discharge location (Salbach 2001
Rabadi 2005)
bull Mortality (Hardy 2007)
ndash Functional amp Physiological changes (Perry1995)
bull Potential for rehabilitation (Goldie 1996)
bull Aids in prediction of
ndash Falls (Guimaraes 1980)
ndash Fear of falling (Maki 1997)
Fritz S Lusardi M Clayton G Bird W Bidelpach D Duncan PW Gait the Sixth Vital Sign
Page 83
Suggested Way to Measure
HOWEVERhellip
Do these tests answer either of our two introductory questions regarding recovery and treatment planning
What is the role of a vital sign
Diagnostic Test
BP
Differential Exams Cholesterol Blood sugar
Adrenal gland fxn Thyroid fxn Kidney fxn
Diagnostic Test
Walking speed
Differential Exams
Gait Analysis
Laboratory Measures
Angles GRFs
Moments
0
0
tan
tan
inertiacediscontact
inertiacediscontact
MMM
FFF
IICOM
inertia
inertia
M
amF
I
COM
inertiaM
COM
inertiainertia
COMOO
inerrtia MFpM
S
contactT
T
TTTTTTTTTTT
TT
contact
F
contactS
S
SSSSSSSSSSS
SS
contact
F
F
FFFFFFFFFFF
FF
contact
MgmpampM
MgmpampM
GRMGRFCOPgmpampM
COMCOM
COMCOM
COMCOM
)())()()(()(
)())()()(()(
)())()()(()(
1
1
1
RIRIRR
RIRIRR
RIRIRR
S
contactTTT
T
contact
F
contactSSS
S
contact
FFF
F
contact
FgmamF
FgmamF
GRFgmamF
drsquoAlembert approach to inverse dynamics General laws of motion (sum forces sum moments)
General inertial forces and moments
NOTE
in general General (3 dimensional) Parallel Axis Theorem
Moments calculated at the proximal end of each segment
F S and T reflect the moment at proximal foot shank and thigh segments respectively Joint reaction forces
Laws of Motion
Spatiotemporal Analysis
Vastus
Medialis
Semi-
Membranosus
BREAK
bull Motor control training
bull Cardiovascular training
bull Strengthening and power training
bull Dynamic balance training
Elements of Optimized Walking Programs
Examination of Walking Specific Motor Control
Force vertical
Force anterior-posterior
Force medio-lateral
Ground Reaction Forces
Paretic Propulsion (Pp)
The percentage of total anterior GRF (propulsive) impulse generated by the paretic leg referred to as paretic propulsion (Pp) was calculated by dividing the propulsive impulse of the paretic leg by the sum of the paretic and non-paretic propulsive impulses
Pp =
+
0
50
100
1 2 3
Pp
(
)
Bowden et al 2006
bull Increased flexor activity in
preswing (eg TA and RF)
was correlated with
decreased paretic
propulsion
bull Increased plantarflexor
activity in late swing (eg
MG and SO) was correlated
with increased paretic
propulsion
Mechanisms of Response
Turns et al 2007
Extensor EMG Flexor EMG
What correlates with propulsion
bull PropulsionParetic cannot be measured in a conventional clinical setting without access to force plates
bull Step length asymmetry relates to propulsive forces generated by the legs
Paretic Step Ratio (PSR)
Stride Length
Paretic Step Length
PSR = Paretic Step Length Stride Length
PSR lt 047
047 lt PSR lt 053
PSR gt 053
r = -078 p lt 001
Balasubramanian et al 2007
ACTIVE propulsion generated by appropriately timed ankle power
PASSIVE propulsion generated by properly positioned foot COM posterior to the pelvic COM (larger horizontal portion of the red arrow)
Therefore emphasize hip extension
Mechanics of Propulsion and PSR
Clinical Usefulness
Beyond simply promoting symmetry PSR can be used to develop individual goals to train propulsive force production equalize bilateral biomechanical involvement by improving hip extension or promote paretic step initiation
ndash Longer paretic steps may be due to compensation by
greater non-paretic propulsion
ndash Weak relation with speed suggests compensatory strategies to attain functional speeds
ndash PSR may serve as a useful surrogate to assess propulsion during hemiparetic walking
bull These measures are capable of distinguishing ldquorecoveryrdquo from ldquocompensationrdquo
bull They also are capable of distinguishing motor control problems and provide critical information for treatment
BUT
Of what value is this measure to a clinician without biomechanical laboratory capabilities
-040
-030
-020
-010
000
010
020
030
1 7
13
19
25
31
37
43
49
55
61
67
73
79
85
91
97
Raw GRFs
Left leg
Right leg
-030
-020
-010
000
010
020
030
1 8
15
22
29
36
43
50
57
64
71
78
85
92
99
Summed GRFs
Summed GRFs
-030
-020
-010
000
010
020
030
1 8
15
22
29
36
43
50
57
64
71
78
85
92
99
Summed GRFs
Norm accel
GRFs vs Acceleration
CONTROL
-006
-004
-002
000
002
004
006
008
1 713
19
25
31
37
43
49
55
61
67
73
79
85
91
97
Paretic leg
Non paretic leg
Raw GRFs
-006
-004
-002
000
002
004
006
008
1 8
15
22
29
36
43
50
57
64
71
78
85
92
99
Summed GRF
summed GRF
-060
-040
-020
000
020
040
060
080
1 8
15
22
29
36
43
50
57
64
71
78
85
92
99
Normed GRFs
Acceleration
GRFs vs Acceleration
PERSON WITH STROKE
-15
-1
-05
0
05
1
15
1 9
17
25
33
41
49
57
65
73
81
89
97
Acc
ele
rati
on
in m
s2
Pre
Post
Control
Pre- and post-training accelerations of individuals participating in a
locomotor training intervention While COM acceleration increases it
does not approach normative values particularly in the critical phase 3 and 4
period of the gait cycle implying specific therapies need to target specific mechanistic elements of the walking pattern
-08
-06
-04
-02
0
02
04
06
CO
Ma
in m
s2
COMa before (blue line) and 2 minutes after (red line) incline training A
brief (5 minute) period of adaptation training yielded a 48 increase in both
peak COMa and the time integral of the COMa curve in phase 3 and 4 The x-axis represents percentage of the gait cycle
COMa as an outcome measure
bull segmental accelerations
bull studies into shock absorption
bull spatiotemporal gait parameters
bull control of stability
bull age-related changes in movement patterns
bull relating quantifiable movement patterns to falls
Portable applications
-06
-04
-02
0
02
04
06
Acc
ele
rati
on
in m
s2
Low PP
-06
-04
-02
0
02
04
06
Acc
ele
rati
on
in m
s2
Symmetrical
-06
-04
-02
0
02
04
06
Acc
ele
rati
on
in m
s2
High PP
Figure 6 COMa sorted by Pp Sorting by Pp yields three distinctly different acceleration profiles although the double support phase (shaded area) are similar in shape The low Pp
group (b) generates very little acceleration in the double support phase However the high Pp group (c) demonstrates only positive acceleration through the first half of the gait cycle while remaining negative throughout late double support and swing (Bowden Behrman et al In Press) The x-axes represent percentages of the gait cycle
a b c
COMa to diagnose motor control deficits
Examination of Power Training
JOINT POWER
P = moment times angular velocity P(+) = concentric (moments and velocity same direction) shortening contraction P(-) = eccentric (moments and velocity in opposite direction) lengthening contraction
A2
H3
H1
Gregory Bowden et al 2007
bull H1 (hip extension during initial stance) H3 (hip flexion during early swing) and A2 (ankle plantarflexion during late stance and pre-swing) all increased after therapy and the A2 and H3 bursts were significantly correlated with walking speed (Richards et al 2004)
bull Furthermore the A2 peak burst improvement was responsible for 25 of the gain in walking
bull Examining the interlimb coordination effects demonstrated that pre-training paretic A2 and H3 accounted for 84 of the variance in walking speed while post-training the non-paretic H3 replaces the paretic H3 to account for 82 of the post-training variance in patients that improved from 040 ms to 058 ms as a result of the intervention (Richards et al 2004)
Examination of Cardiovascular Status
bull Cardiorespiratory fitness is approximately 50 below age-matched controls
bull Decreased fitness combines with increased energetic demands to decrease efficiency
bull O2 use normalized to walking speed 50 higher bull Due to reduced peripheral muscle activation
change in fiber type reduced enzyme activities and altered hemodynamics
all responsive to exercise interventions
0
2
4
6
8
10
12
14
16
18
0 01 02 03 04 05 06 07
VO
2 (m
lk
gm
in)
Speed (ms)
bull Peak oxygen consumption (VO2) values in patients with stroke are below the level required for many basic activities of daily living (ADL)
bull Peak cardiovascular fitness
levels are roughly half those of age-matched individuals
bull Decreased CV fitness likely limits amount of walking thereby limiting daily physical activity and contributing to a downward spiral
ldquoStroke is a cardiac eventhelliprdquo Pam
Duncan
SS-50 SS-25 SS
SS+25 SS+50
SS-50
SS-25
SS SS+25 SS+50
01
02
03
04
05
06
07
08
O2
Eff (
mL
O2k
gm
)
Voluntary Fatigue
Cadence lt 40 rpm
Borg = 18
90 THR
Angina
HTN
Dyspnea
ST
segment
depression
Other
15
32
22
22
7
05
05
05
1 05
Hypotension
Courtesy of Dorian Rose PT PhD
Cardiovascular Fitness Functional Mobility
Examination of Dynamic Balance Control
Clinical Examinations
Dynamic COM vs COP
Weerdesteyn 2008
Balance Control
Treatment
bull Increase task complexity and difficulty (IRT example)
bull Athletic training
bull Intensity of training
bull Must know if people continue to fall
bull STILL evolving
Putting it All Together
Walking Performance
Motor Control
CV Fitness
Dynamic Balance Control
Strength
Results
bull The mobility group members improved their SMWT performance by an average of 35 m more than members of the UE group (95 CI 7 64)
bull Gait speed increases
ndash 011 ms_ss (95 CI 003 019) and 021 ms_fast (95 CI 12 030) faster than subjects in the UE group
bull TUG
ndash decreased 12 seconds in the intervention group (control increase by 17 seconds)
bull BBS No change (2 points to 1 point)
bull Later reports indicate an improvement in balancefalls efficacy
One therapy will NOT be the answer
Motor Control CV Status StrengthPower Dynamic Balance
Patient 1
Motor Control CV Status StrengthPower Dynamic Balance
Patient 3
Motor Control CV Status StrengthPower Dynamic Balance
Patient 2
Motor Control CV Status StrengthPower Dynamic Balance
Patient 4
Hypothetical future clinic
Overview - REVIEW
bull What is required for successful locomotor rehabilitation
ndash Systematic measurement
ndash Intensity
ndash Task specific practice
ndash Adherence to guiding principles
bull What does evidence-based practice tell us about locomotor rehabilitation
bull Where to go from here and what will future generations of therapeutic practice include
bull Guideline 1 Maximize weight bearing on the legs
bull Guideline 2 Afford the sensory experience consistent with walking
bull Guideline 3 Optimize kinematics for each motor task
bull Guideline 4 Maximize recovery and independence minimize compensation
LT Guidelines
hellipadded Guidelines
bull Systematic
bull Intensive
bull Progressive
bull Repetitive
bull Measure outcomes
hellipplus Plasticity
bull Use it or lose it
bull Use it and improve it
bull Specificity
bull Repetition matters
bull Intensity matters
bull Time matters
bull Salience matters
bull Age matters
bull Transference
bull Interference
Future directions
bull Evaluation to yield meaningful theory-based information to help guide clinical decision making
bull Classification to help guide treatment options
bull Understand ways to build on base therapy depending on impairments while being consistent with training guidelines
bull What tx for whom when in what combination with other tx
bull Clinic as a laboratory
Steve Kautz PhD
Mark George MD
Chris Gregory PhD PT
Aaron Embry DPT MSCR
Lindsay Perry DPT NCS
Patrick Morgan MS
This material is based upon work supported by the Office of Research and Development Rehabilitation Research and Development Department of Veterans Affairs Career Development-1 Award (Project B7177M Bowden PI) SCTR Discovery Pilot Grant (Kautz PI) AHA Innovative Research Grant (Kautz PI) and VA RRampD Merit Award B3983R (Kautz PI) The contents do not represent the views of the Department of Veterans Affairs or the United States Government
Thanks to all of my mentors collaborators and funding sources

Overview
bull What is required for successful locomotor rehabilitation
ndash Systematic outcome measurement
ndash Intensity
ndash Training to be specific to the task
ndash Adherence to principles of neuromuscular plasticity
bull What does evidence-based practice tell us about locomotor rehabilitation
bull Where to go from here and what will future generations of therapeutic practice include
Significance of Problem
bull Stroke is one of the most debilitating medical conditions in America affecting approximately 795000 each year with a surviving cohort of almost 65 million people
bull 73 of those surviving stroke will have some degree of long term disability
bull Even among those who achieve independent ambulation significant residual deficits persist in balance and gait speed with 60 of persons post-stroke reporting limitations in mobility related to walking
Stroke Deficits
bull Disruption of motor pathways leads to decreased motor unit activation
bull Disuse atrophy in the skeletal
bull ldquoMaladaptive plasticityrdquo
All lead to inadequate force generation and abnormal timing
ndash Decreased support
ndash Poor limb advancement
ndash Poor weight advancement
Chronic Conditions
bull Continued atrophy and plastic changes
bull Contractures
bull Spasticity ()
bull Decreased cardiovascular fitness and endurance
Where are we currently with locomotor rehabilitation
bull Since the 1928 work of Santiago Ramoacuten y Cajal famed neuroscientist the prevailing assumption has been that the central nervous system (CNS) is hard-wired non-malleable and incapable of repairing itself
bull Clinicians have selected compensation as a rehabilitation strategy for non-remediable deficits of strength voluntary motor control sensation and balance
1 Promote maximum capacity muscle strength range and endurance in muscles that can
be voluntarily-activated above and below the lesion
2 Compensate for non-remediable deficits of paralysis and weakness by using braces and assistive devices
3 Teach new behavioral strategies or skills for ambulation and mobility
Compensation Strategies
ICF model of Rehabilitation
Recovery versus Compensation
Neural Movement
Functional
What amp when is ldquorecoveryrdquo
Neural Control of Walking
How we walk central control of muscle activity during human walking Nielsen JB Neuroscientist 2003 Jun9(3)195-204 Review
Control of movement
bull Descending drive from the brain via corticospinal tracts
bull Network in spinal cord capable of generating basic rhythmic patterns of movement
ndash Supraspinal influences (more than other animals) ndash Peripheral sensory influences
bull Direct corticospinal projects to spinal motoneurons has developed for bipedalism
Role of motor cortex in human walking
bull Activation increased for ndash Obstacles ndash Startingstopping ndash Complicated environments
bull Information from cortex to spinal cord may go through corticospinal (CS) tracts but may use other tracts as well
Adapted from Dobkin 2004
Thomas and Gorassini 2005
Effect of locomotor training on descending drive
Thomas and Gorassini 2005
Spinal Rhythm Generator
bull Definitely present in cats bull May be activated in deafferented animals in the
brainstem (mesencephalic and subthalamic locomotor regions MLR and SLR)
Therefore basic patterns can be activated by nonpatterned and nonspecific descending drive from the brainstem This network can recruit and coordinate muscles on its own However does this same network exists in humans
Do bipedal human have a central pattern generator in the same way as seen in the cat
Studies in humans with complete SCI (no descending drive to peripheral muscle) demonstrate walking patterns and muscle activation consistent with normal walking
None of these individuals has learned to walk off of the treadmill
Harkema 1997
Pattern Generation
Role of sensory feedback
1 Sensory feedback may help to drive the active motoneurons
2 May contribute to corrective reflexes following sudden perturbations
3 May provide essential error signals that inform the brain of differences between the intended movement and the actually executed movementhellipmay update future movements (motor learning)
ldquoThere is no reason to suggest that human walking is generated only by the spinal cord and that the corticospinal tract only makes a significant contribution in relation to voluntary modification of the gait pattern
Nor is there any reason to suggest that the motor cortex alone is
responsible for the activation of the muscles during walking without any contribution from the spinal cord neuronal circuitries
Human bipedal walkinghellipis based on an integration of the activity of
spinal neuronal circuitries with sensory feedback signals and descending motor commandsrdquo
Nielsen 2003
Nielson 2003
Central Control Centers
for control of walking
(from Nielsen 2003) Muscle
activation comes directly
from the cortex as well as
spinal CPGs and is
modulated at each location
by afferent input
Behavioral Output
Sohellip
The most effective locomotor rehab should
bull Train volitional cognitive approaches
bull Normalize sensory inputs and
bull Take advantage of pattern generation circuitry
Experience-Dependent Plasticity
Principles of experience-dependent neural plasticity implications for rehabilitation after brain damage Kleim JA Jones TA J Speech Lang Hear Res 2008 Feb51(1)S225-39
Neuroplasticity
bull ldquoPersistent changes within the central nervous system that result from prior experiences and influence future motor behaviors (Wolpaw and Tennissen 2001)rdquo
bull Brain activation bull Axonal growth bull Sprouting bull Synaptic transmission bull Protein upregulation
bull Therapy can capitalize on the central nervous systemrsquos ability to learn and reorganize to restore function that has already been compromised or lost
bull Driven by changes in behavioral sensory and cognitive experiences
bull Learning happens even in the absence of rehabilitation Therefore as therapists we must drive plasticity in the direction to promote recovery of function
The following are 10 principles of neuromotor change
Principle 1 Use it or lose it - Neural circuits not used will degrade and change
Principle 2 Use it and improve it - Training provides enhancement of function
Nudo 2005
Principle 3 Specificity
bull The type of rehabilitation dictates the type of plasticity
Hodgson et al 1994
Principle 4 Repetition matters
bull Repetition is required for lasting neural changes (ie motor learning)
bull Not just acquisition of the skill but repeated use of the skill over time
Mean number of steps per therapy session 357 (95 CI = 296ndash418) (Lang 2009)
Mean number taken per day in healthy individual 5117 (Bassett
2010)
Principle 5 Intensity matters
bull Sufficient training intensity is required for lasting neural changes (ie motor learning)
Pienemann 2004
WHAT IS INTENSITY FOR WALKING
Principle 6 Time matters
bull Plastic changes require a process over time and do not alter instantaneously
bull Certain time periods post injury may be most beneficial
Gene expression
Synapse formation
Motor map reorganization
Principle 7 Salience matters
bull The system must weigh the importance of any given situation in order to facilitate motor learning (motivation attention emotion etc relate to degree of plasticity)
Principle 8 Age matters bull Potentiation synaptogenesis reorganization all
hampered bull Aging marked by neuronal and synaptic atrophy
Principle 9 Transference
bull ldquoThe ability of plasticity within one set of neural circuits to promote concurrent or subsequent plasticityrdquo
Principle 10 Interference
bull ldquoRefers to the ability of plasticity within a given neural circuitry to impede the induction of new or expression of existing plasticity within that same circuitryhellipimpairing learningrdquo (ex maladaptive plasticity)
Sohellip
The most effective locomotor rehab should
bull Activate desired neural circuitry
bull Be specific to the task
bull Be repetitive intense for appropriate duration
bull Be important to the individual
What does neuroplasticity look like in a clinical intervention
LT Guidelines
bull Guideline 1 Maximize weight bearing on the legs
bull Guideline 2 Afford the sensory experience consistent with walking
bull Guideline 3 Optimize kinematics for each motor task
bull Guideline 4 Maximize recovery and independence minimize compensation
ldquoTrain like you walkrdquo
hellipadded Guidelines
bull Systematic
bull Intensive
bull Progressive
bull Repetitive
bull Document outcomes
hellipplus Plasticity
bull Use it or lose it
bull Use it and improve it
bull Specificity
bull Repetition matters
bull Intensity matters
bull Time matters
bull Salience matters
bull Age matters
bull Transference
bull Interference
So what is ldquoevidence-based practicerdquo
Top Stroke Rehabil 2008 May-Jun15(3)227-46 Links Application of evidence-based practice strategies current
trends in walking recovery interventions poststroke Tilson JK Settle SM Sullivan KJ ldquoRehabilitation effectiveness is enhanced when the clinician can 1 determine the best available interventions 2 for the appropriate subset of patients and 3 apply them at the correct dose and timepoint of recoveryrdquo
Framework
Step 1 Convert the need for information into a focused and searchable clinical question
Narrow question for bull Patient or patient population bull Intervention bull Outcome of interest
ldquoPICOrdquo Population Intervention Comparison (alternate intervention) Outcome of interest
Step 2 Find the best possible research evidence to answer your question
Pubmed
PEDro (Physiotherapy Evidence Database)
National Guidelines Clearinghouse
Canadian Stroke Network
Cochrane Collaboration (wwwcochraneorgreviews)
Step 3 Critically appraise the research evidence for validity and applicability
Assess evidence level and grade
Step 4 Integrate the critically appraised research evidence with clinical expertise and the patients unique biology circumstances and values
ldquoClinical trials do not provide the answers on how to rehabilitate
patientsrdquo bull Inform bull Provide a framework for practice bull Integrate with clinical expertise bull Integrate with patients unique circumstances values and
preferences Partner with patient family and caregivers
Step 5 Evaluate the effectiveness and efficacy of our efforts in Steps 1-4 and identify ways to improve them in the future
bull Monitor impact
bull Use standardized outcome measures
bull Build on each experience
bull PubMedrsquos MyNCBI service set up auto alerts for emerging literature of interest
Examples in stroke literature
Question 1 Aerobic conditioning and walking recovery poststroke
Recommendations
bull High quality (level 1a) and clinically relevant (grade A) research evidence that aerobic conditioning is effective for improving walking speed and endurance poststroke
bull Small body of evidence (conflicting grades A and C) of clinical relevance of impact on disability and QOL
bull Unclear of dose
bull Recommend breaking down by severity and chronicity
Question 2 Ankle-foot-orthosis prescription with an without functional electrical stimulation for walking recovery post-stroke
Recommendations
bull Level 2 grade B evidence that non-FES AFOs are effective for small
changes in walking speed bull Increased
ndash patient independence ndash Perception of safety ndash Confidence
bull Level 1a grade A evidence for improved gait velocity with FES-enabled AFO devices
bull Implanted FES has one RCT supporting lebel 1b grade A evidence for improved walking speed
Questionable functional independence QOL and long-term implications
Question 3 Treadmill training with body weight support for walking recovery post-stroke
BREAK
Locomotor Experience Applied Post-Stroke
bull 5 year
bull Phase-III
bull Single-blinded
bull Multi-site
bull Randomized Clinical Trial
bull If in addition to usual care to determine if a specialized locomotor training program that includes BWST as a treatment modality can produce clinically significant changes in walking speed in individuals post-stroke compared to Home Exercise Program
bull To determine effect of timing (early vs late severity (moderate vs severe) and duration (12- 24- 36-sessions)
Screening at 260plusmn116 days post-stroke 2-month baseline = point of randomization The bars indicate 95 confidence interval
Walking speed trajectory by intervention group and severity at screening 2-(baseline) 6- and 12-months post-stroke
Duncan et al 2011
Walking Speed at 6 Months
bull Six months after stroke Early-LTP (025plusmn021 ms) and HEP (023plusmn020 ms) groups had similar gains in walking speed and sustained these gains at 1 year
bull The Late-LTP group (which only received usual care from 2 to 6 months) improved by 013plusmn014 ms at 6 months
Statistically and Clinically Significant Changes in Outcomes from 2 mos to 12 mos post-stroke
Item
Early-LTP
(n=139)
Late-LTP
(n=143)
HEP
(n=126)
Overall
p-value
Comfortable Walking Speed
(msec) 023plusmn020 024plusmn023 025plusmn022 067
6 minute Walking Distance (m) 732plusmn694 790plusmn751 852plusmn729 045
Step Activity Monitor (SAM) ndash
Median of average number
stepsday [25th -75th percentile]
858
[-253 2422]
1022
[-111 3009]
1471
[435 3481] 010
Stroke Impact Scale (SIS)
Participation
(range = 0-100)
171plusmn259 131plusmn220 144plusmn206 038
SIS ADLIADL (range = 0-100) 96plusmn195 94plusmn172 145plusmn190 007
SIS Mobility (range = 0-100) 137plusmn216 120plusmn191 142plusmn203 0685
Fugl-Meyer LE Score (range
= 0-34) 17plusmn39 15plusmn37 25plusmn43 013
Berg Score (range = 0-56) 80plusmn78 59plusmn91 83plusmn878 006
No differences in improvements across treatment groups HIGHLY clinically relevant improvements
Preplanned Secondary Analysis of 6 Month Outcomes
Item LTP
(n=139)
HEP
(n=126)
UC
(n=143)
Overall
p-value
Comfortable Walking Speed (msec) 025plusmn021 023plusmn020 013plusmn014 lt00001
6 minute Walking Distance (m) 818plusmn628 759plusmn693 410plusmn474 lt00001
Step Activity Monitor (SAM) ndash Median
of average number stepsday [25th -
75th percentile]
1017
[-102 2209]
1357
[84 3382]
566
[-362 2043] 00367
Stroke Impact Scale (SIS) Participation
(range = 0-100) 118plusmn267 146plusmn229 77plusmn205 00384
SIS ADLIADL (range = 0-100) 98plusmn172 130plusmn169 70plusmn178 00516
SIS Mobility (range = 0-100) 153plusmn214 149plusmn200 70plusmn157 00006
Fugl-Meyer LE Score
(range = 0-34) 22plusmn34 24plusmn41 13plusmn33 01196
Berg Score (range = 0-56) 88plusmn81 79plusmn85 53plusmn70 00018
Activities Specific Balance Confidence
Score (range=0-100) 138plusmn208 156plusmn194 62plusmn202 00013
Late-LTP (usual care) experienced approximately HALF the improvement of early intervention groups
Falls and Falls Rate
The most common minor adverse event was falls
bull 576 of individuals experienced 1 fall
bull 34 experienced multiple falls
bull 6 experienced an injurious fall
bull More multiple falls in early-LTP group than late-LTP or HEP (plt007)
LEAPS in the context of EBP
For patients in the first year post-stroke who can walk 10 feet but are not walking at speeds gt08 ms (18 mph)
This randomized trial provides strong and high quality evidence that
Structured progressive locomotor training (including BWSTT) is not superior to a structured strengthening and balance exercise program for walking recovery
Either structured program is more effective than usual care at 6 months post-stroke
Both interventions have low risks of adverse events but structured exercise program in the home results in fewer adverse events compared to locomotor training
Current Therapeutic Approaches
bull Activity-based therapies
ndash Robotic interventions
bull Task-specific interventions
bull Aerobic training
bull Muscle Strengthening
bull FES (neuroprosthetics)
bull Virtual Rehabilitation
Results Similar outcomes for final walking speed were found for the different prevailing treatment methods Treatment gains were likewise comparable and generally insufficient for upgrading patientsrsquo functional community walking capacity
Conclusions Different treatment methods exist for poststroke gait
rehabilitation Their availability mode of application and costs vary yet outcomes are largely similar Therefore choosing an appropriate method may be guided by a pragmatic approach Simple ldquolow technologyrdquo and conventional exercise to date is at least as efficacious as more complex strategies such as treadmill and robotic-based interventions
Similarities for success
bull Intensity
bull Repeatability
Obstacles
bull Adverse personal effects
bull Decreased cardiovascular potential
bull Condition of peripheral muscle
bull Heterogeneity of sample
bull Responders versus non-responders
Current Therapeutic Approaches
bull Activity-based therapies
ndash Robotic interventions
bull Task-specific interventions
bull Aerobic training
bull Muscle Strengthening
bull FES (neuroprosthetics)
bull Virtual Rehabilitation
000
1000
2000
3000
4000
5000
6000
7000
8000
Pre Week1 Week2 Week3 Week4 Week5 Week6 Week7 Week8 Week9 Week10 Week11 Post
Self
-Se
lect
ed
Wal
kin
g Sp
ee
d (
cms
)
Mean Walking Speed
Responders versus Non-Responders
0
20
40
60
80
100
120
140
Pre Week1 Week2 Week3 Week4 Week5 Week6 Week7 Week8 Week9 Week10 Week11 Post
Self
-Se
lect
ed
Wal
kin
g Sp
ee
d (
cms
)
Individual Walking Speed
PL1
4
5
7
9
10
11
12
13
14
15
17
18
19
20
21
22
24
What does EBP tell us about current clinical decision making
ldquoPre-gaitrdquo Sequencing
Bridging
Kneeling
Sit-to-stand
Sitting Quadruped
Standing
Modified plantigrade
Half-kneeling
WALKING
Arch Phys Med Rehabil 1989 Oct70(10)755-62 Links Standing balance training effect on balance and locomotion in
hemiparetic adults Winstein CJ Gardner ER McNeal DR Barto PS Nicholson DE
Training symmetrical standing did not lead to symmetrical gait
performancehelliplocomotor pattern was only minimally affected by static balance exercises
Remember Hodgsonrsquos cats those trained to stand could stand
and not step while those trained to step could not stand
Standing = Walking What about BALANCE
Exp Brain Res 2006 Jun172(1)35-48 Epub 2006 Jan 24 Links A direct comparison of local dynamic stability during unperturbed standing and walking Kang HG Dingwell JB
bull Local dynamic stability properties were significantly different when comparing standing versus walking
bull COP divergence measures only significantly correlated with standing
TASK SPECIFICITY MATTERS
hellipBut is that all that matters
bull Strengthening and power training
bull Cardiovascular training
bull Dynamic balance training
bull Motor control training
Elements of Optimized Walking Programs
Advancing Locomotor Rehabilitation Measurement in Physical Therapy
Practice
bull Recovery versus compensation how can measurement distinguish the two
bull Physical performance vs mechanisms of response
bull How does your standardized ldquomeasurementrdquo help guide clinical decision making
Guiding Questions
Numeric Rating Scale (NRS)
The patient rates pain on a scale from 0 to 10
Questions regarding traditional ldquoMeasurementrdquo
1) Does improvement in a measure imply that the patient ldquorecoveredrdquo neuromotor function or simply more efficiently compensated for impaired underlying body functions
2) Does the measurement assist clinical decision making by differentiating between a variety of treatment options
Historically locomotor rehabilitation measurement has incorporated assessments using
1) rating scales
2) timed movement tasks
3) laboratory based outcomes
How may technological advances improve clinical measurement capabilities
Rating Scales
bull Often based on summary scores
ndash Lose individual item sensitivity
ndash Unable to measure subtle changes in control
bull Makes no comments on mechanisms
bull No information on recovery vs compensation or guiding of treatment plan
Timed Movement Tasks
bull Timed up and Go
bull 6 minute walk test (distance)
bull 10 meter walk test (speed)
Many many very positive elements of these tests
ndash Simple to measure
ndash Inexpensive
ndash Reliable and valid
ndash Sensitive
ndash Specific
Walking Speed ishellip
bull ldquohellipalmost the perfect measurerdquo (Wade 1992)
ndash Reliable (Richards 1996)
ndash Valid (Steffen 2002)
ndash Sensitive (van Iersel 2008)
ndash Specific (Harada1995)
ndash Correlates with
bull Functional ability (Perry1995)
bull Balance confidence (Mangione2007)
Walking Speed Predictive
ndash Future health status (Studenski
2003 Purser 2005)
ndash Functional decline (Brach 2002)
bull Hospitalization (Montero-Odasso
2005)
bull Discharge location (Salbach 2001
Rabadi 2005)
bull Mortality (Hardy 2007)
ndash Functional amp Physiological changes (Perry1995)
bull Potential for rehabilitation (Goldie 1996)
bull Aids in prediction of
ndash Falls (Guimaraes 1980)
ndash Fear of falling (Maki 1997)
Fritz S Lusardi M Clayton G Bird W Bidelpach D Duncan PW Gait the Sixth Vital Sign
Page 83
Suggested Way to Measure
HOWEVERhellip
Do these tests answer either of our two introductory questions regarding recovery and treatment planning
What is the role of a vital sign
Diagnostic Test
BP
Differential Exams Cholesterol Blood sugar
Adrenal gland fxn Thyroid fxn Kidney fxn
Diagnostic Test
Walking speed
Differential Exams
Gait Analysis
Laboratory Measures
Angles GRFs
Moments
0
0
tan
tan
inertiacediscontact
inertiacediscontact
MMM
FFF
IICOM
inertia
inertia
M
amF
I
COM
inertiaM
COM
inertiainertia
COMOO
inerrtia MFpM
S
contactT
T
TTTTTTTTTTT
TT
contact
F
contactS
S
SSSSSSSSSSS
SS
contact
F
F
FFFFFFFFFFF
FF
contact
MgmpampM
MgmpampM
GRMGRFCOPgmpampM
COMCOM
COMCOM
COMCOM
)())()()(()(
)())()()(()(
)())()()(()(
1
1
1
RIRIRR
RIRIRR
RIRIRR
S
contactTTT
T
contact
F
contactSSS
S
contact
FFF
F
contact
FgmamF
FgmamF
GRFgmamF
drsquoAlembert approach to inverse dynamics General laws of motion (sum forces sum moments)
General inertial forces and moments
NOTE
in general General (3 dimensional) Parallel Axis Theorem
Moments calculated at the proximal end of each segment
F S and T reflect the moment at proximal foot shank and thigh segments respectively Joint reaction forces
Laws of Motion
Spatiotemporal Analysis
Vastus
Medialis
Semi-
Membranosus
BREAK
bull Motor control training
bull Cardiovascular training
bull Strengthening and power training
bull Dynamic balance training
Elements of Optimized Walking Programs
Examination of Walking Specific Motor Control
Force vertical
Force anterior-posterior
Force medio-lateral
Ground Reaction Forces
Paretic Propulsion (Pp)
The percentage of total anterior GRF (propulsive) impulse generated by the paretic leg referred to as paretic propulsion (Pp) was calculated by dividing the propulsive impulse of the paretic leg by the sum of the paretic and non-paretic propulsive impulses
Pp =
+
0
50
100
1 2 3
Pp
(
)
Bowden et al 2006
bull Increased flexor activity in
preswing (eg TA and RF)
was correlated with
decreased paretic
propulsion
bull Increased plantarflexor
activity in late swing (eg
MG and SO) was correlated
with increased paretic
propulsion
Mechanisms of Response
Turns et al 2007
Extensor EMG Flexor EMG
What correlates with propulsion
bull PropulsionParetic cannot be measured in a conventional clinical setting without access to force plates
bull Step length asymmetry relates to propulsive forces generated by the legs
Paretic Step Ratio (PSR)
Stride Length
Paretic Step Length
PSR = Paretic Step Length Stride Length
PSR lt 047
047 lt PSR lt 053
PSR gt 053
r = -078 p lt 001
Balasubramanian et al 2007
ACTIVE propulsion generated by appropriately timed ankle power
PASSIVE propulsion generated by properly positioned foot COM posterior to the pelvic COM (larger horizontal portion of the red arrow)
Therefore emphasize hip extension
Mechanics of Propulsion and PSR
Clinical Usefulness
Beyond simply promoting symmetry PSR can be used to develop individual goals to train propulsive force production equalize bilateral biomechanical involvement by improving hip extension or promote paretic step initiation
ndash Longer paretic steps may be due to compensation by
greater non-paretic propulsion
ndash Weak relation with speed suggests compensatory strategies to attain functional speeds
ndash PSR may serve as a useful surrogate to assess propulsion during hemiparetic walking
bull These measures are capable of distinguishing ldquorecoveryrdquo from ldquocompensationrdquo
bull They also are capable of distinguishing motor control problems and provide critical information for treatment
BUT
Of what value is this measure to a clinician without biomechanical laboratory capabilities
-040
-030
-020
-010
000
010
020
030
1 7
13
19
25
31
37
43
49
55
61
67
73
79
85
91
97
Raw GRFs
Left leg
Right leg
-030
-020
-010
000
010
020
030
1 8
15
22
29
36
43
50
57
64
71
78
85
92
99
Summed GRFs
Summed GRFs
-030
-020
-010
000
010
020
030
1 8
15
22
29
36
43
50
57
64
71
78
85
92
99
Summed GRFs
Norm accel
GRFs vs Acceleration
CONTROL
-006
-004
-002
000
002
004
006
008
1 713
19
25
31
37
43
49
55
61
67
73
79
85
91
97
Paretic leg
Non paretic leg
Raw GRFs
-006
-004
-002
000
002
004
006
008
1 8
15
22
29
36
43
50
57
64
71
78
85
92
99
Summed GRF
summed GRF
-060
-040
-020
000
020
040
060
080
1 8
15
22
29
36
43
50
57
64
71
78
85
92
99
Normed GRFs
Acceleration
GRFs vs Acceleration
PERSON WITH STROKE
-15
-1
-05
0
05
1
15
1 9
17
25
33
41
49
57
65
73
81
89
97
Acc
ele
rati
on
in m
s2
Pre
Post
Control
Pre- and post-training accelerations of individuals participating in a
locomotor training intervention While COM acceleration increases it
does not approach normative values particularly in the critical phase 3 and 4
period of the gait cycle implying specific therapies need to target specific mechanistic elements of the walking pattern
-08
-06
-04
-02
0
02
04
06
CO
Ma
in m
s2
COMa before (blue line) and 2 minutes after (red line) incline training A
brief (5 minute) period of adaptation training yielded a 48 increase in both
peak COMa and the time integral of the COMa curve in phase 3 and 4 The x-axis represents percentage of the gait cycle
COMa as an outcome measure
bull segmental accelerations
bull studies into shock absorption
bull spatiotemporal gait parameters
bull control of stability
bull age-related changes in movement patterns
bull relating quantifiable movement patterns to falls
Portable applications
-06
-04
-02
0
02
04
06
Acc
ele
rati
on
in m
s2
Low PP
-06
-04
-02
0
02
04
06
Acc
ele
rati
on
in m
s2
Symmetrical
-06
-04
-02
0
02
04
06
Acc
ele
rati
on
in m
s2
High PP
Figure 6 COMa sorted by Pp Sorting by Pp yields three distinctly different acceleration profiles although the double support phase (shaded area) are similar in shape The low Pp
group (b) generates very little acceleration in the double support phase However the high Pp group (c) demonstrates only positive acceleration through the first half of the gait cycle while remaining negative throughout late double support and swing (Bowden Behrman et al In Press) The x-axes represent percentages of the gait cycle
a b c
COMa to diagnose motor control deficits
Examination of Power Training
JOINT POWER
P = moment times angular velocity P(+) = concentric (moments and velocity same direction) shortening contraction P(-) = eccentric (moments and velocity in opposite direction) lengthening contraction
A2
H3
H1
Gregory Bowden et al 2007
bull H1 (hip extension during initial stance) H3 (hip flexion during early swing) and A2 (ankle plantarflexion during late stance and pre-swing) all increased after therapy and the A2 and H3 bursts were significantly correlated with walking speed (Richards et al 2004)
bull Furthermore the A2 peak burst improvement was responsible for 25 of the gain in walking
bull Examining the interlimb coordination effects demonstrated that pre-training paretic A2 and H3 accounted for 84 of the variance in walking speed while post-training the non-paretic H3 replaces the paretic H3 to account for 82 of the post-training variance in patients that improved from 040 ms to 058 ms as a result of the intervention (Richards et al 2004)
Examination of Cardiovascular Status
bull Cardiorespiratory fitness is approximately 50 below age-matched controls
bull Decreased fitness combines with increased energetic demands to decrease efficiency
bull O2 use normalized to walking speed 50 higher bull Due to reduced peripheral muscle activation
change in fiber type reduced enzyme activities and altered hemodynamics
all responsive to exercise interventions
0
2
4
6
8
10
12
14
16
18
0 01 02 03 04 05 06 07
VO
2 (m
lk
gm
in)
Speed (ms)
bull Peak oxygen consumption (VO2) values in patients with stroke are below the level required for many basic activities of daily living (ADL)
bull Peak cardiovascular fitness
levels are roughly half those of age-matched individuals
bull Decreased CV fitness likely limits amount of walking thereby limiting daily physical activity and contributing to a downward spiral
ldquoStroke is a cardiac eventhelliprdquo Pam
Duncan
SS-50 SS-25 SS
SS+25 SS+50
SS-50
SS-25
SS SS+25 SS+50
01
02
03
04
05
06
07
08
O2
Eff (
mL
O2k
gm
)
Voluntary Fatigue
Cadence lt 40 rpm
Borg = 18
90 THR
Angina
HTN
Dyspnea
ST
segment
depression
Other
15
32
22
22
7
05
05
05
1 05
Hypotension
Courtesy of Dorian Rose PT PhD
Cardiovascular Fitness Functional Mobility
Examination of Dynamic Balance Control
Clinical Examinations
Dynamic COM vs COP
Weerdesteyn 2008
Balance Control
Treatment
bull Increase task complexity and difficulty (IRT example)
bull Athletic training
bull Intensity of training
bull Must know if people continue to fall
bull STILL evolving
Putting it All Together
Walking Performance
Motor Control
CV Fitness
Dynamic Balance Control
Strength
Results
bull The mobility group members improved their SMWT performance by an average of 35 m more than members of the UE group (95 CI 7 64)
bull Gait speed increases
ndash 011 ms_ss (95 CI 003 019) and 021 ms_fast (95 CI 12 030) faster than subjects in the UE group
bull TUG
ndash decreased 12 seconds in the intervention group (control increase by 17 seconds)
bull BBS No change (2 points to 1 point)
bull Later reports indicate an improvement in balancefalls efficacy
One therapy will NOT be the answer
Motor Control CV Status StrengthPower Dynamic Balance
Patient 1
Motor Control CV Status StrengthPower Dynamic Balance
Patient 3
Motor Control CV Status StrengthPower Dynamic Balance
Patient 2
Motor Control CV Status StrengthPower Dynamic Balance
Patient 4
Hypothetical future clinic
Overview - REVIEW
bull What is required for successful locomotor rehabilitation
ndash Systematic measurement
ndash Intensity
ndash Task specific practice
ndash Adherence to guiding principles
bull What does evidence-based practice tell us about locomotor rehabilitation
bull Where to go from here and what will future generations of therapeutic practice include
bull Guideline 1 Maximize weight bearing on the legs
bull Guideline 2 Afford the sensory experience consistent with walking
bull Guideline 3 Optimize kinematics for each motor task
bull Guideline 4 Maximize recovery and independence minimize compensation
LT Guidelines
hellipadded Guidelines
bull Systematic
bull Intensive
bull Progressive
bull Repetitive
bull Measure outcomes
hellipplus Plasticity
bull Use it or lose it
bull Use it and improve it
bull Specificity
bull Repetition matters
bull Intensity matters
bull Time matters
bull Salience matters
bull Age matters
bull Transference
bull Interference
Future directions
bull Evaluation to yield meaningful theory-based information to help guide clinical decision making
bull Classification to help guide treatment options
bull Understand ways to build on base therapy depending on impairments while being consistent with training guidelines
bull What tx for whom when in what combination with other tx
bull Clinic as a laboratory
Steve Kautz PhD
Mark George MD
Chris Gregory PhD PT
Aaron Embry DPT MSCR
Lindsay Perry DPT NCS
Patrick Morgan MS
This material is based upon work supported by the Office of Research and Development Rehabilitation Research and Development Department of Veterans Affairs Career Development-1 Award (Project B7177M Bowden PI) SCTR Discovery Pilot Grant (Kautz PI) AHA Innovative Research Grant (Kautz PI) and VA RRampD Merit Award B3983R (Kautz PI) The contents do not represent the views of the Department of Veterans Affairs or the United States Government
Thanks to all of my mentors collaborators and funding sources
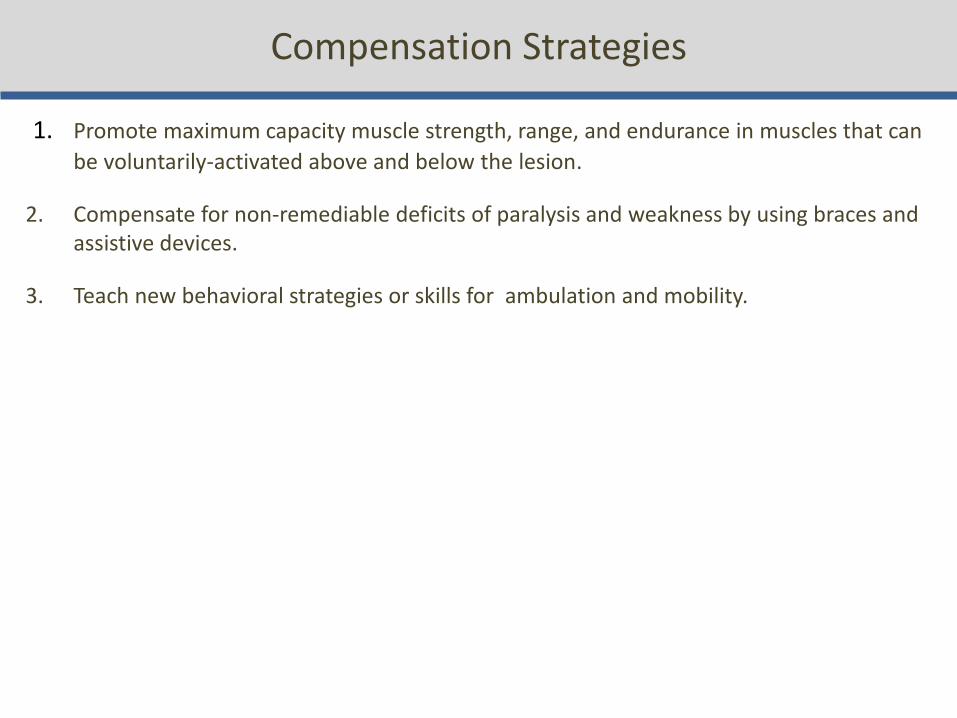
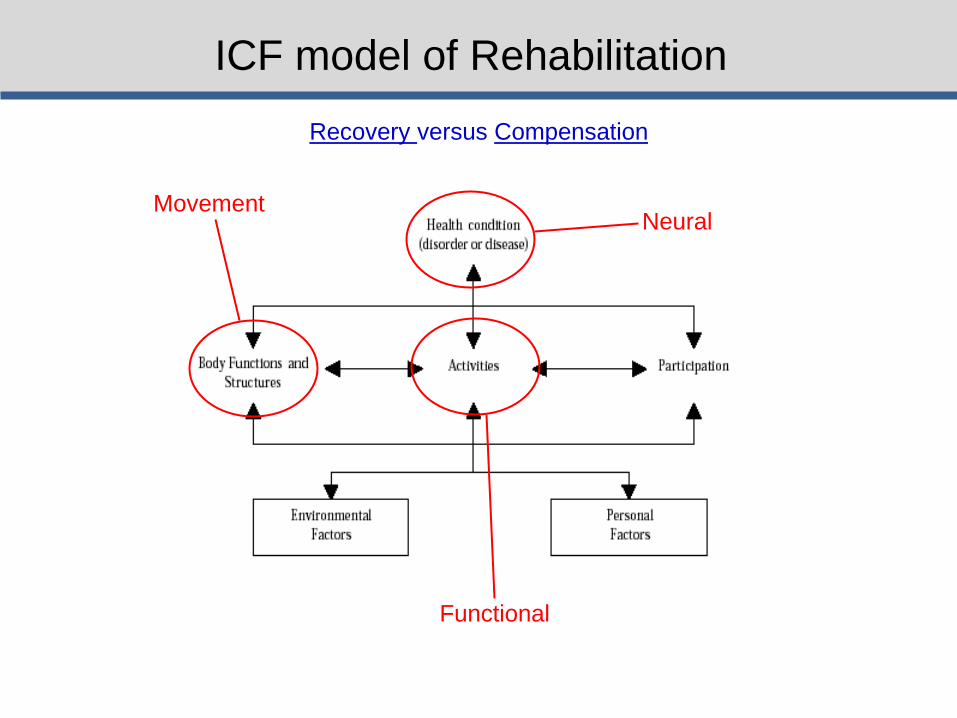

Thomas and Gorassini 2005
Effect of locomotor training on descending drive
Thomas and Gorassini 2005
Spinal Rhythm Generator
bull Definitely present in cats bull May be activated in deafferented animals in the
brainstem (mesencephalic and subthalamic locomotor regions MLR and SLR)
Therefore basic patterns can be activated by nonpatterned and nonspecific descending drive from the brainstem This network can recruit and coordinate muscles on its own However does this same network exists in humans
Do bipedal human have a central pattern generator in the same way as seen in the cat
Studies in humans with complete SCI (no descending drive to peripheral muscle) demonstrate walking patterns and muscle activation consistent with normal walking
None of these individuals has learned to walk off of the treadmill
Harkema 1997
Pattern Generation
Role of sensory feedback
1 Sensory feedback may help to drive the active motoneurons
2 May contribute to corrective reflexes following sudden perturbations
3 May provide essential error signals that inform the brain of differences between the intended movement and the actually executed movementhellipmay update future movements (motor learning)
ldquoThere is no reason to suggest that human walking is generated only by the spinal cord and that the corticospinal tract only makes a significant contribution in relation to voluntary modification of the gait pattern
Nor is there any reason to suggest that the motor cortex alone is
responsible for the activation of the muscles during walking without any contribution from the spinal cord neuronal circuitries
Human bipedal walkinghellipis based on an integration of the activity of
spinal neuronal circuitries with sensory feedback signals and descending motor commandsrdquo
Nielsen 2003
Nielson 2003
Central Control Centers
for control of walking
(from Nielsen 2003) Muscle
activation comes directly
from the cortex as well as
spinal CPGs and is
modulated at each location
by afferent input
Behavioral Output
Sohellip
The most effective locomotor rehab should
bull Train volitional cognitive approaches
bull Normalize sensory inputs and
bull Take advantage of pattern generation circuitry
Experience-Dependent Plasticity
Principles of experience-dependent neural plasticity implications for rehabilitation after brain damage Kleim JA Jones TA J Speech Lang Hear Res 2008 Feb51(1)S225-39
Neuroplasticity
bull ldquoPersistent changes within the central nervous system that result from prior experiences and influence future motor behaviors (Wolpaw and Tennissen 2001)rdquo
bull Brain activation bull Axonal growth bull Sprouting bull Synaptic transmission bull Protein upregulation
bull Therapy can capitalize on the central nervous systemrsquos ability to learn and reorganize to restore function that has already been compromised or lost
bull Driven by changes in behavioral sensory and cognitive experiences
bull Learning happens even in the absence of rehabilitation Therefore as therapists we must drive plasticity in the direction to promote recovery of function
The following are 10 principles of neuromotor change
Principle 1 Use it or lose it - Neural circuits not used will degrade and change
Principle 2 Use it and improve it - Training provides enhancement of function
Nudo 2005
Principle 3 Specificity
bull The type of rehabilitation dictates the type of plasticity
Hodgson et al 1994
Principle 4 Repetition matters
bull Repetition is required for lasting neural changes (ie motor learning)
bull Not just acquisition of the skill but repeated use of the skill over time
Mean number of steps per therapy session 357 (95 CI = 296ndash418) (Lang 2009)
Mean number taken per day in healthy individual 5117 (Bassett
2010)
Principle 5 Intensity matters
bull Sufficient training intensity is required for lasting neural changes (ie motor learning)
Pienemann 2004
WHAT IS INTENSITY FOR WALKING
Principle 6 Time matters
bull Plastic changes require a process over time and do not alter instantaneously
bull Certain time periods post injury may be most beneficial
Gene expression
Synapse formation
Motor map reorganization
Principle 7 Salience matters
bull The system must weigh the importance of any given situation in order to facilitate motor learning (motivation attention emotion etc relate to degree of plasticity)
Principle 8 Age matters bull Potentiation synaptogenesis reorganization all
hampered bull Aging marked by neuronal and synaptic atrophy
Principle 9 Transference
bull ldquoThe ability of plasticity within one set of neural circuits to promote concurrent or subsequent plasticityrdquo
Principle 10 Interference
bull ldquoRefers to the ability of plasticity within a given neural circuitry to impede the induction of new or expression of existing plasticity within that same circuitryhellipimpairing learningrdquo (ex maladaptive plasticity)
Sohellip
The most effective locomotor rehab should
bull Activate desired neural circuitry
bull Be specific to the task
bull Be repetitive intense for appropriate duration
bull Be important to the individual
What does neuroplasticity look like in a clinical intervention
LT Guidelines
bull Guideline 1 Maximize weight bearing on the legs
bull Guideline 2 Afford the sensory experience consistent with walking
bull Guideline 3 Optimize kinematics for each motor task
bull Guideline 4 Maximize recovery and independence minimize compensation
ldquoTrain like you walkrdquo
hellipadded Guidelines
bull Systematic
bull Intensive
bull Progressive
bull Repetitive
bull Document outcomes
hellipplus Plasticity
bull Use it or lose it
bull Use it and improve it
bull Specificity
bull Repetition matters
bull Intensity matters
bull Time matters
bull Salience matters
bull Age matters
bull Transference
bull Interference
So what is ldquoevidence-based practicerdquo
Top Stroke Rehabil 2008 May-Jun15(3)227-46 Links Application of evidence-based practice strategies current
trends in walking recovery interventions poststroke Tilson JK Settle SM Sullivan KJ ldquoRehabilitation effectiveness is enhanced when the clinician can 1 determine the best available interventions 2 for the appropriate subset of patients and 3 apply them at the correct dose and timepoint of recoveryrdquo
Framework
Step 1 Convert the need for information into a focused and searchable clinical question
Narrow question for bull Patient or patient population bull Intervention bull Outcome of interest
ldquoPICOrdquo Population Intervention Comparison (alternate intervention) Outcome of interest
Step 2 Find the best possible research evidence to answer your question
Pubmed
PEDro (Physiotherapy Evidence Database)
National Guidelines Clearinghouse
Canadian Stroke Network
Cochrane Collaboration (wwwcochraneorgreviews)
Step 3 Critically appraise the research evidence for validity and applicability
Assess evidence level and grade
Step 4 Integrate the critically appraised research evidence with clinical expertise and the patients unique biology circumstances and values
ldquoClinical trials do not provide the answers on how to rehabilitate
patientsrdquo bull Inform bull Provide a framework for practice bull Integrate with clinical expertise bull Integrate with patients unique circumstances values and
preferences Partner with patient family and caregivers
Step 5 Evaluate the effectiveness and efficacy of our efforts in Steps 1-4 and identify ways to improve them in the future
bull Monitor impact
bull Use standardized outcome measures
bull Build on each experience
bull PubMedrsquos MyNCBI service set up auto alerts for emerging literature of interest
Examples in stroke literature
Question 1 Aerobic conditioning and walking recovery poststroke
Recommendations
bull High quality (level 1a) and clinically relevant (grade A) research evidence that aerobic conditioning is effective for improving walking speed and endurance poststroke
bull Small body of evidence (conflicting grades A and C) of clinical relevance of impact on disability and QOL
bull Unclear of dose
bull Recommend breaking down by severity and chronicity
Question 2 Ankle-foot-orthosis prescription with an without functional electrical stimulation for walking recovery post-stroke
Recommendations
bull Level 2 grade B evidence that non-FES AFOs are effective for small
changes in walking speed bull Increased
ndash patient independence ndash Perception of safety ndash Confidence
bull Level 1a grade A evidence for improved gait velocity with FES-enabled AFO devices
bull Implanted FES has one RCT supporting lebel 1b grade A evidence for improved walking speed
Questionable functional independence QOL and long-term implications
Question 3 Treadmill training with body weight support for walking recovery post-stroke
BREAK
Locomotor Experience Applied Post-Stroke
bull 5 year
bull Phase-III
bull Single-blinded
bull Multi-site
bull Randomized Clinical Trial
bull If in addition to usual care to determine if a specialized locomotor training program that includes BWST as a treatment modality can produce clinically significant changes in walking speed in individuals post-stroke compared to Home Exercise Program
bull To determine effect of timing (early vs late severity (moderate vs severe) and duration (12- 24- 36-sessions)
Screening at 260plusmn116 days post-stroke 2-month baseline = point of randomization The bars indicate 95 confidence interval
Walking speed trajectory by intervention group and severity at screening 2-(baseline) 6- and 12-months post-stroke
Duncan et al 2011
Walking Speed at 6 Months
bull Six months after stroke Early-LTP (025plusmn021 ms) and HEP (023plusmn020 ms) groups had similar gains in walking speed and sustained these gains at 1 year
bull The Late-LTP group (which only received usual care from 2 to 6 months) improved by 013plusmn014 ms at 6 months
Statistically and Clinically Significant Changes in Outcomes from 2 mos to 12 mos post-stroke
Item
Early-LTP
(n=139)
Late-LTP
(n=143)
HEP
(n=126)
Overall
p-value
Comfortable Walking Speed
(msec) 023plusmn020 024plusmn023 025plusmn022 067
6 minute Walking Distance (m) 732plusmn694 790plusmn751 852plusmn729 045
Step Activity Monitor (SAM) ndash
Median of average number
stepsday [25th -75th percentile]
858
[-253 2422]
1022
[-111 3009]
1471
[435 3481] 010
Stroke Impact Scale (SIS)
Participation
(range = 0-100)
171plusmn259 131plusmn220 144plusmn206 038
SIS ADLIADL (range = 0-100) 96plusmn195 94plusmn172 145plusmn190 007
SIS Mobility (range = 0-100) 137plusmn216 120plusmn191 142plusmn203 0685
Fugl-Meyer LE Score (range
= 0-34) 17plusmn39 15plusmn37 25plusmn43 013
Berg Score (range = 0-56) 80plusmn78 59plusmn91 83plusmn878 006
No differences in improvements across treatment groups HIGHLY clinically relevant improvements
Preplanned Secondary Analysis of 6 Month Outcomes
Item LTP
(n=139)
HEP
(n=126)
UC
(n=143)
Overall
p-value
Comfortable Walking Speed (msec) 025plusmn021 023plusmn020 013plusmn014 lt00001
6 minute Walking Distance (m) 818plusmn628 759plusmn693 410plusmn474 lt00001
Step Activity Monitor (SAM) ndash Median
of average number stepsday [25th -
75th percentile]
1017
[-102 2209]
1357
[84 3382]
566
[-362 2043] 00367
Stroke Impact Scale (SIS) Participation
(range = 0-100) 118plusmn267 146plusmn229 77plusmn205 00384
SIS ADLIADL (range = 0-100) 98plusmn172 130plusmn169 70plusmn178 00516
SIS Mobility (range = 0-100) 153plusmn214 149plusmn200 70plusmn157 00006
Fugl-Meyer LE Score
(range = 0-34) 22plusmn34 24plusmn41 13plusmn33 01196
Berg Score (range = 0-56) 88plusmn81 79plusmn85 53plusmn70 00018
Activities Specific Balance Confidence
Score (range=0-100) 138plusmn208 156plusmn194 62plusmn202 00013
Late-LTP (usual care) experienced approximately HALF the improvement of early intervention groups
Falls and Falls Rate
The most common minor adverse event was falls
bull 576 of individuals experienced 1 fall
bull 34 experienced multiple falls
bull 6 experienced an injurious fall
bull More multiple falls in early-LTP group than late-LTP or HEP (plt007)
LEAPS in the context of EBP
For patients in the first year post-stroke who can walk 10 feet but are not walking at speeds gt08 ms (18 mph)
This randomized trial provides strong and high quality evidence that
Structured progressive locomotor training (including BWSTT) is not superior to a structured strengthening and balance exercise program for walking recovery
Either structured program is more effective than usual care at 6 months post-stroke
Both interventions have low risks of adverse events but structured exercise program in the home results in fewer adverse events compared to locomotor training
Current Therapeutic Approaches
bull Activity-based therapies
ndash Robotic interventions
bull Task-specific interventions
bull Aerobic training
bull Muscle Strengthening
bull FES (neuroprosthetics)
bull Virtual Rehabilitation
Results Similar outcomes for final walking speed were found for the different prevailing treatment methods Treatment gains were likewise comparable and generally insufficient for upgrading patientsrsquo functional community walking capacity
Conclusions Different treatment methods exist for poststroke gait
rehabilitation Their availability mode of application and costs vary yet outcomes are largely similar Therefore choosing an appropriate method may be guided by a pragmatic approach Simple ldquolow technologyrdquo and conventional exercise to date is at least as efficacious as more complex strategies such as treadmill and robotic-based interventions
Similarities for success
bull Intensity
bull Repeatability
Obstacles
bull Adverse personal effects
bull Decreased cardiovascular potential
bull Condition of peripheral muscle
bull Heterogeneity of sample
bull Responders versus non-responders
Current Therapeutic Approaches
bull Activity-based therapies
ndash Robotic interventions
bull Task-specific interventions
bull Aerobic training
bull Muscle Strengthening
bull FES (neuroprosthetics)
bull Virtual Rehabilitation
000
1000
2000
3000
4000
5000
6000
7000
8000
Pre Week1 Week2 Week3 Week4 Week5 Week6 Week7 Week8 Week9 Week10 Week11 Post
Self
-Se
lect
ed
Wal
kin
g Sp
ee
d (
cms
)
Mean Walking Speed
Responders versus Non-Responders
0
20
40
60
80
100
120
140
Pre Week1 Week2 Week3 Week4 Week5 Week6 Week7 Week8 Week9 Week10 Week11 Post
Self
-Se
lect
ed
Wal
kin
g Sp
ee
d (
cms
)
Individual Walking Speed
PL1
4
5
7
9
10
11
12
13
14
15
17
18
19
20
21
22
24
What does EBP tell us about current clinical decision making
ldquoPre-gaitrdquo Sequencing
Bridging
Kneeling
Sit-to-stand
Sitting Quadruped
Standing
Modified plantigrade
Half-kneeling
WALKING
Arch Phys Med Rehabil 1989 Oct70(10)755-62 Links Standing balance training effect on balance and locomotion in
hemiparetic adults Winstein CJ Gardner ER McNeal DR Barto PS Nicholson DE
Training symmetrical standing did not lead to symmetrical gait
performancehelliplocomotor pattern was only minimally affected by static balance exercises
Remember Hodgsonrsquos cats those trained to stand could stand
and not step while those trained to step could not stand
Standing = Walking What about BALANCE
Exp Brain Res 2006 Jun172(1)35-48 Epub 2006 Jan 24 Links A direct comparison of local dynamic stability during unperturbed standing and walking Kang HG Dingwell JB
bull Local dynamic stability properties were significantly different when comparing standing versus walking
bull COP divergence measures only significantly correlated with standing
TASK SPECIFICITY MATTERS
hellipBut is that all that matters
bull Strengthening and power training
bull Cardiovascular training
bull Dynamic balance training
bull Motor control training
Elements of Optimized Walking Programs
Advancing Locomotor Rehabilitation Measurement in Physical Therapy
Practice
bull Recovery versus compensation how can measurement distinguish the two
bull Physical performance vs mechanisms of response
bull How does your standardized ldquomeasurementrdquo help guide clinical decision making
Guiding Questions
Numeric Rating Scale (NRS)
The patient rates pain on a scale from 0 to 10
Questions regarding traditional ldquoMeasurementrdquo
1) Does improvement in a measure imply that the patient ldquorecoveredrdquo neuromotor function or simply more efficiently compensated for impaired underlying body functions
2) Does the measurement assist clinical decision making by differentiating between a variety of treatment options
Historically locomotor rehabilitation measurement has incorporated assessments using
1) rating scales
2) timed movement tasks
3) laboratory based outcomes
How may technological advances improve clinical measurement capabilities
Rating Scales
bull Often based on summary scores
ndash Lose individual item sensitivity
ndash Unable to measure subtle changes in control
bull Makes no comments on mechanisms
bull No information on recovery vs compensation or guiding of treatment plan
Timed Movement Tasks
bull Timed up and Go
bull 6 minute walk test (distance)
bull 10 meter walk test (speed)
Many many very positive elements of these tests
ndash Simple to measure
ndash Inexpensive
ndash Reliable and valid
ndash Sensitive
ndash Specific
Walking Speed ishellip
bull ldquohellipalmost the perfect measurerdquo (Wade 1992)
ndash Reliable (Richards 1996)
ndash Valid (Steffen 2002)
ndash Sensitive (van Iersel 2008)
ndash Specific (Harada1995)
ndash Correlates with
bull Functional ability (Perry1995)
bull Balance confidence (Mangione2007)
Walking Speed Predictive
ndash Future health status (Studenski
2003 Purser 2005)
ndash Functional decline (Brach 2002)
bull Hospitalization (Montero-Odasso
2005)
bull Discharge location (Salbach 2001
Rabadi 2005)
bull Mortality (Hardy 2007)
ndash Functional amp Physiological changes (Perry1995)
bull Potential for rehabilitation (Goldie 1996)
bull Aids in prediction of
ndash Falls (Guimaraes 1980)
ndash Fear of falling (Maki 1997)
Fritz S Lusardi M Clayton G Bird W Bidelpach D Duncan PW Gait the Sixth Vital Sign
Page 83
Suggested Way to Measure
HOWEVERhellip
Do these tests answer either of our two introductory questions regarding recovery and treatment planning
What is the role of a vital sign
Diagnostic Test
BP
Differential Exams Cholesterol Blood sugar
Adrenal gland fxn Thyroid fxn Kidney fxn
Diagnostic Test
Walking speed
Differential Exams
Gait Analysis
Laboratory Measures
Angles GRFs
Moments
0
0
tan
tan
inertiacediscontact
inertiacediscontact
MMM
FFF
IICOM
inertia
inertia
M
amF
I
COM
inertiaM
COM
inertiainertia
COMOO
inerrtia MFpM
S
contactT
T
TTTTTTTTTTT
TT
contact
F
contactS
S
SSSSSSSSSSS
SS
contact
F
F
FFFFFFFFFFF
FF
contact
MgmpampM
MgmpampM
GRMGRFCOPgmpampM
COMCOM
COMCOM
COMCOM
)())()()(()(
)())()()(()(
)())()()(()(
1
1
1
RIRIRR
RIRIRR
RIRIRR
S
contactTTT
T
contact
F
contactSSS
S
contact
FFF
F
contact
FgmamF
FgmamF
GRFgmamF
drsquoAlembert approach to inverse dynamics General laws of motion (sum forces sum moments)
General inertial forces and moments
NOTE
in general General (3 dimensional) Parallel Axis Theorem
Moments calculated at the proximal end of each segment
F S and T reflect the moment at proximal foot shank and thigh segments respectively Joint reaction forces
Laws of Motion
Spatiotemporal Analysis
Vastus
Medialis
Semi-
Membranosus
BREAK
bull Motor control training
bull Cardiovascular training
bull Strengthening and power training
bull Dynamic balance training
Elements of Optimized Walking Programs
Examination of Walking Specific Motor Control
Force vertical
Force anterior-posterior
Force medio-lateral
Ground Reaction Forces
Paretic Propulsion (Pp)
The percentage of total anterior GRF (propulsive) impulse generated by the paretic leg referred to as paretic propulsion (Pp) was calculated by dividing the propulsive impulse of the paretic leg by the sum of the paretic and non-paretic propulsive impulses
Pp =
+
0
50
100
1 2 3
Pp
(
)
Bowden et al 2006
bull Increased flexor activity in
preswing (eg TA and RF)
was correlated with
decreased paretic
propulsion
bull Increased plantarflexor
activity in late swing (eg
MG and SO) was correlated
with increased paretic
propulsion
Mechanisms of Response
Turns et al 2007
Extensor EMG Flexor EMG
What correlates with propulsion
bull PropulsionParetic cannot be measured in a conventional clinical setting without access to force plates
bull Step length asymmetry relates to propulsive forces generated by the legs
Paretic Step Ratio (PSR)
Stride Length
Paretic Step Length
PSR = Paretic Step Length Stride Length
PSR lt 047
047 lt PSR lt 053
PSR gt 053
r = -078 p lt 001
Balasubramanian et al 2007
ACTIVE propulsion generated by appropriately timed ankle power
PASSIVE propulsion generated by properly positioned foot COM posterior to the pelvic COM (larger horizontal portion of the red arrow)
Therefore emphasize hip extension
Mechanics of Propulsion and PSR
Clinical Usefulness
Beyond simply promoting symmetry PSR can be used to develop individual goals to train propulsive force production equalize bilateral biomechanical involvement by improving hip extension or promote paretic step initiation
ndash Longer paretic steps may be due to compensation by
greater non-paretic propulsion
ndash Weak relation with speed suggests compensatory strategies to attain functional speeds
ndash PSR may serve as a useful surrogate to assess propulsion during hemiparetic walking
bull These measures are capable of distinguishing ldquorecoveryrdquo from ldquocompensationrdquo
bull They also are capable of distinguishing motor control problems and provide critical information for treatment
BUT
Of what value is this measure to a clinician without biomechanical laboratory capabilities
-040
-030
-020
-010
000
010
020
030
1 7
13
19
25
31
37
43
49
55
61
67
73
79
85
91
97
Raw GRFs
Left leg
Right leg
-030
-020
-010
000
010
020
030
1 8
15
22
29
36
43
50
57
64
71
78
85
92
99
Summed GRFs
Summed GRFs
-030
-020
-010
000
010
020
030
1 8
15
22
29
36
43
50
57
64
71
78
85
92
99
Summed GRFs
Norm accel
GRFs vs Acceleration
CONTROL
-006
-004
-002
000
002
004
006
008
1 713
19
25
31
37
43
49
55
61
67
73
79
85
91
97
Paretic leg
Non paretic leg
Raw GRFs
-006
-004
-002
000
002
004
006
008
1 8
15
22
29
36
43
50
57
64
71
78
85
92
99
Summed GRF
summed GRF
-060
-040
-020
000
020
040
060
080
1 8
15
22
29
36
43
50
57
64
71
78
85
92
99
Normed GRFs
Acceleration
GRFs vs Acceleration
PERSON WITH STROKE
-15
-1
-05
0
05
1
15
1 9
17
25
33
41
49
57
65
73
81
89
97
Acc
ele
rati
on
in m
s2
Pre
Post
Control
Pre- and post-training accelerations of individuals participating in a
locomotor training intervention While COM acceleration increases it
does not approach normative values particularly in the critical phase 3 and 4
period of the gait cycle implying specific therapies need to target specific mechanistic elements of the walking pattern
-08
-06
-04
-02
0
02
04
06
CO
Ma
in m
s2
COMa before (blue line) and 2 minutes after (red line) incline training A
brief (5 minute) period of adaptation training yielded a 48 increase in both
peak COMa and the time integral of the COMa curve in phase 3 and 4 The x-axis represents percentage of the gait cycle
COMa as an outcome measure
bull segmental accelerations
bull studies into shock absorption
bull spatiotemporal gait parameters
bull control of stability
bull age-related changes in movement patterns
bull relating quantifiable movement patterns to falls
Portable applications
-06
-04
-02
0
02
04
06
Acc
ele
rati
on
in m
s2
Low PP
-06
-04
-02
0
02
04
06
Acc
ele
rati
on
in m
s2
Symmetrical
-06
-04
-02
0
02
04
06
Acc
ele
rati
on
in m
s2
High PP
Figure 6 COMa sorted by Pp Sorting by Pp yields three distinctly different acceleration profiles although the double support phase (shaded area) are similar in shape The low Pp
group (b) generates very little acceleration in the double support phase However the high Pp group (c) demonstrates only positive acceleration through the first half of the gait cycle while remaining negative throughout late double support and swing (Bowden Behrman et al In Press) The x-axes represent percentages of the gait cycle
a b c
COMa to diagnose motor control deficits
Examination of Power Training
JOINT POWER
P = moment times angular velocity P(+) = concentric (moments and velocity same direction) shortening contraction P(-) = eccentric (moments and velocity in opposite direction) lengthening contraction
A2
H3
H1
Gregory Bowden et al 2007
bull H1 (hip extension during initial stance) H3 (hip flexion during early swing) and A2 (ankle plantarflexion during late stance and pre-swing) all increased after therapy and the A2 and H3 bursts were significantly correlated with walking speed (Richards et al 2004)
bull Furthermore the A2 peak burst improvement was responsible for 25 of the gain in walking
bull Examining the interlimb coordination effects demonstrated that pre-training paretic A2 and H3 accounted for 84 of the variance in walking speed while post-training the non-paretic H3 replaces the paretic H3 to account for 82 of the post-training variance in patients that improved from 040 ms to 058 ms as a result of the intervention (Richards et al 2004)
Examination of Cardiovascular Status
bull Cardiorespiratory fitness is approximately 50 below age-matched controls
bull Decreased fitness combines with increased energetic demands to decrease efficiency
bull O2 use normalized to walking speed 50 higher bull Due to reduced peripheral muscle activation
change in fiber type reduced enzyme activities and altered hemodynamics
all responsive to exercise interventions
0
2
4
6
8
10
12
14
16
18
0 01 02 03 04 05 06 07
VO
2 (m
lk
gm
in)
Speed (ms)
bull Peak oxygen consumption (VO2) values in patients with stroke are below the level required for many basic activities of daily living (ADL)
bull Peak cardiovascular fitness
levels are roughly half those of age-matched individuals
bull Decreased CV fitness likely limits amount of walking thereby limiting daily physical activity and contributing to a downward spiral
ldquoStroke is a cardiac eventhelliprdquo Pam
Duncan
SS-50 SS-25 SS
SS+25 SS+50
SS-50
SS-25
SS SS+25 SS+50
01
02
03
04
05
06
07
08
O2
Eff (
mL
O2k
gm
)
Voluntary Fatigue
Cadence lt 40 rpm
Borg = 18
90 THR
Angina
HTN
Dyspnea
ST
segment
depression
Other
15
32
22
22
7
05
05
05
1 05
Hypotension
Courtesy of Dorian Rose PT PhD
Cardiovascular Fitness Functional Mobility
Examination of Dynamic Balance Control
Clinical Examinations
Dynamic COM vs COP
Weerdesteyn 2008
Balance Control
Treatment
bull Increase task complexity and difficulty (IRT example)
bull Athletic training
bull Intensity of training
bull Must know if people continue to fall
bull STILL evolving
Putting it All Together
Walking Performance
Motor Control
CV Fitness
Dynamic Balance Control
Strength
Results
bull The mobility group members improved their SMWT performance by an average of 35 m more than members of the UE group (95 CI 7 64)
bull Gait speed increases
ndash 011 ms_ss (95 CI 003 019) and 021 ms_fast (95 CI 12 030) faster than subjects in the UE group
bull TUG
ndash decreased 12 seconds in the intervention group (control increase by 17 seconds)
bull BBS No change (2 points to 1 point)
bull Later reports indicate an improvement in balancefalls efficacy
One therapy will NOT be the answer
Motor Control CV Status StrengthPower Dynamic Balance
Patient 1
Motor Control CV Status StrengthPower Dynamic Balance
Patient 3
Motor Control CV Status StrengthPower Dynamic Balance
Patient 2
Motor Control CV Status StrengthPower Dynamic Balance
Patient 4
Hypothetical future clinic
Overview - REVIEW
bull What is required for successful locomotor rehabilitation
ndash Systematic measurement
ndash Intensity
ndash Task specific practice
ndash Adherence to guiding principles
bull What does evidence-based practice tell us about locomotor rehabilitation
bull Where to go from here and what will future generations of therapeutic practice include
bull Guideline 1 Maximize weight bearing on the legs
bull Guideline 2 Afford the sensory experience consistent with walking
bull Guideline 3 Optimize kinematics for each motor task
bull Guideline 4 Maximize recovery and independence minimize compensation
LT Guidelines
hellipadded Guidelines
bull Systematic
bull Intensive
bull Progressive
bull Repetitive
bull Measure outcomes
hellipplus Plasticity
bull Use it or lose it
bull Use it and improve it
bull Specificity
bull Repetition matters
bull Intensity matters
bull Time matters
bull Salience matters
bull Age matters
bull Transference
bull Interference
Future directions
bull Evaluation to yield meaningful theory-based information to help guide clinical decision making
bull Classification to help guide treatment options
bull Understand ways to build on base therapy depending on impairments while being consistent with training guidelines
bull What tx for whom when in what combination with other tx
bull Clinic as a laboratory
Steve Kautz PhD
Mark George MD
Chris Gregory PhD PT
Aaron Embry DPT MSCR
Lindsay Perry DPT NCS
Patrick Morgan MS
This material is based upon work supported by the Office of Research and Development Rehabilitation Research and Development Department of Veterans Affairs Career Development-1 Award (Project B7177M Bowden PI) SCTR Discovery Pilot Grant (Kautz PI) AHA Innovative Research Grant (Kautz PI) and VA RRampD Merit Award B3983R (Kautz PI) The contents do not represent the views of the Department of Veterans Affairs or the United States Government
Thanks to all of my mentors collaborators and funding sources
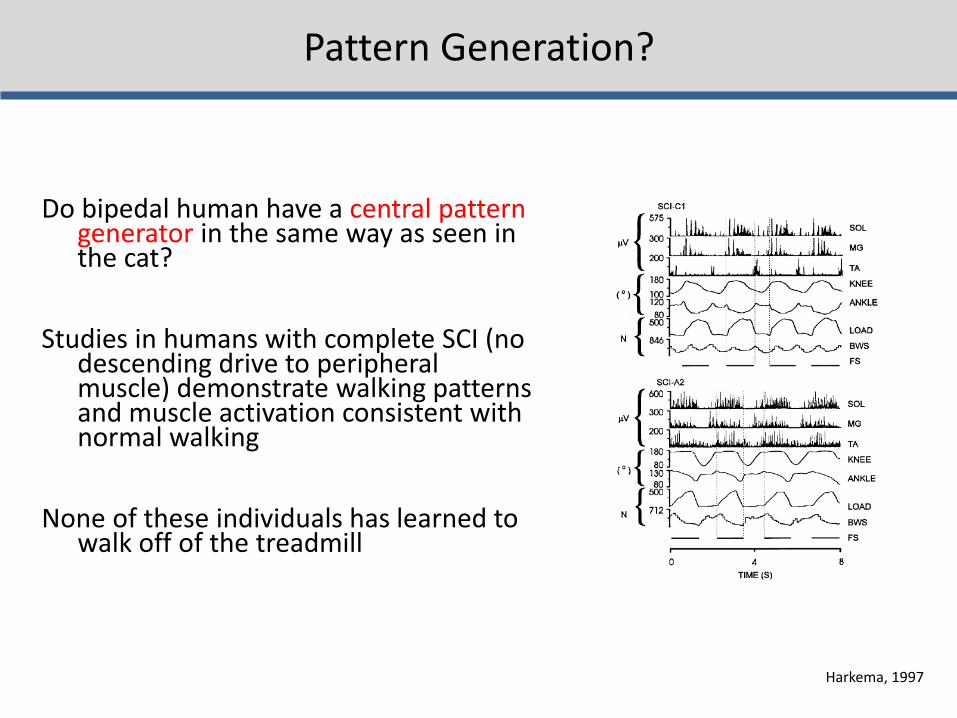

Sohellip
The most effective locomotor rehab should
bull Train volitional cognitive approaches
bull Normalize sensory inputs and
bull Take advantage of pattern generation circuitry
Experience-Dependent Plasticity
Principles of experience-dependent neural plasticity implications for rehabilitation after brain damage Kleim JA Jones TA J Speech Lang Hear Res 2008 Feb51(1)S225-39
Neuroplasticity
bull ldquoPersistent changes within the central nervous system that result from prior experiences and influence future motor behaviors (Wolpaw and Tennissen 2001)rdquo
bull Brain activation bull Axonal growth bull Sprouting bull Synaptic transmission bull Protein upregulation
bull Therapy can capitalize on the central nervous systemrsquos ability to learn and reorganize to restore function that has already been compromised or lost
bull Driven by changes in behavioral sensory and cognitive experiences
bull Learning happens even in the absence of rehabilitation Therefore as therapists we must drive plasticity in the direction to promote recovery of function
The following are 10 principles of neuromotor change
Principle 1 Use it or lose it - Neural circuits not used will degrade and change
Principle 2 Use it and improve it - Training provides enhancement of function
Nudo 2005
Principle 3 Specificity
bull The type of rehabilitation dictates the type of plasticity
Hodgson et al 1994
Principle 4 Repetition matters
bull Repetition is required for lasting neural changes (ie motor learning)
bull Not just acquisition of the skill but repeated use of the skill over time
Mean number of steps per therapy session 357 (95 CI = 296ndash418) (Lang 2009)
Mean number taken per day in healthy individual 5117 (Bassett
2010)
Principle 5 Intensity matters
bull Sufficient training intensity is required for lasting neural changes (ie motor learning)
Pienemann 2004
WHAT IS INTENSITY FOR WALKING
Principle 6 Time matters
bull Plastic changes require a process over time and do not alter instantaneously
bull Certain time periods post injury may be most beneficial
Gene expression
Synapse formation
Motor map reorganization
Principle 7 Salience matters
bull The system must weigh the importance of any given situation in order to facilitate motor learning (motivation attention emotion etc relate to degree of plasticity)
Principle 8 Age matters bull Potentiation synaptogenesis reorganization all
hampered bull Aging marked by neuronal and synaptic atrophy
Principle 9 Transference
bull ldquoThe ability of plasticity within one set of neural circuits to promote concurrent or subsequent plasticityrdquo
Principle 10 Interference
bull ldquoRefers to the ability of plasticity within a given neural circuitry to impede the induction of new or expression of existing plasticity within that same circuitryhellipimpairing learningrdquo (ex maladaptive plasticity)
Sohellip
The most effective locomotor rehab should
bull Activate desired neural circuitry
bull Be specific to the task
bull Be repetitive intense for appropriate duration
bull Be important to the individual
What does neuroplasticity look like in a clinical intervention
LT Guidelines
bull Guideline 1 Maximize weight bearing on the legs
bull Guideline 2 Afford the sensory experience consistent with walking
bull Guideline 3 Optimize kinematics for each motor task
bull Guideline 4 Maximize recovery and independence minimize compensation
ldquoTrain like you walkrdquo
hellipadded Guidelines
bull Systematic
bull Intensive
bull Progressive
bull Repetitive
bull Document outcomes
hellipplus Plasticity
bull Use it or lose it
bull Use it and improve it
bull Specificity
bull Repetition matters
bull Intensity matters
bull Time matters
bull Salience matters
bull Age matters
bull Transference
bull Interference
So what is ldquoevidence-based practicerdquo
Top Stroke Rehabil 2008 May-Jun15(3)227-46 Links Application of evidence-based practice strategies current
trends in walking recovery interventions poststroke Tilson JK Settle SM Sullivan KJ ldquoRehabilitation effectiveness is enhanced when the clinician can 1 determine the best available interventions 2 for the appropriate subset of patients and 3 apply them at the correct dose and timepoint of recoveryrdquo
Framework
Step 1 Convert the need for information into a focused and searchable clinical question
Narrow question for bull Patient or patient population bull Intervention bull Outcome of interest
ldquoPICOrdquo Population Intervention Comparison (alternate intervention) Outcome of interest
Step 2 Find the best possible research evidence to answer your question
Pubmed
PEDro (Physiotherapy Evidence Database)
National Guidelines Clearinghouse
Canadian Stroke Network
Cochrane Collaboration (wwwcochraneorgreviews)
Step 3 Critically appraise the research evidence for validity and applicability
Assess evidence level and grade
Step 4 Integrate the critically appraised research evidence with clinical expertise and the patients unique biology circumstances and values
ldquoClinical trials do not provide the answers on how to rehabilitate
patientsrdquo bull Inform bull Provide a framework for practice bull Integrate with clinical expertise bull Integrate with patients unique circumstances values and
preferences Partner with patient family and caregivers
Step 5 Evaluate the effectiveness and efficacy of our efforts in Steps 1-4 and identify ways to improve them in the future
bull Monitor impact
bull Use standardized outcome measures
bull Build on each experience
bull PubMedrsquos MyNCBI service set up auto alerts for emerging literature of interest
Examples in stroke literature
Question 1 Aerobic conditioning and walking recovery poststroke
Recommendations
bull High quality (level 1a) and clinically relevant (grade A) research evidence that aerobic conditioning is effective for improving walking speed and endurance poststroke
bull Small body of evidence (conflicting grades A and C) of clinical relevance of impact on disability and QOL
bull Unclear of dose
bull Recommend breaking down by severity and chronicity
Question 2 Ankle-foot-orthosis prescription with an without functional electrical stimulation for walking recovery post-stroke
Recommendations
bull Level 2 grade B evidence that non-FES AFOs are effective for small
changes in walking speed bull Increased
ndash patient independence ndash Perception of safety ndash Confidence
bull Level 1a grade A evidence for improved gait velocity with FES-enabled AFO devices
bull Implanted FES has one RCT supporting lebel 1b grade A evidence for improved walking speed
Questionable functional independence QOL and long-term implications
Question 3 Treadmill training with body weight support for walking recovery post-stroke
BREAK
Locomotor Experience Applied Post-Stroke
bull 5 year
bull Phase-III
bull Single-blinded
bull Multi-site
bull Randomized Clinical Trial
bull If in addition to usual care to determine if a specialized locomotor training program that includes BWST as a treatment modality can produce clinically significant changes in walking speed in individuals post-stroke compared to Home Exercise Program
bull To determine effect of timing (early vs late severity (moderate vs severe) and duration (12- 24- 36-sessions)
Screening at 260plusmn116 days post-stroke 2-month baseline = point of randomization The bars indicate 95 confidence interval
Walking speed trajectory by intervention group and severity at screening 2-(baseline) 6- and 12-months post-stroke
Duncan et al 2011
Walking Speed at 6 Months
bull Six months after stroke Early-LTP (025plusmn021 ms) and HEP (023plusmn020 ms) groups had similar gains in walking speed and sustained these gains at 1 year
bull The Late-LTP group (which only received usual care from 2 to 6 months) improved by 013plusmn014 ms at 6 months
Statistically and Clinically Significant Changes in Outcomes from 2 mos to 12 mos post-stroke
Item
Early-LTP
(n=139)
Late-LTP
(n=143)
HEP
(n=126)
Overall
p-value
Comfortable Walking Speed
(msec) 023plusmn020 024plusmn023 025plusmn022 067
6 minute Walking Distance (m) 732plusmn694 790plusmn751 852plusmn729 045
Step Activity Monitor (SAM) ndash
Median of average number
stepsday [25th -75th percentile]
858
[-253 2422]
1022
[-111 3009]
1471
[435 3481] 010
Stroke Impact Scale (SIS)
Participation
(range = 0-100)
171plusmn259 131plusmn220 144plusmn206 038
SIS ADLIADL (range = 0-100) 96plusmn195 94plusmn172 145plusmn190 007
SIS Mobility (range = 0-100) 137plusmn216 120plusmn191 142plusmn203 0685
Fugl-Meyer LE Score (range
= 0-34) 17plusmn39 15plusmn37 25plusmn43 013
Berg Score (range = 0-56) 80plusmn78 59plusmn91 83plusmn878 006
No differences in improvements across treatment groups HIGHLY clinically relevant improvements
Preplanned Secondary Analysis of 6 Month Outcomes
Item LTP
(n=139)
HEP
(n=126)
UC
(n=143)
Overall
p-value
Comfortable Walking Speed (msec) 025plusmn021 023plusmn020 013plusmn014 lt00001
6 minute Walking Distance (m) 818plusmn628 759plusmn693 410plusmn474 lt00001
Step Activity Monitor (SAM) ndash Median
of average number stepsday [25th -
75th percentile]
1017
[-102 2209]
1357
[84 3382]
566
[-362 2043] 00367
Stroke Impact Scale (SIS) Participation
(range = 0-100) 118plusmn267 146plusmn229 77plusmn205 00384
SIS ADLIADL (range = 0-100) 98plusmn172 130plusmn169 70plusmn178 00516
SIS Mobility (range = 0-100) 153plusmn214 149plusmn200 70plusmn157 00006
Fugl-Meyer LE Score
(range = 0-34) 22plusmn34 24plusmn41 13plusmn33 01196
Berg Score (range = 0-56) 88plusmn81 79plusmn85 53plusmn70 00018
Activities Specific Balance Confidence
Score (range=0-100) 138plusmn208 156plusmn194 62plusmn202 00013
Late-LTP (usual care) experienced approximately HALF the improvement of early intervention groups
Falls and Falls Rate
The most common minor adverse event was falls
bull 576 of individuals experienced 1 fall
bull 34 experienced multiple falls
bull 6 experienced an injurious fall
bull More multiple falls in early-LTP group than late-LTP or HEP (plt007)
LEAPS in the context of EBP
For patients in the first year post-stroke who can walk 10 feet but are not walking at speeds gt08 ms (18 mph)
This randomized trial provides strong and high quality evidence that
Structured progressive locomotor training (including BWSTT) is not superior to a structured strengthening and balance exercise program for walking recovery
Either structured program is more effective than usual care at 6 months post-stroke
Both interventions have low risks of adverse events but structured exercise program in the home results in fewer adverse events compared to locomotor training
Current Therapeutic Approaches
bull Activity-based therapies
ndash Robotic interventions
bull Task-specific interventions
bull Aerobic training
bull Muscle Strengthening
bull FES (neuroprosthetics)
bull Virtual Rehabilitation
Results Similar outcomes for final walking speed were found for the different prevailing treatment methods Treatment gains were likewise comparable and generally insufficient for upgrading patientsrsquo functional community walking capacity
Conclusions Different treatment methods exist for poststroke gait
rehabilitation Their availability mode of application and costs vary yet outcomes are largely similar Therefore choosing an appropriate method may be guided by a pragmatic approach Simple ldquolow technologyrdquo and conventional exercise to date is at least as efficacious as more complex strategies such as treadmill and robotic-based interventions
Similarities for success
bull Intensity
bull Repeatability
Obstacles
bull Adverse personal effects
bull Decreased cardiovascular potential
bull Condition of peripheral muscle
bull Heterogeneity of sample
bull Responders versus non-responders
Current Therapeutic Approaches
bull Activity-based therapies
ndash Robotic interventions
bull Task-specific interventions
bull Aerobic training
bull Muscle Strengthening
bull FES (neuroprosthetics)
bull Virtual Rehabilitation
000
1000
2000
3000
4000
5000
6000
7000
8000
Pre Week1 Week2 Week3 Week4 Week5 Week6 Week7 Week8 Week9 Week10 Week11 Post
Self
-Se
lect
ed
Wal
kin
g Sp
ee
d (
cms
)
Mean Walking Speed
Responders versus Non-Responders
0
20
40
60
80
100
120
140
Pre Week1 Week2 Week3 Week4 Week5 Week6 Week7 Week8 Week9 Week10 Week11 Post
Self
-Se
lect
ed
Wal
kin
g Sp
ee
d (
cms
)
Individual Walking Speed
PL1
4
5
7
9
10
11
12
13
14
15
17
18
19
20
21
22
24
What does EBP tell us about current clinical decision making
ldquoPre-gaitrdquo Sequencing
Bridging
Kneeling
Sit-to-stand
Sitting Quadruped
Standing
Modified plantigrade
Half-kneeling
WALKING
Arch Phys Med Rehabil 1989 Oct70(10)755-62 Links Standing balance training effect on balance and locomotion in
hemiparetic adults Winstein CJ Gardner ER McNeal DR Barto PS Nicholson DE
Training symmetrical standing did not lead to symmetrical gait
performancehelliplocomotor pattern was only minimally affected by static balance exercises
Remember Hodgsonrsquos cats those trained to stand could stand
and not step while those trained to step could not stand
Standing = Walking What about BALANCE
Exp Brain Res 2006 Jun172(1)35-48 Epub 2006 Jan 24 Links A direct comparison of local dynamic stability during unperturbed standing and walking Kang HG Dingwell JB
bull Local dynamic stability properties were significantly different when comparing standing versus walking
bull COP divergence measures only significantly correlated with standing
TASK SPECIFICITY MATTERS
hellipBut is that all that matters
bull Strengthening and power training
bull Cardiovascular training
bull Dynamic balance training
bull Motor control training
Elements of Optimized Walking Programs
Advancing Locomotor Rehabilitation Measurement in Physical Therapy
Practice
bull Recovery versus compensation how can measurement distinguish the two
bull Physical performance vs mechanisms of response
bull How does your standardized ldquomeasurementrdquo help guide clinical decision making
Guiding Questions
Numeric Rating Scale (NRS)
The patient rates pain on a scale from 0 to 10
Questions regarding traditional ldquoMeasurementrdquo
1) Does improvement in a measure imply that the patient ldquorecoveredrdquo neuromotor function or simply more efficiently compensated for impaired underlying body functions
2) Does the measurement assist clinical decision making by differentiating between a variety of treatment options
Historically locomotor rehabilitation measurement has incorporated assessments using
1) rating scales
2) timed movement tasks
3) laboratory based outcomes
How may technological advances improve clinical measurement capabilities
Rating Scales
bull Often based on summary scores
ndash Lose individual item sensitivity
ndash Unable to measure subtle changes in control
bull Makes no comments on mechanisms
bull No information on recovery vs compensation or guiding of treatment plan
Timed Movement Tasks
bull Timed up and Go
bull 6 minute walk test (distance)
bull 10 meter walk test (speed)
Many many very positive elements of these tests
ndash Simple to measure
ndash Inexpensive
ndash Reliable and valid
ndash Sensitive
ndash Specific
Walking Speed ishellip
bull ldquohellipalmost the perfect measurerdquo (Wade 1992)
ndash Reliable (Richards 1996)
ndash Valid (Steffen 2002)
ndash Sensitive (van Iersel 2008)
ndash Specific (Harada1995)
ndash Correlates with
bull Functional ability (Perry1995)
bull Balance confidence (Mangione2007)
Walking Speed Predictive
ndash Future health status (Studenski
2003 Purser 2005)
ndash Functional decline (Brach 2002)
bull Hospitalization (Montero-Odasso
2005)
bull Discharge location (Salbach 2001
Rabadi 2005)
bull Mortality (Hardy 2007)
ndash Functional amp Physiological changes (Perry1995)
bull Potential for rehabilitation (Goldie 1996)
bull Aids in prediction of
ndash Falls (Guimaraes 1980)
ndash Fear of falling (Maki 1997)
Fritz S Lusardi M Clayton G Bird W Bidelpach D Duncan PW Gait the Sixth Vital Sign
Page 83
Suggested Way to Measure
HOWEVERhellip
Do these tests answer either of our two introductory questions regarding recovery and treatment planning
What is the role of a vital sign
Diagnostic Test
BP
Differential Exams Cholesterol Blood sugar
Adrenal gland fxn Thyroid fxn Kidney fxn
Diagnostic Test
Walking speed
Differential Exams
Gait Analysis
Laboratory Measures
Angles GRFs
Moments
0
0
tan
tan
inertiacediscontact
inertiacediscontact
MMM
FFF
IICOM
inertia
inertia
M
amF
I
COM
inertiaM
COM
inertiainertia
COMOO
inerrtia MFpM
S
contactT
T
TTTTTTTTTTT
TT
contact
F
contactS
S
SSSSSSSSSSS
SS
contact
F
F
FFFFFFFFFFF
FF
contact
MgmpampM
MgmpampM
GRMGRFCOPgmpampM
COMCOM
COMCOM
COMCOM
)())()()(()(
)())()()(()(
)())()()(()(
1
1
1
RIRIRR
RIRIRR
RIRIRR
S
contactTTT
T
contact
F
contactSSS
S
contact
FFF
F
contact
FgmamF
FgmamF
GRFgmamF
drsquoAlembert approach to inverse dynamics General laws of motion (sum forces sum moments)
General inertial forces and moments
NOTE
in general General (3 dimensional) Parallel Axis Theorem
Moments calculated at the proximal end of each segment
F S and T reflect the moment at proximal foot shank and thigh segments respectively Joint reaction forces
Laws of Motion
Spatiotemporal Analysis
Vastus
Medialis
Semi-
Membranosus
BREAK
bull Motor control training
bull Cardiovascular training
bull Strengthening and power training
bull Dynamic balance training
Elements of Optimized Walking Programs
Examination of Walking Specific Motor Control
Force vertical
Force anterior-posterior
Force medio-lateral
Ground Reaction Forces
Paretic Propulsion (Pp)
The percentage of total anterior GRF (propulsive) impulse generated by the paretic leg referred to as paretic propulsion (Pp) was calculated by dividing the propulsive impulse of the paretic leg by the sum of the paretic and non-paretic propulsive impulses
Pp =
+
0
50
100
1 2 3
Pp
(
)
Bowden et al 2006
bull Increased flexor activity in
preswing (eg TA and RF)
was correlated with
decreased paretic
propulsion
bull Increased plantarflexor
activity in late swing (eg
MG and SO) was correlated
with increased paretic
propulsion
Mechanisms of Response
Turns et al 2007
Extensor EMG Flexor EMG
What correlates with propulsion
bull PropulsionParetic cannot be measured in a conventional clinical setting without access to force plates
bull Step length asymmetry relates to propulsive forces generated by the legs
Paretic Step Ratio (PSR)
Stride Length
Paretic Step Length
PSR = Paretic Step Length Stride Length
PSR lt 047
047 lt PSR lt 053
PSR gt 053
r = -078 p lt 001
Balasubramanian et al 2007
ACTIVE propulsion generated by appropriately timed ankle power
PASSIVE propulsion generated by properly positioned foot COM posterior to the pelvic COM (larger horizontal portion of the red arrow)
Therefore emphasize hip extension
Mechanics of Propulsion and PSR
Clinical Usefulness
Beyond simply promoting symmetry PSR can be used to develop individual goals to train propulsive force production equalize bilateral biomechanical involvement by improving hip extension or promote paretic step initiation
ndash Longer paretic steps may be due to compensation by
greater non-paretic propulsion
ndash Weak relation with speed suggests compensatory strategies to attain functional speeds
ndash PSR may serve as a useful surrogate to assess propulsion during hemiparetic walking
bull These measures are capable of distinguishing ldquorecoveryrdquo from ldquocompensationrdquo
bull They also are capable of distinguishing motor control problems and provide critical information for treatment
BUT
Of what value is this measure to a clinician without biomechanical laboratory capabilities
-040
-030
-020
-010
000
010
020
030
1 7
13
19
25
31
37
43
49
55
61
67
73
79
85
91
97
Raw GRFs
Left leg
Right leg
-030
-020
-010
000
010
020
030
1 8
15
22
29
36
43
50
57
64
71
78
85
92
99
Summed GRFs
Summed GRFs
-030
-020
-010
000
010
020
030
1 8
15
22
29
36
43
50
57
64
71
78
85
92
99
Summed GRFs
Norm accel
GRFs vs Acceleration
CONTROL
-006
-004
-002
000
002
004
006
008
1 713
19
25
31
37
43
49
55
61
67
73
79
85
91
97
Paretic leg
Non paretic leg
Raw GRFs
-006
-004
-002
000
002
004
006
008
1 8
15
22
29
36
43
50
57
64
71
78
85
92
99
Summed GRF
summed GRF
-060
-040
-020
000
020
040
060
080
1 8
15
22
29
36
43
50
57
64
71
78
85
92
99
Normed GRFs
Acceleration
GRFs vs Acceleration
PERSON WITH STROKE
-15
-1
-05
0
05
1
15
1 9
17
25
33
41
49
57
65
73
81
89
97
Acc
ele
rati
on
in m
s2
Pre
Post
Control
Pre- and post-training accelerations of individuals participating in a
locomotor training intervention While COM acceleration increases it
does not approach normative values particularly in the critical phase 3 and 4
period of the gait cycle implying specific therapies need to target specific mechanistic elements of the walking pattern
-08
-06
-04
-02
0
02
04
06
CO
Ma
in m
s2
COMa before (blue line) and 2 minutes after (red line) incline training A
brief (5 minute) period of adaptation training yielded a 48 increase in both
peak COMa and the time integral of the COMa curve in phase 3 and 4 The x-axis represents percentage of the gait cycle
COMa as an outcome measure
bull segmental accelerations
bull studies into shock absorption
bull spatiotemporal gait parameters
bull control of stability
bull age-related changes in movement patterns
bull relating quantifiable movement patterns to falls
Portable applications
-06
-04
-02
0
02
04
06
Acc
ele
rati
on
in m
s2
Low PP
-06
-04
-02
0
02
04
06
Acc
ele
rati
on
in m
s2
Symmetrical
-06
-04
-02
0
02
04
06
Acc
ele
rati
on
in m
s2
High PP
Figure 6 COMa sorted by Pp Sorting by Pp yields three distinctly different acceleration profiles although the double support phase (shaded area) are similar in shape The low Pp
group (b) generates very little acceleration in the double support phase However the high Pp group (c) demonstrates only positive acceleration through the first half of the gait cycle while remaining negative throughout late double support and swing (Bowden Behrman et al In Press) The x-axes represent percentages of the gait cycle
a b c
COMa to diagnose motor control deficits
Examination of Power Training
JOINT POWER
P = moment times angular velocity P(+) = concentric (moments and velocity same direction) shortening contraction P(-) = eccentric (moments and velocity in opposite direction) lengthening contraction
A2
H3
H1
Gregory Bowden et al 2007
bull H1 (hip extension during initial stance) H3 (hip flexion during early swing) and A2 (ankle plantarflexion during late stance and pre-swing) all increased after therapy and the A2 and H3 bursts were significantly correlated with walking speed (Richards et al 2004)
bull Furthermore the A2 peak burst improvement was responsible for 25 of the gain in walking
bull Examining the interlimb coordination effects demonstrated that pre-training paretic A2 and H3 accounted for 84 of the variance in walking speed while post-training the non-paretic H3 replaces the paretic H3 to account for 82 of the post-training variance in patients that improved from 040 ms to 058 ms as a result of the intervention (Richards et al 2004)
Examination of Cardiovascular Status
bull Cardiorespiratory fitness is approximately 50 below age-matched controls
bull Decreased fitness combines with increased energetic demands to decrease efficiency
bull O2 use normalized to walking speed 50 higher bull Due to reduced peripheral muscle activation
change in fiber type reduced enzyme activities and altered hemodynamics
all responsive to exercise interventions
0
2
4
6
8
10
12
14
16
18
0 01 02 03 04 05 06 07
VO
2 (m
lk
gm
in)
Speed (ms)
bull Peak oxygen consumption (VO2) values in patients with stroke are below the level required for many basic activities of daily living (ADL)
bull Peak cardiovascular fitness
levels are roughly half those of age-matched individuals
bull Decreased CV fitness likely limits amount of walking thereby limiting daily physical activity and contributing to a downward spiral
ldquoStroke is a cardiac eventhelliprdquo Pam
Duncan
SS-50 SS-25 SS
SS+25 SS+50
SS-50
SS-25
SS SS+25 SS+50
01
02
03
04
05
06
07
08
O2
Eff (
mL
O2k
gm
)
Voluntary Fatigue
Cadence lt 40 rpm
Borg = 18
90 THR
Angina
HTN
Dyspnea
ST
segment
depression
Other
15
32
22
22
7
05
05
05
1 05
Hypotension
Courtesy of Dorian Rose PT PhD
Cardiovascular Fitness Functional Mobility
Examination of Dynamic Balance Control
Clinical Examinations
Dynamic COM vs COP
Weerdesteyn 2008
Balance Control
Treatment
bull Increase task complexity and difficulty (IRT example)
bull Athletic training
bull Intensity of training
bull Must know if people continue to fall
bull STILL evolving
Putting it All Together
Walking Performance
Motor Control
CV Fitness
Dynamic Balance Control
Strength
Results
bull The mobility group members improved their SMWT performance by an average of 35 m more than members of the UE group (95 CI 7 64)
bull Gait speed increases
ndash 011 ms_ss (95 CI 003 019) and 021 ms_fast (95 CI 12 030) faster than subjects in the UE group
bull TUG
ndash decreased 12 seconds in the intervention group (control increase by 17 seconds)
bull BBS No change (2 points to 1 point)
bull Later reports indicate an improvement in balancefalls efficacy
One therapy will NOT be the answer
Motor Control CV Status StrengthPower Dynamic Balance
Patient 1
Motor Control CV Status StrengthPower Dynamic Balance
Patient 3
Motor Control CV Status StrengthPower Dynamic Balance
Patient 2
Motor Control CV Status StrengthPower Dynamic Balance
Patient 4
Hypothetical future clinic
Overview - REVIEW
bull What is required for successful locomotor rehabilitation
ndash Systematic measurement
ndash Intensity
ndash Task specific practice
ndash Adherence to guiding principles
bull What does evidence-based practice tell us about locomotor rehabilitation
bull Where to go from here and what will future generations of therapeutic practice include
bull Guideline 1 Maximize weight bearing on the legs
bull Guideline 2 Afford the sensory experience consistent with walking
bull Guideline 3 Optimize kinematics for each motor task
bull Guideline 4 Maximize recovery and independence minimize compensation
LT Guidelines
hellipadded Guidelines
bull Systematic
bull Intensive
bull Progressive
bull Repetitive
bull Measure outcomes
hellipplus Plasticity
bull Use it or lose it
bull Use it and improve it
bull Specificity
bull Repetition matters
bull Intensity matters
bull Time matters
bull Salience matters
bull Age matters
bull Transference
bull Interference
Future directions
bull Evaluation to yield meaningful theory-based information to help guide clinical decision making
bull Classification to help guide treatment options
bull Understand ways to build on base therapy depending on impairments while being consistent with training guidelines
bull What tx for whom when in what combination with other tx
bull Clinic as a laboratory
Steve Kautz PhD
Mark George MD
Chris Gregory PhD PT
Aaron Embry DPT MSCR
Lindsay Perry DPT NCS
Patrick Morgan MS
This material is based upon work supported by the Office of Research and Development Rehabilitation Research and Development Department of Veterans Affairs Career Development-1 Award (Project B7177M Bowden PI) SCTR Discovery Pilot Grant (Kautz PI) AHA Innovative Research Grant (Kautz PI) and VA RRampD Merit Award B3983R (Kautz PI) The contents do not represent the views of the Department of Veterans Affairs or the United States Government
Thanks to all of my mentors collaborators and funding sources

LT Guidelines
bull Guideline 1 Maximize weight bearing on the legs
bull Guideline 2 Afford the sensory experience consistent with walking
bull Guideline 3 Optimize kinematics for each motor task
bull Guideline 4 Maximize recovery and independence minimize compensation
ldquoTrain like you walkrdquo
hellipadded Guidelines
bull Systematic
bull Intensive
bull Progressive
bull Repetitive
bull Document outcomes
hellipplus Plasticity
bull Use it or lose it
bull Use it and improve it
bull Specificity
bull Repetition matters
bull Intensity matters
bull Time matters
bull Salience matters
bull Age matters
bull Transference
bull Interference
So what is ldquoevidence-based practicerdquo
Top Stroke Rehabil 2008 May-Jun15(3)227-46 Links Application of evidence-based practice strategies current
trends in walking recovery interventions poststroke Tilson JK Settle SM Sullivan KJ ldquoRehabilitation effectiveness is enhanced when the clinician can 1 determine the best available interventions 2 for the appropriate subset of patients and 3 apply them at the correct dose and timepoint of recoveryrdquo
Framework
Step 1 Convert the need for information into a focused and searchable clinical question
Narrow question for bull Patient or patient population bull Intervention bull Outcome of interest
ldquoPICOrdquo Population Intervention Comparison (alternate intervention) Outcome of interest
Step 2 Find the best possible research evidence to answer your question
Pubmed
PEDro (Physiotherapy Evidence Database)
National Guidelines Clearinghouse
Canadian Stroke Network
Cochrane Collaboration (wwwcochraneorgreviews)
Step 3 Critically appraise the research evidence for validity and applicability
Assess evidence level and grade
Step 4 Integrate the critically appraised research evidence with clinical expertise and the patients unique biology circumstances and values
ldquoClinical trials do not provide the answers on how to rehabilitate
patientsrdquo bull Inform bull Provide a framework for practice bull Integrate with clinical expertise bull Integrate with patients unique circumstances values and
preferences Partner with patient family and caregivers
Step 5 Evaluate the effectiveness and efficacy of our efforts in Steps 1-4 and identify ways to improve them in the future
bull Monitor impact
bull Use standardized outcome measures
bull Build on each experience
bull PubMedrsquos MyNCBI service set up auto alerts for emerging literature of interest
Examples in stroke literature
Question 1 Aerobic conditioning and walking recovery poststroke
Recommendations
bull High quality (level 1a) and clinically relevant (grade A) research evidence that aerobic conditioning is effective for improving walking speed and endurance poststroke
bull Small body of evidence (conflicting grades A and C) of clinical relevance of impact on disability and QOL
bull Unclear of dose
bull Recommend breaking down by severity and chronicity
Question 2 Ankle-foot-orthosis prescription with an without functional electrical stimulation for walking recovery post-stroke
Recommendations
bull Level 2 grade B evidence that non-FES AFOs are effective for small
changes in walking speed bull Increased
ndash patient independence ndash Perception of safety ndash Confidence
bull Level 1a grade A evidence for improved gait velocity with FES-enabled AFO devices
bull Implanted FES has one RCT supporting lebel 1b grade A evidence for improved walking speed
Questionable functional independence QOL and long-term implications
Question 3 Treadmill training with body weight support for walking recovery post-stroke
BREAK
Locomotor Experience Applied Post-Stroke
bull 5 year
bull Phase-III
bull Single-blinded
bull Multi-site
bull Randomized Clinical Trial
bull If in addition to usual care to determine if a specialized locomotor training program that includes BWST as a treatment modality can produce clinically significant changes in walking speed in individuals post-stroke compared to Home Exercise Program
bull To determine effect of timing (early vs late severity (moderate vs severe) and duration (12- 24- 36-sessions)
Screening at 260plusmn116 days post-stroke 2-month baseline = point of randomization The bars indicate 95 confidence interval
Walking speed trajectory by intervention group and severity at screening 2-(baseline) 6- and 12-months post-stroke
Duncan et al 2011
Walking Speed at 6 Months
bull Six months after stroke Early-LTP (025plusmn021 ms) and HEP (023plusmn020 ms) groups had similar gains in walking speed and sustained these gains at 1 year
bull The Late-LTP group (which only received usual care from 2 to 6 months) improved by 013plusmn014 ms at 6 months
Statistically and Clinically Significant Changes in Outcomes from 2 mos to 12 mos post-stroke
Item
Early-LTP
(n=139)
Late-LTP
(n=143)
HEP
(n=126)
Overall
p-value
Comfortable Walking Speed
(msec) 023plusmn020 024plusmn023 025plusmn022 067
6 minute Walking Distance (m) 732plusmn694 790plusmn751 852plusmn729 045
Step Activity Monitor (SAM) ndash
Median of average number
stepsday [25th -75th percentile]
858
[-253 2422]
1022
[-111 3009]
1471
[435 3481] 010
Stroke Impact Scale (SIS)
Participation
(range = 0-100)
171plusmn259 131plusmn220 144plusmn206 038
SIS ADLIADL (range = 0-100) 96plusmn195 94plusmn172 145plusmn190 007
SIS Mobility (range = 0-100) 137plusmn216 120plusmn191 142plusmn203 0685
Fugl-Meyer LE Score (range
= 0-34) 17plusmn39 15plusmn37 25plusmn43 013
Berg Score (range = 0-56) 80plusmn78 59plusmn91 83plusmn878 006
No differences in improvements across treatment groups HIGHLY clinically relevant improvements
Preplanned Secondary Analysis of 6 Month Outcomes
Item LTP
(n=139)
HEP
(n=126)
UC
(n=143)
Overall
p-value
Comfortable Walking Speed (msec) 025plusmn021 023plusmn020 013plusmn014 lt00001
6 minute Walking Distance (m) 818plusmn628 759plusmn693 410plusmn474 lt00001
Step Activity Monitor (SAM) ndash Median
of average number stepsday [25th -
75th percentile]
1017
[-102 2209]
1357
[84 3382]
566
[-362 2043] 00367
Stroke Impact Scale (SIS) Participation
(range = 0-100) 118plusmn267 146plusmn229 77plusmn205 00384
SIS ADLIADL (range = 0-100) 98plusmn172 130plusmn169 70plusmn178 00516
SIS Mobility (range = 0-100) 153plusmn214 149plusmn200 70plusmn157 00006
Fugl-Meyer LE Score
(range = 0-34) 22plusmn34 24plusmn41 13plusmn33 01196
Berg Score (range = 0-56) 88plusmn81 79plusmn85 53plusmn70 00018
Activities Specific Balance Confidence
Score (range=0-100) 138plusmn208 156plusmn194 62plusmn202 00013
Late-LTP (usual care) experienced approximately HALF the improvement of early intervention groups
Falls and Falls Rate
The most common minor adverse event was falls
bull 576 of individuals experienced 1 fall
bull 34 experienced multiple falls
bull 6 experienced an injurious fall
bull More multiple falls in early-LTP group than late-LTP or HEP (plt007)
LEAPS in the context of EBP
For patients in the first year post-stroke who can walk 10 feet but are not walking at speeds gt08 ms (18 mph)
This randomized trial provides strong and high quality evidence that
Structured progressive locomotor training (including BWSTT) is not superior to a structured strengthening and balance exercise program for walking recovery
Either structured program is more effective than usual care at 6 months post-stroke
Both interventions have low risks of adverse events but structured exercise program in the home results in fewer adverse events compared to locomotor training
Current Therapeutic Approaches
bull Activity-based therapies
ndash Robotic interventions
bull Task-specific interventions
bull Aerobic training
bull Muscle Strengthening
bull FES (neuroprosthetics)
bull Virtual Rehabilitation
Results Similar outcomes for final walking speed were found for the different prevailing treatment methods Treatment gains were likewise comparable and generally insufficient for upgrading patientsrsquo functional community walking capacity
Conclusions Different treatment methods exist for poststroke gait
rehabilitation Their availability mode of application and costs vary yet outcomes are largely similar Therefore choosing an appropriate method may be guided by a pragmatic approach Simple ldquolow technologyrdquo and conventional exercise to date is at least as efficacious as more complex strategies such as treadmill and robotic-based interventions
Similarities for success
bull Intensity
bull Repeatability
Obstacles
bull Adverse personal effects
bull Decreased cardiovascular potential
bull Condition of peripheral muscle
bull Heterogeneity of sample
bull Responders versus non-responders
Current Therapeutic Approaches
bull Activity-based therapies
ndash Robotic interventions
bull Task-specific interventions
bull Aerobic training
bull Muscle Strengthening
bull FES (neuroprosthetics)
bull Virtual Rehabilitation
000
1000
2000
3000
4000
5000
6000
7000
8000
Pre Week1 Week2 Week3 Week4 Week5 Week6 Week7 Week8 Week9 Week10 Week11 Post
Self
-Se
lect
ed
Wal
kin
g Sp
ee
d (
cms
)
Mean Walking Speed
Responders versus Non-Responders
0
20
40
60
80
100
120
140
Pre Week1 Week2 Week3 Week4 Week5 Week6 Week7 Week8 Week9 Week10 Week11 Post
Self
-Se
lect
ed
Wal
kin
g Sp
ee
d (
cms
)
Individual Walking Speed
PL1
4
5
7
9
10
11
12
13
14
15
17
18
19
20
21
22
24
What does EBP tell us about current clinical decision making
ldquoPre-gaitrdquo Sequencing
Bridging
Kneeling
Sit-to-stand
Sitting Quadruped
Standing
Modified plantigrade
Half-kneeling
WALKING
Arch Phys Med Rehabil 1989 Oct70(10)755-62 Links Standing balance training effect on balance and locomotion in
hemiparetic adults Winstein CJ Gardner ER McNeal DR Barto PS Nicholson DE
Training symmetrical standing did not lead to symmetrical gait
performancehelliplocomotor pattern was only minimally affected by static balance exercises
Remember Hodgsonrsquos cats those trained to stand could stand
and not step while those trained to step could not stand
Standing = Walking What about BALANCE
Exp Brain Res 2006 Jun172(1)35-48 Epub 2006 Jan 24 Links A direct comparison of local dynamic stability during unperturbed standing and walking Kang HG Dingwell JB
bull Local dynamic stability properties were significantly different when comparing standing versus walking
bull COP divergence measures only significantly correlated with standing
TASK SPECIFICITY MATTERS
hellipBut is that all that matters
bull Strengthening and power training
bull Cardiovascular training
bull Dynamic balance training
bull Motor control training
Elements of Optimized Walking Programs
Advancing Locomotor Rehabilitation Measurement in Physical Therapy
Practice
bull Recovery versus compensation how can measurement distinguish the two
bull Physical performance vs mechanisms of response
bull How does your standardized ldquomeasurementrdquo help guide clinical decision making
Guiding Questions
Numeric Rating Scale (NRS)
The patient rates pain on a scale from 0 to 10
Questions regarding traditional ldquoMeasurementrdquo
1) Does improvement in a measure imply that the patient ldquorecoveredrdquo neuromotor function or simply more efficiently compensated for impaired underlying body functions
2) Does the measurement assist clinical decision making by differentiating between a variety of treatment options
Historically locomotor rehabilitation measurement has incorporated assessments using
1) rating scales
2) timed movement tasks
3) laboratory based outcomes
How may technological advances improve clinical measurement capabilities
Rating Scales
bull Often based on summary scores
ndash Lose individual item sensitivity
ndash Unable to measure subtle changes in control
bull Makes no comments on mechanisms
bull No information on recovery vs compensation or guiding of treatment plan
Timed Movement Tasks
bull Timed up and Go
bull 6 minute walk test (distance)
bull 10 meter walk test (speed)
Many many very positive elements of these tests
ndash Simple to measure
ndash Inexpensive
ndash Reliable and valid
ndash Sensitive
ndash Specific
Walking Speed ishellip
bull ldquohellipalmost the perfect measurerdquo (Wade 1992)
ndash Reliable (Richards 1996)
ndash Valid (Steffen 2002)
ndash Sensitive (van Iersel 2008)
ndash Specific (Harada1995)
ndash Correlates with
bull Functional ability (Perry1995)
bull Balance confidence (Mangione2007)
Walking Speed Predictive
ndash Future health status (Studenski
2003 Purser 2005)
ndash Functional decline (Brach 2002)
bull Hospitalization (Montero-Odasso
2005)
bull Discharge location (Salbach 2001
Rabadi 2005)
bull Mortality (Hardy 2007)
ndash Functional amp Physiological changes (Perry1995)
bull Potential for rehabilitation (Goldie 1996)
bull Aids in prediction of
ndash Falls (Guimaraes 1980)
ndash Fear of falling (Maki 1997)
Fritz S Lusardi M Clayton G Bird W Bidelpach D Duncan PW Gait the Sixth Vital Sign
Page 83
Suggested Way to Measure
HOWEVERhellip
Do these tests answer either of our two introductory questions regarding recovery and treatment planning
What is the role of a vital sign
Diagnostic Test
BP
Differential Exams Cholesterol Blood sugar
Adrenal gland fxn Thyroid fxn Kidney fxn
Diagnostic Test
Walking speed
Differential Exams
Gait Analysis
Laboratory Measures
Angles GRFs
Moments
0
0
tan
tan
inertiacediscontact
inertiacediscontact
MMM
FFF
IICOM
inertia
inertia
M
amF
I
COM
inertiaM
COM
inertiainertia
COMOO
inerrtia MFpM
S
contactT
T
TTTTTTTTTTT
TT
contact
F
contactS
S
SSSSSSSSSSS
SS
contact
F
F
FFFFFFFFFFF
FF
contact
MgmpampM
MgmpampM
GRMGRFCOPgmpampM
COMCOM
COMCOM
COMCOM
)())()()(()(
)())()()(()(
)())()()(()(
1
1
1
RIRIRR
RIRIRR
RIRIRR
S
contactTTT
T
contact
F
contactSSS
S
contact
FFF
F
contact
FgmamF
FgmamF
GRFgmamF
drsquoAlembert approach to inverse dynamics General laws of motion (sum forces sum moments)
General inertial forces and moments
NOTE
in general General (3 dimensional) Parallel Axis Theorem
Moments calculated at the proximal end of each segment
F S and T reflect the moment at proximal foot shank and thigh segments respectively Joint reaction forces
Laws of Motion
Spatiotemporal Analysis
Vastus
Medialis
Semi-
Membranosus
BREAK
bull Motor control training
bull Cardiovascular training
bull Strengthening and power training
bull Dynamic balance training
Elements of Optimized Walking Programs
Examination of Walking Specific Motor Control
Force vertical
Force anterior-posterior
Force medio-lateral
Ground Reaction Forces
Paretic Propulsion (Pp)
The percentage of total anterior GRF (propulsive) impulse generated by the paretic leg referred to as paretic propulsion (Pp) was calculated by dividing the propulsive impulse of the paretic leg by the sum of the paretic and non-paretic propulsive impulses
Pp =
+
0
50
100
1 2 3
Pp
(
)
Bowden et al 2006
bull Increased flexor activity in
preswing (eg TA and RF)
was correlated with
decreased paretic
propulsion
bull Increased plantarflexor
activity in late swing (eg
MG and SO) was correlated
with increased paretic
propulsion
Mechanisms of Response
Turns et al 2007
Extensor EMG Flexor EMG
What correlates with propulsion
bull PropulsionParetic cannot be measured in a conventional clinical setting without access to force plates
bull Step length asymmetry relates to propulsive forces generated by the legs
Paretic Step Ratio (PSR)
Stride Length
Paretic Step Length
PSR = Paretic Step Length Stride Length
PSR lt 047
047 lt PSR lt 053
PSR gt 053
r = -078 p lt 001
Balasubramanian et al 2007
ACTIVE propulsion generated by appropriately timed ankle power
PASSIVE propulsion generated by properly positioned foot COM posterior to the pelvic COM (larger horizontal portion of the red arrow)
Therefore emphasize hip extension
Mechanics of Propulsion and PSR
Clinical Usefulness
Beyond simply promoting symmetry PSR can be used to develop individual goals to train propulsive force production equalize bilateral biomechanical involvement by improving hip extension or promote paretic step initiation
ndash Longer paretic steps may be due to compensation by
greater non-paretic propulsion
ndash Weak relation with speed suggests compensatory strategies to attain functional speeds
ndash PSR may serve as a useful surrogate to assess propulsion during hemiparetic walking
bull These measures are capable of distinguishing ldquorecoveryrdquo from ldquocompensationrdquo
bull They also are capable of distinguishing motor control problems and provide critical information for treatment
BUT
Of what value is this measure to a clinician without biomechanical laboratory capabilities
-040
-030
-020
-010
000
010
020
030
1 7
13
19
25
31
37
43
49
55
61
67
73
79
85
91
97
Raw GRFs
Left leg
Right leg
-030
-020
-010
000
010
020
030
1 8
15
22
29
36
43
50
57
64
71
78
85
92
99
Summed GRFs
Summed GRFs
-030
-020
-010
000
010
020
030
1 8
15
22
29
36
43
50
57
64
71
78
85
92
99
Summed GRFs
Norm accel
GRFs vs Acceleration
CONTROL
-006
-004
-002
000
002
004
006
008
1 713
19
25
31
37
43
49
55
61
67
73
79
85
91
97
Paretic leg
Non paretic leg
Raw GRFs
-006
-004
-002
000
002
004
006
008
1 8
15
22
29
36
43
50
57
64
71
78
85
92
99
Summed GRF
summed GRF
-060
-040
-020
000
020
040
060
080
1 8
15
22
29
36
43
50
57
64
71
78
85
92
99
Normed GRFs
Acceleration
GRFs vs Acceleration
PERSON WITH STROKE
-15
-1
-05
0
05
1
15
1 9
17
25
33
41
49
57
65
73
81
89
97
Acc
ele
rati
on
in m
s2
Pre
Post
Control
Pre- and post-training accelerations of individuals participating in a
locomotor training intervention While COM acceleration increases it
does not approach normative values particularly in the critical phase 3 and 4
period of the gait cycle implying specific therapies need to target specific mechanistic elements of the walking pattern
-08
-06
-04
-02
0
02
04
06
CO
Ma
in m
s2
COMa before (blue line) and 2 minutes after (red line) incline training A
brief (5 minute) period of adaptation training yielded a 48 increase in both
peak COMa and the time integral of the COMa curve in phase 3 and 4 The x-axis represents percentage of the gait cycle
COMa as an outcome measure
bull segmental accelerations
bull studies into shock absorption
bull spatiotemporal gait parameters
bull control of stability
bull age-related changes in movement patterns
bull relating quantifiable movement patterns to falls
Portable applications
-06
-04
-02
0
02
04
06
Acc
ele
rati
on
in m
s2
Low PP
-06
-04
-02
0
02
04
06
Acc
ele
rati
on
in m
s2
Symmetrical
-06
-04
-02
0
02
04
06
Acc
ele
rati
on
in m
s2
High PP
Figure 6 COMa sorted by Pp Sorting by Pp yields three distinctly different acceleration profiles although the double support phase (shaded area) are similar in shape The low Pp
group (b) generates very little acceleration in the double support phase However the high Pp group (c) demonstrates only positive acceleration through the first half of the gait cycle while remaining negative throughout late double support and swing (Bowden Behrman et al In Press) The x-axes represent percentages of the gait cycle
a b c
COMa to diagnose motor control deficits
Examination of Power Training
JOINT POWER
P = moment times angular velocity P(+) = concentric (moments and velocity same direction) shortening contraction P(-) = eccentric (moments and velocity in opposite direction) lengthening contraction
A2
H3
H1
Gregory Bowden et al 2007
bull H1 (hip extension during initial stance) H3 (hip flexion during early swing) and A2 (ankle plantarflexion during late stance and pre-swing) all increased after therapy and the A2 and H3 bursts were significantly correlated with walking speed (Richards et al 2004)
bull Furthermore the A2 peak burst improvement was responsible for 25 of the gain in walking
bull Examining the interlimb coordination effects demonstrated that pre-training paretic A2 and H3 accounted for 84 of the variance in walking speed while post-training the non-paretic H3 replaces the paretic H3 to account for 82 of the post-training variance in patients that improved from 040 ms to 058 ms as a result of the intervention (Richards et al 2004)
Examination of Cardiovascular Status
bull Cardiorespiratory fitness is approximately 50 below age-matched controls
bull Decreased fitness combines with increased energetic demands to decrease efficiency
bull O2 use normalized to walking speed 50 higher bull Due to reduced peripheral muscle activation
change in fiber type reduced enzyme activities and altered hemodynamics
all responsive to exercise interventions
0
2
4
6
8
10
12
14
16
18
0 01 02 03 04 05 06 07
VO
2 (m
lk
gm
in)
Speed (ms)
bull Peak oxygen consumption (VO2) values in patients with stroke are below the level required for many basic activities of daily living (ADL)
bull Peak cardiovascular fitness
levels are roughly half those of age-matched individuals
bull Decreased CV fitness likely limits amount of walking thereby limiting daily physical activity and contributing to a downward spiral
ldquoStroke is a cardiac eventhelliprdquo Pam
Duncan
SS-50 SS-25 SS
SS+25 SS+50
SS-50
SS-25
SS SS+25 SS+50
01
02
03
04
05
06
07
08
O2
Eff (
mL
O2k
gm
)
Voluntary Fatigue
Cadence lt 40 rpm
Borg = 18
90 THR
Angina
HTN
Dyspnea
ST
segment
depression
Other
15
32
22
22
7
05
05
05
1 05
Hypotension
Courtesy of Dorian Rose PT PhD
Cardiovascular Fitness Functional Mobility
Examination of Dynamic Balance Control
Clinical Examinations
Dynamic COM vs COP
Weerdesteyn 2008
Balance Control
Treatment
bull Increase task complexity and difficulty (IRT example)
bull Athletic training
bull Intensity of training
bull Must know if people continue to fall
bull STILL evolving
Putting it All Together
Walking Performance
Motor Control
CV Fitness
Dynamic Balance Control
Strength
Results
bull The mobility group members improved their SMWT performance by an average of 35 m more than members of the UE group (95 CI 7 64)
bull Gait speed increases
ndash 011 ms_ss (95 CI 003 019) and 021 ms_fast (95 CI 12 030) faster than subjects in the UE group
bull TUG
ndash decreased 12 seconds in the intervention group (control increase by 17 seconds)
bull BBS No change (2 points to 1 point)
bull Later reports indicate an improvement in balancefalls efficacy
One therapy will NOT be the answer
Motor Control CV Status StrengthPower Dynamic Balance
Patient 1
Motor Control CV Status StrengthPower Dynamic Balance
Patient 3
Motor Control CV Status StrengthPower Dynamic Balance
Patient 2
Motor Control CV Status StrengthPower Dynamic Balance
Patient 4
Hypothetical future clinic
Overview - REVIEW
bull What is required for successful locomotor rehabilitation
ndash Systematic measurement
ndash Intensity
ndash Task specific practice
ndash Adherence to guiding principles
bull What does evidence-based practice tell us about locomotor rehabilitation
bull Where to go from here and what will future generations of therapeutic practice include
bull Guideline 1 Maximize weight bearing on the legs
bull Guideline 2 Afford the sensory experience consistent with walking
bull Guideline 3 Optimize kinematics for each motor task
bull Guideline 4 Maximize recovery and independence minimize compensation
LT Guidelines
hellipadded Guidelines
bull Systematic
bull Intensive
bull Progressive
bull Repetitive
bull Measure outcomes
hellipplus Plasticity
bull Use it or lose it
bull Use it and improve it
bull Specificity
bull Repetition matters
bull Intensity matters
bull Time matters
bull Salience matters
bull Age matters
bull Transference
bull Interference
Future directions
bull Evaluation to yield meaningful theory-based information to help guide clinical decision making
bull Classification to help guide treatment options
bull Understand ways to build on base therapy depending on impairments while being consistent with training guidelines
bull What tx for whom when in what combination with other tx
bull Clinic as a laboratory
Steve Kautz PhD
Mark George MD
Chris Gregory PhD PT
Aaron Embry DPT MSCR
Lindsay Perry DPT NCS
Patrick Morgan MS
This material is based upon work supported by the Office of Research and Development Rehabilitation Research and Development Department of Veterans Affairs Career Development-1 Award (Project B7177M Bowden PI) SCTR Discovery Pilot Grant (Kautz PI) AHA Innovative Research Grant (Kautz PI) and VA RRampD Merit Award B3983R (Kautz PI) The contents do not represent the views of the Department of Veterans Affairs or the United States Government
Thanks to all of my mentors collaborators and funding sources

hellipadded Guidelines
bull Systematic
bull Intensive
bull Progressive
bull Repetitive
bull Document outcomes
hellipplus Plasticity
bull Use it or lose it
bull Use it and improve it
bull Specificity
bull Repetition matters
bull Intensity matters
bull Time matters
bull Salience matters
bull Age matters
bull Transference
bull Interference
So what is ldquoevidence-based practicerdquo
Top Stroke Rehabil 2008 May-Jun15(3)227-46 Links Application of evidence-based practice strategies current
trends in walking recovery interventions poststroke Tilson JK Settle SM Sullivan KJ ldquoRehabilitation effectiveness is enhanced when the clinician can 1 determine the best available interventions 2 for the appropriate subset of patients and 3 apply them at the correct dose and timepoint of recoveryrdquo
Framework
Step 1 Convert the need for information into a focused and searchable clinical question
Narrow question for bull Patient or patient population bull Intervention bull Outcome of interest
ldquoPICOrdquo Population Intervention Comparison (alternate intervention) Outcome of interest
Step 2 Find the best possible research evidence to answer your question
Pubmed
PEDro (Physiotherapy Evidence Database)
National Guidelines Clearinghouse
Canadian Stroke Network
Cochrane Collaboration (wwwcochraneorgreviews)
Step 3 Critically appraise the research evidence for validity and applicability
Assess evidence level and grade
Step 4 Integrate the critically appraised research evidence with clinical expertise and the patients unique biology circumstances and values
ldquoClinical trials do not provide the answers on how to rehabilitate
patientsrdquo bull Inform bull Provide a framework for practice bull Integrate with clinical expertise bull Integrate with patients unique circumstances values and
preferences Partner with patient family and caregivers
Step 5 Evaluate the effectiveness and efficacy of our efforts in Steps 1-4 and identify ways to improve them in the future
bull Monitor impact
bull Use standardized outcome measures
bull Build on each experience
bull PubMedrsquos MyNCBI service set up auto alerts for emerging literature of interest
Examples in stroke literature
Question 1 Aerobic conditioning and walking recovery poststroke
Recommendations
bull High quality (level 1a) and clinically relevant (grade A) research evidence that aerobic conditioning is effective for improving walking speed and endurance poststroke
bull Small body of evidence (conflicting grades A and C) of clinical relevance of impact on disability and QOL
bull Unclear of dose
bull Recommend breaking down by severity and chronicity
Question 2 Ankle-foot-orthosis prescription with an without functional electrical stimulation for walking recovery post-stroke
Recommendations
bull Level 2 grade B evidence that non-FES AFOs are effective for small
changes in walking speed bull Increased
ndash patient independence ndash Perception of safety ndash Confidence
bull Level 1a grade A evidence for improved gait velocity with FES-enabled AFO devices
bull Implanted FES has one RCT supporting lebel 1b grade A evidence for improved walking speed
Questionable functional independence QOL and long-term implications
Question 3 Treadmill training with body weight support for walking recovery post-stroke
BREAK
Locomotor Experience Applied Post-Stroke
bull 5 year
bull Phase-III
bull Single-blinded
bull Multi-site
bull Randomized Clinical Trial
bull If in addition to usual care to determine if a specialized locomotor training program that includes BWST as a treatment modality can produce clinically significant changes in walking speed in individuals post-stroke compared to Home Exercise Program
bull To determine effect of timing (early vs late severity (moderate vs severe) and duration (12- 24- 36-sessions)
Screening at 260plusmn116 days post-stroke 2-month baseline = point of randomization The bars indicate 95 confidence interval
Walking speed trajectory by intervention group and severity at screening 2-(baseline) 6- and 12-months post-stroke
Duncan et al 2011
Walking Speed at 6 Months
bull Six months after stroke Early-LTP (025plusmn021 ms) and HEP (023plusmn020 ms) groups had similar gains in walking speed and sustained these gains at 1 year
bull The Late-LTP group (which only received usual care from 2 to 6 months) improved by 013plusmn014 ms at 6 months
Statistically and Clinically Significant Changes in Outcomes from 2 mos to 12 mos post-stroke
Item
Early-LTP
(n=139)
Late-LTP
(n=143)
HEP
(n=126)
Overall
p-value
Comfortable Walking Speed
(msec) 023plusmn020 024plusmn023 025plusmn022 067
6 minute Walking Distance (m) 732plusmn694 790plusmn751 852plusmn729 045
Step Activity Monitor (SAM) ndash
Median of average number
stepsday [25th -75th percentile]
858
[-253 2422]
1022
[-111 3009]
1471
[435 3481] 010
Stroke Impact Scale (SIS)
Participation
(range = 0-100)
171plusmn259 131plusmn220 144plusmn206 038
SIS ADLIADL (range = 0-100) 96plusmn195 94plusmn172 145plusmn190 007
SIS Mobility (range = 0-100) 137plusmn216 120plusmn191 142plusmn203 0685
Fugl-Meyer LE Score (range
= 0-34) 17plusmn39 15plusmn37 25plusmn43 013
Berg Score (range = 0-56) 80plusmn78 59plusmn91 83plusmn878 006
No differences in improvements across treatment groups HIGHLY clinically relevant improvements
Preplanned Secondary Analysis of 6 Month Outcomes
Item LTP
(n=139)
HEP
(n=126)
UC
(n=143)
Overall
p-value
Comfortable Walking Speed (msec) 025plusmn021 023plusmn020 013plusmn014 lt00001
6 minute Walking Distance (m) 818plusmn628 759plusmn693 410plusmn474 lt00001
Step Activity Monitor (SAM) ndash Median
of average number stepsday [25th -
75th percentile]
1017
[-102 2209]
1357
[84 3382]
566
[-362 2043] 00367
Stroke Impact Scale (SIS) Participation
(range = 0-100) 118plusmn267 146plusmn229 77plusmn205 00384
SIS ADLIADL (range = 0-100) 98plusmn172 130plusmn169 70plusmn178 00516
SIS Mobility (range = 0-100) 153plusmn214 149plusmn200 70plusmn157 00006
Fugl-Meyer LE Score
(range = 0-34) 22plusmn34 24plusmn41 13plusmn33 01196
Berg Score (range = 0-56) 88plusmn81 79plusmn85 53plusmn70 00018
Activities Specific Balance Confidence
Score (range=0-100) 138plusmn208 156plusmn194 62plusmn202 00013
Late-LTP (usual care) experienced approximately HALF the improvement of early intervention groups
Falls and Falls Rate
The most common minor adverse event was falls
bull 576 of individuals experienced 1 fall
bull 34 experienced multiple falls
bull 6 experienced an injurious fall
bull More multiple falls in early-LTP group than late-LTP or HEP (plt007)
LEAPS in the context of EBP
For patients in the first year post-stroke who can walk 10 feet but are not walking at speeds gt08 ms (18 mph)
This randomized trial provides strong and high quality evidence that
Structured progressive locomotor training (including BWSTT) is not superior to a structured strengthening and balance exercise program for walking recovery
Either structured program is more effective than usual care at 6 months post-stroke
Both interventions have low risks of adverse events but structured exercise program in the home results in fewer adverse events compared to locomotor training
Current Therapeutic Approaches
bull Activity-based therapies
ndash Robotic interventions
bull Task-specific interventions
bull Aerobic training
bull Muscle Strengthening
bull FES (neuroprosthetics)
bull Virtual Rehabilitation
Results Similar outcomes for final walking speed were found for the different prevailing treatment methods Treatment gains were likewise comparable and generally insufficient for upgrading patientsrsquo functional community walking capacity
Conclusions Different treatment methods exist for poststroke gait
rehabilitation Their availability mode of application and costs vary yet outcomes are largely similar Therefore choosing an appropriate method may be guided by a pragmatic approach Simple ldquolow technologyrdquo and conventional exercise to date is at least as efficacious as more complex strategies such as treadmill and robotic-based interventions
Similarities for success
bull Intensity
bull Repeatability
Obstacles
bull Adverse personal effects
bull Decreased cardiovascular potential
bull Condition of peripheral muscle
bull Heterogeneity of sample
bull Responders versus non-responders
Current Therapeutic Approaches
bull Activity-based therapies
ndash Robotic interventions
bull Task-specific interventions
bull Aerobic training
bull Muscle Strengthening
bull FES (neuroprosthetics)
bull Virtual Rehabilitation
000
1000
2000
3000
4000
5000
6000
7000
8000
Pre Week1 Week2 Week3 Week4 Week5 Week6 Week7 Week8 Week9 Week10 Week11 Post
Self
-Se
lect
ed
Wal
kin
g Sp
ee
d (
cms
)
Mean Walking Speed
Responders versus Non-Responders
0
20
40
60
80
100
120
140
Pre Week1 Week2 Week3 Week4 Week5 Week6 Week7 Week8 Week9 Week10 Week11 Post
Self
-Se
lect
ed
Wal
kin
g Sp
ee
d (
cms
)
Individual Walking Speed
PL1
4
5
7
9
10
11
12
13
14
15
17
18
19
20
21
22
24
What does EBP tell us about current clinical decision making
ldquoPre-gaitrdquo Sequencing
Bridging
Kneeling
Sit-to-stand
Sitting Quadruped
Standing
Modified plantigrade
Half-kneeling
WALKING
Arch Phys Med Rehabil 1989 Oct70(10)755-62 Links Standing balance training effect on balance and locomotion in
hemiparetic adults Winstein CJ Gardner ER McNeal DR Barto PS Nicholson DE
Training symmetrical standing did not lead to symmetrical gait
performancehelliplocomotor pattern was only minimally affected by static balance exercises
Remember Hodgsonrsquos cats those trained to stand could stand
and not step while those trained to step could not stand
Standing = Walking What about BALANCE
Exp Brain Res 2006 Jun172(1)35-48 Epub 2006 Jan 24 Links A direct comparison of local dynamic stability during unperturbed standing and walking Kang HG Dingwell JB
bull Local dynamic stability properties were significantly different when comparing standing versus walking
bull COP divergence measures only significantly correlated with standing
TASK SPECIFICITY MATTERS
hellipBut is that all that matters
bull Strengthening and power training
bull Cardiovascular training
bull Dynamic balance training
bull Motor control training
Elements of Optimized Walking Programs
Advancing Locomotor Rehabilitation Measurement in Physical Therapy
Practice
bull Recovery versus compensation how can measurement distinguish the two
bull Physical performance vs mechanisms of response
bull How does your standardized ldquomeasurementrdquo help guide clinical decision making
Guiding Questions
Numeric Rating Scale (NRS)
The patient rates pain on a scale from 0 to 10
Questions regarding traditional ldquoMeasurementrdquo
1) Does improvement in a measure imply that the patient ldquorecoveredrdquo neuromotor function or simply more efficiently compensated for impaired underlying body functions
2) Does the measurement assist clinical decision making by differentiating between a variety of treatment options
Historically locomotor rehabilitation measurement has incorporated assessments using
1) rating scales
2) timed movement tasks
3) laboratory based outcomes
How may technological advances improve clinical measurement capabilities
Rating Scales
bull Often based on summary scores
ndash Lose individual item sensitivity
ndash Unable to measure subtle changes in control
bull Makes no comments on mechanisms
bull No information on recovery vs compensation or guiding of treatment plan
Timed Movement Tasks
bull Timed up and Go
bull 6 minute walk test (distance)
bull 10 meter walk test (speed)
Many many very positive elements of these tests
ndash Simple to measure
ndash Inexpensive
ndash Reliable and valid
ndash Sensitive
ndash Specific
Walking Speed ishellip
bull ldquohellipalmost the perfect measurerdquo (Wade 1992)
ndash Reliable (Richards 1996)
ndash Valid (Steffen 2002)
ndash Sensitive (van Iersel 2008)
ndash Specific (Harada1995)
ndash Correlates with
bull Functional ability (Perry1995)
bull Balance confidence (Mangione2007)
Walking Speed Predictive
ndash Future health status (Studenski
2003 Purser 2005)
ndash Functional decline (Brach 2002)
bull Hospitalization (Montero-Odasso
2005)
bull Discharge location (Salbach 2001
Rabadi 2005)
bull Mortality (Hardy 2007)
ndash Functional amp Physiological changes (Perry1995)
bull Potential for rehabilitation (Goldie 1996)
bull Aids in prediction of
ndash Falls (Guimaraes 1980)
ndash Fear of falling (Maki 1997)
Fritz S Lusardi M Clayton G Bird W Bidelpach D Duncan PW Gait the Sixth Vital Sign
Page 83
Suggested Way to Measure
HOWEVERhellip
Do these tests answer either of our two introductory questions regarding recovery and treatment planning
What is the role of a vital sign
Diagnostic Test
BP
Differential Exams Cholesterol Blood sugar
Adrenal gland fxn Thyroid fxn Kidney fxn
Diagnostic Test
Walking speed
Differential Exams
Gait Analysis
Laboratory Measures
Angles GRFs
Moments
0
0
tan
tan
inertiacediscontact
inertiacediscontact
MMM
FFF
IICOM
inertia
inertia
M
amF
I
COM
inertiaM
COM
inertiainertia
COMOO
inerrtia MFpM
S
contactT
T
TTTTTTTTTTT
TT
contact
F
contactS
S
SSSSSSSSSSS
SS
contact
F
F
FFFFFFFFFFF
FF
contact
MgmpampM
MgmpampM
GRMGRFCOPgmpampM
COMCOM
COMCOM
COMCOM
)())()()(()(
)())()()(()(
)())()()(()(
1
1
1
RIRIRR
RIRIRR
RIRIRR
S
contactTTT
T
contact
F
contactSSS
S
contact
FFF
F
contact
FgmamF
FgmamF
GRFgmamF
drsquoAlembert approach to inverse dynamics General laws of motion (sum forces sum moments)
General inertial forces and moments
NOTE
in general General (3 dimensional) Parallel Axis Theorem
Moments calculated at the proximal end of each segment
F S and T reflect the moment at proximal foot shank and thigh segments respectively Joint reaction forces
Laws of Motion
Spatiotemporal Analysis
Vastus
Medialis
Semi-
Membranosus
BREAK
bull Motor control training
bull Cardiovascular training
bull Strengthening and power training
bull Dynamic balance training
Elements of Optimized Walking Programs
Examination of Walking Specific Motor Control
Force vertical
Force anterior-posterior
Force medio-lateral
Ground Reaction Forces
Paretic Propulsion (Pp)
The percentage of total anterior GRF (propulsive) impulse generated by the paretic leg referred to as paretic propulsion (Pp) was calculated by dividing the propulsive impulse of the paretic leg by the sum of the paretic and non-paretic propulsive impulses
Pp =
+
0
50
100
1 2 3
Pp
(
)
Bowden et al 2006
bull Increased flexor activity in
preswing (eg TA and RF)
was correlated with
decreased paretic
propulsion
bull Increased plantarflexor
activity in late swing (eg
MG and SO) was correlated
with increased paretic
propulsion
Mechanisms of Response
Turns et al 2007
Extensor EMG Flexor EMG
What correlates with propulsion
bull PropulsionParetic cannot be measured in a conventional clinical setting without access to force plates
bull Step length asymmetry relates to propulsive forces generated by the legs
Paretic Step Ratio (PSR)
Stride Length
Paretic Step Length
PSR = Paretic Step Length Stride Length
PSR lt 047
047 lt PSR lt 053
PSR gt 053
r = -078 p lt 001
Balasubramanian et al 2007
ACTIVE propulsion generated by appropriately timed ankle power
PASSIVE propulsion generated by properly positioned foot COM posterior to the pelvic COM (larger horizontal portion of the red arrow)
Therefore emphasize hip extension
Mechanics of Propulsion and PSR
Clinical Usefulness
Beyond simply promoting symmetry PSR can be used to develop individual goals to train propulsive force production equalize bilateral biomechanical involvement by improving hip extension or promote paretic step initiation
ndash Longer paretic steps may be due to compensation by
greater non-paretic propulsion
ndash Weak relation with speed suggests compensatory strategies to attain functional speeds
ndash PSR may serve as a useful surrogate to assess propulsion during hemiparetic walking
bull These measures are capable of distinguishing ldquorecoveryrdquo from ldquocompensationrdquo
bull They also are capable of distinguishing motor control problems and provide critical information for treatment
BUT
Of what value is this measure to a clinician without biomechanical laboratory capabilities
-040
-030
-020
-010
000
010
020
030
1 7
13
19
25
31
37
43
49
55
61
67
73
79
85
91
97
Raw GRFs
Left leg
Right leg
-030
-020
-010
000
010
020
030
1 8
15
22
29
36
43
50
57
64
71
78
85
92
99
Summed GRFs
Summed GRFs
-030
-020
-010
000
010
020
030
1 8
15
22
29
36
43
50
57
64
71
78
85
92
99
Summed GRFs
Norm accel
GRFs vs Acceleration
CONTROL
-006
-004
-002
000
002
004
006
008
1 713
19
25
31
37
43
49
55
61
67
73
79
85
91
97
Paretic leg
Non paretic leg
Raw GRFs
-006
-004
-002
000
002
004
006
008
1 8
15
22
29
36
43
50
57
64
71
78
85
92
99
Summed GRF
summed GRF
-060
-040
-020
000
020
040
060
080
1 8
15
22
29
36
43
50
57
64
71
78
85
92
99
Normed GRFs
Acceleration
GRFs vs Acceleration
PERSON WITH STROKE
-15
-1
-05
0
05
1
15
1 9
17
25
33
41
49
57
65
73
81
89
97
Acc
ele
rati
on
in m
s2
Pre
Post
Control
Pre- and post-training accelerations of individuals participating in a
locomotor training intervention While COM acceleration increases it
does not approach normative values particularly in the critical phase 3 and 4
period of the gait cycle implying specific therapies need to target specific mechanistic elements of the walking pattern
-08
-06
-04
-02
0
02
04
06
CO
Ma
in m
s2
COMa before (blue line) and 2 minutes after (red line) incline training A
brief (5 minute) period of adaptation training yielded a 48 increase in both
peak COMa and the time integral of the COMa curve in phase 3 and 4 The x-axis represents percentage of the gait cycle
COMa as an outcome measure
bull segmental accelerations
bull studies into shock absorption
bull spatiotemporal gait parameters
bull control of stability
bull age-related changes in movement patterns
bull relating quantifiable movement patterns to falls
Portable applications
-06
-04
-02
0
02
04
06
Acc
ele
rati
on
in m
s2
Low PP
-06
-04
-02
0
02
04
06
Acc
ele
rati
on
in m
s2
Symmetrical
-06
-04
-02
0
02
04
06
Acc
ele
rati
on
in m
s2
High PP
Figure 6 COMa sorted by Pp Sorting by Pp yields three distinctly different acceleration profiles although the double support phase (shaded area) are similar in shape The low Pp
group (b) generates very little acceleration in the double support phase However the high Pp group (c) demonstrates only positive acceleration through the first half of the gait cycle while remaining negative throughout late double support and swing (Bowden Behrman et al In Press) The x-axes represent percentages of the gait cycle
a b c
COMa to diagnose motor control deficits
Examination of Power Training
JOINT POWER
P = moment times angular velocity P(+) = concentric (moments and velocity same direction) shortening contraction P(-) = eccentric (moments and velocity in opposite direction) lengthening contraction
A2
H3
H1
Gregory Bowden et al 2007
bull H1 (hip extension during initial stance) H3 (hip flexion during early swing) and A2 (ankle plantarflexion during late stance and pre-swing) all increased after therapy and the A2 and H3 bursts were significantly correlated with walking speed (Richards et al 2004)
bull Furthermore the A2 peak burst improvement was responsible for 25 of the gain in walking
bull Examining the interlimb coordination effects demonstrated that pre-training paretic A2 and H3 accounted for 84 of the variance in walking speed while post-training the non-paretic H3 replaces the paretic H3 to account for 82 of the post-training variance in patients that improved from 040 ms to 058 ms as a result of the intervention (Richards et al 2004)
Examination of Cardiovascular Status
bull Cardiorespiratory fitness is approximately 50 below age-matched controls
bull Decreased fitness combines with increased energetic demands to decrease efficiency
bull O2 use normalized to walking speed 50 higher bull Due to reduced peripheral muscle activation
change in fiber type reduced enzyme activities and altered hemodynamics
all responsive to exercise interventions
0
2
4
6
8
10
12
14
16
18
0 01 02 03 04 05 06 07
VO
2 (m
lk
gm
in)
Speed (ms)
bull Peak oxygen consumption (VO2) values in patients with stroke are below the level required for many basic activities of daily living (ADL)
bull Peak cardiovascular fitness
levels are roughly half those of age-matched individuals
bull Decreased CV fitness likely limits amount of walking thereby limiting daily physical activity and contributing to a downward spiral
ldquoStroke is a cardiac eventhelliprdquo Pam
Duncan
SS-50 SS-25 SS
SS+25 SS+50
SS-50
SS-25
SS SS+25 SS+50
01
02
03
04
05
06
07
08
O2
Eff (
mL
O2k
gm
)
Voluntary Fatigue
Cadence lt 40 rpm
Borg = 18
90 THR
Angina
HTN
Dyspnea
ST
segment
depression
Other
15
32
22
22
7
05
05
05
1 05
Hypotension
Courtesy of Dorian Rose PT PhD
Cardiovascular Fitness Functional Mobility
Examination of Dynamic Balance Control
Clinical Examinations
Dynamic COM vs COP
Weerdesteyn 2008
Balance Control
Treatment
bull Increase task complexity and difficulty (IRT example)
bull Athletic training
bull Intensity of training
bull Must know if people continue to fall
bull STILL evolving
Putting it All Together
Walking Performance
Motor Control
CV Fitness
Dynamic Balance Control
Strength
Results
bull The mobility group members improved their SMWT performance by an average of 35 m more than members of the UE group (95 CI 7 64)
bull Gait speed increases
ndash 011 ms_ss (95 CI 003 019) and 021 ms_fast (95 CI 12 030) faster than subjects in the UE group
bull TUG
ndash decreased 12 seconds in the intervention group (control increase by 17 seconds)
bull BBS No change (2 points to 1 point)
bull Later reports indicate an improvement in balancefalls efficacy
One therapy will NOT be the answer
Motor Control CV Status StrengthPower Dynamic Balance
Patient 1
Motor Control CV Status StrengthPower Dynamic Balance
Patient 3
Motor Control CV Status StrengthPower Dynamic Balance
Patient 2
Motor Control CV Status StrengthPower Dynamic Balance
Patient 4
Hypothetical future clinic
Overview - REVIEW
bull What is required for successful locomotor rehabilitation
ndash Systematic measurement
ndash Intensity
ndash Task specific practice
ndash Adherence to guiding principles
bull What does evidence-based practice tell us about locomotor rehabilitation
bull Where to go from here and what will future generations of therapeutic practice include
bull Guideline 1 Maximize weight bearing on the legs
bull Guideline 2 Afford the sensory experience consistent with walking
bull Guideline 3 Optimize kinematics for each motor task
bull Guideline 4 Maximize recovery and independence minimize compensation
LT Guidelines
hellipadded Guidelines
bull Systematic
bull Intensive
bull Progressive
bull Repetitive
bull Measure outcomes
hellipplus Plasticity
bull Use it or lose it
bull Use it and improve it
bull Specificity
bull Repetition matters
bull Intensity matters
bull Time matters
bull Salience matters
bull Age matters
bull Transference
bull Interference
Future directions
bull Evaluation to yield meaningful theory-based information to help guide clinical decision making
bull Classification to help guide treatment options
bull Understand ways to build on base therapy depending on impairments while being consistent with training guidelines
bull What tx for whom when in what combination with other tx
bull Clinic as a laboratory
Steve Kautz PhD
Mark George MD
Chris Gregory PhD PT
Aaron Embry DPT MSCR
Lindsay Perry DPT NCS
Patrick Morgan MS
This material is based upon work supported by the Office of Research and Development Rehabilitation Research and Development Department of Veterans Affairs Career Development-1 Award (Project B7177M Bowden PI) SCTR Discovery Pilot Grant (Kautz PI) AHA Innovative Research Grant (Kautz PI) and VA RRampD Merit Award B3983R (Kautz PI) The contents do not represent the views of the Department of Veterans Affairs or the United States Government
Thanks to all of my mentors collaborators and funding sources

hellipplus Plasticity
bull Use it or lose it
bull Use it and improve it
bull Specificity
bull Repetition matters
bull Intensity matters
bull Time matters
bull Salience matters
bull Age matters
bull Transference
bull Interference
So what is ldquoevidence-based practicerdquo
Top Stroke Rehabil 2008 May-Jun15(3)227-46 Links Application of evidence-based practice strategies current
trends in walking recovery interventions poststroke Tilson JK Settle SM Sullivan KJ ldquoRehabilitation effectiveness is enhanced when the clinician can 1 determine the best available interventions 2 for the appropriate subset of patients and 3 apply them at the correct dose and timepoint of recoveryrdquo
Framework
Step 1 Convert the need for information into a focused and searchable clinical question
Narrow question for bull Patient or patient population bull Intervention bull Outcome of interest
ldquoPICOrdquo Population Intervention Comparison (alternate intervention) Outcome of interest
Step 2 Find the best possible research evidence to answer your question
Pubmed
PEDro (Physiotherapy Evidence Database)
National Guidelines Clearinghouse
Canadian Stroke Network
Cochrane Collaboration (wwwcochraneorgreviews)
Step 3 Critically appraise the research evidence for validity and applicability
Assess evidence level and grade
Step 4 Integrate the critically appraised research evidence with clinical expertise and the patients unique biology circumstances and values
ldquoClinical trials do not provide the answers on how to rehabilitate
patientsrdquo bull Inform bull Provide a framework for practice bull Integrate with clinical expertise bull Integrate with patients unique circumstances values and
preferences Partner with patient family and caregivers
Step 5 Evaluate the effectiveness and efficacy of our efforts in Steps 1-4 and identify ways to improve them in the future
bull Monitor impact
bull Use standardized outcome measures
bull Build on each experience
bull PubMedrsquos MyNCBI service set up auto alerts for emerging literature of interest
Examples in stroke literature
Question 1 Aerobic conditioning and walking recovery poststroke
Recommendations
bull High quality (level 1a) and clinically relevant (grade A) research evidence that aerobic conditioning is effective for improving walking speed and endurance poststroke
bull Small body of evidence (conflicting grades A and C) of clinical relevance of impact on disability and QOL
bull Unclear of dose
bull Recommend breaking down by severity and chronicity
Question 2 Ankle-foot-orthosis prescription with an without functional electrical stimulation for walking recovery post-stroke
Recommendations
bull Level 2 grade B evidence that non-FES AFOs are effective for small
changes in walking speed bull Increased
ndash patient independence ndash Perception of safety ndash Confidence
bull Level 1a grade A evidence for improved gait velocity with FES-enabled AFO devices
bull Implanted FES has one RCT supporting lebel 1b grade A evidence for improved walking speed
Questionable functional independence QOL and long-term implications
Question 3 Treadmill training with body weight support for walking recovery post-stroke
BREAK
Locomotor Experience Applied Post-Stroke
bull 5 year
bull Phase-III
bull Single-blinded
bull Multi-site
bull Randomized Clinical Trial
bull If in addition to usual care to determine if a specialized locomotor training program that includes BWST as a treatment modality can produce clinically significant changes in walking speed in individuals post-stroke compared to Home Exercise Program
bull To determine effect of timing (early vs late severity (moderate vs severe) and duration (12- 24- 36-sessions)
Screening at 260plusmn116 days post-stroke 2-month baseline = point of randomization The bars indicate 95 confidence interval
Walking speed trajectory by intervention group and severity at screening 2-(baseline) 6- and 12-months post-stroke
Duncan et al 2011
Walking Speed at 6 Months
bull Six months after stroke Early-LTP (025plusmn021 ms) and HEP (023plusmn020 ms) groups had similar gains in walking speed and sustained these gains at 1 year
bull The Late-LTP group (which only received usual care from 2 to 6 months) improved by 013plusmn014 ms at 6 months
Statistically and Clinically Significant Changes in Outcomes from 2 mos to 12 mos post-stroke
Item
Early-LTP
(n=139)
Late-LTP
(n=143)
HEP
(n=126)
Overall
p-value
Comfortable Walking Speed
(msec) 023plusmn020 024plusmn023 025plusmn022 067
6 minute Walking Distance (m) 732plusmn694 790plusmn751 852plusmn729 045
Step Activity Monitor (SAM) ndash
Median of average number
stepsday [25th -75th percentile]
858
[-253 2422]
1022
[-111 3009]
1471
[435 3481] 010
Stroke Impact Scale (SIS)
Participation
(range = 0-100)
171plusmn259 131plusmn220 144plusmn206 038
SIS ADLIADL (range = 0-100) 96plusmn195 94plusmn172 145plusmn190 007
SIS Mobility (range = 0-100) 137plusmn216 120plusmn191 142plusmn203 0685
Fugl-Meyer LE Score (range
= 0-34) 17plusmn39 15plusmn37 25plusmn43 013
Berg Score (range = 0-56) 80plusmn78 59plusmn91 83plusmn878 006
No differences in improvements across treatment groups HIGHLY clinically relevant improvements
Preplanned Secondary Analysis of 6 Month Outcomes
Item LTP
(n=139)
HEP
(n=126)
UC
(n=143)
Overall
p-value
Comfortable Walking Speed (msec) 025plusmn021 023plusmn020 013plusmn014 lt00001
6 minute Walking Distance (m) 818plusmn628 759plusmn693 410plusmn474 lt00001
Step Activity Monitor (SAM) ndash Median
of average number stepsday [25th -
75th percentile]
1017
[-102 2209]
1357
[84 3382]
566
[-362 2043] 00367
Stroke Impact Scale (SIS) Participation
(range = 0-100) 118plusmn267 146plusmn229 77plusmn205 00384
SIS ADLIADL (range = 0-100) 98plusmn172 130plusmn169 70plusmn178 00516
SIS Mobility (range = 0-100) 153plusmn214 149plusmn200 70plusmn157 00006
Fugl-Meyer LE Score
(range = 0-34) 22plusmn34 24plusmn41 13plusmn33 01196
Berg Score (range = 0-56) 88plusmn81 79plusmn85 53plusmn70 00018
Activities Specific Balance Confidence
Score (range=0-100) 138plusmn208 156plusmn194 62plusmn202 00013
Late-LTP (usual care) experienced approximately HALF the improvement of early intervention groups
Falls and Falls Rate
The most common minor adverse event was falls
bull 576 of individuals experienced 1 fall
bull 34 experienced multiple falls
bull 6 experienced an injurious fall
bull More multiple falls in early-LTP group than late-LTP or HEP (plt007)
LEAPS in the context of EBP
For patients in the first year post-stroke who can walk 10 feet but are not walking at speeds gt08 ms (18 mph)
This randomized trial provides strong and high quality evidence that
Structured progressive locomotor training (including BWSTT) is not superior to a structured strengthening and balance exercise program for walking recovery
Either structured program is more effective than usual care at 6 months post-stroke
Both interventions have low risks of adverse events but structured exercise program in the home results in fewer adverse events compared to locomotor training
Current Therapeutic Approaches
bull Activity-based therapies
ndash Robotic interventions
bull Task-specific interventions
bull Aerobic training
bull Muscle Strengthening
bull FES (neuroprosthetics)
bull Virtual Rehabilitation
Results Similar outcomes for final walking speed were found for the different prevailing treatment methods Treatment gains were likewise comparable and generally insufficient for upgrading patientsrsquo functional community walking capacity
Conclusions Different treatment methods exist for poststroke gait
rehabilitation Their availability mode of application and costs vary yet outcomes are largely similar Therefore choosing an appropriate method may be guided by a pragmatic approach Simple ldquolow technologyrdquo and conventional exercise to date is at least as efficacious as more complex strategies such as treadmill and robotic-based interventions
Similarities for success
bull Intensity
bull Repeatability
Obstacles
bull Adverse personal effects
bull Decreased cardiovascular potential
bull Condition of peripheral muscle
bull Heterogeneity of sample
bull Responders versus non-responders
Current Therapeutic Approaches
bull Activity-based therapies
ndash Robotic interventions
bull Task-specific interventions
bull Aerobic training
bull Muscle Strengthening
bull FES (neuroprosthetics)
bull Virtual Rehabilitation
000
1000
2000
3000
4000
5000
6000
7000
8000
Pre Week1 Week2 Week3 Week4 Week5 Week6 Week7 Week8 Week9 Week10 Week11 Post
Self
-Se
lect
ed
Wal
kin
g Sp
ee
d (
cms
)
Mean Walking Speed
Responders versus Non-Responders
0
20
40
60
80
100
120
140
Pre Week1 Week2 Week3 Week4 Week5 Week6 Week7 Week8 Week9 Week10 Week11 Post
Self
-Se
lect
ed
Wal
kin
g Sp
ee
d (
cms
)
Individual Walking Speed
PL1
4
5
7
9
10
11
12
13
14
15
17
18
19
20
21
22
24
What does EBP tell us about current clinical decision making
ldquoPre-gaitrdquo Sequencing
Bridging
Kneeling
Sit-to-stand
Sitting Quadruped
Standing
Modified plantigrade
Half-kneeling
WALKING
Arch Phys Med Rehabil 1989 Oct70(10)755-62 Links Standing balance training effect on balance and locomotion in
hemiparetic adults Winstein CJ Gardner ER McNeal DR Barto PS Nicholson DE
Training symmetrical standing did not lead to symmetrical gait
performancehelliplocomotor pattern was only minimally affected by static balance exercises
Remember Hodgsonrsquos cats those trained to stand could stand
and not step while those trained to step could not stand
Standing = Walking What about BALANCE
Exp Brain Res 2006 Jun172(1)35-48 Epub 2006 Jan 24 Links A direct comparison of local dynamic stability during unperturbed standing and walking Kang HG Dingwell JB
bull Local dynamic stability properties were significantly different when comparing standing versus walking
bull COP divergence measures only significantly correlated with standing
TASK SPECIFICITY MATTERS
hellipBut is that all that matters
bull Strengthening and power training
bull Cardiovascular training
bull Dynamic balance training
bull Motor control training
Elements of Optimized Walking Programs
Advancing Locomotor Rehabilitation Measurement in Physical Therapy
Practice
bull Recovery versus compensation how can measurement distinguish the two
bull Physical performance vs mechanisms of response
bull How does your standardized ldquomeasurementrdquo help guide clinical decision making
Guiding Questions
Numeric Rating Scale (NRS)
The patient rates pain on a scale from 0 to 10
Questions regarding traditional ldquoMeasurementrdquo
1) Does improvement in a measure imply that the patient ldquorecoveredrdquo neuromotor function or simply more efficiently compensated for impaired underlying body functions
2) Does the measurement assist clinical decision making by differentiating between a variety of treatment options
Historically locomotor rehabilitation measurement has incorporated assessments using
1) rating scales
2) timed movement tasks
3) laboratory based outcomes
How may technological advances improve clinical measurement capabilities
Rating Scales
bull Often based on summary scores
ndash Lose individual item sensitivity
ndash Unable to measure subtle changes in control
bull Makes no comments on mechanisms
bull No information on recovery vs compensation or guiding of treatment plan
Timed Movement Tasks
bull Timed up and Go
bull 6 minute walk test (distance)
bull 10 meter walk test (speed)
Many many very positive elements of these tests
ndash Simple to measure
ndash Inexpensive
ndash Reliable and valid
ndash Sensitive
ndash Specific
Walking Speed ishellip
bull ldquohellipalmost the perfect measurerdquo (Wade 1992)
ndash Reliable (Richards 1996)
ndash Valid (Steffen 2002)
ndash Sensitive (van Iersel 2008)
ndash Specific (Harada1995)
ndash Correlates with
bull Functional ability (Perry1995)
bull Balance confidence (Mangione2007)
Walking Speed Predictive
ndash Future health status (Studenski
2003 Purser 2005)
ndash Functional decline (Brach 2002)
bull Hospitalization (Montero-Odasso
2005)
bull Discharge location (Salbach 2001
Rabadi 2005)
bull Mortality (Hardy 2007)
ndash Functional amp Physiological changes (Perry1995)
bull Potential for rehabilitation (Goldie 1996)
bull Aids in prediction of
ndash Falls (Guimaraes 1980)
ndash Fear of falling (Maki 1997)
Fritz S Lusardi M Clayton G Bird W Bidelpach D Duncan PW Gait the Sixth Vital Sign
Page 83
Suggested Way to Measure
HOWEVERhellip
Do these tests answer either of our two introductory questions regarding recovery and treatment planning
What is the role of a vital sign
Diagnostic Test
BP
Differential Exams Cholesterol Blood sugar
Adrenal gland fxn Thyroid fxn Kidney fxn
Diagnostic Test
Walking speed
Differential Exams
Gait Analysis
Laboratory Measures
Angles GRFs
Moments
0
0
tan
tan
inertiacediscontact
inertiacediscontact
MMM
FFF
IICOM
inertia
inertia
M
amF
I
COM
inertiaM
COM
inertiainertia
COMOO
inerrtia MFpM
S
contactT
T
TTTTTTTTTTT
TT
contact
F
contactS
S
SSSSSSSSSSS
SS
contact
F
F
FFFFFFFFFFF
FF
contact
MgmpampM
MgmpampM
GRMGRFCOPgmpampM
COMCOM
COMCOM
COMCOM
)())()()(()(
)())()()(()(
)())()()(()(
1
1
1
RIRIRR
RIRIRR
RIRIRR
S
contactTTT
T
contact
F
contactSSS
S
contact
FFF
F
contact
FgmamF
FgmamF
GRFgmamF
drsquoAlembert approach to inverse dynamics General laws of motion (sum forces sum moments)
General inertial forces and moments
NOTE
in general General (3 dimensional) Parallel Axis Theorem
Moments calculated at the proximal end of each segment
F S and T reflect the moment at proximal foot shank and thigh segments respectively Joint reaction forces
Laws of Motion
Spatiotemporal Analysis
Vastus
Medialis
Semi-
Membranosus
BREAK
bull Motor control training
bull Cardiovascular training
bull Strengthening and power training
bull Dynamic balance training
Elements of Optimized Walking Programs
Examination of Walking Specific Motor Control
Force vertical
Force anterior-posterior
Force medio-lateral
Ground Reaction Forces
Paretic Propulsion (Pp)
The percentage of total anterior GRF (propulsive) impulse generated by the paretic leg referred to as paretic propulsion (Pp) was calculated by dividing the propulsive impulse of the paretic leg by the sum of the paretic and non-paretic propulsive impulses
Pp =
+
0
50
100
1 2 3
Pp
(
)
Bowden et al 2006
bull Increased flexor activity in
preswing (eg TA and RF)
was correlated with
decreased paretic
propulsion
bull Increased plantarflexor
activity in late swing (eg
MG and SO) was correlated
with increased paretic
propulsion
Mechanisms of Response
Turns et al 2007
Extensor EMG Flexor EMG
What correlates with propulsion
bull PropulsionParetic cannot be measured in a conventional clinical setting without access to force plates
bull Step length asymmetry relates to propulsive forces generated by the legs
Paretic Step Ratio (PSR)
Stride Length
Paretic Step Length
PSR = Paretic Step Length Stride Length
PSR lt 047
047 lt PSR lt 053
PSR gt 053
r = -078 p lt 001
Balasubramanian et al 2007
ACTIVE propulsion generated by appropriately timed ankle power
PASSIVE propulsion generated by properly positioned foot COM posterior to the pelvic COM (larger horizontal portion of the red arrow)
Therefore emphasize hip extension
Mechanics of Propulsion and PSR
Clinical Usefulness
Beyond simply promoting symmetry PSR can be used to develop individual goals to train propulsive force production equalize bilateral biomechanical involvement by improving hip extension or promote paretic step initiation
ndash Longer paretic steps may be due to compensation by
greater non-paretic propulsion
ndash Weak relation with speed suggests compensatory strategies to attain functional speeds
ndash PSR may serve as a useful surrogate to assess propulsion during hemiparetic walking
bull These measures are capable of distinguishing ldquorecoveryrdquo from ldquocompensationrdquo
bull They also are capable of distinguishing motor control problems and provide critical information for treatment
BUT
Of what value is this measure to a clinician without biomechanical laboratory capabilities
-040
-030
-020
-010
000
010
020
030
1 7
13
19
25
31
37
43
49
55
61
67
73
79
85
91
97
Raw GRFs
Left leg
Right leg
-030
-020
-010
000
010
020
030
1 8
15
22
29
36
43
50
57
64
71
78
85
92
99
Summed GRFs
Summed GRFs
-030
-020
-010
000
010
020
030
1 8
15
22
29
36
43
50
57
64
71
78
85
92
99
Summed GRFs
Norm accel
GRFs vs Acceleration
CONTROL
-006
-004
-002
000
002
004
006
008
1 713
19
25
31
37
43
49
55
61
67
73
79
85
91
97
Paretic leg
Non paretic leg
Raw GRFs
-006
-004
-002
000
002
004
006
008
1 8
15
22
29
36
43
50
57
64
71
78
85
92
99
Summed GRF
summed GRF
-060
-040
-020
000
020
040
060
080
1 8
15
22
29
36
43
50
57
64
71
78
85
92
99
Normed GRFs
Acceleration
GRFs vs Acceleration
PERSON WITH STROKE
-15
-1
-05
0
05
1
15
1 9
17
25
33
41
49
57
65
73
81
89
97
Acc
ele
rati
on
in m
s2
Pre
Post
Control
Pre- and post-training accelerations of individuals participating in a
locomotor training intervention While COM acceleration increases it
does not approach normative values particularly in the critical phase 3 and 4
period of the gait cycle implying specific therapies need to target specific mechanistic elements of the walking pattern
-08
-06
-04
-02
0
02
04
06
CO
Ma
in m
s2
COMa before (blue line) and 2 minutes after (red line) incline training A
brief (5 minute) period of adaptation training yielded a 48 increase in both
peak COMa and the time integral of the COMa curve in phase 3 and 4 The x-axis represents percentage of the gait cycle
COMa as an outcome measure
bull segmental accelerations
bull studies into shock absorption
bull spatiotemporal gait parameters
bull control of stability
bull age-related changes in movement patterns
bull relating quantifiable movement patterns to falls
Portable applications
-06
-04
-02
0
02
04
06
Acc
ele
rati
on
in m
s2
Low PP
-06
-04
-02
0
02
04
06
Acc
ele
rati
on
in m
s2
Symmetrical
-06
-04
-02
0
02
04
06
Acc
ele
rati
on
in m
s2
High PP
Figure 6 COMa sorted by Pp Sorting by Pp yields three distinctly different acceleration profiles although the double support phase (shaded area) are similar in shape The low Pp
group (b) generates very little acceleration in the double support phase However the high Pp group (c) demonstrates only positive acceleration through the first half of the gait cycle while remaining negative throughout late double support and swing (Bowden Behrman et al In Press) The x-axes represent percentages of the gait cycle
a b c
COMa to diagnose motor control deficits
Examination of Power Training
JOINT POWER
P = moment times angular velocity P(+) = concentric (moments and velocity same direction) shortening contraction P(-) = eccentric (moments and velocity in opposite direction) lengthening contraction
A2
H3
H1
Gregory Bowden et al 2007
bull H1 (hip extension during initial stance) H3 (hip flexion during early swing) and A2 (ankle plantarflexion during late stance and pre-swing) all increased after therapy and the A2 and H3 bursts were significantly correlated with walking speed (Richards et al 2004)
bull Furthermore the A2 peak burst improvement was responsible for 25 of the gain in walking
bull Examining the interlimb coordination effects demonstrated that pre-training paretic A2 and H3 accounted for 84 of the variance in walking speed while post-training the non-paretic H3 replaces the paretic H3 to account for 82 of the post-training variance in patients that improved from 040 ms to 058 ms as a result of the intervention (Richards et al 2004)
Examination of Cardiovascular Status
bull Cardiorespiratory fitness is approximately 50 below age-matched controls
bull Decreased fitness combines with increased energetic demands to decrease efficiency
bull O2 use normalized to walking speed 50 higher bull Due to reduced peripheral muscle activation
change in fiber type reduced enzyme activities and altered hemodynamics
all responsive to exercise interventions
0
2
4
6
8
10
12
14
16
18
0 01 02 03 04 05 06 07
VO
2 (m
lk
gm
in)
Speed (ms)
bull Peak oxygen consumption (VO2) values in patients with stroke are below the level required for many basic activities of daily living (ADL)
bull Peak cardiovascular fitness
levels are roughly half those of age-matched individuals
bull Decreased CV fitness likely limits amount of walking thereby limiting daily physical activity and contributing to a downward spiral
ldquoStroke is a cardiac eventhelliprdquo Pam
Duncan
SS-50 SS-25 SS
SS+25 SS+50
SS-50
SS-25
SS SS+25 SS+50
01
02
03
04
05
06
07
08
O2
Eff (
mL
O2k
gm
)
Voluntary Fatigue
Cadence lt 40 rpm
Borg = 18
90 THR
Angina
HTN
Dyspnea
ST
segment
depression
Other
15
32
22
22
7
05
05
05
1 05
Hypotension
Courtesy of Dorian Rose PT PhD
Cardiovascular Fitness Functional Mobility
Examination of Dynamic Balance Control
Clinical Examinations
Dynamic COM vs COP
Weerdesteyn 2008
Balance Control
Treatment
bull Increase task complexity and difficulty (IRT example)
bull Athletic training
bull Intensity of training
bull Must know if people continue to fall
bull STILL evolving
Putting it All Together
Walking Performance
Motor Control
CV Fitness
Dynamic Balance Control
Strength
Results
bull The mobility group members improved their SMWT performance by an average of 35 m more than members of the UE group (95 CI 7 64)
bull Gait speed increases
ndash 011 ms_ss (95 CI 003 019) and 021 ms_fast (95 CI 12 030) faster than subjects in the UE group
bull TUG
ndash decreased 12 seconds in the intervention group (control increase by 17 seconds)
bull BBS No change (2 points to 1 point)
bull Later reports indicate an improvement in balancefalls efficacy
One therapy will NOT be the answer
Motor Control CV Status StrengthPower Dynamic Balance
Patient 1
Motor Control CV Status StrengthPower Dynamic Balance
Patient 3
Motor Control CV Status StrengthPower Dynamic Balance
Patient 2
Motor Control CV Status StrengthPower Dynamic Balance
Patient 4
Hypothetical future clinic
Overview - REVIEW
bull What is required for successful locomotor rehabilitation
ndash Systematic measurement
ndash Intensity
ndash Task specific practice
ndash Adherence to guiding principles
bull What does evidence-based practice tell us about locomotor rehabilitation
bull Where to go from here and what will future generations of therapeutic practice include
bull Guideline 1 Maximize weight bearing on the legs
bull Guideline 2 Afford the sensory experience consistent with walking
bull Guideline 3 Optimize kinematics for each motor task
bull Guideline 4 Maximize recovery and independence minimize compensation
LT Guidelines
hellipadded Guidelines
bull Systematic
bull Intensive
bull Progressive
bull Repetitive
bull Measure outcomes
hellipplus Plasticity
bull Use it or lose it
bull Use it and improve it
bull Specificity
bull Repetition matters
bull Intensity matters
bull Time matters
bull Salience matters
bull Age matters
bull Transference
bull Interference
Future directions
bull Evaluation to yield meaningful theory-based information to help guide clinical decision making
bull Classification to help guide treatment options
bull Understand ways to build on base therapy depending on impairments while being consistent with training guidelines
bull What tx for whom when in what combination with other tx
bull Clinic as a laboratory
Steve Kautz PhD
Mark George MD
Chris Gregory PhD PT
Aaron Embry DPT MSCR
Lindsay Perry DPT NCS
Patrick Morgan MS
This material is based upon work supported by the Office of Research and Development Rehabilitation Research and Development Department of Veterans Affairs Career Development-1 Award (Project B7177M Bowden PI) SCTR Discovery Pilot Grant (Kautz PI) AHA Innovative Research Grant (Kautz PI) and VA RRampD Merit Award B3983R (Kautz PI) The contents do not represent the views of the Department of Veterans Affairs or the United States Government
Thanks to all of my mentors collaborators and funding sources

Recommendations
bull High quality (level 1a) and clinically relevant (grade A) research evidence that aerobic conditioning is effective for improving walking speed and endurance poststroke
bull Small body of evidence (conflicting grades A and C) of clinical relevance of impact on disability and QOL
bull Unclear of dose
bull Recommend breaking down by severity and chronicity
Question 2 Ankle-foot-orthosis prescription with an without functional electrical stimulation for walking recovery post-stroke
Recommendations
bull Level 2 grade B evidence that non-FES AFOs are effective for small
changes in walking speed bull Increased
ndash patient independence ndash Perception of safety ndash Confidence
bull Level 1a grade A evidence for improved gait velocity with FES-enabled AFO devices
bull Implanted FES has one RCT supporting lebel 1b grade A evidence for improved walking speed
Questionable functional independence QOL and long-term implications
Question 3 Treadmill training with body weight support for walking recovery post-stroke
BREAK
Locomotor Experience Applied Post-Stroke
bull 5 year
bull Phase-III
bull Single-blinded
bull Multi-site
bull Randomized Clinical Trial
bull If in addition to usual care to determine if a specialized locomotor training program that includes BWST as a treatment modality can produce clinically significant changes in walking speed in individuals post-stroke compared to Home Exercise Program
bull To determine effect of timing (early vs late severity (moderate vs severe) and duration (12- 24- 36-sessions)
Screening at 260plusmn116 days post-stroke 2-month baseline = point of randomization The bars indicate 95 confidence interval
Walking speed trajectory by intervention group and severity at screening 2-(baseline) 6- and 12-months post-stroke
Duncan et al 2011
Walking Speed at 6 Months
bull Six months after stroke Early-LTP (025plusmn021 ms) and HEP (023plusmn020 ms) groups had similar gains in walking speed and sustained these gains at 1 year
bull The Late-LTP group (which only received usual care from 2 to 6 months) improved by 013plusmn014 ms at 6 months
Statistically and Clinically Significant Changes in Outcomes from 2 mos to 12 mos post-stroke
Item
Early-LTP
(n=139)
Late-LTP
(n=143)
HEP
(n=126)
Overall
p-value
Comfortable Walking Speed
(msec) 023plusmn020 024plusmn023 025plusmn022 067
6 minute Walking Distance (m) 732plusmn694 790plusmn751 852plusmn729 045
Step Activity Monitor (SAM) ndash
Median of average number
stepsday [25th -75th percentile]
858
[-253 2422]
1022
[-111 3009]
1471
[435 3481] 010
Stroke Impact Scale (SIS)
Participation
(range = 0-100)
171plusmn259 131plusmn220 144plusmn206 038
SIS ADLIADL (range = 0-100) 96plusmn195 94plusmn172 145plusmn190 007
SIS Mobility (range = 0-100) 137plusmn216 120plusmn191 142plusmn203 0685
Fugl-Meyer LE Score (range
= 0-34) 17plusmn39 15plusmn37 25plusmn43 013
Berg Score (range = 0-56) 80plusmn78 59plusmn91 83plusmn878 006
No differences in improvements across treatment groups HIGHLY clinically relevant improvements
Preplanned Secondary Analysis of 6 Month Outcomes
Item LTP
(n=139)
HEP
(n=126)
UC
(n=143)
Overall
p-value
Comfortable Walking Speed (msec) 025plusmn021 023plusmn020 013plusmn014 lt00001
6 minute Walking Distance (m) 818plusmn628 759plusmn693 410plusmn474 lt00001
Step Activity Monitor (SAM) ndash Median
of average number stepsday [25th -
75th percentile]
1017
[-102 2209]
1357
[84 3382]
566
[-362 2043] 00367
Stroke Impact Scale (SIS) Participation
(range = 0-100) 118plusmn267 146plusmn229 77plusmn205 00384
SIS ADLIADL (range = 0-100) 98plusmn172 130plusmn169 70plusmn178 00516
SIS Mobility (range = 0-100) 153plusmn214 149plusmn200 70plusmn157 00006
Fugl-Meyer LE Score
(range = 0-34) 22plusmn34 24plusmn41 13plusmn33 01196
Berg Score (range = 0-56) 88plusmn81 79plusmn85 53plusmn70 00018
Activities Specific Balance Confidence
Score (range=0-100) 138plusmn208 156plusmn194 62plusmn202 00013
Late-LTP (usual care) experienced approximately HALF the improvement of early intervention groups
Falls and Falls Rate
The most common minor adverse event was falls
bull 576 of individuals experienced 1 fall
bull 34 experienced multiple falls
bull 6 experienced an injurious fall
bull More multiple falls in early-LTP group than late-LTP or HEP (plt007)
LEAPS in the context of EBP
For patients in the first year post-stroke who can walk 10 feet but are not walking at speeds gt08 ms (18 mph)
This randomized trial provides strong and high quality evidence that
Structured progressive locomotor training (including BWSTT) is not superior to a structured strengthening and balance exercise program for walking recovery
Either structured program is more effective than usual care at 6 months post-stroke
Both interventions have low risks of adverse events but structured exercise program in the home results in fewer adverse events compared to locomotor training
Current Therapeutic Approaches
bull Activity-based therapies
ndash Robotic interventions
bull Task-specific interventions
bull Aerobic training
bull Muscle Strengthening
bull FES (neuroprosthetics)
bull Virtual Rehabilitation
Results Similar outcomes for final walking speed were found for the different prevailing treatment methods Treatment gains were likewise comparable and generally insufficient for upgrading patientsrsquo functional community walking capacity
Conclusions Different treatment methods exist for poststroke gait
rehabilitation Their availability mode of application and costs vary yet outcomes are largely similar Therefore choosing an appropriate method may be guided by a pragmatic approach Simple ldquolow technologyrdquo and conventional exercise to date is at least as efficacious as more complex strategies such as treadmill and robotic-based interventions
Similarities for success
bull Intensity
bull Repeatability
Obstacles
bull Adverse personal effects
bull Decreased cardiovascular potential
bull Condition of peripheral muscle
bull Heterogeneity of sample
bull Responders versus non-responders
Current Therapeutic Approaches
bull Activity-based therapies
ndash Robotic interventions
bull Task-specific interventions
bull Aerobic training
bull Muscle Strengthening
bull FES (neuroprosthetics)
bull Virtual Rehabilitation
000
1000
2000
3000
4000
5000
6000
7000
8000
Pre Week1 Week2 Week3 Week4 Week5 Week6 Week7 Week8 Week9 Week10 Week11 Post
Self
-Se
lect
ed
Wal
kin
g Sp
ee
d (
cms
)
Mean Walking Speed
Responders versus Non-Responders
0
20
40
60
80
100
120
140
Pre Week1 Week2 Week3 Week4 Week5 Week6 Week7 Week8 Week9 Week10 Week11 Post
Self
-Se
lect
ed
Wal
kin
g Sp
ee
d (
cms
)
Individual Walking Speed
PL1
4
5
7
9
10
11
12
13
14
15
17
18
19
20
21
22
24
What does EBP tell us about current clinical decision making
ldquoPre-gaitrdquo Sequencing
Bridging
Kneeling
Sit-to-stand
Sitting Quadruped
Standing
Modified plantigrade
Half-kneeling
WALKING
Arch Phys Med Rehabil 1989 Oct70(10)755-62 Links Standing balance training effect on balance and locomotion in
hemiparetic adults Winstein CJ Gardner ER McNeal DR Barto PS Nicholson DE
Training symmetrical standing did not lead to symmetrical gait
performancehelliplocomotor pattern was only minimally affected by static balance exercises
Remember Hodgsonrsquos cats those trained to stand could stand
and not step while those trained to step could not stand
Standing = Walking What about BALANCE
Exp Brain Res 2006 Jun172(1)35-48 Epub 2006 Jan 24 Links A direct comparison of local dynamic stability during unperturbed standing and walking Kang HG Dingwell JB
bull Local dynamic stability properties were significantly different when comparing standing versus walking
bull COP divergence measures only significantly correlated with standing
TASK SPECIFICITY MATTERS
hellipBut is that all that matters
bull Strengthening and power training
bull Cardiovascular training
bull Dynamic balance training
bull Motor control training
Elements of Optimized Walking Programs
Advancing Locomotor Rehabilitation Measurement in Physical Therapy
Practice
bull Recovery versus compensation how can measurement distinguish the two
bull Physical performance vs mechanisms of response
bull How does your standardized ldquomeasurementrdquo help guide clinical decision making
Guiding Questions
Numeric Rating Scale (NRS)
The patient rates pain on a scale from 0 to 10
Questions regarding traditional ldquoMeasurementrdquo
1) Does improvement in a measure imply that the patient ldquorecoveredrdquo neuromotor function or simply more efficiently compensated for impaired underlying body functions
2) Does the measurement assist clinical decision making by differentiating between a variety of treatment options
Historically locomotor rehabilitation measurement has incorporated assessments using
1) rating scales
2) timed movement tasks
3) laboratory based outcomes
How may technological advances improve clinical measurement capabilities
Rating Scales
bull Often based on summary scores
ndash Lose individual item sensitivity
ndash Unable to measure subtle changes in control
bull Makes no comments on mechanisms
bull No information on recovery vs compensation or guiding of treatment plan
Timed Movement Tasks
bull Timed up and Go
bull 6 minute walk test (distance)
bull 10 meter walk test (speed)
Many many very positive elements of these tests
ndash Simple to measure
ndash Inexpensive
ndash Reliable and valid
ndash Sensitive
ndash Specific
Walking Speed ishellip
bull ldquohellipalmost the perfect measurerdquo (Wade 1992)
ndash Reliable (Richards 1996)
ndash Valid (Steffen 2002)
ndash Sensitive (van Iersel 2008)
ndash Specific (Harada1995)
ndash Correlates with
bull Functional ability (Perry1995)
bull Balance confidence (Mangione2007)
Walking Speed Predictive
ndash Future health status (Studenski
2003 Purser 2005)
ndash Functional decline (Brach 2002)
bull Hospitalization (Montero-Odasso
2005)
bull Discharge location (Salbach 2001
Rabadi 2005)
bull Mortality (Hardy 2007)
ndash Functional amp Physiological changes (Perry1995)
bull Potential for rehabilitation (Goldie 1996)
bull Aids in prediction of
ndash Falls (Guimaraes 1980)
ndash Fear of falling (Maki 1997)
Fritz S Lusardi M Clayton G Bird W Bidelpach D Duncan PW Gait the Sixth Vital Sign
Page 83
Suggested Way to Measure
HOWEVERhellip
Do these tests answer either of our two introductory questions regarding recovery and treatment planning
What is the role of a vital sign
Diagnostic Test
BP
Differential Exams Cholesterol Blood sugar
Adrenal gland fxn Thyroid fxn Kidney fxn
Diagnostic Test
Walking speed
Differential Exams
Gait Analysis
Laboratory Measures
Angles GRFs
Moments
0
0
tan
tan
inertiacediscontact
inertiacediscontact
MMM
FFF
IICOM
inertia
inertia
M
amF
I
COM
inertiaM
COM
inertiainertia
COMOO
inerrtia MFpM
S
contactT
T
TTTTTTTTTTT
TT
contact
F
contactS
S
SSSSSSSSSSS
SS
contact
F
F
FFFFFFFFFFF
FF
contact
MgmpampM
MgmpampM
GRMGRFCOPgmpampM
COMCOM
COMCOM
COMCOM
)())()()(()(
)())()()(()(
)())()()(()(
1
1
1
RIRIRR
RIRIRR
RIRIRR
S
contactTTT
T
contact
F
contactSSS
S
contact
FFF
F
contact
FgmamF
FgmamF
GRFgmamF
drsquoAlembert approach to inverse dynamics General laws of motion (sum forces sum moments)
General inertial forces and moments
NOTE
in general General (3 dimensional) Parallel Axis Theorem
Moments calculated at the proximal end of each segment
F S and T reflect the moment at proximal foot shank and thigh segments respectively Joint reaction forces
Laws of Motion
Spatiotemporal Analysis
Vastus
Medialis
Semi-
Membranosus
BREAK
bull Motor control training
bull Cardiovascular training
bull Strengthening and power training
bull Dynamic balance training
Elements of Optimized Walking Programs
Examination of Walking Specific Motor Control
Force vertical
Force anterior-posterior
Force medio-lateral
Ground Reaction Forces
Paretic Propulsion (Pp)
The percentage of total anterior GRF (propulsive) impulse generated by the paretic leg referred to as paretic propulsion (Pp) was calculated by dividing the propulsive impulse of the paretic leg by the sum of the paretic and non-paretic propulsive impulses
Pp =
+
0
50
100
1 2 3
Pp
(
)
Bowden et al 2006
bull Increased flexor activity in
preswing (eg TA and RF)
was correlated with
decreased paretic
propulsion
bull Increased plantarflexor
activity in late swing (eg
MG and SO) was correlated
with increased paretic
propulsion
Mechanisms of Response
Turns et al 2007
Extensor EMG Flexor EMG
What correlates with propulsion
bull PropulsionParetic cannot be measured in a conventional clinical setting without access to force plates
bull Step length asymmetry relates to propulsive forces generated by the legs
Paretic Step Ratio (PSR)
Stride Length
Paretic Step Length
PSR = Paretic Step Length Stride Length
PSR lt 047
047 lt PSR lt 053
PSR gt 053
r = -078 p lt 001
Balasubramanian et al 2007
ACTIVE propulsion generated by appropriately timed ankle power
PASSIVE propulsion generated by properly positioned foot COM posterior to the pelvic COM (larger horizontal portion of the red arrow)
Therefore emphasize hip extension
Mechanics of Propulsion and PSR
Clinical Usefulness
Beyond simply promoting symmetry PSR can be used to develop individual goals to train propulsive force production equalize bilateral biomechanical involvement by improving hip extension or promote paretic step initiation
ndash Longer paretic steps may be due to compensation by
greater non-paretic propulsion
ndash Weak relation with speed suggests compensatory strategies to attain functional speeds
ndash PSR may serve as a useful surrogate to assess propulsion during hemiparetic walking
bull These measures are capable of distinguishing ldquorecoveryrdquo from ldquocompensationrdquo
bull They also are capable of distinguishing motor control problems and provide critical information for treatment
BUT
Of what value is this measure to a clinician without biomechanical laboratory capabilities
-040
-030
-020
-010
000
010
020
030
1 7
13
19
25
31
37
43
49
55
61
67
73
79
85
91
97
Raw GRFs
Left leg
Right leg
-030
-020
-010
000
010
020
030
1 8
15
22
29
36
43
50
57
64
71
78
85
92
99
Summed GRFs
Summed GRFs
-030
-020
-010
000
010
020
030
1 8
15
22
29
36
43
50
57
64
71
78
85
92
99
Summed GRFs
Norm accel
GRFs vs Acceleration
CONTROL
-006
-004
-002
000
002
004
006
008
1 713
19
25
31
37
43
49
55
61
67
73
79
85
91
97
Paretic leg
Non paretic leg
Raw GRFs
-006
-004
-002
000
002
004
006
008
1 8
15
22
29
36
43
50
57
64
71
78
85
92
99
Summed GRF
summed GRF
-060
-040
-020
000
020
040
060
080
1 8
15
22
29
36
43
50
57
64
71
78
85
92
99
Normed GRFs
Acceleration
GRFs vs Acceleration
PERSON WITH STROKE
-15
-1
-05
0
05
1
15
1 9
17
25
33
41
49
57
65
73
81
89
97
Acc
ele
rati
on
in m
s2
Pre
Post
Control
Pre- and post-training accelerations of individuals participating in a
locomotor training intervention While COM acceleration increases it
does not approach normative values particularly in the critical phase 3 and 4
period of the gait cycle implying specific therapies need to target specific mechanistic elements of the walking pattern
-08
-06
-04
-02
0
02
04
06
CO
Ma
in m
s2
COMa before (blue line) and 2 minutes after (red line) incline training A
brief (5 minute) period of adaptation training yielded a 48 increase in both
peak COMa and the time integral of the COMa curve in phase 3 and 4 The x-axis represents percentage of the gait cycle
COMa as an outcome measure
bull segmental accelerations
bull studies into shock absorption
bull spatiotemporal gait parameters
bull control of stability
bull age-related changes in movement patterns
bull relating quantifiable movement patterns to falls
Portable applications
-06
-04
-02
0
02
04
06
Acc
ele
rati
on
in m
s2
Low PP
-06
-04
-02
0
02
04
06
Acc
ele
rati
on
in m
s2
Symmetrical
-06
-04
-02
0
02
04
06
Acc
ele
rati
on
in m
s2
High PP
Figure 6 COMa sorted by Pp Sorting by Pp yields three distinctly different acceleration profiles although the double support phase (shaded area) are similar in shape The low Pp
group (b) generates very little acceleration in the double support phase However the high Pp group (c) demonstrates only positive acceleration through the first half of the gait cycle while remaining negative throughout late double support and swing (Bowden Behrman et al In Press) The x-axes represent percentages of the gait cycle
a b c
COMa to diagnose motor control deficits
Examination of Power Training
JOINT POWER
P = moment times angular velocity P(+) = concentric (moments and velocity same direction) shortening contraction P(-) = eccentric (moments and velocity in opposite direction) lengthening contraction
A2
H3
H1
Gregory Bowden et al 2007
bull H1 (hip extension during initial stance) H3 (hip flexion during early swing) and A2 (ankle plantarflexion during late stance and pre-swing) all increased after therapy and the A2 and H3 bursts were significantly correlated with walking speed (Richards et al 2004)
bull Furthermore the A2 peak burst improvement was responsible for 25 of the gain in walking
bull Examining the interlimb coordination effects demonstrated that pre-training paretic A2 and H3 accounted for 84 of the variance in walking speed while post-training the non-paretic H3 replaces the paretic H3 to account for 82 of the post-training variance in patients that improved from 040 ms to 058 ms as a result of the intervention (Richards et al 2004)
Examination of Cardiovascular Status
bull Cardiorespiratory fitness is approximately 50 below age-matched controls
bull Decreased fitness combines with increased energetic demands to decrease efficiency
bull O2 use normalized to walking speed 50 higher bull Due to reduced peripheral muscle activation
change in fiber type reduced enzyme activities and altered hemodynamics
all responsive to exercise interventions
0
2
4
6
8
10
12
14
16
18
0 01 02 03 04 05 06 07
VO
2 (m
lk
gm
in)
Speed (ms)
bull Peak oxygen consumption (VO2) values in patients with stroke are below the level required for many basic activities of daily living (ADL)
bull Peak cardiovascular fitness
levels are roughly half those of age-matched individuals
bull Decreased CV fitness likely limits amount of walking thereby limiting daily physical activity and contributing to a downward spiral
ldquoStroke is a cardiac eventhelliprdquo Pam
Duncan
SS-50 SS-25 SS
SS+25 SS+50
SS-50
SS-25
SS SS+25 SS+50
01
02
03
04
05
06
07
08
O2
Eff (
mL
O2k
gm
)
Voluntary Fatigue
Cadence lt 40 rpm
Borg = 18
90 THR
Angina
HTN
Dyspnea
ST
segment
depression
Other
15
32
22
22
7
05
05
05
1 05
Hypotension
Courtesy of Dorian Rose PT PhD
Cardiovascular Fitness Functional Mobility
Examination of Dynamic Balance Control
Clinical Examinations
Dynamic COM vs COP
Weerdesteyn 2008
Balance Control
Treatment
bull Increase task complexity and difficulty (IRT example)
bull Athletic training
bull Intensity of training
bull Must know if people continue to fall
bull STILL evolving
Putting it All Together
Walking Performance
Motor Control
CV Fitness
Dynamic Balance Control
Strength
Results
bull The mobility group members improved their SMWT performance by an average of 35 m more than members of the UE group (95 CI 7 64)
bull Gait speed increases
ndash 011 ms_ss (95 CI 003 019) and 021 ms_fast (95 CI 12 030) faster than subjects in the UE group
bull TUG
ndash decreased 12 seconds in the intervention group (control increase by 17 seconds)
bull BBS No change (2 points to 1 point)
bull Later reports indicate an improvement in balancefalls efficacy
One therapy will NOT be the answer
Motor Control CV Status StrengthPower Dynamic Balance
Patient 1
Motor Control CV Status StrengthPower Dynamic Balance
Patient 3
Motor Control CV Status StrengthPower Dynamic Balance
Patient 2
Motor Control CV Status StrengthPower Dynamic Balance
Patient 4
Hypothetical future clinic
Overview - REVIEW
bull What is required for successful locomotor rehabilitation
ndash Systematic measurement
ndash Intensity
ndash Task specific practice
ndash Adherence to guiding principles
bull What does evidence-based practice tell us about locomotor rehabilitation
bull Where to go from here and what will future generations of therapeutic practice include
bull Guideline 1 Maximize weight bearing on the legs
bull Guideline 2 Afford the sensory experience consistent with walking
bull Guideline 3 Optimize kinematics for each motor task
bull Guideline 4 Maximize recovery and independence minimize compensation
LT Guidelines
hellipadded Guidelines
bull Systematic
bull Intensive
bull Progressive
bull Repetitive
bull Measure outcomes
hellipplus Plasticity
bull Use it or lose it
bull Use it and improve it
bull Specificity
bull Repetition matters
bull Intensity matters
bull Time matters
bull Salience matters
bull Age matters
bull Transference
bull Interference
Future directions
bull Evaluation to yield meaningful theory-based information to help guide clinical decision making
bull Classification to help guide treatment options
bull Understand ways to build on base therapy depending on impairments while being consistent with training guidelines
bull What tx for whom when in what combination with other tx
bull Clinic as a laboratory
Steve Kautz PhD
Mark George MD
Chris Gregory PhD PT
Aaron Embry DPT MSCR
Lindsay Perry DPT NCS
Patrick Morgan MS
This material is based upon work supported by the Office of Research and Development Rehabilitation Research and Development Department of Veterans Affairs Career Development-1 Award (Project B7177M Bowden PI) SCTR Discovery Pilot Grant (Kautz PI) AHA Innovative Research Grant (Kautz PI) and VA RRampD Merit Award B3983R (Kautz PI) The contents do not represent the views of the Department of Veterans Affairs or the United States Government
Thanks to all of my mentors collaborators and funding sources
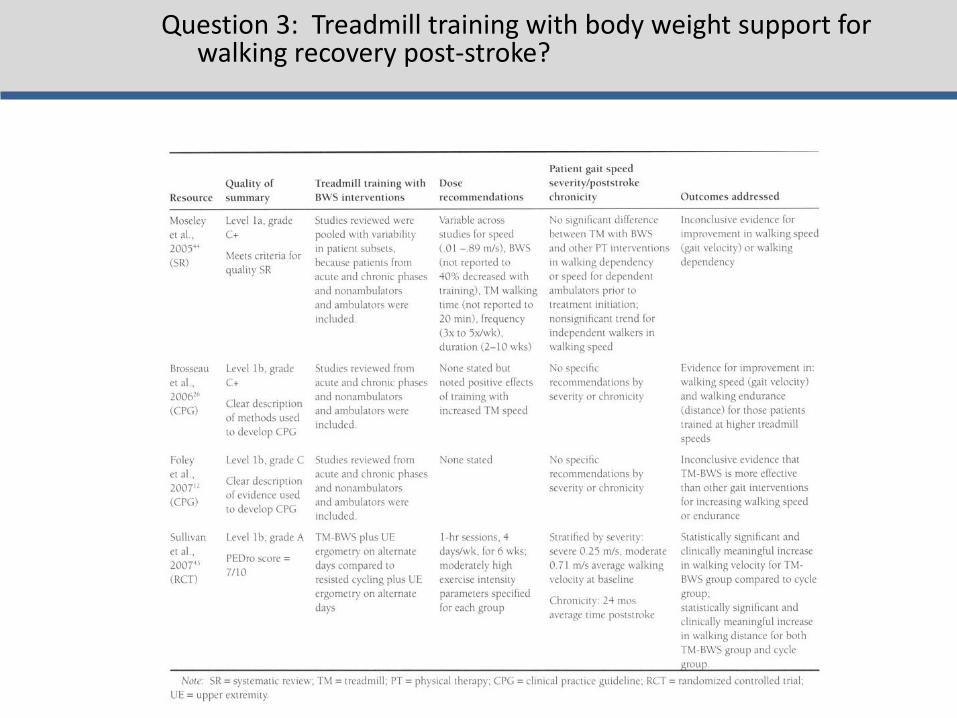

BREAK
Locomotor Experience Applied Post-Stroke
bull 5 year
bull Phase-III
bull Single-blinded
bull Multi-site
bull Randomized Clinical Trial
bull If in addition to usual care to determine if a specialized locomotor training program that includes BWST as a treatment modality can produce clinically significant changes in walking speed in individuals post-stroke compared to Home Exercise Program
bull To determine effect of timing (early vs late severity (moderate vs severe) and duration (12- 24- 36-sessions)
Screening at 260plusmn116 days post-stroke 2-month baseline = point of randomization The bars indicate 95 confidence interval
Walking speed trajectory by intervention group and severity at screening 2-(baseline) 6- and 12-months post-stroke
Duncan et al 2011
Walking Speed at 6 Months
bull Six months after stroke Early-LTP (025plusmn021 ms) and HEP (023plusmn020 ms) groups had similar gains in walking speed and sustained these gains at 1 year
bull The Late-LTP group (which only received usual care from 2 to 6 months) improved by 013plusmn014 ms at 6 months
Statistically and Clinically Significant Changes in Outcomes from 2 mos to 12 mos post-stroke
Item
Early-LTP
(n=139)
Late-LTP
(n=143)
HEP
(n=126)
Overall
p-value
Comfortable Walking Speed
(msec) 023plusmn020 024plusmn023 025plusmn022 067
6 minute Walking Distance (m) 732plusmn694 790plusmn751 852plusmn729 045
Step Activity Monitor (SAM) ndash
Median of average number
stepsday [25th -75th percentile]
858
[-253 2422]
1022
[-111 3009]
1471
[435 3481] 010
Stroke Impact Scale (SIS)
Participation
(range = 0-100)
171plusmn259 131plusmn220 144plusmn206 038
SIS ADLIADL (range = 0-100) 96plusmn195 94plusmn172 145plusmn190 007
SIS Mobility (range = 0-100) 137plusmn216 120plusmn191 142plusmn203 0685
Fugl-Meyer LE Score (range
= 0-34) 17plusmn39 15plusmn37 25plusmn43 013
Berg Score (range = 0-56) 80plusmn78 59plusmn91 83plusmn878 006
No differences in improvements across treatment groups HIGHLY clinically relevant improvements
Preplanned Secondary Analysis of 6 Month Outcomes
Item LTP
(n=139)
HEP
(n=126)
UC
(n=143)
Overall
p-value
Comfortable Walking Speed (msec) 025plusmn021 023plusmn020 013plusmn014 lt00001
6 minute Walking Distance (m) 818plusmn628 759plusmn693 410plusmn474 lt00001
Step Activity Monitor (SAM) ndash Median
of average number stepsday [25th -
75th percentile]
1017
[-102 2209]
1357
[84 3382]
566
[-362 2043] 00367
Stroke Impact Scale (SIS) Participation
(range = 0-100) 118plusmn267 146plusmn229 77plusmn205 00384
SIS ADLIADL (range = 0-100) 98plusmn172 130plusmn169 70plusmn178 00516
SIS Mobility (range = 0-100) 153plusmn214 149plusmn200 70plusmn157 00006
Fugl-Meyer LE Score
(range = 0-34) 22plusmn34 24plusmn41 13plusmn33 01196
Berg Score (range = 0-56) 88plusmn81 79plusmn85 53plusmn70 00018
Activities Specific Balance Confidence
Score (range=0-100) 138plusmn208 156plusmn194 62plusmn202 00013
Late-LTP (usual care) experienced approximately HALF the improvement of early intervention groups
Falls and Falls Rate
The most common minor adverse event was falls
bull 576 of individuals experienced 1 fall
bull 34 experienced multiple falls
bull 6 experienced an injurious fall
bull More multiple falls in early-LTP group than late-LTP or HEP (plt007)
LEAPS in the context of EBP
For patients in the first year post-stroke who can walk 10 feet but are not walking at speeds gt08 ms (18 mph)
This randomized trial provides strong and high quality evidence that
Structured progressive locomotor training (including BWSTT) is not superior to a structured strengthening and balance exercise program for walking recovery
Either structured program is more effective than usual care at 6 months post-stroke
Both interventions have low risks of adverse events but structured exercise program in the home results in fewer adverse events compared to locomotor training
Current Therapeutic Approaches
bull Activity-based therapies
ndash Robotic interventions
bull Task-specific interventions
bull Aerobic training
bull Muscle Strengthening
bull FES (neuroprosthetics)
bull Virtual Rehabilitation
Results Similar outcomes for final walking speed were found for the different prevailing treatment methods Treatment gains were likewise comparable and generally insufficient for upgrading patientsrsquo functional community walking capacity
Conclusions Different treatment methods exist for poststroke gait
rehabilitation Their availability mode of application and costs vary yet outcomes are largely similar Therefore choosing an appropriate method may be guided by a pragmatic approach Simple ldquolow technologyrdquo and conventional exercise to date is at least as efficacious as more complex strategies such as treadmill and robotic-based interventions
Similarities for success
bull Intensity
bull Repeatability
Obstacles
bull Adverse personal effects
bull Decreased cardiovascular potential
bull Condition of peripheral muscle
bull Heterogeneity of sample
bull Responders versus non-responders
Current Therapeutic Approaches
bull Activity-based therapies
ndash Robotic interventions
bull Task-specific interventions
bull Aerobic training
bull Muscle Strengthening
bull FES (neuroprosthetics)
bull Virtual Rehabilitation
000
1000
2000
3000
4000
5000
6000
7000
8000
Pre Week1 Week2 Week3 Week4 Week5 Week6 Week7 Week8 Week9 Week10 Week11 Post
Self
-Se
lect
ed
Wal
kin
g Sp
ee
d (
cms
)
Mean Walking Speed
Responders versus Non-Responders
0
20
40
60
80
100
120
140
Pre Week1 Week2 Week3 Week4 Week5 Week6 Week7 Week8 Week9 Week10 Week11 Post
Self
-Se
lect
ed
Wal
kin
g Sp
ee
d (
cms
)
Individual Walking Speed
PL1
4
5
7
9
10
11
12
13
14
15
17
18
19
20
21
22
24
What does EBP tell us about current clinical decision making
ldquoPre-gaitrdquo Sequencing
Bridging
Kneeling
Sit-to-stand
Sitting Quadruped
Standing
Modified plantigrade
Half-kneeling
WALKING
Arch Phys Med Rehabil 1989 Oct70(10)755-62 Links Standing balance training effect on balance and locomotion in
hemiparetic adults Winstein CJ Gardner ER McNeal DR Barto PS Nicholson DE
Training symmetrical standing did not lead to symmetrical gait
performancehelliplocomotor pattern was only minimally affected by static balance exercises
Remember Hodgsonrsquos cats those trained to stand could stand
and not step while those trained to step could not stand
Standing = Walking What about BALANCE
Exp Brain Res 2006 Jun172(1)35-48 Epub 2006 Jan 24 Links A direct comparison of local dynamic stability during unperturbed standing and walking Kang HG Dingwell JB
bull Local dynamic stability properties were significantly different when comparing standing versus walking
bull COP divergence measures only significantly correlated with standing
TASK SPECIFICITY MATTERS
hellipBut is that all that matters
bull Strengthening and power training
bull Cardiovascular training
bull Dynamic balance training
bull Motor control training
Elements of Optimized Walking Programs
Advancing Locomotor Rehabilitation Measurement in Physical Therapy
Practice
bull Recovery versus compensation how can measurement distinguish the two
bull Physical performance vs mechanisms of response
bull How does your standardized ldquomeasurementrdquo help guide clinical decision making
Guiding Questions
Numeric Rating Scale (NRS)
The patient rates pain on a scale from 0 to 10
Questions regarding traditional ldquoMeasurementrdquo
1) Does improvement in a measure imply that the patient ldquorecoveredrdquo neuromotor function or simply more efficiently compensated for impaired underlying body functions
2) Does the measurement assist clinical decision making by differentiating between a variety of treatment options
Historically locomotor rehabilitation measurement has incorporated assessments using
1) rating scales
2) timed movement tasks
3) laboratory based outcomes
How may technological advances improve clinical measurement capabilities
Rating Scales
bull Often based on summary scores
ndash Lose individual item sensitivity
ndash Unable to measure subtle changes in control
bull Makes no comments on mechanisms
bull No information on recovery vs compensation or guiding of treatment plan
Timed Movement Tasks
bull Timed up and Go
bull 6 minute walk test (distance)
bull 10 meter walk test (speed)
Many many very positive elements of these tests
ndash Simple to measure
ndash Inexpensive
ndash Reliable and valid
ndash Sensitive
ndash Specific
Walking Speed ishellip
bull ldquohellipalmost the perfect measurerdquo (Wade 1992)
ndash Reliable (Richards 1996)
ndash Valid (Steffen 2002)
ndash Sensitive (van Iersel 2008)
ndash Specific (Harada1995)
ndash Correlates with
bull Functional ability (Perry1995)
bull Balance confidence (Mangione2007)
Walking Speed Predictive
ndash Future health status (Studenski
2003 Purser 2005)
ndash Functional decline (Brach 2002)
bull Hospitalization (Montero-Odasso
2005)
bull Discharge location (Salbach 2001
Rabadi 2005)
bull Mortality (Hardy 2007)
ndash Functional amp Physiological changes (Perry1995)
bull Potential for rehabilitation (Goldie 1996)
bull Aids in prediction of
ndash Falls (Guimaraes 1980)
ndash Fear of falling (Maki 1997)
Fritz S Lusardi M Clayton G Bird W Bidelpach D Duncan PW Gait the Sixth Vital Sign
Page 83
Suggested Way to Measure
HOWEVERhellip
Do these tests answer either of our two introductory questions regarding recovery and treatment planning
What is the role of a vital sign
Diagnostic Test
BP
Differential Exams Cholesterol Blood sugar
Adrenal gland fxn Thyroid fxn Kidney fxn
Diagnostic Test
Walking speed
Differential Exams
Gait Analysis
Laboratory Measures
Angles GRFs
Moments
0
0
tan
tan
inertiacediscontact
inertiacediscontact
MMM
FFF
IICOM
inertia
inertia
M
amF
I
COM
inertiaM
COM
inertiainertia
COMOO
inerrtia MFpM
S
contactT
T
TTTTTTTTTTT
TT
contact
F
contactS
S
SSSSSSSSSSS
SS
contact
F
F
FFFFFFFFFFF
FF
contact
MgmpampM
MgmpampM
GRMGRFCOPgmpampM
COMCOM
COMCOM
COMCOM
)())()()(()(
)())()()(()(
)())()()(()(
1
1
1
RIRIRR
RIRIRR
RIRIRR
S
contactTTT
T
contact
F
contactSSS
S
contact
FFF
F
contact
FgmamF
FgmamF
GRFgmamF
drsquoAlembert approach to inverse dynamics General laws of motion (sum forces sum moments)
General inertial forces and moments
NOTE
in general General (3 dimensional) Parallel Axis Theorem
Moments calculated at the proximal end of each segment
F S and T reflect the moment at proximal foot shank and thigh segments respectively Joint reaction forces
Laws of Motion
Spatiotemporal Analysis
Vastus
Medialis
Semi-
Membranosus
BREAK
bull Motor control training
bull Cardiovascular training
bull Strengthening and power training
bull Dynamic balance training
Elements of Optimized Walking Programs
Examination of Walking Specific Motor Control
Force vertical
Force anterior-posterior
Force medio-lateral
Ground Reaction Forces
Paretic Propulsion (Pp)
The percentage of total anterior GRF (propulsive) impulse generated by the paretic leg referred to as paretic propulsion (Pp) was calculated by dividing the propulsive impulse of the paretic leg by the sum of the paretic and non-paretic propulsive impulses
Pp =
+
0
50
100
1 2 3
Pp
(
)
Bowden et al 2006
bull Increased flexor activity in
preswing (eg TA and RF)
was correlated with
decreased paretic
propulsion
bull Increased plantarflexor
activity in late swing (eg
MG and SO) was correlated
with increased paretic
propulsion
Mechanisms of Response
Turns et al 2007
Extensor EMG Flexor EMG
What correlates with propulsion
bull PropulsionParetic cannot be measured in a conventional clinical setting without access to force plates
bull Step length asymmetry relates to propulsive forces generated by the legs
Paretic Step Ratio (PSR)
Stride Length
Paretic Step Length
PSR = Paretic Step Length Stride Length
PSR lt 047
047 lt PSR lt 053
PSR gt 053
r = -078 p lt 001
Balasubramanian et al 2007
ACTIVE propulsion generated by appropriately timed ankle power
PASSIVE propulsion generated by properly positioned foot COM posterior to the pelvic COM (larger horizontal portion of the red arrow)
Therefore emphasize hip extension
Mechanics of Propulsion and PSR
Clinical Usefulness
Beyond simply promoting symmetry PSR can be used to develop individual goals to train propulsive force production equalize bilateral biomechanical involvement by improving hip extension or promote paretic step initiation
ndash Longer paretic steps may be due to compensation by
greater non-paretic propulsion
ndash Weak relation with speed suggests compensatory strategies to attain functional speeds
ndash PSR may serve as a useful surrogate to assess propulsion during hemiparetic walking
bull These measures are capable of distinguishing ldquorecoveryrdquo from ldquocompensationrdquo
bull They also are capable of distinguishing motor control problems and provide critical information for treatment
BUT
Of what value is this measure to a clinician without biomechanical laboratory capabilities
-040
-030
-020
-010
000
010
020
030
1 7
13
19
25
31
37
43
49
55
61
67
73
79
85
91
97
Raw GRFs
Left leg
Right leg
-030
-020
-010
000
010
020
030
1 8
15
22
29
36
43
50
57
64
71
78
85
92
99
Summed GRFs
Summed GRFs
-030
-020
-010
000
010
020
030
1 8
15
22
29
36
43
50
57
64
71
78
85
92
99
Summed GRFs
Norm accel
GRFs vs Acceleration
CONTROL
-006
-004
-002
000
002
004
006
008
1 713
19
25
31
37
43
49
55
61
67
73
79
85
91
97
Paretic leg
Non paretic leg
Raw GRFs
-006
-004
-002
000
002
004
006
008
1 8
15
22
29
36
43
50
57
64
71
78
85
92
99
Summed GRF
summed GRF
-060
-040
-020
000
020
040
060
080
1 8
15
22
29
36
43
50
57
64
71
78
85
92
99
Normed GRFs
Acceleration
GRFs vs Acceleration
PERSON WITH STROKE
-15
-1
-05
0
05
1
15
1 9
17
25
33
41
49
57
65
73
81
89
97
Acc
ele
rati
on
in m
s2
Pre
Post
Control
Pre- and post-training accelerations of individuals participating in a
locomotor training intervention While COM acceleration increases it
does not approach normative values particularly in the critical phase 3 and 4
period of the gait cycle implying specific therapies need to target specific mechanistic elements of the walking pattern
-08
-06
-04
-02
0
02
04
06
CO
Ma
in m
s2
COMa before (blue line) and 2 minutes after (red line) incline training A
brief (5 minute) period of adaptation training yielded a 48 increase in both
peak COMa and the time integral of the COMa curve in phase 3 and 4 The x-axis represents percentage of the gait cycle
COMa as an outcome measure
bull segmental accelerations
bull studies into shock absorption
bull spatiotemporal gait parameters
bull control of stability
bull age-related changes in movement patterns
bull relating quantifiable movement patterns to falls
Portable applications
-06
-04
-02
0
02
04
06
Acc
ele
rati
on
in m
s2
Low PP
-06
-04
-02
0
02
04
06
Acc
ele
rati
on
in m
s2
Symmetrical
-06
-04
-02
0
02
04
06
Acc
ele
rati
on
in m
s2
High PP
Figure 6 COMa sorted by Pp Sorting by Pp yields three distinctly different acceleration profiles although the double support phase (shaded area) are similar in shape The low Pp
group (b) generates very little acceleration in the double support phase However the high Pp group (c) demonstrates only positive acceleration through the first half of the gait cycle while remaining negative throughout late double support and swing (Bowden Behrman et al In Press) The x-axes represent percentages of the gait cycle
a b c
COMa to diagnose motor control deficits
Examination of Power Training
JOINT POWER
P = moment times angular velocity P(+) = concentric (moments and velocity same direction) shortening contraction P(-) = eccentric (moments and velocity in opposite direction) lengthening contraction
A2
H3
H1
Gregory Bowden et al 2007
bull H1 (hip extension during initial stance) H3 (hip flexion during early swing) and A2 (ankle plantarflexion during late stance and pre-swing) all increased after therapy and the A2 and H3 bursts were significantly correlated with walking speed (Richards et al 2004)
bull Furthermore the A2 peak burst improvement was responsible for 25 of the gain in walking
bull Examining the interlimb coordination effects demonstrated that pre-training paretic A2 and H3 accounted for 84 of the variance in walking speed while post-training the non-paretic H3 replaces the paretic H3 to account for 82 of the post-training variance in patients that improved from 040 ms to 058 ms as a result of the intervention (Richards et al 2004)
Examination of Cardiovascular Status
bull Cardiorespiratory fitness is approximately 50 below age-matched controls
bull Decreased fitness combines with increased energetic demands to decrease efficiency
bull O2 use normalized to walking speed 50 higher bull Due to reduced peripheral muscle activation
change in fiber type reduced enzyme activities and altered hemodynamics
all responsive to exercise interventions
0
2
4
6
8
10
12
14
16
18
0 01 02 03 04 05 06 07
VO
2 (m
lk
gm
in)
Speed (ms)
bull Peak oxygen consumption (VO2) values in patients with stroke are below the level required for many basic activities of daily living (ADL)
bull Peak cardiovascular fitness
levels are roughly half those of age-matched individuals
bull Decreased CV fitness likely limits amount of walking thereby limiting daily physical activity and contributing to a downward spiral
ldquoStroke is a cardiac eventhelliprdquo Pam
Duncan
SS-50 SS-25 SS
SS+25 SS+50
SS-50
SS-25
SS SS+25 SS+50
01
02
03
04
05
06
07
08
O2
Eff (
mL
O2k
gm
)
Voluntary Fatigue
Cadence lt 40 rpm
Borg = 18
90 THR
Angina
HTN
Dyspnea
ST
segment
depression
Other
15
32
22
22
7
05
05
05
1 05
Hypotension
Courtesy of Dorian Rose PT PhD
Cardiovascular Fitness Functional Mobility
Examination of Dynamic Balance Control
Clinical Examinations
Dynamic COM vs COP
Weerdesteyn 2008
Balance Control
Treatment
bull Increase task complexity and difficulty (IRT example)
bull Athletic training
bull Intensity of training
bull Must know if people continue to fall
bull STILL evolving
Putting it All Together
Walking Performance
Motor Control
CV Fitness
Dynamic Balance Control
Strength
Results
bull The mobility group members improved their SMWT performance by an average of 35 m more than members of the UE group (95 CI 7 64)
bull Gait speed increases
ndash 011 ms_ss (95 CI 003 019) and 021 ms_fast (95 CI 12 030) faster than subjects in the UE group
bull TUG
ndash decreased 12 seconds in the intervention group (control increase by 17 seconds)
bull BBS No change (2 points to 1 point)
bull Later reports indicate an improvement in balancefalls efficacy
One therapy will NOT be the answer
Motor Control CV Status StrengthPower Dynamic Balance
Patient 1
Motor Control CV Status StrengthPower Dynamic Balance
Patient 3
Motor Control CV Status StrengthPower Dynamic Balance
Patient 2
Motor Control CV Status StrengthPower Dynamic Balance
Patient 4
Hypothetical future clinic
Overview - REVIEW
bull What is required for successful locomotor rehabilitation
ndash Systematic measurement
ndash Intensity
ndash Task specific practice
ndash Adherence to guiding principles
bull What does evidence-based practice tell us about locomotor rehabilitation
bull Where to go from here and what will future generations of therapeutic practice include
bull Guideline 1 Maximize weight bearing on the legs
bull Guideline 2 Afford the sensory experience consistent with walking
bull Guideline 3 Optimize kinematics for each motor task
bull Guideline 4 Maximize recovery and independence minimize compensation
LT Guidelines
hellipadded Guidelines
bull Systematic
bull Intensive
bull Progressive
bull Repetitive
bull Measure outcomes
hellipplus Plasticity
bull Use it or lose it
bull Use it and improve it
bull Specificity
bull Repetition matters
bull Intensity matters
bull Time matters
bull Salience matters
bull Age matters
bull Transference
bull Interference
Future directions
bull Evaluation to yield meaningful theory-based information to help guide clinical decision making
bull Classification to help guide treatment options
bull Understand ways to build on base therapy depending on impairments while being consistent with training guidelines
bull What tx for whom when in what combination with other tx
bull Clinic as a laboratory
Steve Kautz PhD
Mark George MD
Chris Gregory PhD PT
Aaron Embry DPT MSCR
Lindsay Perry DPT NCS
Patrick Morgan MS
This material is based upon work supported by the Office of Research and Development Rehabilitation Research and Development Department of Veterans Affairs Career Development-1 Award (Project B7177M Bowden PI) SCTR Discovery Pilot Grant (Kautz PI) AHA Innovative Research Grant (Kautz PI) and VA RRampD Merit Award B3983R (Kautz PI) The contents do not represent the views of the Department of Veterans Affairs or the United States Government
Thanks to all of my mentors collaborators and funding sources
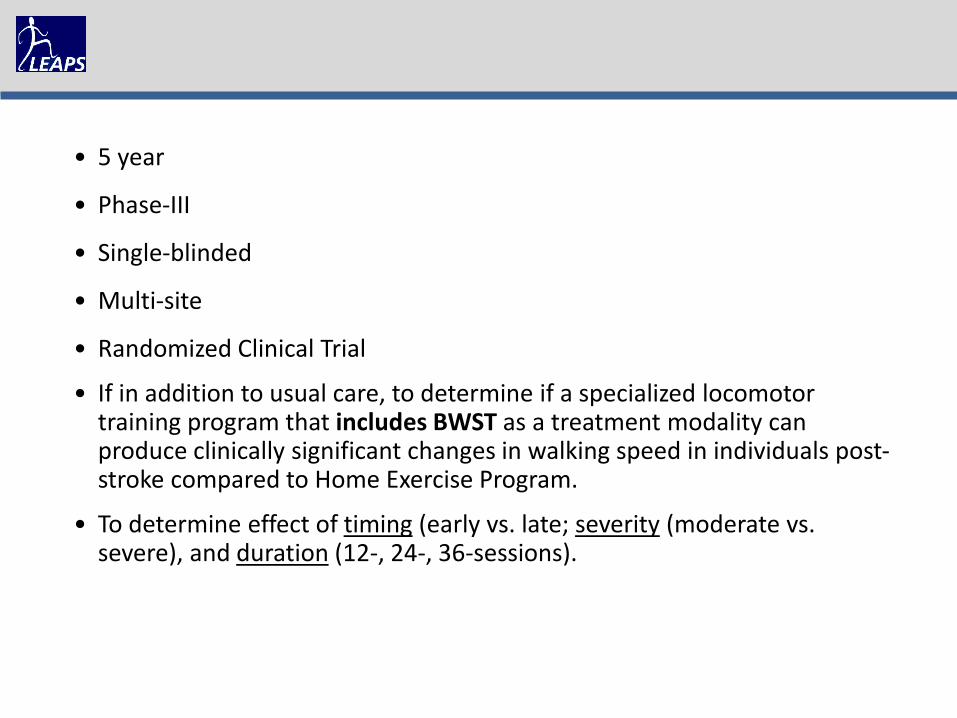
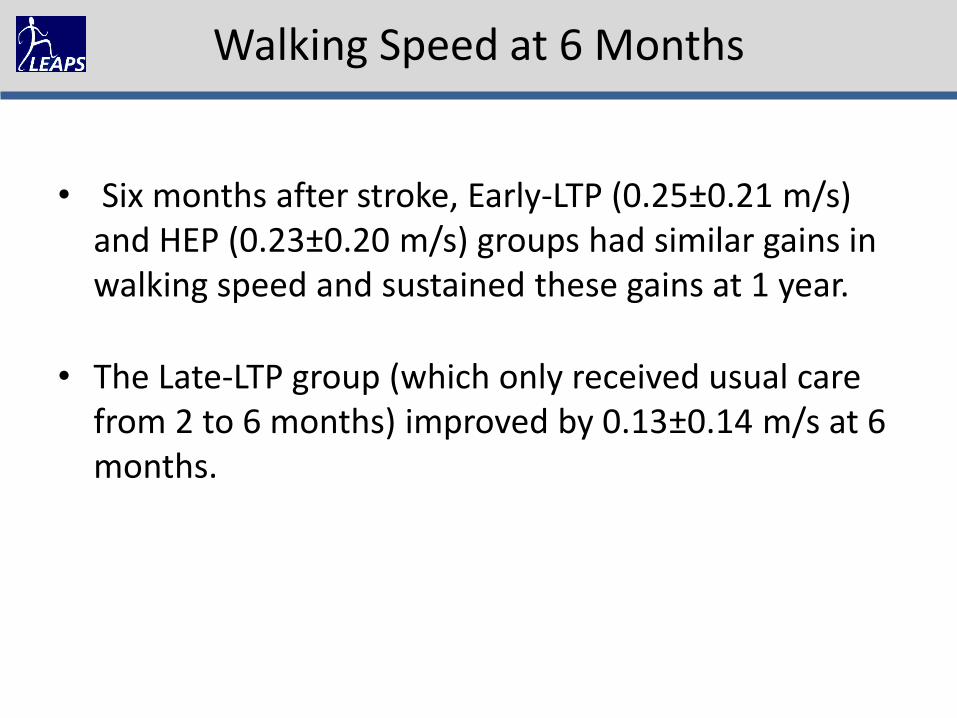

Current Therapeutic Approaches
bull Activity-based therapies
ndash Robotic interventions
bull Task-specific interventions
bull Aerobic training
bull Muscle Strengthening
bull FES (neuroprosthetics)
bull Virtual Rehabilitation
Results Similar outcomes for final walking speed were found for the different prevailing treatment methods Treatment gains were likewise comparable and generally insufficient for upgrading patientsrsquo functional community walking capacity
Conclusions Different treatment methods exist for poststroke gait
rehabilitation Their availability mode of application and costs vary yet outcomes are largely similar Therefore choosing an appropriate method may be guided by a pragmatic approach Simple ldquolow technologyrdquo and conventional exercise to date is at least as efficacious as more complex strategies such as treadmill and robotic-based interventions
Similarities for success
bull Intensity
bull Repeatability
Obstacles
bull Adverse personal effects
bull Decreased cardiovascular potential
bull Condition of peripheral muscle
bull Heterogeneity of sample
bull Responders versus non-responders
Current Therapeutic Approaches
bull Activity-based therapies
ndash Robotic interventions
bull Task-specific interventions
bull Aerobic training
bull Muscle Strengthening
bull FES (neuroprosthetics)
bull Virtual Rehabilitation
000
1000
2000
3000
4000
5000
6000
7000
8000
Pre Week1 Week2 Week3 Week4 Week5 Week6 Week7 Week8 Week9 Week10 Week11 Post
Self
-Se
lect
ed
Wal
kin
g Sp
ee
d (
cms
)
Mean Walking Speed
Responders versus Non-Responders
0
20
40
60
80
100
120
140
Pre Week1 Week2 Week3 Week4 Week5 Week6 Week7 Week8 Week9 Week10 Week11 Post
Self
-Se
lect
ed
Wal
kin
g Sp
ee
d (
cms
)
Individual Walking Speed
PL1
4
5
7
9
10
11
12
13
14
15
17
18
19
20
21
22
24
What does EBP tell us about current clinical decision making
ldquoPre-gaitrdquo Sequencing
Bridging
Kneeling
Sit-to-stand
Sitting Quadruped
Standing
Modified plantigrade
Half-kneeling
WALKING
Arch Phys Med Rehabil 1989 Oct70(10)755-62 Links Standing balance training effect on balance and locomotion in
hemiparetic adults Winstein CJ Gardner ER McNeal DR Barto PS Nicholson DE
Training symmetrical standing did not lead to symmetrical gait
performancehelliplocomotor pattern was only minimally affected by static balance exercises
Remember Hodgsonrsquos cats those trained to stand could stand
and not step while those trained to step could not stand
Standing = Walking What about BALANCE
Exp Brain Res 2006 Jun172(1)35-48 Epub 2006 Jan 24 Links A direct comparison of local dynamic stability during unperturbed standing and walking Kang HG Dingwell JB
bull Local dynamic stability properties were significantly different when comparing standing versus walking
bull COP divergence measures only significantly correlated with standing
TASK SPECIFICITY MATTERS
hellipBut is that all that matters
bull Strengthening and power training
bull Cardiovascular training
bull Dynamic balance training
bull Motor control training
Elements of Optimized Walking Programs
Advancing Locomotor Rehabilitation Measurement in Physical Therapy
Practice
bull Recovery versus compensation how can measurement distinguish the two
bull Physical performance vs mechanisms of response
bull How does your standardized ldquomeasurementrdquo help guide clinical decision making
Guiding Questions
Numeric Rating Scale (NRS)
The patient rates pain on a scale from 0 to 10
Questions regarding traditional ldquoMeasurementrdquo
1) Does improvement in a measure imply that the patient ldquorecoveredrdquo neuromotor function or simply more efficiently compensated for impaired underlying body functions
2) Does the measurement assist clinical decision making by differentiating between a variety of treatment options
Historically locomotor rehabilitation measurement has incorporated assessments using
1) rating scales
2) timed movement tasks
3) laboratory based outcomes
How may technological advances improve clinical measurement capabilities
Rating Scales
bull Often based on summary scores
ndash Lose individual item sensitivity
ndash Unable to measure subtle changes in control
bull Makes no comments on mechanisms
bull No information on recovery vs compensation or guiding of treatment plan
Timed Movement Tasks
bull Timed up and Go
bull 6 minute walk test (distance)
bull 10 meter walk test (speed)
Many many very positive elements of these tests
ndash Simple to measure
ndash Inexpensive
ndash Reliable and valid
ndash Sensitive
ndash Specific
Walking Speed ishellip
bull ldquohellipalmost the perfect measurerdquo (Wade 1992)
ndash Reliable (Richards 1996)
ndash Valid (Steffen 2002)
ndash Sensitive (van Iersel 2008)
ndash Specific (Harada1995)
ndash Correlates with
bull Functional ability (Perry1995)
bull Balance confidence (Mangione2007)
Walking Speed Predictive
ndash Future health status (Studenski
2003 Purser 2005)
ndash Functional decline (Brach 2002)
bull Hospitalization (Montero-Odasso
2005)
bull Discharge location (Salbach 2001
Rabadi 2005)
bull Mortality (Hardy 2007)
ndash Functional amp Physiological changes (Perry1995)
bull Potential for rehabilitation (Goldie 1996)
bull Aids in prediction of
ndash Falls (Guimaraes 1980)
ndash Fear of falling (Maki 1997)
Fritz S Lusardi M Clayton G Bird W Bidelpach D Duncan PW Gait the Sixth Vital Sign
Page 83
Suggested Way to Measure
HOWEVERhellip
Do these tests answer either of our two introductory questions regarding recovery and treatment planning
What is the role of a vital sign
Diagnostic Test
BP
Differential Exams Cholesterol Blood sugar
Adrenal gland fxn Thyroid fxn Kidney fxn
Diagnostic Test
Walking speed
Differential Exams
Gait Analysis
Laboratory Measures
Angles GRFs
Moments
0
0
tan
tan
inertiacediscontact
inertiacediscontact
MMM
FFF
IICOM
inertia
inertia
M
amF
I
COM
inertiaM
COM
inertiainertia
COMOO
inerrtia MFpM
S
contactT
T
TTTTTTTTTTT
TT
contact
F
contactS
S
SSSSSSSSSSS
SS
contact
F
F
FFFFFFFFFFF
FF
contact
MgmpampM
MgmpampM
GRMGRFCOPgmpampM
COMCOM
COMCOM
COMCOM
)())()()(()(
)())()()(()(
)())()()(()(
1
1
1
RIRIRR
RIRIRR
RIRIRR
S
contactTTT
T
contact
F
contactSSS
S
contact
FFF
F
contact
FgmamF
FgmamF
GRFgmamF
drsquoAlembert approach to inverse dynamics General laws of motion (sum forces sum moments)
General inertial forces and moments
NOTE
in general General (3 dimensional) Parallel Axis Theorem
Moments calculated at the proximal end of each segment
F S and T reflect the moment at proximal foot shank and thigh segments respectively Joint reaction forces
Laws of Motion
Spatiotemporal Analysis
Vastus
Medialis
Semi-
Membranosus
BREAK
bull Motor control training
bull Cardiovascular training
bull Strengthening and power training
bull Dynamic balance training
Elements of Optimized Walking Programs
Examination of Walking Specific Motor Control
Force vertical
Force anterior-posterior
Force medio-lateral
Ground Reaction Forces
Paretic Propulsion (Pp)
The percentage of total anterior GRF (propulsive) impulse generated by the paretic leg referred to as paretic propulsion (Pp) was calculated by dividing the propulsive impulse of the paretic leg by the sum of the paretic and non-paretic propulsive impulses
Pp =
+
0
50
100
1 2 3
Pp
(
)
Bowden et al 2006
bull Increased flexor activity in
preswing (eg TA and RF)
was correlated with
decreased paretic
propulsion
bull Increased plantarflexor
activity in late swing (eg
MG and SO) was correlated
with increased paretic
propulsion
Mechanisms of Response
Turns et al 2007
Extensor EMG Flexor EMG
What correlates with propulsion
bull PropulsionParetic cannot be measured in a conventional clinical setting without access to force plates
bull Step length asymmetry relates to propulsive forces generated by the legs
Paretic Step Ratio (PSR)
Stride Length
Paretic Step Length
PSR = Paretic Step Length Stride Length
PSR lt 047
047 lt PSR lt 053
PSR gt 053
r = -078 p lt 001
Balasubramanian et al 2007
ACTIVE propulsion generated by appropriately timed ankle power
PASSIVE propulsion generated by properly positioned foot COM posterior to the pelvic COM (larger horizontal portion of the red arrow)
Therefore emphasize hip extension
Mechanics of Propulsion and PSR
Clinical Usefulness
Beyond simply promoting symmetry PSR can be used to develop individual goals to train propulsive force production equalize bilateral biomechanical involvement by improving hip extension or promote paretic step initiation
ndash Longer paretic steps may be due to compensation by
greater non-paretic propulsion
ndash Weak relation with speed suggests compensatory strategies to attain functional speeds
ndash PSR may serve as a useful surrogate to assess propulsion during hemiparetic walking
bull These measures are capable of distinguishing ldquorecoveryrdquo from ldquocompensationrdquo
bull They also are capable of distinguishing motor control problems and provide critical information for treatment
BUT
Of what value is this measure to a clinician without biomechanical laboratory capabilities
-040
-030
-020
-010
000
010
020
030
1 7
13
19
25
31
37
43
49
55
61
67
73
79
85
91
97
Raw GRFs
Left leg
Right leg
-030
-020
-010
000
010
020
030
1 8
15
22
29
36
43
50
57
64
71
78
85
92
99
Summed GRFs
Summed GRFs
-030
-020
-010
000
010
020
030
1 8
15
22
29
36
43
50
57
64
71
78
85
92
99
Summed GRFs
Norm accel
GRFs vs Acceleration
CONTROL
-006
-004
-002
000
002
004
006
008
1 713
19
25
31
37
43
49
55
61
67
73
79
85
91
97
Paretic leg
Non paretic leg
Raw GRFs
-006
-004
-002
000
002
004
006
008
1 8
15
22
29
36
43
50
57
64
71
78
85
92
99
Summed GRF
summed GRF
-060
-040
-020
000
020
040
060
080
1 8
15
22
29
36
43
50
57
64
71
78
85
92
99
Normed GRFs
Acceleration
GRFs vs Acceleration
PERSON WITH STROKE
-15
-1
-05
0
05
1
15
1 9
17
25
33
41
49
57
65
73
81
89
97
Acc
ele
rati
on
in m
s2
Pre
Post
Control
Pre- and post-training accelerations of individuals participating in a
locomotor training intervention While COM acceleration increases it
does not approach normative values particularly in the critical phase 3 and 4
period of the gait cycle implying specific therapies need to target specific mechanistic elements of the walking pattern
-08
-06
-04
-02
0
02
04
06
CO
Ma
in m
s2
COMa before (blue line) and 2 minutes after (red line) incline training A
brief (5 minute) period of adaptation training yielded a 48 increase in both
peak COMa and the time integral of the COMa curve in phase 3 and 4 The x-axis represents percentage of the gait cycle
COMa as an outcome measure
bull segmental accelerations
bull studies into shock absorption
bull spatiotemporal gait parameters
bull control of stability
bull age-related changes in movement patterns
bull relating quantifiable movement patterns to falls
Portable applications
-06
-04
-02
0
02
04
06
Acc
ele
rati
on
in m
s2
Low PP
-06
-04
-02
0
02
04
06
Acc
ele
rati
on
in m
s2
Symmetrical
-06
-04
-02
0
02
04
06
Acc
ele
rati
on
in m
s2
High PP
Figure 6 COMa sorted by Pp Sorting by Pp yields three distinctly different acceleration profiles although the double support phase (shaded area) are similar in shape The low Pp
group (b) generates very little acceleration in the double support phase However the high Pp group (c) demonstrates only positive acceleration through the first half of the gait cycle while remaining negative throughout late double support and swing (Bowden Behrman et al In Press) The x-axes represent percentages of the gait cycle
a b c
COMa to diagnose motor control deficits
Examination of Power Training
JOINT POWER
P = moment times angular velocity P(+) = concentric (moments and velocity same direction) shortening contraction P(-) = eccentric (moments and velocity in opposite direction) lengthening contraction
A2
H3
H1
Gregory Bowden et al 2007
bull H1 (hip extension during initial stance) H3 (hip flexion during early swing) and A2 (ankle plantarflexion during late stance and pre-swing) all increased after therapy and the A2 and H3 bursts were significantly correlated with walking speed (Richards et al 2004)
bull Furthermore the A2 peak burst improvement was responsible for 25 of the gain in walking
bull Examining the interlimb coordination effects demonstrated that pre-training paretic A2 and H3 accounted for 84 of the variance in walking speed while post-training the non-paretic H3 replaces the paretic H3 to account for 82 of the post-training variance in patients that improved from 040 ms to 058 ms as a result of the intervention (Richards et al 2004)
Examination of Cardiovascular Status
bull Cardiorespiratory fitness is approximately 50 below age-matched controls
bull Decreased fitness combines with increased energetic demands to decrease efficiency
bull O2 use normalized to walking speed 50 higher bull Due to reduced peripheral muscle activation
change in fiber type reduced enzyme activities and altered hemodynamics
all responsive to exercise interventions
0
2
4
6
8
10
12
14
16
18
0 01 02 03 04 05 06 07
VO
2 (m
lk
gm
in)
Speed (ms)
bull Peak oxygen consumption (VO2) values in patients with stroke are below the level required for many basic activities of daily living (ADL)
bull Peak cardiovascular fitness
levels are roughly half those of age-matched individuals
bull Decreased CV fitness likely limits amount of walking thereby limiting daily physical activity and contributing to a downward spiral
ldquoStroke is a cardiac eventhelliprdquo Pam
Duncan
SS-50 SS-25 SS
SS+25 SS+50
SS-50
SS-25
SS SS+25 SS+50
01
02
03
04
05
06
07
08
O2
Eff (
mL
O2k
gm
)
Voluntary Fatigue
Cadence lt 40 rpm
Borg = 18
90 THR
Angina
HTN
Dyspnea
ST
segment
depression
Other
15
32
22
22
7
05
05
05
1 05
Hypotension
Courtesy of Dorian Rose PT PhD
Cardiovascular Fitness Functional Mobility
Examination of Dynamic Balance Control
Clinical Examinations
Dynamic COM vs COP
Weerdesteyn 2008
Balance Control
Treatment
bull Increase task complexity and difficulty (IRT example)
bull Athletic training
bull Intensity of training
bull Must know if people continue to fall
bull STILL evolving
Putting it All Together
Walking Performance
Motor Control
CV Fitness
Dynamic Balance Control
Strength
Results
bull The mobility group members improved their SMWT performance by an average of 35 m more than members of the UE group (95 CI 7 64)
bull Gait speed increases
ndash 011 ms_ss (95 CI 003 019) and 021 ms_fast (95 CI 12 030) faster than subjects in the UE group
bull TUG
ndash decreased 12 seconds in the intervention group (control increase by 17 seconds)
bull BBS No change (2 points to 1 point)
bull Later reports indicate an improvement in balancefalls efficacy
One therapy will NOT be the answer
Motor Control CV Status StrengthPower Dynamic Balance
Patient 1
Motor Control CV Status StrengthPower Dynamic Balance
Patient 3
Motor Control CV Status StrengthPower Dynamic Balance
Patient 2
Motor Control CV Status StrengthPower Dynamic Balance
Patient 4
Hypothetical future clinic
Overview - REVIEW
bull What is required for successful locomotor rehabilitation
ndash Systematic measurement
ndash Intensity
ndash Task specific practice
ndash Adherence to guiding principles
bull What does evidence-based practice tell us about locomotor rehabilitation
bull Where to go from here and what will future generations of therapeutic practice include
bull Guideline 1 Maximize weight bearing on the legs
bull Guideline 2 Afford the sensory experience consistent with walking
bull Guideline 3 Optimize kinematics for each motor task
bull Guideline 4 Maximize recovery and independence minimize compensation
LT Guidelines
hellipadded Guidelines
bull Systematic
bull Intensive
bull Progressive
bull Repetitive
bull Measure outcomes
hellipplus Plasticity
bull Use it or lose it
bull Use it and improve it
bull Specificity
bull Repetition matters
bull Intensity matters
bull Time matters
bull Salience matters
bull Age matters
bull Transference
bull Interference
Future directions
bull Evaluation to yield meaningful theory-based information to help guide clinical decision making
bull Classification to help guide treatment options
bull Understand ways to build on base therapy depending on impairments while being consistent with training guidelines
bull What tx for whom when in what combination with other tx
bull Clinic as a laboratory
Steve Kautz PhD
Mark George MD
Chris Gregory PhD PT
Aaron Embry DPT MSCR
Lindsay Perry DPT NCS
Patrick Morgan MS
This material is based upon work supported by the Office of Research and Development Rehabilitation Research and Development Department of Veterans Affairs Career Development-1 Award (Project B7177M Bowden PI) SCTR Discovery Pilot Grant (Kautz PI) AHA Innovative Research Grant (Kautz PI) and VA RRampD Merit Award B3983R (Kautz PI) The contents do not represent the views of the Department of Veterans Affairs or the United States Government
Thanks to all of my mentors collaborators and funding sources
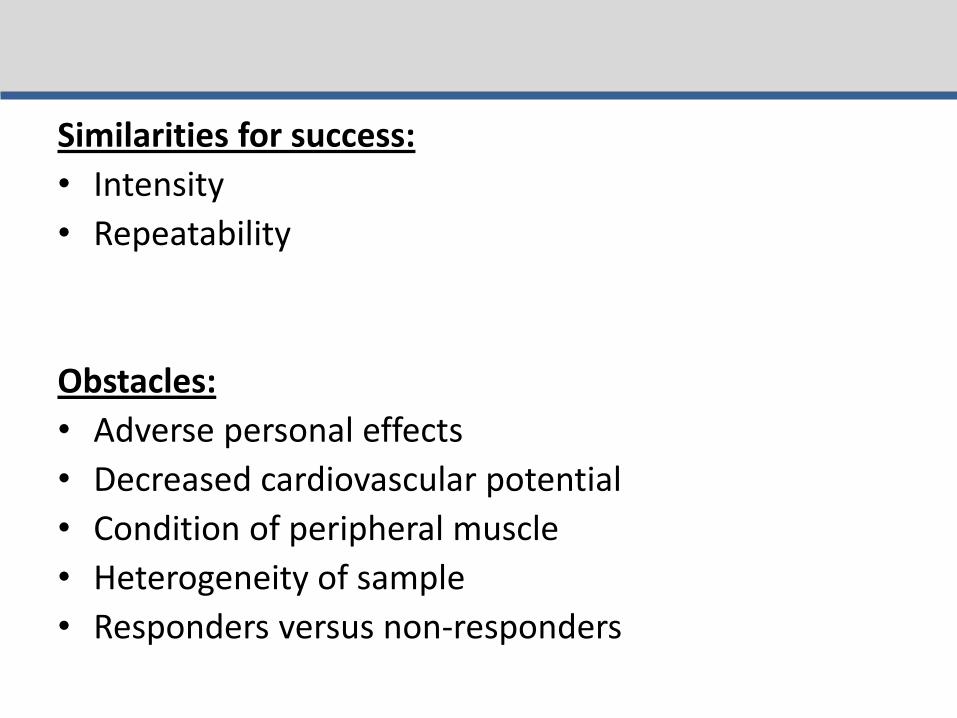

000
1000
2000
3000
4000
5000
6000
7000
8000
Pre Week1 Week2 Week3 Week4 Week5 Week6 Week7 Week8 Week9 Week10 Week11 Post
Self
-Se
lect
ed
Wal
kin
g Sp
ee
d (
cms
)
Mean Walking Speed
Responders versus Non-Responders
0
20
40
60
80
100
120
140
Pre Week1 Week2 Week3 Week4 Week5 Week6 Week7 Week8 Week9 Week10 Week11 Post
Self
-Se
lect
ed
Wal
kin
g Sp
ee
d (
cms
)
Individual Walking Speed
PL1
4
5
7
9
10
11
12
13
14
15
17
18
19
20
21
22
24
What does EBP tell us about current clinical decision making
ldquoPre-gaitrdquo Sequencing
Bridging
Kneeling
Sit-to-stand
Sitting Quadruped
Standing
Modified plantigrade
Half-kneeling
WALKING
Arch Phys Med Rehabil 1989 Oct70(10)755-62 Links Standing balance training effect on balance and locomotion in
hemiparetic adults Winstein CJ Gardner ER McNeal DR Barto PS Nicholson DE
Training symmetrical standing did not lead to symmetrical gait
performancehelliplocomotor pattern was only minimally affected by static balance exercises
Remember Hodgsonrsquos cats those trained to stand could stand
and not step while those trained to step could not stand
Standing = Walking What about BALANCE
Exp Brain Res 2006 Jun172(1)35-48 Epub 2006 Jan 24 Links A direct comparison of local dynamic stability during unperturbed standing and walking Kang HG Dingwell JB
bull Local dynamic stability properties were significantly different when comparing standing versus walking
bull COP divergence measures only significantly correlated with standing
TASK SPECIFICITY MATTERS
hellipBut is that all that matters
bull Strengthening and power training
bull Cardiovascular training
bull Dynamic balance training
bull Motor control training
Elements of Optimized Walking Programs
Advancing Locomotor Rehabilitation Measurement in Physical Therapy
Practice
bull Recovery versus compensation how can measurement distinguish the two
bull Physical performance vs mechanisms of response
bull How does your standardized ldquomeasurementrdquo help guide clinical decision making
Guiding Questions
Numeric Rating Scale (NRS)
The patient rates pain on a scale from 0 to 10
Questions regarding traditional ldquoMeasurementrdquo
1) Does improvement in a measure imply that the patient ldquorecoveredrdquo neuromotor function or simply more efficiently compensated for impaired underlying body functions
2) Does the measurement assist clinical decision making by differentiating between a variety of treatment options
Historically locomotor rehabilitation measurement has incorporated assessments using
1) rating scales
2) timed movement tasks
3) laboratory based outcomes
How may technological advances improve clinical measurement capabilities
Rating Scales
bull Often based on summary scores
ndash Lose individual item sensitivity
ndash Unable to measure subtle changes in control
bull Makes no comments on mechanisms
bull No information on recovery vs compensation or guiding of treatment plan
Timed Movement Tasks
bull Timed up and Go
bull 6 minute walk test (distance)
bull 10 meter walk test (speed)
Many many very positive elements of these tests
ndash Simple to measure
ndash Inexpensive
ndash Reliable and valid
ndash Sensitive
ndash Specific
Walking Speed ishellip
bull ldquohellipalmost the perfect measurerdquo (Wade 1992)
ndash Reliable (Richards 1996)
ndash Valid (Steffen 2002)
ndash Sensitive (van Iersel 2008)
ndash Specific (Harada1995)
ndash Correlates with
bull Functional ability (Perry1995)
bull Balance confidence (Mangione2007)
Walking Speed Predictive
ndash Future health status (Studenski
2003 Purser 2005)
ndash Functional decline (Brach 2002)
bull Hospitalization (Montero-Odasso
2005)
bull Discharge location (Salbach 2001
Rabadi 2005)
bull Mortality (Hardy 2007)
ndash Functional amp Physiological changes (Perry1995)
bull Potential for rehabilitation (Goldie 1996)
bull Aids in prediction of
ndash Falls (Guimaraes 1980)
ndash Fear of falling (Maki 1997)
Fritz S Lusardi M Clayton G Bird W Bidelpach D Duncan PW Gait the Sixth Vital Sign
Page 83
Suggested Way to Measure
HOWEVERhellip
Do these tests answer either of our two introductory questions regarding recovery and treatment planning
What is the role of a vital sign
Diagnostic Test
BP
Differential Exams Cholesterol Blood sugar
Adrenal gland fxn Thyroid fxn Kidney fxn
Diagnostic Test
Walking speed
Differential Exams
Gait Analysis
Laboratory Measures
Angles GRFs
Moments
0
0
tan
tan
inertiacediscontact
inertiacediscontact
MMM
FFF
IICOM
inertia
inertia
M
amF
I
COM
inertiaM
COM
inertiainertia
COMOO
inerrtia MFpM
S
contactT
T
TTTTTTTTTTT
TT
contact
F
contactS
S
SSSSSSSSSSS
SS
contact
F
F
FFFFFFFFFFF
FF
contact
MgmpampM
MgmpampM
GRMGRFCOPgmpampM
COMCOM
COMCOM
COMCOM
)())()()(()(
)())()()(()(
)())()()(()(
1
1
1
RIRIRR
RIRIRR
RIRIRR
S
contactTTT
T
contact
F
contactSSS
S
contact
FFF
F
contact
FgmamF
FgmamF
GRFgmamF
drsquoAlembert approach to inverse dynamics General laws of motion (sum forces sum moments)
General inertial forces and moments
NOTE
in general General (3 dimensional) Parallel Axis Theorem
Moments calculated at the proximal end of each segment
F S and T reflect the moment at proximal foot shank and thigh segments respectively Joint reaction forces
Laws of Motion
Spatiotemporal Analysis
Vastus
Medialis
Semi-
Membranosus
BREAK
bull Motor control training
bull Cardiovascular training
bull Strengthening and power training
bull Dynamic balance training
Elements of Optimized Walking Programs
Examination of Walking Specific Motor Control
Force vertical
Force anterior-posterior
Force medio-lateral
Ground Reaction Forces
Paretic Propulsion (Pp)
The percentage of total anterior GRF (propulsive) impulse generated by the paretic leg referred to as paretic propulsion (Pp) was calculated by dividing the propulsive impulse of the paretic leg by the sum of the paretic and non-paretic propulsive impulses
Pp =
+
0
50
100
1 2 3
Pp
(
)
Bowden et al 2006
bull Increased flexor activity in
preswing (eg TA and RF)
was correlated with
decreased paretic
propulsion
bull Increased plantarflexor
activity in late swing (eg
MG and SO) was correlated
with increased paretic
propulsion
Mechanisms of Response
Turns et al 2007
Extensor EMG Flexor EMG
What correlates with propulsion
bull PropulsionParetic cannot be measured in a conventional clinical setting without access to force plates
bull Step length asymmetry relates to propulsive forces generated by the legs
Paretic Step Ratio (PSR)
Stride Length
Paretic Step Length
PSR = Paretic Step Length Stride Length
PSR lt 047
047 lt PSR lt 053
PSR gt 053
r = -078 p lt 001
Balasubramanian et al 2007
ACTIVE propulsion generated by appropriately timed ankle power
PASSIVE propulsion generated by properly positioned foot COM posterior to the pelvic COM (larger horizontal portion of the red arrow)
Therefore emphasize hip extension
Mechanics of Propulsion and PSR
Clinical Usefulness
Beyond simply promoting symmetry PSR can be used to develop individual goals to train propulsive force production equalize bilateral biomechanical involvement by improving hip extension or promote paretic step initiation
ndash Longer paretic steps may be due to compensation by
greater non-paretic propulsion
ndash Weak relation with speed suggests compensatory strategies to attain functional speeds
ndash PSR may serve as a useful surrogate to assess propulsion during hemiparetic walking
bull These measures are capable of distinguishing ldquorecoveryrdquo from ldquocompensationrdquo
bull They also are capable of distinguishing motor control problems and provide critical information for treatment
BUT
Of what value is this measure to a clinician without biomechanical laboratory capabilities
-040
-030
-020
-010
000
010
020
030
1 7
13
19
25
31
37
43
49
55
61
67
73
79
85
91
97
Raw GRFs
Left leg
Right leg
-030
-020
-010
000
010
020
030
1 8
15
22
29
36
43
50
57
64
71
78
85
92
99
Summed GRFs
Summed GRFs
-030
-020
-010
000
010
020
030
1 8
15
22
29
36
43
50
57
64
71
78
85
92
99
Summed GRFs
Norm accel
GRFs vs Acceleration
CONTROL
-006
-004
-002
000
002
004
006
008
1 713
19
25
31
37
43
49
55
61
67
73
79
85
91
97
Paretic leg
Non paretic leg
Raw GRFs
-006
-004
-002
000
002
004
006
008
1 8
15
22
29
36
43
50
57
64
71
78
85
92
99
Summed GRF
summed GRF
-060
-040
-020
000
020
040
060
080
1 8
15
22
29
36
43
50
57
64
71
78
85
92
99
Normed GRFs
Acceleration
GRFs vs Acceleration
PERSON WITH STROKE
-15
-1
-05
0
05
1
15
1 9
17
25
33
41
49
57
65
73
81
89
97
Acc
ele
rati
on
in m
s2
Pre
Post
Control
Pre- and post-training accelerations of individuals participating in a
locomotor training intervention While COM acceleration increases it
does not approach normative values particularly in the critical phase 3 and 4
period of the gait cycle implying specific therapies need to target specific mechanistic elements of the walking pattern
-08
-06
-04
-02
0
02
04
06
CO
Ma
in m
s2
COMa before (blue line) and 2 minutes after (red line) incline training A
brief (5 minute) period of adaptation training yielded a 48 increase in both
peak COMa and the time integral of the COMa curve in phase 3 and 4 The x-axis represents percentage of the gait cycle
COMa as an outcome measure
bull segmental accelerations
bull studies into shock absorption
bull spatiotemporal gait parameters
bull control of stability
bull age-related changes in movement patterns
bull relating quantifiable movement patterns to falls
Portable applications
-06
-04
-02
0
02
04
06
Acc
ele
rati
on
in m
s2
Low PP
-06
-04
-02
0
02
04
06
Acc
ele
rati
on
in m
s2
Symmetrical
-06
-04
-02
0
02
04
06
Acc
ele
rati
on
in m
s2
High PP
Figure 6 COMa sorted by Pp Sorting by Pp yields three distinctly different acceleration profiles although the double support phase (shaded area) are similar in shape The low Pp
group (b) generates very little acceleration in the double support phase However the high Pp group (c) demonstrates only positive acceleration through the first half of the gait cycle while remaining negative throughout late double support and swing (Bowden Behrman et al In Press) The x-axes represent percentages of the gait cycle
a b c
COMa to diagnose motor control deficits
Examination of Power Training
JOINT POWER
P = moment times angular velocity P(+) = concentric (moments and velocity same direction) shortening contraction P(-) = eccentric (moments and velocity in opposite direction) lengthening contraction
A2
H3
H1
Gregory Bowden et al 2007
bull H1 (hip extension during initial stance) H3 (hip flexion during early swing) and A2 (ankle plantarflexion during late stance and pre-swing) all increased after therapy and the A2 and H3 bursts were significantly correlated with walking speed (Richards et al 2004)
bull Furthermore the A2 peak burst improvement was responsible for 25 of the gain in walking
bull Examining the interlimb coordination effects demonstrated that pre-training paretic A2 and H3 accounted for 84 of the variance in walking speed while post-training the non-paretic H3 replaces the paretic H3 to account for 82 of the post-training variance in patients that improved from 040 ms to 058 ms as a result of the intervention (Richards et al 2004)
Examination of Cardiovascular Status
bull Cardiorespiratory fitness is approximately 50 below age-matched controls
bull Decreased fitness combines with increased energetic demands to decrease efficiency
bull O2 use normalized to walking speed 50 higher bull Due to reduced peripheral muscle activation
change in fiber type reduced enzyme activities and altered hemodynamics
all responsive to exercise interventions
0
2
4
6
8
10
12
14
16
18
0 01 02 03 04 05 06 07
VO
2 (m
lk
gm
in)
Speed (ms)
bull Peak oxygen consumption (VO2) values in patients with stroke are below the level required for many basic activities of daily living (ADL)
bull Peak cardiovascular fitness
levels are roughly half those of age-matched individuals
bull Decreased CV fitness likely limits amount of walking thereby limiting daily physical activity and contributing to a downward spiral
ldquoStroke is a cardiac eventhelliprdquo Pam
Duncan
SS-50 SS-25 SS
SS+25 SS+50
SS-50
SS-25
SS SS+25 SS+50
01
02
03
04
05
06
07
08
O2
Eff (
mL
O2k
gm
)
Voluntary Fatigue
Cadence lt 40 rpm
Borg = 18
90 THR
Angina
HTN
Dyspnea
ST
segment
depression
Other
15
32
22
22
7
05
05
05
1 05
Hypotension
Courtesy of Dorian Rose PT PhD
Cardiovascular Fitness Functional Mobility
Examination of Dynamic Balance Control
Clinical Examinations
Dynamic COM vs COP
Weerdesteyn 2008
Balance Control
Treatment
bull Increase task complexity and difficulty (IRT example)
bull Athletic training
bull Intensity of training
bull Must know if people continue to fall
bull STILL evolving
Putting it All Together
Walking Performance
Motor Control
CV Fitness
Dynamic Balance Control
Strength
Results
bull The mobility group members improved their SMWT performance by an average of 35 m more than members of the UE group (95 CI 7 64)
bull Gait speed increases
ndash 011 ms_ss (95 CI 003 019) and 021 ms_fast (95 CI 12 030) faster than subjects in the UE group
bull TUG
ndash decreased 12 seconds in the intervention group (control increase by 17 seconds)
bull BBS No change (2 points to 1 point)
bull Later reports indicate an improvement in balancefalls efficacy
One therapy will NOT be the answer
Motor Control CV Status StrengthPower Dynamic Balance
Patient 1
Motor Control CV Status StrengthPower Dynamic Balance
Patient 3
Motor Control CV Status StrengthPower Dynamic Balance
Patient 2
Motor Control CV Status StrengthPower Dynamic Balance
Patient 4
Hypothetical future clinic
Overview - REVIEW
bull What is required for successful locomotor rehabilitation
ndash Systematic measurement
ndash Intensity
ndash Task specific practice
ndash Adherence to guiding principles
bull What does evidence-based practice tell us about locomotor rehabilitation
bull Where to go from here and what will future generations of therapeutic practice include
bull Guideline 1 Maximize weight bearing on the legs
bull Guideline 2 Afford the sensory experience consistent with walking
bull Guideline 3 Optimize kinematics for each motor task
bull Guideline 4 Maximize recovery and independence minimize compensation
LT Guidelines
hellipadded Guidelines
bull Systematic
bull Intensive
bull Progressive
bull Repetitive
bull Measure outcomes
hellipplus Plasticity
bull Use it or lose it
bull Use it and improve it
bull Specificity
bull Repetition matters
bull Intensity matters
bull Time matters
bull Salience matters
bull Age matters
bull Transference
bull Interference
Future directions
bull Evaluation to yield meaningful theory-based information to help guide clinical decision making
bull Classification to help guide treatment options
bull Understand ways to build on base therapy depending on impairments while being consistent with training guidelines
bull What tx for whom when in what combination with other tx
bull Clinic as a laboratory
Steve Kautz PhD
Mark George MD
Chris Gregory PhD PT
Aaron Embry DPT MSCR
Lindsay Perry DPT NCS
Patrick Morgan MS
This material is based upon work supported by the Office of Research and Development Rehabilitation Research and Development Department of Veterans Affairs Career Development-1 Award (Project B7177M Bowden PI) SCTR Discovery Pilot Grant (Kautz PI) AHA Innovative Research Grant (Kautz PI) and VA RRampD Merit Award B3983R (Kautz PI) The contents do not represent the views of the Department of Veterans Affairs or the United States Government
Thanks to all of my mentors collaborators and funding sources

0
20
40
60
80
100
120
140
Pre Week1 Week2 Week3 Week4 Week5 Week6 Week7 Week8 Week9 Week10 Week11 Post
Self
-Se
lect
ed
Wal
kin
g Sp
ee
d (
cms
)
Individual Walking Speed
PL1
4
5
7
9
10
11
12
13
14
15
17
18
19
20
21
22
24
What does EBP tell us about current clinical decision making
ldquoPre-gaitrdquo Sequencing
Bridging
Kneeling
Sit-to-stand
Sitting Quadruped
Standing
Modified plantigrade
Half-kneeling
WALKING
Arch Phys Med Rehabil 1989 Oct70(10)755-62 Links Standing balance training effect on balance and locomotion in
hemiparetic adults Winstein CJ Gardner ER McNeal DR Barto PS Nicholson DE
Training symmetrical standing did not lead to symmetrical gait
performancehelliplocomotor pattern was only minimally affected by static balance exercises
Remember Hodgsonrsquos cats those trained to stand could stand
and not step while those trained to step could not stand
Standing = Walking What about BALANCE
Exp Brain Res 2006 Jun172(1)35-48 Epub 2006 Jan 24 Links A direct comparison of local dynamic stability during unperturbed standing and walking Kang HG Dingwell JB
bull Local dynamic stability properties were significantly different when comparing standing versus walking
bull COP divergence measures only significantly correlated with standing
TASK SPECIFICITY MATTERS
hellipBut is that all that matters
bull Strengthening and power training
bull Cardiovascular training
bull Dynamic balance training
bull Motor control training
Elements of Optimized Walking Programs
Advancing Locomotor Rehabilitation Measurement in Physical Therapy
Practice
bull Recovery versus compensation how can measurement distinguish the two
bull Physical performance vs mechanisms of response
bull How does your standardized ldquomeasurementrdquo help guide clinical decision making
Guiding Questions
Numeric Rating Scale (NRS)
The patient rates pain on a scale from 0 to 10
Questions regarding traditional ldquoMeasurementrdquo
1) Does improvement in a measure imply that the patient ldquorecoveredrdquo neuromotor function or simply more efficiently compensated for impaired underlying body functions
2) Does the measurement assist clinical decision making by differentiating between a variety of treatment options
Historically locomotor rehabilitation measurement has incorporated assessments using
1) rating scales
2) timed movement tasks
3) laboratory based outcomes
How may technological advances improve clinical measurement capabilities
Rating Scales
bull Often based on summary scores
ndash Lose individual item sensitivity
ndash Unable to measure subtle changes in control
bull Makes no comments on mechanisms
bull No information on recovery vs compensation or guiding of treatment plan
Timed Movement Tasks
bull Timed up and Go
bull 6 minute walk test (distance)
bull 10 meter walk test (speed)
Many many very positive elements of these tests
ndash Simple to measure
ndash Inexpensive
ndash Reliable and valid
ndash Sensitive
ndash Specific
Walking Speed ishellip
bull ldquohellipalmost the perfect measurerdquo (Wade 1992)
ndash Reliable (Richards 1996)
ndash Valid (Steffen 2002)
ndash Sensitive (van Iersel 2008)
ndash Specific (Harada1995)
ndash Correlates with
bull Functional ability (Perry1995)
bull Balance confidence (Mangione2007)
Walking Speed Predictive
ndash Future health status (Studenski
2003 Purser 2005)
ndash Functional decline (Brach 2002)
bull Hospitalization (Montero-Odasso
2005)
bull Discharge location (Salbach 2001
Rabadi 2005)
bull Mortality (Hardy 2007)
ndash Functional amp Physiological changes (Perry1995)
bull Potential for rehabilitation (Goldie 1996)
bull Aids in prediction of
ndash Falls (Guimaraes 1980)
ndash Fear of falling (Maki 1997)
Fritz S Lusardi M Clayton G Bird W Bidelpach D Duncan PW Gait the Sixth Vital Sign
Page 83
Suggested Way to Measure
HOWEVERhellip
Do these tests answer either of our two introductory questions regarding recovery and treatment planning
What is the role of a vital sign
Diagnostic Test
BP
Differential Exams Cholesterol Blood sugar
Adrenal gland fxn Thyroid fxn Kidney fxn
Diagnostic Test
Walking speed
Differential Exams
Gait Analysis
Laboratory Measures
Angles GRFs
Moments
0
0
tan
tan
inertiacediscontact
inertiacediscontact
MMM
FFF
IICOM
inertia
inertia
M
amF
I
COM
inertiaM
COM
inertiainertia
COMOO
inerrtia MFpM
S
contactT
T
TTTTTTTTTTT
TT
contact
F
contactS
S
SSSSSSSSSSS
SS
contact
F
F
FFFFFFFFFFF
FF
contact
MgmpampM
MgmpampM
GRMGRFCOPgmpampM
COMCOM
COMCOM
COMCOM
)())()()(()(
)())()()(()(
)())()()(()(
1
1
1
RIRIRR
RIRIRR
RIRIRR
S
contactTTT
T
contact
F
contactSSS
S
contact
FFF
F
contact
FgmamF
FgmamF
GRFgmamF
drsquoAlembert approach to inverse dynamics General laws of motion (sum forces sum moments)
General inertial forces and moments
NOTE
in general General (3 dimensional) Parallel Axis Theorem
Moments calculated at the proximal end of each segment
F S and T reflect the moment at proximal foot shank and thigh segments respectively Joint reaction forces
Laws of Motion
Spatiotemporal Analysis
Vastus
Medialis
Semi-
Membranosus
BREAK
bull Motor control training
bull Cardiovascular training
bull Strengthening and power training
bull Dynamic balance training
Elements of Optimized Walking Programs
Examination of Walking Specific Motor Control
Force vertical
Force anterior-posterior
Force medio-lateral
Ground Reaction Forces
Paretic Propulsion (Pp)
The percentage of total anterior GRF (propulsive) impulse generated by the paretic leg referred to as paretic propulsion (Pp) was calculated by dividing the propulsive impulse of the paretic leg by the sum of the paretic and non-paretic propulsive impulses
Pp =
+
0
50
100
1 2 3
Pp
(
)
Bowden et al 2006
bull Increased flexor activity in
preswing (eg TA and RF)
was correlated with
decreased paretic
propulsion
bull Increased plantarflexor
activity in late swing (eg
MG and SO) was correlated
with increased paretic
propulsion
Mechanisms of Response
Turns et al 2007
Extensor EMG Flexor EMG
What correlates with propulsion
bull PropulsionParetic cannot be measured in a conventional clinical setting without access to force plates
bull Step length asymmetry relates to propulsive forces generated by the legs
Paretic Step Ratio (PSR)
Stride Length
Paretic Step Length
PSR = Paretic Step Length Stride Length
PSR lt 047
047 lt PSR lt 053
PSR gt 053
r = -078 p lt 001
Balasubramanian et al 2007
ACTIVE propulsion generated by appropriately timed ankle power
PASSIVE propulsion generated by properly positioned foot COM posterior to the pelvic COM (larger horizontal portion of the red arrow)
Therefore emphasize hip extension
Mechanics of Propulsion and PSR
Clinical Usefulness
Beyond simply promoting symmetry PSR can be used to develop individual goals to train propulsive force production equalize bilateral biomechanical involvement by improving hip extension or promote paretic step initiation
ndash Longer paretic steps may be due to compensation by
greater non-paretic propulsion
ndash Weak relation with speed suggests compensatory strategies to attain functional speeds
ndash PSR may serve as a useful surrogate to assess propulsion during hemiparetic walking
bull These measures are capable of distinguishing ldquorecoveryrdquo from ldquocompensationrdquo
bull They also are capable of distinguishing motor control problems and provide critical information for treatment
BUT
Of what value is this measure to a clinician without biomechanical laboratory capabilities
-040
-030
-020
-010
000
010
020
030
1 7
13
19
25
31
37
43
49
55
61
67
73
79
85
91
97
Raw GRFs
Left leg
Right leg
-030
-020
-010
000
010
020
030
1 8
15
22
29
36
43
50
57
64
71
78
85
92
99
Summed GRFs
Summed GRFs
-030
-020
-010
000
010
020
030
1 8
15
22
29
36
43
50
57
64
71
78
85
92
99
Summed GRFs
Norm accel
GRFs vs Acceleration
CONTROL
-006
-004
-002
000
002
004
006
008
1 713
19
25
31
37
43
49
55
61
67
73
79
85
91
97
Paretic leg
Non paretic leg
Raw GRFs
-006
-004
-002
000
002
004
006
008
1 8
15
22
29
36
43
50
57
64
71
78
85
92
99
Summed GRF
summed GRF
-060
-040
-020
000
020
040
060
080
1 8
15
22
29
36
43
50
57
64
71
78
85
92
99
Normed GRFs
Acceleration
GRFs vs Acceleration
PERSON WITH STROKE
-15
-1
-05
0
05
1
15
1 9
17
25
33
41
49
57
65
73
81
89
97
Acc
ele
rati
on
in m
s2
Pre
Post
Control
Pre- and post-training accelerations of individuals participating in a
locomotor training intervention While COM acceleration increases it
does not approach normative values particularly in the critical phase 3 and 4
period of the gait cycle implying specific therapies need to target specific mechanistic elements of the walking pattern
-08
-06
-04
-02
0
02
04
06
CO
Ma
in m
s2
COMa before (blue line) and 2 minutes after (red line) incline training A
brief (5 minute) period of adaptation training yielded a 48 increase in both
peak COMa and the time integral of the COMa curve in phase 3 and 4 The x-axis represents percentage of the gait cycle
COMa as an outcome measure
bull segmental accelerations
bull studies into shock absorption
bull spatiotemporal gait parameters
bull control of stability
bull age-related changes in movement patterns
bull relating quantifiable movement patterns to falls
Portable applications
-06
-04
-02
0
02
04
06
Acc
ele
rati
on
in m
s2
Low PP
-06
-04
-02
0
02
04
06
Acc
ele
rati
on
in m
s2
Symmetrical
-06
-04
-02
0
02
04
06
Acc
ele
rati
on
in m
s2
High PP
Figure 6 COMa sorted by Pp Sorting by Pp yields three distinctly different acceleration profiles although the double support phase (shaded area) are similar in shape The low Pp
group (b) generates very little acceleration in the double support phase However the high Pp group (c) demonstrates only positive acceleration through the first half of the gait cycle while remaining negative throughout late double support and swing (Bowden Behrman et al In Press) The x-axes represent percentages of the gait cycle
a b c
COMa to diagnose motor control deficits
Examination of Power Training
JOINT POWER
P = moment times angular velocity P(+) = concentric (moments and velocity same direction) shortening contraction P(-) = eccentric (moments and velocity in opposite direction) lengthening contraction
A2
H3
H1
Gregory Bowden et al 2007
bull H1 (hip extension during initial stance) H3 (hip flexion during early swing) and A2 (ankle plantarflexion during late stance and pre-swing) all increased after therapy and the A2 and H3 bursts were significantly correlated with walking speed (Richards et al 2004)
bull Furthermore the A2 peak burst improvement was responsible for 25 of the gain in walking
bull Examining the interlimb coordination effects demonstrated that pre-training paretic A2 and H3 accounted for 84 of the variance in walking speed while post-training the non-paretic H3 replaces the paretic H3 to account for 82 of the post-training variance in patients that improved from 040 ms to 058 ms as a result of the intervention (Richards et al 2004)
Examination of Cardiovascular Status
bull Cardiorespiratory fitness is approximately 50 below age-matched controls
bull Decreased fitness combines with increased energetic demands to decrease efficiency
bull O2 use normalized to walking speed 50 higher bull Due to reduced peripheral muscle activation
change in fiber type reduced enzyme activities and altered hemodynamics
all responsive to exercise interventions
0
2
4
6
8
10
12
14
16
18
0 01 02 03 04 05 06 07
VO
2 (m
lk
gm
in)
Speed (ms)
bull Peak oxygen consumption (VO2) values in patients with stroke are below the level required for many basic activities of daily living (ADL)
bull Peak cardiovascular fitness
levels are roughly half those of age-matched individuals
bull Decreased CV fitness likely limits amount of walking thereby limiting daily physical activity and contributing to a downward spiral
ldquoStroke is a cardiac eventhelliprdquo Pam
Duncan
SS-50 SS-25 SS
SS+25 SS+50
SS-50
SS-25
SS SS+25 SS+50
01
02
03
04
05
06
07
08
O2
Eff (
mL
O2k
gm
)
Voluntary Fatigue
Cadence lt 40 rpm
Borg = 18
90 THR
Angina
HTN
Dyspnea
ST
segment
depression
Other
15
32
22
22
7
05
05
05
1 05
Hypotension
Courtesy of Dorian Rose PT PhD
Cardiovascular Fitness Functional Mobility
Examination of Dynamic Balance Control
Clinical Examinations
Dynamic COM vs COP
Weerdesteyn 2008
Balance Control
Treatment
bull Increase task complexity and difficulty (IRT example)
bull Athletic training
bull Intensity of training
bull Must know if people continue to fall
bull STILL evolving
Putting it All Together
Walking Performance
Motor Control
CV Fitness
Dynamic Balance Control
Strength
Results
bull The mobility group members improved their SMWT performance by an average of 35 m more than members of the UE group (95 CI 7 64)
bull Gait speed increases
ndash 011 ms_ss (95 CI 003 019) and 021 ms_fast (95 CI 12 030) faster than subjects in the UE group
bull TUG
ndash decreased 12 seconds in the intervention group (control increase by 17 seconds)
bull BBS No change (2 points to 1 point)
bull Later reports indicate an improvement in balancefalls efficacy
One therapy will NOT be the answer
Motor Control CV Status StrengthPower Dynamic Balance
Patient 1
Motor Control CV Status StrengthPower Dynamic Balance
Patient 3
Motor Control CV Status StrengthPower Dynamic Balance
Patient 2
Motor Control CV Status StrengthPower Dynamic Balance
Patient 4
Hypothetical future clinic
Overview - REVIEW
bull What is required for successful locomotor rehabilitation
ndash Systematic measurement
ndash Intensity
ndash Task specific practice
ndash Adherence to guiding principles
bull What does evidence-based practice tell us about locomotor rehabilitation
bull Where to go from here and what will future generations of therapeutic practice include
bull Guideline 1 Maximize weight bearing on the legs
bull Guideline 2 Afford the sensory experience consistent with walking
bull Guideline 3 Optimize kinematics for each motor task
bull Guideline 4 Maximize recovery and independence minimize compensation
LT Guidelines
hellipadded Guidelines
bull Systematic
bull Intensive
bull Progressive
bull Repetitive
bull Measure outcomes
hellipplus Plasticity
bull Use it or lose it
bull Use it and improve it
bull Specificity
bull Repetition matters
bull Intensity matters
bull Time matters
bull Salience matters
bull Age matters
bull Transference
bull Interference
Future directions
bull Evaluation to yield meaningful theory-based information to help guide clinical decision making
bull Classification to help guide treatment options
bull Understand ways to build on base therapy depending on impairments while being consistent with training guidelines
bull What tx for whom when in what combination with other tx
bull Clinic as a laboratory
Steve Kautz PhD
Mark George MD
Chris Gregory PhD PT
Aaron Embry DPT MSCR
Lindsay Perry DPT NCS
Patrick Morgan MS
This material is based upon work supported by the Office of Research and Development Rehabilitation Research and Development Department of Veterans Affairs Career Development-1 Award (Project B7177M Bowden PI) SCTR Discovery Pilot Grant (Kautz PI) AHA Innovative Research Grant (Kautz PI) and VA RRampD Merit Award B3983R (Kautz PI) The contents do not represent the views of the Department of Veterans Affairs or the United States Government
Thanks to all of my mentors collaborators and funding sources

bull Strengthening and power training
bull Cardiovascular training
bull Dynamic balance training
bull Motor control training
Elements of Optimized Walking Programs
Advancing Locomotor Rehabilitation Measurement in Physical Therapy
Practice
bull Recovery versus compensation how can measurement distinguish the two
bull Physical performance vs mechanisms of response
bull How does your standardized ldquomeasurementrdquo help guide clinical decision making
Guiding Questions
Numeric Rating Scale (NRS)
The patient rates pain on a scale from 0 to 10
Questions regarding traditional ldquoMeasurementrdquo
1) Does improvement in a measure imply that the patient ldquorecoveredrdquo neuromotor function or simply more efficiently compensated for impaired underlying body functions
2) Does the measurement assist clinical decision making by differentiating between a variety of treatment options
Historically locomotor rehabilitation measurement has incorporated assessments using
1) rating scales
2) timed movement tasks
3) laboratory based outcomes
How may technological advances improve clinical measurement capabilities
Rating Scales
bull Often based on summary scores
ndash Lose individual item sensitivity
ndash Unable to measure subtle changes in control
bull Makes no comments on mechanisms
bull No information on recovery vs compensation or guiding of treatment plan
Timed Movement Tasks
bull Timed up and Go
bull 6 minute walk test (distance)
bull 10 meter walk test (speed)
Many many very positive elements of these tests
ndash Simple to measure
ndash Inexpensive
ndash Reliable and valid
ndash Sensitive
ndash Specific
Walking Speed ishellip
bull ldquohellipalmost the perfect measurerdquo (Wade 1992)
ndash Reliable (Richards 1996)
ndash Valid (Steffen 2002)
ndash Sensitive (van Iersel 2008)
ndash Specific (Harada1995)
ndash Correlates with
bull Functional ability (Perry1995)
bull Balance confidence (Mangione2007)
Walking Speed Predictive
ndash Future health status (Studenski
2003 Purser 2005)
ndash Functional decline (Brach 2002)
bull Hospitalization (Montero-Odasso
2005)
bull Discharge location (Salbach 2001
Rabadi 2005)
bull Mortality (Hardy 2007)
ndash Functional amp Physiological changes (Perry1995)
bull Potential for rehabilitation (Goldie 1996)
bull Aids in prediction of
ndash Falls (Guimaraes 1980)
ndash Fear of falling (Maki 1997)
Fritz S Lusardi M Clayton G Bird W Bidelpach D Duncan PW Gait the Sixth Vital Sign
Page 83
Suggested Way to Measure
HOWEVERhellip
Do these tests answer either of our two introductory questions regarding recovery and treatment planning
What is the role of a vital sign
Diagnostic Test
BP
Differential Exams Cholesterol Blood sugar
Adrenal gland fxn Thyroid fxn Kidney fxn
Diagnostic Test
Walking speed
Differential Exams
Gait Analysis
Laboratory Measures
Angles GRFs
Moments
0
0
tan
tan
inertiacediscontact
inertiacediscontact
MMM
FFF
IICOM
inertia
inertia
M
amF
I
COM
inertiaM
COM
inertiainertia
COMOO
inerrtia MFpM
S
contactT
T
TTTTTTTTTTT
TT
contact
F
contactS
S
SSSSSSSSSSS
SS
contact
F
F
FFFFFFFFFFF
FF
contact
MgmpampM
MgmpampM
GRMGRFCOPgmpampM
COMCOM
COMCOM
COMCOM
)())()()(()(
)())()()(()(
)())()()(()(
1
1
1
RIRIRR
RIRIRR
RIRIRR
S
contactTTT
T
contact
F
contactSSS
S
contact
FFF
F
contact
FgmamF
FgmamF
GRFgmamF
drsquoAlembert approach to inverse dynamics General laws of motion (sum forces sum moments)
General inertial forces and moments
NOTE
in general General (3 dimensional) Parallel Axis Theorem
Moments calculated at the proximal end of each segment
F S and T reflect the moment at proximal foot shank and thigh segments respectively Joint reaction forces
Laws of Motion
Spatiotemporal Analysis
Vastus
Medialis
Semi-
Membranosus
BREAK
bull Motor control training
bull Cardiovascular training
bull Strengthening and power training
bull Dynamic balance training
Elements of Optimized Walking Programs
Examination of Walking Specific Motor Control
Force vertical
Force anterior-posterior
Force medio-lateral
Ground Reaction Forces
Paretic Propulsion (Pp)
The percentage of total anterior GRF (propulsive) impulse generated by the paretic leg referred to as paretic propulsion (Pp) was calculated by dividing the propulsive impulse of the paretic leg by the sum of the paretic and non-paretic propulsive impulses
Pp =
+
0
50
100
1 2 3
Pp
(
)
Bowden et al 2006
bull Increased flexor activity in
preswing (eg TA and RF)
was correlated with
decreased paretic
propulsion
bull Increased plantarflexor
activity in late swing (eg
MG and SO) was correlated
with increased paretic
propulsion
Mechanisms of Response
Turns et al 2007
Extensor EMG Flexor EMG
What correlates with propulsion
bull PropulsionParetic cannot be measured in a conventional clinical setting without access to force plates
bull Step length asymmetry relates to propulsive forces generated by the legs
Paretic Step Ratio (PSR)
Stride Length
Paretic Step Length
PSR = Paretic Step Length Stride Length
PSR lt 047
047 lt PSR lt 053
PSR gt 053
r = -078 p lt 001
Balasubramanian et al 2007
ACTIVE propulsion generated by appropriately timed ankle power
PASSIVE propulsion generated by properly positioned foot COM posterior to the pelvic COM (larger horizontal portion of the red arrow)
Therefore emphasize hip extension
Mechanics of Propulsion and PSR
Clinical Usefulness
Beyond simply promoting symmetry PSR can be used to develop individual goals to train propulsive force production equalize bilateral biomechanical involvement by improving hip extension or promote paretic step initiation
ndash Longer paretic steps may be due to compensation by
greater non-paretic propulsion
ndash Weak relation with speed suggests compensatory strategies to attain functional speeds
ndash PSR may serve as a useful surrogate to assess propulsion during hemiparetic walking
bull These measures are capable of distinguishing ldquorecoveryrdquo from ldquocompensationrdquo
bull They also are capable of distinguishing motor control problems and provide critical information for treatment
BUT
Of what value is this measure to a clinician without biomechanical laboratory capabilities
-040
-030
-020
-010
000
010
020
030
1 7
13
19
25
31
37
43
49
55
61
67
73
79
85
91
97
Raw GRFs
Left leg
Right leg
-030
-020
-010
000
010
020
030
1 8
15
22
29
36
43
50
57
64
71
78
85
92
99
Summed GRFs
Summed GRFs
-030
-020
-010
000
010
020
030
1 8
15
22
29
36
43
50
57
64
71
78
85
92
99
Summed GRFs
Norm accel
GRFs vs Acceleration
CONTROL
-006
-004
-002
000
002
004
006
008
1 713
19
25
31
37
43
49
55
61
67
73
79
85
91
97
Paretic leg
Non paretic leg
Raw GRFs
-006
-004
-002
000
002
004
006
008
1 8
15
22
29
36
43
50
57
64
71
78
85
92
99
Summed GRF
summed GRF
-060
-040
-020
000
020
040
060
080
1 8
15
22
29
36
43
50
57
64
71
78
85
92
99
Normed GRFs
Acceleration
GRFs vs Acceleration
PERSON WITH STROKE
-15
-1
-05
0
05
1
15
1 9
17
25
33
41
49
57
65
73
81
89
97
Acc
ele
rati
on
in m
s2
Pre
Post
Control
Pre- and post-training accelerations of individuals participating in a
locomotor training intervention While COM acceleration increases it
does not approach normative values particularly in the critical phase 3 and 4
period of the gait cycle implying specific therapies need to target specific mechanistic elements of the walking pattern
-08
-06
-04
-02
0
02
04
06
CO
Ma
in m
s2
COMa before (blue line) and 2 minutes after (red line) incline training A
brief (5 minute) period of adaptation training yielded a 48 increase in both
peak COMa and the time integral of the COMa curve in phase 3 and 4 The x-axis represents percentage of the gait cycle
COMa as an outcome measure
bull segmental accelerations
bull studies into shock absorption
bull spatiotemporal gait parameters
bull control of stability
bull age-related changes in movement patterns
bull relating quantifiable movement patterns to falls
Portable applications
-06
-04
-02
0
02
04
06
Acc
ele
rati
on
in m
s2
Low PP
-06
-04
-02
0
02
04
06
Acc
ele
rati
on
in m
s2
Symmetrical
-06
-04
-02
0
02
04
06
Acc
ele
rati
on
in m
s2
High PP
Figure 6 COMa sorted by Pp Sorting by Pp yields three distinctly different acceleration profiles although the double support phase (shaded area) are similar in shape The low Pp
group (b) generates very little acceleration in the double support phase However the high Pp group (c) demonstrates only positive acceleration through the first half of the gait cycle while remaining negative throughout late double support and swing (Bowden Behrman et al In Press) The x-axes represent percentages of the gait cycle
a b c
COMa to diagnose motor control deficits
Examination of Power Training
JOINT POWER
P = moment times angular velocity P(+) = concentric (moments and velocity same direction) shortening contraction P(-) = eccentric (moments and velocity in opposite direction) lengthening contraction
A2
H3
H1
Gregory Bowden et al 2007
bull H1 (hip extension during initial stance) H3 (hip flexion during early swing) and A2 (ankle plantarflexion during late stance and pre-swing) all increased after therapy and the A2 and H3 bursts were significantly correlated with walking speed (Richards et al 2004)
bull Furthermore the A2 peak burst improvement was responsible for 25 of the gain in walking
bull Examining the interlimb coordination effects demonstrated that pre-training paretic A2 and H3 accounted for 84 of the variance in walking speed while post-training the non-paretic H3 replaces the paretic H3 to account for 82 of the post-training variance in patients that improved from 040 ms to 058 ms as a result of the intervention (Richards et al 2004)
Examination of Cardiovascular Status
bull Cardiorespiratory fitness is approximately 50 below age-matched controls
bull Decreased fitness combines with increased energetic demands to decrease efficiency
bull O2 use normalized to walking speed 50 higher bull Due to reduced peripheral muscle activation
change in fiber type reduced enzyme activities and altered hemodynamics
all responsive to exercise interventions
0
2
4
6
8
10
12
14
16
18
0 01 02 03 04 05 06 07
VO
2 (m
lk
gm
in)
Speed (ms)
bull Peak oxygen consumption (VO2) values in patients with stroke are below the level required for many basic activities of daily living (ADL)
bull Peak cardiovascular fitness
levels are roughly half those of age-matched individuals
bull Decreased CV fitness likely limits amount of walking thereby limiting daily physical activity and contributing to a downward spiral
ldquoStroke is a cardiac eventhelliprdquo Pam
Duncan
SS-50 SS-25 SS
SS+25 SS+50
SS-50
SS-25
SS SS+25 SS+50
01
02
03
04
05
06
07
08
O2
Eff (
mL
O2k
gm
)
Voluntary Fatigue
Cadence lt 40 rpm
Borg = 18
90 THR
Angina
HTN
Dyspnea
ST
segment
depression
Other
15
32
22
22
7
05
05
05
1 05
Hypotension
Courtesy of Dorian Rose PT PhD
Cardiovascular Fitness Functional Mobility
Examination of Dynamic Balance Control
Clinical Examinations
Dynamic COM vs COP
Weerdesteyn 2008
Balance Control
Treatment
bull Increase task complexity and difficulty (IRT example)
bull Athletic training
bull Intensity of training
bull Must know if people continue to fall
bull STILL evolving
Putting it All Together
Walking Performance
Motor Control
CV Fitness
Dynamic Balance Control
Strength
Results
bull The mobility group members improved their SMWT performance by an average of 35 m more than members of the UE group (95 CI 7 64)
bull Gait speed increases
ndash 011 ms_ss (95 CI 003 019) and 021 ms_fast (95 CI 12 030) faster than subjects in the UE group
bull TUG
ndash decreased 12 seconds in the intervention group (control increase by 17 seconds)
bull BBS No change (2 points to 1 point)
bull Later reports indicate an improvement in balancefalls efficacy
One therapy will NOT be the answer
Motor Control CV Status StrengthPower Dynamic Balance
Patient 1
Motor Control CV Status StrengthPower Dynamic Balance
Patient 3
Motor Control CV Status StrengthPower Dynamic Balance
Patient 2
Motor Control CV Status StrengthPower Dynamic Balance
Patient 4
Hypothetical future clinic
Overview - REVIEW
bull What is required for successful locomotor rehabilitation
ndash Systematic measurement
ndash Intensity
ndash Task specific practice
ndash Adherence to guiding principles
bull What does evidence-based practice tell us about locomotor rehabilitation
bull Where to go from here and what will future generations of therapeutic practice include
bull Guideline 1 Maximize weight bearing on the legs
bull Guideline 2 Afford the sensory experience consistent with walking
bull Guideline 3 Optimize kinematics for each motor task
bull Guideline 4 Maximize recovery and independence minimize compensation
LT Guidelines
hellipadded Guidelines
bull Systematic
bull Intensive
bull Progressive
bull Repetitive
bull Measure outcomes
hellipplus Plasticity
bull Use it or lose it
bull Use it and improve it
bull Specificity
bull Repetition matters
bull Intensity matters
bull Time matters
bull Salience matters
bull Age matters
bull Transference
bull Interference
Future directions
bull Evaluation to yield meaningful theory-based information to help guide clinical decision making
bull Classification to help guide treatment options
bull Understand ways to build on base therapy depending on impairments while being consistent with training guidelines
bull What tx for whom when in what combination with other tx
bull Clinic as a laboratory
Steve Kautz PhD
Mark George MD
Chris Gregory PhD PT
Aaron Embry DPT MSCR
Lindsay Perry DPT NCS
Patrick Morgan MS
This material is based upon work supported by the Office of Research and Development Rehabilitation Research and Development Department of Veterans Affairs Career Development-1 Award (Project B7177M Bowden PI) SCTR Discovery Pilot Grant (Kautz PI) AHA Innovative Research Grant (Kautz PI) and VA RRampD Merit Award B3983R (Kautz PI) The contents do not represent the views of the Department of Veterans Affairs or the United States Government
Thanks to all of my mentors collaborators and funding sources
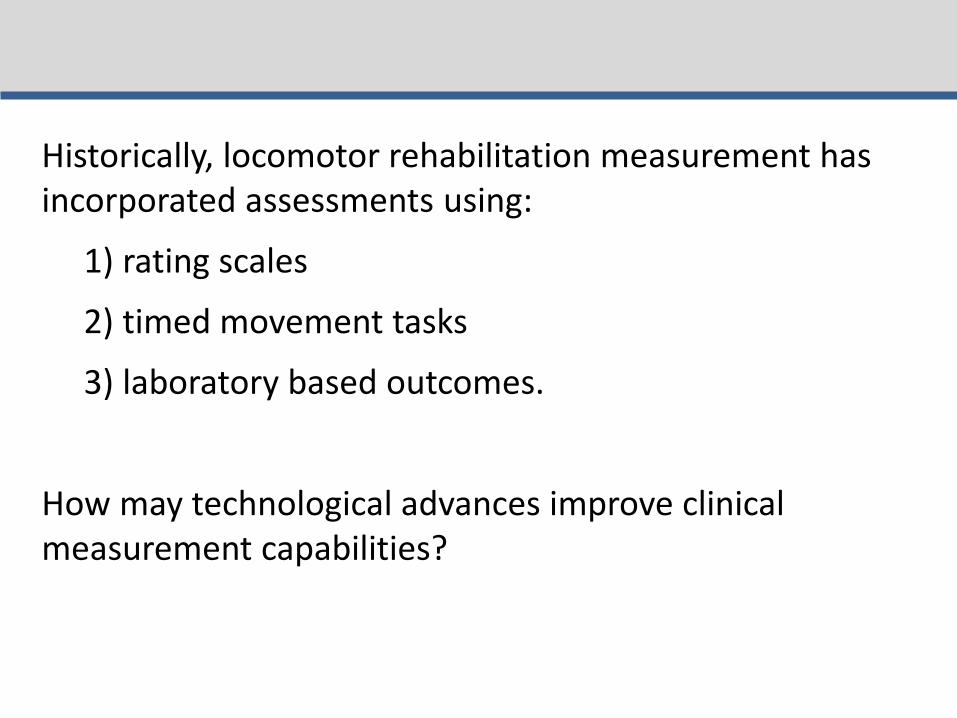

Diagnostic Test
BP
Differential Exams Cholesterol Blood sugar
Adrenal gland fxn Thyroid fxn Kidney fxn
Diagnostic Test
Walking speed
Differential Exams
Gait Analysis
Laboratory Measures
Angles GRFs
Moments
0
0
tan
tan
inertiacediscontact
inertiacediscontact
MMM
FFF
IICOM
inertia
inertia
M
amF
I
COM
inertiaM
COM
inertiainertia
COMOO
inerrtia MFpM
S
contactT
T
TTTTTTTTTTT
TT
contact
F
contactS
S
SSSSSSSSSSS
SS
contact
F
F
FFFFFFFFFFF
FF
contact
MgmpampM
MgmpampM
GRMGRFCOPgmpampM
COMCOM
COMCOM
COMCOM
)())()()(()(
)())()()(()(
)())()()(()(
1
1
1
RIRIRR
RIRIRR
RIRIRR
S
contactTTT
T
contact
F
contactSSS
S
contact
FFF
F
contact
FgmamF
FgmamF
GRFgmamF
drsquoAlembert approach to inverse dynamics General laws of motion (sum forces sum moments)
General inertial forces and moments
NOTE
in general General (3 dimensional) Parallel Axis Theorem
Moments calculated at the proximal end of each segment
F S and T reflect the moment at proximal foot shank and thigh segments respectively Joint reaction forces
Laws of Motion
Spatiotemporal Analysis
Vastus
Medialis
Semi-
Membranosus
BREAK
bull Motor control training
bull Cardiovascular training
bull Strengthening and power training
bull Dynamic balance training
Elements of Optimized Walking Programs
Examination of Walking Specific Motor Control
Force vertical
Force anterior-posterior
Force medio-lateral
Ground Reaction Forces
Paretic Propulsion (Pp)
The percentage of total anterior GRF (propulsive) impulse generated by the paretic leg referred to as paretic propulsion (Pp) was calculated by dividing the propulsive impulse of the paretic leg by the sum of the paretic and non-paretic propulsive impulses
Pp =
+
0
50
100
1 2 3
Pp
(
)
Bowden et al 2006
bull Increased flexor activity in
preswing (eg TA and RF)
was correlated with
decreased paretic
propulsion
bull Increased plantarflexor
activity in late swing (eg
MG and SO) was correlated
with increased paretic
propulsion
Mechanisms of Response
Turns et al 2007
Extensor EMG Flexor EMG
What correlates with propulsion
bull PropulsionParetic cannot be measured in a conventional clinical setting without access to force plates
bull Step length asymmetry relates to propulsive forces generated by the legs
Paretic Step Ratio (PSR)
Stride Length
Paretic Step Length
PSR = Paretic Step Length Stride Length
PSR lt 047
047 lt PSR lt 053
PSR gt 053
r = -078 p lt 001
Balasubramanian et al 2007
ACTIVE propulsion generated by appropriately timed ankle power
PASSIVE propulsion generated by properly positioned foot COM posterior to the pelvic COM (larger horizontal portion of the red arrow)
Therefore emphasize hip extension
Mechanics of Propulsion and PSR
Clinical Usefulness
Beyond simply promoting symmetry PSR can be used to develop individual goals to train propulsive force production equalize bilateral biomechanical involvement by improving hip extension or promote paretic step initiation
ndash Longer paretic steps may be due to compensation by
greater non-paretic propulsion
ndash Weak relation with speed suggests compensatory strategies to attain functional speeds
ndash PSR may serve as a useful surrogate to assess propulsion during hemiparetic walking
bull These measures are capable of distinguishing ldquorecoveryrdquo from ldquocompensationrdquo
bull They also are capable of distinguishing motor control problems and provide critical information for treatment
BUT
Of what value is this measure to a clinician without biomechanical laboratory capabilities
-040
-030
-020
-010
000
010
020
030
1 7
13
19
25
31
37
43
49
55
61
67
73
79
85
91
97
Raw GRFs
Left leg
Right leg
-030
-020
-010
000
010
020
030
1 8
15
22
29
36
43
50
57
64
71
78
85
92
99
Summed GRFs
Summed GRFs
-030
-020
-010
000
010
020
030
1 8
15
22
29
36
43
50
57
64
71
78
85
92
99
Summed GRFs
Norm accel
GRFs vs Acceleration
CONTROL
-006
-004
-002
000
002
004
006
008
1 713
19
25
31
37
43
49
55
61
67
73
79
85
91
97
Paretic leg
Non paretic leg
Raw GRFs
-006
-004
-002
000
002
004
006
008
1 8
15
22
29
36
43
50
57
64
71
78
85
92
99
Summed GRF
summed GRF
-060
-040
-020
000
020
040
060
080
1 8
15
22
29
36
43
50
57
64
71
78
85
92
99
Normed GRFs
Acceleration
GRFs vs Acceleration
PERSON WITH STROKE
-15
-1
-05
0
05
1
15
1 9
17
25
33
41
49
57
65
73
81
89
97
Acc
ele
rati
on
in m
s2
Pre
Post
Control
Pre- and post-training accelerations of individuals participating in a
locomotor training intervention While COM acceleration increases it
does not approach normative values particularly in the critical phase 3 and 4
period of the gait cycle implying specific therapies need to target specific mechanistic elements of the walking pattern
-08
-06
-04
-02
0
02
04
06
CO
Ma
in m
s2
COMa before (blue line) and 2 minutes after (red line) incline training A
brief (5 minute) period of adaptation training yielded a 48 increase in both
peak COMa and the time integral of the COMa curve in phase 3 and 4 The x-axis represents percentage of the gait cycle
COMa as an outcome measure
bull segmental accelerations
bull studies into shock absorption
bull spatiotemporal gait parameters
bull control of stability
bull age-related changes in movement patterns
bull relating quantifiable movement patterns to falls
Portable applications
-06
-04
-02
0
02
04
06
Acc
ele
rati
on
in m
s2
Low PP
-06
-04
-02
0
02
04
06
Acc
ele
rati
on
in m
s2
Symmetrical
-06
-04
-02
0
02
04
06
Acc
ele
rati
on
in m
s2
High PP
Figure 6 COMa sorted by Pp Sorting by Pp yields three distinctly different acceleration profiles although the double support phase (shaded area) are similar in shape The low Pp
group (b) generates very little acceleration in the double support phase However the high Pp group (c) demonstrates only positive acceleration through the first half of the gait cycle while remaining negative throughout late double support and swing (Bowden Behrman et al In Press) The x-axes represent percentages of the gait cycle
a b c
COMa to diagnose motor control deficits
Examination of Power Training
JOINT POWER
P = moment times angular velocity P(+) = concentric (moments and velocity same direction) shortening contraction P(-) = eccentric (moments and velocity in opposite direction) lengthening contraction
A2
H3
H1
Gregory Bowden et al 2007
bull H1 (hip extension during initial stance) H3 (hip flexion during early swing) and A2 (ankle plantarflexion during late stance and pre-swing) all increased after therapy and the A2 and H3 bursts were significantly correlated with walking speed (Richards et al 2004)
bull Furthermore the A2 peak burst improvement was responsible for 25 of the gain in walking
bull Examining the interlimb coordination effects demonstrated that pre-training paretic A2 and H3 accounted for 84 of the variance in walking speed while post-training the non-paretic H3 replaces the paretic H3 to account for 82 of the post-training variance in patients that improved from 040 ms to 058 ms as a result of the intervention (Richards et al 2004)
Examination of Cardiovascular Status
bull Cardiorespiratory fitness is approximately 50 below age-matched controls
bull Decreased fitness combines with increased energetic demands to decrease efficiency
bull O2 use normalized to walking speed 50 higher bull Due to reduced peripheral muscle activation
change in fiber type reduced enzyme activities and altered hemodynamics
all responsive to exercise interventions
0
2
4
6
8
10
12
14
16
18
0 01 02 03 04 05 06 07
VO
2 (m
lk
gm
in)
Speed (ms)
bull Peak oxygen consumption (VO2) values in patients with stroke are below the level required for many basic activities of daily living (ADL)
bull Peak cardiovascular fitness
levels are roughly half those of age-matched individuals
bull Decreased CV fitness likely limits amount of walking thereby limiting daily physical activity and contributing to a downward spiral
ldquoStroke is a cardiac eventhelliprdquo Pam
Duncan
SS-50 SS-25 SS
SS+25 SS+50
SS-50
SS-25
SS SS+25 SS+50
01
02
03
04
05
06
07
08
O2
Eff (
mL
O2k
gm
)
Voluntary Fatigue
Cadence lt 40 rpm
Borg = 18
90 THR
Angina
HTN
Dyspnea
ST
segment
depression
Other
15
32
22
22
7
05
05
05
1 05
Hypotension
Courtesy of Dorian Rose PT PhD
Cardiovascular Fitness Functional Mobility
Examination of Dynamic Balance Control
Clinical Examinations
Dynamic COM vs COP
Weerdesteyn 2008
Balance Control
Treatment
bull Increase task complexity and difficulty (IRT example)
bull Athletic training
bull Intensity of training
bull Must know if people continue to fall
bull STILL evolving
Putting it All Together
Walking Performance
Motor Control
CV Fitness
Dynamic Balance Control
Strength
Results
bull The mobility group members improved their SMWT performance by an average of 35 m more than members of the UE group (95 CI 7 64)
bull Gait speed increases
ndash 011 ms_ss (95 CI 003 019) and 021 ms_fast (95 CI 12 030) faster than subjects in the UE group
bull TUG
ndash decreased 12 seconds in the intervention group (control increase by 17 seconds)
bull BBS No change (2 points to 1 point)
bull Later reports indicate an improvement in balancefalls efficacy
One therapy will NOT be the answer
Motor Control CV Status StrengthPower Dynamic Balance
Patient 1
Motor Control CV Status StrengthPower Dynamic Balance
Patient 3
Motor Control CV Status StrengthPower Dynamic Balance
Patient 2
Motor Control CV Status StrengthPower Dynamic Balance
Patient 4
Hypothetical future clinic
Overview - REVIEW
bull What is required for successful locomotor rehabilitation
ndash Systematic measurement
ndash Intensity
ndash Task specific practice
ndash Adherence to guiding principles
bull What does evidence-based practice tell us about locomotor rehabilitation
bull Where to go from here and what will future generations of therapeutic practice include
bull Guideline 1 Maximize weight bearing on the legs
bull Guideline 2 Afford the sensory experience consistent with walking
bull Guideline 3 Optimize kinematics for each motor task
bull Guideline 4 Maximize recovery and independence minimize compensation
LT Guidelines
hellipadded Guidelines
bull Systematic
bull Intensive
bull Progressive
bull Repetitive
bull Measure outcomes
hellipplus Plasticity
bull Use it or lose it
bull Use it and improve it
bull Specificity
bull Repetition matters
bull Intensity matters
bull Time matters
bull Salience matters
bull Age matters
bull Transference
bull Interference
Future directions
bull Evaluation to yield meaningful theory-based information to help guide clinical decision making
bull Classification to help guide treatment options
bull Understand ways to build on base therapy depending on impairments while being consistent with training guidelines
bull What tx for whom when in what combination with other tx
bull Clinic as a laboratory
Steve Kautz PhD
Mark George MD
Chris Gregory PhD PT
Aaron Embry DPT MSCR
Lindsay Perry DPT NCS
Patrick Morgan MS
This material is based upon work supported by the Office of Research and Development Rehabilitation Research and Development Department of Veterans Affairs Career Development-1 Award (Project B7177M Bowden PI) SCTR Discovery Pilot Grant (Kautz PI) AHA Innovative Research Grant (Kautz PI) and VA RRampD Merit Award B3983R (Kautz PI) The contents do not represent the views of the Department of Veterans Affairs or the United States Government
Thanks to all of my mentors collaborators and funding sources

0
0
tan
tan
inertiacediscontact
inertiacediscontact
MMM
FFF
IICOM
inertia
inertia
M
amF
I
COM
inertiaM
COM
inertiainertia
COMOO
inerrtia MFpM
S
contactT
T
TTTTTTTTTTT
TT
contact
F
contactS
S
SSSSSSSSSSS
SS
contact
F
F
FFFFFFFFFFF
FF
contact
MgmpampM
MgmpampM
GRMGRFCOPgmpampM
COMCOM
COMCOM
COMCOM
)())()()(()(
)())()()(()(
)())()()(()(
1
1
1
RIRIRR
RIRIRR
RIRIRR
S
contactTTT
T
contact
F
contactSSS
S
contact
FFF
F
contact
FgmamF
FgmamF
GRFgmamF
drsquoAlembert approach to inverse dynamics General laws of motion (sum forces sum moments)
General inertial forces and moments
NOTE
in general General (3 dimensional) Parallel Axis Theorem
Moments calculated at the proximal end of each segment
F S and T reflect the moment at proximal foot shank and thigh segments respectively Joint reaction forces
Laws of Motion
Spatiotemporal Analysis
Vastus
Medialis
Semi-
Membranosus
BREAK
bull Motor control training
bull Cardiovascular training
bull Strengthening and power training
bull Dynamic balance training
Elements of Optimized Walking Programs
Examination of Walking Specific Motor Control
Force vertical
Force anterior-posterior
Force medio-lateral
Ground Reaction Forces
Paretic Propulsion (Pp)
The percentage of total anterior GRF (propulsive) impulse generated by the paretic leg referred to as paretic propulsion (Pp) was calculated by dividing the propulsive impulse of the paretic leg by the sum of the paretic and non-paretic propulsive impulses
Pp =
+
0
50
100
1 2 3
Pp
(
)
Bowden et al 2006
bull Increased flexor activity in
preswing (eg TA and RF)
was correlated with
decreased paretic
propulsion
bull Increased plantarflexor
activity in late swing (eg
MG and SO) was correlated
with increased paretic
propulsion
Mechanisms of Response
Turns et al 2007
Extensor EMG Flexor EMG
What correlates with propulsion
bull PropulsionParetic cannot be measured in a conventional clinical setting without access to force plates
bull Step length asymmetry relates to propulsive forces generated by the legs
Paretic Step Ratio (PSR)
Stride Length
Paretic Step Length
PSR = Paretic Step Length Stride Length
PSR lt 047
047 lt PSR lt 053
PSR gt 053
r = -078 p lt 001
Balasubramanian et al 2007
ACTIVE propulsion generated by appropriately timed ankle power
PASSIVE propulsion generated by properly positioned foot COM posterior to the pelvic COM (larger horizontal portion of the red arrow)
Therefore emphasize hip extension
Mechanics of Propulsion and PSR
Clinical Usefulness
Beyond simply promoting symmetry PSR can be used to develop individual goals to train propulsive force production equalize bilateral biomechanical involvement by improving hip extension or promote paretic step initiation
ndash Longer paretic steps may be due to compensation by
greater non-paretic propulsion
ndash Weak relation with speed suggests compensatory strategies to attain functional speeds
ndash PSR may serve as a useful surrogate to assess propulsion during hemiparetic walking
bull These measures are capable of distinguishing ldquorecoveryrdquo from ldquocompensationrdquo
bull They also are capable of distinguishing motor control problems and provide critical information for treatment
BUT
Of what value is this measure to a clinician without biomechanical laboratory capabilities
-040
-030
-020
-010
000
010
020
030
1 7
13
19
25
31
37
43
49
55
61
67
73
79
85
91
97
Raw GRFs
Left leg
Right leg
-030
-020
-010
000
010
020
030
1 8
15
22
29
36
43
50
57
64
71
78
85
92
99
Summed GRFs
Summed GRFs
-030
-020
-010
000
010
020
030
1 8
15
22
29
36
43
50
57
64
71
78
85
92
99
Summed GRFs
Norm accel
GRFs vs Acceleration
CONTROL
-006
-004
-002
000
002
004
006
008
1 713
19
25
31
37
43
49
55
61
67
73
79
85
91
97
Paretic leg
Non paretic leg
Raw GRFs
-006
-004
-002
000
002
004
006
008
1 8
15
22
29
36
43
50
57
64
71
78
85
92
99
Summed GRF
summed GRF
-060
-040
-020
000
020
040
060
080
1 8
15
22
29
36
43
50
57
64
71
78
85
92
99
Normed GRFs
Acceleration
GRFs vs Acceleration
PERSON WITH STROKE
-15
-1
-05
0
05
1
15
1 9
17
25
33
41
49
57
65
73
81
89
97
Acc
ele
rati
on
in m
s2
Pre
Post
Control
Pre- and post-training accelerations of individuals participating in a
locomotor training intervention While COM acceleration increases it
does not approach normative values particularly in the critical phase 3 and 4
period of the gait cycle implying specific therapies need to target specific mechanistic elements of the walking pattern
-08
-06
-04
-02
0
02
04
06
CO
Ma
in m
s2
COMa before (blue line) and 2 minutes after (red line) incline training A
brief (5 minute) period of adaptation training yielded a 48 increase in both
peak COMa and the time integral of the COMa curve in phase 3 and 4 The x-axis represents percentage of the gait cycle
COMa as an outcome measure
bull segmental accelerations
bull studies into shock absorption
bull spatiotemporal gait parameters
bull control of stability
bull age-related changes in movement patterns
bull relating quantifiable movement patterns to falls
Portable applications
-06
-04
-02
0
02
04
06
Acc
ele
rati
on
in m
s2
Low PP
-06
-04
-02
0
02
04
06
Acc
ele
rati
on
in m
s2
Symmetrical
-06
-04
-02
0
02
04
06
Acc
ele
rati
on
in m
s2
High PP
Figure 6 COMa sorted by Pp Sorting by Pp yields three distinctly different acceleration profiles although the double support phase (shaded area) are similar in shape The low Pp
group (b) generates very little acceleration in the double support phase However the high Pp group (c) demonstrates only positive acceleration through the first half of the gait cycle while remaining negative throughout late double support and swing (Bowden Behrman et al In Press) The x-axes represent percentages of the gait cycle
a b c
COMa to diagnose motor control deficits
Examination of Power Training
JOINT POWER
P = moment times angular velocity P(+) = concentric (moments and velocity same direction) shortening contraction P(-) = eccentric (moments and velocity in opposite direction) lengthening contraction
A2
H3
H1
Gregory Bowden et al 2007
bull H1 (hip extension during initial stance) H3 (hip flexion during early swing) and A2 (ankle plantarflexion during late stance and pre-swing) all increased after therapy and the A2 and H3 bursts were significantly correlated with walking speed (Richards et al 2004)
bull Furthermore the A2 peak burst improvement was responsible for 25 of the gain in walking
bull Examining the interlimb coordination effects demonstrated that pre-training paretic A2 and H3 accounted for 84 of the variance in walking speed while post-training the non-paretic H3 replaces the paretic H3 to account for 82 of the post-training variance in patients that improved from 040 ms to 058 ms as a result of the intervention (Richards et al 2004)
Examination of Cardiovascular Status
bull Cardiorespiratory fitness is approximately 50 below age-matched controls
bull Decreased fitness combines with increased energetic demands to decrease efficiency
bull O2 use normalized to walking speed 50 higher bull Due to reduced peripheral muscle activation
change in fiber type reduced enzyme activities and altered hemodynamics
all responsive to exercise interventions
0
2
4
6
8
10
12
14
16
18
0 01 02 03 04 05 06 07
VO
2 (m
lk
gm
in)
Speed (ms)
bull Peak oxygen consumption (VO2) values in patients with stroke are below the level required for many basic activities of daily living (ADL)
bull Peak cardiovascular fitness
levels are roughly half those of age-matched individuals
bull Decreased CV fitness likely limits amount of walking thereby limiting daily physical activity and contributing to a downward spiral
ldquoStroke is a cardiac eventhelliprdquo Pam
Duncan
SS-50 SS-25 SS
SS+25 SS+50
SS-50
SS-25
SS SS+25 SS+50
01
02
03
04
05
06
07
08
O2
Eff (
mL
O2k
gm
)
Voluntary Fatigue
Cadence lt 40 rpm
Borg = 18
90 THR
Angina
HTN
Dyspnea
ST
segment
depression
Other
15
32
22
22
7
05
05
05
1 05
Hypotension
Courtesy of Dorian Rose PT PhD
Cardiovascular Fitness Functional Mobility
Examination of Dynamic Balance Control
Clinical Examinations
Dynamic COM vs COP
Weerdesteyn 2008
Balance Control
Treatment
bull Increase task complexity and difficulty (IRT example)
bull Athletic training
bull Intensity of training
bull Must know if people continue to fall
bull STILL evolving
Putting it All Together
Walking Performance
Motor Control
CV Fitness
Dynamic Balance Control
Strength
Results
bull The mobility group members improved their SMWT performance by an average of 35 m more than members of the UE group (95 CI 7 64)
bull Gait speed increases
ndash 011 ms_ss (95 CI 003 019) and 021 ms_fast (95 CI 12 030) faster than subjects in the UE group
bull TUG
ndash decreased 12 seconds in the intervention group (control increase by 17 seconds)
bull BBS No change (2 points to 1 point)
bull Later reports indicate an improvement in balancefalls efficacy
One therapy will NOT be the answer
Motor Control CV Status StrengthPower Dynamic Balance
Patient 1
Motor Control CV Status StrengthPower Dynamic Balance
Patient 3
Motor Control CV Status StrengthPower Dynamic Balance
Patient 2
Motor Control CV Status StrengthPower Dynamic Balance
Patient 4
Hypothetical future clinic
Overview - REVIEW
bull What is required for successful locomotor rehabilitation
ndash Systematic measurement
ndash Intensity
ndash Task specific practice
ndash Adherence to guiding principles
bull What does evidence-based practice tell us about locomotor rehabilitation
bull Where to go from here and what will future generations of therapeutic practice include
bull Guideline 1 Maximize weight bearing on the legs
bull Guideline 2 Afford the sensory experience consistent with walking
bull Guideline 3 Optimize kinematics for each motor task
bull Guideline 4 Maximize recovery and independence minimize compensation
LT Guidelines
hellipadded Guidelines
bull Systematic
bull Intensive
bull Progressive
bull Repetitive
bull Measure outcomes
hellipplus Plasticity
bull Use it or lose it
bull Use it and improve it
bull Specificity
bull Repetition matters
bull Intensity matters
bull Time matters
bull Salience matters
bull Age matters
bull Transference
bull Interference
Future directions
bull Evaluation to yield meaningful theory-based information to help guide clinical decision making
bull Classification to help guide treatment options
bull Understand ways to build on base therapy depending on impairments while being consistent with training guidelines
bull What tx for whom when in what combination with other tx
bull Clinic as a laboratory
Steve Kautz PhD
Mark George MD
Chris Gregory PhD PT
Aaron Embry DPT MSCR
Lindsay Perry DPT NCS
Patrick Morgan MS
This material is based upon work supported by the Office of Research and Development Rehabilitation Research and Development Department of Veterans Affairs Career Development-1 Award (Project B7177M Bowden PI) SCTR Discovery Pilot Grant (Kautz PI) AHA Innovative Research Grant (Kautz PI) and VA RRampD Merit Award B3983R (Kautz PI) The contents do not represent the views of the Department of Veterans Affairs or the United States Government
Thanks to all of my mentors collaborators and funding sources
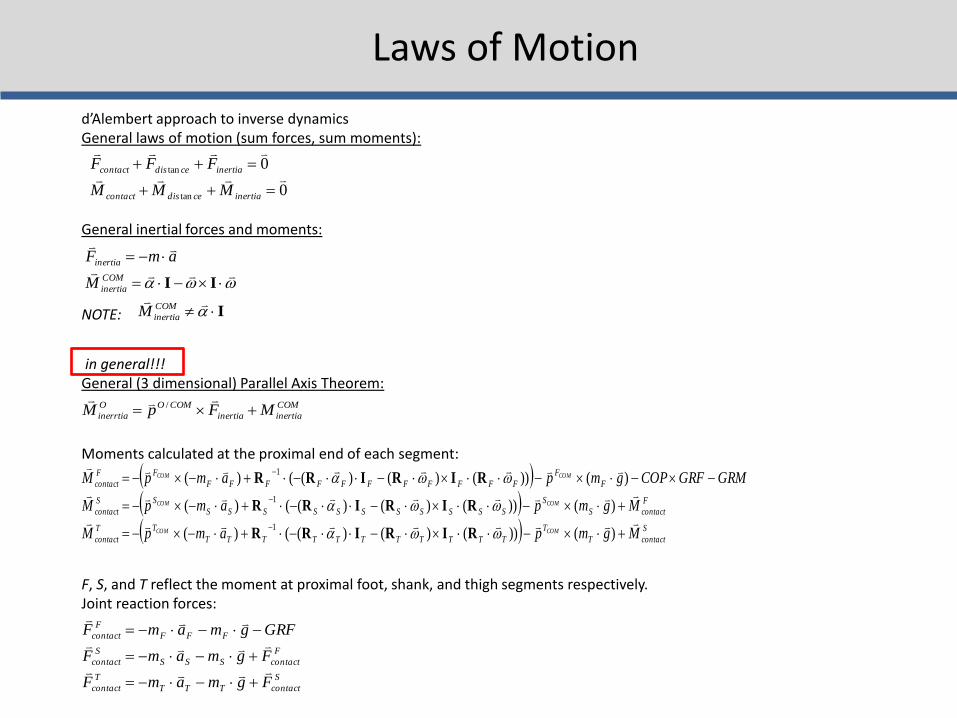

0
50
100
1 2 3
Pp
(
)
Bowden et al 2006
bull Increased flexor activity in
preswing (eg TA and RF)
was correlated with
decreased paretic
propulsion
bull Increased plantarflexor
activity in late swing (eg
MG and SO) was correlated
with increased paretic
propulsion
Mechanisms of Response
Turns et al 2007
Extensor EMG Flexor EMG
What correlates with propulsion
bull PropulsionParetic cannot be measured in a conventional clinical setting without access to force plates
bull Step length asymmetry relates to propulsive forces generated by the legs
Paretic Step Ratio (PSR)
Stride Length
Paretic Step Length
PSR = Paretic Step Length Stride Length
PSR lt 047
047 lt PSR lt 053
PSR gt 053
r = -078 p lt 001
Balasubramanian et al 2007
ACTIVE propulsion generated by appropriately timed ankle power
PASSIVE propulsion generated by properly positioned foot COM posterior to the pelvic COM (larger horizontal portion of the red arrow)
Therefore emphasize hip extension
Mechanics of Propulsion and PSR
Clinical Usefulness
Beyond simply promoting symmetry PSR can be used to develop individual goals to train propulsive force production equalize bilateral biomechanical involvement by improving hip extension or promote paretic step initiation
ndash Longer paretic steps may be due to compensation by
greater non-paretic propulsion
ndash Weak relation with speed suggests compensatory strategies to attain functional speeds
ndash PSR may serve as a useful surrogate to assess propulsion during hemiparetic walking
bull These measures are capable of distinguishing ldquorecoveryrdquo from ldquocompensationrdquo
bull They also are capable of distinguishing motor control problems and provide critical information for treatment
BUT
Of what value is this measure to a clinician without biomechanical laboratory capabilities
-040
-030
-020
-010
000
010
020
030
1 7
13
19
25
31
37
43
49
55
61
67
73
79
85
91
97
Raw GRFs
Left leg
Right leg
-030
-020
-010
000
010
020
030
1 8
15
22
29
36
43
50
57
64
71
78
85
92
99
Summed GRFs
Summed GRFs
-030
-020
-010
000
010
020
030
1 8
15
22
29
36
43
50
57
64
71
78
85
92
99
Summed GRFs
Norm accel
GRFs vs Acceleration
CONTROL
-006
-004
-002
000
002
004
006
008
1 713
19
25
31
37
43
49
55
61
67
73
79
85
91
97
Paretic leg
Non paretic leg
Raw GRFs
-006
-004
-002
000
002
004
006
008
1 8
15
22
29
36
43
50
57
64
71
78
85
92
99
Summed GRF
summed GRF
-060
-040
-020
000
020
040
060
080
1 8
15
22
29
36
43
50
57
64
71
78
85
92
99
Normed GRFs
Acceleration
GRFs vs Acceleration
PERSON WITH STROKE
-15
-1
-05
0
05
1
15
1 9
17
25
33
41
49
57
65
73
81
89
97
Acc
ele
rati
on
in m
s2
Pre
Post
Control
Pre- and post-training accelerations of individuals participating in a
locomotor training intervention While COM acceleration increases it
does not approach normative values particularly in the critical phase 3 and 4
period of the gait cycle implying specific therapies need to target specific mechanistic elements of the walking pattern
-08
-06
-04
-02
0
02
04
06
CO
Ma
in m
s2
COMa before (blue line) and 2 minutes after (red line) incline training A
brief (5 minute) period of adaptation training yielded a 48 increase in both
peak COMa and the time integral of the COMa curve in phase 3 and 4 The x-axis represents percentage of the gait cycle
COMa as an outcome measure
bull segmental accelerations
bull studies into shock absorption
bull spatiotemporal gait parameters
bull control of stability
bull age-related changes in movement patterns
bull relating quantifiable movement patterns to falls
Portable applications
-06
-04
-02
0
02
04
06
Acc
ele
rati
on
in m
s2
Low PP
-06
-04
-02
0
02
04
06
Acc
ele
rati
on
in m
s2
Symmetrical
-06
-04
-02
0
02
04
06
Acc
ele
rati
on
in m
s2
High PP
Figure 6 COMa sorted by Pp Sorting by Pp yields three distinctly different acceleration profiles although the double support phase (shaded area) are similar in shape The low Pp
group (b) generates very little acceleration in the double support phase However the high Pp group (c) demonstrates only positive acceleration through the first half of the gait cycle while remaining negative throughout late double support and swing (Bowden Behrman et al In Press) The x-axes represent percentages of the gait cycle
a b c
COMa to diagnose motor control deficits
Examination of Power Training
JOINT POWER
P = moment times angular velocity P(+) = concentric (moments and velocity same direction) shortening contraction P(-) = eccentric (moments and velocity in opposite direction) lengthening contraction
A2
H3
H1
Gregory Bowden et al 2007
bull H1 (hip extension during initial stance) H3 (hip flexion during early swing) and A2 (ankle plantarflexion during late stance and pre-swing) all increased after therapy and the A2 and H3 bursts were significantly correlated with walking speed (Richards et al 2004)
bull Furthermore the A2 peak burst improvement was responsible for 25 of the gain in walking
bull Examining the interlimb coordination effects demonstrated that pre-training paretic A2 and H3 accounted for 84 of the variance in walking speed while post-training the non-paretic H3 replaces the paretic H3 to account for 82 of the post-training variance in patients that improved from 040 ms to 058 ms as a result of the intervention (Richards et al 2004)
Examination of Cardiovascular Status
bull Cardiorespiratory fitness is approximately 50 below age-matched controls
bull Decreased fitness combines with increased energetic demands to decrease efficiency
bull O2 use normalized to walking speed 50 higher bull Due to reduced peripheral muscle activation
change in fiber type reduced enzyme activities and altered hemodynamics
all responsive to exercise interventions
0
2
4
6
8
10
12
14
16
18
0 01 02 03 04 05 06 07
VO
2 (m
lk
gm
in)
Speed (ms)
bull Peak oxygen consumption (VO2) values in patients with stroke are below the level required for many basic activities of daily living (ADL)
bull Peak cardiovascular fitness
levels are roughly half those of age-matched individuals
bull Decreased CV fitness likely limits amount of walking thereby limiting daily physical activity and contributing to a downward spiral
ldquoStroke is a cardiac eventhelliprdquo Pam
Duncan
SS-50 SS-25 SS
SS+25 SS+50
SS-50
SS-25
SS SS+25 SS+50
01
02
03
04
05
06
07
08
O2
Eff (
mL
O2k
gm
)
Voluntary Fatigue
Cadence lt 40 rpm
Borg = 18
90 THR
Angina
HTN
Dyspnea
ST
segment
depression
Other
15
32
22
22
7
05
05
05
1 05
Hypotension
Courtesy of Dorian Rose PT PhD
Cardiovascular Fitness Functional Mobility
Examination of Dynamic Balance Control
Clinical Examinations
Dynamic COM vs COP
Weerdesteyn 2008
Balance Control
Treatment
bull Increase task complexity and difficulty (IRT example)
bull Athletic training
bull Intensity of training
bull Must know if people continue to fall
bull STILL evolving
Putting it All Together
Walking Performance
Motor Control
CV Fitness
Dynamic Balance Control
Strength
Results
bull The mobility group members improved their SMWT performance by an average of 35 m more than members of the UE group (95 CI 7 64)
bull Gait speed increases
ndash 011 ms_ss (95 CI 003 019) and 021 ms_fast (95 CI 12 030) faster than subjects in the UE group
bull TUG
ndash decreased 12 seconds in the intervention group (control increase by 17 seconds)
bull BBS No change (2 points to 1 point)
bull Later reports indicate an improvement in balancefalls efficacy
One therapy will NOT be the answer
Motor Control CV Status StrengthPower Dynamic Balance
Patient 1
Motor Control CV Status StrengthPower Dynamic Balance
Patient 3
Motor Control CV Status StrengthPower Dynamic Balance
Patient 2
Motor Control CV Status StrengthPower Dynamic Balance
Patient 4
Hypothetical future clinic
Overview - REVIEW
bull What is required for successful locomotor rehabilitation
ndash Systematic measurement
ndash Intensity
ndash Task specific practice
ndash Adherence to guiding principles
bull What does evidence-based practice tell us about locomotor rehabilitation
bull Where to go from here and what will future generations of therapeutic practice include
bull Guideline 1 Maximize weight bearing on the legs
bull Guideline 2 Afford the sensory experience consistent with walking
bull Guideline 3 Optimize kinematics for each motor task
bull Guideline 4 Maximize recovery and independence minimize compensation
LT Guidelines
hellipadded Guidelines
bull Systematic
bull Intensive
bull Progressive
bull Repetitive
bull Measure outcomes
hellipplus Plasticity
bull Use it or lose it
bull Use it and improve it
bull Specificity
bull Repetition matters
bull Intensity matters
bull Time matters
bull Salience matters
bull Age matters
bull Transference
bull Interference
Future directions
bull Evaluation to yield meaningful theory-based information to help guide clinical decision making
bull Classification to help guide treatment options
bull Understand ways to build on base therapy depending on impairments while being consistent with training guidelines
bull What tx for whom when in what combination with other tx
bull Clinic as a laboratory
Steve Kautz PhD
Mark George MD
Chris Gregory PhD PT
Aaron Embry DPT MSCR
Lindsay Perry DPT NCS
Patrick Morgan MS
This material is based upon work supported by the Office of Research and Development Rehabilitation Research and Development Department of Veterans Affairs Career Development-1 Award (Project B7177M Bowden PI) SCTR Discovery Pilot Grant (Kautz PI) AHA Innovative Research Grant (Kautz PI) and VA RRampD Merit Award B3983R (Kautz PI) The contents do not represent the views of the Department of Veterans Affairs or the United States Government
Thanks to all of my mentors collaborators and funding sources

-040
-030
-020
-010
000
010
020
030
1 7
13
19
25
31
37
43
49
55
61
67
73
79
85
91
97
Raw GRFs
Left leg
Right leg
-030
-020
-010
000
010
020
030
1 8
15
22
29
36
43
50
57
64
71
78
85
92
99
Summed GRFs
Summed GRFs
-030
-020
-010
000
010
020
030
1 8
15
22
29
36
43
50
57
64
71
78
85
92
99
Summed GRFs
Norm accel
GRFs vs Acceleration
CONTROL
-006
-004
-002
000
002
004
006
008
1 713
19
25
31
37
43
49
55
61
67
73
79
85
91
97
Paretic leg
Non paretic leg
Raw GRFs
-006
-004
-002
000
002
004
006
008
1 8
15
22
29
36
43
50
57
64
71
78
85
92
99
Summed GRF
summed GRF
-060
-040
-020
000
020
040
060
080
1 8
15
22
29
36
43
50
57
64
71
78
85
92
99
Normed GRFs
Acceleration
GRFs vs Acceleration
PERSON WITH STROKE
-15
-1
-05
0
05
1
15
1 9
17
25
33
41
49
57
65
73
81
89
97
Acc
ele
rati
on
in m
s2
Pre
Post
Control
Pre- and post-training accelerations of individuals participating in a
locomotor training intervention While COM acceleration increases it
does not approach normative values particularly in the critical phase 3 and 4
period of the gait cycle implying specific therapies need to target specific mechanistic elements of the walking pattern
-08
-06
-04
-02
0
02
04
06
CO
Ma
in m
s2
COMa before (blue line) and 2 minutes after (red line) incline training A
brief (5 minute) period of adaptation training yielded a 48 increase in both
peak COMa and the time integral of the COMa curve in phase 3 and 4 The x-axis represents percentage of the gait cycle
COMa as an outcome measure
bull segmental accelerations
bull studies into shock absorption
bull spatiotemporal gait parameters
bull control of stability
bull age-related changes in movement patterns
bull relating quantifiable movement patterns to falls
Portable applications
-06
-04
-02
0
02
04
06
Acc
ele
rati
on
in m
s2
Low PP
-06
-04
-02
0
02
04
06
Acc
ele
rati
on
in m
s2
Symmetrical
-06
-04
-02
0
02
04
06
Acc
ele
rati
on
in m
s2
High PP
Figure 6 COMa sorted by Pp Sorting by Pp yields three distinctly different acceleration profiles although the double support phase (shaded area) are similar in shape The low Pp
group (b) generates very little acceleration in the double support phase However the high Pp group (c) demonstrates only positive acceleration through the first half of the gait cycle while remaining negative throughout late double support and swing (Bowden Behrman et al In Press) The x-axes represent percentages of the gait cycle
a b c
COMa to diagnose motor control deficits
Examination of Power Training
JOINT POWER
P = moment times angular velocity P(+) = concentric (moments and velocity same direction) shortening contraction P(-) = eccentric (moments and velocity in opposite direction) lengthening contraction
A2
H3
H1
Gregory Bowden et al 2007
bull H1 (hip extension during initial stance) H3 (hip flexion during early swing) and A2 (ankle plantarflexion during late stance and pre-swing) all increased after therapy and the A2 and H3 bursts were significantly correlated with walking speed (Richards et al 2004)
bull Furthermore the A2 peak burst improvement was responsible for 25 of the gain in walking
bull Examining the interlimb coordination effects demonstrated that pre-training paretic A2 and H3 accounted for 84 of the variance in walking speed while post-training the non-paretic H3 replaces the paretic H3 to account for 82 of the post-training variance in patients that improved from 040 ms to 058 ms as a result of the intervention (Richards et al 2004)
Examination of Cardiovascular Status
bull Cardiorespiratory fitness is approximately 50 below age-matched controls
bull Decreased fitness combines with increased energetic demands to decrease efficiency
bull O2 use normalized to walking speed 50 higher bull Due to reduced peripheral muscle activation
change in fiber type reduced enzyme activities and altered hemodynamics
all responsive to exercise interventions
0
2
4
6
8
10
12
14
16
18
0 01 02 03 04 05 06 07
VO
2 (m
lk
gm
in)
Speed (ms)
bull Peak oxygen consumption (VO2) values in patients with stroke are below the level required for many basic activities of daily living (ADL)
bull Peak cardiovascular fitness
levels are roughly half those of age-matched individuals
bull Decreased CV fitness likely limits amount of walking thereby limiting daily physical activity and contributing to a downward spiral
ldquoStroke is a cardiac eventhelliprdquo Pam
Duncan
SS-50 SS-25 SS
SS+25 SS+50
SS-50
SS-25
SS SS+25 SS+50
01
02
03
04
05
06
07
08
O2
Eff (
mL
O2k
gm
)
Voluntary Fatigue
Cadence lt 40 rpm
Borg = 18
90 THR
Angina
HTN
Dyspnea
ST
segment
depression
Other
15
32
22
22
7
05
05
05
1 05
Hypotension
Courtesy of Dorian Rose PT PhD
Cardiovascular Fitness Functional Mobility
Examination of Dynamic Balance Control
Clinical Examinations
Dynamic COM vs COP
Weerdesteyn 2008
Balance Control
Treatment
bull Increase task complexity and difficulty (IRT example)
bull Athletic training
bull Intensity of training
bull Must know if people continue to fall
bull STILL evolving
Putting it All Together
Walking Performance
Motor Control
CV Fitness
Dynamic Balance Control
Strength
Results
bull The mobility group members improved their SMWT performance by an average of 35 m more than members of the UE group (95 CI 7 64)
bull Gait speed increases
ndash 011 ms_ss (95 CI 003 019) and 021 ms_fast (95 CI 12 030) faster than subjects in the UE group
bull TUG
ndash decreased 12 seconds in the intervention group (control increase by 17 seconds)
bull BBS No change (2 points to 1 point)
bull Later reports indicate an improvement in balancefalls efficacy
One therapy will NOT be the answer
Motor Control CV Status StrengthPower Dynamic Balance
Patient 1
Motor Control CV Status StrengthPower Dynamic Balance
Patient 3
Motor Control CV Status StrengthPower Dynamic Balance
Patient 2
Motor Control CV Status StrengthPower Dynamic Balance
Patient 4
Hypothetical future clinic
Overview - REVIEW
bull What is required for successful locomotor rehabilitation
ndash Systematic measurement
ndash Intensity
ndash Task specific practice
ndash Adherence to guiding principles
bull What does evidence-based practice tell us about locomotor rehabilitation
bull Where to go from here and what will future generations of therapeutic practice include
bull Guideline 1 Maximize weight bearing on the legs
bull Guideline 2 Afford the sensory experience consistent with walking
bull Guideline 3 Optimize kinematics for each motor task
bull Guideline 4 Maximize recovery and independence minimize compensation
LT Guidelines
hellipadded Guidelines
bull Systematic
bull Intensive
bull Progressive
bull Repetitive
bull Measure outcomes
hellipplus Plasticity
bull Use it or lose it
bull Use it and improve it
bull Specificity
bull Repetition matters
bull Intensity matters
bull Time matters
bull Salience matters
bull Age matters
bull Transference
bull Interference
Future directions
bull Evaluation to yield meaningful theory-based information to help guide clinical decision making
bull Classification to help guide treatment options
bull Understand ways to build on base therapy depending on impairments while being consistent with training guidelines
bull What tx for whom when in what combination with other tx
bull Clinic as a laboratory
Steve Kautz PhD
Mark George MD
Chris Gregory PhD PT
Aaron Embry DPT MSCR
Lindsay Perry DPT NCS
Patrick Morgan MS
This material is based upon work supported by the Office of Research and Development Rehabilitation Research and Development Department of Veterans Affairs Career Development-1 Award (Project B7177M Bowden PI) SCTR Discovery Pilot Grant (Kautz PI) AHA Innovative Research Grant (Kautz PI) and VA RRampD Merit Award B3983R (Kautz PI) The contents do not represent the views of the Department of Veterans Affairs or the United States Government
Thanks to all of my mentors collaborators and funding sources

-006
-004
-002
000
002
004
006
008
1 713
19
25
31
37
43
49
55
61
67
73
79
85
91
97
Paretic leg
Non paretic leg
Raw GRFs
-006
-004
-002
000
002
004
006
008
1 8
15
22
29
36
43
50
57
64
71
78
85
92
99
Summed GRF
summed GRF
-060
-040
-020
000
020
040
060
080
1 8
15
22
29
36
43
50
57
64
71
78
85
92
99
Normed GRFs
Acceleration
GRFs vs Acceleration
PERSON WITH STROKE
-15
-1
-05
0
05
1
15
1 9
17
25
33
41
49
57
65
73
81
89
97
Acc
ele
rati
on
in m
s2
Pre
Post
Control
Pre- and post-training accelerations of individuals participating in a
locomotor training intervention While COM acceleration increases it
does not approach normative values particularly in the critical phase 3 and 4
period of the gait cycle implying specific therapies need to target specific mechanistic elements of the walking pattern
-08
-06
-04
-02
0
02
04
06
CO
Ma
in m
s2
COMa before (blue line) and 2 minutes after (red line) incline training A
brief (5 minute) period of adaptation training yielded a 48 increase in both
peak COMa and the time integral of the COMa curve in phase 3 and 4 The x-axis represents percentage of the gait cycle
COMa as an outcome measure
bull segmental accelerations
bull studies into shock absorption
bull spatiotemporal gait parameters
bull control of stability
bull age-related changes in movement patterns
bull relating quantifiable movement patterns to falls
Portable applications
-06
-04
-02
0
02
04
06
Acc
ele
rati
on
in m
s2
Low PP
-06
-04
-02
0
02
04
06
Acc
ele
rati
on
in m
s2
Symmetrical
-06
-04
-02
0
02
04
06
Acc
ele
rati
on
in m
s2
High PP
Figure 6 COMa sorted by Pp Sorting by Pp yields three distinctly different acceleration profiles although the double support phase (shaded area) are similar in shape The low Pp
group (b) generates very little acceleration in the double support phase However the high Pp group (c) demonstrates only positive acceleration through the first half of the gait cycle while remaining negative throughout late double support and swing (Bowden Behrman et al In Press) The x-axes represent percentages of the gait cycle
a b c
COMa to diagnose motor control deficits
Examination of Power Training
JOINT POWER
P = moment times angular velocity P(+) = concentric (moments and velocity same direction) shortening contraction P(-) = eccentric (moments and velocity in opposite direction) lengthening contraction
A2
H3
H1
Gregory Bowden et al 2007
bull H1 (hip extension during initial stance) H3 (hip flexion during early swing) and A2 (ankle plantarflexion during late stance and pre-swing) all increased after therapy and the A2 and H3 bursts were significantly correlated with walking speed (Richards et al 2004)
bull Furthermore the A2 peak burst improvement was responsible for 25 of the gain in walking
bull Examining the interlimb coordination effects demonstrated that pre-training paretic A2 and H3 accounted for 84 of the variance in walking speed while post-training the non-paretic H3 replaces the paretic H3 to account for 82 of the post-training variance in patients that improved from 040 ms to 058 ms as a result of the intervention (Richards et al 2004)
Examination of Cardiovascular Status
bull Cardiorespiratory fitness is approximately 50 below age-matched controls
bull Decreased fitness combines with increased energetic demands to decrease efficiency
bull O2 use normalized to walking speed 50 higher bull Due to reduced peripheral muscle activation
change in fiber type reduced enzyme activities and altered hemodynamics
all responsive to exercise interventions
0
2
4
6
8
10
12
14
16
18
0 01 02 03 04 05 06 07
VO
2 (m
lk
gm
in)
Speed (ms)
bull Peak oxygen consumption (VO2) values in patients with stroke are below the level required for many basic activities of daily living (ADL)
bull Peak cardiovascular fitness
levels are roughly half those of age-matched individuals
bull Decreased CV fitness likely limits amount of walking thereby limiting daily physical activity and contributing to a downward spiral
ldquoStroke is a cardiac eventhelliprdquo Pam
Duncan
SS-50 SS-25 SS
SS+25 SS+50
SS-50
SS-25
SS SS+25 SS+50
01
02
03
04
05
06
07
08
O2
Eff (
mL
O2k
gm
)
Voluntary Fatigue
Cadence lt 40 rpm
Borg = 18
90 THR
Angina
HTN
Dyspnea
ST
segment
depression
Other
15
32
22
22
7
05
05
05
1 05
Hypotension
Courtesy of Dorian Rose PT PhD
Cardiovascular Fitness Functional Mobility
Examination of Dynamic Balance Control
Clinical Examinations
Dynamic COM vs COP
Weerdesteyn 2008
Balance Control
Treatment
bull Increase task complexity and difficulty (IRT example)
bull Athletic training
bull Intensity of training
bull Must know if people continue to fall
bull STILL evolving
Putting it All Together
Walking Performance
Motor Control
CV Fitness
Dynamic Balance Control
Strength
Results
bull The mobility group members improved their SMWT performance by an average of 35 m more than members of the UE group (95 CI 7 64)
bull Gait speed increases
ndash 011 ms_ss (95 CI 003 019) and 021 ms_fast (95 CI 12 030) faster than subjects in the UE group
bull TUG
ndash decreased 12 seconds in the intervention group (control increase by 17 seconds)
bull BBS No change (2 points to 1 point)
bull Later reports indicate an improvement in balancefalls efficacy
One therapy will NOT be the answer
Motor Control CV Status StrengthPower Dynamic Balance
Patient 1
Motor Control CV Status StrengthPower Dynamic Balance
Patient 3
Motor Control CV Status StrengthPower Dynamic Balance
Patient 2
Motor Control CV Status StrengthPower Dynamic Balance
Patient 4
Hypothetical future clinic
Overview - REVIEW
bull What is required for successful locomotor rehabilitation
ndash Systematic measurement
ndash Intensity
ndash Task specific practice
ndash Adherence to guiding principles
bull What does evidence-based practice tell us about locomotor rehabilitation
bull Where to go from here and what will future generations of therapeutic practice include
bull Guideline 1 Maximize weight bearing on the legs
bull Guideline 2 Afford the sensory experience consistent with walking
bull Guideline 3 Optimize kinematics for each motor task
bull Guideline 4 Maximize recovery and independence minimize compensation
LT Guidelines
hellipadded Guidelines
bull Systematic
bull Intensive
bull Progressive
bull Repetitive
bull Measure outcomes
hellipplus Plasticity
bull Use it or lose it
bull Use it and improve it
bull Specificity
bull Repetition matters
bull Intensity matters
bull Time matters
bull Salience matters
bull Age matters
bull Transference
bull Interference
Future directions
bull Evaluation to yield meaningful theory-based information to help guide clinical decision making
bull Classification to help guide treatment options
bull Understand ways to build on base therapy depending on impairments while being consistent with training guidelines
bull What tx for whom when in what combination with other tx
bull Clinic as a laboratory
Steve Kautz PhD
Mark George MD
Chris Gregory PhD PT
Aaron Embry DPT MSCR
Lindsay Perry DPT NCS
Patrick Morgan MS
This material is based upon work supported by the Office of Research and Development Rehabilitation Research and Development Department of Veterans Affairs Career Development-1 Award (Project B7177M Bowden PI) SCTR Discovery Pilot Grant (Kautz PI) AHA Innovative Research Grant (Kautz PI) and VA RRampD Merit Award B3983R (Kautz PI) The contents do not represent the views of the Department of Veterans Affairs or the United States Government
Thanks to all of my mentors collaborators and funding sources
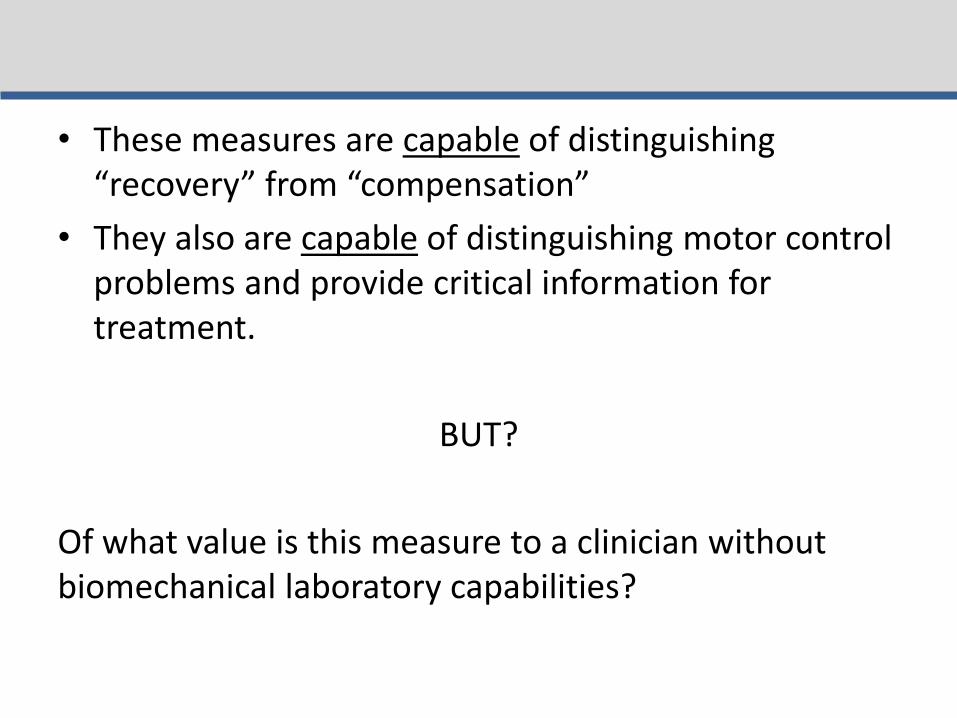
-06
-04
-02
0
02
04
06
Acc
ele
rati
on
in m
s2
Low PP
-06
-04
-02
0
02
04
06
Acc
ele
rati
on
in m
s2
Symmetrical
-06
-04
-02
0
02
04
06
Acc
ele
rati
on
in m
s2
High PP
Figure 6 COMa sorted by Pp Sorting by Pp yields three distinctly different acceleration profiles although the double support phase (shaded area) are similar in shape The low Pp
group (b) generates very little acceleration in the double support phase However the high Pp group (c) demonstrates only positive acceleration through the first half of the gait cycle while remaining negative throughout late double support and swing (Bowden Behrman et al In Press) The x-axes represent percentages of the gait cycle
a b c
COMa to diagnose motor control deficits
Examination of Power Training
JOINT POWER
P = moment times angular velocity P(+) = concentric (moments and velocity same direction) shortening contraction P(-) = eccentric (moments and velocity in opposite direction) lengthening contraction
A2
H3
H1
Gregory Bowden et al 2007
bull H1 (hip extension during initial stance) H3 (hip flexion during early swing) and A2 (ankle plantarflexion during late stance and pre-swing) all increased after therapy and the A2 and H3 bursts were significantly correlated with walking speed (Richards et al 2004)
bull Furthermore the A2 peak burst improvement was responsible for 25 of the gain in walking
bull Examining the interlimb coordination effects demonstrated that pre-training paretic A2 and H3 accounted for 84 of the variance in walking speed while post-training the non-paretic H3 replaces the paretic H3 to account for 82 of the post-training variance in patients that improved from 040 ms to 058 ms as a result of the intervention (Richards et al 2004)
Examination of Cardiovascular Status
bull Cardiorespiratory fitness is approximately 50 below age-matched controls
bull Decreased fitness combines with increased energetic demands to decrease efficiency
bull O2 use normalized to walking speed 50 higher bull Due to reduced peripheral muscle activation
change in fiber type reduced enzyme activities and altered hemodynamics
all responsive to exercise interventions
0
2
4
6
8
10
12
14
16
18
0 01 02 03 04 05 06 07
VO
2 (m
lk
gm
in)
Speed (ms)
bull Peak oxygen consumption (VO2) values in patients with stroke are below the level required for many basic activities of daily living (ADL)
bull Peak cardiovascular fitness
levels are roughly half those of age-matched individuals
bull Decreased CV fitness likely limits amount of walking thereby limiting daily physical activity and contributing to a downward spiral
ldquoStroke is a cardiac eventhelliprdquo Pam
Duncan
SS-50 SS-25 SS
SS+25 SS+50
SS-50
SS-25
SS SS+25 SS+50
01
02
03
04
05
06
07
08
O2
Eff (
mL
O2k
gm
)
Voluntary Fatigue
Cadence lt 40 rpm
Borg = 18
90 THR
Angina
HTN
Dyspnea
ST
segment
depression
Other
15
32
22
22
7
05
05
05
1 05
Hypotension
Courtesy of Dorian Rose PT PhD
Cardiovascular Fitness Functional Mobility
Examination of Dynamic Balance Control
Clinical Examinations
Dynamic COM vs COP
Weerdesteyn 2008
Balance Control
Treatment
bull Increase task complexity and difficulty (IRT example)
bull Athletic training
bull Intensity of training
bull Must know if people continue to fall
bull STILL evolving
Putting it All Together
Walking Performance
Motor Control
CV Fitness
Dynamic Balance Control
Strength
Results
bull The mobility group members improved their SMWT performance by an average of 35 m more than members of the UE group (95 CI 7 64)
bull Gait speed increases
ndash 011 ms_ss (95 CI 003 019) and 021 ms_fast (95 CI 12 030) faster than subjects in the UE group
bull TUG
ndash decreased 12 seconds in the intervention group (control increase by 17 seconds)
bull BBS No change (2 points to 1 point)
bull Later reports indicate an improvement in balancefalls efficacy
One therapy will NOT be the answer
Motor Control CV Status StrengthPower Dynamic Balance
Patient 1
Motor Control CV Status StrengthPower Dynamic Balance
Patient 3
Motor Control CV Status StrengthPower Dynamic Balance
Patient 2
Motor Control CV Status StrengthPower Dynamic Balance
Patient 4
Hypothetical future clinic
Overview - REVIEW
bull What is required for successful locomotor rehabilitation
ndash Systematic measurement
ndash Intensity
ndash Task specific practice
ndash Adherence to guiding principles
bull What does evidence-based practice tell us about locomotor rehabilitation
bull Where to go from here and what will future generations of therapeutic practice include
bull Guideline 1 Maximize weight bearing on the legs
bull Guideline 2 Afford the sensory experience consistent with walking
bull Guideline 3 Optimize kinematics for each motor task
bull Guideline 4 Maximize recovery and independence minimize compensation
LT Guidelines
hellipadded Guidelines
bull Systematic
bull Intensive
bull Progressive
bull Repetitive
bull Measure outcomes
hellipplus Plasticity
bull Use it or lose it
bull Use it and improve it
bull Specificity
bull Repetition matters
bull Intensity matters
bull Time matters
bull Salience matters
bull Age matters
bull Transference
bull Interference
Future directions
bull Evaluation to yield meaningful theory-based information to help guide clinical decision making
bull Classification to help guide treatment options
bull Understand ways to build on base therapy depending on impairments while being consistent with training guidelines
bull What tx for whom when in what combination with other tx
bull Clinic as a laboratory
Steve Kautz PhD
Mark George MD
Chris Gregory PhD PT
Aaron Embry DPT MSCR
Lindsay Perry DPT NCS
Patrick Morgan MS
This material is based upon work supported by the Office of Research and Development Rehabilitation Research and Development Department of Veterans Affairs Career Development-1 Award (Project B7177M Bowden PI) SCTR Discovery Pilot Grant (Kautz PI) AHA Innovative Research Grant (Kautz PI) and VA RRampD Merit Award B3983R (Kautz PI) The contents do not represent the views of the Department of Veterans Affairs or the United States Government
Thanks to all of my mentors collaborators and funding sources
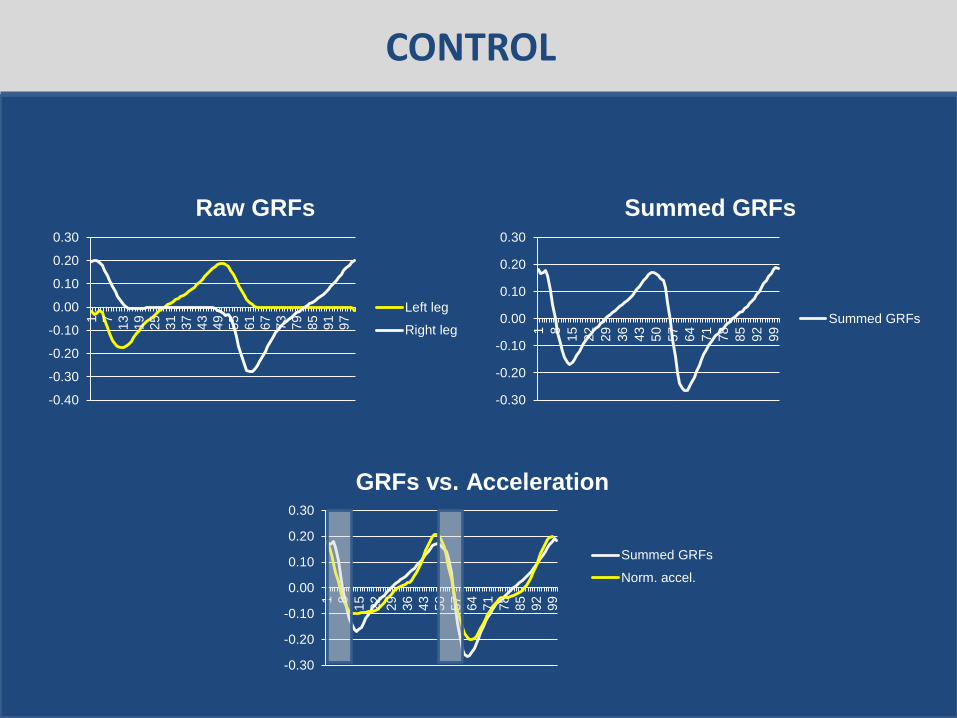
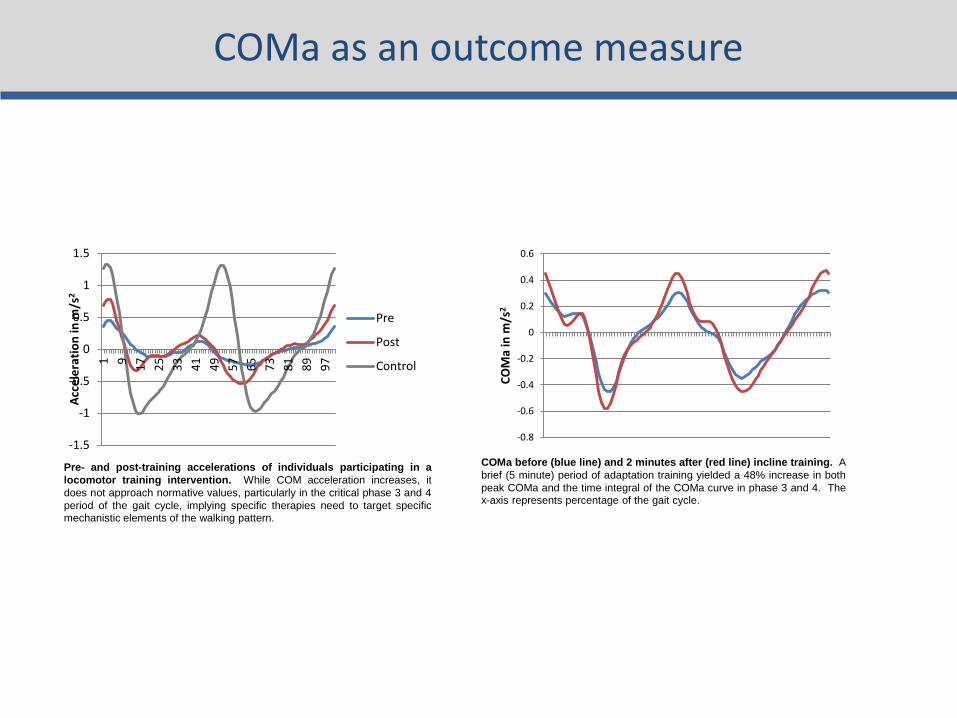
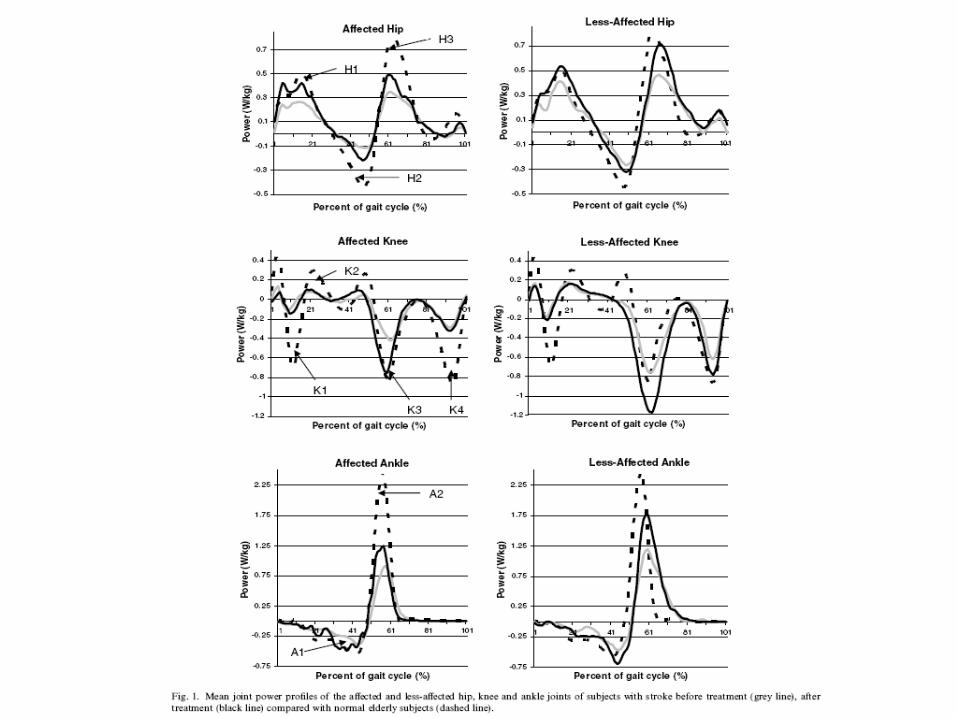
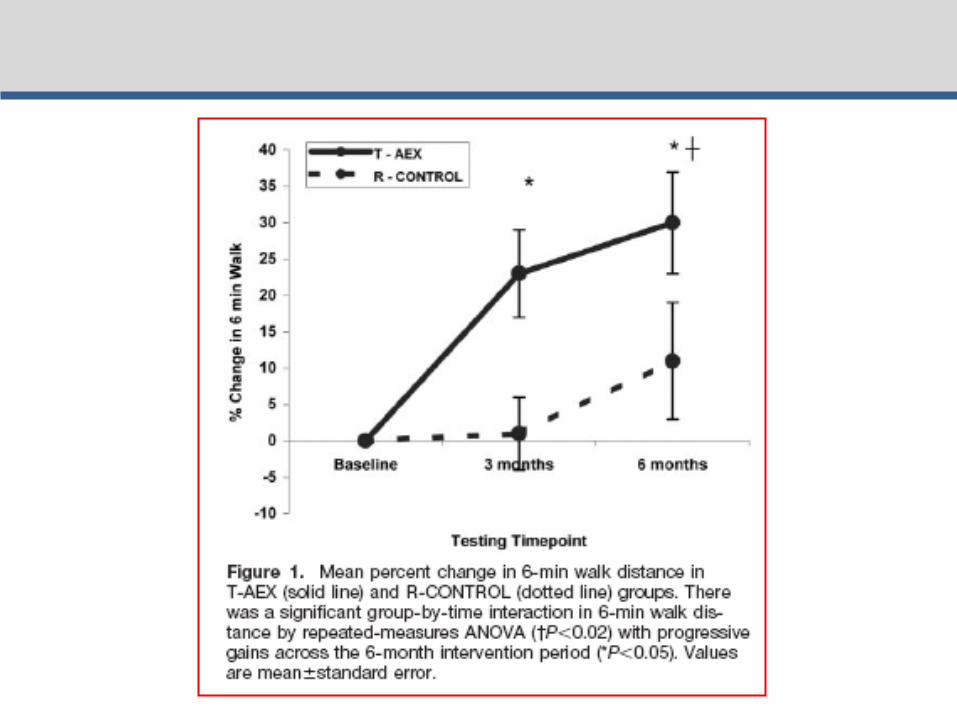