potassium nutrition of alfalfa. potassium (k) nutrition of alfalfa outline: 1.plant development...
TRANSCRIPT
Potassium Nutritionof Alfalfa
Potassium (K) Nutritionof Alfalfa
Outline:1. Plant development
2. Diagnosis
3. Yield and quality
4. Economics
5. Irrigation and record yields
6. Cation competition
7. Balanced nutrition
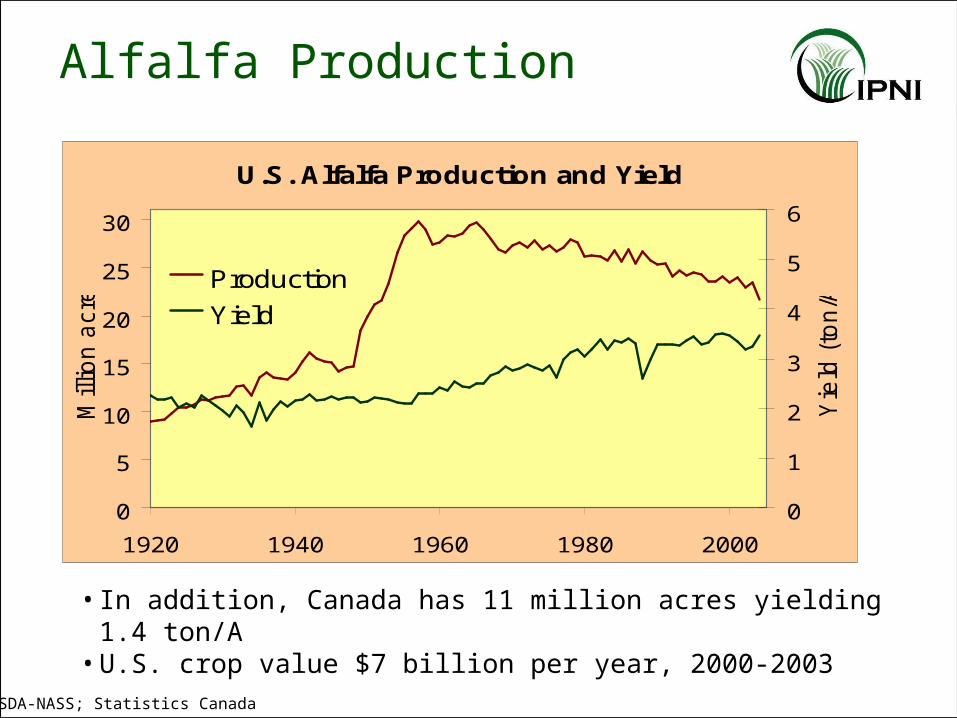
Alfalfa Production
U.S. Alfalfa Production and Yield
0
5
10
15
20
25
30
1920 1940 1960 1980 2000
Mill
ion
acre
s
0
1
2
3
4
5
6
Yie
ld (
ton
/A)Production
Yield
• In addition, Canada has 11 million acres yielding 1.4 ton/A• U.S. crop value $7 billion per year, 2000-2003
USDA-NASS; Statistics Canada
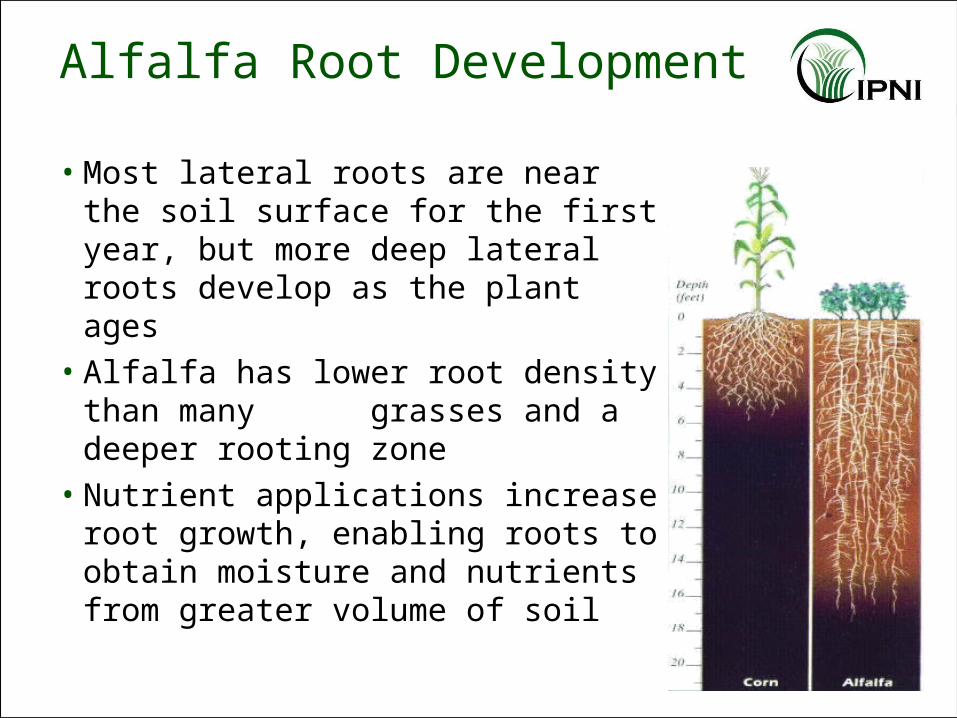
Alfalfa Root Development
• Most lateral roots are near the soil surface for the first year, but more deep lateral roots develop as the plant ages
• Alfalfa has lower root density than many grasses and a deeper rooting zone
• Nutrient applications increase root growth, enabling roots to obtain moisture and nutrients from greater volume of soil
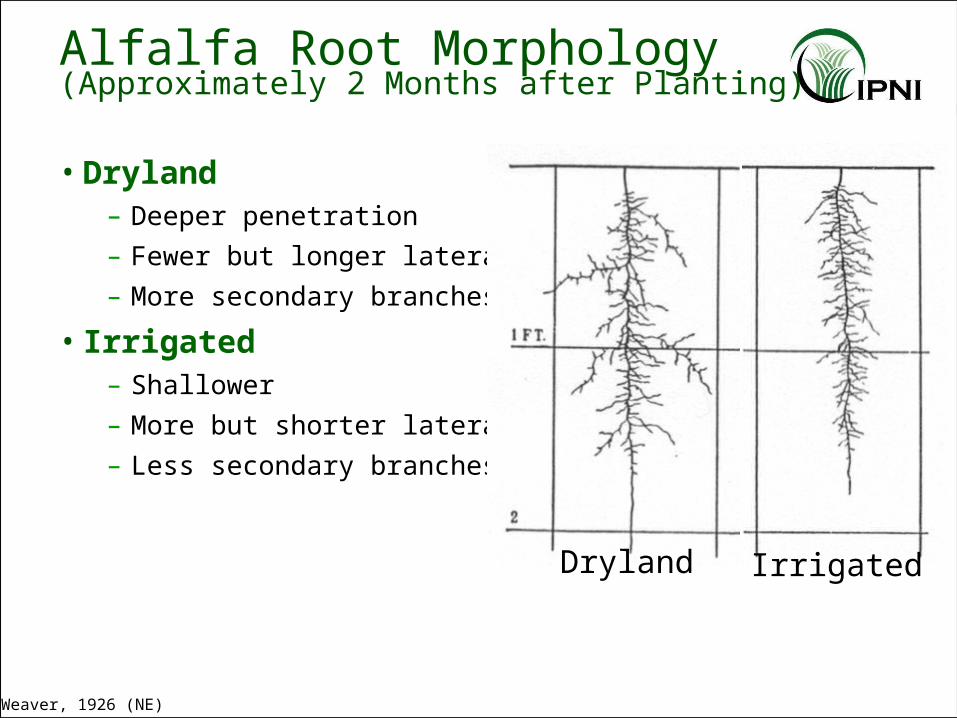
Alfalfa Root Morphology(Approximately 2 Months after Planting)
• Dryland– Deeper penetration
– Fewer but longer laterals
– More secondary branches
• Irrigated– Shallower
– More but shorter laterals
– Less secondary branches
Weaver, 1926 (NE)
Dryland Irrigated
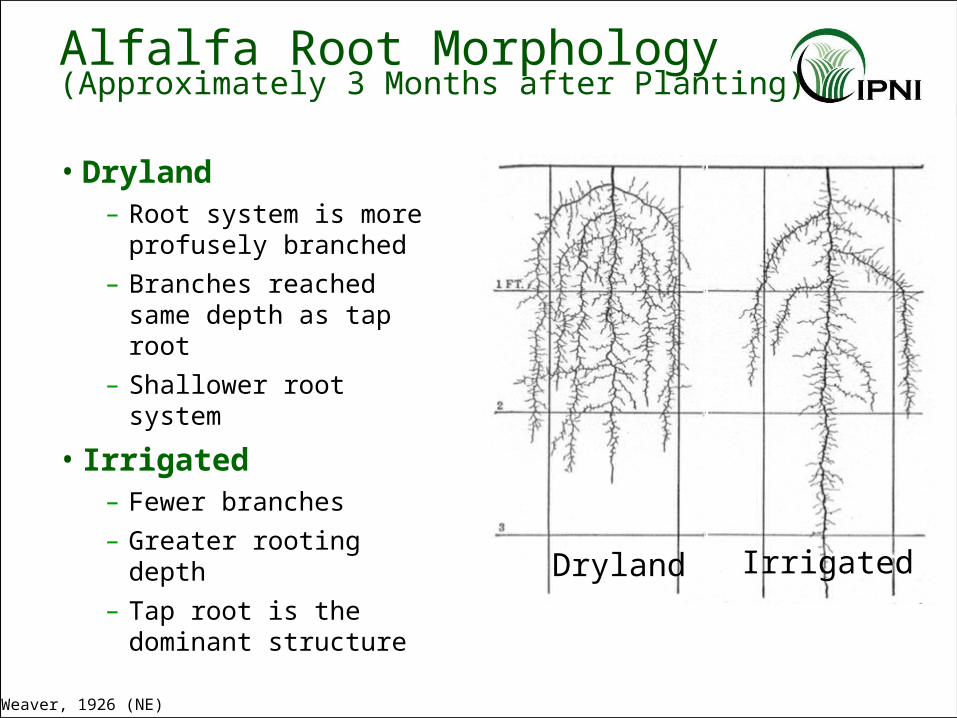
Alfalfa Root Morphology(Approximately 3 Months after Planting)
• Dryland– Root system is more
profusely branched
– Branches reached same depth as tap root
– Shallower root system
• Irrigated– Fewer branches
– Greater rooting depth
– Tap root is the dominant structure Dryland Irrigated
Weaver, 1926 (NE)
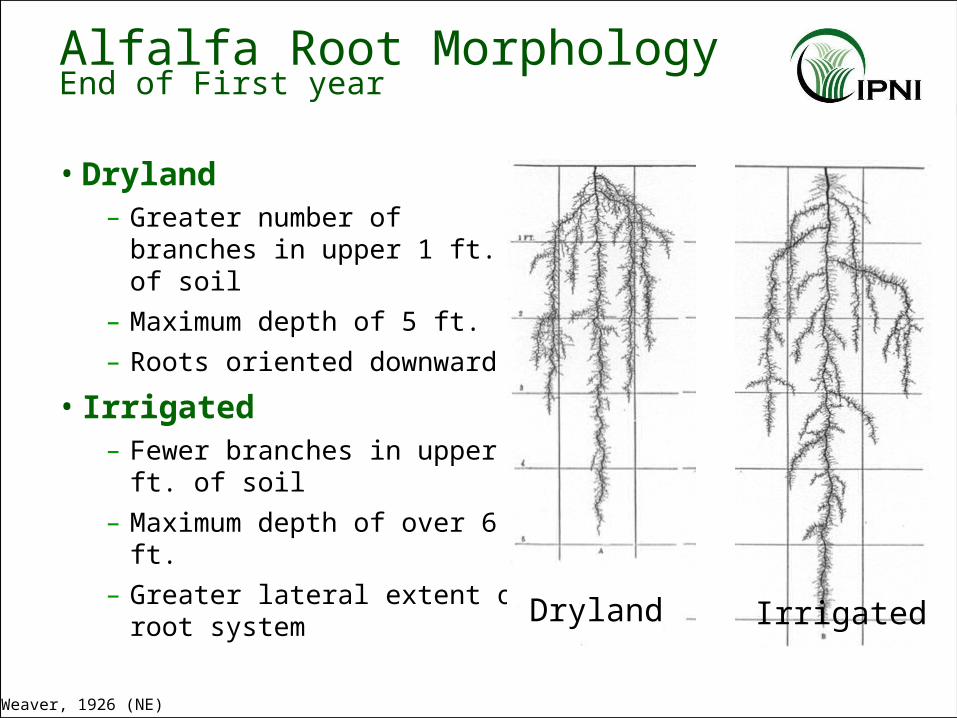
Alfalfa Root MorphologyEnd of First year
• Dryland– Greater number of branches in
upper 1 ft. of soil
– Maximum depth of 5 ft.
– Roots oriented downward
• Irrigated– Fewer branches in upper 1 ft. of
soil
– Maximum depth of over 6 ft.
– Greater lateral extent of root system
Dryland Irrigated
Weaver, 1926 (NE)
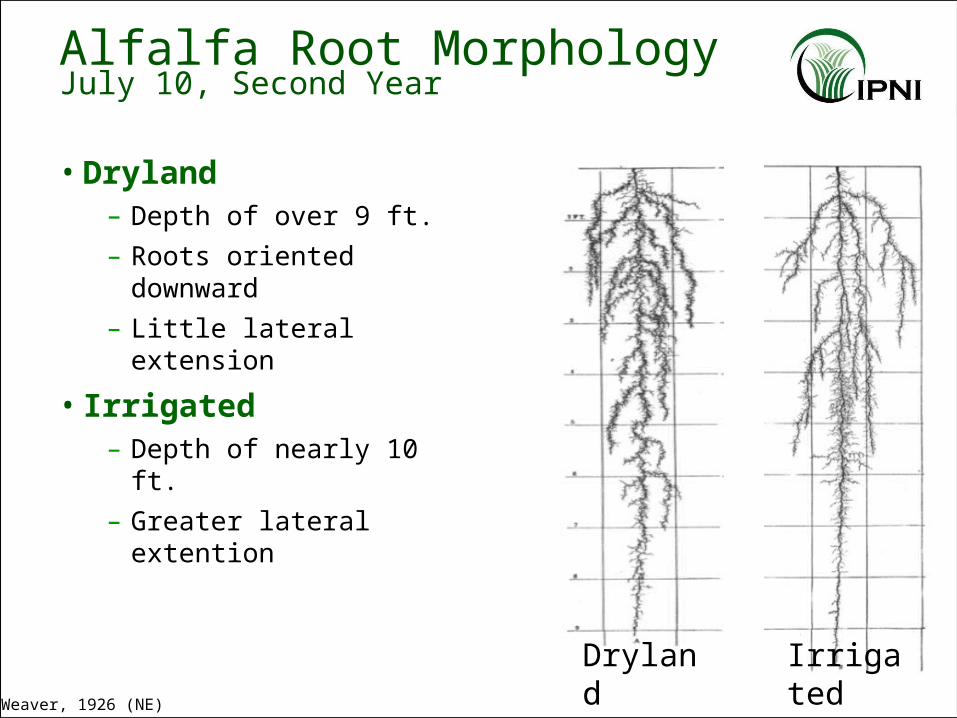
Alfalfa Root MorphologyJuly 10, Second Year
• Dryland– Depth of over 9 ft.
– Roots oriented downward
– Little lateral extension
• Irrigated– Depth of nearly 10 ft.
– Greater lateral extention
IrrigatedWeaver, 1926 (NE)
Dryland
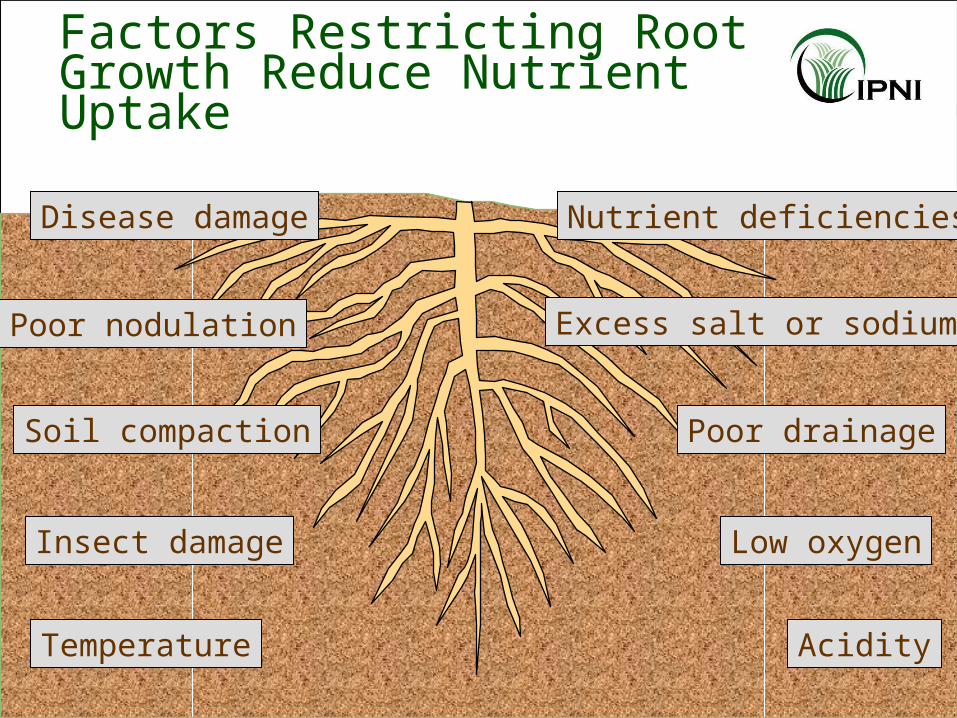
Factors Restricting Root Growth Reduce NutrientUptake
Disease damage
Insect damage
Temperature Acidity
Low oxygen
Poor drainage
Excess salt or sodium
Nutrient deficiencies
Poor nodulation
Soil compaction
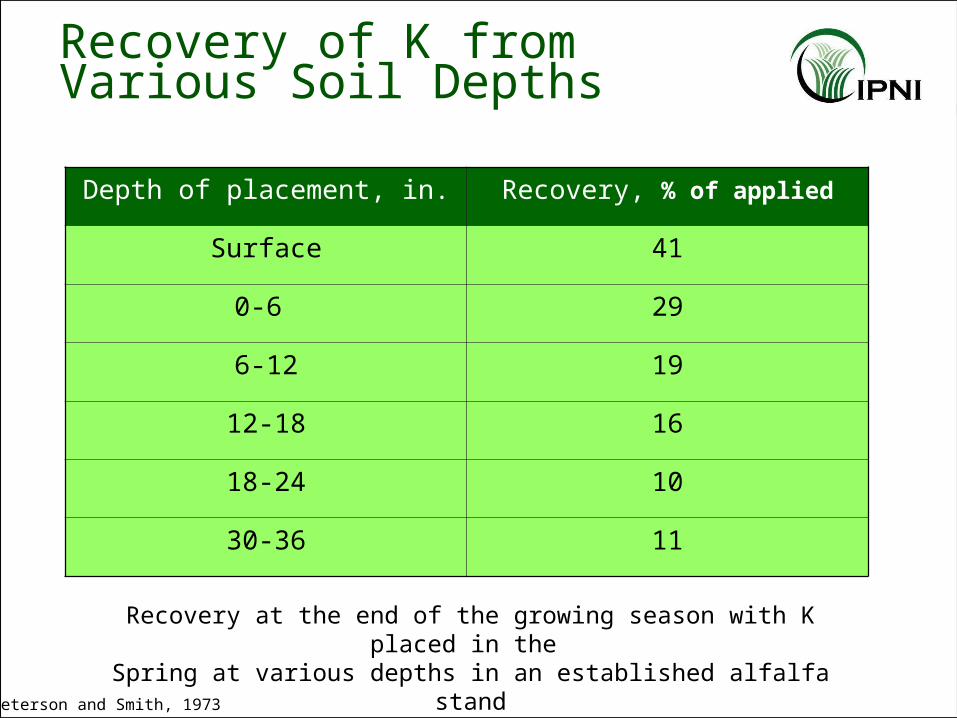
Recovery of K fromVarious Soil Depths
Depth of placement, in. Recovery, % of applied
Surface 41
0-6 29
6-12 19
12-18 16
18-24 10
30-36 11
Recovery at the end of the growing season with K placed in the Spring at various depths in an established alfalfa stand
Peterson and Smith, 1973
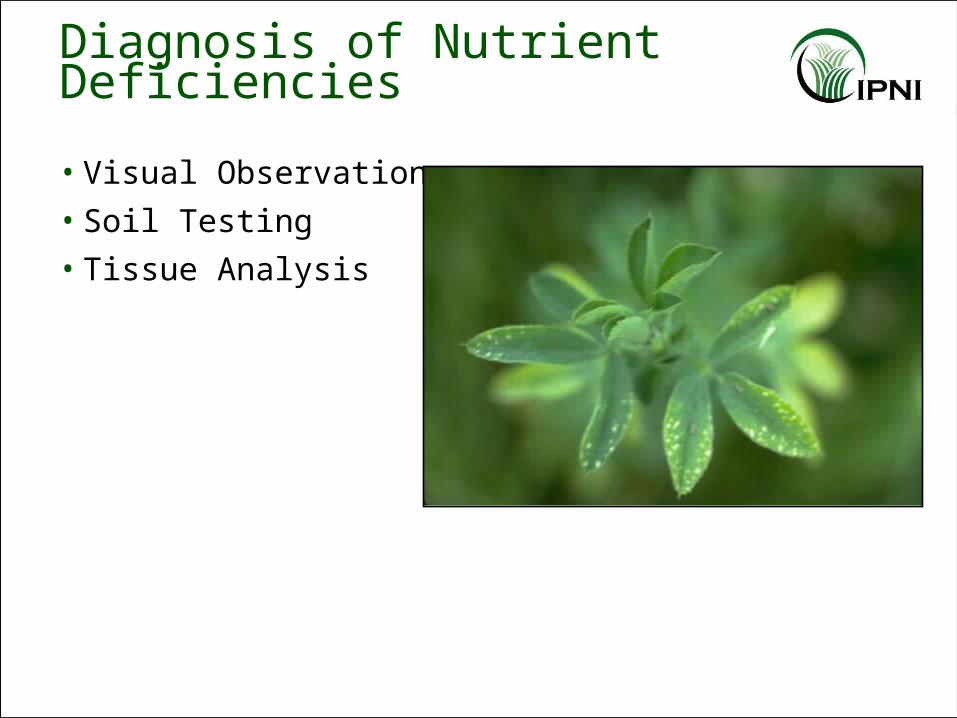
Diagnosis of Nutrient Deficiencies
• Visual Observation
• Soil Testing
• Tissue Analysis
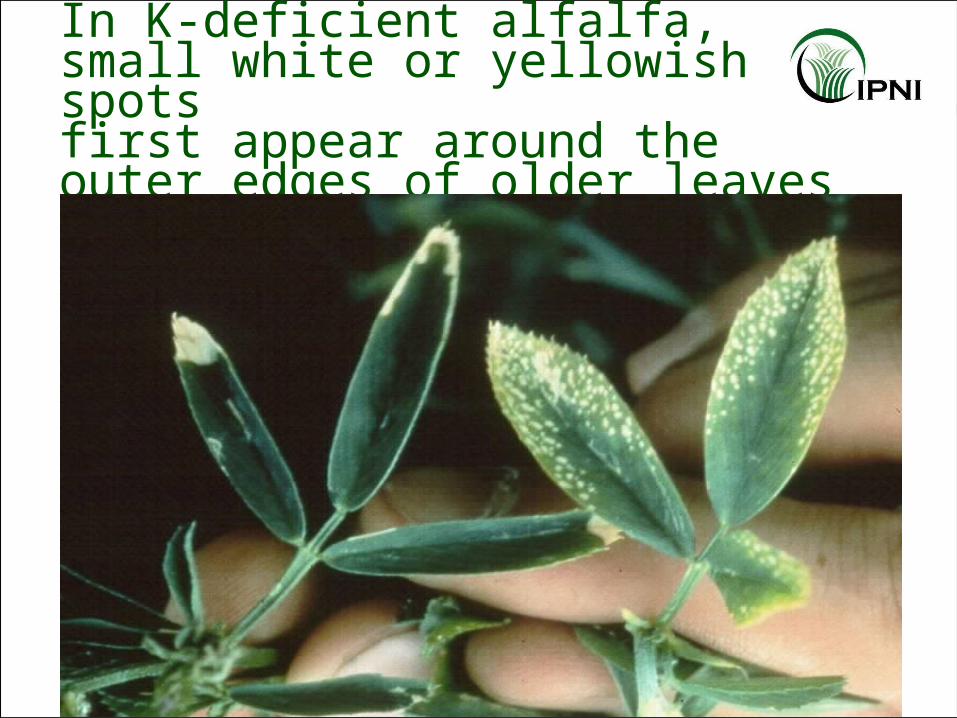
In K-deficient alfalfa, small white or yellowish spotsfirst appear around theouter edges of older leaves
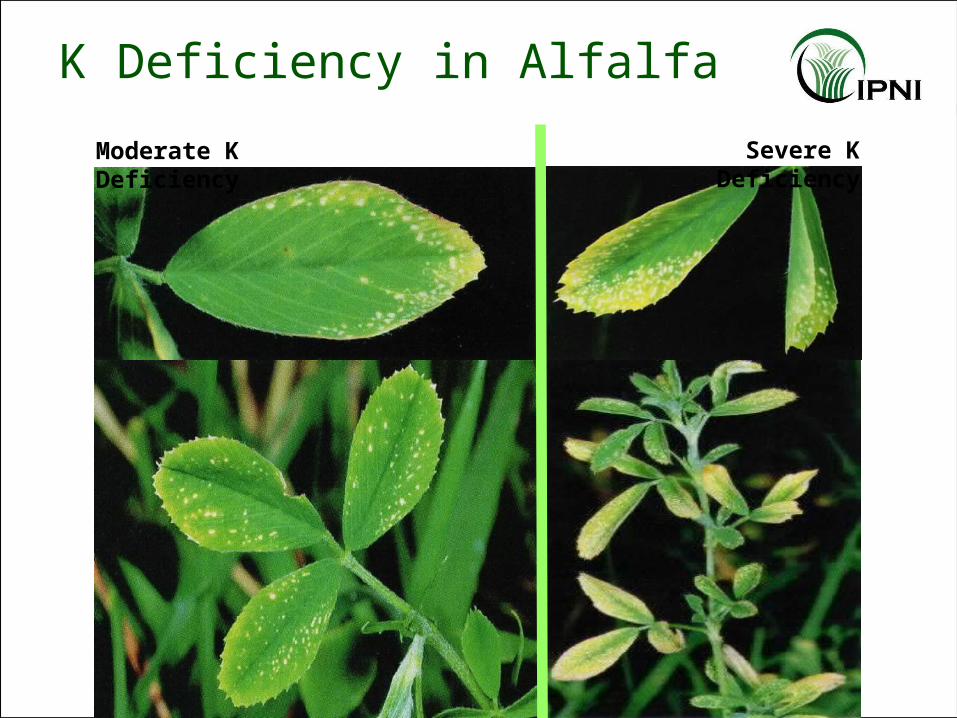
K Deficiency in Alfalfa
Moderate K Deficiency Severe K Deficiency
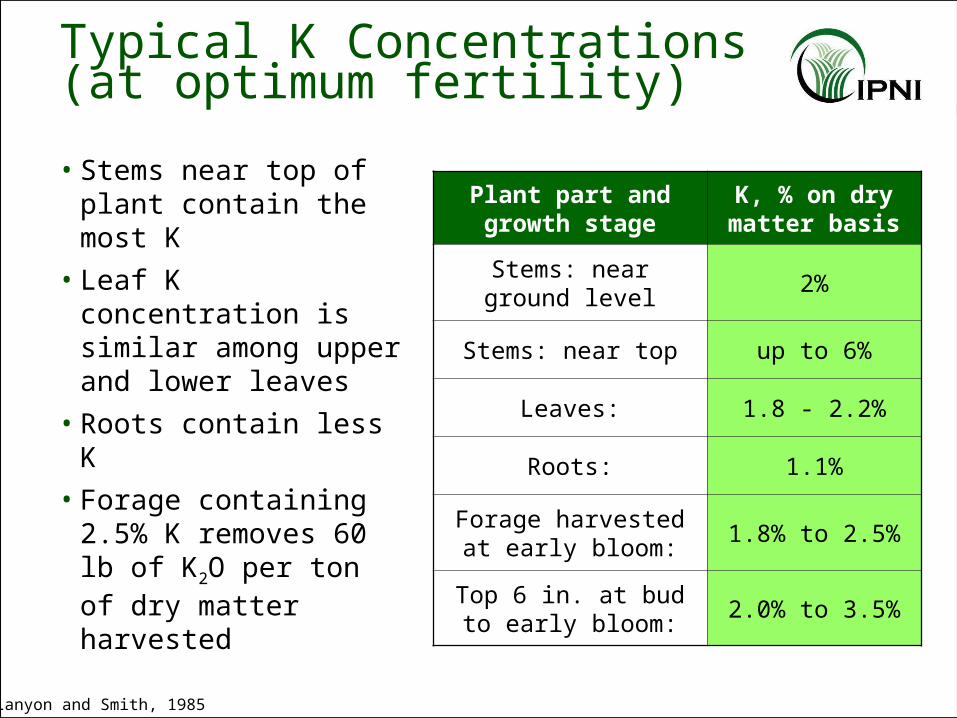
Typical K Concentrations(at optimum fertility)
• Stems near top of plant contain themost K
• Leaf K concentration is similar among upper and lower leaves
• Roots contain less K
• Forage containing 2.5% K removes 60 lb of K2O per ton of dry matter harvested
Plant part andgrowth stage
K, % on dry matter basis
Stems: near ground level
2%
Stems: near top up to 6%
Leaves: 1.8 - 2.2%
Roots: 1.1%
Forage harvested at early bloom:
1.8% to 2.5%
Top 6 in. at bud to early bloom:
2.0% to 3.5%
Lanyon and Smith, 1985
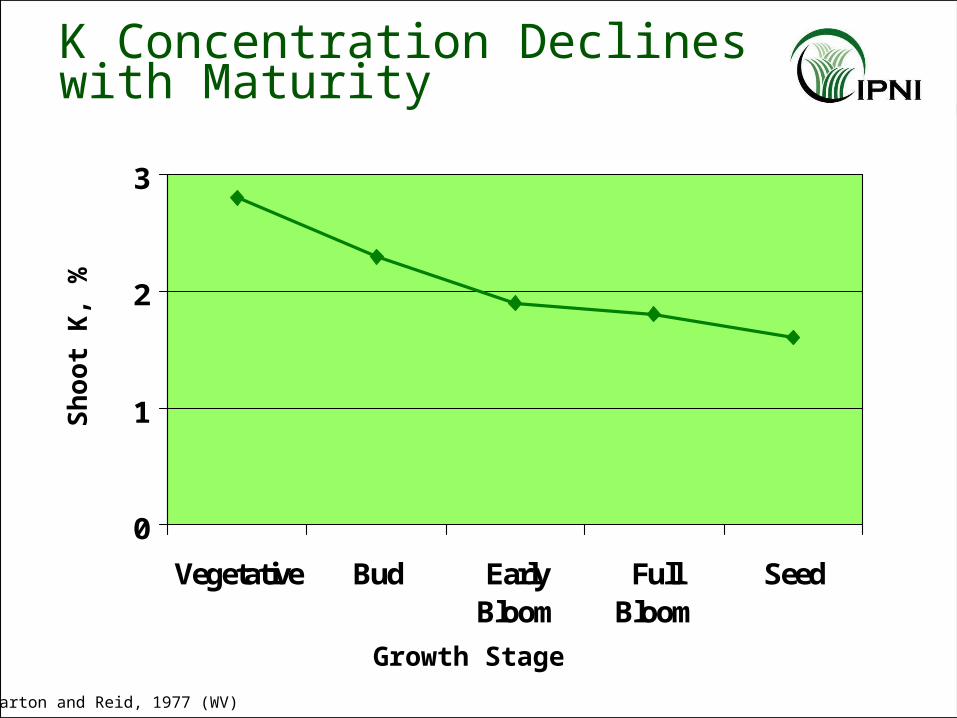
K Concentration Declineswith Maturity
Barton and Reid, 1977 (WV)
0
1
2
3
Vegetative Bud EarlyBloom
FullBloom
Seed
Growth Stage
Sh
oo
t K
, %
Soil Testing andPlant Analysis
• Soil Testing– Verify that K levels are being maintained
– Soil pH 6.5 or higher for efficient N fixation
• Plant Analysis– Usually sample the top 6 in. at harvest
– Indication of adequate K fertility:• <2% indicates insufficient K for winter hardiness
• Optimum yields usually contain around 2.5% K
• Record yield of 10 tons/A (non-irrigated), K content of 3%
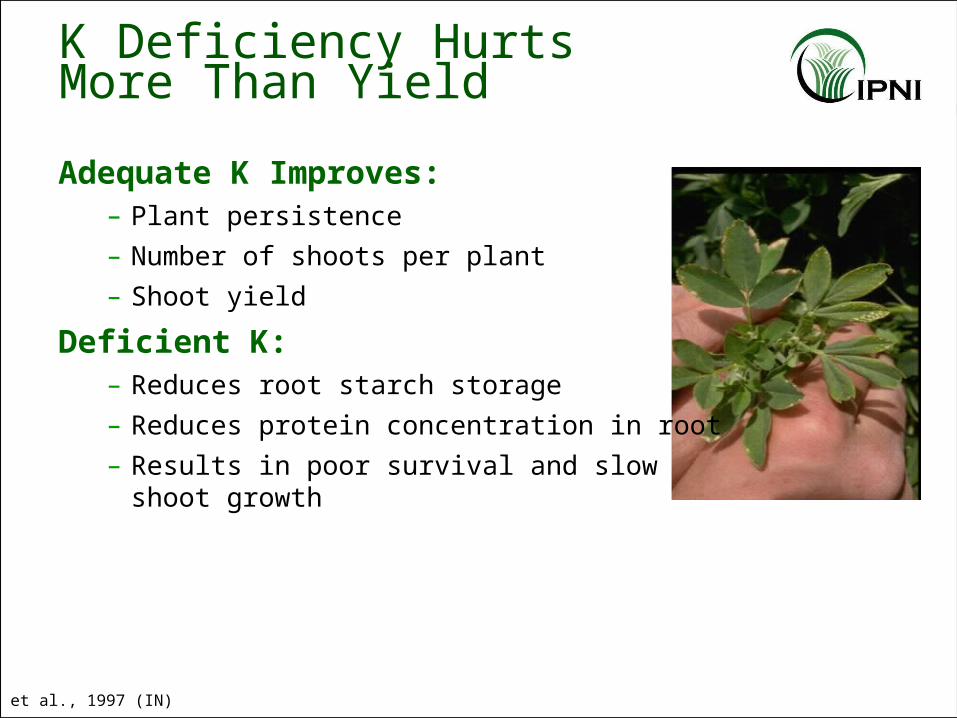
K Deficiency Hurts More Than Yield
Adequate K Improves:– Plant persistence
– Number of shoots per plant
– Shoot yield
Deficient K:– Reduces root starch storage
– Reduces protein concentration in root
– Results in poor survival and slowshoot growth
Li et al., 1997 (IN)
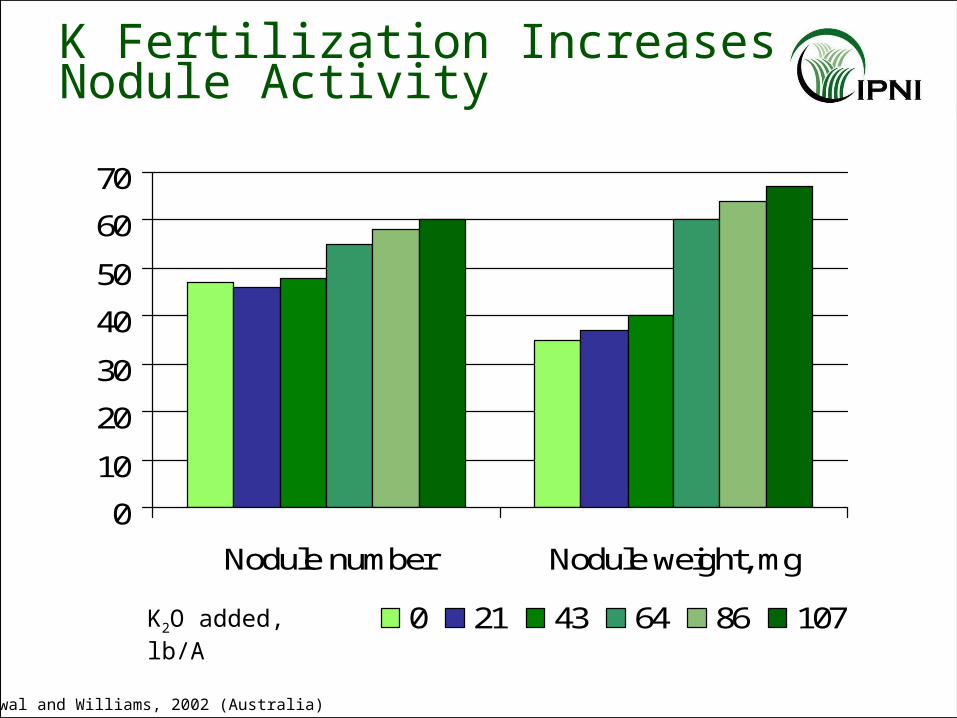
0
10
20
30
40
50
60
70
Nodule number Nodule weight, mg
0 21 43 64 86 107K2O added, lb/A
Grewal and Williams, 2002 (Australia)
K Fertilization IncreasesNodule Activity
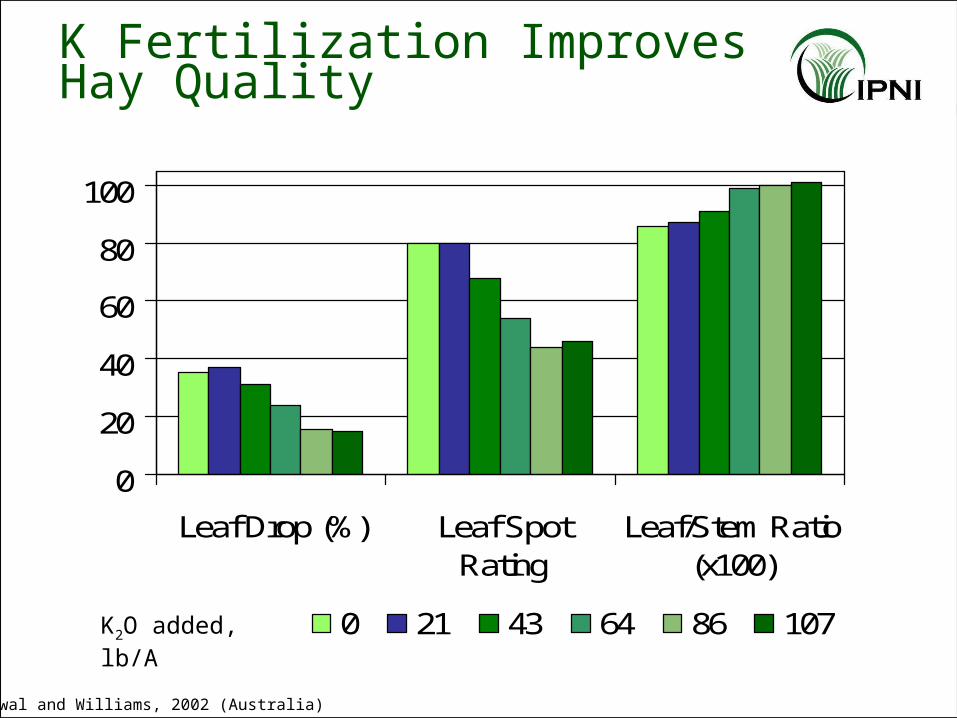
0
20
40
60
80
100
Leaf Drop (%) Leaf SpotRating
Leaf/Stem Ratio(x100)
0 21 43 64 86 107K2O added, lb/A
K Fertilization ImprovesHay Quality
Grewal and Williams, 2002 (Australia)
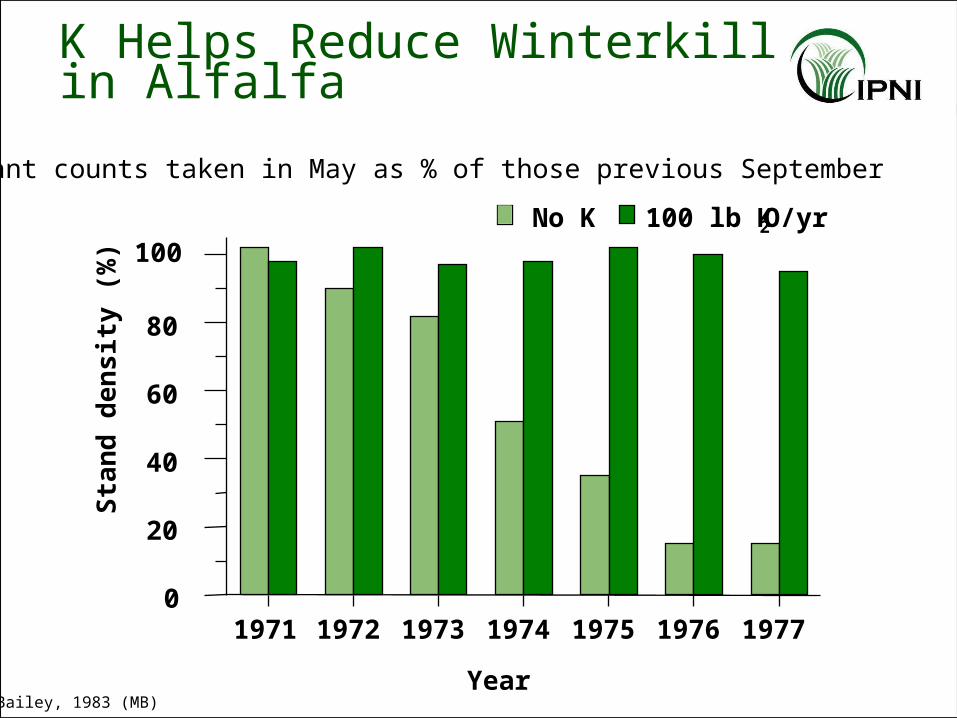
Plant counts taken in May as % of those previous September
Bailey, 1983 (MB)
K Helps Reduce Winterkillin Alfalfa
100
1971 1972 1973 1974 1975 1976 19770
20
40
60
80
Sta
nd
de
ns
ity
(%
)
100 lb K2O/yrNo K
Year
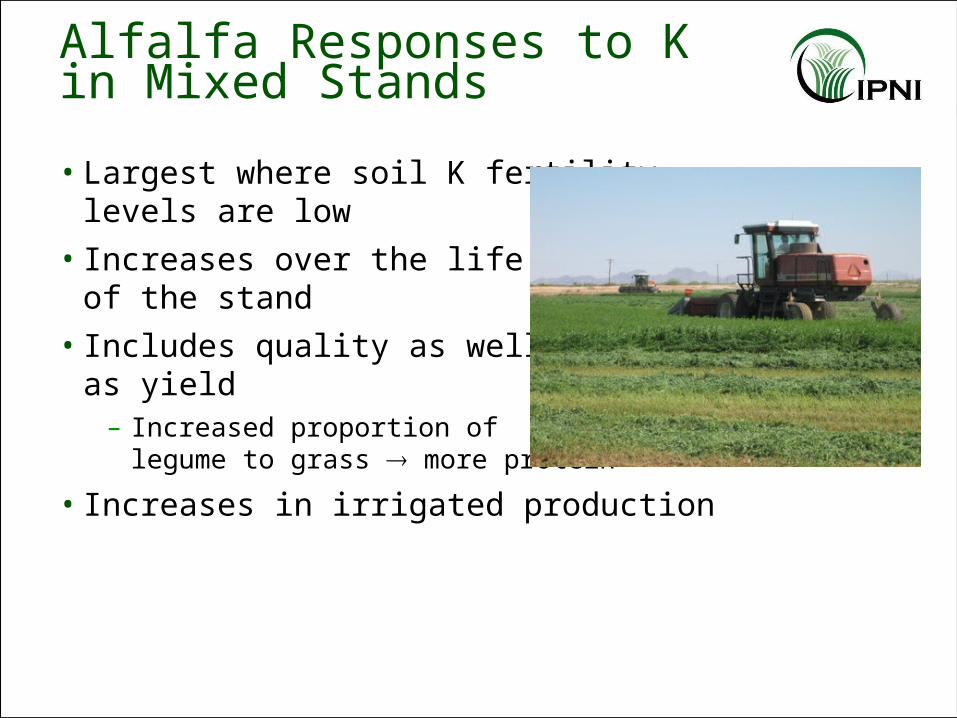
Alfalfa Responses to Kin Mixed Stands
• Largest where soil K fertilitylevels are low
• Increases over the lifeof the stand
• Includes quality as wellas yield
– Increased proportion oflegume to grass more protein
• Increases in irrigated production
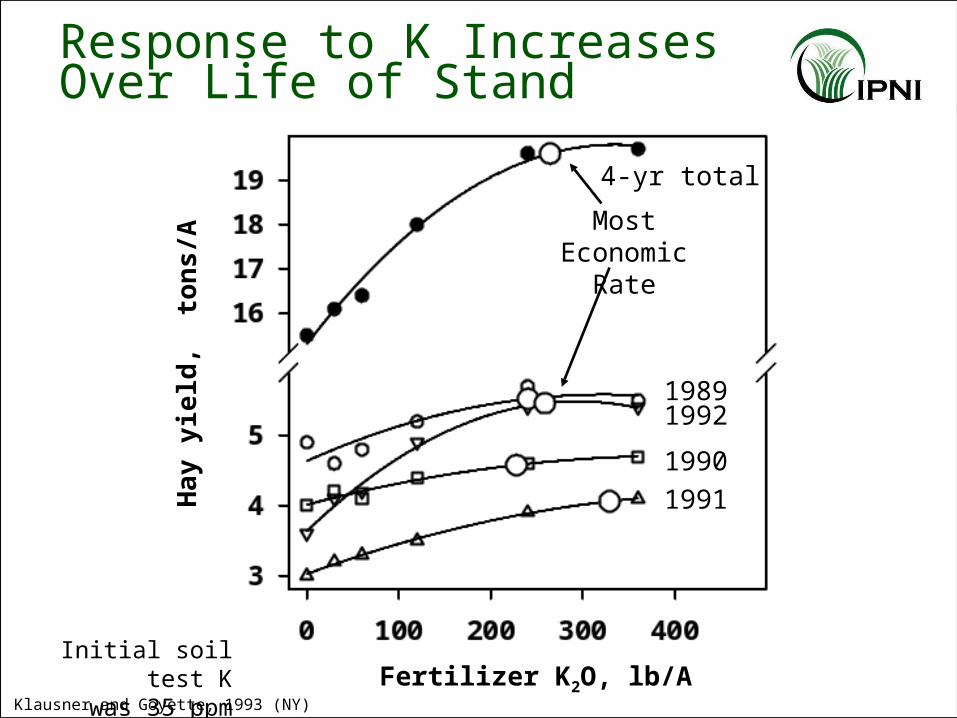
Ha
y y
ield
, to
ns
/A
Fertilizer K2O, lb/AInitial soil test K
was 35 ppm (low)
4-yr total
19891992
1990
1991
Most Economic Rate
Klausner and Goyette, 1993 (NY)
Response to K IncreasesOver Life of Stand
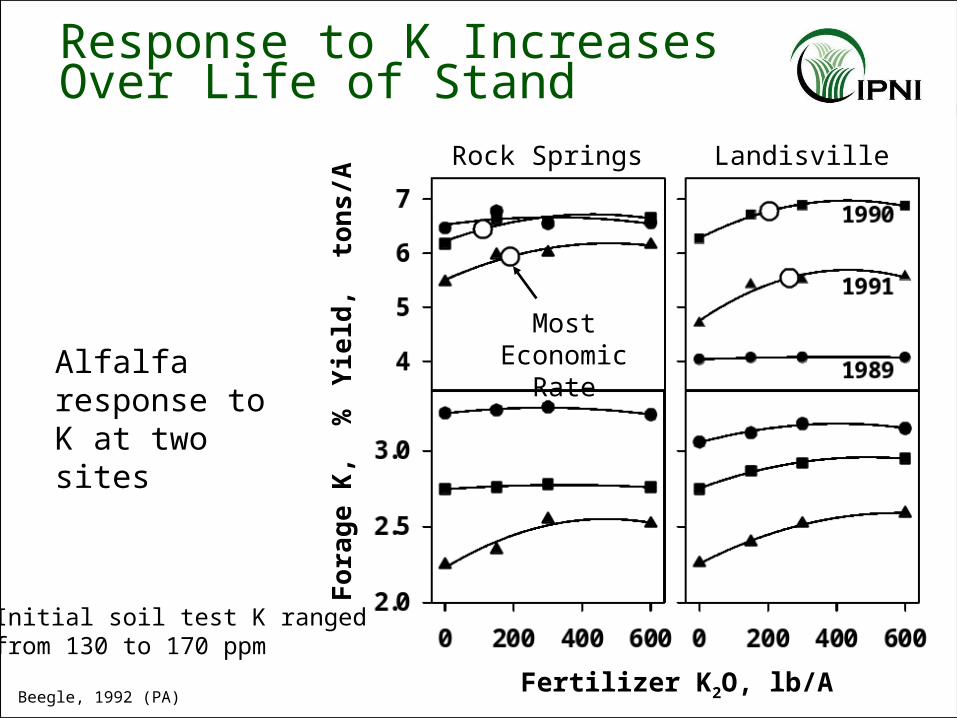
Rock Springs Landisville
Yie
ld,
ton
s/A
Fo
rag
e K
, %
Fertilizer K2O, lb/A
Alfalfa response to K at two sites
Most Economic Rate
Beegle, 1992 (PA)
Initial soil test K rangedfrom 130 to 170 ppm
Response to K IncreasesOver Life of Stand
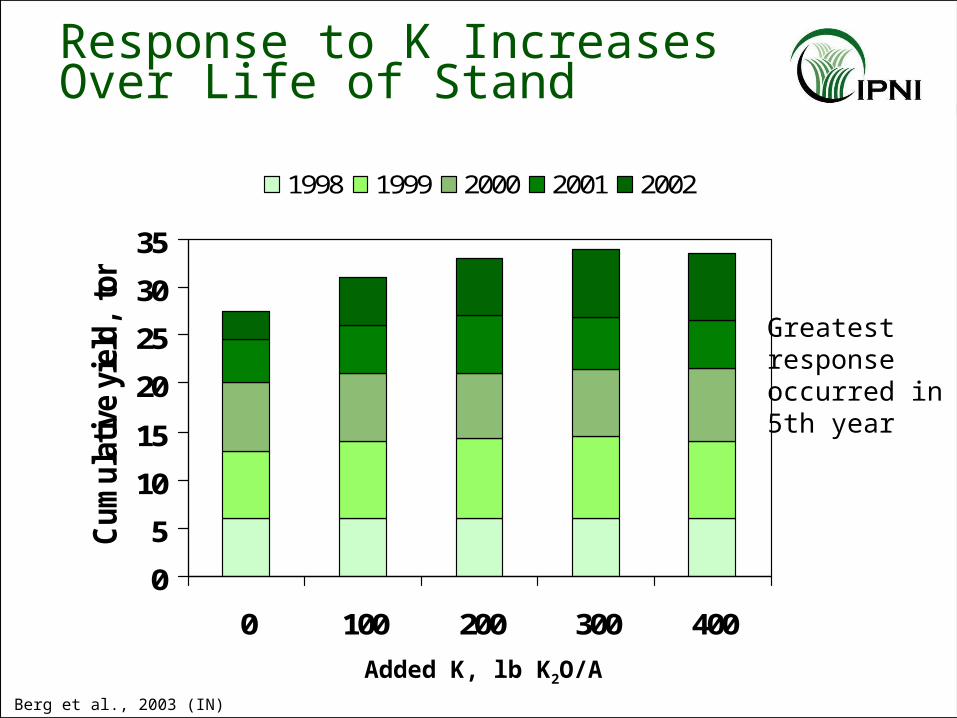
Berg et al., 2003 (IN)
0
5
10
15
20
25
30
35
0 100 200 300 400
Cum
ula
tive
yie
ld, ton/A
1998 1999 2000 2001 2002
Added K, lb K2O/A
Greatestresponseoccurred in5th year
Response to K IncreasesOver Life of Stand
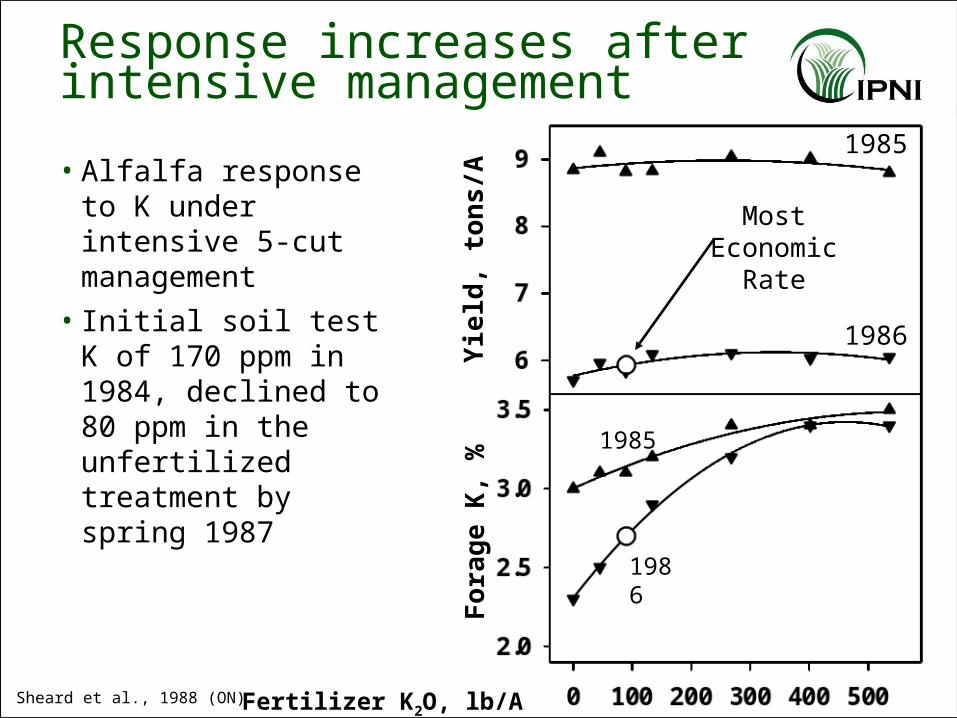
Yie
ld, t
on
s/A
Fertilizer K2O, lb/A
Fo
rag
e K
, %
Most Economic Rate
1985
1986
Sheard et al., 1988 (ON)
1985
1986
Response increases after intensive management
• Alfalfa response to K under intensive 5-cut management
• Initial soil test K of 170 ppm in 1984, declined to 80 ppm in the unfertilized treatment by spring 1987
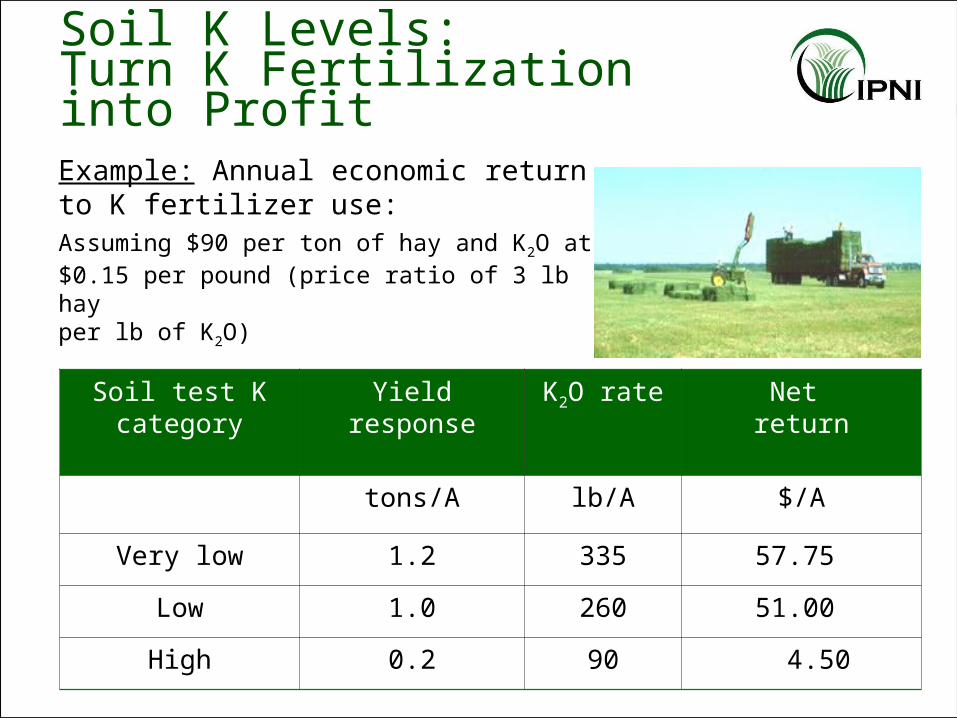
Soil K Levels:Turn K Fertilizationinto ProfitExample: Annual economic returnto K fertilizer use:Assuming $90 per ton of hay and K2O at $0.15 per pound (price ratio of 3 lb hayper lb of K2O)
Soil test Kcategory
Yieldresponse
K2O rate Net return
tons/A lb/A $/A
Very low 1.2 335 57.75
Low 1.0 260 51.00
High 0.2 90 4.50
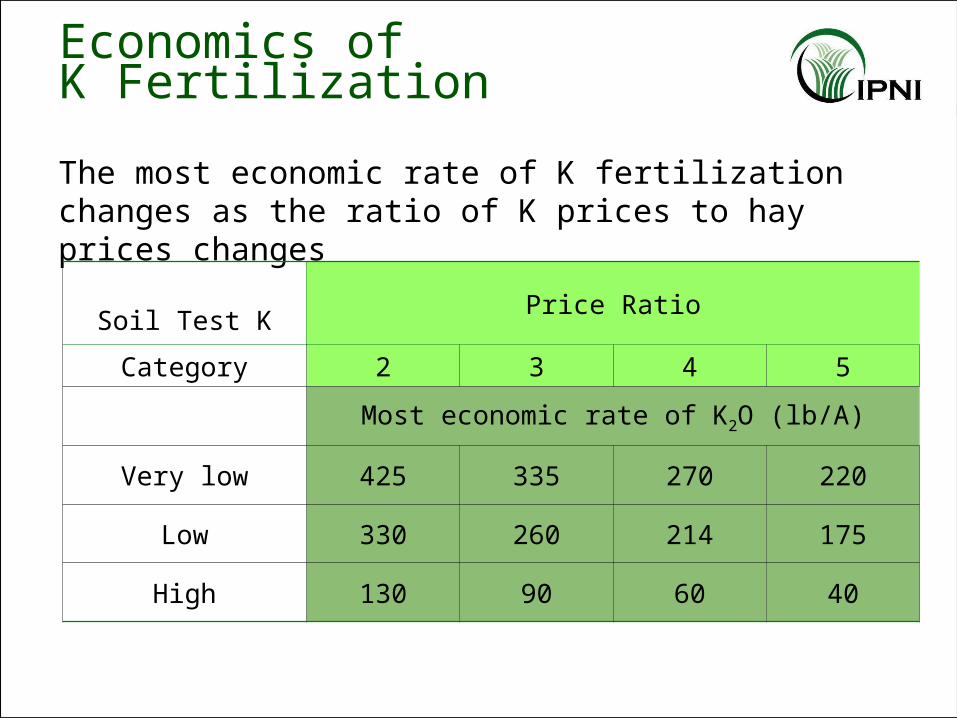
Economics ofK Fertilization
The most economic rate of K fertilization changes as the ratio of K prices to hay prices changes
Soil Test KPrice Ratio
Category 2 3 4 5
Most economic rate of K2O (lb/A)
Very low 425 335 270 220
Low 330 260 214 175
High 130 90 60 40
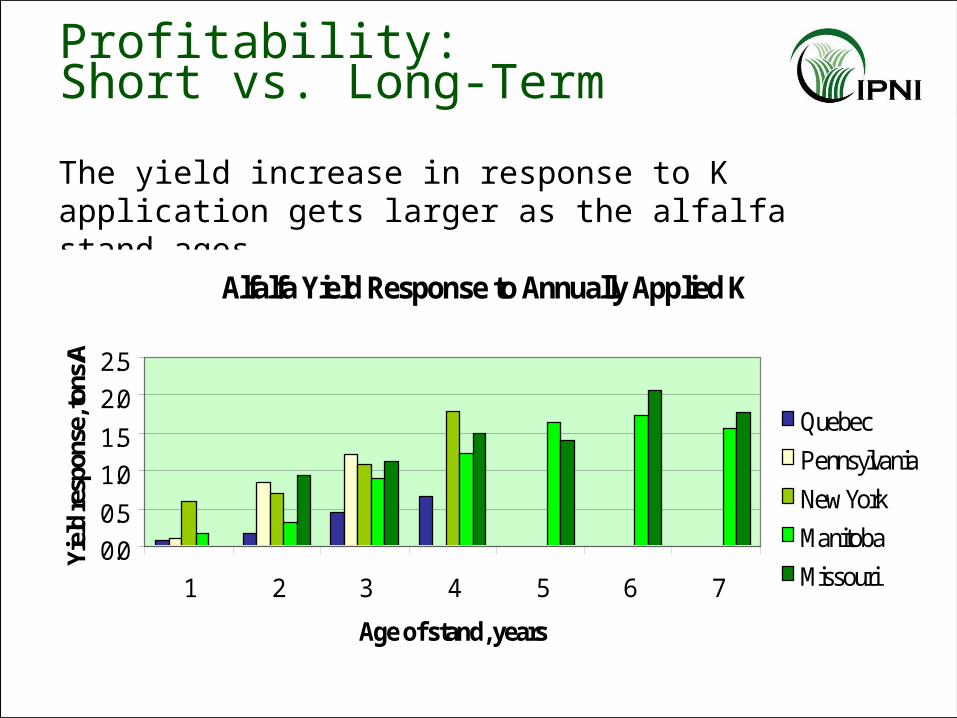
Profitability:Short vs. Long-Term
The yield increase in response to K application gets larger as the alfalfa stand ages
Alfalfa Yield Response to Annually Applied K
0.0
0.5
1.0
1.5
2.0
2.5
1 2 3 4 5 6 7
Age of stand, years
Yiel
d re
spon
se, t
ons/
A
Quebec
Pennsylvania
New York
Manitoba
Missouri
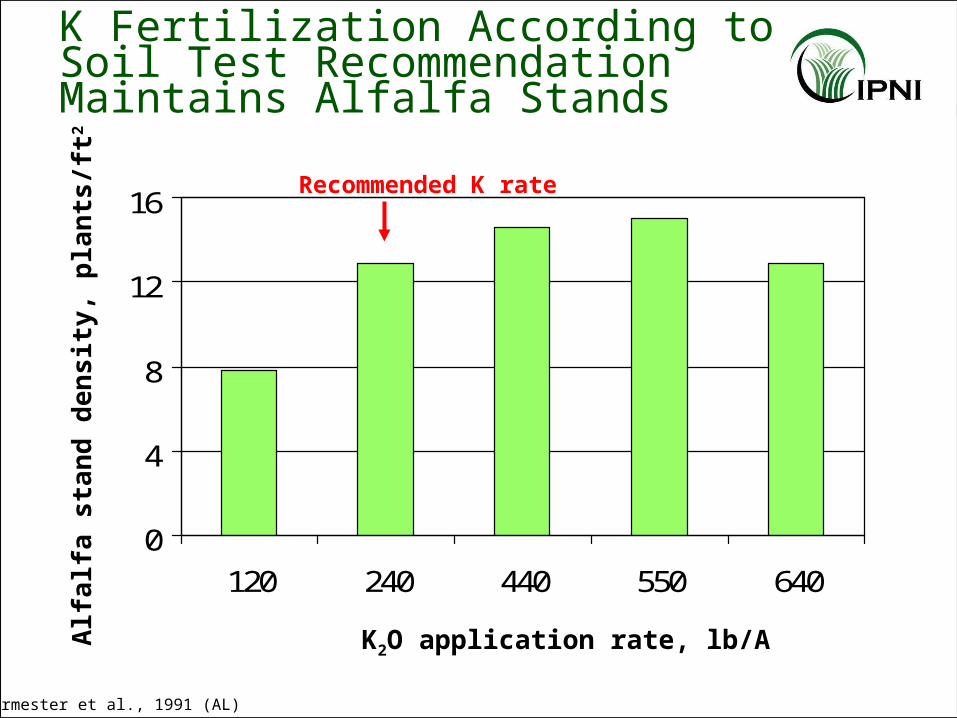
Burmester et al., 1991 (AL)
0
4
8
12
16
120 240 440 550 640
K2O application rate, lb/A
Alf
alf
a s
tan
d d
ens
ity,
pla
nts
/ft2
K Fertilization According toSoil Test RecommendationMaintains Alfalfa Stands
Recommended K rate
Follet and Wilkinson, 1995
0
1
2
3
4.5 5 5.5 6 6.5 7
Soil pH
Yie
ld, t
on
s/A
Alfalfa Response to Soil pH
Walworth and Sumner, 1990 (GA)
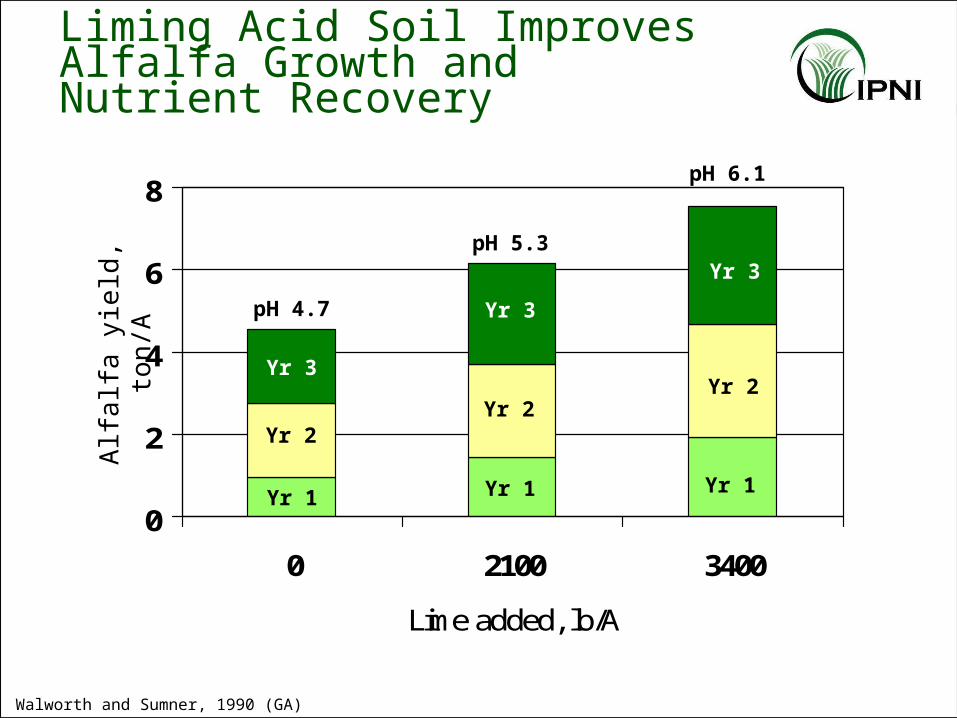
Liming Acid Soil Improves Alfalfa Growth andNutrient Recovery
0
2
4
6
8
0 2100 3400
Lime added, lb/A
Yr 1Yr 1Yr 1
Yr 2
Yr 2Yr 2
Yr 3
Yr 3
Yr 3pH 5.3
pH 6.1
pH 4.7
Alfa
lfa y
ield
, to
n/A
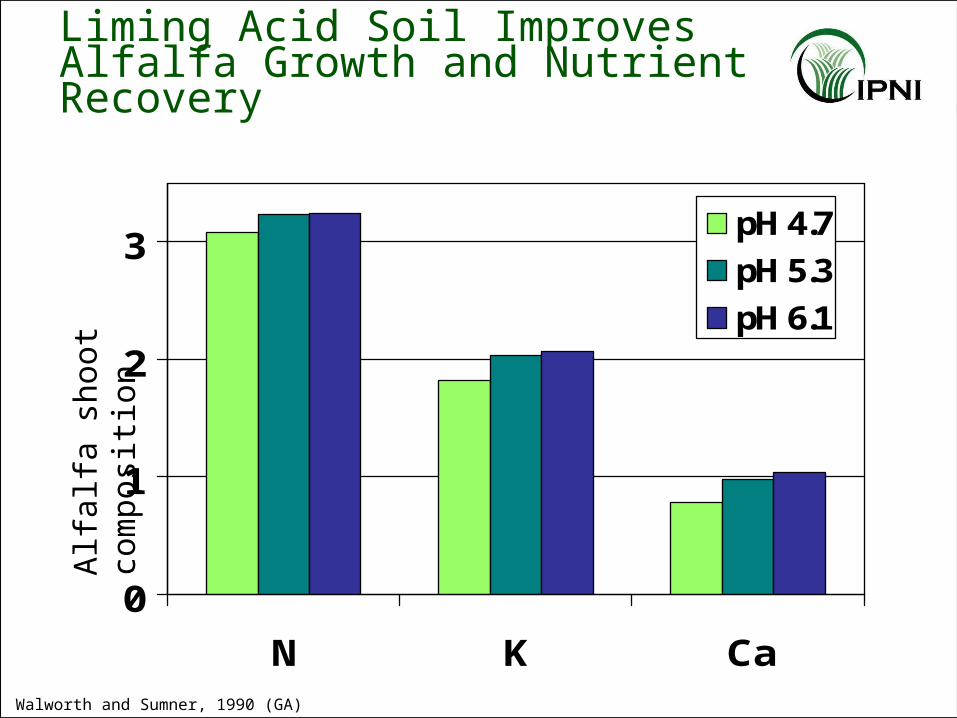
Liming Acid Soil Improves Alfalfa Growth and NutrientRecovery
Walworth and Sumner, 1990 (GA)
0
1
2
3
N K Ca
pH 4.7
pH 5.3
pH 6.1
Alfa
lfa s
hoot
com
posi
tion
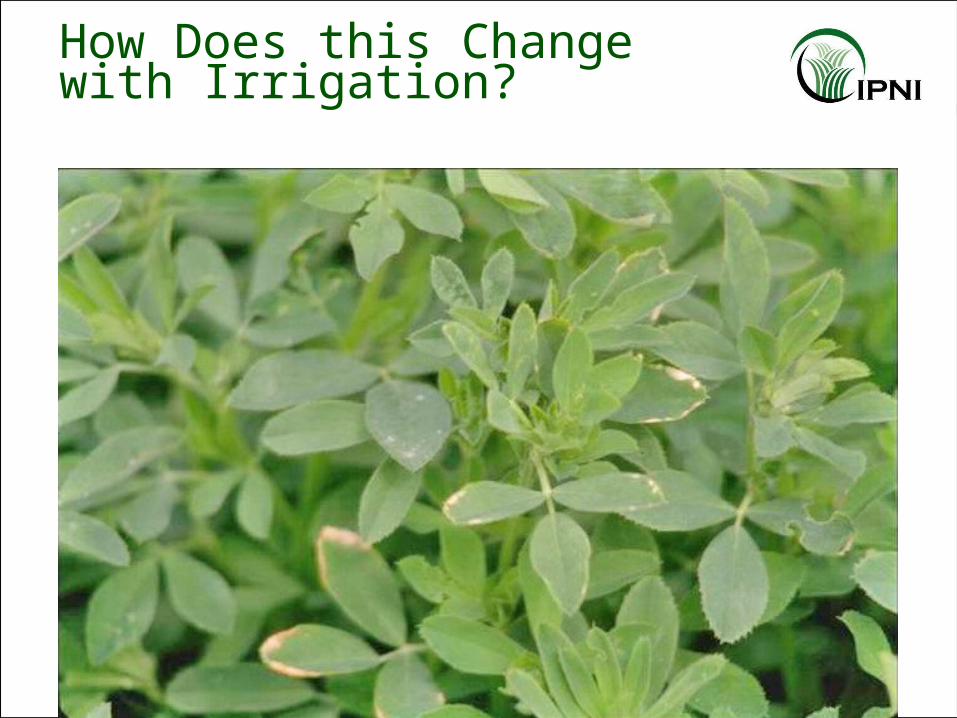
How Does this Changewith Irrigation?
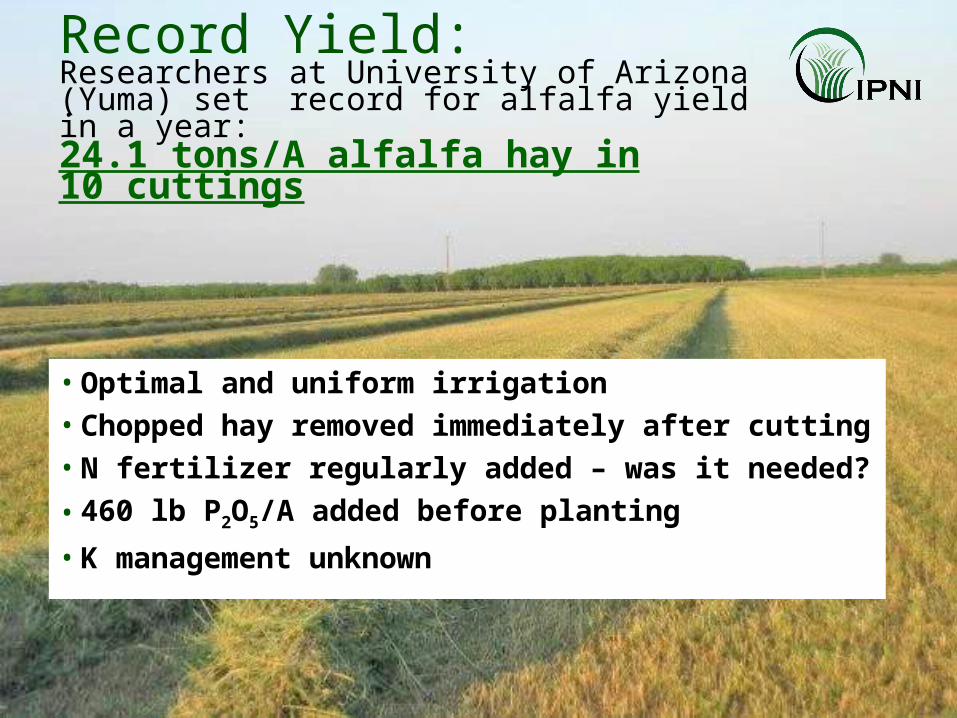
Record Yield:Researchers at University of Arizona(Yuma) set record for alfalfa yieldin a year:24.1 tons/A alfalfa hay in10 cuttings
• Optimal and uniform irrigation• Chopped hay removed immediately after cutting• N fertilizer regularly added – was it needed?
• 460 lb P2O5/A added before planting
• K management unknown
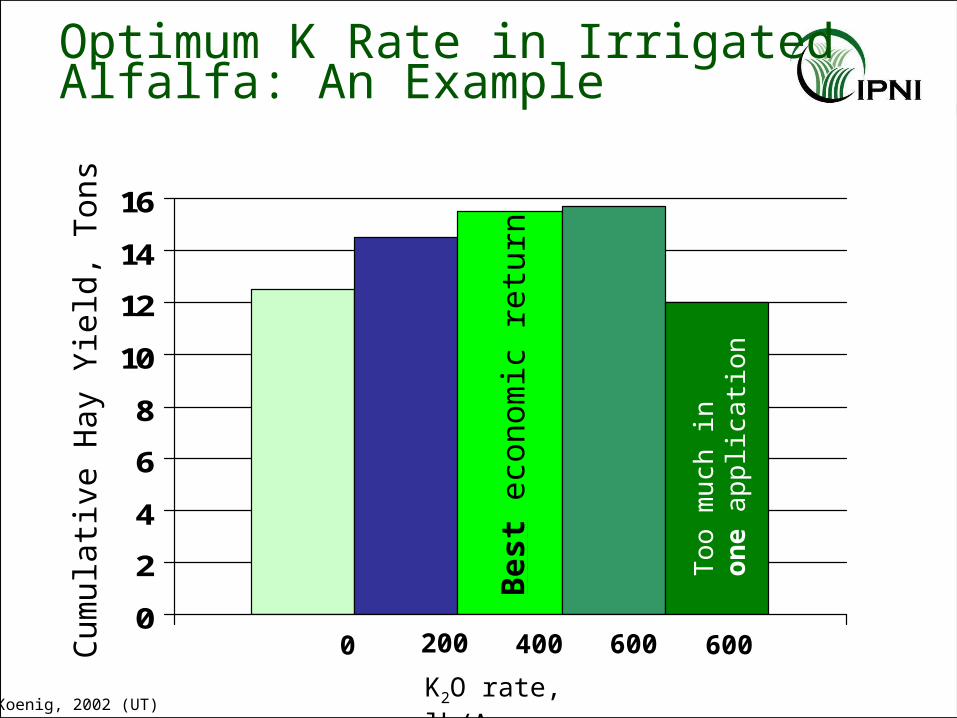
0
2
4
6
8
10
12
14
16
Cum
ulat
ive
Hay
Yie
ld,
Ton
s
K2O rate, lb/A
0 200 400 600 600
Optimum K Rate in Irrigated Alfalfa: An Example
Koenig, 2002 (UT)
Bes
t ec
onom
ic r
etu r
n
To
o m
uch
in
on
e ap
plic
atio
n
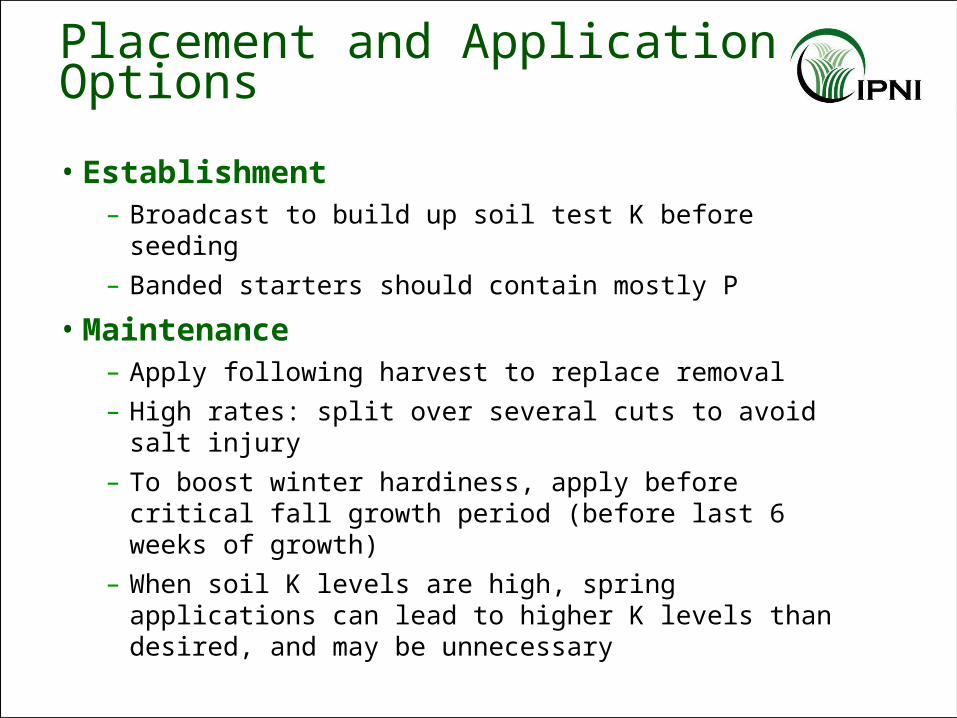
Placement and Application Options
• Establishment– Broadcast to build up soil test K before seeding
– Banded starters should contain mostly P
• Maintenance– Apply following harvest to replace removal
– High rates: split over several cuts to avoid salt injury
– To boost winter hardiness, apply before critical fall growth period (before last 6 weeks of growth)
– When soil K levels are high, spring applications can lead to higher K levels than desired, and may be unnecessary
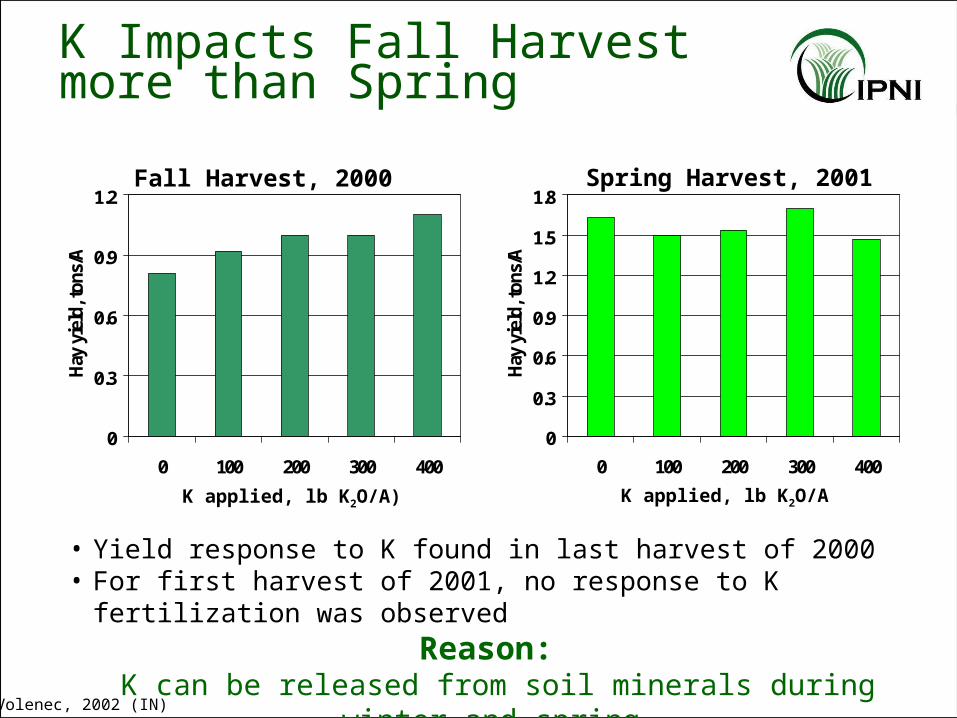
• Yield response to K found in last harvest of 2000 • For first harvest of 2001, no response to K fertilization was observed
Reason:K can be released from soil minerals during winter and spring
Volenec, 2002 (IN)
K Impacts Fall Harvestmore than Spring
0
0.3
0.6
0.9
1.2
0 100 200 300 400
Hay
yie
ld, t
ons/
A
Fall Harvest, 2000
K applied, lb K2O/A)
0
0.3
0.6
0.9
1.2
1.5
1.8
0 100 200 300 400
Hay
yie
ld, t
ons/
A
Spring Harvest, 2001
K applied, lb K2O/A
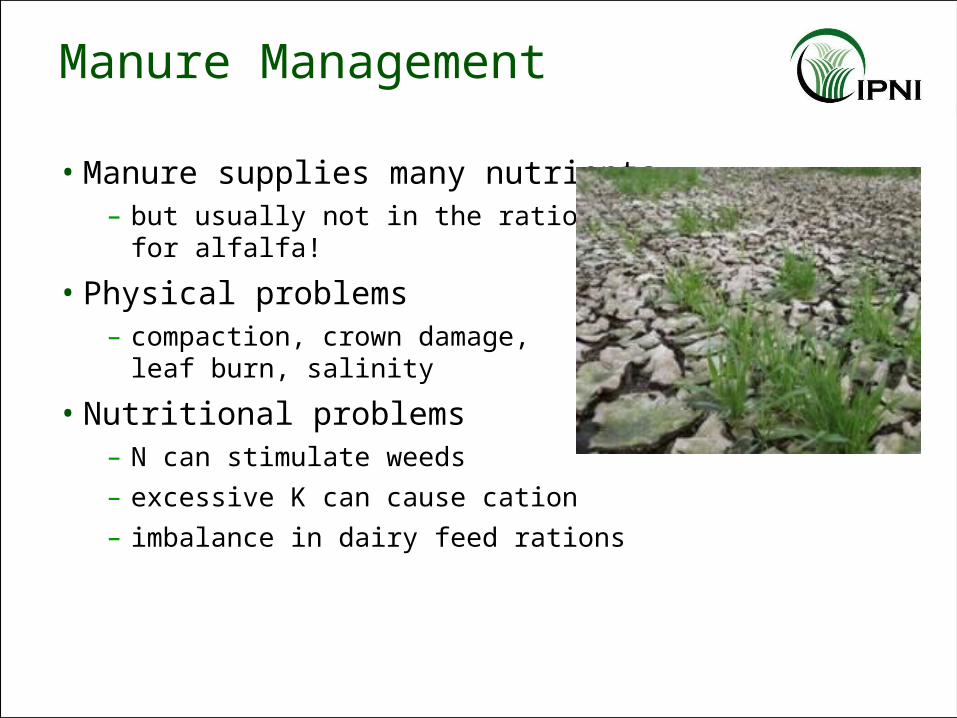
Manure Management
• Manure supplies many nutrients– but usually not in the ratio required
for alfalfa!
• Physical problems– compaction, crown damage,
leaf burn, salinity
• Nutritional problems– N can stimulate weeds
– excessive K can cause cation
– imbalance in dairy feed rations
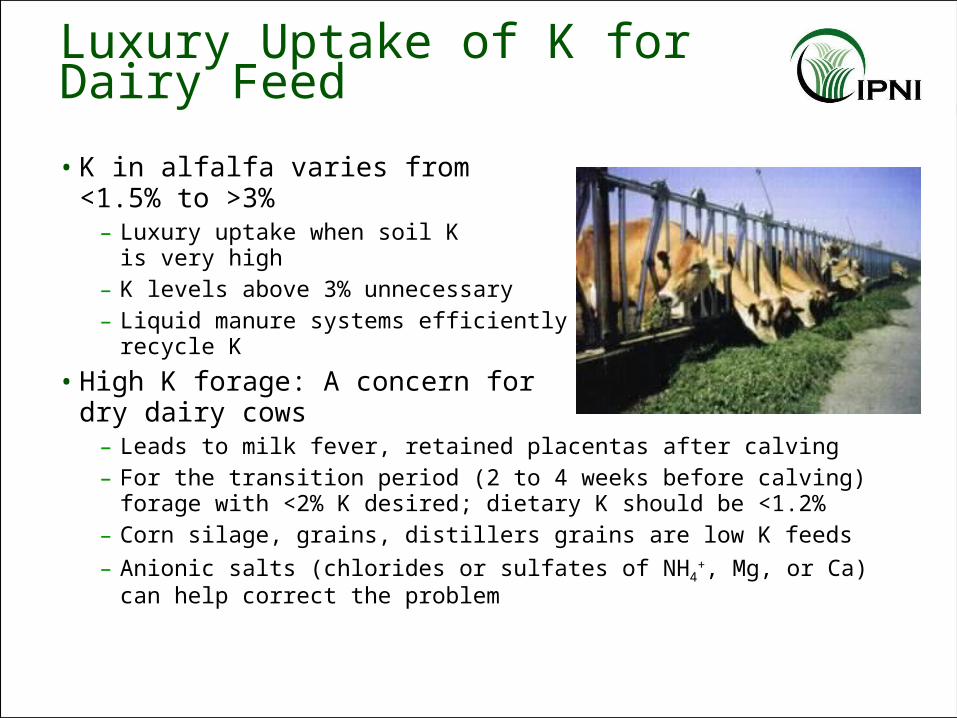
Luxury Uptake of K forDairy Feed
• K in alfalfa varies from<1.5% to >3%
– Luxury uptake when soil Kis very high
– K levels above 3% unnecessary– Liquid manure systems efficiently
recycle K
• High K forage: A concern fordry dairy cows
– Leads to milk fever, retained placentas after calving– For the transition period (2 to 4 weeks before calving) forage
with <2% K desired; dietary K should be <1.2%– Corn silage, grains, distillers grains are low K feeds
– Anionic salts (chlorides or sulfates of NH4+, Mg, or Ca) can help
correct the problem
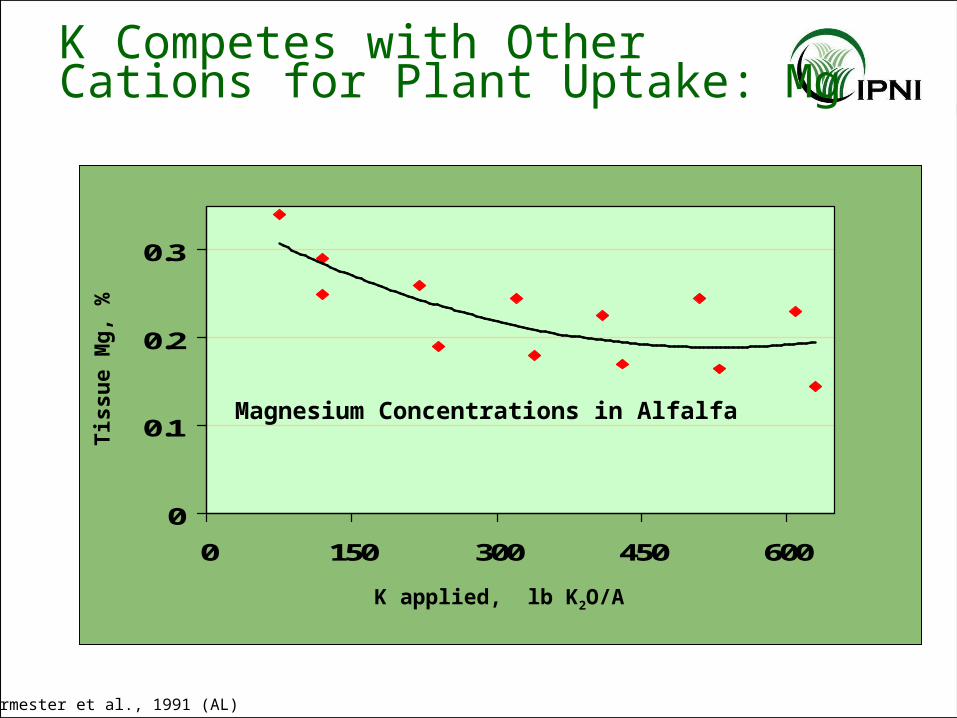
Burmester et al., 1991 (AL)
0
0.1
0.2
0.3
0 150 300 450 600
K applied, lb K2O/A
Tis
sue
Mg
, %
Magnesium Concentrations in Alfalfa
K Competes with Other Cations for Plant Uptake: Mg
0
0.4
0.8
1.2
1.6
0 150 300 450 600
K applied, lb K2O/A
Tis
sue
Ca,
%
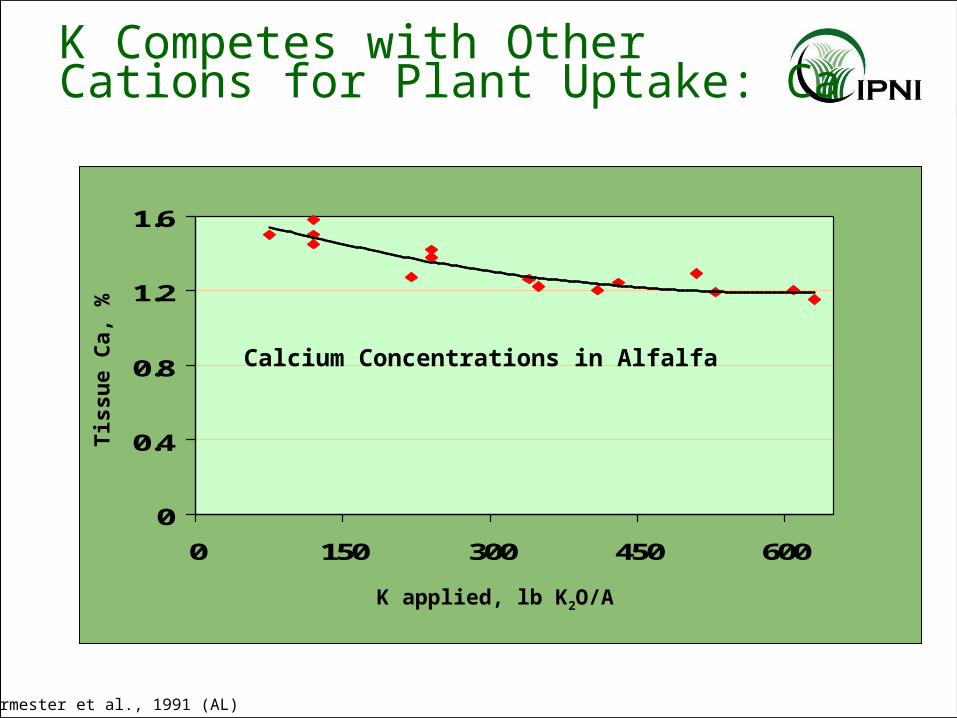
Calcium Concentrations in Alfalfa
K Competes with Other Cations for Plant Uptake: Ca
Burmester et al., 1991 (AL)
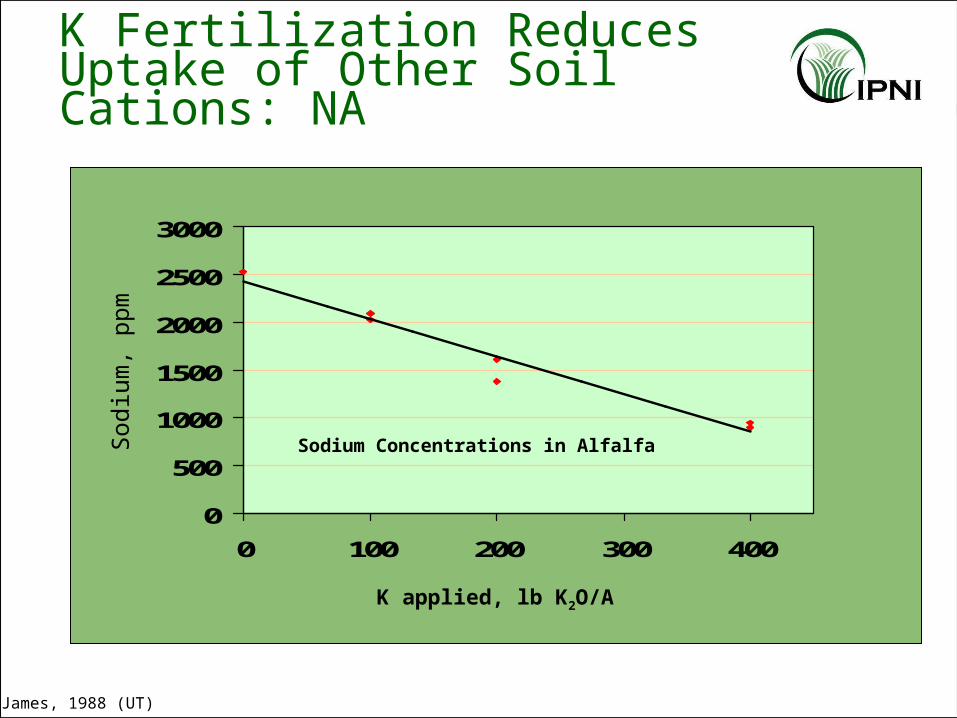
K Fertilization ReducesUptake of Other SoilCations: NA
0
500
1000
1500
2000
2500
3000
0 100 200 300 400
James, 1988 (UT)
Sodium Concentrations in Alfalfa
K applied, lb K2O/A
Sod
ium
, pp
m
0
1
2
3
4
5
6
7
8
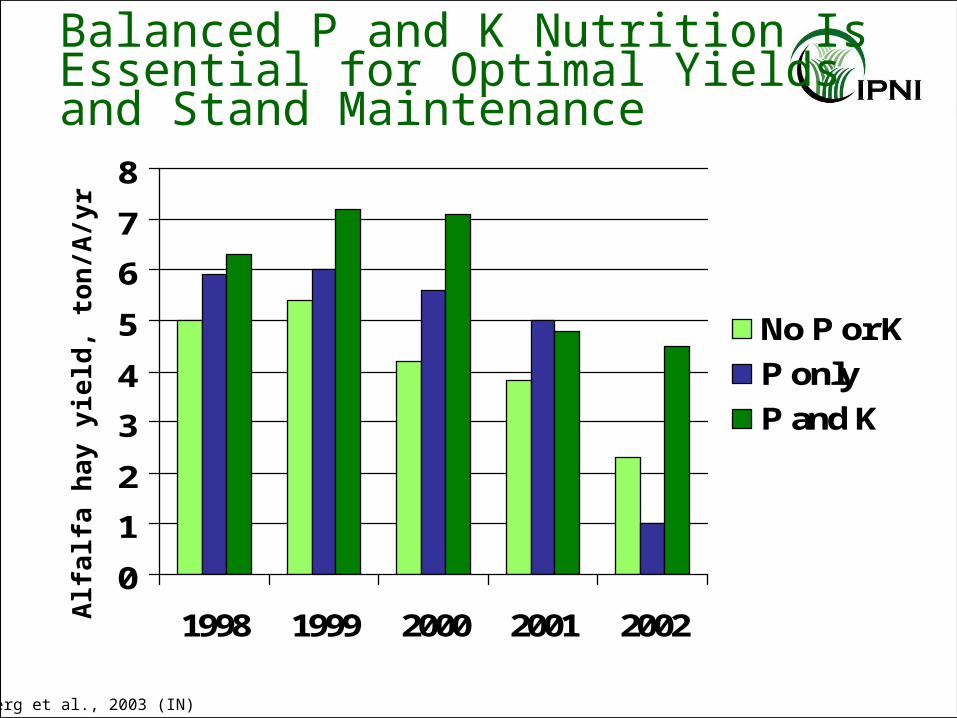
1998 1999 2000 2001 2002
No P or K
P only
P and K
Alf
alf
a h
ay y
ield
, to
n/A
/yr
Berg et al., 2003 (IN)
Balanced P and K Nutrition Is Essential for Optimal Yieldsand Stand Maintenance
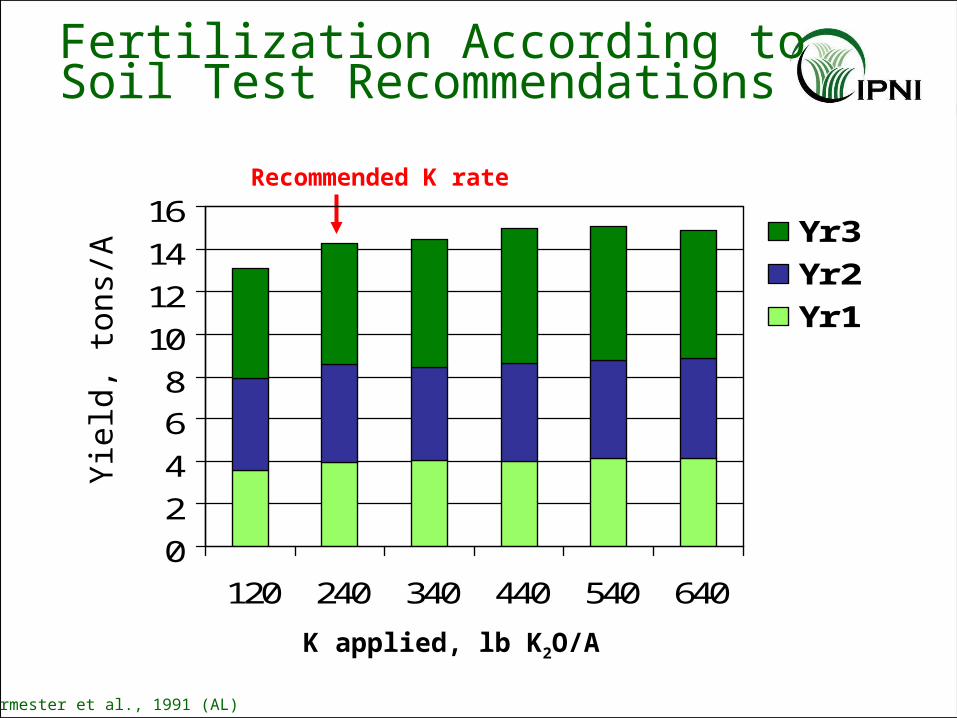
Recommended K rate
0
2
4
6
8
10
12
14
16
120 240 340 440 540 640
Yr 3
Yr 2
Yr 1
Yie
ld,
tons
/A
K applied, lb K2O/A
Fertilization According to Soil Test Recommendations
Burmester et al., 1991 (AL)
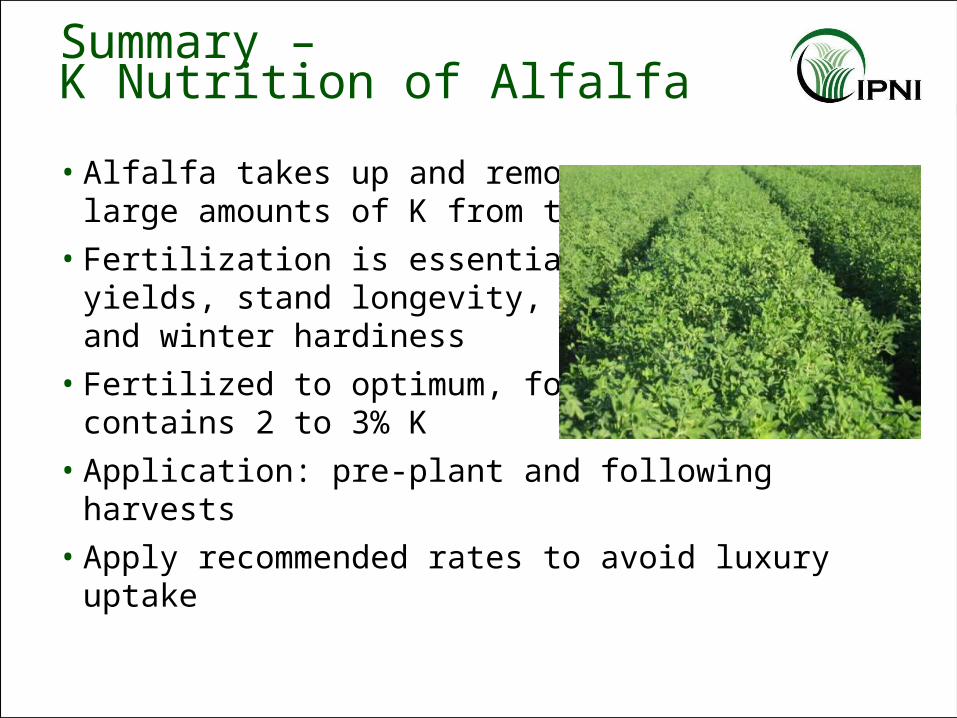
Summary – K Nutrition of Alfalfa
• Alfalfa takes up and removeslarge amounts of K from the soil
• Fertilization is essential for highyields, stand longevity,and winter hardiness
• Fertilized to optimum, foragecontains 2 to 3% K
• Application: pre-plant and following harvests
• Apply recommended rates to avoid luxury uptake
International Plant Nutrition Institute (IPNI)655 Engineering Drive, Suite 110Norcross, GA 30092-2837Phone: 770-447-0335; Fax 770-448-0439Website: www.IPNI.NET
Reference 06128