potential contamination due to cross-connections and backflow
TRANSCRIPT
_____________________________________________________________________
Office of Water (4601M) Office of Ground Water and Drinking Water Distribution System Issue Paper
Potential Contamination Due to Cross-Connections and Backflow and the Associated Health Risks
September 27, 2001

PREPARED BY:
U.S. Environmental Protection Agency Office of Ground Water and Drinking Water Standards and Risk Management Division
1200 Pennsylvania Ave., NW Washington DC 20004
Background and Disclaimer The USEPA is revising the Total Coliform Rule (TCR) and is considering new possible distribution system requirements as part of these revisions. As part of this process, the USEPA is publishing a series of issue papers to present available information on topics relevant to possible TCR revisions. This paper was developed as part of that effort. The objectives of the issue papers are to review the available data, information and research regarding the potential public health risks associated with the distribution system issues, and where relevant identify areas in which additional research may be warranted. The issue papers will serve as background material for EPA, expert and stakeholder discussions. The papers only present available information and do not represent Agency policy. Some of the papers were prepared by parties outside of EPA; EPA does not endorse those papers, but is providing them for information and review. Additional Information The paper is available at the TCR web site at: http://www.epa.gov/safewater/disinfection/tcr/regulation_revisions.html Questions or comments regarding this paper may be directed to [email protected].

Potential Contamination Due toCross-Connections and Backflow and theAssociated Health Risks
An Issues Paper
by
EPA’s Office of Ground Water and Drinking Water

Cross-C onnec tion Con trol August 13, 2002
1
1.0 Nature and Purpose of the Paper
This paper is one of nine papers that examine issues related to drinking water distributionsystems. The nine papers are products of two expert workshops. The first workshop, in June 2000,discussed issues associated with distribution systems that may pose public health risks and identifiedthose issues of most concern. The distribution system issues of most concern identified at the workshopare the following: Microbial Growth and Biofilms; Cross-Connections and Backflow; Intrusion;Corrosion and Aging Infrastructure; Decay of Water Quality over Distribution System Residence Time;Contamination During Infrastructure Repair and Replacement; Nitrification; Covered Storage; andPermeation and Leaching. The second workshop, in March 2002, discussed the first drafts prepared onthose issues.
In support of the nine distribution system issue papers, EPA developed two tables that list manyof the biological and chemical contaminants represented in the papers and their potential health effects:the Microbial Contaminant Health Effects Table (for acute and chronic health effects) and the ChemicalContaminant Health Effects Table (for chronic health effects). For those contaminants mentioned in thispaper and included in these tables, a reference to the tables is provided for further information onpotential health effects.
The purpose of this document is to review existing literature, research, and information on theoccurrence, magnitude, and nature of the public health risks associated with cross-connections andbackflow, from both acute and chronic exposures, and methods for detecting and controlling theoccurrence of cross-connections and backflow within distribution systems. More specifically, the goal ofthis document is to review what we know regarding: (1) causes of contamination throughcross-connections; (2) the magnitude of risk associated with cross-connections and backflow; (3) costs ofbackflow contamination incidents; (4) other problems associated with backflow incidents; (5) suitablemeasures for preventing and correcting problems caused by cross-connections and backflow; (6) possibleindicators of a backflow incident; and (7) research opportunities.
2.0 Executive Summary
Within distribution systems there exist points called cross-connections where nonpotable watercan be connected to potable sources. These cross-connections can provide a pathway for backflow ofnonpotable water into potable sources. Backflow can occur either because of reduced pressure in thedistribution system (termed backsiphonage) or the presence of increased pressure from a nonpotablesource (termed backpressure). Backsiphonage may be caused by a variety of circumstances, such as mainbreaks, flushing, pump failure, or emergency firefighting water drawdown. Backpressure may occurwhen heating/cooling, waste disposal, or industrial manufacturing systems are connected to potablesupplies and the pressure in the external system exceeds the pressure in the distribution system. Bothsituations act to change the direction of water, which normally flows from the distribution system to thecustomer, so that nonpotable and potentially contaminated water from industrial, commercial, orresidential sites flows back into the distribution system through a cross-connection. During incidents ofbackflow, these chemical and biological contaminants have caused illness and deaths, with contaminationaffecting a number of service connections. The number of incidents actually reported is believed to be asmall percentage of the total number of backflow incidents in the United States.
The risk posed by backflow can be mitigated through preventive and corrective measures. Forexample, preventative measures include the installation of backflow prevention devices and assemblies
1This paper defines the distribution system to be from the point at which the water leaves the treatment
plant, or source, if untreated, to the point at which the custom er’s service line begins.
Cross-C onnec tion Con trol August 13, 2002
2
and formal programs to seek out and correct cross-connections within the distribution system and, insome cases, within individual service connections. Corrective measures include activities such asflushing and cleaning the distribution system after a detected incident. These may help mitigate anyfurther adverse health effects from any contaminants that may remain in the distribution system.
3.0 Definition of Key Terms
A cross-connection is a point in a plumbing system where it is possible for a nonpotablesubstance to come into contact with the potable drinking water supply (BMI, 1999). According to theUniversity of Southern California’s Foundation for Cross-Connection Control and Hydraulic Research(USC FCCCHR) (1993), a cross-connection means,
“any unprotected actual or potential connection or structural arrangement between a public orprivate potable water system, and any other source or system through which it is possible tointroduce into any part of the potable system any used water, industrial fluids, gas, or substanceother than the intended potable water with which the potable system is supplied.”
Common examples of cross-connections include a garden hose submerged in a pesticide mixture, a pipedconnection providing potable feed water to an industrial process, such as a cooling tower, or a submergedoutlet of an irrigation system. Connections to firefighting equipment are other very common cross-connections. Most cross-connections occur beyond the customer service connection, within residential,commercial, institutional or industrial plumbing systems. Identifying cross-connections can bechallenging because many distribution systems are expanding to serve new customers and changing toaccommodate customer needs. Further, temporary and permanent cross-connections can be created inexisting facilities without the knowledge of the water system managers and operators.
Backflow is any unwanted flow of used or nonpotable water, or other substances from anydomestic, industrial, or institutional piping system back into the potable water distribution system1 (USCFCCCHR, 1993). The direction of flow under these conditions is opposite to that of normal flow. Thereverse pressure gradient that leads to backflow is caused by either backsiphonage or backpressure (USCFCCCHR, 1993; BMI, 1996).
Backsiphonage is backflow caused by negative or sub-atmospheric pressure in a portion of thedistribution system or the supply piping (USC FCCCHR, 1993). When the system pressure drops tobelow atmospheric (negative gauge pressure), ambient pressure on the distribution system due to theatmosphere, water columns (from buildings or other elevated piping), or other sources will cause thedirection of flow within portions of the system to reverse. If a cross-connection exists in the area whereflow reverses direction, contaminants can be siphoned into the distribution system (USC FCCCHR,1993). Water main breaks, firefighting efforts, high demands, and any situation where water iswithdrawn from the distribution system at a high rate can lead to backsiphonage (USC FCCCHR, 1993).
Backpressure can cause backflow to occur when a potable system is connected to a nonpotablesupply operating under a higher pressure than the distribution system by means of a pump, boiler,elevation difference, air or steam pressure, or other means (USC FCCCHR, 1993). Unlike

Cross-C onnec tion Con trol August 13, 2002
3
backsiphonage, it is not necessary to have a drop in distribution system pressure for backpressure tooccur. Whenever the pressure at the point of a cross-connection exceeds the pressure of the distributionsystem, the direction of flow will reverse. There is a high risk that nonpotable water will be forced intothe potable system whenever these connections are not properly protected (USC FCCCHR, 1993).
4.0 What Causes Contamination Through Cross-Connections to Occur?
This section of the paper describes how cross-connections and backflow occur, and whatconditions and situations are necessary to cause them. Under intended flow conditions, distributionsystems are pressurized to deliver finished water from the treatment plant to the customer. However, twosituations can cause the direction of flow to reverse: pressure in the distribution system can drop due tovarious conditions or an external system connected to the distribution system may operate at a higherpressure than the distribution system. These differences in pressure can cause contaminants to be drawnor forced into the distribution system. Contamination introduced due to backflow into the distributionsystem may then flow freely into other customer connections. The following conditions must be presentfor contamination to occur through cross-connections.
• A cross-connection exists between the potable water distribution system and a nonpotablesource.
• The pressure in the distribution system either becomes negative (backsiphonage), or thepressure of a contaminated source exceeds the pressure inside the system (backpressure).
• The cross-connection is not protected, or the connection is protected and the mechanismfailed, allowing the backflow incident.
The extent of contamination in the distribution system depends, in part, on the location of thecross-connection, the concentration of the contaminant entering the distribution system and themagnitude and duration of the pressure difference causing the backflow. This section of the paperdescribes the theory of backflow and cross-connections, provides examples of conditions that can createbackflow, and lists a number of factors that affect the likelihood and magnitude of backflow through across-connection.
4.1 Backflow Conditions
The occurrence of backflow is directly related to system pressure. Any pressure differentialbetween the potable water and the non-potable source can lead to backflow. It is estimated that evenwell-run water distribution systems experience about 25–30 breaks per 100 miles of piping per year (Debet al., 1995). Haas (1999) reported results from a survey of water systems that showed a range of averagemain breaks of 488 per year for systems serving more than 500,000 people, to 1.33 per year for systemsserving fewer than 500 people.
Fighting fires also reduces a system’s pressure (AWWA, 1999). For example, in 1974 inWashington State, the high rate of flow caused by the activation of a fire deluge system reduced pressurein a domestic water line, causing backsiphonage of a chemical and other pollutants into the potable watersystem (AWWA PNWS, 1995). Similarly, opening hydrants during the summer for recreational usecauses pressure to drop. Regular system maintenance activities such as valve exercising programs,hydrant flushing, pump repair, pressure control valve repair, and valve replacement can also result in

Cross-C onnec tion Con trol August 13, 2002
4
localized variations in pressure that cause backflow. Differences in elevation can compound the effectsof pressure loss.
Additionally, if a high pressure source is connected to the distribution system, a drop in pressureis not necessary for backflow to occur—the presence of a cross-connection or failure of the preventionmechanism will allow backflow to occur.
Examples of backsiphonageElevated piping can cause backsiphonage when there is a loss of pressure in the supply system.
The loss of pressure will cause the water column to collapse and create a vacuum that can drawcontaminants in through a cross-connection (BMI, 1999; USC FCCCHR, 1993). Backsiphonage can alsooccur within irrigation systems. For example, in 1991, a water main break lead to the backsiphonage ofparasitic worms from a residential lawn sprinkler supply into two homes (AWWA PNWS, 1995).
Booster pumps for high-rise buildings can cause backsiphonage if the suction lines of the pumpsare being used for service on the lower floors and a temporary or permanent cross-connection on thelower floors exists (e.g., a hose submerged in a bucket of cleaning solution). If distribution systempressure drops, the suction pressure can cause the backsiphonage through the lower floor cross-connection when the pump is operating, contaminating the higher floors (BMI, 1999; USC FCCCHR,1993; US EPA, 1989).
Localized physical restrictions in water lines can produce backsiphonage through the venturieffect (BMI, 1999). When water flows through a restriction—for example, through a garden hose orfrom a larger water line into a smaller one—its velocity increases and its pressure decreasesproportionately (US EPA, 1989). This decrease in pressure can yield negative pressure and siphonsubstances into the point of restriction (BMI, 1999). Devices such as chemical sprayers used on the endof garden hoses use this principle to siphon chemical from the container into the water stream (BMI,1996).
Backsiphonage can occur when supply piping within an industrial facility is elevated over therim of a vessel, and the outlet of that piping is submerged in a liquid contaminant. Negative distributionsystem pressure would cause the water column in the elevated pipe section to collapse, creating a vacuumthat draws contaminants from the vessel into the distribution system (BMI, 1999; USC FCCCHR, 1993).
If a pipe with cracks or leaking joints is exposed to a wet environment, negative pressure cancause water to be drawn in (or to intrude into) the distribution system through backsiphonage (Kirmeyeret al., 2001). A separate issue paper addresses risks from intrusion due to pressure transients.
Examples of backpressure Backpressure can occur with pressurized residential, industrial, institutional, or commercial
systems which use pumps, including chemical feed pumps or booster pumps, or pressurized auxiliarywater systems for irrigation, fire protection, car washes, and cooling systems (USC FCCCHR, 1993;FDEP, 2001). For example, backpressure resulting from tank cleaning activities by a gas company inConnecticut caused propane to backflow into the distribution system, causing fires in two homes andevacuation of hundreds of people. Gas company workers were purging a propane tank with water anddid not realize the pressure in the tank was greater than in the water line feeding the tank, thus creating abackpressure of propane vapor into the distribution system (US EPA, 1989). Backpressure also occurredin 1991 at a facility that transforms wheat and barley into ethanol in Tucumcari, New Mexico. Anunprotected auxiliary water line feeding emergency fire cannons was illegally tapped to a hose connected
Cross-C onnec tion Con trol August 13, 2002
5
to an ethanol plant’s flushing system, creating a cross-connection. After the plant finished its flushingoperation, the plant resumed normal operations with the hose still connected, and backpressure fromplant operations forced a number of industrial chemicals to backflow into the public water supply(toluene, phenol, benzene, ethanol, nonanoic acid, decanoic acid, octanol, octanoic acid, heptanoic acid,butanoic acid, silicon, diconic acid and four trihalomethanes). The concentrations of these toxins wereenough to cause the mayor of the town to become very ill for 48 hours. Another individual drank a smallamount of water and became ill with stomach upset. Fortunately, there were no deaths, and thedistribution system was thoroughly flushed after the contamination was detected (AWWA PNWS, 1995).The likelihood of backpressure increases when the distribution system pressure drops to below normaloperating pressure due to changes in valve setting, pipeline breaks, air valve slams, loose-fitting servicemeter connections, surge or feed tank draining, or a sudden change in demand (Kirmeyer et al., 2001).
The weight of water in piping of high-rise buildings is a source of backpressure on thedistribution system. Backpressure can also come from thermal expansion (high pressures can begenerated when water is heated in a closed container). Thermal expansion can occur in boilers, solarheating systems, and places where water- or foam-based fire sprinkler systems are located on the highestfloors of tall buildings and temperatures of piping rise (BMI, 1999).
Compressed air systems such as carbonators can pose backpressure risks. The pressure of acarbon dioxide tank, for example, can be several thousand pounds per square inch (psi). This high-pressure carbon dioxide is passed through a regulator and mixed into a water system at anywhere from60 to 150 psi. Carbon dioxide from either a tank or a regulator could be introduced to the distributionsystem pressure if a cross-connection is present and the compressed air system overcomes thedistribution system pressure (Guy, 1997).
4.2 Factors Affecting the Occurrence and Magnitude of Backflow Contamination
Operating pressureA minimum operating pressure of 20 psi at all locations in a distribution system is suggested by
various manuals and codes of good operating practice (Kirmeyer et al., 2001). Some states also haveminimum operating pressure requirements. Local operating pressure in a system varies among zones. Ina highly pressurized system, a great deal of backpressure would be needed to force water to backflow; asystem or part of a system with relatively low pressure would generally be more susceptible tobackpressure. Systems with normal operating pressure lower than recommended by manuals and codesof good practice may have a higher risk of backpressure events.
Reduced pressures that can lead to backflow occur from a variety of sources. Water main breaks,hilly terrain, limited pumping capacity, high demand by consumers, fire fighting flows, rapidly openingor closing a valve within the distribution system, power loss, and hydrant flushing can reduce pressureand contribute to lower or extremely fluctuating water pressures (Kirmeyer et al., 2001). A study of adistribution system (LeChevallier et al., 2001) observed that during a pump test, routine operation, and apower outage, pressures as low was -10.1 psi were recorded, with durations ranging from 16 to 51seconds. During these times of negative pressure, the chance that water external to the distributionsystem intruded into the distribution system due to backsiphonage or backpressure increased. In a simplesingle pipe model employed in the study, a surge generated by a simulated power failure to a pumppredicted 69 gallons of external water would intrude into the pipe within 60 seconds. A surge caused by amain break predicted 78 gallons of water intruding within 60 seconds. A survey of 70 systems reported11,186 pressure reduction incidents in the past year; 34.8 percent of the incidents were from routine

Cross-C onnec tion Con trol August 13, 2002
6
flushing, 19.2 percent were due to main breaks, and 16.2 percent incidents were due to service linebreaks (ABPA, 2000). Hills and other elevations compound pressure loss effects caused by main breaks,fire flows, and other events (ABPA, 2000). Limited pumping capacity may cause periodic termination ofwater supply in areas of the system. Without sufficient redundancy in the distribution system,backsiphonage conditions may occur if one or more major components of the distribution system gooffline or otherwise cease functioning.
Physical security of the distribution system Homeland security initiatives include attention to the physical security of water distribution
systems. The subject of homeland security is well beyond the scope of this paper, but it is relevant tonote that the potential for intentional contamination of a distribution system through cross-connectionsand backflow of chemical and biological contaminants is possible (Dreazen, 2001).
Maintenance activitiesMaintenance levels and practices within the distribution system can affect the likelihood of
occurrence of cross-connections and backflow. In a South Carolina system in 1978 fifteen peoplebecame ill due to backsiphonage of chlordane from an exterminator truck during meter repair (USCFCCCHR, 1993). In May, 1982 maintenance crews in Bancroft, Michigan shut down a main to replace avalve. The resultant pressure loss caused backflow of malathion from a hose end applicator , andresulted in the loss of water to the village for two days (USC FCCCHR, 1993). The herbicide Lexon DF backsiphoned into the distribution system in Gridley, Kansas in 1987 from a tanker truck when a mainbroke during excavation and contaminated ten residences and one business (USC FCCCHR, 1993).
Levels of public awarenessA lack of public awareness about the threat posed by cross-connections and backflow can lead to
unintentional creation of cross-connections, such as through illegal and unprotected taps into thedistribution system. In 1979, a professional exterminator left a garden hose submerged in a barrel ofdiluted pesticide, allowing chlordane to be backsiphoned into the distribution system during a serviceinterruption (US EPA, 1989). This potential is magnified in multi-storied buildings that have manypeople living under one primary connection. Cross-connections are often installed by the public as amatter of convenience without regard to possible dangers, and others with reliance on inadequatebackflow prevention (US EPA, 1989).
5.0 The Magnitude of Risk Associated with Cross-Connections and Backflow
This section describes the risk posed by contaminants that can enter the distribution systemthrough cross-connections. The history of outbreaks and reported illnesses associated with cross-connections and backflow indicates some level of public health risk is associated with cross-connectionsand backflow. Risk is a function of a variety of factors including cross-connection and backflowoccurrence, type and amount of contaminants, and their potential health effects. This section firstdescribes the reported outbreaks of disease associated with cross-connections and backflow, then followswith a description of some contaminants that have been introduced to distribution systems via cross-connections and backflow, and the difficulties in detecting and reporting backflow incidents.
5.1 Reported Outbreaks Associated with Cross-Connections and Backflow
From 1981 to 1998, CDC documented 57 waterborne disease outbreaks related to cross-connections, resulting in 9,734 illnesses. These include 20 outbreaks (6,333 cases of illness) caused by
2If the numbe r of illnesses was re ported q ualitatively, the analysis u sed the follow ing assump tions to
estimate a total figure. Specifically, if the number of illnesses was reported as “several”, “many”, or “numerous”, the
analysis assumed five. The analysis assumed that “some” meant three. One incident reported “dozens” of
illnesses¾ this analysis assum ed 36. A nother rep orted one family¾ the analysis assumed three people.
Cross-C onnec tion Con trol August 13, 2002
7
microbiological contamination, 15 outbreaks (679 cases of illness) caused by chemical contamination,and 22 outbreaks (2,722 cases of illness) where the contaminant was not reported. Craun and Calderon(2001) report that 30.3 percent of waterborne disease outbreaks in community water systems during1971-1998 were caused by contamination of water in the distribution systems. Of these waterbornedisease outbreaks caused by distribution system deficiencies, 50.6 percent were due to cross-connectionand backflow (Craun and Calderon, 2001). Documented acute health impacts most often involvegastrointestinal disorders. The data from the CDC’s surveillance of the outbreak of waterborne diseasemust meet certain documentation standards; therefore, these reports are reliable. However, CDC’sreporting standards exclude some incidents that lack complete documentation and report only outbreaksof notifiable diseases (a set of diseases that CDC tracks; these do not include endemic diseases). As aresult, these data are likely under-estimates and these under-estimates are compounded by the number ofillnesses that go unreported. (Section 5.4 further discusses the difficulties of detecting and reportingwaterborne disease outbreaks.)
Estimates of the proportion of waterborne illness attributable to cross-connections and backflowvary. A compilation by EPA’s Health Effects Research Laboratory found that between 1920 and 1980,cross-connections and backflow caused 78 percent of outbreaks, and 95 percent of the cases of illness,attributed to community distribution system contamination in the United States (AWWA, 1990).
Data on health impacts are also available from other sources that collect information onbackflow incidents, such as USC FCCCHR, and the Cross-Connection Control Committee of the PacificNorthwest Section of the AWWA. These independent organizations do not limit their data to well-defined outbreaks, but focus on incidents. Because not all incident reports document illness, estimates ofillness resulting from an individual incident based on their data are less reliable than CDC estimates ofreported outbreaks.
Our compilation of backflow incident data (summarized in Exhibit 5.1) found that 459 incidentsresulted in an estimated 12,0932 illnesses from 1970 to 2001. When we narrowed the analysis to 1981-1999, for comparison with CDC data on outbreaks for that period, we found that only 97 of 309 incidentsproduced reports of how many (if any) illnesses were caused, and 22 of these 97 incidents reported noillnesses. Of the remaining 75 incidents, only 26 appear in CDC’s summaries as a waterborne diseaseoutbreak. This suggests that CDC data underreport even known instances of illness caused by backflowcontamination. From the 75 incidents that produced reports of illness, analysis of the qualitative andquantitative case reports estimated 4,416 illnesses, averaging 46 illnesses per outbreak.
5.2 Contaminants Associated with Cross-Connections and Backflow and Their HealthEffects
A variety of contaminants have been introduced into distribution systems by cross-connectionsand backflow, indicated by the backflow occurrence discussed in this paper. The likelihood and severityof illness and number of people affected depend on various factors including how much contamination
Cross-C onnec tion Con trol August 13, 2002
8
enters the system, the dilution factor, the type of contaminant, the number of users exposed, and thehealth status of each person at the time of exposure.
Contamination from cross-connections and backflow can occur not only where the cross-connection is located but at sites upstream and downstream, as contaminants spread. The fate andtransport of a contaminant are often system-specific and can be difficult to predict because they dependon multiple parameters such as the hydraulics of the distribution system and the physical, chemical, orbiological properties of the contaminant. The contaminant may remain as a slug, resulting in very highconcentrations in localized areas, or it may disperse, contaminating large volumes of water at lowerconcentrations. It may adsorb to the interior of pipes, necessitating their cleaning or replacement. It maydegrade, or in the case of microorganisms, be inactivated or injured by residual disinfectant. It may alsobecome concentrated within the biofilms and be slowly released through erosion or as a slug throughbiofilm sloughing. Scales within the piping may adsorb the contaminants for later release.
The Chemical and Microbial Health Effects Tables, developed by EPA to support the nine issuepapers, include many biological and chemical contaminants mentioned in the papers. However,additional contaminants not listed in these tables are described in this paper because the types ofcontaminants that have entered distribution systems through cross-connections are numerous and notdiscussed in any other white papers; thus more appropriately described in this paper. For thosecontaminants listed in the Health Effects Tables, this paper references the appropriate table for moreinformation on potential health effects.
5.2.1 Chemical ContaminantsThe use of chemicals at residential, industrial, and commercial facilities with direct or indirect
connections to potable water systems presents an opportunity for contamination from cross-connectionsand backflow (USC FCCCHR, 1993). Many of these chemicals have some degree of toxicity, andexposure to these chemicals can have either acute or long-term health effects, depending on the natureand concentration of the contaminant, duration of exposure, and a person’s immune status. Exposurefrom contamination through a cross-connection can be either acute or chronic. While waterborneoutbreaks are under-reported in general, rarely are waterborne chemical outbreaks reported to CDC. Thereasons for under-reporting of chemical outbreaks above and beyond that of microbial outbreaks include:1) most poisonings of this nature (e.g., lead and copper from plumbing) probably occur in privateresidences, affect relatively few people and, thus, may not come to the attention of public healthofficials; 2) exposure to chemicals via drinking water may cause illness that is difficult to attribute tochemical intoxication, or it may cause non-specific symptoms that are difficult to link to a specific agent;and 3) the chemical outbreak detection mechanisms, as well as the reporting requirements are not as wellestablished as they are for microbial agents (CDC, 1996). Most reported incidents are acute exposures,however, chronic exposures are possible if immediate water quality or health effects are not noticed, or ifcross-connections remain uncorrected long-term. This can result in some of the chronic health effectsdescribed in the Chemical Health Effects Table (US EPA, 2002a), when the consumer is exposed to thechemicals listed for a long period of time. Depending on the contaminant, these chronic exposures cancause long-term health effects, including cancer, which may not be identified until many years after theinitial exposure. Acute health risks include vomiting, burns, poisoning, and other reactions—somepotentially life-threatening. For example, in Rochester, NY, a faulty carbonation system on a soft drinkmachine continuously leaked carbon dioxide into the distribution system for over 3 months, creatingincreased levels of copper in the distribution system (as high as 13,400 ppb) (Manioci, 1984). Contamination at the K-25 atomic bomb plant in Oak Ridge, TN, occurred for an unknown length oftime (possibly on the order of decades) through cross-connections with cooling system and firefighting

Cross-C onnec tion Con trol August 13, 2002
9
lines. Contaminants found at the source of contamination that may have entered the distribution systemincluded strontium-90, arsenic, chromium, and antifreeze (Nashville Tennessean, 2000).
Because few backflow incidents are reported, it is important to note that a variety of chemicalshave the potential to enter the distribution system through cross-connections, and the number of thosereported only represent a subset. For example, agricultural applications contain many fertilizers,herbicides, and insecticides and industrial sources such as cooling systems, plating plants, steam boilerplants, and dye plants have a number of toxic chemicals in day-to-day use that have the potential tocontaminate the distribution system (USC FCCCHR, 1993). The most common chemical contaminantsreported, according to information EPA has obtained from backflow incident records, are (in order ofdecreasing occurrence): copper, chromium, ethylene glycol, detergents, chlordane, malathion, propyleneglycol, freon, and nitrite. Chlordane and malathion are pesticides; ethylene glycol is used as antifreeze inheating and cooling systems, propylene glycol is used as antifreeze and as a food additive; detergents areextensively used in many industries; copper is used in plumbing; chromium VI was used in the past incooling towers as a rust and corrosion inhibitor; and nitrite is a reduced form of nitrate, an agriculturalfertilizer. This summary discusses these and other related chemical contaminants (grouped into fourcategories—pesticides, metals, synthetic organic compounds, and nitrates and nitrites) in terms ofpotential health effects and examples of reported backflow incidents.
PesticidesPesticides (including insecticides, herbicides, and fungicides) as a group are contaminants in 45
reported incidents. Chlordane, malathion, heptachlor, and diazinon were reported as contaminants in 11,5, 3, and 2 incidents, respectively. In one 1976 incident in Chattanooga, TN, chlordane was being usedfor termite extermination and contaminated a three-block area of residential homes; 17 people reportedthey drank the suspect water. Reported symptoms by those people were nausea, abdominal pain,gastrointestinal problems, and neurological effects such as dizziness, blurred vision, irritability,headache, paresthesia, muscle weakness, and twitching (AWWA PNWS, 1995). In 1980, heptachlor andchlordane contaminated a portion of distribution system in Allegheny, PA that serviced approximately300 people. A pesticide contractor created the cross-connection with a garden hose submerged in thechemical mixing tank. There were no reports of illness, however, residents were without water for 27days (Watts, 1998). Another pesticide incident involved diazinon contamination in Tucson, AZ in 1989. Diazinon entered the system through a residential connection where a home-made pesticide pump systemwas hooked up to a garden hose. The combination of backpressure from the pump system and the wateruse by a next-door neighbor washing a car caused the pesticide to flow into the distribution system(Tucson Citizen, 1989). No illnesses were reported. In 1986, two employees of a Kansas grain millbecame ill after drinking water contaminated with malathion that was backsiphoned into the plant’swater supply (AWWA PNWS, 1995). In 1988, a Florida man died of insecticide intoxication after hestepped off his mower, filled his water bottle, and drank from the bottle that was filled with contaminatedwater from a faucet at an airstrip. Officials suspected backflow as the cause of the water supplycontamination (AWWA PNWS, 1995).
An example of a small amount of contamination resulting in a public health threat is a 1991incident where 2.5 gallons of the herbicide TriMec backsiphoned into the Uintah Highlands water systemin Utah affecting 2,000 homes (US EPA, 1989). Shortly thereafter, concentrations of the activeingredients, 2,4-D and Dicamba, at a consumer’s tap were measured at 638 and 64.8 parts per million(ppm), respectively. This incident also affected a nursing home and a day-care facility, both of whichserve higher risk subpopulations. The health advisory level of both 2,4-D and Dicamba over a 10-dayperiod is 0.3 ppm (US EPA, 2000a). Chronic health effects of 2,4-D and Dicamba include damage to thenervous system, kidney, and liver (US EPA, 2002a). However, only acute exposures were documented.
Cross-C onnec tion Con trol August 13, 2002
10
MetalsThere are 73 reported backflow incidents with metal contaminants—55 with copper and 18 with
hexavalent chromium. Copper contamination is most commonly associated with backflow incidents atrestaurants, where carbonated water can dissolve portions of water or soft drink dispenser piping made ofcopper. In 1987, a child in Minnesota suffered acute copper toxicity when the backflow from a carbondioxide machine contaminated a restaurant’s potable system (AWWA PNWS, 1995). A similar incidentat a fair in Springfield, MO, caused vomiting and abdominal pain in three people who drank soft drinksfrom a soft drink machine that had a faulty check valve (AWWA PNWS, 1995). Potential health effectsdue to copper poisoning include vomiting, nausea, and liver and kidney damage; refer to the ChemicalHealth Effects Table for other potential health effects (US EPA, 2002a). CDC reports that the observedacute health effects due to copper poisoning outbreaks are gastrointestinal illness (CDC, 1996).
Chromium is used as a corrosion inhibitor. In 1970, a cross-connection between a chromate-treated cooling system and the water supply at Skidmore College in New York, New York, caused fivepeople to become nauseated (USC FCCCHR, 1993). In another incident in New Jersey in 1970,hexavalent chromium contamination occurred through a cross-connection of a building heating systemand soft drink machine causing 11 people to become nauseated (USC FCCCHR, 1993). Potentialchronic health effects are listed in the Chemical Health Effects Table (US EPA, 2002a).
Synthetic and volatile organic compoundsSynthetic and volatile organic compounds as a group are contaminants in 66 reported incidents,
with the most frequent contaminants being ethylene glycol (used in antifreeze), propylene glycol (used inantifreeze and as a food additive), freon (refrigerant), and propane (fuel).
Ethylene and propylene glycol were contaminants in 16 and 5 reported incidents, respectively. Examples include one incident in 1982, when ethylene glycol backsiphoned from an air conditioningsystem’s water holding tank into a group of dialysis machines contributing to the death of “several”patients in Illinois (AWWA PNWS, 1995). In 1985, backpressure from a hospital air conditioningsystem caused the introduction of ethylene glycol into the water system of a New York hospital. Onewoman died after being exposed while undergoing dialysis (CDC, 1987). In 1987, a cross-connectionwith a heating system contaminated the plumbing at a municipal building in North Dakota with ethyleneglycol, causing acute illness in 29 people. Water from a spigot used to make flavored drinks contained 9percent ethylene glycol. Reported health effects included excessive fatigue and dizziness, while twochildren experienced vomiting, excessive fatigue, and hematuria (CDC, 1987). Backflow of propyleneglycol from a fire suppression system in 1993 into the potable water system of a park in Arizonaoccurred for at least 2 months before the point of entry was identified. Several employees reportednausea and intestinal upsets after drinking water during the period of contamination (Watts, 1998), whichwas discovered by taste and odor complaints.
Freon and propane were contaminants in four and three reported incidents, respectively. In1989, backpressure from a propane tank car forced propane into the water supply of Fordyce, Arkansas. Three people in separate buildings were injured from explosions after flushing toilets, and two houseswere destroyed and a business was damaged by explosions and subsequent fires (AWWA PNWS, 1995). Backpressure from an air conditioning unit caused freon to backflow into the distribution system inFranklin, NE. The contamination was detected when city residents complained of bad tasting water thatcaused a burning sensation in the mouth (AWWA PNWS, 1995).

Cross-C onnec tion Con trol August 13, 2002
11
Detergents were contaminants in nine reported incidents. Contamination of concentrated soap in1995 from an incorrectly installed soap dispenser at a health care facility in Iowa affected 13 people wasreported a burning sensation in their mouths and symptoms resembling the flu (CDC, 1998). In 1993 inSeattle, WA a temporary cross-connection at a car wash facility allowed soapy water in the distributionsystem, affecting an eight block area and causing two unconfirmed cases of illness (AWWA PNWS,1992).
Nitrates and nitritesNitrates and nitrites were contaminants in four reported incidents. Nitrate is a common ion
found in natural waters and is used in fertilizers. Nitrite is typically not observed at significant levels(AWWA, 2001), however nitrate reduces to nitrite in the human body. In one incident in the countycourthouse building of Monterey, CA, sodium nitrate from the boiler and cooler system backflowed intothe potable water supply through a faulty backflow prevention device. Nineteen people became sick andneeded medical attention from drinking coffee from the courthouse snack bar (AWWA PNWS, 1995). An incident of nitrite contamination at a school in California caused illness in three people; a faultydouble-check valve allowed chemicals from the chilling system to enter the school’s potable watersystem (CDC, 1998). Another backflow incident through a cross-connection with a boiler and a faultybackflow prevention device occurred in New Jersey, causing six people to become ill withmethemoglobinemia caused by nitrites (CDC, 1998). Potential health effects of nitrate consumptioninclude diuresis and hemorrhaging of the spleen, among others (US EPA, 2002a).
5.2.2 Biological ContaminantsThe risks posed by backflow of biological contaminants vary dramatically depending on the
disease vector, the concentration and degree of infectivity of the pathogen, the level of disinfectantresidual maintained by the water system, and the health of the individual exposed (Rusin et al., 1997). Infective dose studies of non-primary (opportunistic) pathogens on healthy individuals and animals, usingthe oral and intranasal route, demonstrate that very high doses (e.g., for bacteria, 106 -1010 cells) areneeded for infection or disease (Rusin et al., 1997).
Pathogenic microorganisms (e.g., Giardia, some strains of E. coli) have contaminated potablewater supplies through cross-connections with sewer lines, untreated surface water sources, reclaimedwater supplies, equipment at medical facilities and mortuaries, and utility sinks, pools, and similarreceptacles. In addition, drain lines, laboratories, and illegal connections of private wells and cisterns topublic water supplies are primary sources of contamination (USC FCCCHR, 1993).
A majority of microbial incident reports (32 of 58) list the microbial contaminant as “sewage” ornonspecific microbes. In the summer of 1990, 1,100 guests of a country club in Tennessee sufferedintestinal disorders in two mass incidents after consuming the club’s contaminated water supplied froman auxiliary well that had become contaminated with sewage due to a cross-connection (AWWA PNWS,1995). In February, 1990, a cross-connection between an auxiliary irrigation system supporting a golfcourse and country club and the Seattle Water Department’s distribution system resulted in total andfecal coliform contamination that was detected by neighboring systems purchasing water (AWWAPNWS, 1995). The health effects from pathogens are often not specifically reported in the incidentreports, making it more difficult to determine the type of microbial contaminant. The combination ofthese reporting issues leads to underreporting of contamination linked to a specific pathogen.
The general health effects of most microbial pathogens include fever, nausea, and diarrhea, whilesome diseases have long-term and/or life-threatening effects. For example, the protozoan Giardia (acontaminant in 12 reported incidents) causes severe and potentially long-term diarrhea, accompanied by

Cross-C onnec tion Con trol August 13, 2002
12
excessive gas, bloating, and weight loss. The Microbial Health Effects Table lists these general healtheffects and other potential diseases (US EPA, 2002b); however, the table is not all inclusive; additionalpotential health effects exist.
From backflow incident records collected by EPA, the most common microbial contaminantsand their potential health effects are listed below with examples of backflow incidents.
ShigellaShigella species are a cause of gastroenteritis, and are reported as contaminants in five incidents.
The associated symptoms are vomiting, diarrhea, fever, and convulsions (US EPA, 2002b). All speciesof Shigella are highly infectious in humans and are spread through ingestion of fecal contamination (USFDA, 2001a). In one incident in 1977, a cross-connection led to four cases of shigellosis in an apartmenthouse in Chicago, Illinois (USC FCCCHR, 1993). It is unknown whether the cross-connection spreadShigella into the distribution system.
E. coliE. coli, a common biological contaminant (reported as a contaminant in two incidents) that is
found in sewage, is normally a benign intestinal bacterium that is present in every human. However,some strains of E. coli are pathogenic, and can cause a variety of internal disorders. The most commoneffect is watery diarrhea, with some strains causing fever or dysentery. In rarer cases, some strains ofE. coli can cause persistent diarrhea in young children, and have hemolytic properties. An infamousstrain of E. coli is strain O157:H7, which, in addition to causing bloody diarrhea, can cause kidneyfailure (US EPA, 2002b). In 2000, two outbreaks of E. coli occurred in Medina County, OH, whereapproximately 30 became ill (Cleveland Plain Dealer, 2001).
SalmonellaSalmonella is one of the primary intestinal bacterial waterborne pathogens (reported as a
contaminant in one incident). Depending on the strain, health effects can include typhoid fever,gastroenteritis (salmonellosis) (Benenson, 1995), and septicemia (US EPA, 2002b). In one incident, 750people became ill with Salmonella enteritidis in Richland, Washington, in 1983. The incident involvednew plumbing and contaminated ice (CDC, 1984). A person infected with the Salmonella enteritidisbacterium usually has fever, abdominal cramps, and diarrhea beginning 12 to 72 hours after consuming acontaminated food or beverage. The diarrhea can be severe, and the person may be ill enough to requirehospitalization (CDC DBMD, 2001).
Campylobacter jejuniCampylobacter jejuni is an avian gut bacteria that is the primary cause of bacterial diarrhea in
the United States (CDC, 2002b). It is estimated that Campylobacter infects over two million people ayear, and 10,000 cases are reported to the CDC annually, despite limited monitoring. AlthoughCampylobacter is primarily a foodborne pathogen, it has been implicated in waterborne diseaseoutbreaks in the past (CDC, 1996). This bacteria can cause gastroenteritis with symptoms includingbloody diarrhea, fever, and abdominal cramping (US EPA, 2002b). In extreme cases, a Campylobacterinfection may lead to Guillain-Barré syndrome where the immune system attacks part of the nervoussystem (CDC, 2002b). In 1986, 250 people became ill with diarrhea due to Campylobactercontamination in Noble, OK (CDC, 1996).
CyanobacteriaCyanobacteria are photosynthetic free-living bacteria. They produce algal blooms in fresh water,
which can result in elevated toxin levels. Cyanobacterial toxins can produce acute neurotoxicity,
Cross-C onnec tion Con trol August 13, 2002
13
hepatotoxicity, gastroenteritis, respiratory ailments, skin irritation, and allergic reactions through contactor ingest ion (CDC, 2002c). In one incident in 1992, in Ritzville, Washington, backsiphonage from adrain sump near a new reservoir caused a reoccurring contamination of cyanobacteria (AWWA PNWS,1995).
Norwalk and Norwalk-like virusesThe Norwalk family of viruses is a cause of viral gastroenteritis with symptoms of vomiting,
diarrhea, upper respiratory problems, and fever (US EPA, 2002b). Although viral gastroenteritis iscaused by a number of viruses, it is estimated that Norwalk or Norwalk-like viruses are responsible forabout 1/3 of the cases of viral gastroenteritis not involving the 6-to-24-month age group (US FDA,2001b). People often develop immunity to the Norwalk virus, however, it is not permanent andreinfection can occur (US FDA, 2001b). In developing countries the percentage of individuals who havedeveloped immunity is very high at an early age. In the United States, the percentage increases graduallywith age, reaching 50 percent in the part of the population over 18 years of age. Norwalk or Norwalk-like viruses were reported as a contaminant in two incidents. In one incident in 1980 in Lindale,Georgia, 1,500 people became ill with a Norwalk-like acute gastrointestinal illness as a result of acontamination incident for which the specific chemical or microbiological contaminant was neverdetermined (CDC, 1982).
GiardiaGiardia was a contaminant in 12 reported incidents. Giardia are intestinal parasites that exist in
natural waters in a nonreproductive stage (cysts). They can cause diarrhea, as well as vomiting, cramps,and bloating (US EPA, 2002b). The mode of infection is through ingestion of fecally contaminated foodor water. The infections from these parasites are usually self-limiting, but among children, the elderly,and the immunocompromised, the infections can lead to chronic diarrhea, anemia, fever, and possiblydeath (Hoxie et al., 1997; US EPA, 1998; CDC, 2002a). In 1979, Giardia was responsible for 2,000illnesses after backpressure effluent from a tree bubbler system in an Arizona State park (Lake Havasu)contaminated the potable water supply (USC FCCCHR, 1993). In 1994, dozens of people became illfrom Giardia contamination through a cross-connection between a drain and an ice machine at aconvention in Columbus, Ohio (AWWA PNWS, 1995).
Other contaminants Biological contaminants that are nonmicrobial can also enter the distribution system. For
example, due to a cross-connection at a funeral home, human blood and bodily fluids from theembalming process were backsiphoned into the distribution system, and blood flowed from waterfountains and other water fixtures (US EPA, 1989). Human bodily fluids can be a vector for disease aswell as being an aesthetic concern.
5.3 Data on Selected Backflow Incidents, 1970-1999
There are no reporting requirements nationally for backflow incidents, and no central repositoryfor backflow incident information. Nonetheless, data on backflow incidents have been actively collectedby several organizations, including the following:
• Centers for Disease Control (CDC), the federal agency that tracks epidemiology of illnessesas reported by doctors and health care providers.

Cross-C onnec tion Con trol August 13, 2002
14
• Cross-Connection Control Committee of the Pacific Northwest Section of the AmericanWater Works Association (AWWA PNWS), a technical and educational association for thedrinking water industry.
• University of Southern California’s (USC’s) Foundation for Cross-Connection Control andHydraulic Research, a water engineering research and industry standards developmentorganization.
• American Backflow Prevention Association (ABPA), a training and advocacy association forthe water system industry.
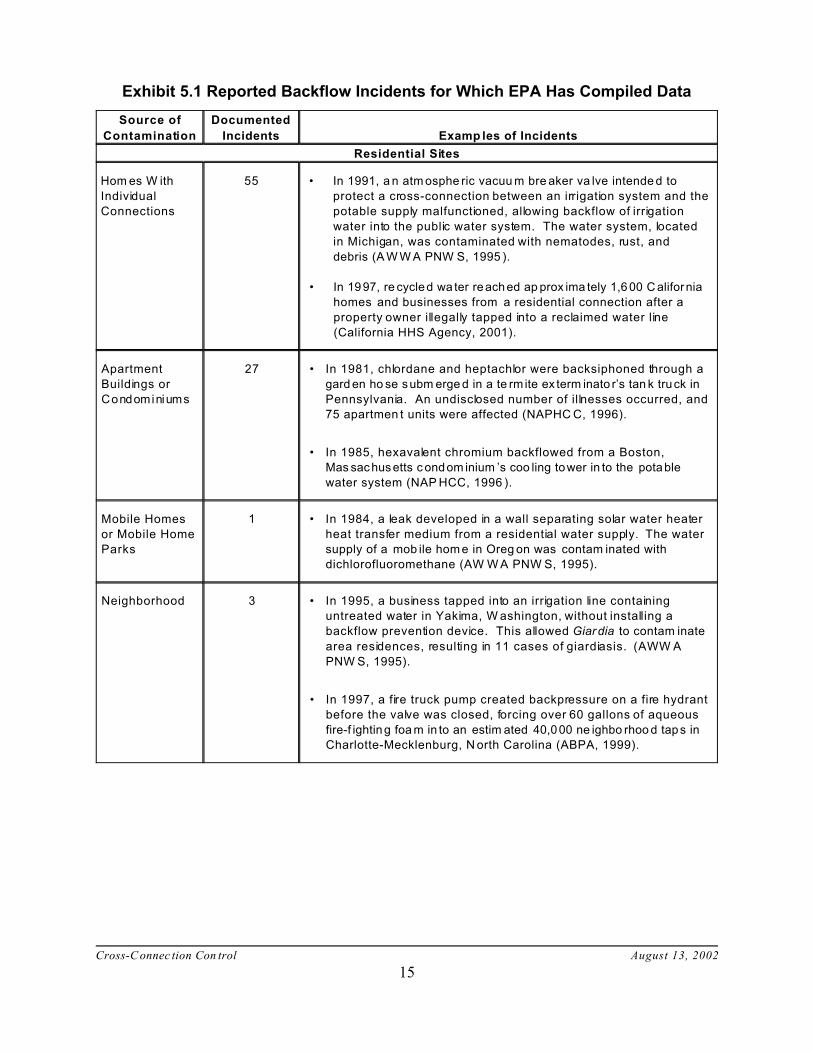
Drawing from these and other sources, including EPA Regional Offices, the Florida Departmentof Environmental Protection, professional manuals on controlling cross-connections, and news reportingaccounts, EPA compiled data on 459 backflow incidents that occurred in the United States between 1970and 2001. Exhibit 5.1 summarizes the types of incidents reported at various sites and indicates the widerange of problems that can occur. Because backflow incidents are underreported, the data cannot supportconclusions about the full magnitude of risk associated with backflow. And the exhibit summarizes onlythe reported acute health impacts, as surveillance programs do not capture impacts due to chronicexposures or chronic health effects.
Cross-C onnec tion Con trol August 13, 2002
15
Exhibit 5.1 Reported Backflow Incidents for Which EPA Has Compiled Data
Source of
Contamination
Documented
Incidents Examp les of Incidents
Residential Sites
Hom es W ith
Individual
Connections
55 • In 1991, a n atm osphe ric vacuu m bre aker va lve intende d to
protect a cross-connection between an irrigation system and the
potable supply malfunctioned, allowing backflow of irrigation
water into the public water system. The water system, located
in Michigan, was contaminated with nematodes, rust, and
debris (A W W A PNW S, 1995 ).
• In 1997, re cycled wa ter re ached ap prox ima tely 1,6 00 C alifornia
homes and businesses from a residential connection after a
property owner illegally tapped into a reclaimed water line
(California HHS Agency, 2001).
Apartment
Buildings or
Condominiums
27 • In 1981, chlordane and heptachlor were backsiphoned through a
gard en ho se subm erge d in a te rm ite ex term inato r’s tan k truck in
Pennsylvania. An undisclosed number of illnesses occurred, and
75 apartmen t units were affected (NAPHC C, 1996).
• In 1985, hexavalent chromium backflowed from a Boston,
Mas sachusetts c ondom inium ’s coo ling tower in to the potable
water system (NAP HCC, 1996 ).
Mobile Homes
or Mobile Home
Parks
1 • In 1984, a leak developed in a wall separating solar water heater
heat transfer medium from a residential water supply. The water
supply of a mob ile hom e in Oreg on was contam inated with
dichlorofluoromethane (AW W A PNW S, 1995).
Neighborhood 3 • In 1995, a business tapped into an irrigation line containing
untreated water in Yakima, W ashington, without installing a
backflow prevention device. This allowed Giar dia to contam inate
area residences, resulting in 11 cases of giardiasis. (AWW A
PNW S, 1995).
• In 1997, a fire truck pump created backpressure on a fire hydrant
before the valve was closed, forcing over 60 gallons of aqueous
fire-f ighting foa m in to an estim ated 40,000 ne ighbo rhoo d taps in
Charlotte-Mecklenburg, N orth Carolina (ABPA, 1999).

Exhibit 5.1 Reported Backflow Incidents for Which EPA Has Compiled Data
Source of
Contamination
Documented
Incidents Examp les of Incidents
Cross-C onnec tion Con trol August 13, 2002
16
Government and Institutional Sites
Medical Sites
(Hospita l,
Dental, Nursing
Sites, Blood
Bank s, etc.)
27 • In 1982 in Illin ois, e thylene glyco l back siphoned from a n air
condition ing sys tem ’s wa ter ho lding tank into a g roup of dia lysis
machines, con tributing to the death of ?several” (number not
given) patients (AWW A PNW S, 1995).
• During shut-down of a water main to repair a valve in 1984, the
backflow of water from a nursing home’s boiler caused burns to a
water de partm ent em ployee’s ha nds in W ashingto n State
(AW W A PNW S, 1995).
• In 1994, during repa irs to a nurs ing ho me air co nditioning u nit in
Franklin, Nebraska, a hole left in the cooling coils allowed freon
to backflow into the city water main, affecting the city’s 1,100
residents. Custome rs complained abo ut the taste of the water,
but no illnesses were reported (AW W A PNW S, 1995).
Schools,
Universities, and
Child ren’s
Camps
31 • In 1990, six staff members of an Indiana middle school reported
becoming ill after drinking water containing ethylene glycol that
backflow ed from the school’s co oling s ystem into the potable
water system (AW W A PNW S, 1995).
• In 1987, copper sediment contamination in a beverage mixing
tank resulted in four cases of illness in a residence hall at
Michigan university (AWW A PNW S, 1995).
• In 1995, three people became ill at a California school after
drinking water from a system with a double-check backflow
prevention valve that did not meet industry standards and had
badly deteriorated rubber gaskets (Craun an d Calderon, 2001).
Public Water
Systems
15 • In 1984, creosote was backsiphoned through a three-quarter inch
hose used to prim e a pump, co ntaminating a section of a
Georgia community water system. No illnesses were reported
(AW W A PNW S, 1995 ).
• In 1970 in Mattoon, Illinois, hot wash water from an asphalt plant
back pressu red into m ains durin g flow testin g of fire hydra nts
(USC FC CCHR , 1993).
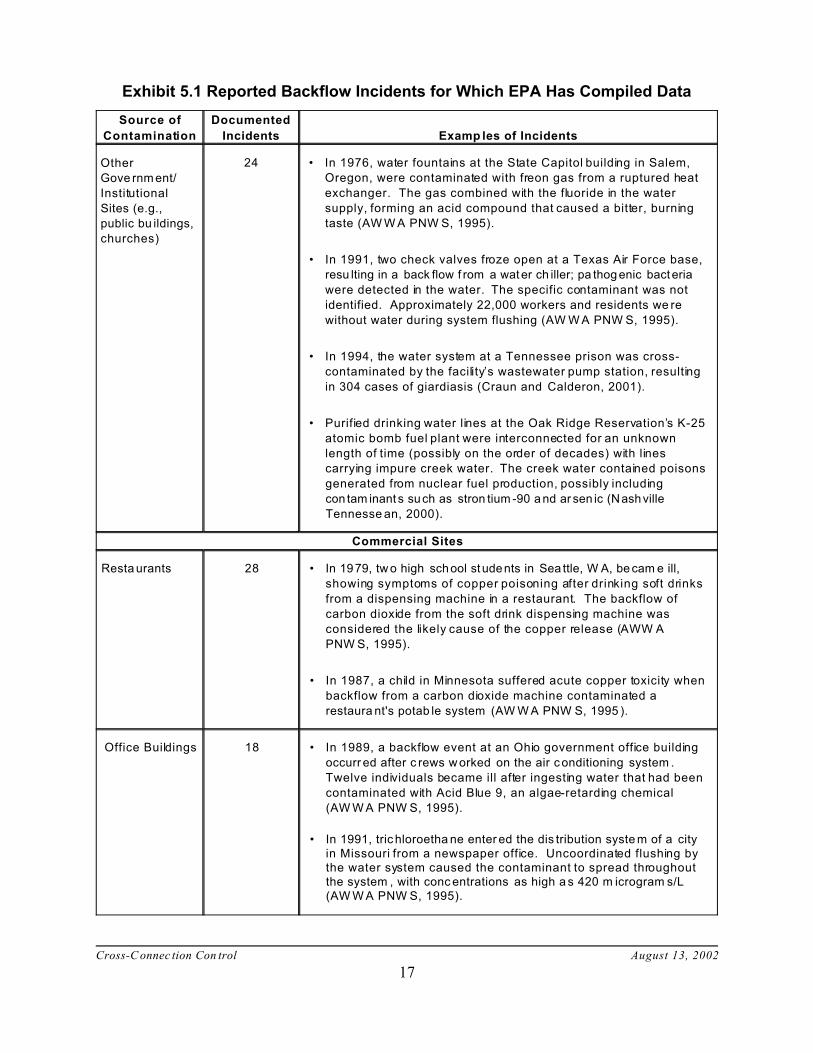
Exhibit 5.1 Reported Backflow Incidents for Which EPA Has Compiled Data
Source of
Contamination
Documented
Incidents Examp les of Incidents
Cross-C onnec tion Con trol August 13, 2002
17
Other
Gove rnm ent/
Institutional
Sites (e.g.,
public bu ildings,
churches)
24 • In 1976, water fountains at the State Capitol building in Salem,
Oregon, were contaminated with freon gas from a ruptured heat
exchanger. The gas combined with the fluoride in the water
supply, forming an acid compound that caused a bitter, burning
taste (AW W A PNW S, 1995).
• In 1991, two check valves froze open at a Texas Air Force base,
resu lting in a back flow f rom a water ch iller; pa thog enic bacteria
were detected in the water. The specific contaminant was not
identified. Approximately 22,000 workers and residents we re
without water during system flushing (AW W A PNW S, 1995).
• In 1994, the water system at a Tennessee prison was cross-
contaminated by the facility’s wastewater pump station, resulting
in 304 cases of giardiasis (Craun and Calderon, 2001).
• Purified drinking water lines at the Oak Ridge Reservation’s K-25
atomic bomb fuel plant were interconnected for an unknown
length of time (possibly on the order of decades) with lines
carrying impure creek water. The creek water contained poisons
generated from nuclear fuel production, possibly including
con tam inant s such as stron tium -90 a nd ar sen ic (Nashville
Tennesse an, 2000).
Commercial Sites
Resta urants 28 • In 1979, tw o high school st udents in Sea ttle, W A, be cam e ill,
showing symptoms of copper poisoning after drinking soft drinks
from a dispensing machine in a restaurant. The backflow of
carbon dioxide from the soft drink dispensing machine was
considered the likely cause of the copper release (AWW A
PNW S, 1995).
• In 1987, a child in Minnesota suffered acute copper toxicity when
backflow from a carbon dioxide machine contaminated a
restaura nt's potab le system (AW W A PNW S, 1995 ).
Office Buildings 18 • In 1989, a backflow event at an Ohio government office building
occurr ed after c rews w orked on the air c onditioning system .
Twelve individuals became ill after ingesting water that had been
contaminated with Acid Blue 9, an algae-retarding chemical
(AW W A PNW S, 1995).
• In 1991, tric hloroetha ne enter ed the dis tribution syste m of a cityin Missouri from a newspaper office. Uncoordinated flushing bythe water system caused the contaminant to spread throughoutthe system , with conc entrations as high a s 420 m icrogram s/L(AW W A PNW S, 1995).
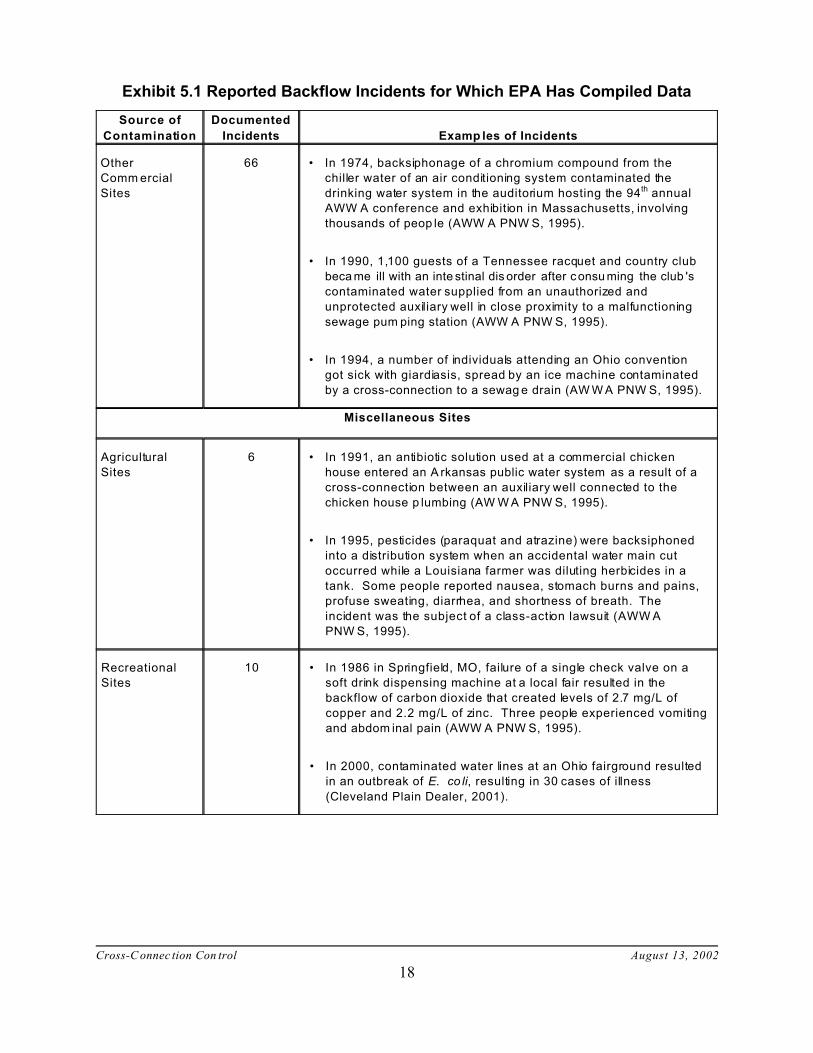
Exhibit 5.1 Reported Backflow Incidents for Which EPA Has Compiled Data
Source of
Contamination
Documented
Incidents Examp les of Incidents
Cross-C onnec tion Con trol August 13, 2002
18
Other
Comm ercial
Sites
66 • In 1974, backsiphonage of a chromium compound from the
chiller water of an air conditioning system contaminated the
drinking water system in the auditorium hosting the 94th annual
AWW A conference and exhibition in Massachusetts, involving
thousands of peop le (AWW A PNW S, 1995).
• In 1990, 1,100 guests of a Tennessee racquet and country club
beca me ill with an inte stinal dis order after c onsu ming the club 's
contaminated water supplied from an unauthorized and
unprotected auxiliary well in close proximity to a malfunctioning
sewage pum ping station (AWW A PNW S, 1995).
• In 1994, a number of individuals attending an Ohio convention
got sick with giardiasis, spread by an ice machine contaminated
by a cross-connection to a sewag e drain (AW W A PNW S, 1995).
Miscellaneous Sites
Agricultural
Sites
6 • In 1991, an antibiotic solution used at a commercial chicken
house entered an A rkansas public water system as a result of a
cross-connection between an auxiliary well connected to the
chicken house p lumbing (AW W A PNW S, 1995).
• In 1995, pesticides (paraquat and atrazine) were backsiphoned
into a distribution system when an accidental water main cut
occurred while a Louisiana farmer was diluting herbicides in a
tank. Some people reported nausea, stomach burns and pains,
profuse sweating, diarrhea, and shortness of breath. The
incident was the subject of a class-action lawsuit (AWW A
PNW S, 1995).
Recreational
Sites
10 • In 1986 in Springfield, MO, failure of a single check valve on a
soft drink dispensing machine at a local fair resulted in the
backflow of carbon dioxide that created levels of 2.7 mg/L of
copper and 2.2 mg/L of zinc. Three people experienced vomiting
and abdom inal pain (AWW A PNW S, 1995).
• In 2000, contaminated water lines at an Ohio fairground resulted
in an outbreak of E. co li, resulting in 30 cases of illness
(Cleveland Plain Dealer, 2001).

Exhibit 5.1 Reported Backflow Incidents for Which EPA Has Compiled Data
Source of
Contamination
Documented
Incidents Examp les of Incidents
Cross-C onnec tion Con trol August 13, 2002
19
Industrial Sites 40 • In 1989, backpressure from a propane tank car forced propane
into th e wa ter su pply of Ford yce, A rkan sas . Thr ee pe ople in
separate buildings were injured from explosions after flushing
toilets, and two houses were destroyed and a business was
damaged by explosions and subsequent fires (AWW A PNWS,
1995).
• In 1990, at least two individuals became ill after an unknown
quantity of industrial chemicals backflowed into the public water
supply via an unprotected auxiliary line illegally tapped to a hose
connected to the plant’s flushing system. The incident occurred
at a New Mexico facility that transfo rms wheat a nd barley into
ethanol (AW W A PNW S, 1995).
Other S ites/Site
Type Unknown
108 • In 1980, a cross-connection aboard an Alaskan crab processing
ship resulted in backflow of sewage (including Giar dia), causing
189 employees to become ill and endangering about $35 million
worth of processed k ing crab (USC FC CCHR , 1993; CDC, 1982 ).
Total 459
Source: CDC, AWWA PNWS, ABPA, EPA, USC FCCCHR, FDEP, and Newspapers
5.4 Occurrence of Cross-Connections and Backflow
From a 1999 American Backflow Prevention Association (ABPA) survey, ABPA estimated that42 percent of cross-connection surveys conducted (by 135 respondents, representing 30 states) identifieda cross-connection. The most common cross-connections reported were from irrigation (62 percent ofrespondents identified an irrigation cross-connection), fire systems (43 percent), garden/washdown hoses(43 percent), and boilers (38 percent). A total of 233 backflow incidents were reported by 51 percent ofrespondents, or 1.7 incidents per system (ABPA, 1999). These numbers only reflect those backflowincidents detected; many go undetected because it is not practical for systems to continuously monitortheir distribution systems for changes in pressure or the presence of contaminants. In addition, ABPAconducted a survey in 2000, which included a question on the occurrence of low pressure events whichmay lead to backflow where unprotected. A survey of 70 systems responding to the survey reported11,186 pressure reduction incidents in the previous year; 34.8% of the incidents were from routineflushing, 19.2% were due to main breaks, and 16.2% of the incidents were due to service line breaks(ABPA, 2000).
5.5 Difficulties in Detecting Backflow Incidents and Associated Outbreaks
Contamination due to backflow incidents may not be detected or reported for several reasons:
• Bacterial contamination tends to be transient and highly localized (ABPA, 1999).

Cross-C onnec tion Con trol August 13, 2002
20
• Water system operators monitor routinely for coliform bacteria, however, most often that isthe only microbial monitoring conducted (US EPA, 2001). While these bacteria areimportant indicators of distribution system problems, some microbial contaminants may goundetected. The limited nature of biological monitoring, especially in smaller systems (asinfrequent as once per year), makes it unlikely that contamination will be detected in atimely manner. Operators monitor for a limited number of chemicals (US EPA, 2001), butnot routinely or often enough to identify most backflow incidents.
• Most backflow incidents are generally detected and reported to the local authority only ifcustomers detect an irregularity in their water supply. Not all contamination that producesillness and disease can be detected by taste, color, or odor (Hoxie et al., 1997). For manyhighly toxic substances, including benzene, vinyl chloride, and dichloromethane, the tasteand odor threshold is well above the drinking water maximum contaminant level (MCL)(DWI0441, 1992; Glaza and Park, 1992).
• Even if an irregularity is detected, it may not be reported by the consumer.
• When water system operators suspect backflow incidents, they have a disincentive todocument and report them because of concerns about legal liability and loss of consumerconfidence, as noted by an EPA Office of the Inspector General report (US EPA, 1995). (Fortunately, these same concerns provide the utility with an incentive to protect thedistribution system.)
• The difference between epidemic and endemic transmission is obscured by limitations inrecognizing when an outbreak occurs (Frost et al., 1996). A study of waterbornecryptosporidiosis estimates that out of every 10,000 infections by Cryptosporidium only 3would be reported, and concludes that surveillance for detected cases of a reportable illnessmay substantially underestimate rates of infection and morbidity (Perz et al., 1998).
• Some contaminants that enter the distribution system through cross-connections andbackflow may not be reportable.
• The incidents of reduced pressure and some cross-connections are often transient in nature. Pressure changes may not be detected by conventional pressure monitoring equipment. Reduced pressures may also affect only a portion of the distribution system, a specificpressure zone, or only piping beyond the service connection.
State officials offer perspective on the estimated extent of underreporting. One State officialsuspects that there may be 10 times as many as incidents as are reported (Fauver, 2002). Another Stateofficial estimates approximately 1,200 backflow incidents occur per year, assuming that all water mainbreaks will cause a backflow incident (and each of 600 public water systems in the State average 2 watermain breaks a year). Yet only 15 backflow incidents have been documented in the State since 1970(Koenig, 2002).
Outbreaks of illness associated with backflow incidents also are underreported, for the followingreasons:
Cross-C onnec tion Con trol August 13, 2002
21
• Outbreaks of illness may not be linked to an incident of backflow contamination (Craun andCalderon, 2001). Documented effects of contamination are usually acute and result fromshort-term exposures; whether mild or severe, the effect appears soon after exposure. Effectsthat are long-lasting or only appear after some time (chronic effects) are difficult to ascribeto a single event or associate with a waterborne source. Cross-connections combined withuncorrected backflow situations that cause continuous or intermittent exposure over a longtime and result in chronic illness would be less likely to be linked to backflowcontamination.
• Contamination may not affect enough people to attract the attention of public health officials(Craun and Calderon, 2001).
• Information that could tie an incident to an outbreak of illness or disease, such as where andwhen a contaminant entered the system, is often missing.
Even when incidents are detected and voluntarily reported, inconsistent reporting anddocumentation procedures make it hard to assess the full scope of the problem. Some organizations thatrecord incidents will accept reports only if they have documentation that meets their standards. The USCFCCCHR prepared a Summary of Case Histories (USC FCCCHR, 1993) that covers 397 incidents from1903 to 1993. The Chief Engineer of the Foundation estimated that more than 90 percent of thebackflow incidents known to water system administrators were not documented enough to be included inthe case histories (CCC WS, 1999). Inadequate documentation can result from the fact that wherebackflow is suspected, in most instances it is difficult if not impossible to trace the origin ofcontamination (BMI, 1999).
6.0 Costs of Backflow Contamination Incidents
The costs associated with backflow incidents depend on the nature and scope of the incident andthe nature and extent of the response. Depending on these factors, costs could be incurred for publicnotification; the repair of damage to water distribution system infrastructure; investigation, sampling, andlaboratory analysis; clean-up of structures and equipment; purchases of bottled water; responding toconsumer complaints; lawsuits (both legal fees and judgments); the repair of property damage;replacement of spoiled food; missed work and school; loss of production; and medical expenses. Beyondactual costs, other losses could include leisure time and even mortality.
The ABPA 1999 survey gathered information to estimate the costs water systems may incur tomitigate a backflow incident. The survey collected data from 25 water systems serving fewer than10,000 people and from 103 systems serving 10,000 people or more. Survey results show that for the 92systems that responded, water system operators expended an average of 494 hours per event mitigatingbackflow incidents. At $30 per hour (the average rate of technical labor reported by the Bureau of LaborStatistics (2000)), that averages $14,800 per event. Eleven of these were significantly more timeconsuming than the others, averaging 3,683 hours and about $110,500 (at $30 per hour) per incident. Excluding these 11 most time-consuming incidents, operators expended an average of 60.8 hours perincident and $1,820 per incident. Utility-level costs such as these do not include costs for all of thepossible elements described earlier, especially those for health-related effects.

Cross-C onnec tion Con trol August 13, 2002
22
Other backflow incidents reported monetary losses due to food spoilage, property damage, andlawsuits. Examples include a backflow of wastewater through a cross-connection created with the watersupply and the wastewater line when a new well was installed; the wastewater contaminated pork valuedat approximately $2 million (NAPHCC, 1996). A lawsuit for $21 million was filed against a pest controlcompany that contaminated the water supply to 63 homes and businesses with pesticide; the money wascompensation for physical distress, inconvenience (the homes and businesses were without water forseveral days), and loss of property value (AWWA PNWS, 1992).
7.0 Other Problems Associated with Backflow Incidents
This section discusses other negative effects associated with cross-connections and backflowthat, although not a direct threat to health, can cause other undesired effects such as negative publicity,consumer complaints, damage to the water system, and impediments to system operation. Negativeeffects discussed are: 1.) corrosion; 2.) microbial growth; and 3.) taste, odor, and color problems.
CorrosionMany contaminants, such as acids and carbon dioxide, can corrode pipes and other distribution
system materials. Many incidents of corrosion induced by carbon dioxide backflow have released toxicamounts of copper into drinking water systems (AWWA PNWS, 1995). Many of these incidents werereported because the corrosion was rapid enough and large enough in extent to produce concentrations ofcorroded metal high enough to be toxic or to lead to complaints about taste and odor.
Corrosion in iron pipes is much less likely to be noticed because iron is not as toxic as copper,and corrosion of iron and steel is relatively slow, leading to lower concentrations. But slow corrosion isa problem: corroded iron pipes can lead to discolored water, stained laundry, and taste complaints(McNeil and Edwards, 2001). Corrosion can also weaken the integrity of pipes, causing leaks that canallow contaminants in through intrusion or catastrophic breaks, which can in turn cause reduced pressure(McNeil and Edwards, 2001). Corrosion of iron pipes can also form tubercles that can shelter microbes(including pathogens) from disinfection (US EPA, 1992).
Microbial growthWhen backflow through cross-connections introduces microbes into the distribution system,
these organisms can attach to pipe walls in places where the disinfectant residual may be inadequate toinactivate the microbes, such as in dead ends. Such organisms, even if they are not pathogenicthemselves, can be a concern because they can colonize on the pipe walls, forming biofilms (US EPA,1992) that trap and concentrate nutrients, promoting growth of pathogens (Costerton and Lappin-Scott,1989). The biofilm can lead to total coliform violations, even in the absence of contamination events. Biofilm can also cause complaints about taste and odor and harbor potentially pathogenic organisms fromdisinfection (Characklis, 1988). Backflow through cross-connections can also introduce nutrients thatsupport the growth of pre-existing biofilms.
Taste, odor, and color problemsSome contaminants introduced through cross-connections and backflow may not cause illness
but may result in consumer complaints about the tastes, odors, or color of the water (e.g., seawater anddyes (AWWA PNWS, 1995)). Such incidents can lower consumer confidence in the water system,require water and employee time to flush the system to remove the offending contaminant, and initiate aninvestigation to identify and correct the cross-connection.
Cross-C onnec tion Con trol August 13, 2002
23
8.0 Suitable Measures for Preventing and Correcting Problems Caused byCross-Connections and Backflow
This section reviews existing research, data, and available information regarding the preventionof cross-connections and backflow incidents, as well as mitigation measures systems use following abackflow incident.
8.1 Preventive Measures
Backflow into the public water distribution system can be prevented by eliminating cross-connections or protecting the potable water supply using backflow prevention devices and assemblies.Some systems educate the public to prevent cross-connections, and maintain and inspect the distributionsystem to correct those found. However, because situations frequently arise where new cross-connectionsoccur before they are detected and corrected, it is helpful to build in to the distribution system physicalimpediments to backflow, including mechanical backflow prevention devices and assemblies. Systemslook to minimize the risk posed to their distribution systems from a customer’s plumbing system, andtherefore conduct hazard assessments in order to determine the level of protection needed and whatapproach should be taken. The appropriate type of protection depends on the physical characteristics ofthe cross-connection (e.g., whether there is a potential for backpressure in addition to backsiphonage) andthe degree of the potential hazard. The degree of hazard is a function of both the probability thatbackflow may occur and the toxicity or pathogenicity of the contaminant involved. A high hazard can bedefined as,
“a condition, device, or practice which is conducive to the introduction of waterborne diseaseorganisms, or harmful chemical, physical, or radioactive substances into a public water system,and which presents an unreasonable risk to health” (BMI, 1996).
Low hazard can be defined as,
“a hazard that could cause aesthetic problems or have a detrimental secondary effect on thequality of the public potable water supply” (BMI, 1996).
Another reason for conducting risk assessments is to determine and help manage legal liabilitydue to public health risk; therefore, these definitions of high and low hazard are ultimately subjective anddepend upon the risk aversion of the water system, appropriate local regulations, and the particular riskassessment conducted by the system.
8.1.1 Physical SeparationAir gaps, if designed and maintained properly, make backflow physically impossible as they
ensure that there is no connection between the supply main and the nonpotable source. An effective airgap is a physical separation of a supply pipe from the overflow rim of a receiving receptacle, by at leasttwice the diameter (minimum of one inch) of the incoming supply pipe (USC FCCCHR, 1993; BMI,1996). The distance between the end of a faucet and the overflow of a utility sink is an example of an airgap. While air gaps provide physical assurances against backflow, they are often tampered with aspeople extend the end of the pipe to prevent splashing and thus potentially create a cross-connection. Bythe AWWA standard, air gaps are acceptable in lieu of mechanical backflow prevention assembliesbeyond the service connection only if installed and maintained by the local cross-connection controlprogram enforcement agency (AWWA, 1999).
Cross-C onnec tion Con trol August 13, 2002
24
8.1.2 Backflow Prevention Devices and AssembliesMechanical backflow prevention devices and assemblies offer protection of the potable water
system if other protective approaches fail. Backflow prevention devices and assemblies may be installedat the service connection to a facility (effectively “containing” a potential contaminant within acustomer’s plumbing system and preventing it from entering the distribution system). Alternatively,devices and assemblies can also be instal led at high and low hazard cross-connections inside the facility,including all outlets where cross-connections could potentially be created (this type of approach is called“isolation” or “fixture outlet protection”). Some drinking water authorities prefer isolation tocontainment because personnel working beyond the service connection are protected and, in most cases,the assembly can be sized smaller because of smaller piping beyond the service connection. However,backflow devices and assemblies used for isolation could be bypassed through changes to internalplumbing, inadvertently creating an unprotected cross-connection.
There are two types of mechanical protection available to systems: backflow prevention“devices” and backflow prevention “assemblies”. Backflow prevention devices function by stopping thereversal of flow, but are not testable once installed because they do not have inlet and outlet shut-offvalves or test cocks (USC FCCCHR, 1993). Backflow prevention assemblies, by contrast, include aninlet and outlet shut-off valve and test cocks to facilitate testing of the assembly while it is in itsfunctional environment (in-line) (USC FCCCHR, 1993).
Backflow prevention assemblies include pressure vacuum breakers (PVBs), spill resistantvacuum breakers (SVBs), double check valve assemblies (DCVAs), and reduced pressure principlebackflow assemblies (RPs) (USC FCCCHR, 1993) (BMI, 1996). PVBs are vertically positionedassemblies that include spring-loaded check valves designed to close when flow stops (USC FCCCHR,1993). They also have an air inlet valve that is designed to open when the internal pressure is lower thanthe atmospheric pressure, preventing backsiphonage but not backpressure. PVBs must be a minimum of12 inches above all downstream piping and the flood level rim of a receptor to function properly. PVBsare designed to protect against low- or high-hazard situations.
SVBs are similar in design to PVBs with the addition of a diaphragm seal that stops water fromspilling out the air inlet whenever the assembly is pressurized. As with PVBs, they protect againstbacksiphonage only (BMI, 1996).
A DCVA consists of two internally loaded, independently operating check valves together withtightly closing resilient seated shut-off valves upstream and downstream from the check valves (USCFCCCHR, 1993). These assemblies require a minimum of 1 foot of clearance at the bottom formaintenance purposes to allow for the worker to get to the assembly. These assemblies are used forprotection against either backsiphonage or backpressure, but only for situations of low hazard.
RPs consist of two internally loaded, independently operating check valves and a mechanicallyindependent, hydraulically dependent relief valve located between the check valves (USC FCCCHR,1993). The relief valve maintains a zone of reduced pressure between the two check valves. The RPalso has tightly closing, resilient seated shut-off valves upstream and downstream of the water supply. RPs must have a minimum of 1 foot clearance at the bottom of the assembly for maintenance purposes. RPs protect against backsiphonage or backpressure in low- or high-hazard situations.
One common backflow prevention device is an atmospheric vacuum breaker (AVB). AVBs relyon atmospheric instead of water pressure to work, and are installed downstream from all shut-off valves.

Cross-C onnec tion Con trol August 13, 2002
25
AVBs contain an air inlet valve that closes when the water flows in the normal direction. But, as waterceases to flow, the air inlet valve opens and prevents backsiphonage. AVBs must be a minimum of 6inches above all downstream piping and the flood level rim of a receptor to function properly (USCFCCCHR, 1993). Household hose bib vacuum breakers and frost-proof wall hydrant faucets areexamples of AVBs. According to some, AVBs do not protect against backpressure and are used insituations of low hazard (BMI, 1999); however, some plumbing codes recognize AVBs as high hazardassemblies.
The selection of any particular assembly or device is a function of the hazard assessment thatbalances the likelihood of backpressure and backsiphonage and the potential contaminants involved. Thetotal cost of installing and maintaining a particular device or assembly can also be a factor for somewater systems. In cases of low hazard and backsiphonage only, systems typically install less expensiveAVBs or PVBs. If backpressure is a concern, many systems use double check valve assemblies, and ifthe degree of hazard is high, many systems install a reduced pressure principle backflow assembly.
The cost of backflow preventers has been reported by industry experts to be a deterrent instarting and maintaining and backflow prevention program (CCC WS, 1999). The cost of backflowpreventers can range from $18 to over $22,000 (Watts, 2002), depending on the size and preventer type. Installation costs are typically borne by the water system and passed along to consumers, or are bornedirectly by consumers (ABPA, 2000).
8.1.3 Cross-Connection Control and Backflow Prevention ProgramsMany states and local jurisdictions require cross-connection control and backflow prevention
programs. However, many utilities do not have programs, or have programs that are insufficient toprovide reasonable protection from cross-connections (ABPA, 1999). The program requirements varywidely between states: they may be part one or more of various regulations, including the drinking waterregulations, health code, plumbing code, policy decision of the utility itself and building codes. A 1993U.S. General Accounting Office report on the review of 200 sanitary surveys and a nationwidequestionnaire of states identified inadequate cross-connection control programs as the most commondeficiency (US GAO, 1993).
Programs and their level of effort are often tailored to the perceived risk of backflow and thetypes of hazards that can be introduced into the distribution system (USC FCCCHR, 1993). Thesefactors may contribute to determining whether a containment or isolation program is implementedlocally, as well as what types of backflow preventers are required. The need for backflow prevention in awater system is determined through a variety of means, including: surveys of new sites; retrofitprograms; and change of occupancy inspections. Some programs inspect a site upon request. In many ofthese cases, identification of hazards determines the need for backflow prevention. For example, KansasCity, Missouri’s program does informal, informational checks and passes the data to the plumbingauthority (Nelson, 1999). The cross-connection control programs of Boston and Cambridge,Massachusetts, check connections to the last free-flowing tap (Hendrickson, 1999). Other programs,such as the one for Gatlinburg, Tennessee, identify additional requirements as a function of the risk ofthe facility (City of Gatlinburg, 2001). The water system in Price, Utah, performs about 20-30inspections each year, about half of which go beyond containment to focus on potential cross-connectionhazards. Staff focus primarily on high-hazard sites, but inspect other types of sites after installations orupgrades (Price, 1999).

Cross-C onnec tion Con trol August 13, 2002
26
In an effort to evaluate the measures states take to address cross-connections and backflow, EPAanalyzed existing state requirements (Exhibit 8.1). The analysis reviewed regulations of all statespertaining to drinking water, clean water, and plumbing and building codes. Additionally, informationfrom the following surveys was used as supplementary information for the analysis: the EPA Office ofInspector General Report (The Survey Report on the Cross-Connection Control Program, 1995); theFlorida Report (The State of Florida’s Evaluation of Cross-Connection Control Rules/Regulations in the50 States, FDEP, 1996); Governmental Affairs Committee (GAC) Follow-up Survey (Summary of theCross-Connection Control Requirements-Nationally, 1997); the American Backflow PreventionAssociation (ABPA) Survey, 1999; the Associat ion of State Drinking Water Administrators (ASDWA)Survey, 1999; and the Van Loon Survey, 1999.

Cross-C onnec tion Con trol August 13, 2002
27
Exhibit 8.1. State Cross-C onnection C ontrol Requ irements
Requirement
Number of States
With Requirement
Does the State have a requirement for the control of cross-connections and/or
backflow prevention?
50
Is it specified in the requirement that the system must implement or develop a
cross-connection control and/or backflow prevention program?
32
Does the State require authority to implement a local ordinance or rule for cross-
connection control and/or backflow prevention?
33
- Must the authority cover testing of backflow prevention assemblies? 27
- Must the authority cover the use of only licensed or certified
backflow assembly testers?
16
- Must the authority cover the entry of the premises for the sake of
inspecting the premises?
14
- Must the authority cover the entry of the premises for the sake of
inspecting and/or installing backflow prevention assemblies?
15
Does the State require training, licensing, or certification of backflow prevention
assembly testers?
26
Does the State require training, licensing, or certification of backflow prevention
assembly and/or device installers?
6
Does the State require training, licensing, or certification of backflow prevention
assembly and/or device repairers?
10
Does the State require training, licensing, or certification of cross-connection
control inspectors?
19
Does the State require inspection of backflow prevention devices and/or testing of
backflow prevention assemblies?
37
Does the State require the system to include record keeping as part of cross-
connec tion contro l?
34
Does the requirement include keeping records of hazard assessment surveys? 11
Does the State require the system to notify the public following the occurrence of a
back flow even t?
3
Does the state require the local rule or ordinance to allow the system to take
enforcement action against customers that do not comply with the cross-
connection control and backflow prevention requirements?
23
Does the State conduct periodic reviews of cross-connection control programs? 3
Does the State regulation or plumbing code require public education regarding
cross-connection control and/or backflow prevention?
7
Source: Derived from state drinking water and clean water regulations and state plumbing and building codes.
Cross-C onnec tion Con trol August 13, 2002
28
Considerable variability exists in state statutes, regulations, and policies related to cross-connection control and backflow prevention. In some cases where states do not require programs, somewater systems within the state have implemented comprehensive and active programs in absence of astate requirement to do so.
According to input from a Cross-Connection Control Expert Meeting in September, 1999, aprogram is considered active and comprehensive if it contained regulations with these requirements: 1)require adoption of some form of legal authority (ordinance, by-law, code) for establishing andmaintaining a cross-connection control program at the local level; 2) require training and certificationspecifications; 3) require record keeping and reporting; 4) provides public education; and 5) defineenforcement responsibility and penalties. Many state programs that require cross-connection control andbackflow prevention programs share these elements (ASDWA, 1999; USC FCCCHR, 1993). As notedin Exhibit 8.1, several states have these requirements, although a majority do not have all five of therecommended minimum elements.
AuthorityExperts agreed that a cross-connection control program should have the authority to effectively
enforce its ordinances and requirements (CCC WS, 1999). It is recommended by groups such as theAWWA (AWWA, 1999) that local cross-connection control programs have the legal authority in place tocarry out basic program requirements, such as: 1) enter premises and inspect facilities to determine thedegree of hazard and the presence of cross-connections; 2) to install, repair, and test backflow devices; 3)license employees or contractors engaged in testing of assemblies to ensure competency; and 4)terminate water service in case of noncompliance. Not all states require authority to effectively enforcethe ordinances and requirements—33 states require local authorities to implement cross-connectioncontrol ordinances. Of those states, only 14 states require authority to enter premises for inspectionpurposes, and 15 states require authority to enter premises to inspect or install backflow preventiondevices (Exhibit 8.1).
Different local authorities may have pre-existing responsibilities that would be overlapped by across-connection control program. Water utilities typically have the responsibility to protect thedistribution system up to a customer’s meter. In some cases, they fulfill this responsibility by placingbackflow assemblies at the meter (USC FCCCHR, 1993). Plumbing authorities are often responsible forall potable water connections downstream of the meter (USC FCCCHR, 1993). Engineers and buildingauthorities have inspection and compliance responsibilities which, in some cases, overlap with plumbingauthorities. Additional overlap of authority occurs with regard to fire lines. While fire lines can usepotable water and are frequently interconnected with the potable system (AWWA, 1999), they areusually unmetered and typically not considered part of the drinking water supply, and therefore are notsubject to plumbing codes. Having backflow assemblies on fire lines (e.g., the Boston, Massachusetts,program involving the fire authorities) requires the cooperation of fire departments. In addition, manyprograms require customers to understand the dangers of backflow and take effective measures toeliminate, fix, and isolate cross-connections.
Training and certificationTraining and certification is considered an important element of a cross-connection control and
backflow prevention program (CCC WS, 1999). The training and certification can cover administering aprogram, conducting site surveys, installing and testing approved backflow assemblies, as well as formaintaining and repairing backflow assemblies. The testing of backflow prevention assemblies by acertified tester works to ensure that the assembly is functioning properly and will prevent backflow.
Cross-C onnec tion Con trol August 13, 2002
29
Twenty-six states require certification of backflow assembly testers (Exhibit 8.1). In some states,backflow assembly testers also install and repair the backflow preventers, however only 6 states requiretraining, licensing, or certification of backflow installers (Exhibit 8.1). A small number of states expandtheir training requirements to program managers, installers, and/or repairers. Nineteen states requirecertification of survey inspectors (Exhibit 8.1).
Having trained and certified testers may contribute to effective cross-connection control and
backflow prevention. For example, in 1998, a 42-inch water main broke in close proximity to the BostonPublic Library, causing a dramatic drop in pressure in a large portion of the city for a short period;however, there were no reported backflow incidents (Hendrickson, 1999). The key elements of theBoston, Massachusetts, cross-connection control and backflow prevention program include 11 full-timecross-connection control staff employees, all of whom are certified testers licensed by the State ofMassachusetts (Hendrickson, 1999).
Public educationThere have been incidents of water system customers installing inadvertent cross-connections
leading to backflow incidents. Education of the public may reduce the number of cross-connectionscreated on the customer side, and is therefore a critical element in the implementation and success of across-connection control and backflow prevention program (CCC WS, 1999). Seven states requiredpublic education regarding cross-connection and/or backflow control and prevention (Exhibit 8.1). Public education is usually a function of the local water purveyor. Also, states sometimes providematerials for distribution, and maintain Internet sites that include information about state water qualityprograms to educate consumers about CCC programs and the role they play in protecting their drinkingwater. The Michigan Backflow Prevention Association has developed a video used for training utilitypersonnel on educating the public (MBPA, 1997).
Educational tools used by local programs are: meetings, brochures, and seminars. Las Vegas,Nevada, has run multiple seminars to explain the program since they serve two jurisdictions (Blish,1999). They have been so successful that some of the large casinos now have their own on-site trainedand certified cross-connection control personnel. Tucson, Arizona distributes backflow preventionbrochures to customers, and in the past has used public access television to promote the program. Theyalso distribute backflow prevention brochures to existing customers during inspections (Adams, 1999). Other programs distribute fliers and bill inserts. The public awareness program of Sandy City, Utah,consists of fact sheets, manufacturer’s information on backflow prevention, newspaper articles andnewsletters, public meetings with customers, and backflow information provided to people requestinginformation on sprinkler systems (Oakeson, 1999).
Reporting and record keepingA requirement to report backflow incidents is important for detection and correction of cross-
connections (CCC WS, 1999). Although many backflow incidents are believed to occur undetected,those that are detected can provide valuable information on other potential cross-connections in thedistribution system. Three states require reporting of backflow incidents to the public, while eight statesrequire systems to notify state authorities (Exhibit 8.1).
Lack of records or poorly organized records can inhibit corrective measures. Thirty-four statesrequire some sort of record keeping as part of their cross-connection control and backflow preventionprogram (Exhibit 8.1). As part of its cross-connection control program, Tucson, Arizona, has a datamanagement system that tracks each assembly’s compliance status (Adams, 1999). The Charlotte-
Cross-C onnec tion Con trol August 13, 2002
30
Mecklenburg incident involving firefighting foam, which took 39 hours and 100 city employees toremedy, prompted the state to require a comprehensive evaluation of the Charlotte-Mecklenburg UtilityDepartment’s backflow prevention program by an outside consultant. One of the key findings resultingfrom the evaluation was that the program did not have a formal retrofit program for existing connectionsand devoted excessive resources to record keeping; the resources spent on record keeping were usedinefficiently. Since then, the utility has implemented a new data management system to reduce therecord keeping burden and plans to hire an additional staff member to focus on developing a program forretrofitted equipment (ABPA, 1999).
Testing and repairMany systems that have cross-connection control and backflow prevention programs require
testing to ensure that backflow preventers are working correctly. As in any mechanical device, backflowassemblies can deteriorate and fail as they get older. Testing intervals typically are annual, semi-annual,or risk-based (USC FCCCHR, 1993).
Many states require in regulation or code specific components that make up a testing program. A testing program frequently identifies the appropriate standards that a backflow prevention device orassembly must meet (e.g., standards set by the USC FCCCHR, AWWA, or in the Uniform PlumbingCode (UPC)), as well as specifies a routine testing frequency to ensure adequate performance of thedevices. In many cases, assemblies are then tested by a certified backflow assembly tester. Approximately 37 states require inspection and/or testing of various backflow assemblies in theirregulations (Exhibit 8.1).
In Boston, Massachusetts, as required by the state, reduced pressure backflow assemblies aretested twice a year; double-check valve assemblies are tested once per year (Hendrickson, 1999). Theprogram performs 11,000 site inspections per year. All surveys go to the last free-flowing outletregardless of whether the facility is considered high- or low-hazard, as required by state cross-connectioncontrol regulations. Under this program, 100 percent of all high-hazard sites have installed protection. This high level of testing has prevented any cross-connection incident since 1984, and no boil-waternotices have been necessary (Hendrickson, 1999).
EnforcementAWWA recommends that cross-connection control program authority should include clearly
defined enforcement procedures such as provisions to shut off water service if devices are not installed ortested, entry to property is not allowed, devices and assemblies are not installed properly, devices are nottested, and testing payments are not received (AWWA, 1999). According to the 1995 EPA Office ofInspector General report, state officials indicated that they adopted a regulation prohibiting cross-connections and required the local water suppliers to establish a program with the responsibility toadminister and enforce the program at the local level (US EPA, 1995). State officials indicated,however, that there is little follow-up or enforcement at the state level (US EPA, 1995). In addition,several states do not require systems to develop programs to implement or enforce the requirements,through additional drinking water regulations, plumbing codes, or health codes. For example, only 23states require enforcement action against noncomplying customers (Exhibit 8.1). In Denver, Colorado,enforcement consists of notifying customers that backflow assemblies must be installed. Customers arethen given 90 days to comply, followed by a second notice, 30 days of grace, and then third notice. Failure to comply may lead to suspension of water service. Inspections are done by request and numberapproximately 25 per month (Stevens, 1999). Thirty-two states require water systems to have a CCC
Cross-C onnec tion Con trol August 13, 2002
31
program, but only three states conduct periodic reviews of cross-connection control programs, and thesereviews are conducted annually (Exhibit 8.1).
8.1.4 Disinfectant ResidualWhile not able to prevent cross-connections or backflow from occurring, the use of disinfectant
residuals (i.e., free chlorine or chloramines) can provide a measure of protection against waterbornedisease through the inactivation of some microbial or oxidation of some chemical contaminants. Although contamination from cross-connections and backflow may be controlled by a disinfectantresidual (Snead et al., 1980), some water supply professionals believe a disinfectant residual is noteffective when cross-connections result in massive contamination (LeChevallier, 1999). In some cases,reductions in a disinfectant residual can signify the existence of a contamination problem in thedistribution system, including those resulting from cross-connections and backflow (Haas, 1999). However, some disinfectant residual sampling strategies (e.g., grab samples), may not be able to detect areduction in disinfectant residual concentrations for transient events, such as many backflow incidents.
8.1.5 Pressure Stabilization and Maintenance of Positive PressureSince backsiphonage and possibly backpressure are induced by drops in distribution system
pressure, maintaining positive and stable pressure reduces the risk of backflow. Minimizing pressurespikes through use of variable speed pumps and proper valve opening and closing procedures may reducethe frequency of main breaks that cause backsiphonage (Kirmeyer et al, 2001), and thus be a preventivemeasure. Maintaining positive pressure through changes in pumping patterns and adding additionalpump power can minimize backsiphonage and may reduce the occurrence of backpressure events(Kirmeyer et al, 2001). Pressure stabilization and pressure maintenance may be difficult for systemswith multiple entry points and those with large variances in elevation or daily demand. Main breaks,firefighting demands, or other unusual demands that cannot be predicted will also hinder a system’sability to maintain pressure.
The initial design of a distribution system can minimize possible cross-connection and backflowopportunities by avoiding low pressure areas and ensuring positive pressure throughout the system. Water systems that are aware of pressure drops within their distribution systems can conduct additionalwater quality testing to determine if a backflow incident has occurred, thus detecting incidents that mayhave gone undetected. Systems that have records of pressure over a period of time have the ability toidentify chronic trouble spots, and the records can provide information to devise a strategy to fix them(LeChevallier et al, 2001). Studying and correcting low pressure zones in existing systems, eithercontinual or transient, can reduce the number of backflow incidents (LeChevallier et al., 2001).
8.1.6 Pipeline Maintenance and InspectionRegular inspection of pipelines may identify conditions that could lead to main breaks such as
frozen valves, advanced corrosion, and small leaks, and allow them to be repaired before they lead tomain breaks, which can lead to backsiphonage. Regularly cleaning and flushing pipelines may alsoreduce buildup and growth of biofilms that may promote corrosive conditions that can cause pipelineleaks and eventually breaks (Shindala and Chisolm, 1970; Norris and Ryker, 1987).
8.1.7 Sanitary SurveysThrough the course of conducting sanitary surveys on elements related to the distribution system,
likely cross-connections may be identified and corrected by the water system (US EPA, 1999). Sanitarysurveys may also find evidence of corroding pipelines, frozen valves, and other situations that could leadto pressure maintenance problems.
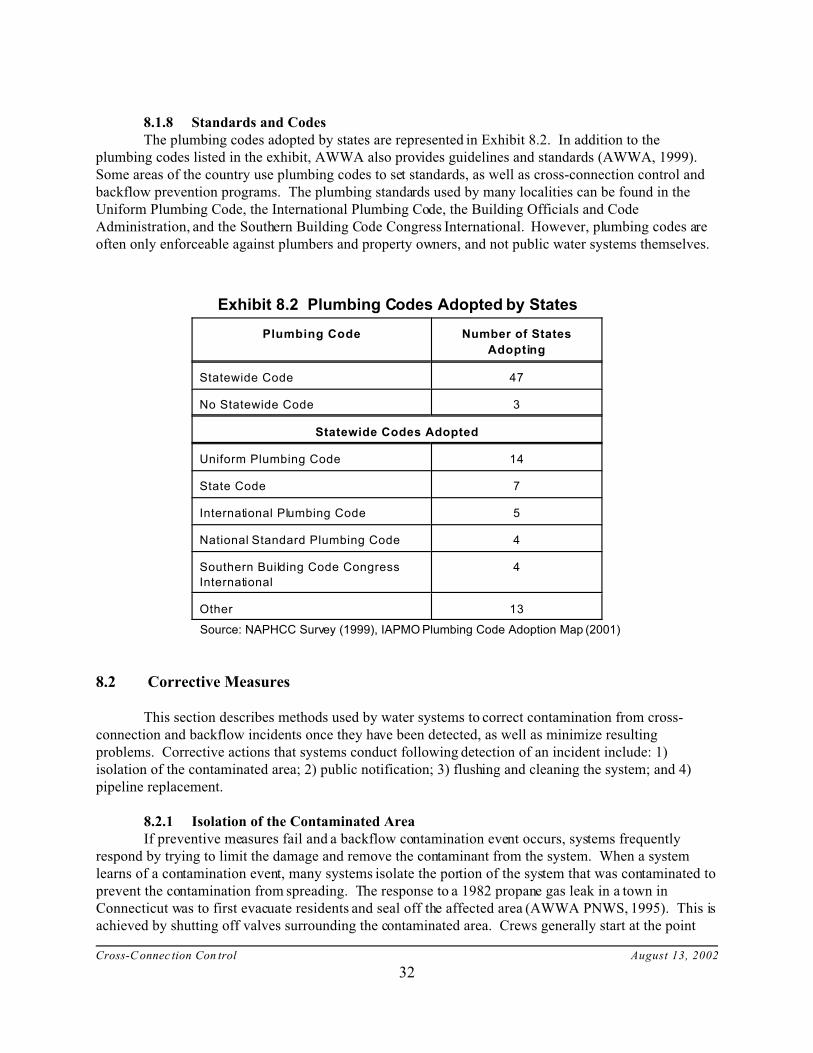
Cross-C onnec tion Con trol August 13, 2002
32
8.1.8 Standards and CodesThe plumbing codes adopted by states are represented in Exhibit 8.2. In addition to the
plumbing codes listed in the exhibit, AWWA also provides guidelines and standards (AWWA, 1999). Some areas of the country use plumbing codes to set standards, as well as cross-connection control andbackflow prevention programs. The plumbing standards used by many localities can be found in theUniform Plumbing Code, the International Plumbing Code, the Building Officials and CodeAdministration, and the Southern Building Code Congress International. However, plumbing codes areoften only enforceable against plumbers and property owners, and not public water systems themselves.
Exhibit 8.2 Plumbing Codes Adopted by States
Plumbing Code Number of States
Adopting
Statewide Code 47
No Statewide Code 3
Statewide Codes Adopted
Uniform Plumbing Code 14
State Code 7
International Plumbing Code 5
National Standard Plumbing Code 4
Southern Building Code Congress
International
4
Other 13
Source: NAPHCC Survey (1999), IAPMO Plumbing Code Adoption Map (2001)
8.2 Corrective Measures
This section describes methods used by water systems to correct contamination from cross-connection and backflow incidents once they have been detected, as well as minimize resultingproblems. Corrective actions that systems conduct following detection of an incident include: 1)isolation of the contaminated area; 2) public notification; 3) flushing and cleaning the system; and 4)pipeline replacement.
8.2.1 Isolation of the Contaminated AreaIf preventive measures fail and a backflow contamination event occurs, systems frequently
respond by trying to limit the damage and remove the contaminant from the system. When a systemlearns of a contamination event, many systems isolate the portion of the system that was contaminated toprevent the contamination from spreading. The response to a 1982 propane gas leak in a town inConnecticut was to first evacuate residents and seal off the affected area (AWWA PNWS, 1995). This isachieved by shutting off valves surrounding the contaminated area. Crews generally start at the point

Cross-C onnec tion Con trol August 13, 2002
33
where the contamination was reported and work their way out until they find the edge of thecontamination. Contaminants that are not detectable through sight or smell may be difficult to track andcontain if field testing techniques for the contaminant are not available. Because a stuck valve canprevent an area from being isolated and lead to the spread of contamination, valve exercising programscan be important in isolating contamination events. In 1988, in response to a backflow incident at a paintfactory in Edgewater, Florida, the factory manager isolated the factory water system from the city watersystem prior to flushing out the contaminants (USC FCCCHR, 1993). An example of not being able toisolate the area is the Charlotte-Mecklenburg incident (Exhibit 5.1), which required 90 million gallons toflush the distribution system (ABPA, 1999).
8.2.2 Public NotificationIf a contamination event has occurred and the contamination was unable to be isolated before
reaching customers, all customers served by the system must be notified (65 FR 25982). The type ofnotification depends on the contaminant and the size of the area contaminated (65 FR 25982). If thecontaminant has acute health effects notification must be as quick as possible, either through broadcastmedia or through system employees or public safety officials going door-to-door depending on the sizeof the area. For contaminants without immediate or short-term health effects, the public can be notifiedby other methods such as letters placed in mail boxes or print media (65 FR 25982). Notification of thepublic can prevent health effects by minimizing possible contact with contaminated water until otherimmediate corrective measures have been completed. During the Charlotte-Mecklenburg incident(Exhibit 5.1), the city coordinated an emergency response and notified 40,000 affected customers. In a25-block radius from the incident, door-to-door notifications were made instructing customers not to usetheir water. An extended area beyond the door-to-door radius was notified through media reports not touse their water (ABPA, 1999).
8.2.3 System Flushing and CleaningOnce a contamination event has been detected and isolated, usually water system authorities
flush the system as a first attempt to remove the contaminant. Flushing is done by opening up hydrantsand expelling water from the system using a wide open valve approach until the contaminant can nolonger be detected. If a large area has been affected several hydrants may need to be opened insuccession to clean the system. Flushing generally moves from the source of contamination in thedownstream direction. If the source of contamination is not found and fixed there is a possibility of arepeat incident. In 1986, after sodium hydroxide contaminated the distribution system of Lacey’sChapel, Alabama, water mains and affected plumbing were flushed after containment (Watts, 1998). Valves are then slowly opened before the hydrant is turned off. This allows for the removal of anycontamination that was undetected during system isolation and may have moved beyond the valves usedfor isolation (Yoke and Gittelman, 1986). Out of 28 backflow incidents on which EPA has informationand where a response was reported, 12 reported flushing the affected portion of the distribution system.
Some contaminants may not be adequately removed by flushing. Microbial contaminants mayconcentrate in biofilms that may not be easily dislodged by flushing alone. The water system servingMuncie, Indiana, drained its entire distribution system over a weekend in an unsuccessful effort toremove the biofilm (Geldreich, 1996). Other contaminants may adsorb to biofilm layers or corrodedpipe materials and be released slowly to water in the pipe and, therefore, may take an unreasonableamount of time to flush from the system (US EPA, 1992). In these cases, water systems may opt tophysically clean the pipelines. Pigging and rodding are cleaning methods where a device is introducedinto the pipe that physically scrapes biofilm and corrosion layers from the sides of the pipe (Kirmeyer et

Cross-C onnec tion Con trol August 13, 2002
34
al, 2001). Jetting and sandblasting can also be used to remove such layers. Typically pipes aredisinfected and flushed after a physical cleaning by one of the above methods.
8.2.4 Pipeline ReplacementSome contaminants may not be removed by physical cleaning. Examples include the pesticide
chlordane, which can adsorb to even clean pipe material and is released into solution only at slow rates. In 1987, following contamination of drinking water lines in Fairlawn and Hawthorn, New Jersey, withthe pesticides chlordane and heptachlor, the affected lines were removed and replaced (AWWA PNWS,1995). Radioactive materials are also difficult to remove physically as they can irradiate pipe materials. Other contaminants such as highly corrosive or explosive contaminants may cause damage to the system. In these cases, systems may choose to replace the contaminated piping and other appurtenances.
9.0 Possible Indicators of a Backflow Incident
This section discusses events, occurrences, or signals that help indicate to a water system orregulatory authority that a backflow incident is occurring or has occurred. A problem for water systemsin detecting cross-connections is that there is little immediate warning that a backflow incident isoccurring. In some cases it is not known for some time after an incident, and in other cases it is neverdiscovered. With an active monitoring program, cross-connections may be detected by routineinspection, and deficiencies in the distribution system that could lead to backflow could be corrected. However, the efficacy of a cross-connection control program might only be known to the extent that newbackflow incidents are not detected. Possible indicators of backflow include: 1) customer complaints ofwater quality; 2) drops in operating pressure; 3) drops in disinfectant residual; 4) water meters running inreverse; and 5) coliform detections. It is also possible that cross-connections and contamination due tobackflow events can occur in the absence of these indicators.
Customer complaintsFrom the backflow incident data collected (Exhibit 5.1), the primary indicator of backflow has
been customer complaints of odor, discoloration of the water, or direct physical harm from contact withthe water. Generally, it is unknown how long a backflow incident may have occurred before it isdetected through aesthetic or health concerns.
Drops in operating pressureContinual monitoring for reduced pressure can give immediate warning of a potential backflow
incident. It may also identify the area where a pressure drop may have originated, and thus help isolateareas affected by backflow. A drop in operating pressure can only indicate that a backflow event mayhave already occurred; it cannot stop an event in progress or prevent an incident, unless the root cause iscorrected.
Drops in Disinfectant ResidualA drop in the disinfectant residual of a distribution system can be an indicator of a backflow
event. Many factors influence the concentration of the disinfectant residual in the distribution system,including the assimilable organic carbon level, the type and concentration of disinfectant, watertemperature, and system hydraulics (Trussell, 1999). Entry of foreign material into the distributionsystem from backflow (or other events) may alter these factors and contribute to a loss of residual.
Cross-C onnec tion Con trol August 13, 2002
35
Water meters running in reverseDuring periods of reversed water flow, water meters can reverse their counters. When
investigating a water quality complaint at a restaurant in Kennewick, WA, a cross-connection specialistfound the meter at the site running backwards; the dual check valves for the carbon dioxide tanks wereimpaired, allowing the pressurized carbon dioxide to backflow into the water supply line (AWWAPNWS, 1995). Based on a survey of water systems, many have the ability to detect meters runningbackwards and have detected this occurrence on several occasions (Schwartz, 2002).
Total coliform detections and heterotrophic plate count changesA sudden spike in total coliform detections, or a sudden change in heterotrophic bacterial
densities (measured by heterotrophic plate count) is an indication that contaminants could have enteredthe distribution system (40 CFR 141). Persistent coliform contamination may indicate a long-standingcross-connection. Monitoring for coliform and other microbial indicators of contamination, as well asmore extensive monitoring, may help identify instances of backflow contamination.
10.0 Research Opportunities
This document identifies what we know regarding the potential health risks associated withcross-connections and backflow incidents in drinking water distribution systems based on availableliterature, research, and information. However, as with most areas, further opportunities exist forresearch to result in greater certainty of the health impacts associated with drinking water distributionsystems. Some specific research opportunities, among others, related to cross-connections and backfloware: further analysis of how surges contribute to occurrence of backflow; the degree of underreporting ofbackflow incidents across the country; what constitutes an effective cross-connection control andbackflow prevention program; and what the effectiveness of disinfectant residual is for protecting againstmicrobial contamination from backflow. It is not feasible to list all specific data needs for cross-connection control and backflow prevention, but two reports being prepared for EPA as part of itsComprehensive Drinking Water Research Strategy and the Microbial/Disinfection Byproducts (M/DBP)Research Council outline additional research opportunities.
11.0 Summary
Cross-connections and backflow represent a significant public health risk (US EPA, 2000b) byallowing chemical and biological contaminants into the potable water supply (a conclusion of theMicrobial/Disinfection Byproducts Federal Advisory Committee (M/DBP FACA)). Of the 459 backflowincidents from 1970-2001 on which EPA has information, an estimated 12,093 cases of illness resulted. Fifty-seven of these cross-connection-related waterborne disease outbreaks were reported to CDC from1981-1998, and resulted in at least 9,734 cases of illness. A wide number and range of chemical andbiological contaminants have been reported to enter the distribution system through cross-connectionsand backflow. Pesticides, sewage, antifreeze, coolants, and detergents were the most frequent types ofcontaminants reported. Although a wide range of contaminants have been reported, the number oncontamination incidents is considered a likely underestimate due to problems in detecting, reporting, anddocumenting incidents. These problems include: an inability to detect incidents without health effects;incidents with health effects that are unreported because affected individuals do not realize a connectionbetween their illness and the drinking water; no requirement on either health officials or water system

Cross-C onnec tion Con trol August 13, 2002
36
officials to report detected backflow incidents; and no central repository for reported illness. Whereundetected, cross-connections may also expose consumers to contaminants from backflow long-term. Cross-connections can be prevented through mechanical means and through programs administered bylocal or state officials to specifically locate and eliminate cross-connections and prevent backflow. Officials can also take measures to correct deficiencies that either have the potential to lead to backflowincidents or have already caused a backflow incident, and they can increase monitoring for indicators ofpotential problems to improve reaction time to future incidents.
REFERENCES
ABPA. American Backflow Prevention Association. 2000. 2000 Survey of State and Public WaterSystem Cross-Connection Control Programs.
ABPA. American Backflow Prevention Association, 1999. 1999 Survey of State and Public WaterSystem Cross-Connection Control Programs.
Adams, C.H. 1999. Memo to Pam Russell of US EPA Regarding Tucson, Arizona Cross-ConnectionControl Program. April 13, 1999.
ASDWA. Association of State Drinking Water Administrators. 1999. Survey of State Cross-ConnectionControl Programs. September 29, 1999.
AWWA. American Water Works Association. 2001. Water Quality and Treatment, 5th Edition.
AWWA. American Water Works Association. 1990. Recommended Practice for Backflow Preventionand Cross-Connection Control, AWWA Manual M14. Denver, CO.
AWWA PNWS. AWWA Pacific Northwest Section. 1995. Summary of Backflow Incidents, FourthEdition. December, 1995.
AWWA PNWS. AWWA Pacific Northwest Section. 1992. Summary of Backflow Incidents, ThirdEdition.
Benenson, A.S. 1995. Control of communicable diseases manual. 16th ed. APHA. Washington, DC.
Blish, L.R. 1999. Las Vegas Valley Water District Cross-Connection Control Program.
BMI. Backflow Management Incorporated. 1999. Safe Drinking Water For Everyone Through anActive Cross-Connection Control Program. Portland, OR.
BMI. Backflow Management Incorporated. 1996. Cross-Connection from A to Z: A ComprehensiveGuide to Cross-Connection Control Programs. Backflow Management Incorporated. Portland,OR.
Bureau of Labor Statistics. 2000. Employment Cost Index. http://www.bls.com.

Cross-C onnec tion Con trol August 13, 2002
37
California Health and Human Services Agency. 2001. Cross-Connection Control Memorandum toRecycled Water Task Force from Jeff Stone. Cross-Connection Incident Summaries. July 3,2001.
CCC WS. Cross-Connection Control Workshop. 1999. Meeting at American Water Works Service Co. HQ. Voorhees, New Jersey. September 1-2.
CDC. Centers for Disease Control. 2002a. CDC - Giardiasis Fact Sheet. http://www.cdc.gov/ncidod/dpd /parasites/giardiasis/factsht_giardia.htm. January 4, 2002.
CDC. Centers for Disease Control. 2002b. CDC - DBMD Campylobacter Infections. www.cdc.gov/ncidod/dbmd/diseaseinfo/campylobacter_g.htm. May 3, 2002.
CDC. Centers for Disease Control. 2002c. CDC - Harmful Algal Blooms. http://www.cdc.gov/nceh/hsb/algal.htm. May 3, 2002.
CDC. Centers for Disease Control. 1998. Morbidity and Mortality Weekly Report: CDC SurveillanceSummaries. Surveillance for Waterborne Disease Outbreaks - United States, 1995-1996. December 11, 1998, Vol 47, No. SS-5.
CDC. Centers for Disease Control. 1996. Morbidity and Mortality Weekly Report: CDC SurveillanceSummaries. Surveillance for Waterborne Disease Outbreaks - United States, 1993-1994. April12, 1996, Vol 45, No. SS-1.
CDC. Centers for Disease Control. 1987. Morbidity and Mortality Weekly Report. Volume 36, No. 36.
CDC. Centers for Disease Control. 1984. Water-related Disease Outbreaks; Surveillance: AnnualSummary 1983.
CDC. Centers for Disease Control. 1982. Water-related Disease Outbreaks; Surveillance: AnnualSummary 1980.
CDC DBMD. Centers for Disease Control, Division of Bacterial and Mycotic Diseases. 2001. DBMD -Salmonella enteritidis. http://www.cdc.gov/ncidod/dbmd/diseaseinfo/salment_g.htm. November 20, 2001.
Characklis, W.G. 1988. Bacterial Regrowth in Distribution Systems. AWWARF. Denver, CO.
Cleveland Plain Dealer. 2001. Medina Fair Water Ruled Safe to Drink. June 30, 2001. Cleveland, OH.
Costerton, J.W. and H.M. Lappin-Scott. 1992. Behavior of Bacteria in Biofilms. ASM News. 55:650-654.
Craun, G.F. and R.L. Calderon. 2001. Waterborne Disease Outbreaks Caused by Distribution SystemDeficiencies. J. AWWA. Vol 93, No.9. pp. 64-75.

Cross-C onnec tion Con trol August 13, 2002
38
Deb, A.K., Y.J. Hasit and F.M. Grablutz. 1995. Distribution System Performance Evaluation. AWWARF. Denver, Colorado.
Dreazen, Y.J. 2001. Officials Fear Terrorists Could Use 'Backflow' To Push Toxins IntoWater-Distribution Grids. Wall Street Journal, December 27th, 2001.
DWI0441. May, 1992. "Effects of Organic Chemicals in Contaminated Land on Buried Services,"FWR.
Fauver, P. 2002. Personal communication.
FDEP. Florida Department of Environmental Protection. 2001. Case Histories of Selected BackflowIncidents. http://www.mindspring.com/~loben/casehist.htm. November 20, 2001.
FDEP. Florida Department of Environmental Protection. 1996. The State of Florida’s Evaluation ofCross-Connection Control Rules and Regulations in the 50 States. August 1996 Revision.
Frost, F.J., G.F. Craun, and R.L. Calderon. 1996. Waterborne Disease Surveillance. Journal of theAmerican Water Works Association. Vol. 88, pp66-75.
GAC. American Backflow Prevention Association Government Affairs Committee. 1997. Summary ofState Requirements Regarding Cross-Connection Control and Backflow Prevention for PublicWater Systems.
Gatlinburg, Tennessee, City of. 2001. Gatlinburg’s Municipal Codes: Ch. 3; Sec. 18. Cross-Connections, Auxiliary Intakes, Etc3.http://www.ci.gatlinburg.tn.us/municipal/title18/18chap3.htm.
Geldreich, E.E. 1996. Microbial Quality of Water Supply in Distribution Systems. CRC Press, BocaRaton, FL.
Glaza, E.C. and J.K. Park. 1992. “Permeation of Organic Contaminants Through Gasketed PipeJoints,”J. AWWA. Vol. 84 No. 7, pp. 92-100.
Guy, T. 1997. Carbonator Operation - Operation of Post-Mix Beverage Equipment. The DirectConnection Newsletter. Vol 8. No.3.
Haas, C. 1999. Benefits of Using a Disinfectant Residual. J. AWWA.. Vol 90, No.1. pp. 65-67.
Hendrickson, H.D. 1999. Memo to Richard Moser of AWWSC Regarding the Boston, MassachusettsCross-Connection Control Program.
Hoxie, N.J., J.P. Davis, J.M. Vergeront, R.D. Nashold, and K.A. Blair. 1997. Cryptosporidiosis-Associated Mortality following a Massive Waterborne Outbreak in Milwaukee, Wisconsin. Amer. J. Publ. Health 87.12: 2032-2035.
Cross-C onnec tion Con trol August 13, 2002
39
IAPMO. International Association of Plumbing and Mechanical Officials. 2001. Plumbing CodeAdoption Map. http://www.iapmo.org/common/pdf/UPC_map.pdf
Kirmeyer, G.J., M. Friedman, K.D. Martel, P.F. Noran and D. Smith. 2001. Maintaining DistributionSystem Water Quality. J. AWWA. Vol 93, No.7 pp. 62-73.
Koenig, R. 2002. Personal communication.
LeChevallier, M., R.W. Gullick, and M. Karim. 2001. The Potential for Health Risks from Intrusion of Contaminants into the Distribution System from Pressure Transients. Presented at 16th AnnualASDWA Conference, Oct 25, 2001. http://www.asdwa.org/annconf01/website/presentations/Mark%20LeChavellier%20-%20Potential%20for%20Intrusion.ppt
LeChevallier, M.W. 1999. The Case for Maintaining a Disinfectant Residual. J. AWWA.. 91(1):86-94.
Manioci, M. 1984. Inter-Departmental Correspondence for the City of Rochester, NY. BackflowIncident–Midtown Plaza (Post Office).
MBPA. Michigan Backflow Prevention Association. 1997. Video: Mission: Educating the Public.
McNeil, L.S. and M. Edwards. 2001. Iron Pipe Corrosion in Distribution System. J. AWWA. Vol. 93. No. 7. Pp. 88-100.
NAPHCC. National Association of Plumbing, Heating and Cooling Contractors. 1999. Cross-Connection Control and Backflow Prevention: Summary of State Programs.
NAPHCC. National Association of Plumbing, Heating and Cooling Contractors Educational Foundation. 1996. Manual of Cross-Connection Control, 2nd Edition. Falls Church, VA.
Nashville Tennessean. 2000. Oak Ridge Site’s Water was Tainted for Decades. July 30, 2000. http://www.tennessean.com/sii/00/07/30/mynuke30.shtml
Nelson, A. 1999. Memo to William Tarpley Regarding the Kansas City, Missouri Cross-ConnectionControl Program. September 28, 1999.
Norris, K.C. and P. Ryker. 1987. Case History of a Municipal Drinking Water System. Proc. AWWAWQTC: Issues and Answers for Today’s Water Quality Professional. Denver, CO.
Oakeson, J. 1999. Memo to Patti Fauver of Utah Department of Environmental Quality Regarding theSandy City, Utah Cross-Connection Control Program. October 14, 1999.
Perz, J.F., F.K. Ennever and S.M. LeBlancq. 1998. Cryptosporidium in Tap Water. American Journal ofEpidemiology. Vol 147, No. 3. pp289-301.
Price, Utah. 1999. Cross-Connection Control Program.

Cross-C onnec tion Con trol August 13, 2002
40
Rusin, PA, J.B. Rose, C.N. Haas and C.P. Gerba. 1997. Risk Assessment of Opportunistic BacterialPathogens in Drinking Water. Rev. Environ. Contam. Toxicol. 152:57-83.
Schwartz, P. 2002. Personal Communication.
Shindala, A. and C.H. Chisolm. 1970. Water Quality Changes in the Distribution System. Water andWaste Eng. 62(1):35-37.
Snead, MC, V.P. Olivieri, K. Kawata and C.W. Kruse. 1980. The Effectiveness of Chlorine Residualsin: Inactivation of Bacteria and Viruses Introduced by Post-Treatment Contamination. Wat. Res. 14:403-408.
Stevens, R. 1999. Memo to Craig Adams of Tucson Water Regarding the Denver, Colorado Cross-Connection Control Program. September 24, 1999.
Trussell, RR. 1999. Safeguarding Distribution System Integrity. J. AWWA. 91(1):46-54.
Tucson Citizen. 1989. Tucson Water Quashes Rumor.
USC FCCCHR. Foundation for Cross-Connection Control and Hydraulic Research, University ofSouthern California. 1993. Manual of Cross-Connection Control, 9th ed.. Los Angeles, CA.
US EPA. US Environmental Protection Agency. 2002a. Chemical Health Effects Tables. http://www.epa.gov/safewater/tcrdsr.html. May 7, 2002.
US EPA. US Environmental Protection Agency. 2002b. Microbial Health Effects Tables. http://www.epa.gov/safewater/tcrdsr.html. May 7, 2002.
US EPA. US. Environmental Protection Agency. 2001. National Primary Drinking Water Regulations. Current Drinking Water Standards. http://www.epa.gov/safewater/mcl.html. November 20,2001.
US EPA. US Environmental Protection Agency. 2000a. Drinking Water Standards and HealthAdvisories. Office of Water. EPA 822-B-00-001. http://www.epa.gov/ost/drinking/standards/dwstandards.pdf
US EPA. US Environmental Protection Agency. 2000b. Stage 2 Microbial and Disinfection ByproductsFederal Advisory Committee Agreement in Principle. Federal Register: December 29, 2000. Vol.65, No. 251. Pp.83015-83024.
US EPA. US Environmental Protection Agency. 1999. Learner’s Guide: How to Conduct a SanitarySurvey of Small Water Systems.
US EPA. US Environmental Protection Agency. 1998. Addendum to Draft Drinking Water CriteriaDocument for Cryptosporidium. Office of Water. EPA 815-B-98-011. July 1998.
US EPA. US Environmental Protection Agency. 1995. Survey Report on the Cross-Connection ControlProgram. Office of Inspector General. EIHWG4-01-5400070. Washington, DC.
Cross-C onnec tion Con trol August 13, 2002
41
US EPA. US Environmental Protection Agency. 1992. Control of Biofilm Growth in Drinking WaterDistribution Systems. Office of Research and Development. Washington, DC.
US EPA. US Environmental Protection Agency. 1989. Cross-Connection Control Manual. Office ofWater. EPA 570/9-89-007. Washington, DC.
US FDA. US Food and Drug Administration. 2001a. FDA/CFSAN Bad Bug Book. FoodbornePathogenic Microorganisms and Natural Toxins Handbook - Shigella spp. http://vm.cfsan.fda.gov/~mow/chap19.html. November 20, 2001.
US FDA. US Food and Drug Administration. 2001b. FDA/CFSAN Bad Bug Book. FoodbornePathogenic Microorganisms and Natural Toxins Handbook - The Norwalk virus family. http://vm.cfsan.fda.gov/~mow/chap34.html. November 20, 2001.
US GAO. US Government Accounting Office. 1993. Drinking Water: Key Quality Assurance Programis Flawed and Underfunded. GAO/RCED-93-97. Washington, DC.
Van Loon, R. 1999. Survey Conducted of All 50 State DW Rules Relating to CCC and CertificationRequirements. University of Florida TREEEO 9th Annual CCC Conference. February, 1999.
Watts. Watts Backflow Prevention Products. 2002. Watts Regulator Price List (Effective January 14,2002). Andover, MA.
Watts. Watts Backflow Prevention Products. 1998. Stop Backflow News: Case Histories and Solutions. Andover, MA.
Watts. Watts Backflow Prevention Products. 1993. Stop Backflow News: Typical Cases for BackflowPrevention. Andover, MA.
Yoke, T.L. and T.S. Gittelman. 1986. Tastes and Odors in Distribution Systems. Proc. Water Qual. Concerns in Distribution System. Denver, CO.