potential data mining techniques for flow cyt data analysis li xiong
TRANSCRIPT

Potential Data Mining Techniques for Flow Cyt Data Analysis
Li Xiong

Data Mining Functionalities
Association analysis Classification and prediction Cluster analysis Evolution analysis

Flow Cyt Data
Sample over time points Flow cyt data at each time point
cell – marker intensity matrix

Data Preprocessing
Data cleaning Reduce noise and handle missing values
Data transformation Discretization: discretize marker values into
ranges (gates?) Normalization
Marker based Cell based Sample based

Potential Analysis Marker-based clustering
Cluster markers based on their expression patterns Cell-based clustering
Cluster cells based on their expression patterns Marker-based frequent itemsets analysis
Find frequent co-elevated marker groups Sample-based clustering
Cluster samples based on their flow-cyt data Sample-based classification
Classify patient based on their flow-cyt data and other clinical data into pre-defined classes
Sample-based time series analysis Analyze how the flow cyt data evolves

Marker-Based Clustering
Plot each marker as a point in N-dimensional space (N = #of cells)
Define a distance metric between every two marker points in the N-dimensional space Euclidean distance Pearson correlation
Markers with a small distance share the same expression characteristics -> functionally related or similar?
Clustering -> functionally related markers?

Cell Based Clustering
Plot each cell as a point in N-dimensional space (N=# of markers)
Define a distance metric between every two cell points in the N-dimensional space
Cells with a small distance share the same expression characteristics -> functionally related or similar?
Clustering -> functionally related cells? Help with gating? (N-dimensional vs. 2-dimensional)
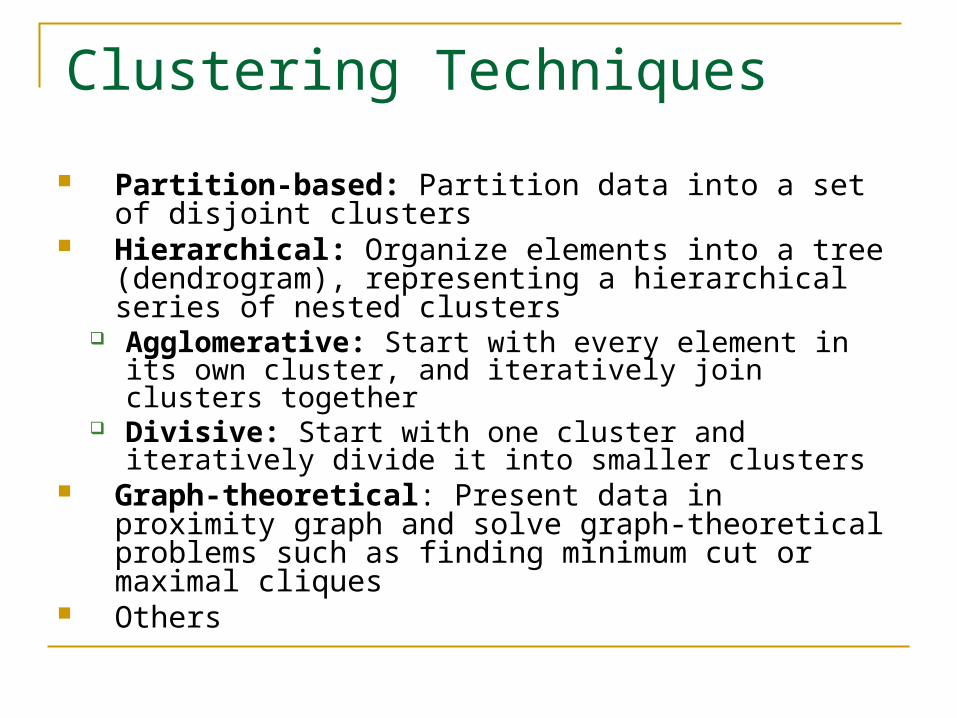
Clustering Techniques
Partition-based: Partition data into a set of disjoint clusters
Hierarchical: Organize elements into a tree (dendrogram), representing a hierarchical series of nested clusters
Agglomerative: Start with every element in its own cluster, and iteratively join clusters together
Divisive: Start with one cluster and iteratively divide it into smaller clusters
Graph-theoretical: Present data in proximity graph and solve graph-theoretical problems such as finding minimum cut or maximal cliques
Others

Partitioning Methods: K-Means Clustering
Input: A set, V, consisting of n points and a parameter k
Output: A set X consisting of k points (cluster centers) that minimizes the squared error distortion d(V,X) over all possible choices of X
• Given a data point v and a set of points X, define the distance from v to X, d(v, X), as the (Eucledian) distance from v to the closest point from X. Given a set of n data points V={v1…vn} and a set of k points X, define the Squared Error Distortion
d(V,X) = ∑d(vi, X)2 / n 1 < i < n

K-Means Clustering: Lloyd AlgorithmLloyd Algorithm1. Arbitrarily assign the k cluster centers2. while the cluster centers keep changing3. Assign each data point to the cluster Ci
corresponding to the closest cluster center (1 ≤ i ≤ k)
4. Update cluster centers according to the center of gravity of each cluster, that is, ∑v \ |C| for all v in C for every cluster C
*This may lead to merely a locally optimal clustering.

Some Discussion on k-means Clustering
May leads to a merely locally optimal clustering
Works well when the clusters are compact clouds that are rather well separated from one another.
Not suitable for clusters with nonconvex shapes or clusters of very different size.
Sensitive to noise and outlier data points Necessity for users to specify k

Hierarchical Clustering

Hierarchical Clustering Algorithm
Hierarchical Clustering (d , n) Form n clusters each with one element Construct a graph T by assigning one vertex to each cluster while there is more than one cluster Find the two closest clusters C1 and C2 Merge C1 and C2 into new cluster C with |C1| +|C2| elements Compute distance from C to all other clusters Add a new vertex C to T and connect to vertices C1 and C2 Remove rows and columns of d corresponding to C1 and C2 Add a row and column to d corrsponding to the new cluster
C return T
The algorithm takes a nxn distance matrix d of pairwise distances between points as an input.Different ways to define distances between clusters may lead to different clusters
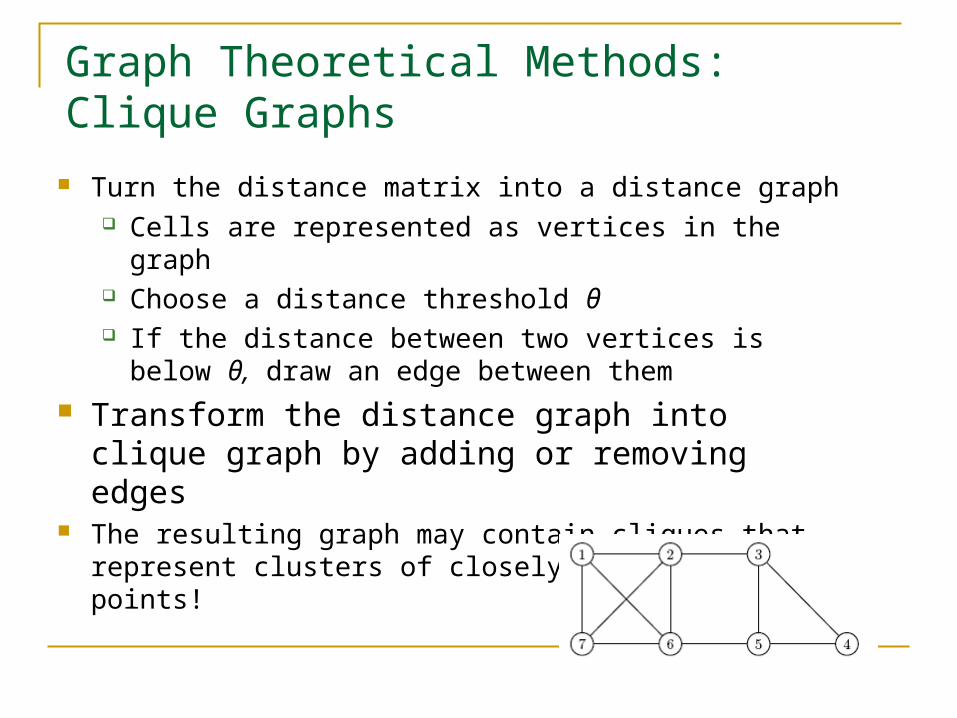
Graph Theoretical Methods: Clique Graphs
Turn the distance matrix into a distance graph Cells are represented as vertices in the graph Choose a distance threshold θ If the distance between two vertices is below θ, draw
an edge between them Transform the distance graph into clique graph
by adding or removing edges The resulting graph may contain cliques that represent
clusters of closely located data points!

Marker Association Analysis Convert intensity values to present or absent The cell-marker intensity matrix can be transformed
to cell – list of present markers data
Mine for frequent marker sets that are co-present in cells
Potential association analysis for different gates (vs. present or absent)
B, E, F4
B, C, D, E, F5
A, D, E3
A, C, D2
A, B, D1
Present MarkersCell-id

Frequent Pattern Mining Methods
Three major approaches Apriori (Agrawal & Srikant@VLDB’94) Freq. pattern growth (FPgrowth—Han, Pei & Yin
@SIGMOD’00) Vertical data format approach (Charm—Zaki & Hsiao
@SDM’02)

Sample Based Classification Predict target attributes for patients based on a set of features:
e.g. is the patient healthy? Will the patient reject the transplant?
…
yes 5
no 4
no 3
yes 2
yes 1
Class1…Feature 2
Feature 1
Patient

18
Classification: Model Construction
TrainingData
(w/ Label)
ClassificationAlgorithms
Classifier(Model)
NewData
(w/o Label)Labels

Feature Generation
Potential features Marker data Microarray data Clinical data

Marker Data Features
Cell distribution for each marker Histograms: % of cells for each range/gate
(corresponds to what users are currently plotting for pair-wise markers)
Min, max, average, variance of the intensity levels Distribution curves: % of cells for each intensity
value

Cell Distribution for Individual Marker (CD 62L)

Question
Is the cell distribution enough to represent the flow cyt data?
In other words, can we say two samples are similar or the same if they have the same cell distribution for each marker?

Cross-Marker Distribution
Pair-wise cell distribution? Can we use any results form the marker
based clustering, cell based clustering, and the marker based association analysis?
Others?

Feature Selection and Feature Extraction Problem: curse of dimensionality
Limited data samples Large set of features
Techniques: dimension reduction Feature selection Feature extraction

Feature Selection
Select a subset of features from feature space Theoretically - an optimal feature selection requires
exhaustive search of all possible subsets of features Practically - satisfactory set of features Approaches
Relevance analysis: remove redundant features based on correlation or mutual information (dependencies) among features
Greedy hill climbing: select an approximate “best” set of features using correlation and mutual information between features and class attributes

Feature Extraction
Map high dimensional feature space to low dimensional feature space
Approaches Principle Component Analysis: linear
transformation that maps projection of the data with greatest variance to the first coordinate (the first principal component), and so on.

Classification Methods
Decision tree induction
Bayesian classification
Neural network
Support Vector Machines (SVM)
Instance based methods

age?
overcast
IFM 1? IFM 2?
++ -- --++
<=30 >40
no noyes yes
yes
30..40
Decision Tree

Decision Tree - Comments
Relatively faster learning speed (than other classification methods)
Convertible to simple and easy to understand classification rules (e.g. if age<30 and IFM1 ++ then healthy)
Can use SQL queries for accessing databases Comparable classification accuracy with other
methods

Probabilistic Learning (Bayesian Classification)
Calculate explicit probabilities for hypothesis Characteristics
Incremental Standard Computationally intractable
Naïve Bayesian Classifier Conditional independency of attributes

Naïve Bayesian Classifier - Comments
Advantages Easy to implement Good results obtained in most of the cases
Disadvantages Assumption: conditional independence Practically, dependencies exist among variables
and cannot be modeled by Naïve Bayesian Classifier

32
Discriminative Analysis
Learning a function of its inputs to base its decision on
x
xx
x
xx
x
x
x
x ooo
oo
o
o
o
o o
oo
o

Neural Network
Output nodes
Input nodes
Hidden nodes
Output vector
Input vector: xi
wij

SVM
Support Vectors
Small Margin Large Margin
35
Discriminative Classifiers vs. Bayesian Classifiers
Advantages prediction accuracy is generally high robust, works when training examples contain errors fast evaluation of the learned target function
Criticism long training time difficult to understand the learned function (weights) not easy to incorporate domain knowledge

October 26, 2005 36
Instance-Based Methods
Instance-based learning: Store training examples and delay the processing (“lazy
evaluation”) until a new instance must be classified Typical approaches
k-nearest neighbor approach Instances represented as points in a Euclidean space.
Locally weighted regression Constructs local approximation
Case-based reasoning Uses symbolic representations and knowledge-based
inference

Popular Implementations General
Weka: an open source toolkit written in Java with
implementations of many basic algorithms of classification,
clustering, association analysis, can be accessed through GUI
interface or Java API
Specialized ones SVM-light: simple implementation of SVM in C
KDNuggets: a good directory of data mining software (commercial as well as open source) http://www.kdnuggets.com/software/index.html

Summary
Potential adaptation and evaluation of a set of data mining techniques for flow cyt data analysis
Domain knowledge is important for each of the steps