potomac river commuter ferry service study ... - … · september 15, 2009 potomac river commuter...
TRANSCRIPT
September 15, 2009
Potomac River
Commuter Ferry
Service Study &
Route Proving
Prince William County
Department of Transportation
Route Proving
Exercise
Submitted By:
Greenhorne & O’Mara, Inc.
Potomac Riverboat Company
Straughan Environmental Services, Inc.
FINAL REPORT
Potomac River Commuter Ferry Feasibility Study & RPE Results Table of Contents
Study Team and Acknowledgements Chapter 1 Executive Summary Section 1.1 Introduction Page 1 Section 1.2 RPE Methodology Pages 1-2 Section 1.3 RPE Observations & Results Pages 2-3 Section 1.4 Proposed Ferry Service Characteristics & Plan Pages 3-4 Section 1.5 Capital Costs Page 5 Section 1.6 Operational Costs Page 5 Section 1.7 Fare Determination Page 5 Section 1.8 Travel Demands and Final Analysis Page 6 Section 1.9 Conclusions & Recommendations Pages 6-7 Chapter 2 Introduction Section 2.1 Background Page 8 Section 2.2 Project Goal Pages 8-9 Section 2.3 Approach Pages 9-11 Section 2.4 Previous Reports & Current Operations Page 11 Chapter 3 Methodology Section 3.1 General Page 12 Section 3.2 Service Point Selection Pages 12-19 Section 3.3 Vessel Selection Pages 20-21 Section 3.4 Route Proving Exercise Planning Pages 21-22 Section 3.5 Wave/Wake Measurement Pages 22-24 Section 3.6 Noise Testing Pages 24-26 Chapter 4 RPE Observations and Results Section 4.1 RPE Observations Page 27 Section 4.2 Timing Measurement Results Pages 27-41 Section 4.3 Wave Measurement Results Page 42 Section 4.4 Noise Measurement Results Pages 43-48 Chapter 5 Service Plan Section 5.1 General Page 49 Section 5.2 Required Vessel Characteristics Page 49 Section 5.3 Anticipated Travel Times Pages 49-55 Section 5.4 Proposed Schedule/Headways Pages 56-63 Section 5.5 Potential Commuter Ferry Impacts Pages 64-65 Chapter 6 Capital Costs Section 6.1 General Page 66 Section 6.2 Service Point Capital Costs Pages 66-74 Section 6.3 Transportation Capital Costs Page 75 Section 6.4 Capital Cost Summary Page 75 Section 6.5 Sources of Funding Page 75 Chapter 7 Operational Costs Section 7.1 General Page 76 Section 7.2 Assumptions Page 76 Section 7.3 Operational Cost Estimates Pages 76-78 Chapter 8 Fare Determination Section 8.1 General Page 79 Section 8.2 Fare Box Recovery Analysis Page 79 Section 8.3 Fare Determination Pages 80-81
Potomac River Commuter Ferry Feasibility Study & RPE Results Table of Contents Chapter 9 Service Demands & Final Analysis Section 9.1 General Page 82 Section 9.2 Review of VDOT Trip Demand Analysis Pages 82-83 Section 9.3 Analysis of Existing Conditions Pages 84-85 Section 9.4 Adjustments to VDOT 2000 Ridership Prediction Pages 85-86 Section 9.5 Modal Shift Page 86 Section 9.6 Comparison to PRTC and VRE Service Page 87 Chapter 10 Conclusions and Recommendations Section 10.1 RPE Findings Pages 88-91 Section 10.2 Conclusions Pages 91-95 Section 10.3 Recommendations Pages 94-95 Appendices Appendix 1 Previous Potomac River Commuter Ferry Studies Appendix 2 RPE Schedule Appendix 3 Time Measurement Sheets and Trimble Data Sheet Appendix 4 Wave Measurement Plan & MacroWave Data Sheet Appendix 5 Noise Measurement Plan Appendix 6 Hourly Weather 5/2/09 to 5/11/09 Appendix 7 RPE Run Result Maps Appendix 8 Route Segment Maps Appendix 9 Route Breakdown by Segment Appendix 10 Wave Measurement Graphs Appendix 11 Noise Measurement Results Appendix 12 Potential Sources of Funding Appendix 13 VDOT 2000 Commuter Ferry Feasibility Report Trip Forecasting Procedure Appendix 14 HOT Lanes Presentation of Survey Results Appendix 15 Synopsis of Selected Existing Ferry Services
Potomac River Commuter Ferry Feasibility Study & RPE Results Project Team & Acknowledgements
Project Team Client Prince William County Department of Transportation Mr. Rick Canizales, Project Manager Consultants Greenhorne & O’Mara, Inc. Michael J. DeRosier Charles “Cody” Smith, PE Mark Kile, EIT Manju Krishnappa, EIT Potomac Riverboat Company Willem Polak Charlotte Hall Straughan Environmental Group, Inc. Tracy Seymour
Acknowledgements On behalf of Prince William County, the project team would like to thank those individuals who were able to join us on the Provincetown III for the route proving exercise held between May 4, 2009 and May 6, 2009. The project team would like to extend a special thanks to the following private companies, public agencies and individuals whose assistance and cooperation led to the successful execution of the route proving exercise and feasibility report preparation. Washington DC Harbor Police Office of Woodbridge District Supervisor, Frank Principi Supervisor Frank Principi Ms. Barbara Dechene Ms. Bertha Johnson Charles County, Maryland Mr. Jeff Nixon District of Columbia Department of Transportation Mr. Emile Smith Tri‐County Council of Southern Maryland Fort Belvoir Ms. Juanita Green MCB‐Quantico
Potomac River Commuter Ferry Feasibility Study & RPE Results Project Team & Acknowledgements
NSF‐Indian Head Mr. Gary Wagner City of Alexandria, VA Mr. Mark Jinks Potomac & Rappahannock Transit Commission Mr. Al Harf Northern Virginia Transportation Commission Bay State Cruises Mr. Mike Glasfeld Prince Georges County, Maryland Belmont Bay Harbor Mr. Jim Brooks Occoquan Harbour Marina Mr. Dick Lynn Hamptons Landing Mr. Tim Redmon Mr. Stuart Pumpelly A special thanks to the crew of the Provincetown III for allowing the project team access throughout the vessel and without whom the route proving exercise would not have been possible.
Potomac River Commuter Ferry Feasibility Study & RPE Results Chapter 1 Executive Summary
Page 1
1.1 Introduction
The Prince William County Department of Transportation conducted a route proving exercise (RPE) and feasibility study of a proposed commuter ferry service on the Potomac River between April 1, 2009 and July 31, 2009.
The primary goal of this project was to determine likely ferry service travel times between potential docking locations, assess potential environmental impacts resulting from a ferry service, prepare preliminary capital and operational costs of a ferry service and define the operational parameters necessary to provide optimal ferry service between points in Virginia, Maryland and Washington DC. Another project goal was to determine a preliminary estimate of ferry service travel demand and operational revenue as well as assess the need to further analyze travel demands through market studies and updated trip generation models.
The project team developed an approach to the project specifically designed to meet the stated goal. The project team prepared a methodology to procure a ferry vessel and execute the three days of runs and testing making up the RPE. The project team then recorded the observations and results of the RPE. Next, the project team analyzed the results of the RPE to develop ferry vessel characteristics and plausible service plans. Based on these service plans, the project team estimated the likely capital and operational costs associated with the ferry service. The project team then determined the fare and ridership numbers necessary to recover a specified percentage of the operational expense (termed the “fare box recovery”) selected after reviewing the cost recoveries of other modes of transit serving Prince William County and ferry services across the United States. Based primarily on fares, in‐vehicle travel times and out‐of‐vehicle travel times, the project team updated ridership estimates produced in a 2000 VDOT ferry feasibility report, employing the same ridership model. Finally, the project team drew conclusions regarding a potential ferry service on the Potomac River and provided recommendations for next steps.
Many previous commuter ferry feasibility studies conclude that ferry service on the Potomac River is feasible. However, no high‐speed ferry service has been implemented on the Potomac. A recent water‐taxi service between Alexandria, Virginia and National Harbor, Maryland has begun in the last year and is operating with no public subsidy.
1.2 RPE Methodology
In order to ensure that all necessary data was collected during the RPE, the project team developed a well‐defined methodology for conducting the RPE. Service points were selected based on project goals and on input from regional transportation officials from Virginia, Maryland and Washington D.C. A total of thirteen service points were tested during the RPE. Of the thirteen service points, five points were located in Prince William County, three points were located in Maryland, three points were located in other Virginia localities and two points were located in Washington D.C.
Potomac River Commuter Ferry Feasibility Study & RPE Results Chapter 1 Executive Summary
Page 2
The ferry vessel was selected to perform the RPE was the Provincetown III out of Boston, Massachusetts. The Provincetown III was selected because it had been on the Potomac River previously, it met the criteria for a potential ferry vessel on the Potomac River and it was available during the selected RPE dates.
The project team prepared a schedule of runs for the three days of the RPE that optimized the use of the vessel while on the Potomac. The schedule was developed to allow for unanticipated delays and allowed for inclusion of passengers during many of the runs.
The project team prepared a timing plan during the RPE that included the use of GPS monitoring to capture run times at five second intervals throughout the course of the RPE. Manual recording of times was also planned as a back‐up in the event of a GPS system failure.
The project team prepared a wave/wake testing plan that relied primarily on an underwater pressure sensor that was placed at two locations within the Potomac to measure the wave heights generated by the wake of the vessel at different speeds. The purpose of the wave testing was to determine likely impacts the wake from a passenger ferry vessel might have on marinas and sensitive shorelines along the Potomac River.
The project team prepared a noise testing plan that resulted in the use of two noise testing teams on the banks of the Potomac River. Noise tests were conducted at 10 locations along the Potomac River in Maryland, Virginia and Washington D.C. to gauge the likely impacts that noise from a ferry vessel might have on residences and recreational areas along the banks of the Potomac River.
1.3 RPE Observations and Results
The RPE was executed between Monday, May 4, 2009 and Wednesday May 6, 2009. On May 4, 2009, each of three planned runs was made. On May 5, 2009, each of the two planned runs was made. On May 6, 2009, two of the three planned runs were made. One run was cancelled due to excessive debris in the Potomac resulting from heavy rain over the previous two days. Multiple runs were made between most pairs of service points in order to average the run times and determine run time variability.
Timings for all runs were recorded using a GPS system. To summarize run times, trips were broken into twenty‐nine segments. The segments could then be assembled in different combinations to determine travel times from any service point to any service point.
The vessel had an average cruising speed of between 32 and 34 mph. Slower than anticipated times were recorded for two primary reasons:
Potomac River Commuter Ferry Feasibility Study & RPE Results Chapter 1 Executive Summary
Page 3
1) Relatively shallow water depths on the Occoquan River prevented the ferry vessel from operating at cruising speed. This had a large affect on travel times from Prince William Marina, Occoquan Harbour Marina and Belmont Bay Marina.
2) Wake restrictions on the Potomac River along the Alexandria, Virginia waterfront and on the Anacostia River and Washington Channel in Washington D.C. obligated the ferry vessel to slow to speeds of 5 to 10 mph. As will be discussed in more detail, the project team concluded that these restrictions must be waived in order for a ferry service to provide trip durations similar to those being offered by other modes of mass transit.
Wave measurements taken on the Potomac River indicate that at cruising speed, the ferry vessel generated a wake of approximately 7 inches. Based on review of base line wave data, a wave height of 7 inches is commonly generated by wind on the Potomac River. Noise measurements taken along the banks of the Potomac River indicate that at eight of the ten measurement locations, there was no appreciable increase in noise as a result of ferry vessel operations. Only two measurement locations, NSF Indian Head and Piscataway Park in Maryland had noise increases as a result of ferry operations.
1.4 Proposed Ferry Service Characteristics & Plan
Based on the data collected during the RPE, the project team developed proposed characteristics for a ferry vessel on the Potomac River. The ideal Potomac ferry vessel would be multi‐hulled, have a draft of no more than 3.5 feet, have an average cruising speed of 34 mph, be single deck and hold 99 people. In addition, the project team recommends that amenities such as Wi‐Fi, a snack bar and televisions be installed in the proposed ferry vessel.
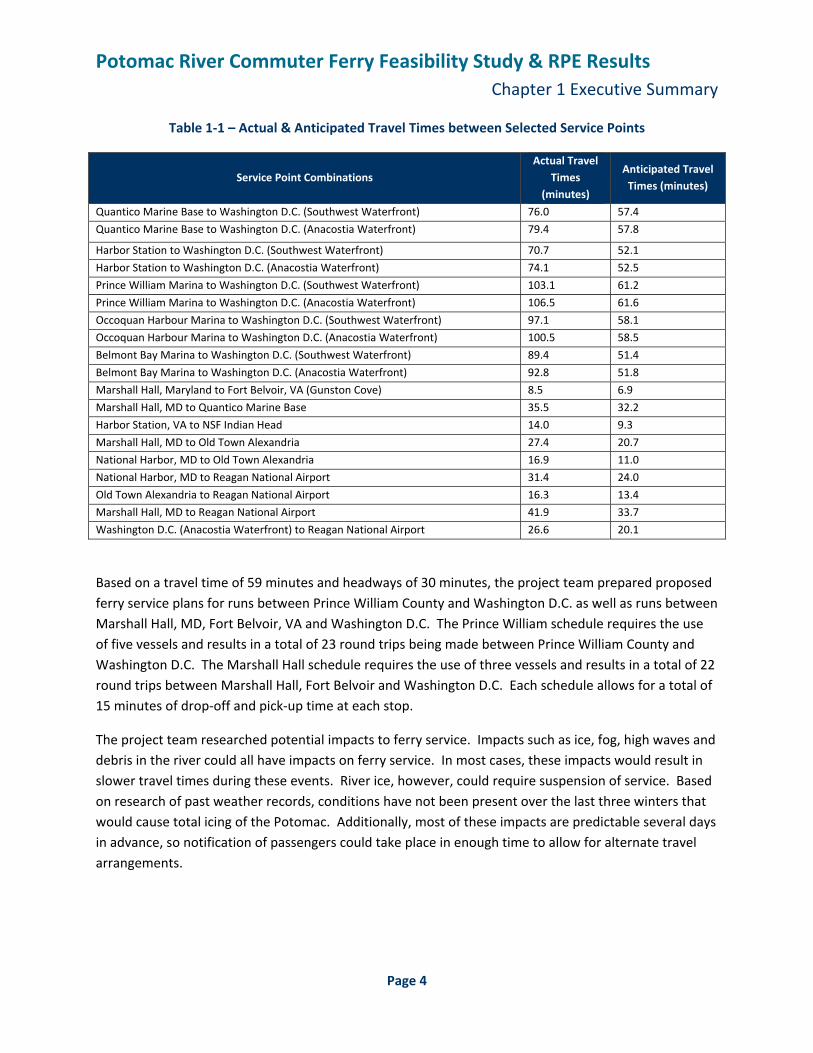
Both measured and anticipated travel times between selected service points are shown in Table 1.1. Anticipated travel times are based on the proposed vessel characteristics outlined above and the acquisition of a waiver of no‐wake zone restrictions on the Potomac River at Alexandria, Virginia and Washington D.C.
Potomac River Commuter Ferry Feasibility Study & RPE Results Chapter 1 Executive Summary
Page 4
Table 1‐1 – Actual & Anticipated Travel Times between Selected Service Points
Service Point Combinations Actual Travel
Times (minutes)
Anticipated Travel Times (minutes)
Quantico Marine Base to Washington D.C. (Southwest Waterfront) 76.0 57.4
Quantico Marine Base to Washington D.C. (Anacostia Waterfront) 79.4 57.8
Harbor Station to Washington D.C. (Southwest Waterfront) 70.7 52.1
Harbor Station to Washington D.C. (Anacostia Waterfront) 74.1 52.5
Prince William Marina to Washington D.C. (Southwest Waterfront) 103.1 61.2
Prince William Marina to Washington D.C. (Anacostia Waterfront) 106.5 61.6
Occoquan Harbour Marina to Washington D.C. (Southwest Waterfront) 97.1 58.1
Occoquan Harbour Marina to Washington D.C. (Anacostia Waterfront) 100.5 58.5
Belmont Bay Marina to Washington D.C. (Southwest Waterfront) 89.4 51.4
Belmont Bay Marina to Washington D.C. (Anacostia Waterfront) 92.8 51.8
Marshall Hall, Maryland to Fort Belvoir, VA (Gunston Cove) 8.5 6.9
Marshall Hall, MD to Quantico Marine Base 35.5 32.2
Harbor Station, VA to NSF Indian Head 14.0 9.3
Marshall Hall, MD to Old Town Alexandria 27.4 20.7
National Harbor, MD to Old Town Alexandria 16.9 11.0
National Harbor, MD to Reagan National Airport 31.4 24.0
Old Town Alexandria to Reagan National Airport 16.3 13.4
Marshall Hall, MD to Reagan National Airport 41.9 33.7
Washington D.C. (Anacostia Waterfront) to Reagan National Airport 26.6 20.1
Based on a travel time of 59 minutes and headways of 30 minutes, the project team prepared proposed ferry service plans for runs between Prince William County and Washington D.C. as well as runs between Marshall Hall, MD, Fort Belvoir, VA and Washington D.C. The Prince William schedule requires the use of five vessels and results in a total of 23 round trips being made between Prince William County and Washington D.C. The Marshall Hall schedule requires the use of three vessels and results in a total of 22 round trips between Marshall Hall, Fort Belvoir and Washington D.C. Each schedule allows for a total of 15 minutes of drop‐off and pick‐up time at each stop.
The project team researched potential impacts to ferry service. Impacts such as ice, fog, high waves and debris in the river could all have impacts on ferry service. In most cases, these impacts would result in slower travel times during these events. River ice, however, could require suspension of service. Based on research of past weather records, conditions have not been present over the last three winters that would cause total icing of the Potomac. Additionally, most of these impacts are predictable several days in advance, so notification of passengers could take place in enough time to allow for alternate travel arrangements.
Potomac River Commuter Ferry Feasibility Study & RPE Results Chapter 1 Executive Summary
Page 5
1.5 Capital Costs
Based on observations during the RPE, the project team estimated the likely capital costs associated with ferry service start‐up. Water‐side and land‐side infrastructure upgrade costs were estimated at each service point. Water‐side infrastructure included items such as docks and dredging. Land‐side infrastructure items included such items as parking lot expansion, pedestrian improvements and waiting shelters. Transportation costs were also estimated. Transportation costs included items such as vessel purchase and ticketing system. Based on the proposed ferry service plan from Occoquan Harbour Marina to Washington D.C. (Anacostia Waterfront), the current total estimated capital cost for ferry service start‐up is between 21.8 million and 29.8 million dollars. The current total estimated capital cost for ferry service between Marshall Hall, MD, Fort Belvoir, VA and Washington D.C. is between 15.7 million and 20.9 million dollars.
1.6 Operational Costs
The project team estimated the likely operational costs of ferry service based on the previously defined ferry service schedule. Assumptions used in the operational cost estimate include that a total of 6 boats would be utilized for the service with one boat being kept in reserve. Also, the project team assumed that operations would only be conducted on weekdays and that a typical vessel crew would consist of one captain and one deckhand. It should be noted that vessel manning requirements are carrying capacity‐dependent. Finally the project team estimated total fuel usage of 1,000,000 gallons per year. The total annual estimated operational cost (current dollars) for ferry service between Prince William County and Washington D.C. is 3.9 million dollars. The total annual estimated operation cost (current dollars) for ferry service between Marshall Hall, MD, Fort Belvoir, VA and Washington D.C. is 3.0 million dollars.
1.7 Fare Determination
The project team set a round trip fare for ferry service at $11.00 in order to closely mirror the fares currently being charged by VRE. Based on an individual fare of $11.00 the project team calculated that approximately 280,000 person‐trips per year would need to utilize the ferry service in order to meet the targeted fare box recovery of 40%. The project team chose 40% after reviewing the fare box recoveries of PRTC’s OmniRide commuter bus service, VRE and other ferry services around the country, opting for an assumed recovery that falls within that range.
Potomac River Commuter Ferry Feasibility Study & RPE Results Chapter 1 Executive Summary
Page 6
1.8 Travel Demands & Final Analysis
The project team reviewed the data contained in the 2000 commuter ferry feasibility study conducted by the Virginia Department of Transportation. The model utilized in the report yields travel demand estimates based primarily on three factors, in‐vehicle time, out‐of‐vehicle time and fare. The project team applied current existing conditions and the pertinent aspects of the proposed service plan to produce an updated estimate of the number of potential commuter ferry passengers based on the same model, which amounts to approximately 340,000 person‐trips per year. As noted in the opening section of this report, the purpose of this exercise was to determine if additional analysis of travel demands through market studies and a new travel model is warranted. Sole reliance on the travel demand results in this report is not advisable as the model used to predict the travel demand cannot account for some current conditions not in existence at the time of model development. Examples of current conditions that cannot be accounted for in the existing model include direct commuter bus service from Woodbridge to the Navy Yard Metro Station and the addition of HOT lanes on I‐95.
The project team also performed a cursory review of potential modal shift from other forms of mass transit to ferry service as well as the potential impacts of the HOT lanes
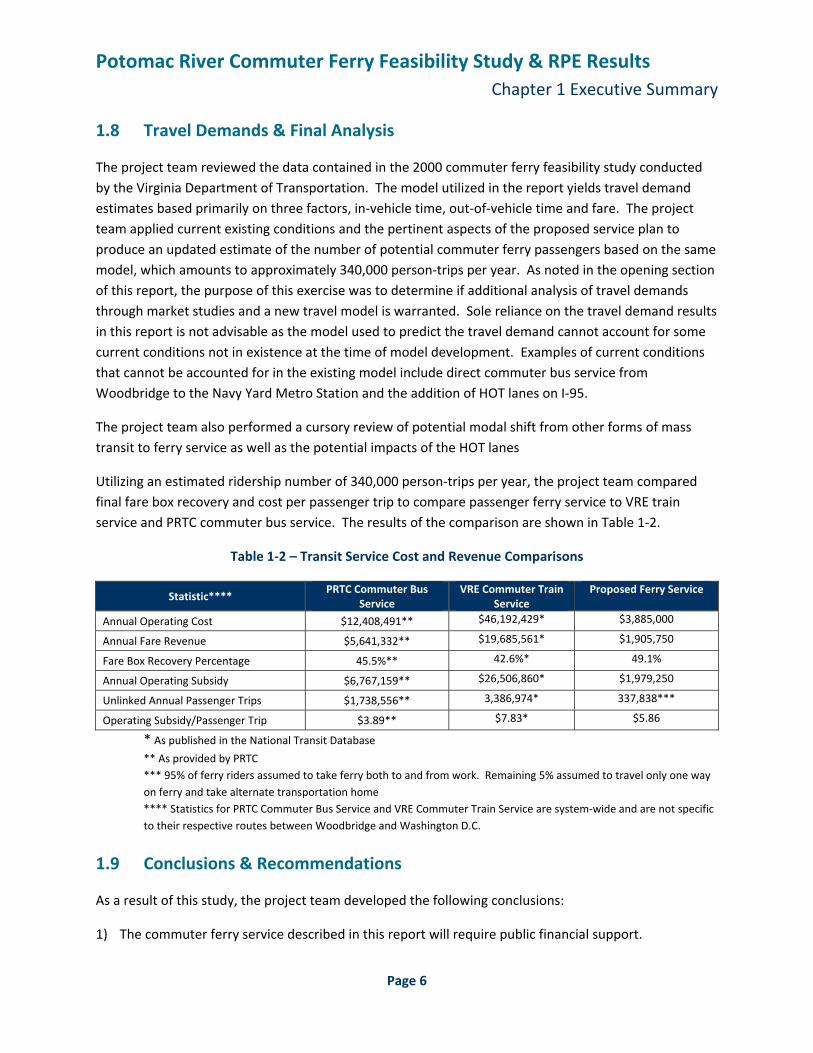
Utilizing an estimated ridership number of 340,000 person‐trips per year, the project team compared final fare box recovery and cost per passenger trip to compare passenger ferry service to VRE train service and PRTC commuter bus service. The results of the comparison are shown in Table 1‐2.
Table 1‐2 – Transit Service Cost and Revenue Comparisons
Statistic**** PRTC Commuter Bus
Service VRE Commuter Train
Service Proposed Ferry Service
Annual Operating Cost $12,408,491** $46,192,429* $3,885,000
Annual Fare Revenue $5,641,332** $19,685,561* $1,905,750
Fare Box Recovery Percentage 45.5%** 42.6%* 49.1%
Annual Operating Subsidy $6,767,159** $26,506,860* $1,979,250
Unlinked Annual Passenger Trips $1,738,556** 3,386,974* 337,838***
Operating Subsidy/Passenger Trip $3.89** $7.83* $5.86
* As published in the National Transit Database ** As provided by PRTC
*** 95% of ferry riders assumed to take ferry both to and from work. Remaining 5% assumed to travel only one way on ferry and take alternate transportation home **** Statistics for PRTC Commuter Bus Service and VRE Commuter Train Service are system‐wide and are not specific to their respective routes between Woodbridge and Washington D.C.
1.9 Conclusions & Recommendations
As a result of this study, the project team developed the following conclusions:
1) The commuter ferry service described in this report will require public financial support.
Potomac River Commuter Ferry Feasibility Study & RPE Results Chapter 1 Executive Summary
Page 7
2) Based on the data and analysis contained herein, a Potomac River ferry operation has the potential to offer a commuting option to the public that in terms of travel time and service between the area of Occoquan, Virginia and SE Washington DC would be competitive with those commuter services offered by PRTC and VRE. Public commuter ferry service between points in Maryland and Virginia appears to be especially promising given the significant amount of travel time saved as a result of ferry usage.
3) The estimated travel demand derived from the application of current‐day existing conditions to the demand model contained in the VDOT 2000 feasibility report suggests that additional analysis of travel demands through market studies and a new trip generation model is warranted. As noted in this report, sole reliance on the travel demand results in this report is not advisable as the model used to predict the travel demand cannot account for some current conditions not in existence at the time of model development.
4) No significant noise or wave impacts associated with ferry service are anticipated given the operating parameters specified herein.
Should this opportunity be pursued further, the project team makes the following recommendations:
• Coordination with the proper authorities to obtain speed restriction waivers along the Potomac River should be initiated.
• A more rigorous market analysis should be undertaken to analyze prospective demand by market in order to account for all the significant variables bearing on usage and estimated ridership diversions by mode.
• Continued coordination with local governments and military installations that front the Potomac River should be pursued. While commuter ferry service from Prince William County to Washington D.C. appears viable, there is great potential for a ferry operation to serve cross‐river commuters between Southern Maryland and Virginia
• Initial investigations into an authority to oversee ferry operations should also be discussed with those counties and cities that might have an interest in commuter ferry service.
Potomac River Commuter Ferry Feasibility Study & RPE Results Chapter 2 Introduction
Page 8
2.1 Background
It has long been recognized that the Potomac River holds potential as a commuter route from the suburbs of Virginia and Maryland to Washington D.C. Studies from as early as 1965 have been conducted in an effort to gauge the feasibility of providing commuter ferry service on the river. A majority of these studies have recognized the particular potential benefits a commuter ferry might hold for the segment of the Washington D.C. Metro population residing in Maryland along the Route 210 corridor and in Virginia along the Interstate 95/U.S. Route 1 corridor.
Most previous feasibility studies have utilized assumed travel times and other operational data in analyzing a potential commuter ferry service. For example, the most recent study published by the Virginia Department of Transportation in 2000 utilized two assumed travel times of 45 and 70 minutes in attempting to determine ferry service viability.
In the fall of 2007, a local private developer chartered the Provincetown III, a commuter ferry vessel operating out of Boston, Massachusetts to travel down to the Potomac River to conduct a one‐day demonstration of the potential for commuter ferry service along the Potomac River. Inspired by the potential the demonstration project showed, Prince William County officials prepared a grant funding application to the Virginia Department of Transportation’s Multi‐Modal Office to conduct a formal route proving exercise (RPE). In April, 2008, the Virginia Department of Transportation awarded Prince William County a $225,000 grant to perform the RPE and feasibility study.
2.2 Project Goal
The primary goal of this project was to determine likely ferry service travel times between potential docking locations, assess potential environmental impacts resulting from a ferry service, prepare preliminary capital and operational costs of a ferry service and define the operational parameters necessary to provide optimal ferry service between points in Virginia, Maryland and Washington DC. Another project goal was to determine a preliminary estimate of ferry service travel demand and operational revenue as well as assess the need to further analyze travel demands through market studies and updated trip generation models. To meet these goals, four tasks are to be undertaken.
1. RPE execution and data collection 2. RPE data analysis 3. Travel demand analysis of 2000 VDOT feasibility report 4. Comparison of RPE results to feasibility criteria in order to draw conclusions
RPE execution and data collection As part of this task, an existing commuter ferry vessel is to be procured for the purpose of conducting an RPE. The RPE will be comprised of three days of test runs by the ferry vessel from various points on the Potomac River. During the RPE, some of the data necessary to more accurately gauge the viability of the ferry service will be collected. Specific data to be obtained as part of the RPE includes:

Potomac River Commuter Ferry Feasibility Study & RPE Results Chapter 2 Introduction
Page 9
• Actual run times between points in Maryland, Virginia and Washington D.C.
• Impacts of vessel wake on marinas and sensitive shorelines along the Potomac River
• Impacts of vessel noise on residences and recreational areas along the shores of the river
• Impacts that characteristics of the Potomac and its tributaries have on vessel operations
• Existing landside and waterside infrastructure available to support ferry operations
• Impacts that weather and other factors might have on ferry operations RPE data analysis This task will be comprised of analyzing the data obtained from the RPE. The data is to be analyzed to determine the following information:
• Optimal ferry vessel characteristics for operations on the Potomac River
• Establishment of proposed ferry service plans
• Land‐side and water‐side infrastructure improvements necessary to allow for ferry operations
• Likely land‐side and water‐side infrastructure costs
• Likely operational costs
• Likely travel times between points in Maryland, Virginia and Washington D.C. Travel demand analysis of 2000 VDOT feasibility report As part of the 2000 VDOT feasibility report, eight operational scenarios were applied to a model to predict 2010 ridership on a ferry service. The purpose of this task is to select the scenario that most closely resembles actual current conditions and make any modifications necessary to predict current likely ferry ridership based on the existing model. Comparison of RPE results to feasibility criteria to draw conclusions This task includes comparing the results of the RPE and updated travel demands to other modes of mass transit as well as other ferry operations in the United States to determine overall feasibility. Based on the comparison, a set of conclusions and recommendations is to be derived.
2.3 Approach
In order to meet the project goals stated in Section 2.2, it was critical to approach this project in a systematic manner. The remaining chapters of this report are organized in much the same way as the project team’s approach. RPE Methodology Chapter 3 discusses the methodology utilized in preparing and executing the route proving exercise. The first step was to define the potential docking locations along the Potomac River that would provide optimal locations for the pick‐up of commuter passengers. These locations were picked based on input from regional transportation officials from local, state and federal government organizations having an interest in commuter ferry service. In addition, information from the Base Realignment and Closure
Potomac River Commuter Ferry Feasibility Study & RPE Results Chapter 2 Introduction
Page 10
Commission (BRAC) was analyzed along with planned developments along the Potomac River to determine the most feasible docking locations. The project team then searched for an appropriate vessel to conduct the RPE. In addition to the specifications discussed in the Methodology section of this report, the vessel had to be available to conduct the RPE in mid‐Spring and had to be sufficiently close to be able to travel to the Potomac River economically. With the docking locations and vessel selected, the project team endeavored to draw up a schedule and route plan for the three days of the RPE. The routes were laid out to maximize the number of times each run was conducted in an effort to be able to average the times of a given route to attain a higher level of precision and a greater probability that the times recorded were a true representation of a typical time that could be expected given the vessel capabilities and environmental factors. Once the RPE schedule was fixed, the project team worked to develop a testing plan for both vessel wake and noise. The testing plan for wake and noise measurements was developed in an effort to maximize the data that would be collected during the three days of the RPE. RPE Observations and Results Chapter 4 discusses the observations and results of the RPE. Timing measurements are organized into twenty‐nine (29) segments. Those segments can then be combined to result in timing measurements from any docking location to another. Because most of the segments were traveled multiple times, segment timings could be averaged to produce a more accurate assessment of travel times. In addition to timing measurements, wave and noise measurements and results were obtained during the RPE and discussed in this chapter. Ferry Service Plan Chapter 5 discusses the ferry service plans developed by the project team. Based on the data collected during the RPE, the project team determined vessel characteristics that would optimize ferry service on the Potomac. Using the proposed vessel, the project team then adjusted likely travel times for a permanent service and provided justification for those adjustments. Service plans were then developed to meet the goal of transporting commuters from between points in Virginia, Maryland and Washington D.C. using headways similar to those of PRTC and VRE. Included in the preparation of a ferry service plan was an analysis of potential service impacts such as ice on the Potomac during winter and debris in the river during periods of heavy rain. Capital and Operational Costs Chapters 6 and 7 discuss capital and operational costs. Based on the service plans, both capital and operational costs were estimated. Capital costs include the purchase of ferry vessels as well as waterside and landside infrastructure improvements. Operational costs include personnel costs as well as other reoccurring costs such as fuel and maintenance.
Potomac River Commuter Ferry Feasibility Study & RPE Results Chapter 2 Introduction
Page 11
Fare Determination Chapter 8 discusses fare determination. Once likely operational costs were determined, the project team analyzed the percentage of operational costs currently being funded by commuter fares in other modes of mass transit such as the Virginia Railway Express and the Potomac and Rappahannock Transit Commission commuter bus service. The percentage also known as the fare box recovery was applied to the proposed ferry service to determine the likely fare to be charged for the service. Travel Demand Chapter 9 discusses anticipated travel demand. In preparing the feasibility report, the project team first reviewed the data contained in the 2000 commuter ferry feasibility study conducted by the Virginia Department of Transportation. The project team then applied current existing conditions and the pertinent aspects of the proposed service plan to estimate the number of potential commuter ferry passengers. The project team also analyzed potential modal shift from other forms of mass transit to ferry service as well as the potential impacts of the HOT lanes.
2.4 Previous Reports and Current Operations The VDOT 2000 feasibility report included a summary of previous Potomac River ferry studies that have been conducted over the past 40 years. A significant number of those studies indicated that a ferry service was viable. Appendix 1 provides detail of each of the previous study. In addition, Potomac Riverboat Company, based in Alexandria, Virginia, began providing water taxi service between Alexandria and Georgetown (Washington Harbor) in 1996, utilizing one boat. Each leg was 45 minutes. Service was offered Tuesday‐Sundays and carried over 60,000 passengers per year, operating approximately 250 days. In 2002 the company added a second boat to this run, which increased ridership to over 100,000 passengers per year, with boats leaving each port every hour on the half hour starting at 11:30 am. Two boats were used primarily Thursday‐Sunday to meet peak load demands. The rate for that service today is $26.00 roundtrip for adults. In 2008, the company built two 122‐passenger water taxis to service the Gaylord National/National Harbor complex in Prince Georges County and connect with Alexandria, Virginia. That service provides service 7 days per week and is expected to carry over 125,000 passengers in 2009, its first full year of service. The departure times are every 35 minutes, with the actual trip being 15‐20 minutes between the two states. The rate is $16 round trip and $8 one‐way. Neither of these two services>Georgetown to Alexandria and Alexandria to National Harbor/Gaylord National are subsidized. They remain profitably. Potomac Riverboat Company currently operates 7 boats on the Potomac and Anacostia rivers and has been in business since 1974, operating since 1984 from Alexandria. It has docking rights in Georgetown, Alexandria, Nationals Stadium, Mount Vernon and is the exclusive water taxi operator for National Harbor and Gaylord National. The company is also negotiating contracts with National Airport for water taxi service to connect National Harbor under its contract with that complex.
Potomac River Commuter Ferry Feasibility Study & RPE Results
Chapter 3 Methodology
Page 12
3.1 General
In order to optimize the use of the ferry boat over the three days of the route proving exercise as well as obtain the required data needed to meet the goals of the study, several aspects of the study needed to be defined. Those aspects included the potential commuter ferry service point selection, vessel selection, route proving exercise planning, wave/wake measurement methodology and noise testing methodology. A discussion of the approach and methodology applied in determining each of these aspects is discussed in this section.
3.2 Service Point Selection
Potential service points generally fall into two categories, origin points and destination points. To be considered a viable origin point, a location was required to be reasonably accessible by populations likely to utilize a commuter ferry service without excessive landside infrastructure improvements. To be considered a viable destination point, a location was required to be in reasonable proximity to a commuter’s final destination point. A list of the potential service points utilized in planning the route proving exercise is included below.
• Prince William Marina, Woodbridge, Virginia Origin
• Occoquan Harbour Marina, Woodbridge, Virginia Origin
• Belmont Bay Marina, Woodbridge, Virginia Origin
• Quantico Marine Base, Quantico, Virginia Destination
• Harbor Station, Woodbridge, Virginia Origin
• Indian Head Naval Support Facility, Indian Head, Maryland Destination
• Fort Belvoir (Gunston Cove), Fairfax County, Virginia Destination
• Marshall Hall, Prince George’s County, Maryland Origin
• National Harbor, Prince George’s County, Maryland Origin/Destination
• Alexandria City Pier, Alexandria, Virginia Origin/Destination
• National Airport, Alexandria, Virginia Destination
• Washington Channel, Washington, D.C. Destination
• Nationals Stadium/Navy Yard, Washington, D.C. Destination A brief description of each docking location as well as photographs of each location can be found on the following pages.
Potomac River Commuter Ferry Feasibility Study & RPE Results
Chapter 3 Methodology
Page 13
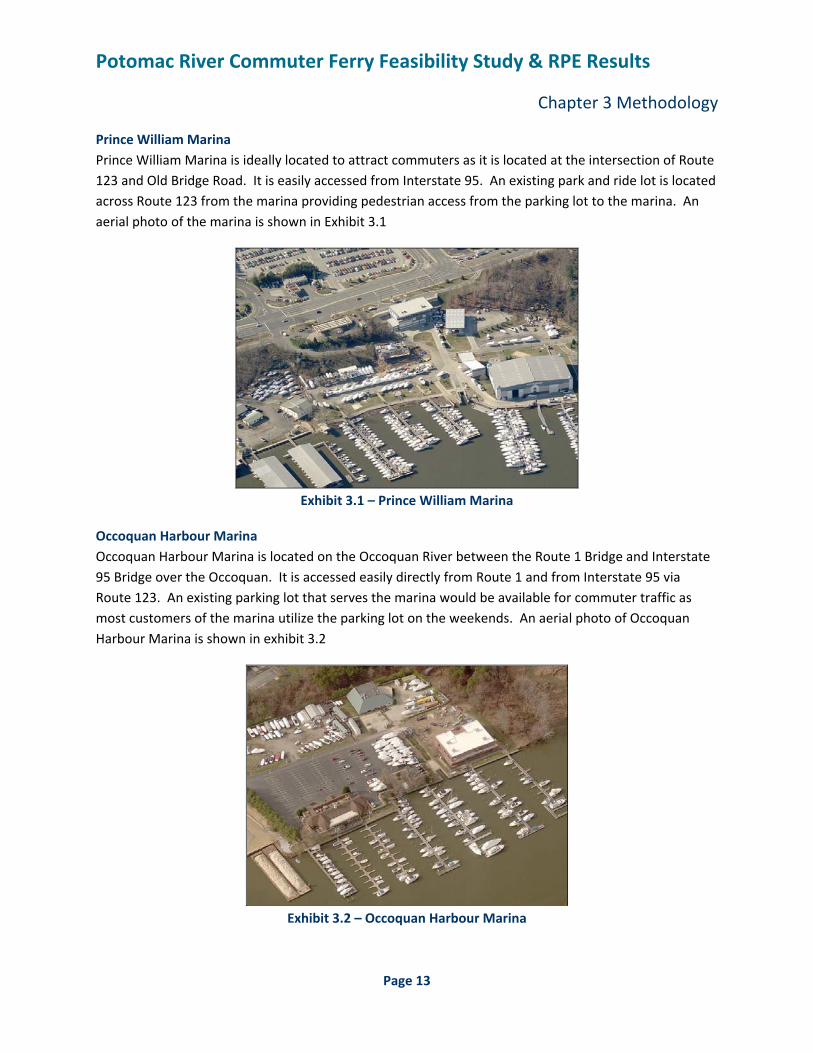
Prince William Marina Prince William Marina is ideally located to attract commuters as it is located at the intersection of Route 123 and Old Bridge Road. It is easily accessed from Interstate 95. An existing park and ride lot is located across Route 123 from the marina providing pedestrian access from the parking lot to the marina. An aerial photo of the marina is shown in Exhibit 3.1
Exhibit 3.1 – Prince William Marina
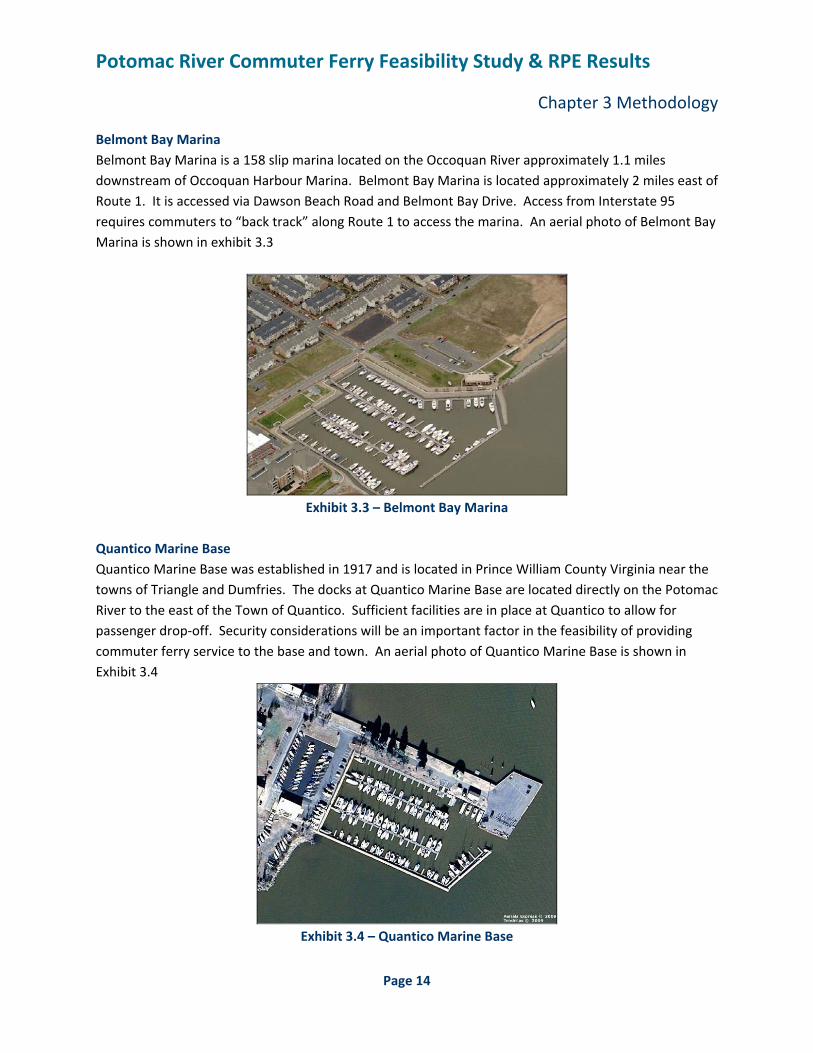
Occoquan Harbour Marina Occoquan Harbour Marina is located on the Occoquan River between the Route 1 Bridge and Interstate 95 Bridge over the Occoquan. It is accessed easily directly from Route 1 and from Interstate 95 via Route 123. An existing parking lot that serves the marina would be available for commuter traffic as most customers of the marina utilize the parking lot on the weekends. An aerial photo of Occoquan Harbour Marina is shown in exhibit 3.2
Exhibit 3.2 – Occoquan Harbour Marina
Potomac River Commuter Ferry Feasibility Study & RPE Results
Chapter 3 Methodology
Page 14
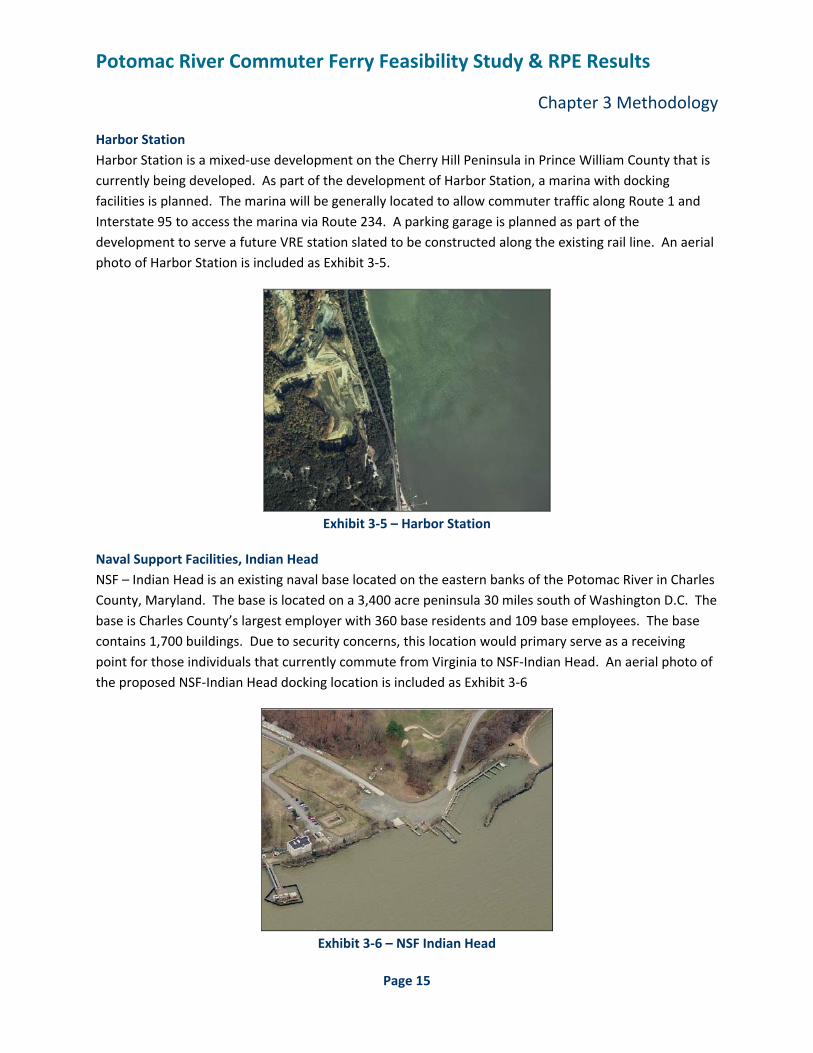
Belmont Bay Marina Belmont Bay Marina is a 158 slip marina located on the Occoquan River approximately 1.1 miles downstream of Occoquan Harbour Marina. Belmont Bay Marina is located approximately 2 miles east of Route 1. It is accessed via Dawson Beach Road and Belmont Bay Drive. Access from Interstate 95 requires commuters to “back track” along Route 1 to access the marina. An aerial photo of Belmont Bay Marina is shown in exhibit 3.3
Exhibit 3.3 – Belmont Bay Marina
Quantico Marine Base Quantico Marine Base was established in 1917 and is located in Prince William County Virginia near the towns of Triangle and Dumfries. The docks at Quantico Marine Base are located directly on the Potomac River to the east of the Town of Quantico. Sufficient facilities are in place at Quantico to allow for passenger drop‐off. Security considerations will be an important factor in the feasibility of providing commuter ferry service to the base and town. An aerial photo of Quantico Marine Base is shown in Exhibit 3.4
Exhibit 3.4 – Quantico Marine Base
Potomac River Commuter Ferry Feasibility Study & RPE Results
Chapter 3 Methodology
Page 15
Harbor Station Harbor Station is a mixed‐use development on the Cherry Hill Peninsula in Prince William County that is currently being developed. As part of the development of Harbor Station, a marina with docking facilities is planned. The marina will be generally located to allow commuter traffic along Route 1 and Interstate 95 to access the marina via Route 234. A parking garage is planned as part of the development to serve a future VRE station slated to be constructed along the existing rail line. An aerial photo of Harbor Station is included as Exhibit 3‐5.
Exhibit 3‐5 – Harbor Station
Naval Support Facilities, Indian Head NSF – Indian Head is an existing naval base located on the eastern banks of the Potomac River in Charles County, Maryland. The base is located on a 3,400 acre peninsula 30 miles south of Washington D.C. The base is Charles County’s largest employer with 360 base residents and 109 base employees. The base contains 1,700 buildings. Due to security concerns, this location would primary serve as a receiving point for those individuals that currently commute from Virginia to NSF‐Indian Head. An aerial photo of the proposed NSF‐Indian Head docking location is included as Exhibit 3‐6
Exhibit 3‐6 – NSF Indian Head
Potomac River Commuter Ferry Feasibility Study & RPE Results
Chapter 3 Methodology
Page 16
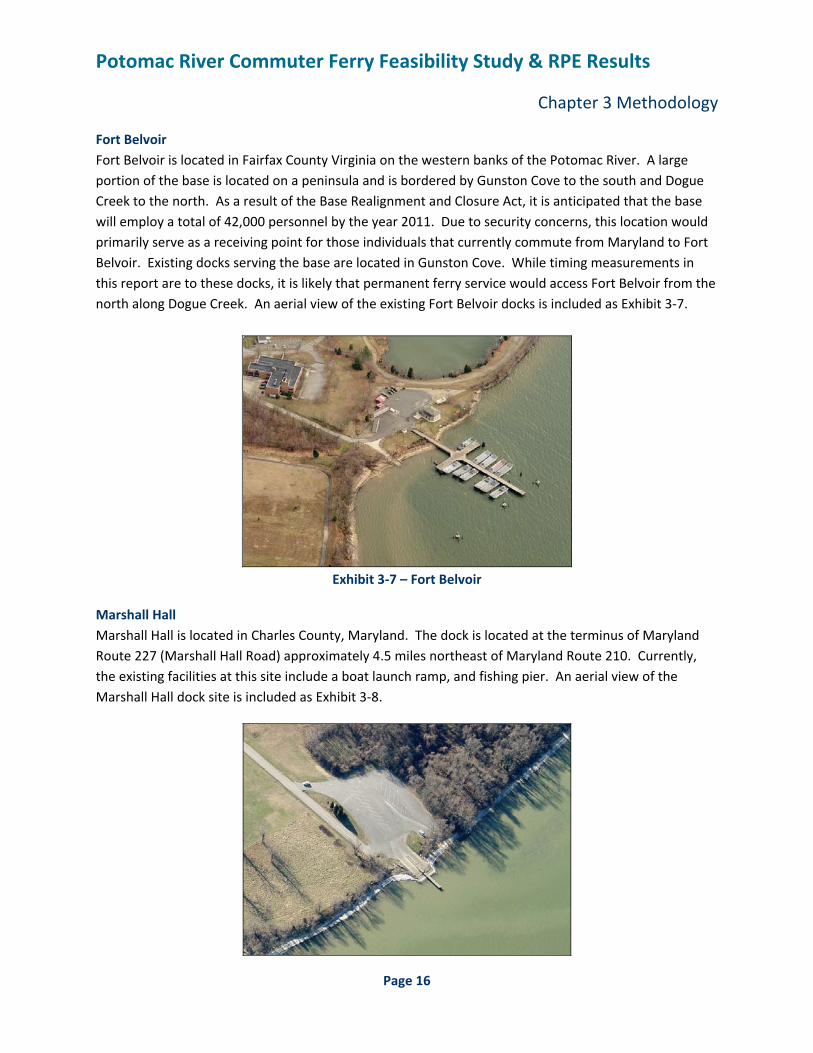
Fort Belvoir Fort Belvoir is located in Fairfax County Virginia on the western banks of the Potomac River. A large portion of the base is located on a peninsula and is bordered by Gunston Cove to the south and Dogue Creek to the north. As a result of the Base Realignment and Closure Act, it is anticipated that the base will employ a total of 42,000 personnel by the year 2011. Due to security concerns, this location would primarily serve as a receiving point for those individuals that currently commute from Maryland to Fort Belvoir. Existing docks serving the base are located in Gunston Cove. While timing measurements in this report are to these docks, it is likely that permanent ferry service would access Fort Belvoir from the north along Dogue Creek. An aerial view of the existing Fort Belvoir docks is included as Exhibit 3‐7.
Exhibit 3‐7 – Fort Belvoir
Marshall Hall Marshall Hall is located in Charles County, Maryland. The dock is located at the terminus of Maryland Route 227 (Marshall Hall Road) approximately 4.5 miles northeast of Maryland Route 210. Currently, the existing facilities at this site include a boat launch ramp, and fishing pier. An aerial view of the Marshall Hall dock site is included as Exhibit 3‐8.
Potomac River Commuter Ferry Feasibility Study & RPE Results
Chapter 3 Methodology
Page 17
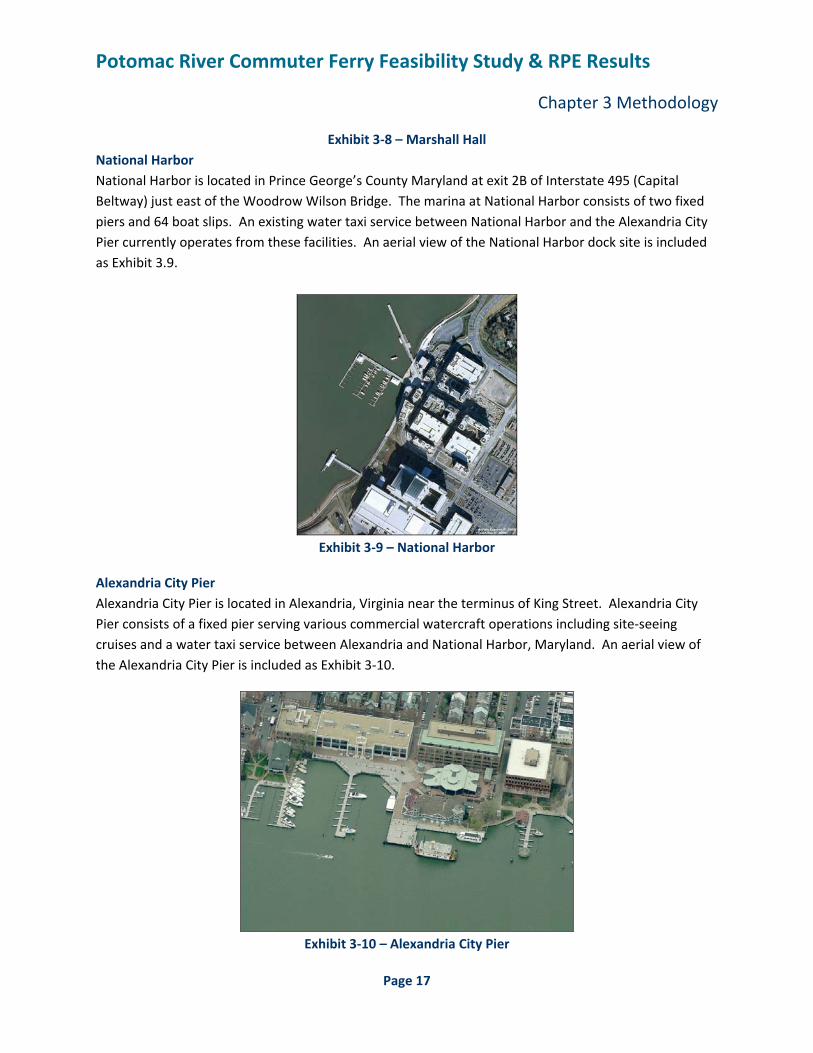
Exhibit 3‐8 – Marshall Hall National Harbor National Harbor is located in Prince George’s County Maryland at exit 2B of Interstate 495 (Capital Beltway) just east of the Woodrow Wilson Bridge. The marina at National Harbor consists of two fixed piers and 64 boat slips. An existing water taxi service between National Harbor and the Alexandria City Pier currently operates from these facilities. An aerial view of the National Harbor dock site is included as Exhibit 3.9.
Exhibit 3‐9 – National Harbor
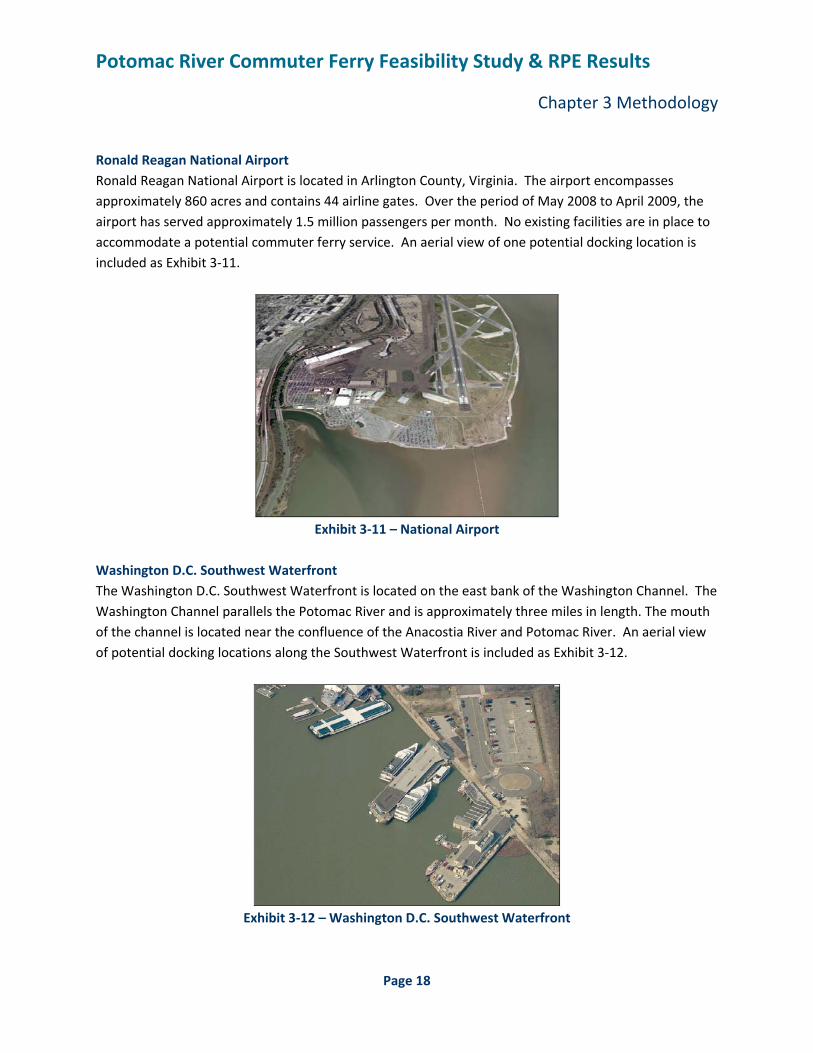
Alexandria City Pier Alexandria City Pier is located in Alexandria, Virginia near the terminus of King Street. Alexandria City Pier consists of a fixed pier serving various commercial watercraft operations including site‐seeing cruises and a water taxi service between Alexandria and National Harbor, Maryland. An aerial view of the Alexandria City Pier is included as Exhibit 3‐10.
Exhibit 3‐10 – Alexandria City Pier
Potomac River Commuter Ferry Feasibility Study & RPE Results
Chapter 3 Methodology
Page 18
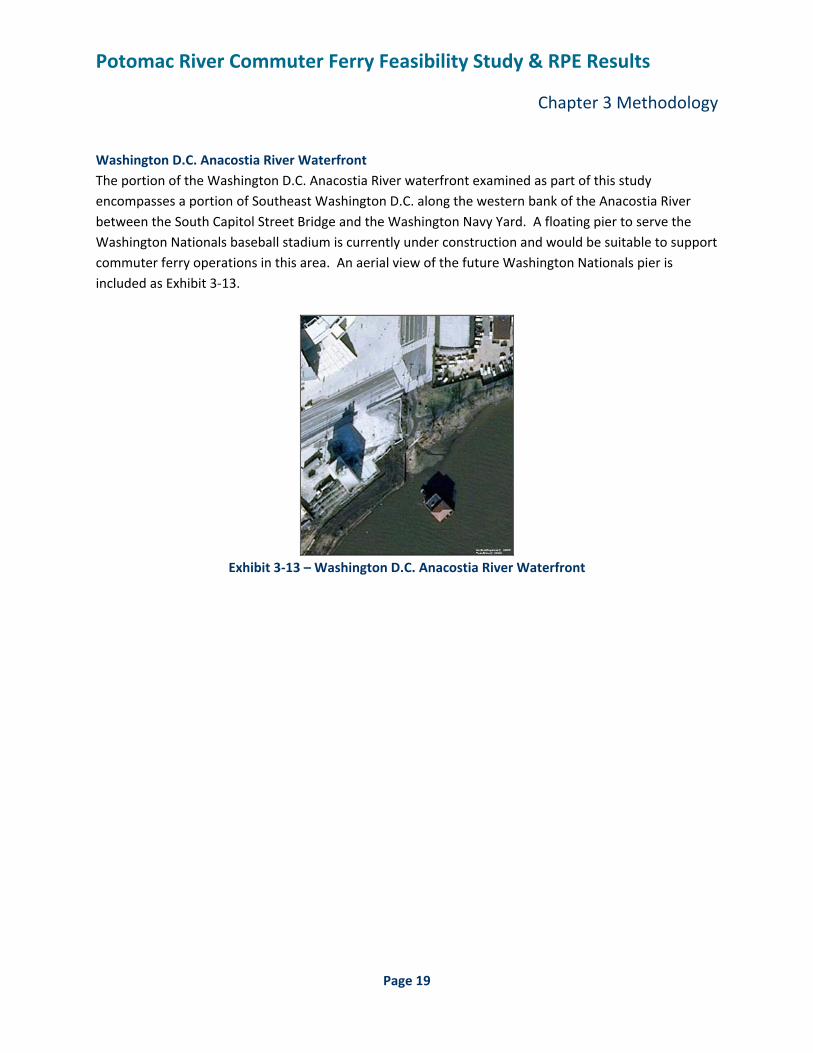
Ronald Reagan National Airport Ronald Reagan National Airport is located in Arlington County, Virginia. The airport encompasses approximately 860 acres and contains 44 airline gates. Over the period of May 2008 to April 2009, the airport has served approximately 1.5 million passengers per month. No existing facilities are in place to accommodate a potential commuter ferry service. An aerial view of one potential docking location is included as Exhibit 3‐11.
Exhibit 3‐11 – National Airport
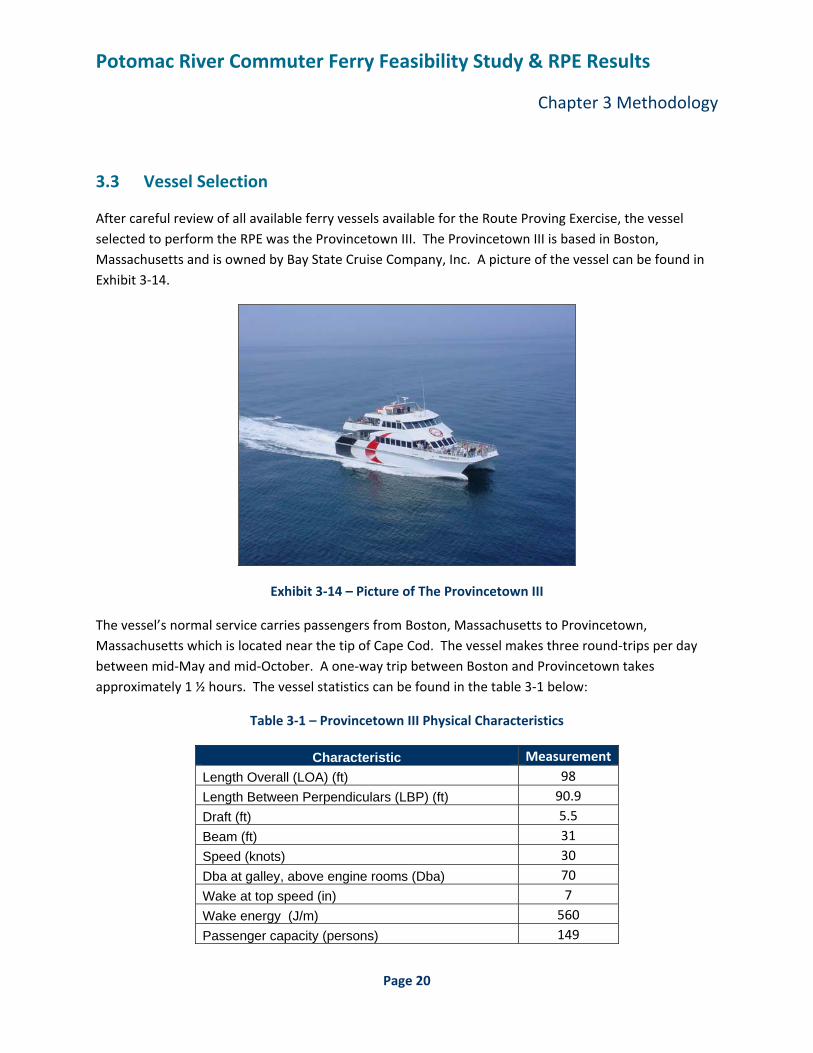
Washington D.C. Southwest Waterfront The Washington D.C. Southwest Waterfront is located on the east bank of the Washington Channel. The Washington Channel parallels the Potomac River and is approximately three miles in length. The mouth of the channel is located near the confluence of the Anacostia River and Potomac River. An aerial view of potential docking locations along the Southwest Waterfront is included as Exhibit 3‐12.
Exhibit 3‐12 – Washington D.C. Southwest Waterfront
Potomac River Commuter Ferry Feasibility Study & RPE Results
Chapter 3 Methodology
Page 19
Washington D.C. Anacostia River Waterfront The portion of the Washington D.C. Anacostia River waterfront examined as part of this study encompasses a portion of Southeast Washington D.C. along the western bank of the Anacostia River between the South Capitol Street Bridge and the Washington Navy Yard. A floating pier to serve the Washington Nationals baseball stadium is currently under construction and would be suitable to support commuter ferry operations in this area. An aerial view of the future Washington Nationals pier is included as Exhibit 3‐13.
Exhibit 3‐13 – Washington D.C. Anacostia River Waterfront
Potomac River Commuter Ferry Feasibility Study & RPE Results
Chapter 3 Methodology
Page 20
3.3 Vessel Selection
After careful review of all available ferry vessels available for the Route Proving Exercise, the vessel selected to perform the RPE was the Provincetown III. The Provincetown III is based in Boston, Massachusetts and is owned by Bay State Cruise Company, Inc. A picture of the vessel can be found in Exhibit 3‐14.
Exhibit 3‐14 – Picture of The Provincetown III
The vessel’s normal service carries passengers from Boston, Massachusetts to Provincetown, Massachusetts which is located near the tip of Cape Cod. The vessel makes three round‐trips per day between mid‐May and mid‐October. A one‐way trip between Boston and Provincetown takes approximately 1 ½ hours. The vessel statistics can be found in the table 3‐1 below:
Table 3‐1 – Provincetown III Physical Characteristics
Characteristic Measurement Length Overall (LOA) (ft) 98 Length Between Perpendiculars (LBP) (ft) 90.9 Draft (ft) 5.5 Beam (ft) 31 Speed (knots) 30 Dba at galley, above engine rooms (Dba) 70 Wake at top speed (in) 7 Wake energy (J/m) 560 Passenger capacity (persons) 149
Potomac River Commuter Ferry Feasibility Study & RPE Results
Chapter 3 Methodology
Page 21
In addition to the requirement that the test vessel be an existing passenger vessel, the following criteria were used in the selection of the vessel:
• Minimum speed of 30 knots
• Low wake/wash characteristics
• Double‐hull, catamaran style hull
• Minimum capacity of 149 persons
In addition, the selection of the Provincetown III was ideal due to the fact that the vessel had previously been brought down in October of 2007 for an independent private demonstration project.
3.4 Route Proving Exercise Planning
The primary goal of the route proving exercise was to obtain accurate speed, distance and timing measurements from any combination of the service points discussed in Section 3.2. In order to obtain this data, two individual planning efforts, preparation of an RPE schedule and preparation of a timing plan, were necessary.
RPE Schedule Preparation
Using the selected potential commuter ferry service points identified in Section 3.2, the project team began preparations of the RPE schedule. The RPE schedule was prepared in order to meet certain goals the project team set out prior to commencing the scheduling. They were:
• Prepare a schedule that would provide the most comprehensive timing data. When possible, schedule the RPE so that any given run was traveled at least twice to allow for averaging of the run times and speeds.
• Prepare a schedule with built‐in lag time to account for unanticipated delays during the execution of the RPE.
• Prepare a schedule that allowed inclusion of passengers during the RPE. Passengers included members of the general public, Prince William County staff and elected officials as well as staff and elected officials from local governments across the region.
Based on the goals stated above, and in conjunction with Prince William County and regional transportation planning officials, the project team prepared a final schedule for the RPE. A copy of the final schedule is included in Appendix 2.
Potomac River Commuter Ferry Feasibility Study & RPE Results
Chapter 3 Methodology
Page 22
Timing Plan Preparation
The project team understood that obtaining accurate and detailed timing information during the RPE was one of the most critical aspects of this study. In preparing a timing plan, the project team determined that it was necessary to record time and speed characteristics of the run using two separate methods to ensure that the risk of data loss of data would be minimized. The project team determined that timing and speed data would be measured by using a GPS system as well as by visual observations.
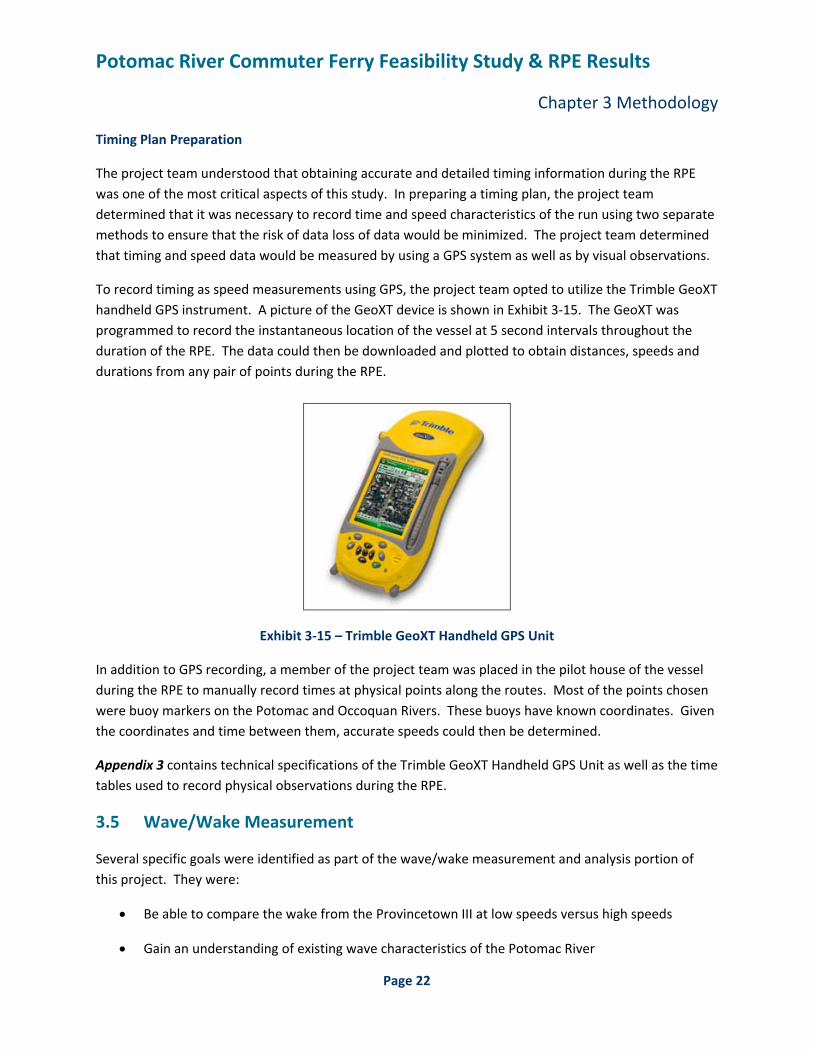
To record timing as speed measurements using GPS, the project team opted to utilize the Trimble GeoXT handheld GPS instrument. A picture of the GeoXT device is shown in Exhibit 3‐15. The GeoXT was programmed to record the instantaneous location of the vessel at 5 second intervals throughout the duration of the RPE. The data could then be downloaded and plotted to obtain distances, speeds and durations from any pair of points during the RPE.
Exhibit 3‐15 – Trimble GeoXT Handheld GPS Unit
In addition to GPS recording, a member of the project team was placed in the pilot house of the vessel during the RPE to manually record times at physical points along the routes. Most of the points chosen were buoy markers on the Potomac and Occoquan Rivers. These buoys have known coordinates. Given the coordinates and time between them, accurate speeds could then be determined.
Appendix 3 contains technical specifications of the Trimble GeoXT Handheld GPS Unit as well as the time tables used to record physical observations during the RPE.
3.5 Wave/Wake Measurement
Several specific goals were identified as part of the wave/wake measurement and analysis portion of this project. They were:
• Be able to compare the wake from the Provincetown III at low speeds versus high speeds
• Gain an understanding of existing wave characteristics of the Potomac River
Potomac River Commuter Ferry Feasibility Study & RPE Results
Chapter 3 Methodology
Page 23
• Determine the likely impacts of a ferry vessel wake on the surrounding marine community
To obtain qualitative data, visual observations of the vessel’s wake were conducted during the three days of route testing. The primary focus of this exercise was to gain a comparison of the vessel wake at low speeds versus high speeds.
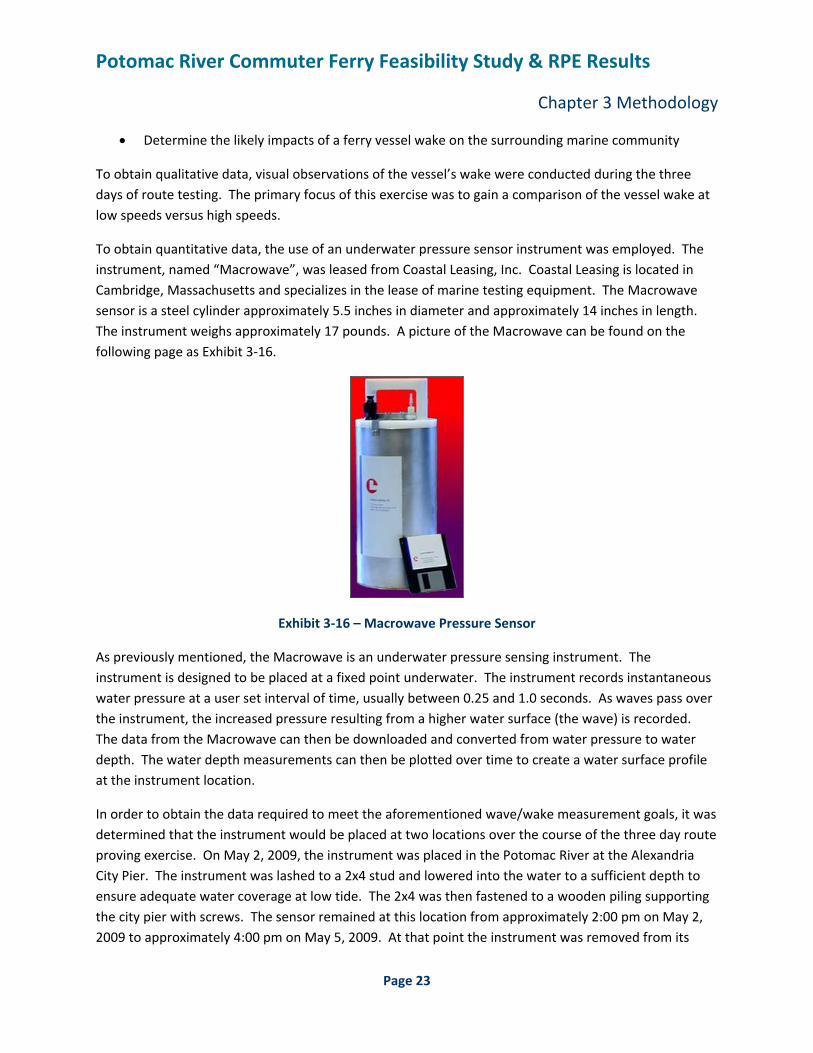
To obtain quantitative data, the use of an underwater pressure sensor instrument was employed. The instrument, named “Macrowave”, was leased from Coastal Leasing, Inc. Coastal Leasing is located in Cambridge, Massachusetts and specializes in the lease of marine testing equipment. The Macrowave sensor is a steel cylinder approximately 5.5 inches in diameter and approximately 14 inches in length. The instrument weighs approximately 17 pounds. A picture of the Macrowave can be found on the following page as Exhibit 3‐16.
Exhibit 3‐16 – Macrowave Pressure Sensor
As previously mentioned, the Macrowave is an underwater pressure sensing instrument. The instrument is designed to be placed at a fixed point underwater. The instrument records instantaneous water pressure at a user set interval of time, usually between 0.25 and 1.0 seconds. As waves pass over the instrument, the increased pressure resulting from a higher water surface (the wave) is recorded. The data from the Macrowave can then be downloaded and converted from water pressure to water depth. The water depth measurements can then be plotted over time to create a water surface profile at the instrument location.
In order to obtain the data required to meet the aforementioned wave/wake measurement goals, it was determined that the instrument would be placed at two locations over the course of the three day route proving exercise. On May 2, 2009, the instrument was placed in the Potomac River at the Alexandria City Pier. The instrument was lashed to a 2x4 stud and lowered into the water to a sufficient depth to ensure adequate water coverage at low tide. The 2x4 was then fastened to a wooden piling supporting the city pier with screws. The sensor remained at this location from approximately 2:00 pm on May 2, 2009 to approximately 4:00 pm on May 5, 2009. At that point the instrument was removed from its
Potomac River Commuter Ferry Feasibility Study & RPE Results
Chapter 3 Methodology
Page 24
location at the Alexandria City Pier and transported via boat approximately 3 miles south to Potomac River Channel Marker 88. Marker 88 is located near the eastern bank of the Potomac River approximately 1.5 miles south of the Woodrow Wilson Bridge. The 2x4 with instrument attached was then lashed to the side of the channel marker, again ensuring that a sufficient depth of water would cover the sensor at low tide. The sensor remained at this location and recorded data from approximately 5:00 pm on May 5, 2009 to the morning of May 11, 2009, when the instrument was pulled from the water and returned to download the collected data. Appendix 4 contains the wave sensor deployment plan, aerial views of the deployment locations and technical specifications for the MacroWave pressure sensor.
The selection of the two wave measurement locations was driven by the desire to record wave heights at a location where the ferry vessel would be traveling at minimal speeds due to a no wake zone, the Alexandria City Pier and at a location where the ferry vessel would be traveling at full cruising speed, Marker 88. The instrument was left in place at Marker 88 for an extended period of time to allow the opportunity to record several days of data to obtain base line data from which the ferry vessel wake impacts could be compared.
3.6 Noise Testing
An assessment of potential noise impacts associated with the proposed ferry operations was developed for the locations within the project study area shown in Appendix 5. Measurement locations were selected based upon the noise sensitivity of the existing land use to another noise source. The assessment included measuring ambient background sound levels and sound levels during ferry operations in the same location. Measurements of ambient background sound levels were compared to measurements during ferry operations to assess potential noise impact.
Sound and Noise Fundamentals
A discussion on Sound and Noise Fundamentals is included, because it helps define many of the terms and criteria utilized in this report.
Definitions
Sound – vibrations transmitted through the air or other medium that are detected by the ear
Noise – unwanted sound
Leq – equivalent sound level; the logarithmic average sound level computed over the sound measurement time period
Potomac River Commuter Ferry Feasibility Study & RPE Results
Chapter 3 Methodology
Page 25
General
The extent to which individuals are affected by noise sources is controlled by several factors, including:
• The duration and frequency of sound • The distance between the sound source and the receptor • The intervening natural or man‐made barriers or structures • The ambient environment
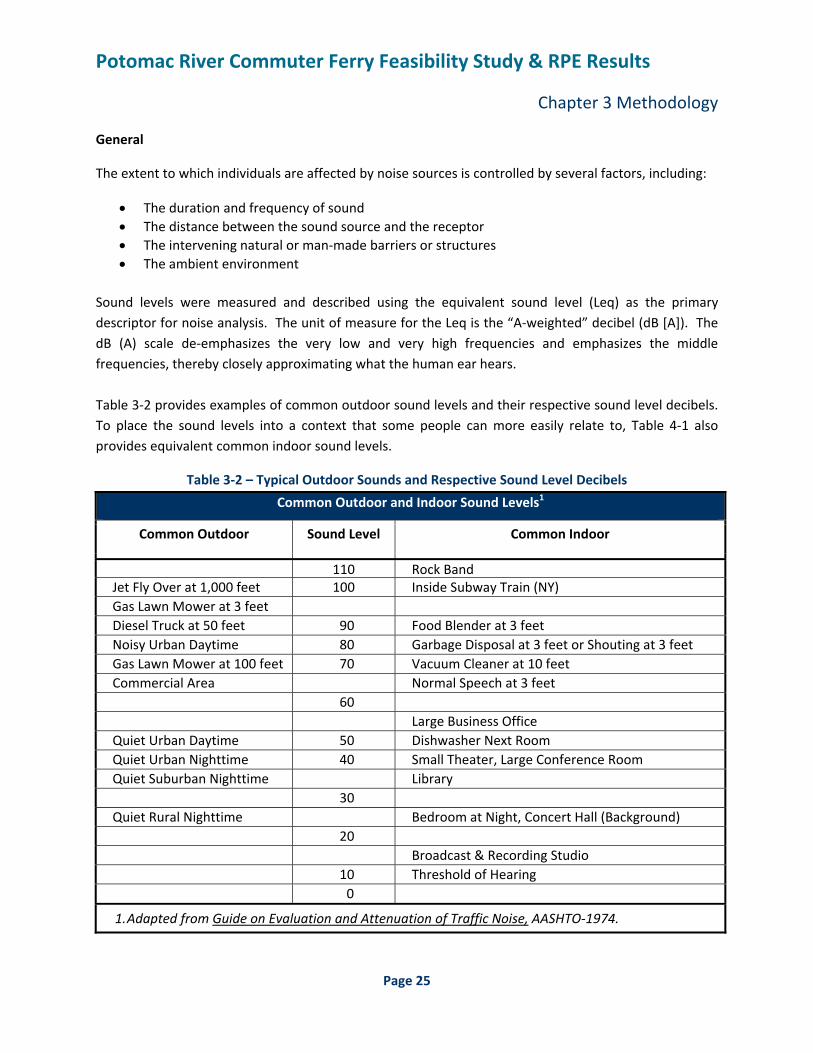
Sound levels were measured and described using the equivalent sound level (Leq) as the primary descriptor for noise analysis. The unit of measure for the Leq is the “A‐weighted” decibel (dB [A]). The dB (A) scale de‐emphasizes the very low and very high frequencies and emphasizes the middle frequencies, thereby closely approximating what the human ear hears. Table 3‐2 provides examples of common outdoor sound levels and their respective sound level decibels. To place the sound levels into a context that some people can more easily relate to, Table 4‐1 also provides equivalent common indoor sound levels.
Table 3‐2 – Typical Outdoor Sounds and Respective Sound Level Decibels
Common Outdoor and Indoor Sound Levels1
Common Outdoor Sound Level Common Indoor
110 Rock BandJet Fly Over at 1,000 feet 100 Inside Subway Train (NY) Gas Lawn Mower at 3 feet Diesel Truck at 50 feet 90 Food Blender at 3 feet Noisy Urban Daytime 80 Garbage Disposal at 3 feet or Shouting at 3 feet Gas Lawn Mower at 100 feet 70 Vacuum Cleaner at 10 feet Commercial Area Normal Speech at 3 feet 60 Large Business Office Quiet Urban Daytime 50 Dishwasher Next Room Quiet Urban Nighttime 40 Small Theater, Large Conference Room Quiet Suburban Nighttime Library 30 Quiet Rural Nighttime Bedroom at Night, Concert Hall (Background) 20 Broadcast & Recording Studio 10 Threshold of Hearing 0
1. Adapted from Guide on Evaluation and Attenuation of Traffic Noise, AASHTO‐1974.
Potomac River Commuter Ferry Feasibility Study & RPE Results
Chapter 3 Methodology
Page 26
Typically, sound level changes between 2 and 3 dB (A) are barely perceptible, while a change of 5 dB (A) is readily noticeable by most people. A 10‐dB (A) increase is usually perceived as a doubling of loudness, and conversely, sound is perceived to be reduced by one‐half when a sound level is reduced by 10 dB (A). Noise Sensitive Locations
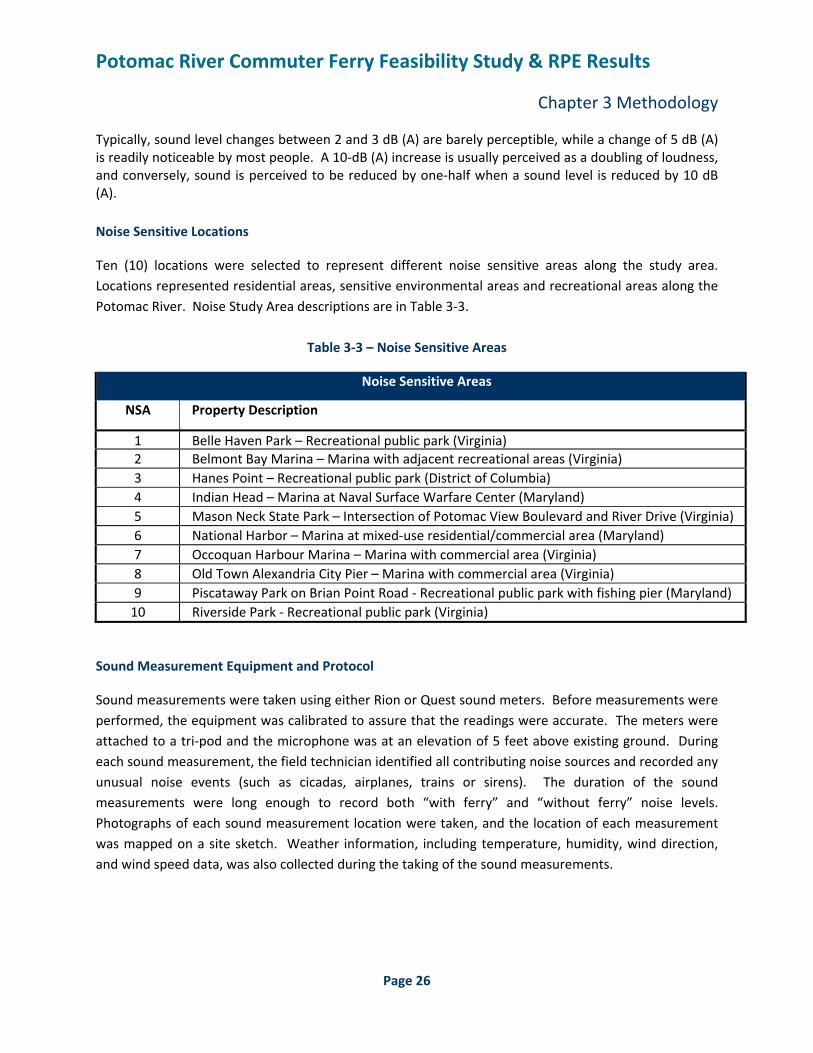
Ten (10) locations were selected to represent different noise sensitive areas along the study area. Locations represented residential areas, sensitive environmental areas and recreational areas along the Potomac River. Noise Study Area descriptions are in Table 3‐3.
Table 3‐3 – Noise Sensitive Areas
Noise Sensitive Areas
NSA Property Description
1 Belle Haven Park – Recreational public park (Virginia)2 Belmont Bay Marina – Marina with adjacent recreational areas (Virginia) 3 Hanes Point – Recreational public park (District of Columbia) 4 Indian Head – Marina at Naval Surface Warfare Center (Maryland) 5 Mason Neck State Park – Intersection of Potomac View Boulevard and River Drive (Virginia) 6 National Harbor – Marina at mixed‐use residential/commercial area (Maryland) 7 Occoquan Harbour Marina – Marina with commercial area (Virginia) 8 Old Town Alexandria City Pier – Marina with commercial area (Virginia) 9 Piscataway Park on Brian Point Road ‐ Recreational public park with fishing pier (Maryland) 10 Riverside Park ‐ Recreational public park (Virginia)
Sound Measurement Equipment and Protocol
Sound measurements were taken using either Rion or Quest sound meters. Before measurements were performed, the equipment was calibrated to assure that the readings were accurate. The meters were attached to a tri‐pod and the microphone was at an elevation of 5 feet above existing ground. During each sound measurement, the field technician identified all contributing noise sources and recorded any unusual noise events (such as cicadas, airplanes, trains or sirens). The duration of the sound measurements were long enough to record both “with ferry” and “without ferry” noise levels. Photographs of each sound measurement location were taken, and the location of each measurement was mapped on a site sketch. Weather information, including temperature, humidity, wind direction, and wind speed data, was also collected during the taking of the sound measurements.
Potomac River Commuter Ferry Feasibility Study & RPE Results
Chapter 4 RPE Observations & Results
Page 27
4.1 RPE Observations Between Monday, May 4, 2009 and Wednesday, May 6, 2009, the Provincetown III was utilized to conduct the route proving exercise for a potential commuter ferry service. Overall, the weather during the three days of the RPE was fair to poor with rain occurring all three days. Temperatures ranged from the mid‐50’s on Monday and Tuesday to the mid‐60’s on Wednesday. Visibility over the three days ranged from a low of 2.5 miles to a high of 10 miles. As a result of heavy rain experienced within the higher portions of the Potomac River on Monday and Tuesday, significant debris fields were observed on the Potomac River on Wednesday. These debris fields had an adverse affect on travel times on Wednesday and caused the cancellation of a Wednesday afternoon run. Full hourly weather records for the period of May 2, 2009 through May 11, 2009 are included in Appendix 6. With the exception of the debris fields encountered on Wednesday, weather conditions did not play a significant role in travel times.
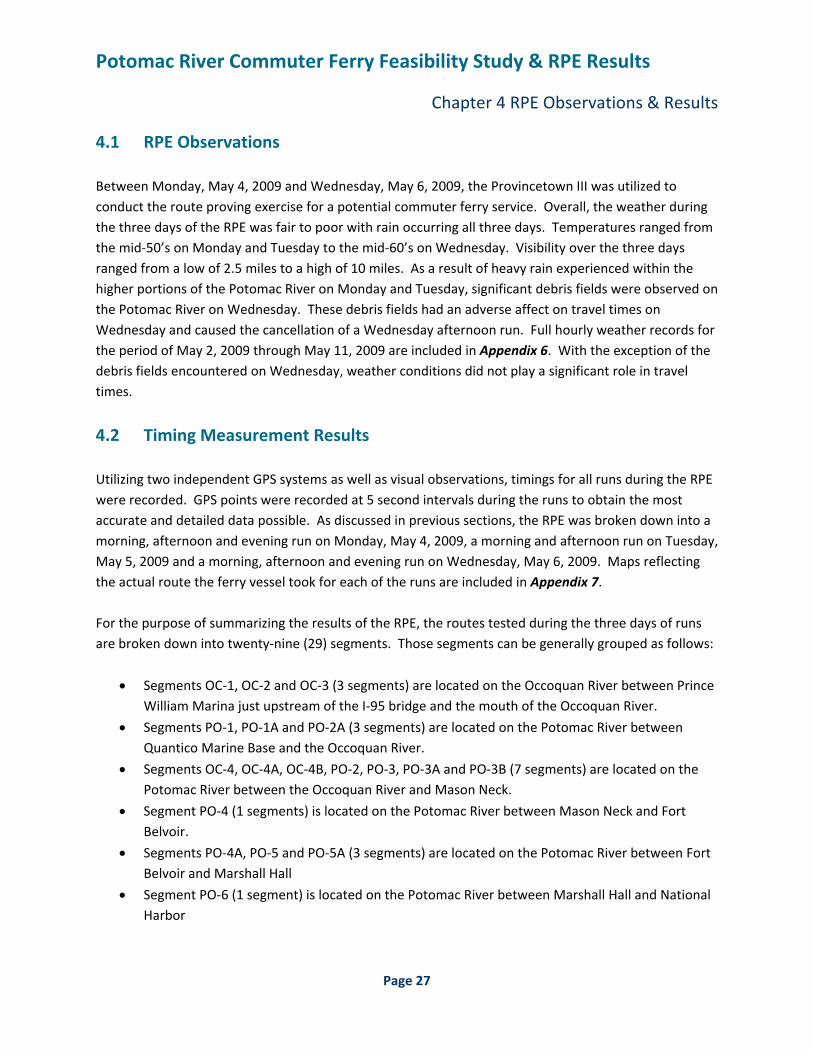
4.2 Timing Measurement Results Utilizing two independent GPS systems as well as visual observations, timings for all runs during the RPE were recorded. GPS points were recorded at 5 second intervals during the runs to obtain the most accurate and detailed data possible. As discussed in previous sections, the RPE was broken down into a morning, afternoon and evening run on Monday, May 4, 2009, a morning and afternoon run on Tuesday, May 5, 2009 and a morning, afternoon and evening run on Wednesday, May 6, 2009. Maps reflecting the actual route the ferry vessel took for each of the runs are included in Appendix 7. For the purpose of summarizing the results of the RPE, the routes tested during the three days of runs are broken down into twenty‐nine (29) segments. Those segments can be generally grouped as follows:
• Segments OC‐1, OC‐2 and OC‐3 (3 segments) are located on the Occoquan River between Prince William Marina just upstream of the I‐95 bridge and the mouth of the Occoquan River.
• Segments PO‐1, PO‐1A and PO‐2A (3 segments) are located on the Potomac River between Quantico Marine Base and the Occoquan River.
• Segments OC‐4, OC‐4A, OC‐4B, PO‐2, PO‐3, PO‐3A and PO‐3B (7 segments) are located on the Potomac River between the Occoquan River and Mason Neck.
• Segment PO‐4 (1 segments) is located on the Potomac River between Mason Neck and Fort Belvoir.
• Segments PO‐4A, PO‐5 and PO‐5A (3 segments) are located on the Potomac River between Fort Belvoir and Marshall Hall
• Segment PO‐6 (1 segment) is located on the Potomac River between Marshall Hall and National Harbor
Potomac River Commuter Ferry Feasibility Study & RPE Results
Chapter 4 RPE Observations & Results
Page 28
• Segments PO‐6A, PO‐7, PO‐8, PO‐9, PO‐9A and PO‐9B (6 segments) are located on the Potomac River between National Harbor and Old Town Alexandria
• Segments PO‐10 and PO‐10A (2 segments) are located on the Potomac River between the Old Town Alexandria and Hains Point in Washington D.C.
• Segments WC‐1, AC‐1 and AC‐1A (3 segments) are located on the Washington Channel and Anacostia River.
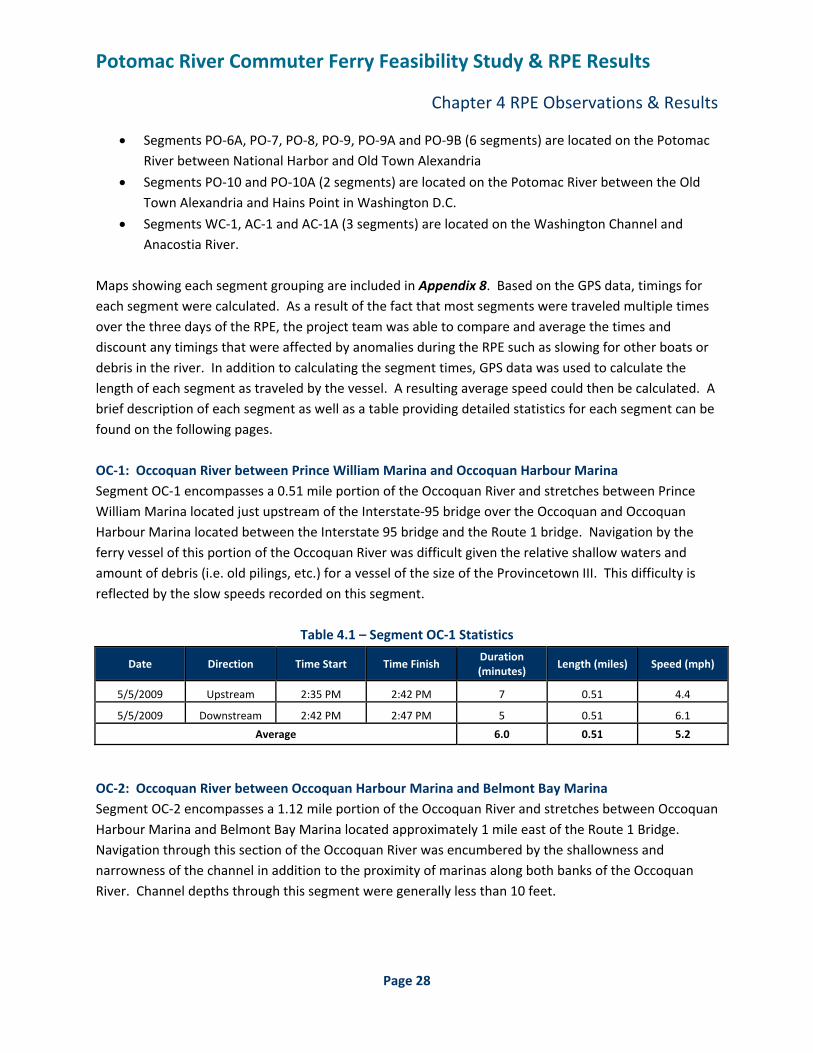
Maps showing each segment grouping are included in Appendix 8. Based on the GPS data, timings for each segment were calculated. As a result of the fact that most segments were traveled multiple times over the three days of the RPE, the project team was able to compare and average the times and discount any timings that were affected by anomalies during the RPE such as slowing for other boats or debris in the river. In addition to calculating the segment times, GPS data was used to calculate the length of each segment as traveled by the vessel. A resulting average speed could then be calculated. A brief description of each segment as well as a table providing detailed statistics for each segment can be found on the following pages. OC‐1: Occoquan River between Prince William Marina and Occoquan Harbour Marina Segment OC‐1 encompasses a 0.51 mile portion of the Occoquan River and stretches between Prince William Marina located just upstream of the Interstate‐95 bridge over the Occoquan and Occoquan Harbour Marina located between the Interstate 95 bridge and the Route 1 bridge. Navigation by the ferry vessel of this portion of the Occoquan River was difficult given the relative shallow waters and amount of debris (i.e. old pilings, etc.) for a vessel of the size of the Provincetown III. This difficulty is reflected by the slow speeds recorded on this segment.
Table 4.1 – Segment OC‐1 Statistics
Date Direction Time Start Time Finish Duration (minutes)
Length (miles) Speed (mph)
5/5/2009 Upstream 2:35 PM 2:42 PM 7 0.51 4.4
5/5/2009 Downstream 2:42 PM 2:47 PM 5 0.51 6.1
Average 6.0 0.51 5.2
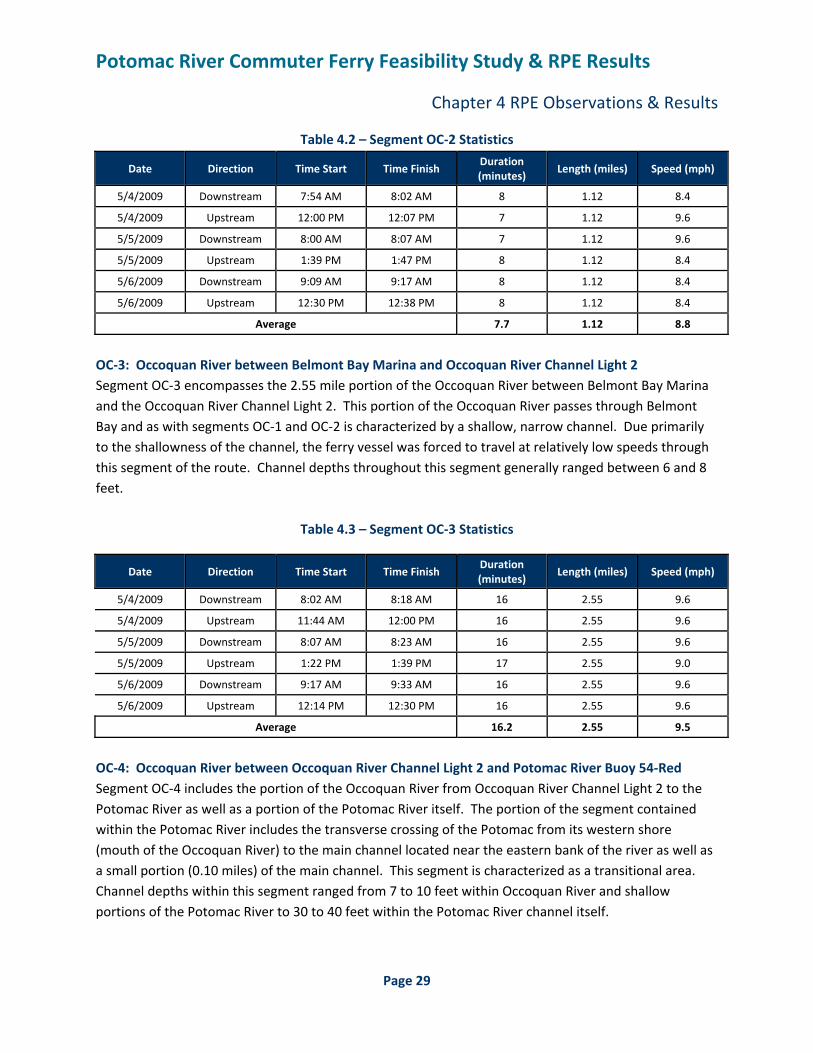
OC‐2: Occoquan River between Occoquan Harbour Marina and Belmont Bay Marina Segment OC‐2 encompasses a 1.12 mile portion of the Occoquan River and stretches between Occoquan Harbour Marina and Belmont Bay Marina located approximately 1 mile east of the Route 1 Bridge. Navigation through this section of the Occoquan River was encumbered by the shallowness and narrowness of the channel in addition to the proximity of marinas along both banks of the Occoquan River. Channel depths through this segment were generally less than 10 feet.
Potomac River Commuter Ferry Feasibility Study & RPE Results
Chapter 4 RPE Observations & Results
Page 29
Table 4.2 – Segment OC‐2 Statistics
Date Direction Time Start Time Finish Duration (minutes)
Length (miles) Speed (mph)
5/4/2009 Downstream 7:54 AM 8:02 AM 8 1.12 8.4
5/4/2009 Upstream 12:00 PM 12:07 PM 7 1.12 9.6
5/5/2009 Downstream 8:00 AM 8:07 AM 7 1.12 9.6
5/5/2009 Upstream 1:39 PM 1:47 PM 8 1.12 8.4
5/6/2009 Downstream 9:09 AM 9:17 AM 8 1.12 8.4
5/6/2009 Upstream 12:30 PM 12:38 PM 8 1.12 8.4
Average 7.7 1.12 8.8
OC‐3: Occoquan River between Belmont Bay Marina and Occoquan River Channel Light 2 Segment OC‐3 encompasses the 2.55 mile portion of the Occoquan River between Belmont Bay Marina and the Occoquan River Channel Light 2. This portion of the Occoquan River passes through Belmont Bay and as with segments OC‐1 and OC‐2 is characterized by a shallow, narrow channel. Due primarily to the shallowness of the channel, the ferry vessel was forced to travel at relatively low speeds through this segment of the route. Channel depths throughout this segment generally ranged between 6 and 8 feet.
Table 4.3 – Segment OC‐3 Statistics
Date Direction Time Start Time Finish Duration (minutes)
Length (miles) Speed (mph)
5/4/2009 Downstream 8:02 AM 8:18 AM 16 2.55 9.6
5/4/2009 Upstream 11:44 AM 12:00 PM 16 2.55 9.6
5/5/2009 Downstream 8:07 AM 8:23 AM 16 2.55 9.6
5/5/2009 Upstream 1:22 PM 1:39 PM 17 2.55 9.0
5/6/2009 Downstream 9:17 AM 9:33 AM 16 2.55 9.6
5/6/2009 Upstream 12:14 PM 12:30 PM 16 2.55 9.6
Average 16.2 2.55 9.5
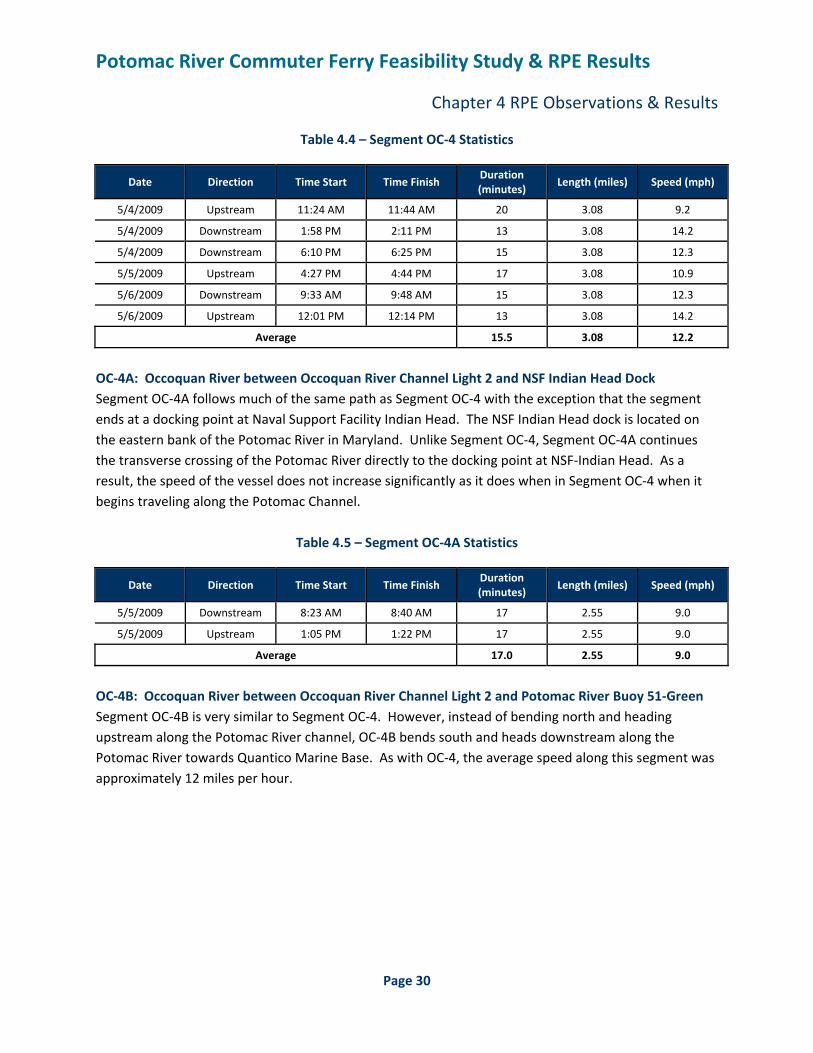
OC‐4: Occoquan River between Occoquan River Channel Light 2 and Potomac River Buoy 54‐Red Segment OC‐4 includes the portion of the Occoquan River from Occoquan River Channel Light 2 to the Potomac River as well as a portion of the Potomac River itself. The portion of the segment contained within the Potomac River includes the transverse crossing of the Potomac from its western shore (mouth of the Occoquan River) to the main channel located near the eastern bank of the river as well as a small portion (0.10 miles) of the main channel. This segment is characterized as a transitional area. Channel depths within this segment ranged from 7 to 10 feet within Occoquan River and shallow portions of the Potomac River to 30 to 40 feet within the Potomac River channel itself.
Potomac River Commuter Ferry Feasibility Study & RPE Results
Chapter 4 RPE Observations & Results
Page 30
Table 4.4 – Segment OC‐4 Statistics
Date Direction Time Start Time Finish Duration (minutes)
Length (miles) Speed (mph)
5/4/2009 Upstream 11:24 AM 11:44 AM 20 3.08 9.2
5/4/2009 Downstream 1:58 PM 2:11 PM 13 3.08 14.2
5/4/2009 Downstream 6:10 PM 6:25 PM 15 3.08 12.3
5/5/2009 Upstream 4:27 PM 4:44 PM 17 3.08 10.9
5/6/2009 Downstream 9:33 AM 9:48 AM 15 3.08 12.3
5/6/2009 Upstream 12:01 PM 12:14 PM 13 3.08 14.2
Average 15.5 3.08 12.2
OC‐4A: Occoquan River between Occoquan River Channel Light 2 and NSF Indian Head Dock Segment OC‐4A follows much of the same path as Segment OC‐4 with the exception that the segment ends at a docking point at Naval Support Facility Indian Head. The NSF Indian Head dock is located on the eastern bank of the Potomac River in Maryland. Unlike Segment OC‐4, Segment OC‐4A continues the transverse crossing of the Potomac River directly to the docking point at NSF‐Indian Head. As a result, the speed of the vessel does not increase significantly as it does when in Segment OC‐4 when it begins traveling along the Potomac Channel.
Table 4.5 – Segment OC‐4A Statistics
Date Direction Time Start Time Finish Duration (minutes)
Length (miles) Speed (mph)
5/5/2009 Downstream 8:23 AM 8:40 AM 17 2.55 9.0
5/5/2009 Upstream 1:05 PM 1:22 PM 17 2.55 9.0
Average 17.0 2.55 9.0
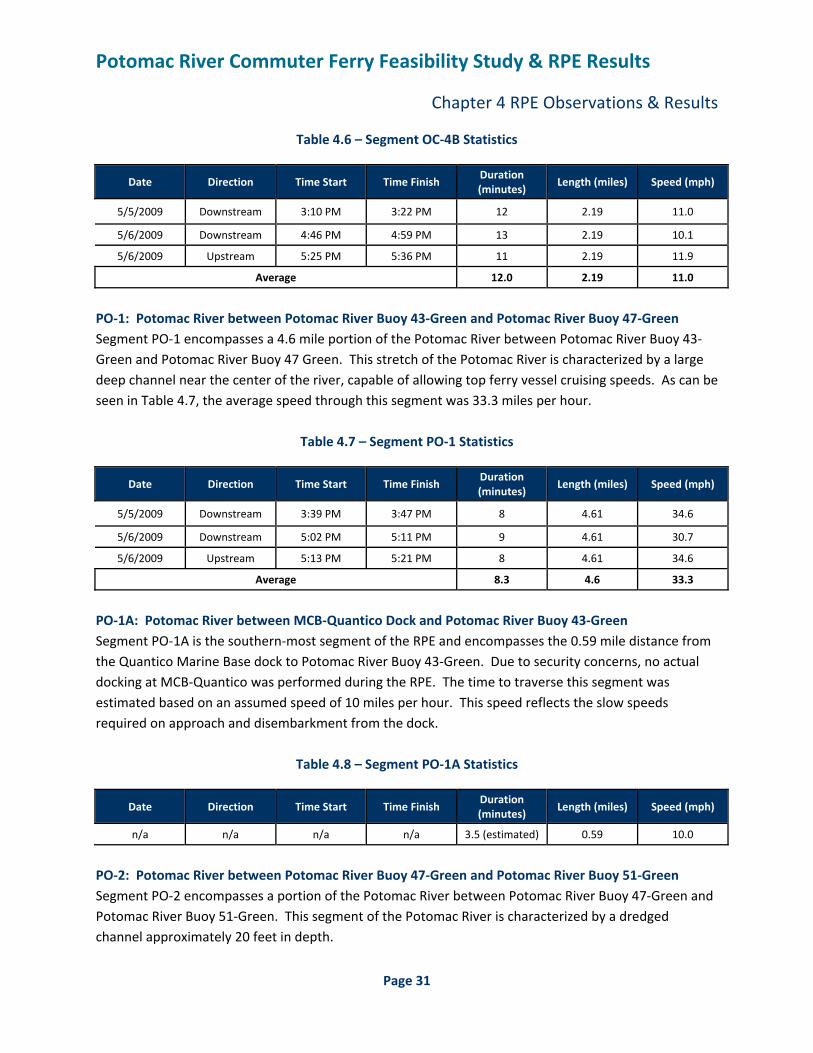
OC‐4B: Occoquan River between Occoquan River Channel Light 2 and Potomac River Buoy 51‐Green Segment OC‐4B is very similar to Segment OC‐4. However, instead of bending north and heading upstream along the Potomac River channel, OC‐4B bends south and heads downstream along the Potomac River towards Quantico Marine Base. As with OC‐4, the average speed along this segment was approximately 12 miles per hour.
Potomac River Commuter Ferry Feasibility Study & RPE Results
Chapter 4 RPE Observations & Results
Page 31
Table 4.6 – Segment OC‐4B Statistics
Date Direction Time Start Time Finish Duration (minutes)
Length (miles) Speed (mph)
5/5/2009 Downstream 3:10 PM 3:22 PM 12 2.19 11.0
5/6/2009 Downstream 4:46 PM 4:59 PM 13 2.19 10.1
5/6/2009 Upstream 5:25 PM 5:36 PM 11 2.19 11.9
Average 12.0 2.19 11.0
PO‐1: Potomac River between Potomac River Buoy 43‐Green and Potomac River Buoy 47‐Green Segment PO‐1 encompasses a 4.6 mile portion of the Potomac River between Potomac River Buoy 43‐Green and Potomac River Buoy 47 Green. This stretch of the Potomac River is characterized by a large deep channel near the center of the river, capable of allowing top ferry vessel cruising speeds. As can be seen in Table 4.7, the average speed through this segment was 33.3 miles per hour.
Table 4.7 – Segment PO‐1 Statistics
Date Direction Time Start Time Finish Duration (minutes)
Length (miles) Speed (mph)
5/5/2009 Downstream 3:39 PM 3:47 PM 8 4.61 34.6
5/6/2009 Downstream 5:02 PM 5:11 PM 9 4.61 30.7
5/6/2009 Upstream 5:13 PM 5:21 PM 8 4.61 34.6
Average 8.3 4.6 33.3
PO‐1A: Potomac River between MCB‐Quantico Dock and Potomac River Buoy 43‐Green Segment PO‐1A is the southern‐most segment of the RPE and encompasses the 0.59 mile distance from the Quantico Marine Base dock to Potomac River Buoy 43‐Green. Due to security concerns, no actual docking at MCB‐Quantico was performed during the RPE. The time to traverse this segment was estimated based on an assumed speed of 10 miles per hour. This speed reflects the slow speeds required on approach and disembarkment from the dock.
Table 4.8 – Segment PO‐1A Statistics
Date Direction Time Start Time Finish Duration (minutes)
Length (miles) Speed (mph)
n/a n/a n/a n/a 3.5 (estimated) 0.59 10.0
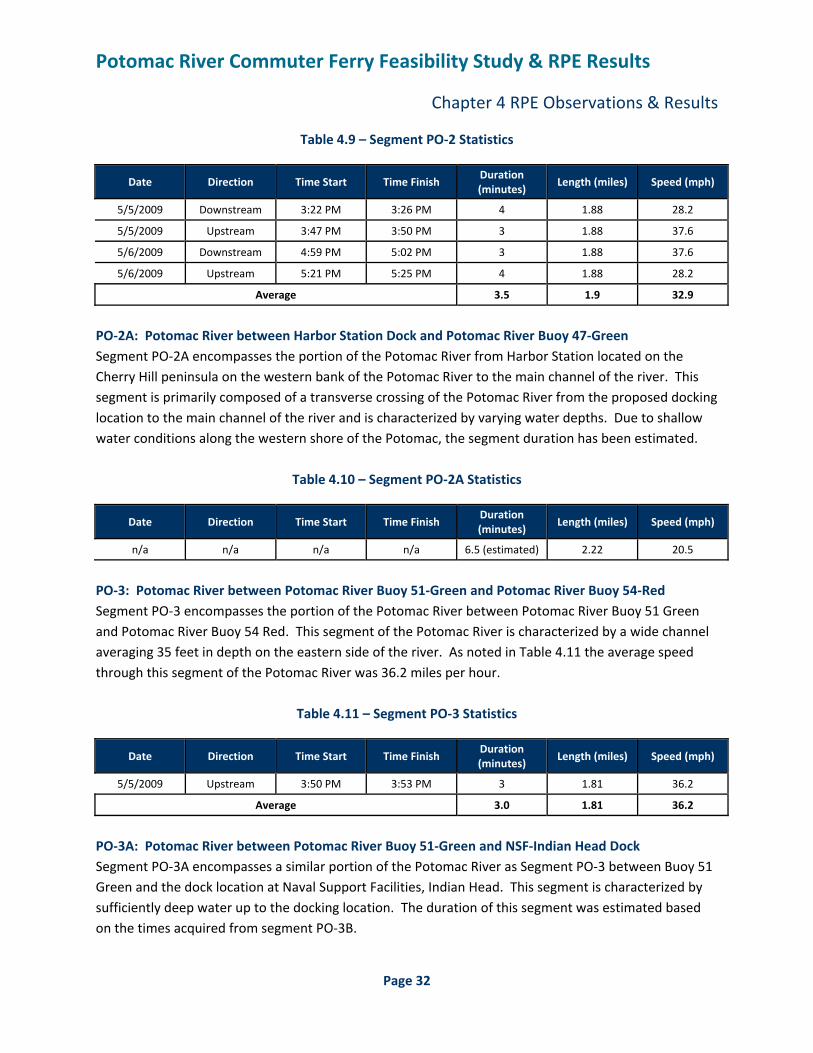
PO‐2: Potomac River between Potomac River Buoy 47‐Green and Potomac River Buoy 51‐Green Segment PO‐2 encompasses a portion of the Potomac River between Potomac River Buoy 47‐Green and Potomac River Buoy 51‐Green. This segment of the Potomac River is characterized by a dredged channel approximately 20 feet in depth.
Potomac River Commuter Ferry Feasibility Study & RPE Results
Chapter 4 RPE Observations & Results
Page 32
Table 4.9 – Segment PO‐2 Statistics
Date Direction Time Start Time Finish Duration (minutes)
Length (miles) Speed (mph)
5/5/2009 Downstream 3:22 PM 3:26 PM 4 1.88 28.2
5/5/2009 Upstream 3:47 PM 3:50 PM 3 1.88 37.6
5/6/2009 Downstream 4:59 PM 5:02 PM 3 1.88 37.6
5/6/2009 Upstream 5:21 PM 5:25 PM 4 1.88 28.2
Average 3.5 1.9 32.9
PO‐2A: Potomac River between Harbor Station Dock and Potomac River Buoy 47‐Green Segment PO‐2A encompasses the portion of the Potomac River from Harbor Station located on the Cherry Hill peninsula on the western bank of the Potomac River to the main channel of the river. This segment is primarily composed of a transverse crossing of the Potomac River from the proposed docking location to the main channel of the river and is characterized by varying water depths. Due to shallow water conditions along the western shore of the Potomac, the segment duration has been estimated.
Table 4.10 – Segment PO‐2A Statistics
Date Direction Time Start Time Finish Duration (minutes)
Length (miles) Speed (mph)
n/a n/a n/a n/a 6.5 (estimated) 2.22 20.5
PO‐3: Potomac River between Potomac River Buoy 51‐Green and Potomac River Buoy 54‐Red Segment PO‐3 encompasses the portion of the Potomac River between Potomac River Buoy 51 Green and Potomac River Buoy 54 Red. This segment of the Potomac River is characterized by a wide channel averaging 35 feet in depth on the eastern side of the river. As noted in Table 4.11 the average speed through this segment of the Potomac River was 36.2 miles per hour.
Table 4.11 – Segment PO‐3 Statistics
Date Direction Time Start Time Finish Duration (minutes)
Length (miles) Speed (mph)
5/5/2009 Upstream 3:50 PM 3:53 PM 3 1.81 36.2
Average 3.0 1.81 36.2
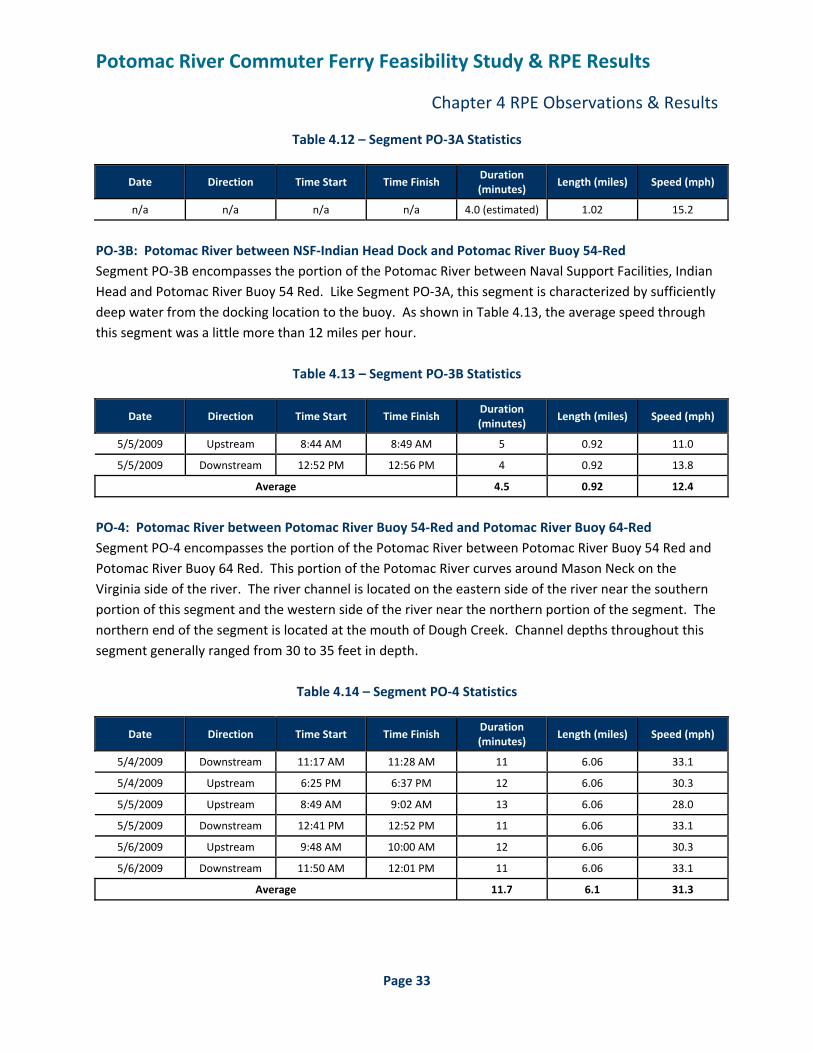
PO‐3A: Potomac River between Potomac River Buoy 51‐Green and NSF‐Indian Head Dock Segment PO‐3A encompasses a similar portion of the Potomac River as Segment PO‐3 between Buoy 51 Green and the dock location at Naval Support Facilities, Indian Head. This segment is characterized by sufficiently deep water up to the docking location. The duration of this segment was estimated based on the times acquired from segment PO‐3B.
Potomac River Commuter Ferry Feasibility Study & RPE Results
Chapter 4 RPE Observations & Results
Page 33
Table 4.12 – Segment PO‐3A Statistics
Date Direction Time Start Time Finish Duration (minutes)
Length (miles) Speed (mph)
n/a n/a n/a n/a 4.0 (estimated) 1.02 15.2
PO‐3B: Potomac River between NSF‐Indian Head Dock and Potomac River Buoy 54‐Red Segment PO‐3B encompasses the portion of the Potomac River between Naval Support Facilities, Indian Head and Potomac River Buoy 54 Red. Like Segment PO‐3A, this segment is characterized by sufficiently deep water from the docking location to the buoy. As shown in Table 4.13, the average speed through this segment was a little more than 12 miles per hour.
Table 4.13 – Segment PO‐3B Statistics
Date Direction Time Start Time Finish Duration (minutes)
Length (miles) Speed (mph)
5/5/2009 Upstream 8:44 AM 8:49 AM 5 0.92 11.0
5/5/2009 Downstream 12:52 PM 12:56 PM 4 0.92 13.8
Average 4.5 0.92 12.4
PO‐4: Potomac River between Potomac River Buoy 54‐Red and Potomac River Buoy 64‐Red Segment PO‐4 encompasses the portion of the Potomac River between Potomac River Buoy 54 Red and Potomac River Buoy 64 Red. This portion of the Potomac River curves around Mason Neck on the Virginia side of the river. The river channel is located on the eastern side of the river near the southern portion of this segment and the western side of the river near the northern portion of the segment. The northern end of the segment is located at the mouth of Dough Creek. Channel depths throughout this segment generally ranged from 30 to 35 feet in depth.
Table 4.14 – Segment PO‐4 Statistics
Date Direction Time Start Time Finish Duration (minutes)
Length (miles) Speed (mph)
5/4/2009 Downstream 11:17 AM 11:28 AM 11 6.06 33.1
5/4/2009 Upstream 6:25 PM 6:37 PM 12 6.06 30.3
5/5/2009 Upstream 8:49 AM 9:02 AM 13 6.06 28.0
5/5/2009 Downstream 12:41 PM 12:52 PM 11 6.06 33.1
5/6/2009 Upstream 9:48 AM 10:00 AM 12 6.06 30.3
5/6/2009 Downstream 11:50 AM 12:01 PM 11 6.06 33.1
Average 11.7 6.1 31.3

Potomac River Commuter Ferry Feasibility Study & RPE Results
Chapter 4 RPE Observations & Results
Page 34
PO‐4A: Potomac River between Fort Belvoir Dock and Potomac River Buoy 64‐Red Segment PO‐4A encompasses a portion of Gunston Cove and the Potomac River. The segment contains a transverse crossing of the Potomac River from the main channel and within Gunston Cove to the existing docks at Fort Belvoir. Due to shallow water and security restrictions, the route duration was estimated based on data collected from similar segments.
Table 4.15 – Segment PO‐4A Statistics
Date Direction Time Start Time Finish Duration (minutes)
Length (miles) Speed (mph)
n/a n/a n/a n/a 3.0 (estimated) 0.68 13.6
PO‐5: Potomac River between Potomac River Buoy 64‐Red and Potomac River Buoy 67‐Green Segment PO‐5 encompasses the portion of the Potomac River between Potomac River Buoy 64 Red to Potomac River Buoy 67 Green. This portion of the Potomac River is approximately two miles in length and is characterized by a wide channel near the middle of the river with depths of approximately 30 feet. Average speed along this portion of the river was approximately 35 miles per hour.
Table 4.16 – Segment PO‐5 Statistics
Date Direction Time Start Time Finish Duration (minutes)
Length (miles) Speed (mph)
5/4/2009 Downstream 11:13 AM 11:17 AM 4 1.97 29.6
5/4/2009 Upstream 6:37 PM 6:40 PM 3 1.97 39.4
5/5/2009 Upstream 9:02 AM 9:06 AM 4 1.97 29.6
5/5/2009 Downstream 12:38 PM 12:41 PM 3 1.97 39.4
5/6/2009 Upstream 10:00 AM 10:04 AM 4 1.97 29.6
5/6/2009 Downstream 11:47 AM 11:50 AM 3 1.97 39.4
Average 3.5 1.97 34.5
PO‐5A: Potomac River between Marshall Hall Dock and Potomac River Buoy 67‐Green Segment PO‐5A encompasses the 0.4 mile transverse crossing of the Potomac River from the main channel to the proposed Marshall Hall dock. Because no docking facilities currently exist in this location, a segment duration was estimated based on data obtained from similar segments.
Table 4.17 – Segment PO‐5A Statistics
Date Direction Time Start Time Finish Duration (minutes)
Length (miles) Speed (mph)
n/a n/a n/a n/a 2.0 (estimated) 0.39 11.7
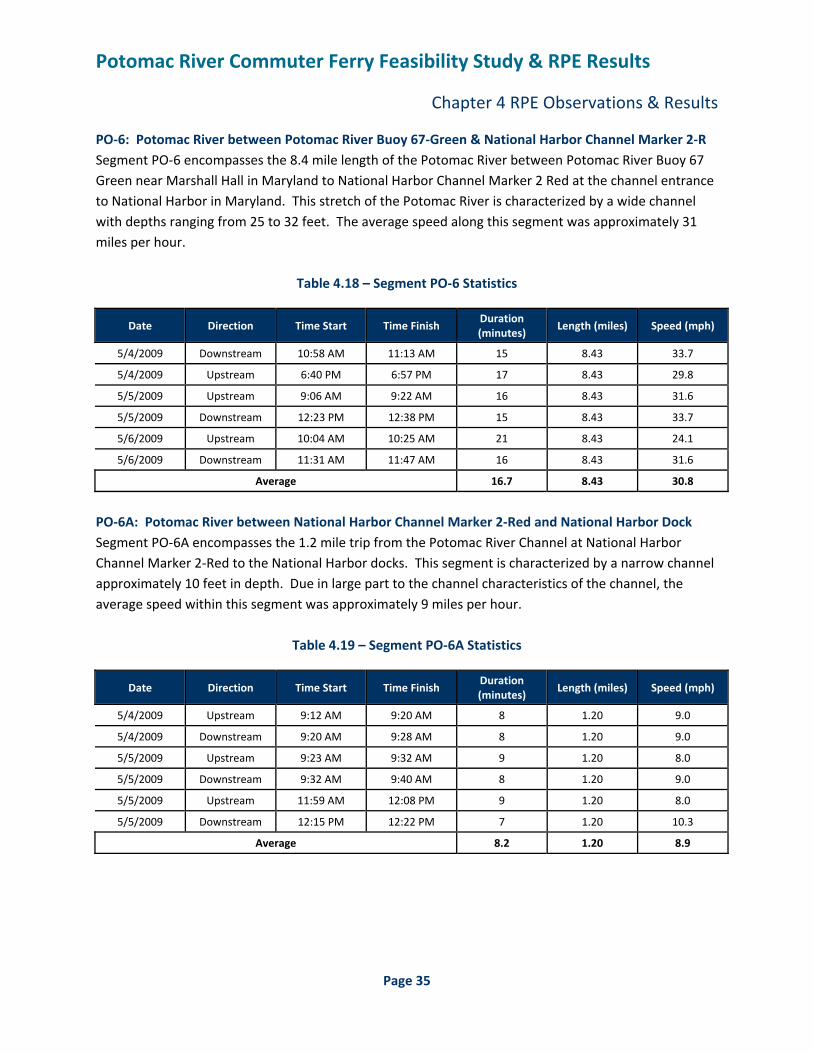
Potomac River Commuter Ferry Feasibility Study & RPE Results
Chapter 4 RPE Observations & Results
Page 35
PO‐6: Potomac River between Potomac River Buoy 67‐Green & National Harbor Channel Marker 2‐R Segment PO‐6 encompasses the 8.4 mile length of the Potomac River between Potomac River Buoy 67 Green near Marshall Hall in Maryland to National Harbor Channel Marker 2 Red at the channel entrance to National Harbor in Maryland. This stretch of the Potomac River is characterized by a wide channel with depths ranging from 25 to 32 feet. The average speed along this segment was approximately 31 miles per hour.
Table 4.18 – Segment PO‐6 Statistics
Date Direction Time Start Time Finish Duration (minutes)
Length (miles) Speed (mph)
5/4/2009 Downstream 10:58 AM 11:13 AM 15 8.43 33.7
5/4/2009 Upstream 6:40 PM 6:57 PM 17 8.43 29.8
5/5/2009 Upstream 9:06 AM 9:22 AM 16 8.43 31.6
5/5/2009 Downstream 12:23 PM 12:38 PM 15 8.43 33.7
5/6/2009 Upstream 10:04 AM 10:25 AM 21 8.43 24.1
5/6/2009 Downstream 11:31 AM 11:47 AM 16 8.43 31.6
Average 16.7 8.43 30.8
PO‐6A: Potomac River between National Harbor Channel Marker 2‐Red and National Harbor Dock Segment PO‐6A encompasses the 1.2 mile trip from the Potomac River Channel at National Harbor Channel Marker 2‐Red to the National Harbor docks. This segment is characterized by a narrow channel approximately 10 feet in depth. Due in large part to the channel characteristics of the channel, the average speed within this segment was approximately 9 miles per hour.
Table 4.19 – Segment PO‐6A Statistics
Date Direction Time Start Time Finish Duration (minutes)
Length (miles) Speed (mph)
5/4/2009 Upstream 9:12 AM 9:20 AM 8 1.20 9.0
5/4/2009 Downstream 9:20 AM 9:28 AM 8 1.20 9.0
5/5/2009 Upstream 9:23 AM 9:32 AM 9 1.20 8.0
5/5/2009 Downstream 9:32 AM 9:40 AM 8 1.20 9.0
5/5/2009 Upstream 11:59 AM 12:08 PM 9 1.20 8.0
5/5/2009 Downstream 12:15 PM 12:22 PM 7 1.20 10.3
Average 8.2 1.20 8.9
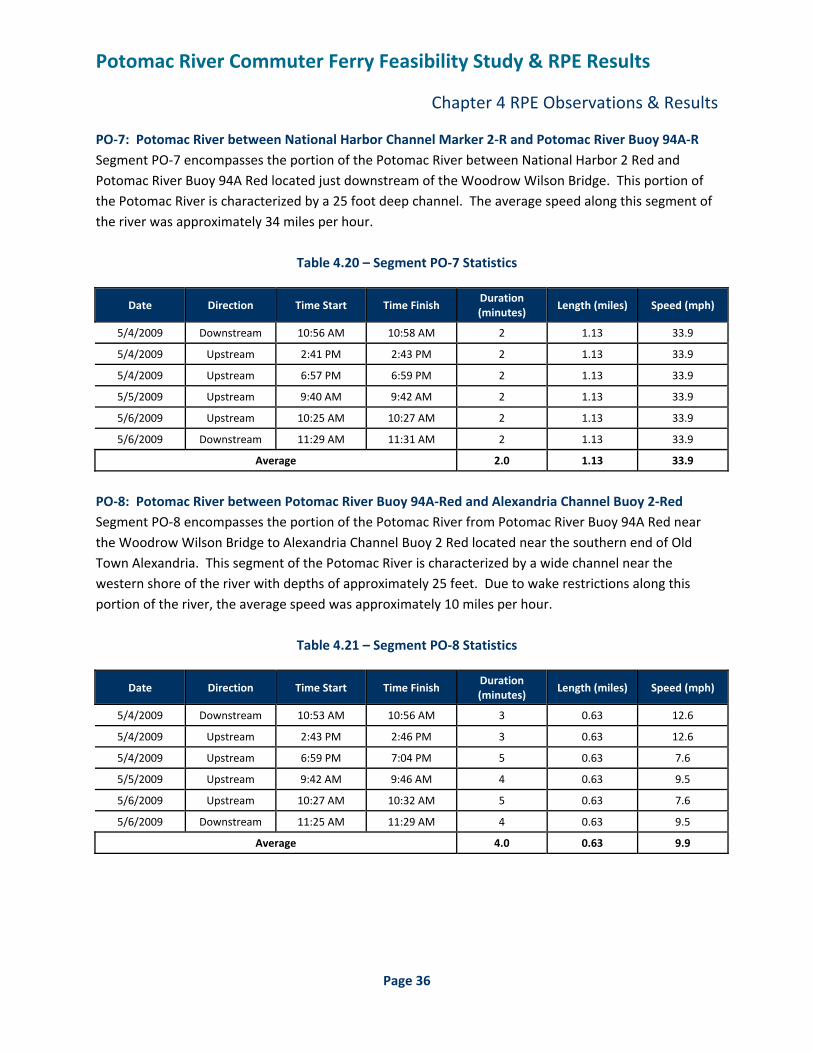
Potomac River Commuter Ferry Feasibility Study & RPE Results
Chapter 4 RPE Observations & Results
Page 36
PO‐7: Potomac River between National Harbor Channel Marker 2‐R and Potomac River Buoy 94A‐R Segment PO‐7 encompasses the portion of the Potomac River between National Harbor 2 Red and Potomac River Buoy 94A Red located just downstream of the Woodrow Wilson Bridge. This portion of the Potomac River is characterized by a 25 foot deep channel. The average speed along this segment of the river was approximately 34 miles per hour.
Table 4.20 – Segment PO‐7 Statistics
Date Direction Time Start Time Finish Duration (minutes)
Length (miles) Speed (mph)
5/4/2009 Downstream 10:56 AM 10:58 AM 2 1.13 33.9
5/4/2009 Upstream 2:41 PM 2:43 PM 2 1.13 33.9
5/4/2009 Upstream 6:57 PM 6:59 PM 2 1.13 33.9
5/5/2009 Upstream 9:40 AM 9:42 AM 2 1.13 33.9
5/6/2009 Upstream 10:25 AM 10:27 AM 2 1.13 33.9
5/6/2009 Downstream 11:29 AM 11:31 AM 2 1.13 33.9
Average 2.0 1.13 33.9
PO‐8: Potomac River between Potomac River Buoy 94A‐Red and Alexandria Channel Buoy 2‐Red Segment PO‐8 encompasses the portion of the Potomac River from Potomac River Buoy 94A Red near the Woodrow Wilson Bridge to Alexandria Channel Buoy 2 Red located near the southern end of Old Town Alexandria. This segment of the Potomac River is characterized by a wide channel near the western shore of the river with depths of approximately 25 feet. Due to wake restrictions along this portion of the river, the average speed was approximately 10 miles per hour.
Table 4.21 – Segment PO‐8 Statistics
Date Direction Time Start Time Finish Duration (minutes)
Length (miles) Speed (mph)
5/4/2009 Downstream 10:53 AM 10:56 AM 3 0.63 12.6
5/4/2009 Upstream 2:43 PM 2:46 PM 3 0.63 12.6
5/4/2009 Upstream 6:59 PM 7:04 PM 5 0.63 7.6
5/5/2009 Upstream 9:42 AM 9:46 AM 4 0.63 9.5
5/6/2009 Upstream 10:27 AM 10:32 AM 5 0.63 7.6
5/6/2009 Downstream 11:25 AM 11:29 AM 4 0.63 9.5
Average 4.0 0.63 9.9
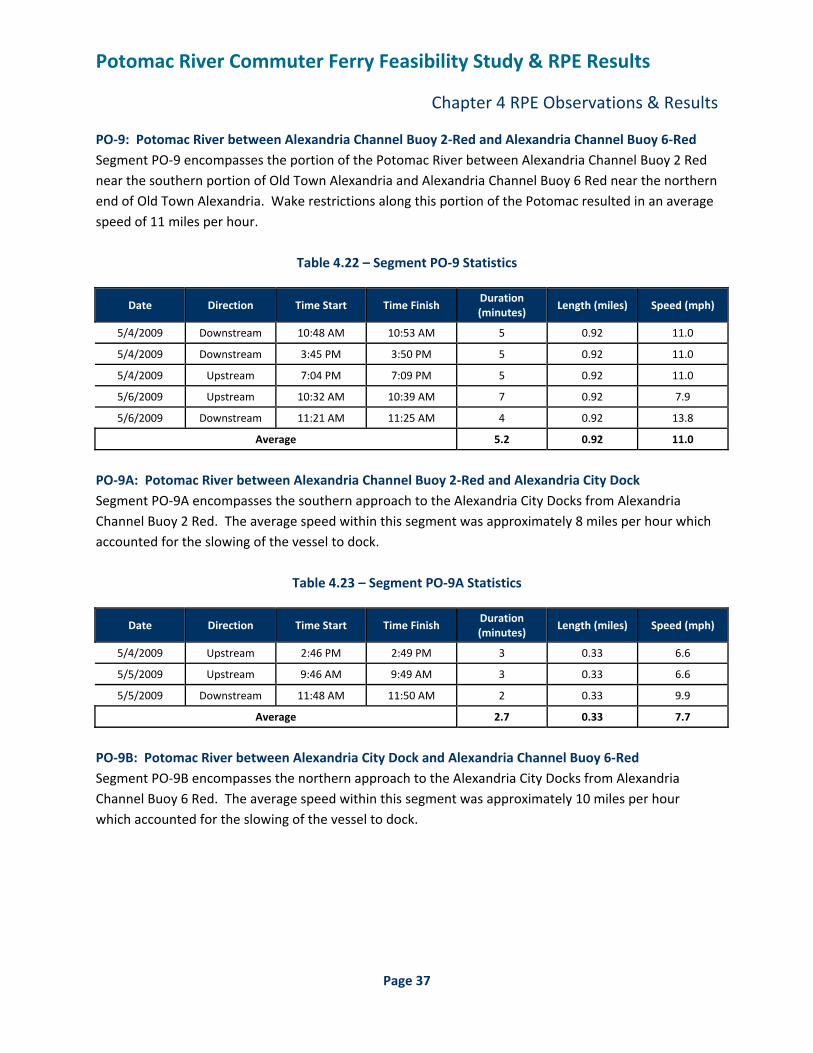
Potomac River Commuter Ferry Feasibility Study & RPE Results
Chapter 4 RPE Observations & Results
Page 37
PO‐9: Potomac River between Alexandria Channel Buoy 2‐Red and Alexandria Channel Buoy 6‐Red Segment PO‐9 encompasses the portion of the Potomac River between Alexandria Channel Buoy 2 Red near the southern portion of Old Town Alexandria and Alexandria Channel Buoy 6 Red near the northern end of Old Town Alexandria. Wake restrictions along this portion of the Potomac resulted in an average speed of 11 miles per hour.
Table 4.22 – Segment PO‐9 Statistics
Date Direction Time Start Time Finish Duration (minutes)
Length (miles) Speed (mph)
5/4/2009 Downstream 10:48 AM 10:53 AM 5 0.92 11.0
5/4/2009 Downstream 3:45 PM 3:50 PM 5 0.92 11.0
5/4/2009 Upstream 7:04 PM 7:09 PM 5 0.92 11.0
5/6/2009 Upstream 10:32 AM 10:39 AM 7 0.92 7.9
5/6/2009 Downstream 11:21 AM 11:25 AM 4 0.92 13.8
Average 5.2 0.92 11.0
PO‐9A: Potomac River between Alexandria Channel Buoy 2‐Red and Alexandria City Dock Segment PO‐9A encompasses the southern approach to the Alexandria City Docks from Alexandria Channel Buoy 2 Red. The average speed within this segment was approximately 8 miles per hour which accounted for the slowing of the vessel to dock.
Table 4.23 – Segment PO‐9A Statistics
Date Direction Time Start Time Finish Duration (minutes)
Length (miles) Speed (mph)
5/4/2009 Upstream 2:46 PM 2:49 PM 3 0.33 6.6
5/5/2009 Upstream 9:46 AM 9:49 AM 3 0.33 6.6
5/5/2009 Downstream 11:48 AM 11:50 AM 2 0.33 9.9
Average 2.7 0.33 7.7
PO‐9B: Potomac River between Alexandria City Dock and Alexandria Channel Buoy 6‐Red Segment PO‐9B encompasses the northern approach to the Alexandria City Docks from Alexandria Channel Buoy 6 Red. The average speed within this segment was approximately 10 miles per hour which accounted for the slowing of the vessel to dock.
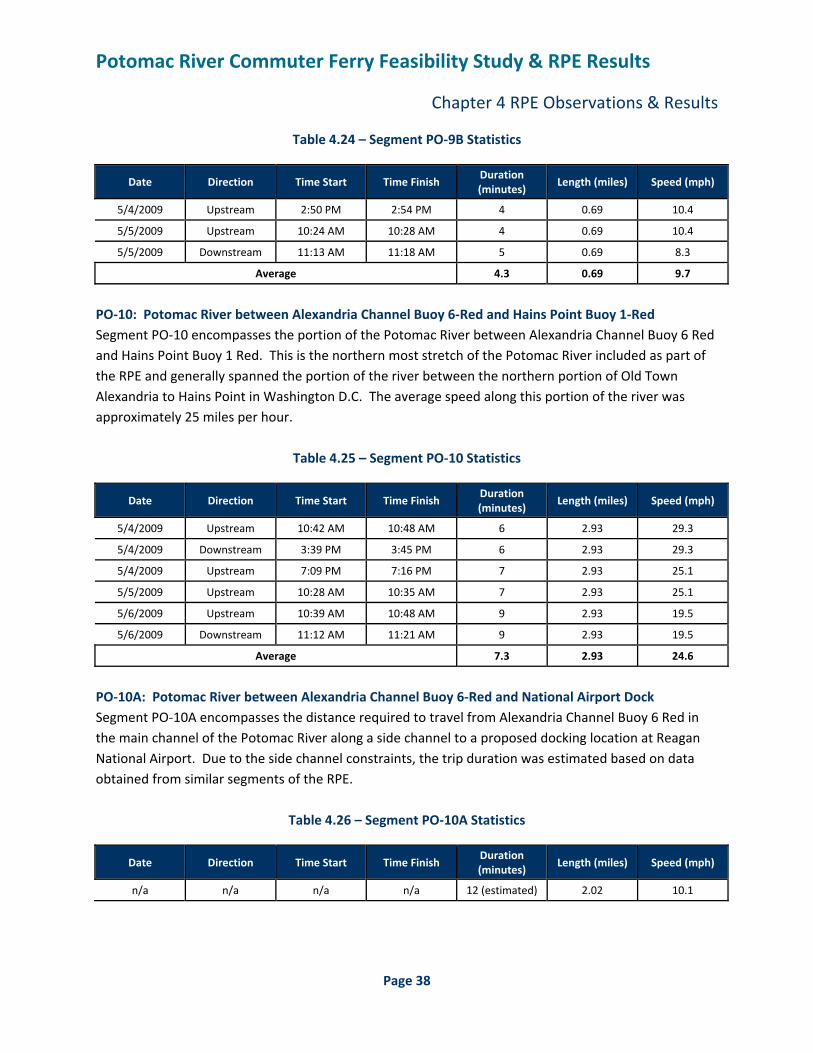
Potomac River Commuter Ferry Feasibility Study & RPE Results
Chapter 4 RPE Observations & Results
Page 38
Table 4.24 – Segment PO‐9B Statistics
Date Direction Time Start Time Finish Duration (minutes)
Length (miles) Speed (mph)
5/4/2009 Upstream 2:50 PM 2:54 PM 4 0.69 10.4
5/5/2009 Upstream 10:24 AM 10:28 AM 4 0.69 10.4
5/5/2009 Downstream 11:13 AM 11:18 AM 5 0.69 8.3
Average 4.3 0.69 9.7
PO‐10: Potomac River between Alexandria Channel Buoy 6‐Red and Hains Point Buoy 1‐Red Segment PO‐10 encompasses the portion of the Potomac River between Alexandria Channel Buoy 6 Red and Hains Point Buoy 1 Red. This is the northern most stretch of the Potomac River included as part of the RPE and generally spanned the portion of the river between the northern portion of Old Town Alexandria to Hains Point in Washington D.C. The average speed along this portion of the river was approximately 25 miles per hour.
Table 4.25 – Segment PO‐10 Statistics
Date Direction Time Start Time Finish Duration (minutes)
Length (miles) Speed (mph)
5/4/2009 Upstream 10:42 AM 10:48 AM 6 2.93 29.3
5/4/2009 Downstream 3:39 PM 3:45 PM 6 2.93 29.3
5/4/2009 Upstream 7:09 PM 7:16 PM 7 2.93 25.1
5/5/2009 Upstream 10:28 AM 10:35 AM 7 2.93 25.1
5/6/2009 Upstream 10:39 AM 10:48 AM 9 2.93 19.5
5/6/2009 Downstream 11:12 AM 11:21 AM 9 2.93 19.5
Average 7.3 2.93 24.6
PO‐10A: Potomac River between Alexandria Channel Buoy 6‐Red and National Airport Dock Segment PO‐10A encompasses the distance required to travel from Alexandria Channel Buoy 6 Red in the main channel of the Potomac River along a side channel to a proposed docking location at Reagan National Airport. Due to the side channel constraints, the trip duration was estimated based on data obtained from similar segments of the RPE.
Table 4.26 – Segment PO‐10A Statistics
Date Direction Time Start Time Finish Duration (minutes)
Length (miles) Speed (mph)
n/a n/a n/a n/a 12 (estimated) 2.02 10.1
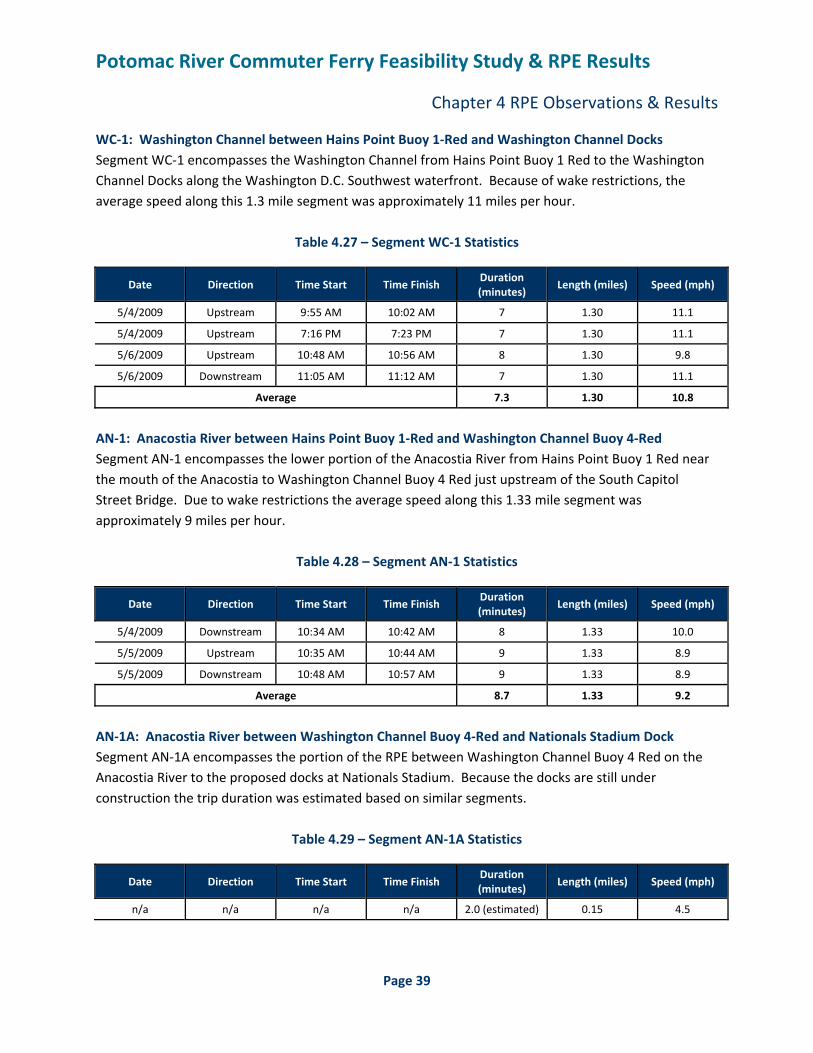
Potomac River Commuter Ferry Feasibility Study & RPE Results
Chapter 4 RPE Observations & Results
Page 39
WC‐1: Washington Channel between Hains Point Buoy 1‐Red and Washington Channel Docks Segment WC‐1 encompasses the Washington Channel from Hains Point Buoy 1 Red to the Washington Channel Docks along the Washington D.C. Southwest waterfront. Because of wake restrictions, the average speed along this 1.3 mile segment was approximately 11 miles per hour.
Table 4.27 – Segment WC‐1 Statistics
Date Direction Time Start Time Finish Duration (minutes)
Length (miles) Speed (mph)
5/4/2009 Upstream 9:55 AM 10:02 AM 7 1.30 11.1
5/4/2009 Upstream 7:16 PM 7:23 PM 7 1.30 11.1
5/6/2009 Upstream 10:48 AM 10:56 AM 8 1.30 9.8
5/6/2009 Downstream 11:05 AM 11:12 AM 7 1.30 11.1
Average 7.3 1.30 10.8
AN‐1: Anacostia River between Hains Point Buoy 1‐Red and Washington Channel Buoy 4‐Red Segment AN‐1 encompasses the lower portion of the Anacostia River from Hains Point Buoy 1 Red near the mouth of the Anacostia to Washington Channel Buoy 4 Red just upstream of the South Capitol Street Bridge. Due to wake restrictions the average speed along this 1.33 mile segment was approximately 9 miles per hour.
Table 4.28 – Segment AN‐1 Statistics
Date Direction Time Start Time Finish Duration (minutes)
Length (miles) Speed (mph)
5/4/2009 Downstream 10:34 AM 10:42 AM 8 1.33 10.0
5/5/2009 Upstream 10:35 AM 10:44 AM 9 1.33 8.9
5/5/2009 Downstream 10:48 AM 10:57 AM 9 1.33 8.9
Average 8.7 1.33 9.2
AN‐1A: Anacostia River between Washington Channel Buoy 4‐Red and Nationals Stadium Dock Segment AN‐1A encompasses the portion of the RPE between Washington Channel Buoy 4 Red on the Anacostia River to the proposed docks at Nationals Stadium. Because the docks are still under construction the trip duration was estimated based on similar segments.
Table 4.29 – Segment AN‐1A Statistics
Date Direction Time Start Time Finish Duration (minutes)
Length (miles) Speed (mph)
n/a n/a n/a n/a 2.0 (estimated) 0.15 4.5
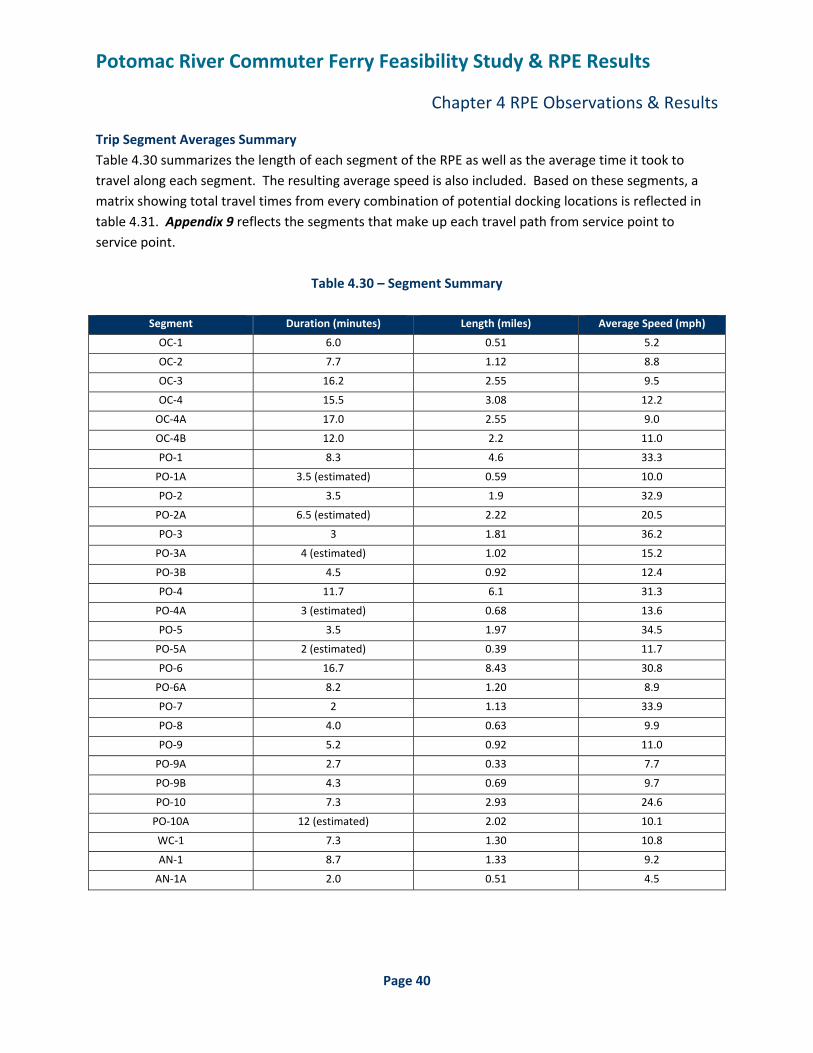
Potomac River Commuter Ferry Feasibility Study & RPE Results
Chapter 4 RPE Observations & Results
Page 40
Trip Segment Averages Summary Table 4.30 summarizes the length of each segment of the RPE as well as the average time it took to travel along each segment. The resulting average speed is also included. Based on these segments, a matrix showing total travel times from every combination of potential docking locations is reflected in table 4.31. Appendix 9 reflects the segments that make up each travel path from service point to service point.
Table 4.30 – Segment Summary
Segment Duration (minutes) Length (miles) Average Speed (mph)
OC‐1 6.0 0.51 5.2
OC‐2 7.7 1.12 8.8
OC‐3 16.2 2.55 9.5
OC‐4 15.5 3.08 12.2
OC‐4A 17.0 2.55 9.0
OC‐4B 12.0 2.2 11.0
PO‐1 8.3 4.6 33.3
PO‐1A 3.5 (estimated) 0.59 10.0
PO‐2 3.5 1.9 32.9
PO‐2A 6.5 (estimated) 2.22 20.5
PO‐3 3 1.81 36.2
PO‐3A 4 (estimated) 1.02 15.2
PO‐3B 4.5 0.92 12.4
PO‐4 11.7 6.1 31.3
PO‐4A 3 (estimated) 0.68 13.6
PO‐5 3.5 1.97 34.5
PO‐5A 2 (estimated) 0.39 11.7
PO‐6 16.7 8.43 30.8
PO‐6A 8.2 1.20 8.9
PO‐7 2 1.13 33.9
PO‐8 4.0 0.63 9.9
PO‐9 5.2 0.92 11.0
PO‐9A 2.7 0.33 7.7
PO‐9B 4.3 0.69 9.7
PO‐10 7.3 2.93 24.6
PO‐10A 12 (estimated) 2.02 10.1
WC‐1 7.3 1.30 10.8
AN‐1 8.7 1.33 9.2
AN‐1A 2.0 0.51 4.5
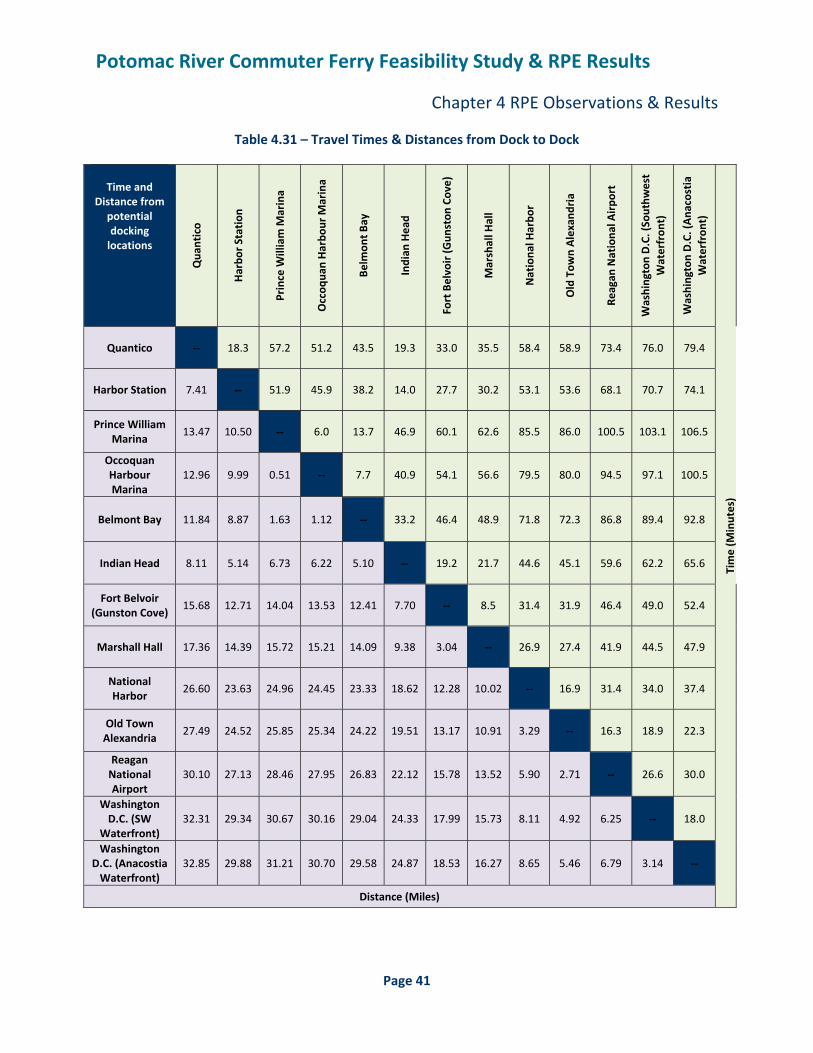
Potomac River Commuter Ferry Feasibility Study & RPE Results
Chapter 4 RPE Observations & Results
Page 41
Table 4.31 – Travel Times & Distances from Dock to Dock
Time and
Distance from potential docking locations
Qua
ntico
Harbo
r Station
Prince W
illiam M
arina
Occoq
uan Harbo
ur M
arina
Belm
ont B
ay
Indian
Head
Fort Belvoir (G
unston
Cove)
Marshall H
all
Nationa
l Harbo
r
Old Tow
n Alexand
ria
Reagan
Nationa
l Airpo
rt
Washington D.C. (So
uthw
est
Waterfron
t)
Washington D.C. (Ana
costia
Waterfron
t)
Time (M
inutes)
Quantico ‐‐ 18.3 57.2 51.2 43.5 19.3 33.0 35.5 58.4 58.9 73.4 76.0 79.4
Harbor Station 7.41 ‐‐ 51.9 45.9 38.2 14.0 27.7 30.2 53.1 53.6 68.1 70.7 74.1
Prince William Marina
13.47 10.50 ‐‐ 6.0 13.7 46.9 60.1 62.6 85.5 86.0 100.5 103.1 106.5
Occoquan Harbour Marina
12.96 9.99 0.51 ‐‐ 7.7 40.9 54.1 56.6 79.5 80.0 94.5 97.1 100.5
Belmont Bay 11.84 8.87 1.63 1.12 ‐‐ 33.2 46.4 48.9 71.8 72.3 86.8 89.4 92.8
Indian Head 8.11 5.14 6.73 6.22 5.10 ‐‐ 19.2 21.7 44.6 45.1 59.6 62.2 65.6
Fort Belvoir (Gunston Cove)
15.68 12.71 14.04 13.53 12.41 7.70 ‐‐ 8.5 31.4 31.9 46.4 49.0 52.4
Marshall Hall 17.36 14.39 15.72 15.21 14.09 9.38 3.04 ‐‐ 26.9 27.4 41.9 44.5 47.9
National Harbor
26.60 23.63 24.96 24.45 23.33 18.62 12.28 10.02 ‐‐ 16.9 31.4 34.0 37.4
Old Town Alexandria
27.49 24.52 25.85 25.34 24.22 19.51 13.17 10.91 3.29 ‐‐ 16.3 18.9 22.3
Reagan National Airport
30.10 27.13 28.46 27.95 26.83 22.12 15.78 13.52 5.90 2.71 ‐‐ 26.6 30.0
Washington D.C. (SW
Waterfront) 32.31 29.34 30.67 30.16 29.04 24.33 17.99 15.73 8.11 4.92 6.25 ‐‐ 18.0
Washington D.C. (Anacostia Waterfront)
32.85 29.88 31.21 30.70 29.58 24.87 18.53 16.27 8.65 5.46 6.79 3.14 ‐‐
Distance (Miles)
Potomac River Commuter Ferry Feasibility Study & RPE Results
Chapter 4 RPE Observations & Results
Page 42
4.3 Wave Measurement Results As discussed in the methodology section of this report, a wave measurement sensor was placed in the Potomac River at two specific locations to measure wave heights during the course of the RPE. The first testing point was the Alexandria City Pier. The second testing point was Potomac River Buoy 88 located approximately 1.2 miles south of the Woodrow Wilson Bridge. Appendix 10 contains graphs showing wave heights measured generally between 8:00 am and 8:00 pm each day from Sunday, May 3, 2009 to Monday May 11, 2009. The results of the testing from each of the two locations are as follows: Old Town Alexandria The waves measured at Old Town Alexandria were generally no more than 0.2 feet (2.5 inches) in height. This reflects the fact that Old Town Alexandria is on the western shore of the Potomac where there is little wind‐driven wave action. During the periods of time when the ferry vessel was either docking at or passing Old Town Alexandria, little additional wave action can be seen. This reflects that fact that the vessel was travelling at a no‐wake speed of approximately 5 to 10 miles per hour. Potomac River Buoy 88 In contrast to Old Town Alexandria, wave measurements taken at Buoy 88 downstream recorded significantly higher waves over the course of its placement. On May 6, 2009, the wave measurement sensor clearly measured the waves generated as a result of the ferry vessel wake on two separate occasions at approximately 10:25 am and 11:28 am. The wave heights measured as a result of the ferry vessel wake were 0.68 feet and 0.46 feet respectively. The vessel speed during the occasions when the wake was measured was its top cruising speed of approximately 34 miles per hour. The wake measurements correspond directly to the published wake heights of 7 inches based on the vessel specifications. When compared to overall wave action measured between May 3 and May 11, the wave heights of 7 inches fall well within the normal wind‐driven wave action. As can be seen from wave measurements taken between Saturday May 9, 2009 and Monday May 11, 2009, wind‐driven waves were consistently being measured at approximately 0.5 to 1.0 feet in height. These increased wave heights correspond directly to higher winds ranging from 15 to 20 miles per hour with higher gusts experienced over same time period. The wave period as a result of the vessel wake was also very similar to the wave period resulting from wind driven waves. This fact is important as shorter wave periods can have an enhanced negative effect on smaller vessels. Visual Wake Observations From visual observations made during the course of the RPE, the vessel wake tended to be smaller at both very slow speed (5 mph or less) (displacement mode) or at high speeds (25 mph or greater) (planing mode). Wake generated by the ferry vessel tended to be highest during the periods of transition from displacement mode to planing mode. In addition, it was observed that vessel wake tended to be amplified to the inside of a vessel turn.
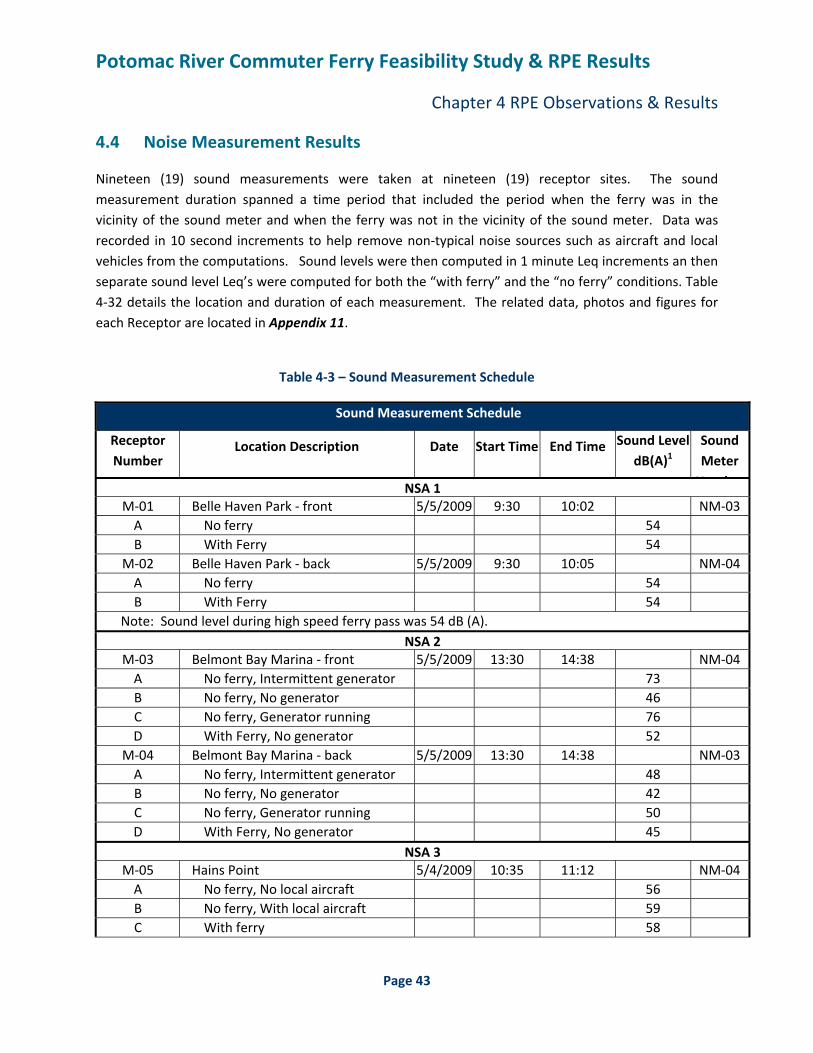
Potomac River Commuter Ferry Feasibility Study & RPE Results
Chapter 4 RPE Observations & Results
Page 43
4.4 Noise Measurement Results
Nineteen (19) sound measurements were taken at nineteen (19) receptor sites. The sound measurement duration spanned a time period that included the period when the ferry was in the vicinity of the sound meter and when the ferry was not in the vicinity of the sound meter. Data was recorded in 10 second increments to help remove non‐typical noise sources such as aircraft and local vehicles from the computations. Sound levels were then computed in 1 minute Leq increments an then separate sound level Leq’s were computed for both the “with ferry” and the “no ferry” conditions. Table 4‐32 details the location and duration of each measurement. The related data, photos and figures for each Receptor are located in Appendix 11.
Table 4‐3 – Sound Measurement Schedule
Sound Measurement Schedule
Receptor Number
Location Description Date Start Time End Time Sound Level dB(A)1
Sound Meter N bNSA 1
M‐01 Belle Haven Park ‐ front 5/5/2009 9:30 10:02 NM‐03 A No ferry 54 B With Ferry 54
M‐02 Belle Haven Park ‐ back 5/5/2009 9:30 10:05 NM‐04 A No ferry 54 B With Ferry 54
Note: Sound level during high speed ferry pass was 54 dB (A). NSA 2
M‐03 Belmont Bay Marina ‐ front 5/5/2009 13:30 14:38 NM‐04 A No ferry, Intermittent generator 73 B No ferry, No generator 46 C No ferry, Generator running 76 D With Ferry, No generator 52
M‐04 Belmont Bay Marina ‐ back 5/5/2009 13:30 14:38 NM‐03 A No ferry, Intermittent generator 48 B No ferry, No generator 42 C No ferry, Generator running 50 D With Ferry, No generator 45
NSA 3M‐05 Hains Point 5/4/2009 10:35 11:12 NM‐04 A No ferry, No local aircraft 56 B No ferry, With local aircraft 59 C With ferry 58
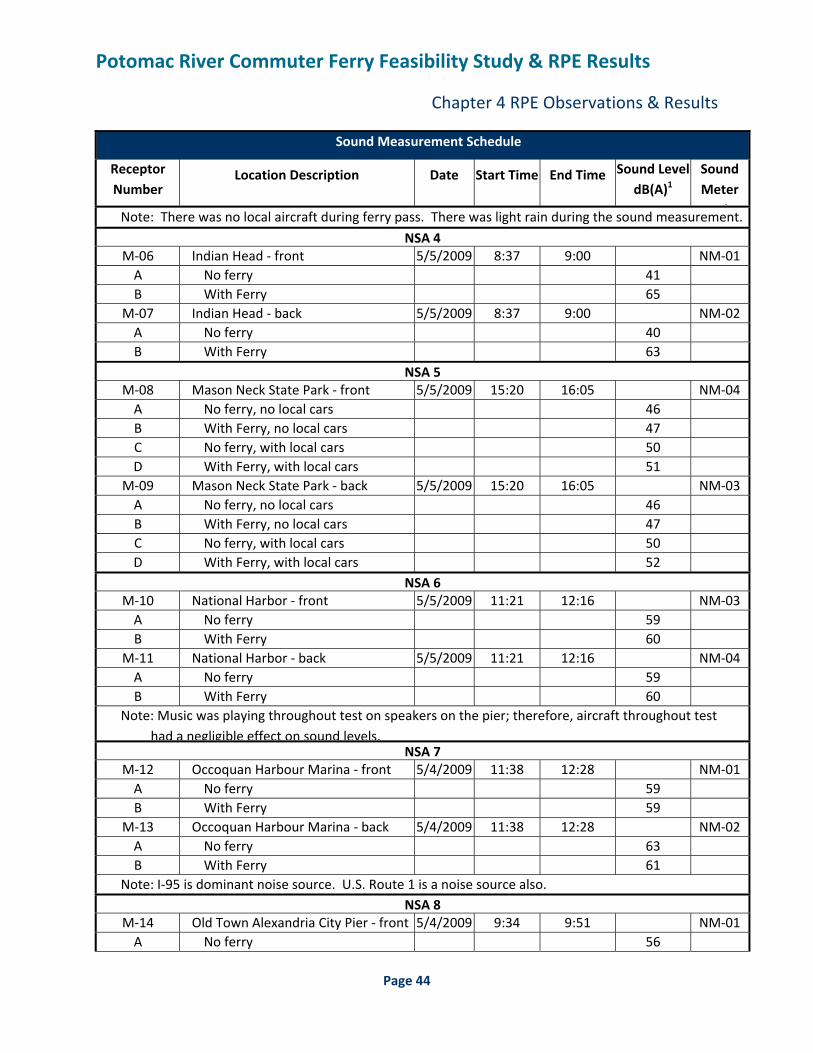
Potomac River Commuter Ferry Feasibility Study & RPE Results
Chapter 4 RPE Observations & Results
Page 44
Sound Measurement Schedule
Receptor Number
Location Description Date Start Time End Time Sound Level dB(A)1
Sound Meter N bNote: There was no local aircraft during ferry pass. There was light rain during the sound measurement.
NSA 4M‐06 Indian Head ‐ front 5/5/2009 8:37 9:00 NM‐01 A No ferry 41 B With Ferry 65
M‐07 Indian Head ‐ back 5/5/2009 8:37 9:00 NM‐02 A No ferry 40 B With Ferry 63
NSA 5M‐08 Mason Neck State Park ‐ front 5/5/2009 15:20 16:05 NM‐04 A No ferry, no local cars 46 B With Ferry, no local cars 47 C No ferry, with local cars 50 D With Ferry, with local cars 51
M‐09 Mason Neck State Park ‐ back 5/5/2009 15:20 16:05 NM‐03 A No ferry, no local cars 46 B With Ferry, no local cars 47 C No ferry, with local cars 50 D With Ferry, with local cars 52
NSA 6M‐10 National Harbor ‐ front 5/5/2009 11:21 12:16 NM‐03 A No ferry 59 B With Ferry 60
M‐11 National Harbor ‐ back 5/5/2009 11:21 12:16 NM‐04 A No ferry 59 B With Ferry 60
Note: Music was playing throughout test on speakers on the pier; therefore, aircraft throughout test had a negligible effect on sound levels.
NSA 7M‐12 Occoquan Harbour Marina ‐ front 5/4/2009 11:38 12:28 NM‐01 A No ferry 59 B With Ferry 59
M‐13 Occoquan Harbour Marina ‐ back 5/4/2009 11:38 12:28 NM‐02 A No ferry 63 B With Ferry 61
Note: I‐95 is dominant noise source. U.S. Route 1 is a noise source also. NSA 8
M‐14 Old Town Alexandria City Pier ‐ front 5/4/2009 9:34 9:51 NM‐01 A No ferry 56
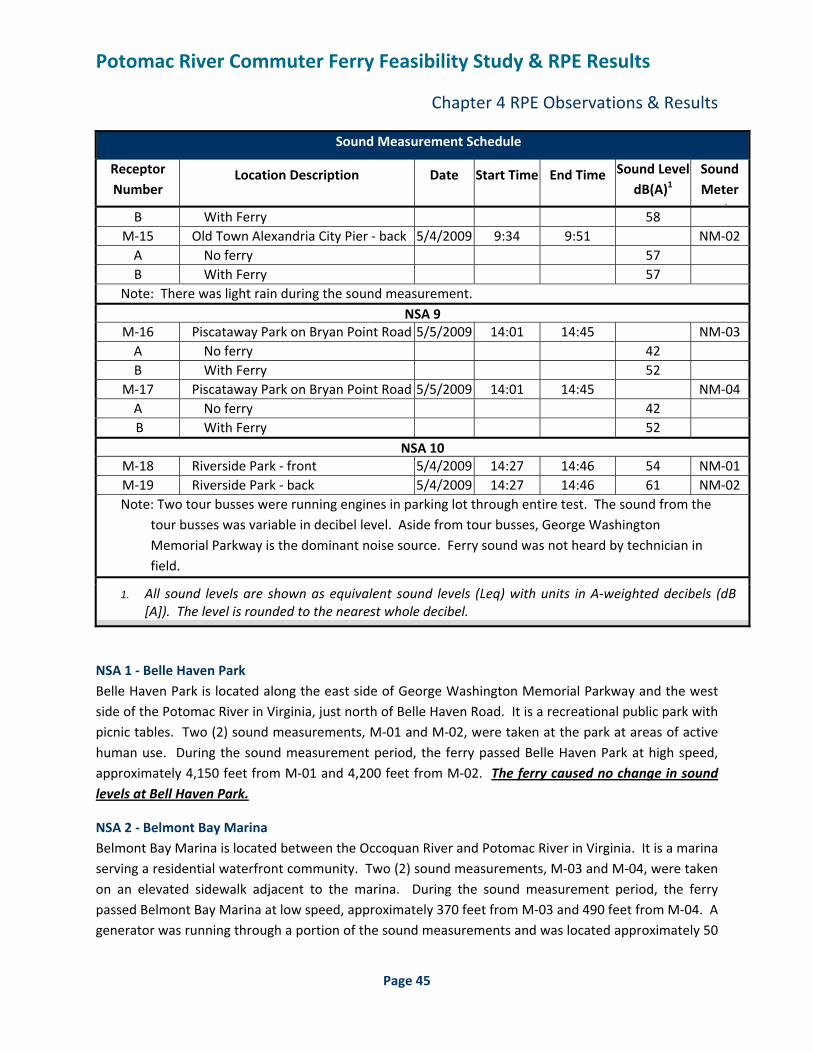
Potomac River Commuter Ferry Feasibility Study & RPE Results
Chapter 4 RPE Observations & Results
Page 45
Sound Measurement Schedule
Receptor Number
Location Description Date Start Time End Time Sound Level dB(A)1
Sound Meter N bB With Ferry 58
M‐15 Old Town Alexandria City Pier ‐ back 5/4/2009 9:34 9:51 NM‐02 A No ferry 57 B With Ferry 57
Note: There was light rain during the sound measurement. NSA 9
M‐16 Piscataway Park on Bryan Point Road 5/5/2009 14:01 14:45 NM‐03 A No ferry 42 B With Ferry 52
M‐17 Piscataway Park on Bryan Point Road 5/5/2009 14:01 14:45 NM‐04 A No ferry 42 B With Ferry 52
NSA 10M‐18 Riverside Park ‐ front 5/4/2009 14:27 14:46 54 NM‐01 M‐19 Riverside Park ‐ back 5/4/2009 14:27 14:46 61 NM‐02 Note: Two tour busses were running engines in parking lot through entire test. The sound from the
tour busses was variable in decibel level. Aside from tour busses, George Washington Memorial Parkway is the dominant noise source. Ferry sound was not heard by technician in field.
1. All sound levels are shown as equivalent sound levels (Leq) with units in A‐weighted decibels (dB [A]). The level is rounded to the nearest whole decibel.
NSA 1 ‐ Belle Haven Park Belle Haven Park is located along the east side of George Washington Memorial Parkway and the west side of the Potomac River in Virginia, just north of Belle Haven Road. It is a recreational public park with picnic tables. Two (2) sound measurements, M‐01 and M‐02, were taken at the park at areas of active human use. During the sound measurement period, the ferry passed Belle Haven Park at high speed, approximately 4,150 feet from M‐01 and 4,200 feet from M‐02. The ferry caused no change in sound levels at Bell Haven Park.
NSA 2 ‐ Belmont Bay Marina Belmont Bay Marina is located between the Occoquan River and Potomac River in Virginia. It is a marina serving a residential waterfront community. Two (2) sound measurements, M‐03 and M‐04, were taken on an elevated sidewalk adjacent to the marina. During the sound measurement period, the ferry passed Belmont Bay Marina at low speed, approximately 370 feet from M‐03 and 490 feet from M‐04. A generator was running through a portion of the sound measurements and was located approximately 50
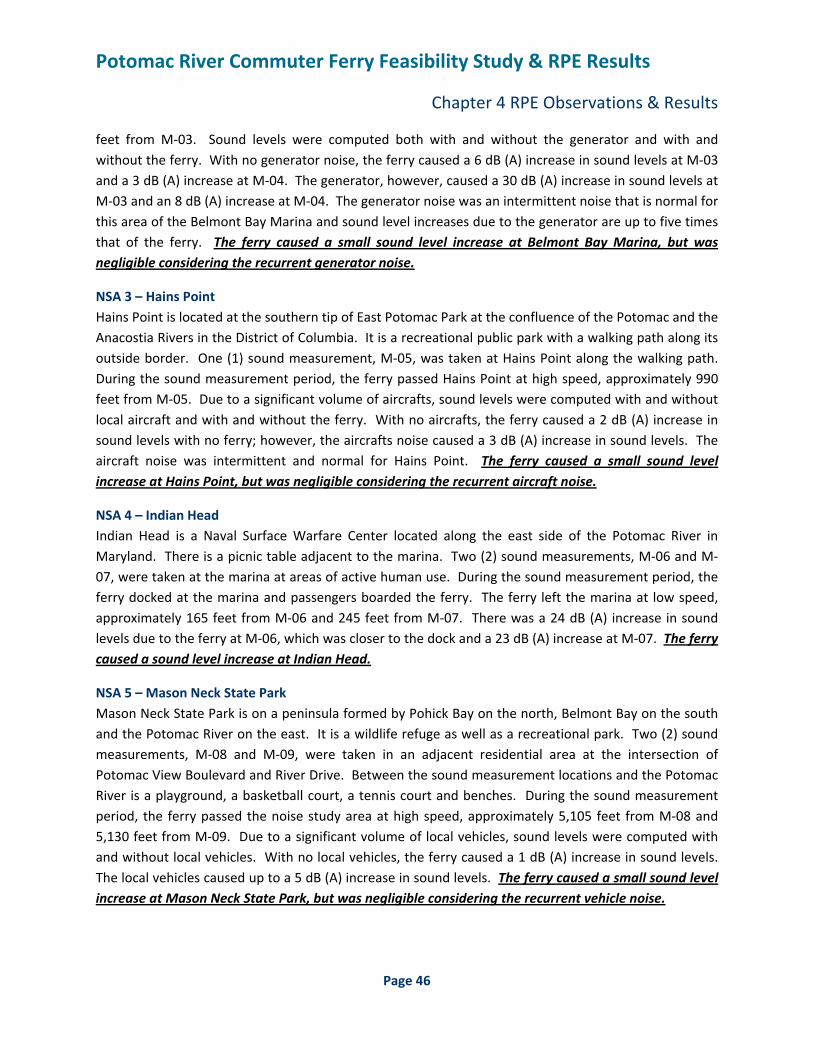
Potomac River Commuter Ferry Feasibility Study & RPE Results
Chapter 4 RPE Observations & Results
Page 46
feet from M‐03. Sound levels were computed both with and without the generator and with and without the ferry. With no generator noise, the ferry caused a 6 dB (A) increase in sound levels at M‐03 and a 3 dB (A) increase at M‐04. The generator, however, caused a 30 dB (A) increase in sound levels at M‐03 and an 8 dB (A) increase at M‐04. The generator noise was an intermittent noise that is normal for this area of the Belmont Bay Marina and sound level increases due to the generator are up to five times that of the ferry. The ferry caused a small sound level increase at Belmont Bay Marina, but was negligible considering the recurrent generator noise.
NSA 3 – Hains Point Hains Point is located at the southern tip of East Potomac Park at the confluence of the Potomac and the Anacostia Rivers in the District of Columbia. It is a recreational public park with a walking path along its outside border. One (1) sound measurement, M‐05, was taken at Hains Point along the walking path. During the sound measurement period, the ferry passed Hains Point at high speed, approximately 990 feet from M‐05. Due to a significant volume of aircrafts, sound levels were computed with and without local aircraft and with and without the ferry. With no aircrafts, the ferry caused a 2 dB (A) increase in sound levels with no ferry; however, the aircrafts noise caused a 3 dB (A) increase in sound levels. The aircraft noise was intermittent and normal for Hains Point. The ferry caused a small sound level increase at Hains Point, but was negligible considering the recurrent aircraft noise.
NSA 4 – Indian Head Indian Head is a Naval Surface Warfare Center located along the east side of the Potomac River in Maryland. There is a picnic table adjacent to the marina. Two (2) sound measurements, M‐06 and M‐07, were taken at the marina at areas of active human use. During the sound measurement period, the ferry docked at the marina and passengers boarded the ferry. The ferry left the marina at low speed, approximately 165 feet from M‐06 and 245 feet from M‐07. There was a 24 dB (A) increase in sound levels due to the ferry at M‐06, which was closer to the dock and a 23 dB (A) increase at M‐07. The ferry caused a sound level increase at Indian Head.
NSA 5 – Mason Neck State Park Mason Neck State Park is on a peninsula formed by Pohick Bay on the north, Belmont Bay on the south and the Potomac River on the east. It is a wildlife refuge as well as a recreational park. Two (2) sound measurements, M‐08 and M‐09, were taken in an adjacent residential area at the intersection of Potomac View Boulevard and River Drive. Between the sound measurement locations and the Potomac River is a playground, a basketball court, a tennis court and benches. During the sound measurement period, the ferry passed the noise study area at high speed, approximately 5,105 feet from M‐08 and 5,130 feet from M‐09. Due to a significant volume of local vehicles, sound levels were computed with and without local vehicles. With no local vehicles, the ferry caused a 1 dB (A) increase in sound levels. The local vehicles caused up to a 5 dB (A) increase in sound levels. The ferry caused a small sound level increase at Mason Neck State Park, but was negligible considering the recurrent vehicle noise.
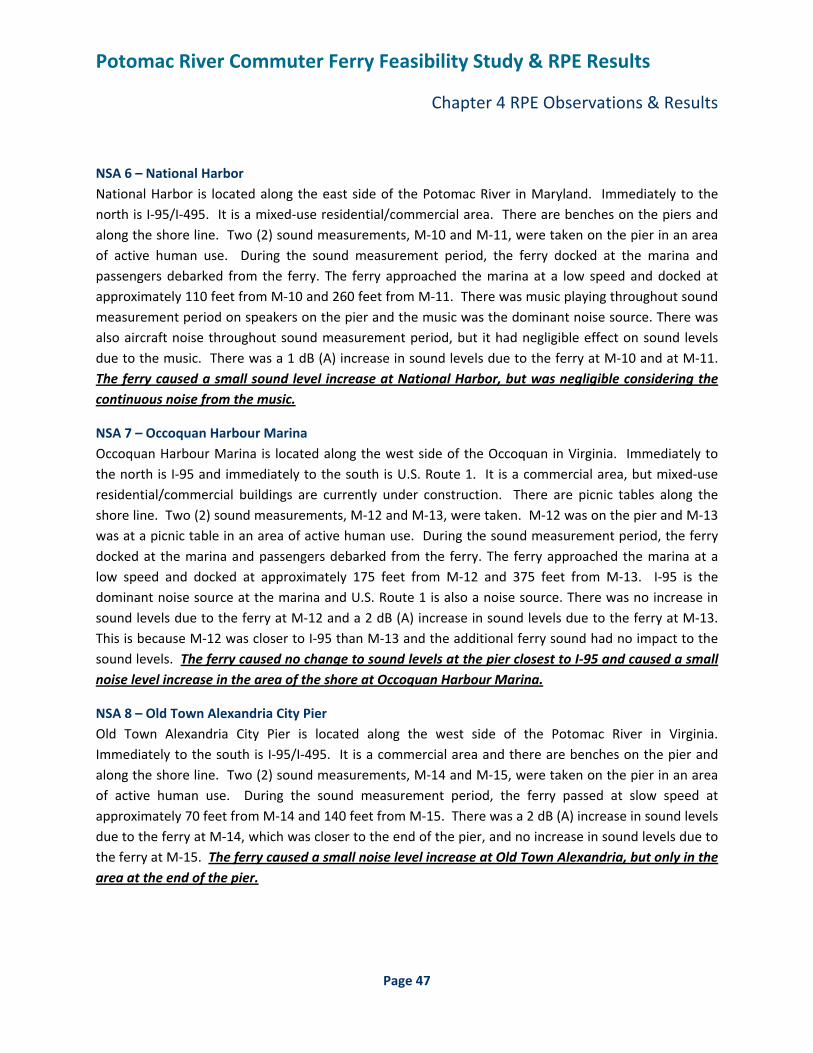
Potomac River Commuter Ferry Feasibility Study & RPE Results
Chapter 4 RPE Observations & Results
Page 47
NSA 6 – National Harbor National Harbor is located along the east side of the Potomac River in Maryland. Immediately to the north is I‐95/I‐495. It is a mixed‐use residential/commercial area. There are benches on the piers and along the shore line. Two (2) sound measurements, M‐10 and M‐11, were taken on the pier in an area of active human use. During the sound measurement period, the ferry docked at the marina and passengers debarked from the ferry. The ferry approached the marina at a low speed and docked at approximately 110 feet from M‐10 and 260 feet from M‐11. There was music playing throughout sound measurement period on speakers on the pier and the music was the dominant noise source. There was also aircraft noise throughout sound measurement period, but it had negligible effect on sound levels due to the music. There was a 1 dB (A) increase in sound levels due to the ferry at M‐10 and at M‐11. The ferry caused a small sound level increase at National Harbor, but was negligible considering the continuous noise from the music.
NSA 7 – Occoquan Harbour Marina Occoquan Harbour Marina is located along the west side of the Occoquan in Virginia. Immediately to the north is I‐95 and immediately to the south is U.S. Route 1. It is a commercial area, but mixed‐use residential/commercial buildings are currently under construction. There are picnic tables along the shore line. Two (2) sound measurements, M‐12 and M‐13, were taken. M‐12 was on the pier and M‐13 was at a picnic table in an area of active human use. During the sound measurement period, the ferry docked at the marina and passengers debarked from the ferry. The ferry approached the marina at a low speed and docked at approximately 175 feet from M‐12 and 375 feet from M‐13. I‐95 is the dominant noise source at the marina and U.S. Route 1 is also a noise source. There was no increase in sound levels due to the ferry at M‐12 and a 2 dB (A) increase in sound levels due to the ferry at M‐13. This is because M‐12 was closer to I‐95 than M‐13 and the additional ferry sound had no impact to the sound levels. The ferry caused no change to sound levels at the pier closest to I‐95 and caused a small noise level increase in the area of the shore at Occoquan Harbour Marina.
NSA 8 – Old Town Alexandria City Pier Old Town Alexandria City Pier is located along the west side of the Potomac River in Virginia. Immediately to the south is I‐95/I‐495. It is a commercial area and there are benches on the pier and along the shore line. Two (2) sound measurements, M‐14 and M‐15, were taken on the pier in an area of active human use. During the sound measurement period, the ferry passed at slow speed at approximately 70 feet from M‐14 and 140 feet from M‐15. There was a 2 dB (A) increase in sound levels due to the ferry at M‐14, which was closer to the end of the pier, and no increase in sound levels due to the ferry at M‐15. The ferry caused a small noise level increase at Old Town Alexandria, but only in the area at the end of the pier.

Potomac River Commuter Ferry Feasibility Study & RPE Results
Chapter 4 RPE Observations & Results
Page 48
NSA 9 – Piscataway Park on Bryan Point Road Piscataway Park is located along the east side of the Potomac River in Maryland. It is a recreational public park with picnic tables and a fishing pier. Two (2) sound measurements, M‐16 and M‐17, were taken on the fishing pier. During the sound measurement period, the ferry passed at high speed, approximately 1,330 feet from M‐16 and 1,385 feet from M‐17. There was a 10 dB (A) increase in sound levels due to the ferry at both M‐16 and M‐17. The ferry caused a sound level increase on the fishing pier at Piscataway Park on Bryan Point Road.
NSA 10 – Riverside Park Riverside Park is on the east side of George Washington Memorial Parkway and the west side of the Potomac River in Virginia. It is a recreational public park with picnic tables. Two (2) sound measurements, M‐18 and M‐19, were taken at the park at areas of active human use. During the sound measurement period, the ferry passed Riverside Park at high speed, approximately 4,320 feet from M‐18 and 4,370 feet from M‐19. Two tour busses were running engines in the parking lot throughout the entire test. The noise from the tour busses was variable in decibel level and is a common occurrence for the park. Aside from tour busses, George Washington Memorial Parkway is the dominant noise source. Ferry noise was not heard by the technicians in field. The ferry caused no change to sound levels at Riverside Park.
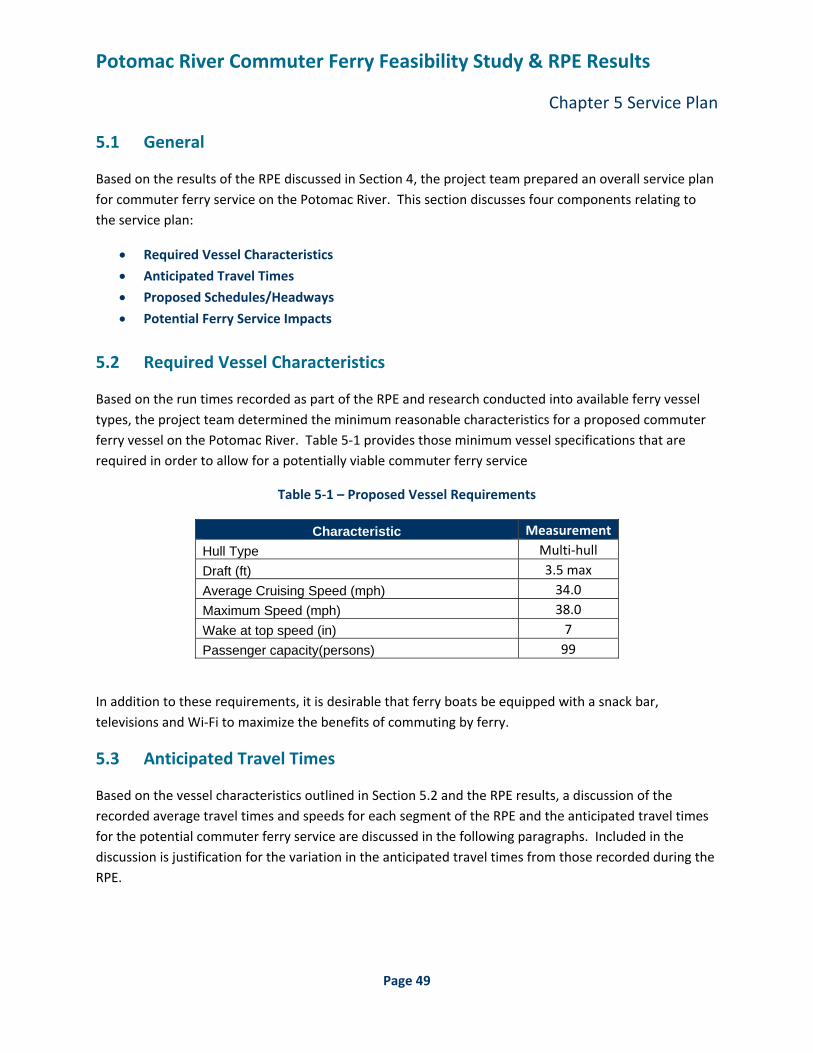
Potomac River Commuter Ferry Feasibility Study & RPE Results
Chapter 5 Service Plan
Page 49
5.1 General
Based on the results of the RPE discussed in Section 4, the project team prepared an overall service plan for commuter ferry service on the Potomac River. This section discusses four components relating to the service plan:
• Required Vessel Characteristics
• Anticipated Travel Times
• Proposed Schedules/Headways
• Potential Ferry Service Impacts
5.2 Required Vessel Characteristics
Based on the run times recorded as part of the RPE and research conducted into available ferry vessel types, the project team determined the minimum reasonable characteristics for a proposed commuter ferry vessel on the Potomac River. Table 5‐1 provides those minimum vessel specifications that are required in order to allow for a potentially viable commuter ferry service
Table 5‐1 – Proposed Vessel Requirements
Characteristic Measurement Hull Type Multi‐hull Draft (ft) 3.5 max Average Cruising Speed (mph) 34.0 Maximum Speed (mph) 38.0 Wake at top speed (in) 7 Passenger capacity(persons) 99
In addition to these requirements, it is desirable that ferry boats be equipped with a snack bar, televisions and Wi‐Fi to maximize the benefits of commuting by ferry.
5.3 Anticipated Travel Times
Based on the vessel characteristics outlined in Section 5.2 and the RPE results, a discussion of the recorded average travel times and speeds for each segment of the RPE and the anticipated travel times for the potential commuter ferry service are discussed in the following paragraphs. Included in the discussion is justification for the variation in the anticipated travel times from those recorded during the RPE.
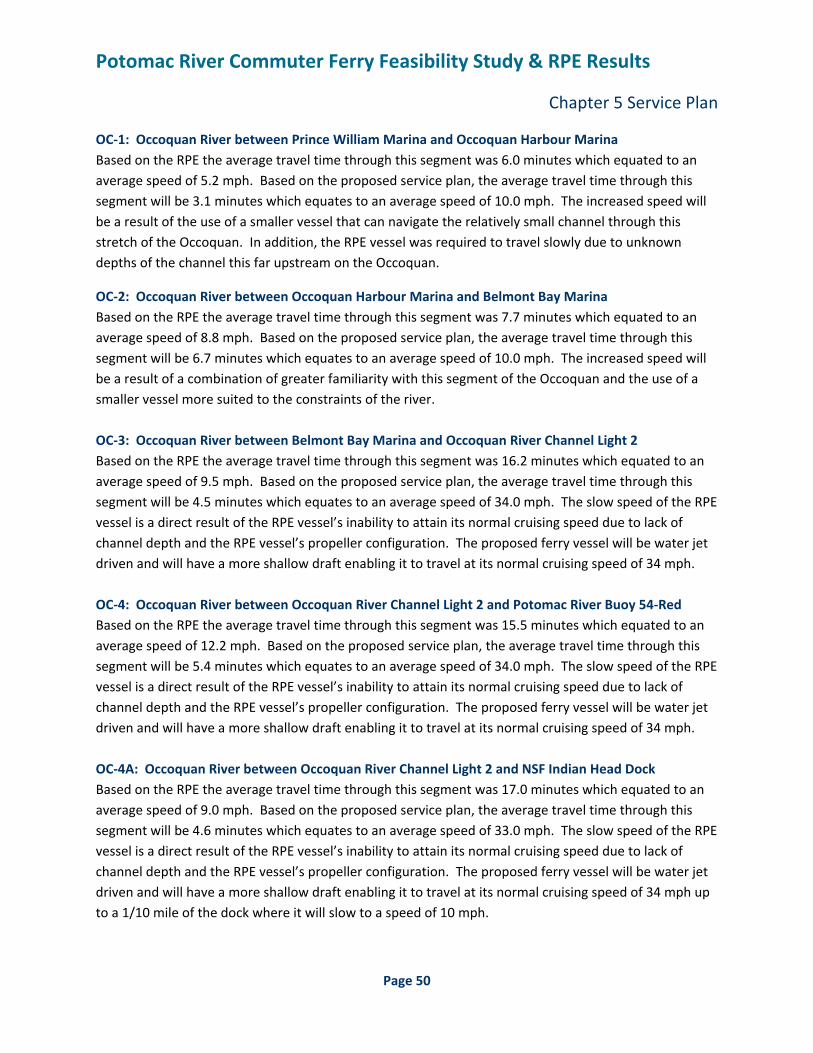
Potomac River Commuter Ferry Feasibility Study & RPE Results
Chapter 5 Service Plan
Page 50
OC‐1: Occoquan River between Prince William Marina and Occoquan Harbour Marina Based on the RPE the average travel time through this segment was 6.0 minutes which equated to an average speed of 5.2 mph. Based on the proposed service plan, the average travel time through this segment will be 3.1 minutes which equates to an average speed of 10.0 mph. The increased speed will be a result of the use of a smaller vessel that can navigate the relatively small channel through this stretch of the Occoquan. In addition, the RPE vessel was required to travel slowly due to unknown depths of the channel this far upstream on the Occoquan.
OC‐2: Occoquan River between Occoquan Harbour Marina and Belmont Bay Marina Based on the RPE the average travel time through this segment was 7.7 minutes which equated to an average speed of 8.8 mph. Based on the proposed service plan, the average travel time through this segment will be 6.7 minutes which equates to an average speed of 10.0 mph. The increased speed will be a result of a combination of greater familiarity with this segment of the Occoquan and the use of a smaller vessel more suited to the constraints of the river. OC‐3: Occoquan River between Belmont Bay Marina and Occoquan River Channel Light 2 Based on the RPE the average travel time through this segment was 16.2 minutes which equated to an average speed of 9.5 mph. Based on the proposed service plan, the average travel time through this segment will be 4.5 minutes which equates to an average speed of 34.0 mph. The slow speed of the RPE vessel is a direct result of the RPE vessel’s inability to attain its normal cruising speed due to lack of channel depth and the RPE vessel’s propeller configuration. The proposed ferry vessel will be water jet driven and will have a more shallow draft enabling it to travel at its normal cruising speed of 34 mph. OC‐4: Occoquan River between Occoquan River Channel Light 2 and Potomac River Buoy 54‐Red Based on the RPE the average travel time through this segment was 15.5 minutes which equated to an average speed of 12.2 mph. Based on the proposed service plan, the average travel time through this segment will be 5.4 minutes which equates to an average speed of 34.0 mph. The slow speed of the RPE vessel is a direct result of the RPE vessel’s inability to attain its normal cruising speed due to lack of channel depth and the RPE vessel’s propeller configuration. The proposed ferry vessel will be water jet driven and will have a more shallow draft enabling it to travel at its normal cruising speed of 34 mph. OC‐4A: Occoquan River between Occoquan River Channel Light 2 and NSF Indian Head Dock Based on the RPE the average travel time through this segment was 17.0 minutes which equated to an average speed of 9.0 mph. Based on the proposed service plan, the average travel time through this segment will be 4.6 minutes which equates to an average speed of 33.0 mph. The slow speed of the RPE vessel is a direct result of the RPE vessel’s inability to attain its normal cruising speed due to lack of channel depth and the RPE vessel’s propeller configuration. The proposed ferry vessel will be water jet driven and will have a more shallow draft enabling it to travel at its normal cruising speed of 34 mph up to a 1/10 mile of the dock where it will slow to a speed of 10 mph.
Potomac River Commuter Ferry Feasibility Study & RPE Results
Chapter 5 Service Plan
Page 51
OC‐4B: Occoquan River between Occoquan River Channel Light 2 and Potomac River Buoy 51‐Green Based on the RPE the average travel time through this segment was 12.0 minutes which equated to an average speed of 11.0 mph. Based on the proposed service plan, the average travel time through this segment will be 3.9 minutes which equates to an average speed of 34.0 mph. The slow speed of the RPE vessel is a direct result of the RPE vessel’s inability to attain its normal cruising speed due to lack of channel depth and the RPE vessel’s propeller configuration. The proposed ferry vessel will be water jet driven and will have a more shallow draft enabling it to travel at its normal cruising speed of 34 mph. PO‐1: Potomac River between Potomac River Buoy 43‐Green and Potomac River Buoy 47‐Green Based on the RPE the average travel time through this segment was 8.3 minutes which equated to an average speed of 33.3 mph. Based on the proposed service plan, the average travel time through this segment will be 8.1 minutes which equates to an average speed of 34.0 mph. The variation is due to the small difference in average speeds through this segment. PO‐1A: Potomac River between MCB‐Quantico Dock and Potomac River Buoy 43‐Green The estimated travel time through this segment was 3.5 minutes which equated to an average speed of 10 mph. Based on the proposed service plan, the average travel time through this segment will be 1.2 minutes which equates to an average speed of 30.0 mph. The variation is due to the ability of a smaller vessel to travel at its normal cruising speed of 34.0 mph to a point 1/10 of a mile from the dock where it will slow to an average speed of 10 mph. PO‐2: Potomac River between Potomac River Buoy 47‐Green and Potomac River Buoy 51‐Green Based on the RPE the average travel time through this segment was 3.5 minutes which equated to an average speed of 32.9 mph. Based on the proposed service plan, the average travel time through this segment will be 3.4 minutes which equates to an average speed of 34.0 mph. The variation is due to the small difference in average speeds through this segment. PO‐2A: Potomac River between Harbor Station Dock and Potomac River Buoy 47‐Green The estimated travel time through this segment was 6.5 minutes which equated to an average speed of 20.5 mph. Based on the proposed service plan, the average travel time through this segment will be 4.0 minutes which equates to an average speed of 33.0 mph. The variation is due to the ability of a smaller vessel to travel at its normal cruising speed of 34.0 mph to a point 1/10 of a mile from the dock where it will slow to an average speed of 10 mph. PO‐3: Potomac River between Potomac River Buoy 51‐Green and Potomac River Buoy 54‐Red Based on the RPE the average travel time through this segment was 3.0 minutes which equated to an average speed of 36.2 mph. Based on the proposed service plan, the average travel time through this segment will be 3.2 minutes which equates to an average speed of 34.0 mph. The variation is due to the small difference in average speeds through this segment.
Potomac River Commuter Ferry Feasibility Study & RPE Results
Chapter 5 Service Plan
Page 52
PO‐3A: Potomac River between Potomac River Buoy 51‐Green and NSF‐Indian Head Dock The estimated travel time through this segment was 4.0 minutes which equated to an average speed of 15.2 mph. Based on the proposed service plan, the average travel time through this segment will be 1.9 minutes which equates to an average speed of 32.0 mph. The variation is due to the ability of a smaller vessel to travel at its normal cruising speed of 34.0 mph to a point 1/10 of a mile from the dock where it will slow to an average speed of 10 mph. PO‐3B: Potomac River between NSF‐Indian Head Dock and Potomac River Buoy 54‐Red Based on the RPE the average travel time through this segment was 4.5 minutes which equated to an average speed of 12.4 mph. Based on the proposed service plan, the average travel time through this segment will be 1.8 minutes which equates to an average speed of 31.0 mph. The variation is due to the ability of a smaller vessel to travel at its normal cruising speed of 34.0 mph to a point 1/10 of a mile from the dock where it will slow to an average speed of 10 mph. PO‐4: Potomac River between Potomac River Buoy 54‐Red and Potomac River Buoy 64‐Red Based on the RPE the average travel time through this segment was 11.7 minutes which equated to an average speed of 31.3 mph. Based on the proposed service plan, the average travel time through this segment will be 10.8 minutes which equates to an average speed of 34.0 mph. The variation is due to the small difference in average speeds through this segment. PO‐4A: Potomac River between Fort Belvoir Dock on Gunston Cove and Potomac River Buoy 64‐Red The estimated travel time through this segment was 3.0 minutes which equated to an average speed of 13.6 mph. Based on the proposed service plan, the average travel time through this segment will be 1.4 minutes which equates to an average speed of 29.0 mph. The variation is due to the ability of a smaller vessel to travel at its normal cruising speed of 34.0 mph to a point 1/10 of a mile from the dock where it will slow to an average speed of 10 mph. PO‐5: Potomac River between Potomac River Buoy 64‐Red and Potomac River Buoy 67‐Green Based on the RPE the average travel time through this segment was 3.5 minutes which equated to an average speed of 34.5 mph. Based on the proposed service plan, the average travel time through this segment will also be 3.5 minutes as a result of the recorded and anticipated speeds being equal PO‐5A: Potomac River between Marshall Hall Dock and Potomac River Buoy 67‐Green The estimated travel time through this segment was 2.0 minutes which equated to an average speed of 11.7 mph. Based on the proposed service plan, the average travel time through this segment will be also be 2.0 minutes as a result of the estimated and anticipated speeds being equal. PO‐6: Potomac River between Potomac River Buoy 67‐Green & National Harbor Channel Marker 2‐R Based on the RPE the average travel time through this segment was 16.7 minutes which equated to an average speed of 30.8 mph. Based on the proposed service plan, the average travel time through this
Potomac River Commuter Ferry Feasibility Study & RPE Results
Chapter 5 Service Plan
Page 53
segment will be 14.9 minutes which equates to an average speed of 34.0 mph. The variation is due to the small difference in average speeds through this segment. PO‐6A: Potomac River between National Harbor Channel Marker 2‐Red and National Harbor Dock Based on the RPE the average travel time through this segment was 8.2 minutes which equated to an average speed of 8.9 mph. Based on the proposed service plan, the average travel time through this segment will be 7.2 minutes which equates to an average speed of 10.0 mph. The variation is due to the small difference in average speeds through this segment. PO‐7: Potomac River between National Harbor Channel Marker 2‐R and Potomac River Buoy 94A‐R
Based on the RPE the average travel time through this segment was 2.0 minutes which equated to an average speed of 33.9 mph. Based on the proposed service plan, the average travel time through this segment will also be 2.0 as a result of the recorded and anticipated times being equal. PO‐8: Potomac River between Potomac River Buoy 94A‐Red and Alexandria Channel Buoy 2‐Red Based on the RPE the average travel time through this segment was 4.0 minutes which equated to an average speed of 9.9 mph. Based on the proposed service plan, the average travel time through this segment will be 1.1 minutes which equates to an average speed of 34.0 mph. The variation is a result of an assumed no wake zone waiver along the City of Alexandria portion of the Potomac River being obtained for the ferry service. PO‐9: Potomac River between Alexandria Channel Buoy 2‐Red and Alexandria Channel Buoy 6‐Red Based on the RPE the average travel time through this segment was 5.2 minutes which equated to an average speed of 11.0 mph. Based on the proposed service plan, the average travel time through this segment will be 1.6 minutes which equates to an average speed of 34.0 mph. The variation is a result of an assumed no wake zone waiver along the City of Alexandria portion of the Potomac River being obtained for the ferry service. PO‐9A: Potomac River between Alexandria Channel Buoy 2‐Red and Alexandria City Dock Based on the RPE the average travel time through this segment was 2.7 minutes which equated to an average speed of 7.7 mph. Based on the proposed service plan, the average travel time through this segment will be 0.7 minutes which equates to an average speed of 28.0 mph. The variation is a result of an assumed no wake zone waiver along the City of Alexandria portion of the Potomac River being obtained for the ferry service as well as the proposed smaller vessel’s ability to travel at its normal cruising speed of 34 mph up to a point 1/10 mile away from the dock where it will slow to 10 mph. PO‐9B: Potomac River between Alexandria City Dock and Alexandria Channel Buoy 6‐Red Based on the RPE the average travel time through this segment was 4.3 minutes which equated to an average speed of 9.7 mph. Based on the proposed service plan, the average travel time through this
Potomac River Commuter Ferry Feasibility Study & RPE Results
Chapter 5 Service Plan
Page 54
segment will be 1.3 minutes which equates to an average speed of 32.0 mph. The variation is a result of an assumed no wake zone waiver along the City of Alexandria portion of the Potomac River being obtained for the ferry service as well as the proposed smaller vessel’s ability to travel at its normal cruising speed of 34 mph up to a point 1/10 mile away from the dock where it will slow to 10 mph. PO‐10: Potomac River between Alexandria Channel Buoy 6‐Red and Hanes Point Buoy 1‐Red Based on the RPE the average travel time through this segment was 7.3 minutes which equated to an average speed of 24.6 mph. Based on the proposed service plan, the average travel time through this segment will be 5.2 minutes which equates to an average speed of 34.0 mph. The variation is a result of the RPE vessel slowing at either end of this segment for no wake zones. With an assumed waiver of no‐wake zones being obtained for the ferry service, this speed constraint will be removed. PO‐10A: Potomac River between Alexandria Channel Buoy 6‐Red and National Airport Dock The estimated travel time through this segment was 12.0 minutes which equated to an average speed of 10.1 mph. Based on the proposed service plan, the average travel time through this segment will also be 12.0 minutes as a result of the estimated and anticipated speeds being equal. WC‐1: Washington Channel between Hanes Point Buoy 1‐Red and Washington Channel Docks Based on the RPE the average travel time through this segment was 7.3 minutes which equated to an average speed of 10.8 mph. Based on the proposed service plan, the average travel time through this segment will be 2.4 minutes which equates to an average speed of 33.0 mph. The variation is a result of an assumed no wake zone waiver along the Washington Channel being obtained for the ferry service as well as the proposed smaller vessel’s ability to travel at its normal cruising speed of 34 mph up to a point 1/10 mile away from the dock where it will slow to 10 mph. AN‐1: Anacostia River between Hanes Point Buoy 1‐Red and Washington Channel Buoy 4‐Red Based on the RPE the average travel time through this segment was 8.7 minutes which equated to an average speed of 9.2 mph. Based on the proposed service plan, the average travel time through this segment will be 2.3 minutes which equates to an average speed of 34.0 mph. The variation is a result of an assumed no wake zone waiver along the Anacostia River being obtained for the ferry service as well as the proposed smaller vessel’s ability to travel at its normal cruising speed of 34 mph up to a point 1/10 mile away from the dock where it will slow to 10 mph. AN‐1A: Anacostia River between Washington Channel Buoy 4‐Red and Nationals Stadium Dock The estimated travel time through this segment was 2.0 minutes which equated to an average speed of 4.5 mph. Based on the proposed service plan, the average travel time through this segment will be 0.5 minutes which equates to an average speed of 18 mph. The variation is a result of an assumed no wake zone waiver along the Anacostia River being obtained for the ferry service as well as the proposed smaller vessel’s ability to travel at its normal cruising speed of 34 mph up to a point 1/10 mile away from the dock where it will slow to 10 mph.
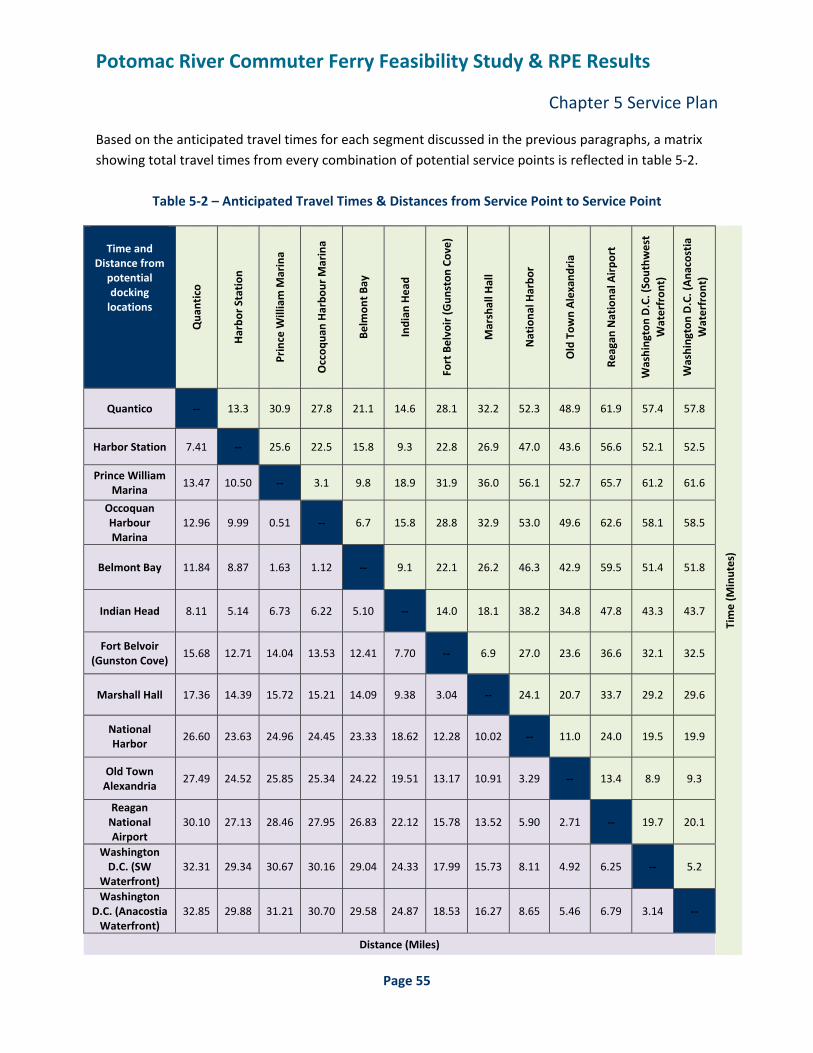
Potomac River Commuter Ferry Feasibility Study & RPE Results
Chapter 5 Service Plan
Page 55
Based on the anticipated travel times for each segment discussed in the previous paragraphs, a matrix showing total travel times from every combination of potential service points is reflected in table 5‐2.
Table 5‐2 – Anticipated Travel Times & Distances from Service Point to Service Point
Time and
Distance from potential docking locations
Qua
ntico
Harbo
r Station
Prince W
illiam M
arina
Occoq
uan Harbo
ur M
arina
Belm
ont B
ay
Indian
Head
Fort Belvoir (G
unston
Cove)
Marshall H
all
Nationa
l Harbo
r
Old Tow
n Alexand
ria
Reagan
Nationa
l Airpo
rt
Washington D.C. (So
uthw
est
Waterfron
t)
Washington D.C. (Ana
costia
Waterfron
t)
Time (M
inutes)
Quantico ‐‐ 13.3 30.9 27.8 21.1 14.6 28.1 32.2 52.3 48.9 61.9 57.4 57.8
Harbor Station 7.41 ‐‐ 25.6 22.5 15.8 9.3 22.8 26.9 47.0 43.6 56.6 52.1 52.5
Prince William Marina
13.47 10.50 ‐‐ 3.1 9.8 18.9 31.9 36.0 56.1 52.7 65.7 61.2 61.6
Occoquan Harbour Marina
12.96 9.99 0.51 ‐‐ 6.7 15.8 28.8 32.9 53.0 49.6 62.6 58.1 58.5
Belmont Bay 11.84 8.87 1.63 1.12 ‐‐ 9.1 22.1 26.2 46.3 42.9 59.5 51.4 51.8
Indian Head 8.11 5.14 6.73 6.22 5.10 ‐‐ 14.0 18.1 38.2 34.8 47.8 43.3 43.7
Fort Belvoir (Gunston Cove)
15.68 12.71 14.04 13.53 12.41 7.70 ‐‐ 6.9 27.0 23.6 36.6 32.1 32.5
Marshall Hall 17.36 14.39 15.72 15.21 14.09 9.38 3.04 ‐‐ 24.1 20.7 33.7 29.2 29.6
National Harbor
26.60 23.63 24.96 24.45 23.33 18.62 12.28 10.02 ‐‐ 11.0 24.0 19.5 19.9
Old Town Alexandria
27.49 24.52 25.85 25.34 24.22 19.51 13.17 10.91 3.29 ‐‐ 13.4 8.9 9.3
Reagan National Airport
30.10 27.13 28.46 27.95 26.83 22.12 15.78 13.52 5.90 2.71 ‐‐ 19.7 20.1
Washington D.C. (SW
Waterfront) 32.31 29.34 30.67 30.16 29.04 24.33 17.99 15.73 8.11 4.92 6.25 ‐‐ 5.2
Washington D.C. (Anacostia Waterfront)
32.85 29.88 31.21 30.70 29.58 24.87 18.53 16.27 8.65 5.46 6.79 3.14 ‐‐
Distance (Miles)
Potomac River Commuter Ferry Feasibility Study & RPE Results
Chapter 5 Service Plan
Page 56
5.4 Proposed Schedules/Headways
The two primary goals in preparing a proposed schedule for the commuter ferry service is to optimize the travel time and headways for commuters in Prince William County traveling to Washington D.C. and to extend commuter service to Maryland residents traveling to either Washington D.C. or across the Potomac to locations such as Fort Belvoir in Virginia. In attempting to attain both goals, the project team prepared two potential commuter ferry schedules. Other service plans extending service between Maryland and Virginia may also be feasible depending on service demand. Schedule “A” concentrates solely on providing ferry service originating out of Prince William County. Schedule “B” expands service to Maryland commuters. Details of each schedule can be found below.
Schedule A
Schedule A utilizes five vessels to maintain a headway of 30 minutes. The origin point for ferry service from Prince William County is assumed to be Occoquan Harbour Marina. By utilizing Occoquan Harbour Marina, potential origin points at Belmont Bay and Harbor Station can be substituted as travel times to Washington D.C. from these alternate locations are slightly less than from Occoquan Harbour Marina. As detailed in Table 5‐2 the potential travel time from Occoquan Harbour Marina to the Washington D.C. Anacostia River waterfront is 59 minutes. Table 5‐3 provides the details of Schedule A.
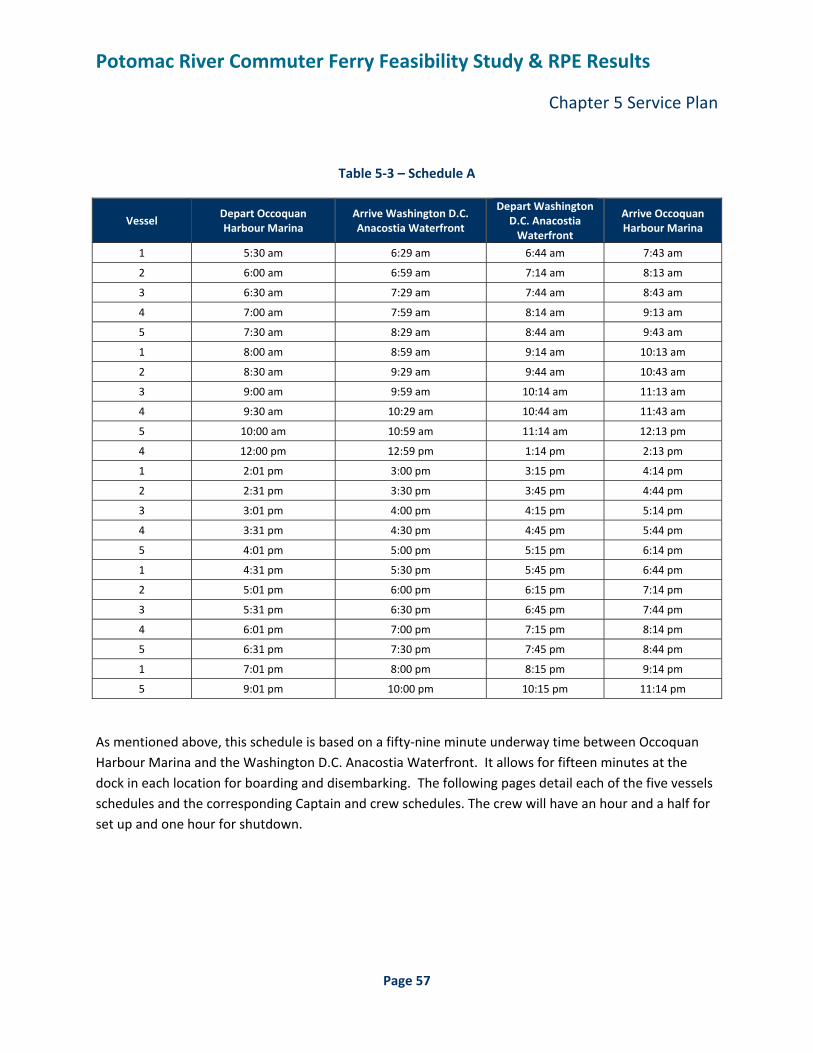
Potomac River Commuter Ferry Feasibility Study & RPE Results
Chapter 5 Service Plan
Page 57
Table 5‐3 – Schedule A
Vessel Depart Occoquan Harbour Marina
Arrive Washington D.C. Anacostia Waterfront
Depart Washington D.C. Anacostia Waterfront
Arrive Occoquan Harbour Marina
1 5:30 am 6:29 am 6:44 am 7:43 am
2 6:00 am 6:59 am 7:14 am 8:13 am
3 6:30 am 7:29 am 7:44 am 8:43 am
4 7:00 am 7:59 am 8:14 am 9:13 am
5 7:30 am 8:29 am 8:44 am 9:43 am
1 8:00 am 8:59 am 9:14 am 10:13 am
2 8:30 am 9:29 am 9:44 am 10:43 am
3 9:00 am 9:59 am 10:14 am 11:13 am
4 9:30 am 10:29 am 10:44 am 11:43 am
5 10:00 am 10:59 am 11:14 am 12:13 pm
4 12:00 pm 12:59 pm 1:14 pm 2:13 pm
1 2:01 pm 3:00 pm 3:15 pm 4:14 pm
2 2:31 pm 3:30 pm 3:45 pm 4:44 pm
3 3:01 pm 4:00 pm 4:15 pm 5:14 pm
4 3:31 pm 4:30 pm 4:45 pm 5:44 pm
5 4:01 pm 5:00 pm 5:15 pm 6:14 pm
1 4:31 pm 5:30 pm 5:45 pm 6:44 pm
2 5:01 pm 6:00 pm 6:15 pm 7:14 pm
3 5:31 pm 6:30 pm 6:45 pm 7:44 pm
4 6:01 pm 7:00 pm 7:15 pm 8:14 pm
5 6:31 pm 7:30 pm 7:45 pm 8:44 pm
1 7:01 pm 8:00 pm 8:15 pm 9:14 pm
5 9:01 pm 10:00 pm 10:15 pm 11:14 pm
As mentioned above, this schedule is based on a fifty‐nine minute underway time between Occoquan Harbour Marina and the Washington D.C. Anacostia Waterfront. It allows for fifteen minutes at the dock in each location for boarding and disembarking. The following pages detail each of the five vessels schedules and the corresponding Captain and crew schedules. The crew will have an hour and a half for set up and one hour for shutdown.
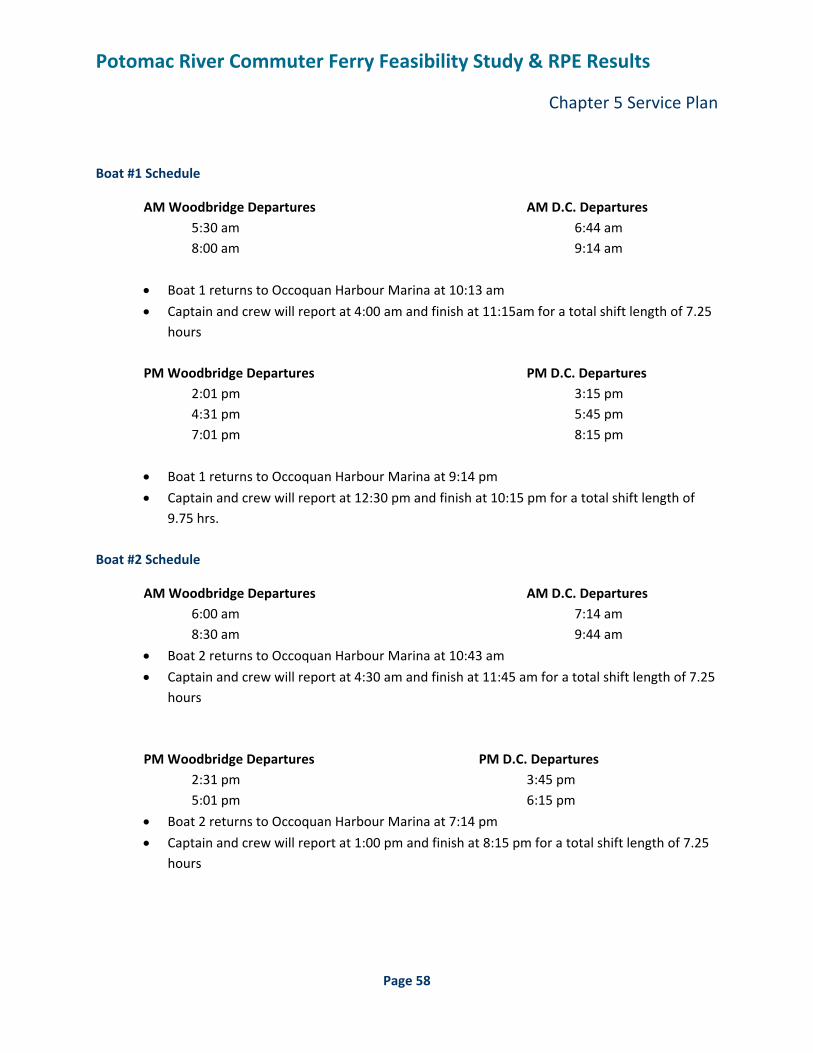
Potomac River Commuter Ferry Feasibility Study & RPE Results
Chapter 5 Service Plan
Page 58
Boat #1 Schedule
AM Woodbridge Departures AM D.C. Departures 5:30 am 6:44 am
8:00 am 9:14 am
• Boat 1 returns to Occoquan Harbour Marina at 10:13 am
• Captain and crew will report at 4:00 am and finish at 11:15am for a total shift length of 7.25 hours
PM Woodbridge Departures PM D.C. Departures
2:01 pm 3:15 pm 4:31 pm 5:45 pm 7:01 pm 8:15 pm
• Boat 1 returns to Occoquan Harbour Marina at 9:14 pm
• Captain and crew will report at 12:30 pm and finish at 10:15 pm for a total shift length of 9.75 hrs.
Boat #2 Schedule
AM Woodbridge Departures AM D.C. Departures 6:00 am 7:14 am 8:30 am 9:44 am
• Boat 2 returns to Occoquan Harbour Marina at 10:43 am
• Captain and crew will report at 4:30 am and finish at 11:45 am for a total shift length of 7.25 hours
PM Woodbridge Departures PM D.C. Departures 2:31 pm 3:45 pm 5:01 pm 6:15 pm
• Boat 2 returns to Occoquan Harbour Marina at 7:14 pm
• Captain and crew will report at 1:00 pm and finish at 8:15 pm for a total shift length of 7.25 hours
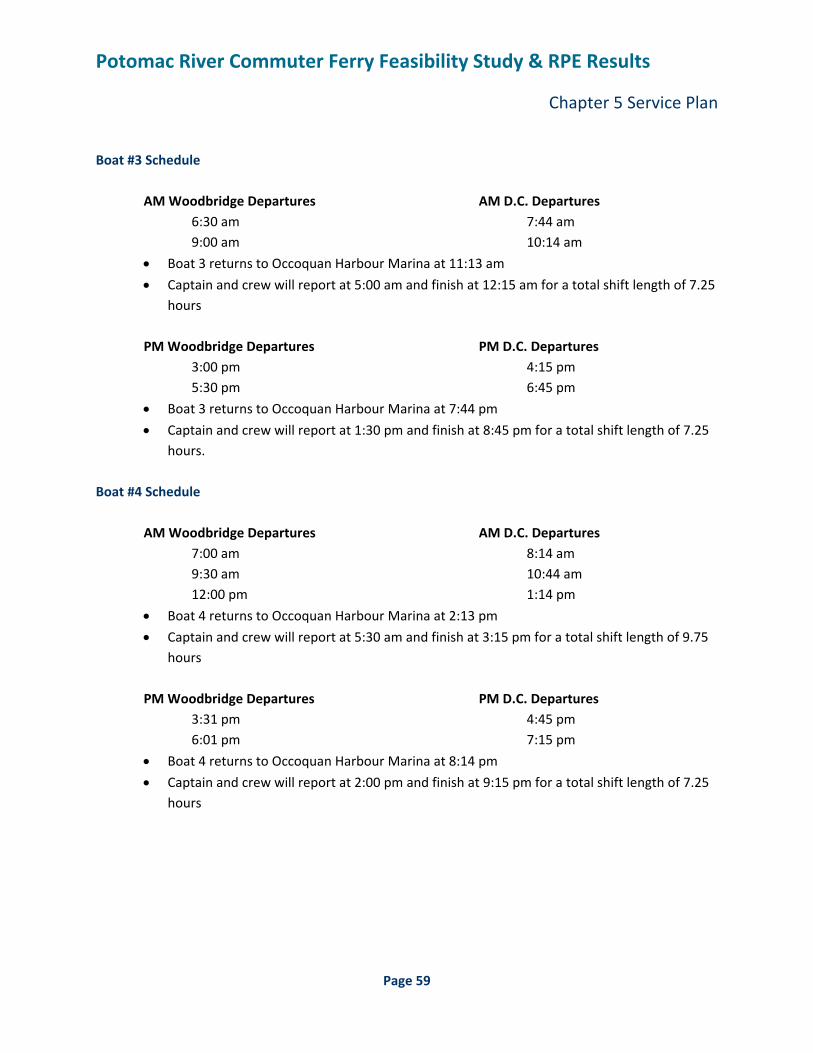
Potomac River Commuter Ferry Feasibility Study & RPE Results
Chapter 5 Service Plan
Page 59
Boat #3 Schedule AM Woodbridge Departures AM D.C. Departures 6:30 am 7:44 am 9:00 am 10:14 am
• Boat 3 returns to Occoquan Harbour Marina at 11:13 am
• Captain and crew will report at 5:00 am and finish at 12:15 am for a total shift length of 7.25 hours
PM Woodbridge Departures PM D.C. Departures 3:00 pm 4:15 pm 5:30 pm 6:45 pm
• Boat 3 returns to Occoquan Harbour Marina at 7:44 pm
• Captain and crew will report at 1:30 pm and finish at 8:45 pm for a total shift length of 7.25 hours.
Boat #4 Schedule AM Woodbridge Departures AM D.C. Departures 7:00 am 8:14 am 9:30 am 10:44 am 12:00 pm 1:14 pm
• Boat 4 returns to Occoquan Harbour Marina at 2:13 pm
• Captain and crew will report at 5:30 am and finish at 3:15 pm for a total shift length of 9.75 hours
PM Woodbridge Departures PM D.C. Departures 3:31 pm 4:45 pm 6:01 pm 7:15 pm
• Boat 4 returns to Occoquan Harbour Marina at 8:14 pm
• Captain and crew will report at 2:00 pm and finish at 9:15 pm for a total shift length of 7.25 hours
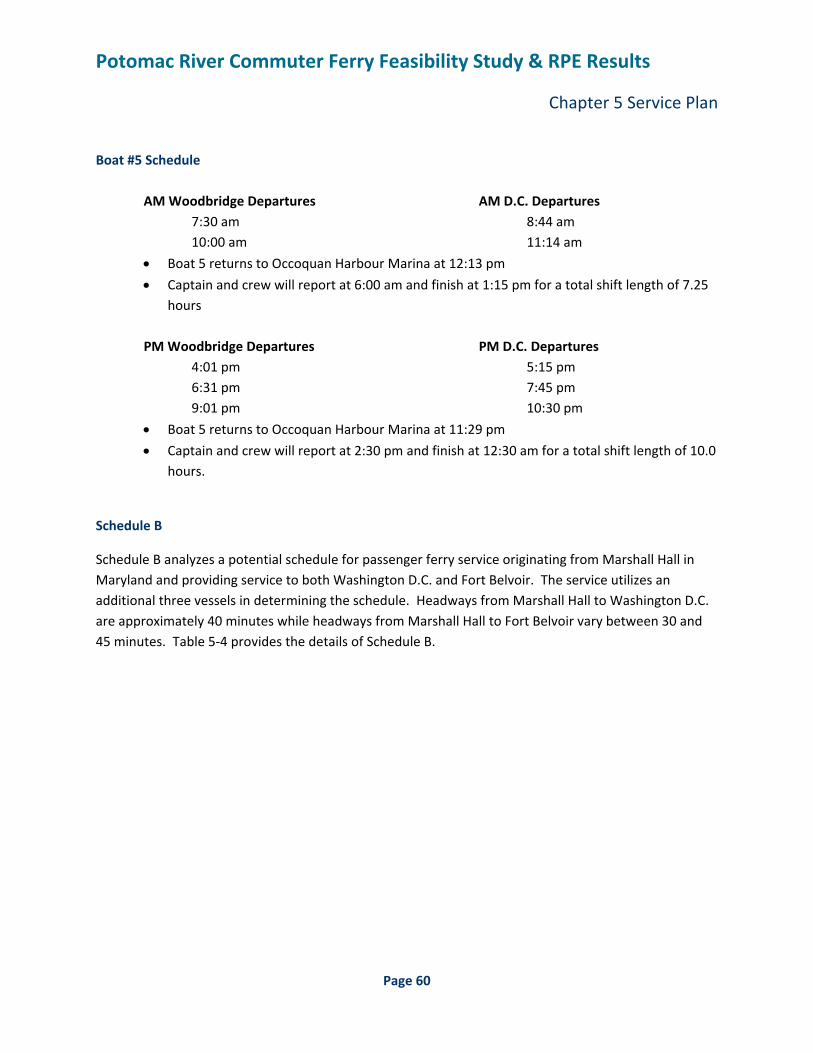
Potomac River Commuter Ferry Feasibility Study & RPE Results
Chapter 5 Service Plan
Page 60
Boat #5 Schedule AM Woodbridge Departures AM D.C. Departures 7:30 am 8:44 am 10:00 am 11:14 am
• Boat 5 returns to Occoquan Harbour Marina at 12:13 pm
• Captain and crew will report at 6:00 am and finish at 1:15 pm for a total shift length of 7.25 hours
PM Woodbridge Departures PM D.C. Departures 4:01 pm 5:15 pm 6:31 pm 7:45 pm 9:01 pm 10:30 pm
• Boat 5 returns to Occoquan Harbour Marina at 11:29 pm
• Captain and crew will report at 2:30 pm and finish at 12:30 am for a total shift length of 10.0 hours.
Schedule B
Schedule B analyzes a potential schedule for passenger ferry service originating from Marshall Hall in Maryland and providing service to both Washington D.C. and Fort Belvoir. The service utilizes an additional three vessels in determining the schedule. Headways from Marshall Hall to Washington D.C. are approximately 40 minutes while headways from Marshall Hall to Fort Belvoir vary between 30 and 45 minutes. Table 5‐4 provides the details of Schedule B.
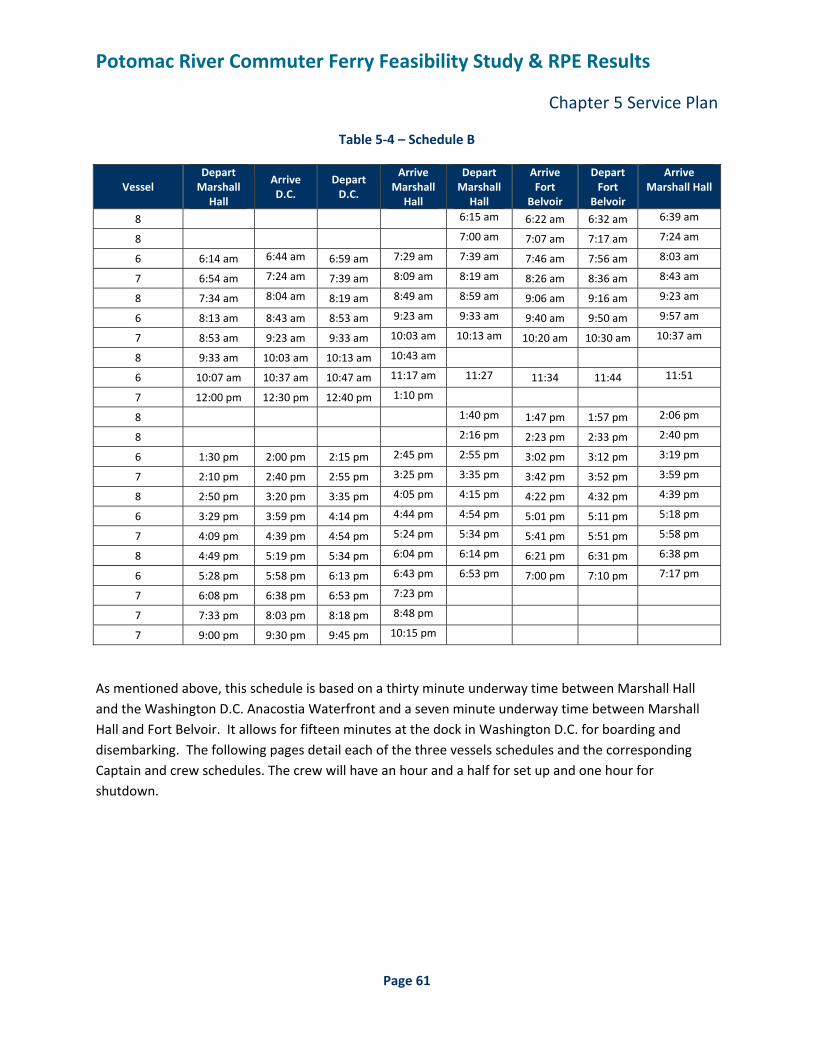
Potomac River Commuter Ferry Feasibility Study & RPE Results
Chapter 5 Service Plan
Page 61
Table 5‐4 – Schedule B
Vessel Depart Marshall
Hall
Arrive D.C.
Depart D.C.
Arrive Marshall Hall
Depart Marshall Hall
Arrive Fort
Belvoir
Depart Fort
Belvoir
Arrive Marshall Hall
8 6:15 am 6:22 am 6:32 am 6:39 am
8 7:00 am 7:07 am 7:17 am 7:24 am
6 6:14 am 6:44 am 6:59 am 7:29 am 7:39 am 7:46 am 7:56 am 8:03 am
7 6:54 am 7:24 am 7:39 am 8:09 am 8:19 am 8:26 am 8:36 am 8:43 am
8 7:34 am 8:04 am 8:19 am 8:49 am 8:59 am 9:06 am 9:16 am 9:23 am
6 8:13 am 8:43 am 8:53 am 9:23 am 9:33 am 9:40 am 9:50 am 9:57 am
7 8:53 am 9:23 am 9:33 am 10:03 am 10:13 am 10:20 am 10:30 am 10:37 am
8 9:33 am 10:03 am 10:13 am 10:43 am
6 10:07 am 10:37 am 10:47 am 11:17 am 11:27 11:34 11:44 11:51
7 12:00 pm 12:30 pm 12:40 pm 1:10 pm
8 1:40 pm 1:47 pm 1:57 pm 2:06 pm
8 2:16 pm 2:23 pm 2:33 pm 2:40 pm
6 1:30 pm 2:00 pm 2:15 pm 2:45 pm 2:55 pm 3:02 pm 3:12 pm 3:19 pm
7 2:10 pm 2:40 pm 2:55 pm 3:25 pm 3:35 pm 3:42 pm 3:52 pm 3:59 pm
8 2:50 pm 3:20 pm 3:35 pm 4:05 pm 4:15 pm 4:22 pm 4:32 pm 4:39 pm
6 3:29 pm 3:59 pm 4:14 pm 4:44 pm 4:54 pm 5:01 pm 5:11 pm 5:18 pm
7 4:09 pm 4:39 pm 4:54 pm 5:24 pm 5:34 pm 5:41 pm 5:51 pm 5:58 pm
8 4:49 pm 5:19 pm 5:34 pm 6:04 pm 6:14 pm 6:21 pm 6:31 pm 6:38 pm
6 5:28 pm 5:58 pm 6:13 pm 6:43 pm 6:53 pm 7:00 pm 7:10 pm 7:17 pm
7 6:08 pm 6:38 pm 6:53 pm 7:23 pm
7 7:33 pm 8:03 pm 8:18 pm 8:48 pm
7 9:00 pm 9:30 pm 9:45 pm 10:15 pm
As mentioned above, this schedule is based on a thirty minute underway time between Marshall Hall and the Washington D.C. Anacostia Waterfront and a seven minute underway time between Marshall Hall and Fort Belvoir. It allows for fifteen minutes at the dock in Washington D.C. for boarding and disembarking. The following pages detail each of the three vessels schedules and the corresponding Captain and crew schedules. The crew will have an hour and a half for set up and one hour for shutdown.
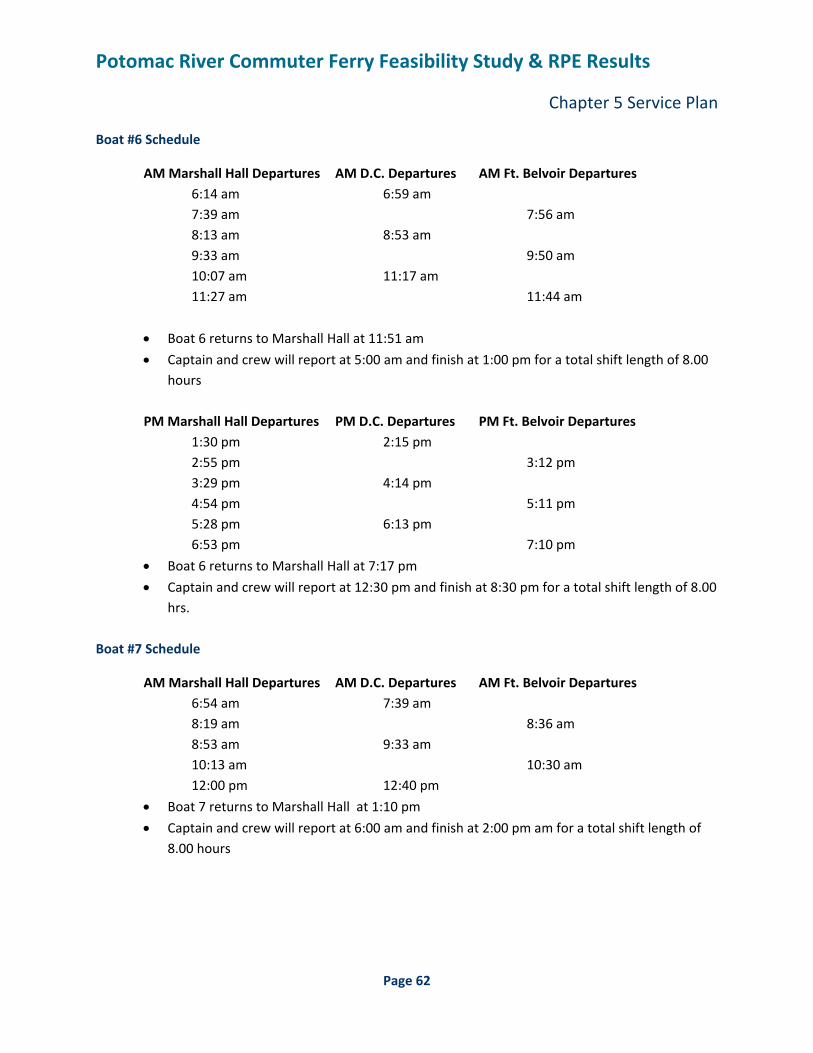
Potomac River Commuter Ferry Feasibility Study & RPE Results
Chapter 5 Service Plan
Page 62
Boat #6 Schedule
AM Marshall Hall Departures AM D.C. Departures AM Ft. Belvoir Departures 6:14 am 6:59 am
7:39 am 7:56 am 8:13 am 8:53 am 9:33 am 9:50 am 10:07 am 11:17 am 11:27 am 11:44 am
• Boat 6 returns to Marshall Hall at 11:51 am
• Captain and crew will report at 5:00 am and finish at 1:00 pm for a total shift length of 8.00 hours
PM Marshall Hall Departures PM D.C. Departures PM Ft. Belvoir Departures
1:30 pm 2:15 pm 2:55 pm 3:12 pm 3:29 pm 4:14 pm 4:54 pm 5:11 pm 5:28 pm 6:13 pm 6:53 pm 7:10 pm
• Boat 6 returns to Marshall Hall at 7:17 pm
• Captain and crew will report at 12:30 pm and finish at 8:30 pm for a total shift length of 8.00 hrs.
Boat #7 Schedule
AM Marshall Hall Departures AM D.C. Departures AM Ft. Belvoir Departures 6:54 am 7:39 am 8:19 am 8:36 am 8:53 am 9:33 am 10:13 am 10:30 am 12:00 pm 12:40 pm
• Boat 7 returns to Marshall Hall at 1:10 pm
• Captain and crew will report at 6:00 am and finish at 2:00 pm am for a total shift length of 8.00 hours
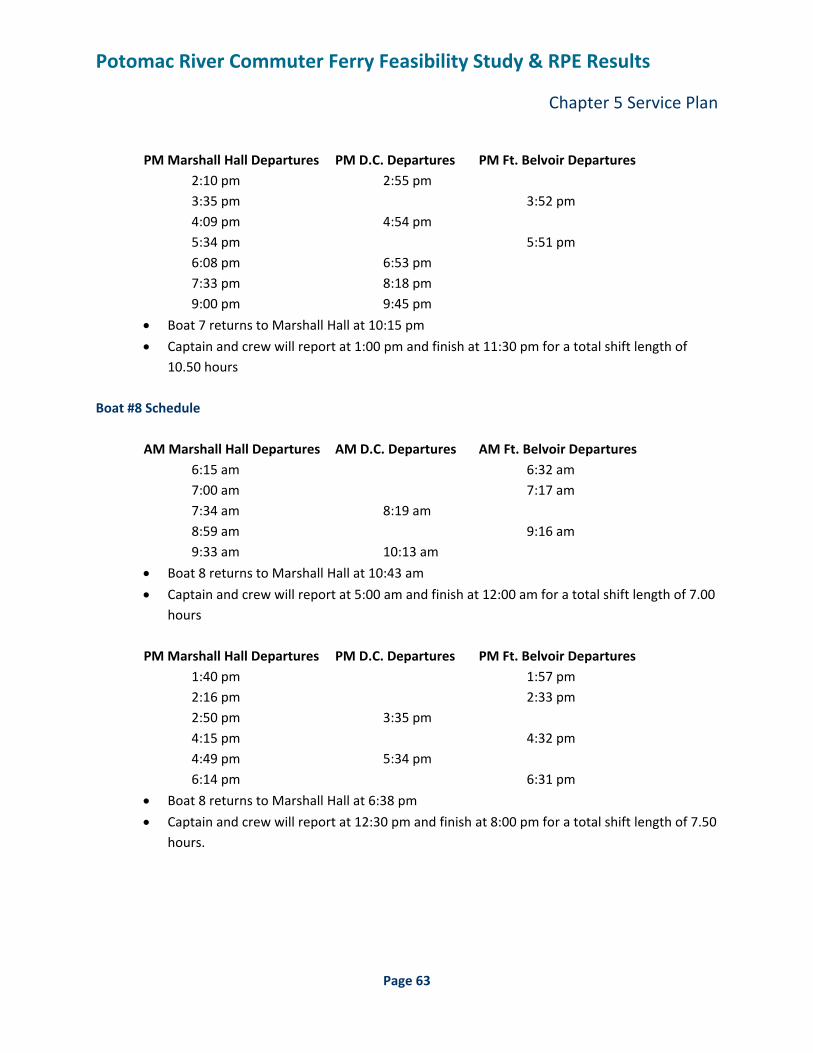
Potomac River Commuter Ferry Feasibility Study & RPE Results
Chapter 5 Service Plan
Page 63
PM Marshall Hall Departures PM D.C. Departures PM Ft. Belvoir Departures
2:10 pm 2:55 pm 3:35 pm 3:52 pm 4:09 pm 4:54 pm 5:34 pm 5:51 pm 6:08 pm 6:53 pm 7:33 pm 8:18 pm 9:00 pm 9:45 pm
• Boat 7 returns to Marshall Hall at 10:15 pm
• Captain and crew will report at 1:00 pm and finish at 11:30 pm for a total shift length of 10.50 hours
Boat #8 Schedule AM Marshall Hall Departures AM D.C. Departures AM Ft. Belvoir Departures 6:15 am 6:32 am 7:00 am 7:17 am 7:34 am 8:19 am 8:59 am 9:16 am 9:33 am 10:13 am
• Boat 8 returns to Marshall Hall at 10:43 am
• Captain and crew will report at 5:00 am and finish at 12:00 am for a total shift length of 7.00 hours
PM Marshall Hall Departures PM D.C. Departures PM Ft. Belvoir Departures
1:40 pm 1:57 pm 2:16 pm 2:33 pm 2:50 pm 3:35 pm 4:15 pm 4:32 pm 4:49 pm 5:34 pm 6:14 pm 6:31 pm
• Boat 8 returns to Marshall Hall at 6:38 pm
• Captain and crew will report at 12:30 pm and finish at 8:00 pm for a total shift length of 7.50 hours.
Potomac River Commuter Ferry Feasibility Study & RPE Results
Chapter 5 Service Plan
Page 64
5.4 Potential Commuter Ferry Service Impacts
As with any mode of public transportation, a key component in determining the operation’s success is the ability of the system to remain on schedule. Through an analysis of the route proving exercise as well as interviews with those familiar with the Potomac River, the project team has identified several factors that could potentially impact the ability of the commuter ferry service to remain on schedule. The potential impacts discussed in this section include high waves, fog, icing, debris, mechanical failures and recreational boating. Each of these factors is discussed in some detail below.
High Waves
High waves on the Potomac River can and will impact ferry service from time to time. When sustained winds approach the 20 mph mark, wind driven waves can approach 2 to 3 feet in height on the upper Potomac while wind driven waves can approach 3 to 4 feet in height on the lower Potomac. Generally with predominant winds out of the south and west, wave action tends to be highest on the eastern side of the Potomac River. A vessel of the size being contemplated for this commuter ferry service would generally be rated to handle waves of up to 4 feet in height. Any predicted waves greater than this would require the cancellation of trips. This type of wave action is generally predicted several days in advance of its actual occurrence. As a result, contingency plans such as advanced notification of trip cancellations can be made to commuters allowing sufficient time to identify alternative means of transportation.
Fog
Fog is a relatively common occurrence on the Potomac River. Fog on the Potomac can occur at any time of the year given the correct circumstances. Generally fog occurs when the difference in temperature and dew point is less than 4 degrees Fahrenheit. Localized fog along the Potomac River corridor is often a result of a phenomenon called steam fog. Steam fog occurs when cool air passes over warmer ground or water. From a navigational standpoint, fog obscures a boat captain’s ability to visually identify potential hazards on the river such as other boaters, debris, etc. While the proposed ferry vessels would be equipped with radar, fog can reflect the radar signals allowing for limited effectiveness. As a result, the captain is generally obliged to slow the boat to a safe operating speed given the conditions. As with high waves, fog on the Potomac River can generally be predicted several days in advance of its actual occurrence. Given conditions where slower speeds are necessary, a contingency schedule should be in place to allow commuters to know ahead of time, what a slower speed schedule would mean to them.
Icing
Icing on the Potomac River will occur generally if there are more than 10 consecutive days of below freezing temperatures. From a review of past weather records, this event has not occurred in the last three years. Given the fact that water in the Potomac is flowing and the fact that the Potomac River in this region is tidal in nature, any ice formation on the river can be highly variable in depth. Generally ice
Potomac River Commuter Ferry Feasibility Study & RPE Results
Chapter 5 Service Plan
Page 65
will form first near the banks of the river and expand out towards the main channel where water temperature changes the slowest. Given the very low volume of commercial shipping on the Potomac River, there are no ice‐breaking ships nearby to clear a path for a potential commuter ferry service. Any significant formation of ice would result in trip cancellations. As with the fog and waves, icing on the Potomac River can be predicted several days ahead of its occurrence and passengers given advanced warning of trip cancellations giving them ample time to make alternate commuting arrangements.
Debris
During periods of heavy rain within the upper reaches of the Potomac River watershed, the river level rises and picks up logs and other debris previously deposited along its banks and carries it downstream into the area of commuter ferry operations. This phenomenon was witnessed during the third day of the RPE when a continuous band of debris was observed on the Potomac. The debris ranged from small sticks and refuse to large logs 15” in diameter and old appliances. As a result of the RPE vessel being propeller driven, there was a great deal of concern regarding potential damage to its propellers should they strike one of the larger logs or other debris. As a result of the proposed vessel being recommended to be water jet driven, there would be no propellers to be damaged. However, hull damage can still occur if a large enough piece of debris is struck while the vessel is traveling at high speed. As with the previous hazards discussed, the presence of debris can be predicted by reviewing precipitation potentials in the future. As with the occurrence of fog, a modified schedule to reflect slower travel times should be prepared to allow commuters to understand beforehand what the impact to their commute would be.
Mechanical Failures
With any motorized operation, the possibility of mechanical failure must always be considered. In the case of a potential ferry service, the project team recommends the inclusion of a spare vessel to be used in the case of mechanical failure.
Recreational Boaters
Recreational boaters have greatly varying degrees of experience. As a result, it may be necessary for a commuter ferry to slow in order to avoid a collision with a recreational boat. Because the most popular days for recreational boating are on the weekend, it is not anticipated that this potential hazard will have a large impact on schedule. It should be noted, however, that it is critical from a safety standpoint that all ferry boat captains be trained specifically in the proper procedures for interacting with recreational boaters.
Potomac River Commuter Ferry Feasibility Study & RPE Results
Chapter 6 Capital Costs
Page 66
6.1 General
In determining the likely capital costs associated with a proposed commuter ferry service, the project team separated the costs into two categories, costs associated with service point improvements and costs of transportation. The costs associated with service point improvements were then broken into two sub‐categories, land‐side capital costs and water‐side capital costs.
A summary of the costs included in each category is shown below.
Service Point Capital Costs Land‐Side
• Access road Improvements
• Parking Lot Improvements
• Signage
• Pedestrian Improvements
• Waiting Shelters Water‐Side
• Dock Construction
• Fuel Dispensing Equipment
• Dredging Transportation Capital Costs
• Vessel Purchase
• Ticketing System
6.2 Service Point Capital Costs
In estimating likely capital improvement costs associated with each potential service point, the project team reviewed each location and based on discussions with local officials, research and site visits determined the likely improvements necessary to allow ferry service to commence. In many cases, potential service points are located at existing marinas and other facilities owned and operated by private organizations. While these facilities offer an opportunity for smaller capital improvement costs, it is likely that that some long term leasing agreements will be necessary in order to utilize the facilities. Any fees associated with these lease agreements are classified as operational costs and are not included in this section.
The following pages include a description of the likely capital improvement costs associated with each potential service point as well as conceptual cost estimates.

Potomac River Commuter Ferry Feasibility Study & RPE Results
Chapter 6 Capital Costs
Page 67
Prince William Marina
Prince William Marina offers many existing land‐side and water‐side infrastructure improvements necessary for commuter ferry operations. Land‐side, an existing 584‐space commuter lot at the intersection of Old Bridge Road and Route 123 can be utilized for ferry service parking. It should be noted, however, that from observations, this lot tends to be 75% to 80% utilized. Ultimately, a parking garage may be necessary to accommodate the additional parking demand at this location. The cost of a parking garage is not included in this estimate. Pedestrian access improvements including modifications to meet ADA requirements would also be necessary to serve the ferry. Water‐side, existing docking and refueling facilities exist to serve the commuter ferry. Table 6‐1 provides a conceptual cost estimate of both land‐side and water‐side improvements necessary for commuter ferry operations.
Table 6‐1 – Prince William Marina Conceptual Capital Cost Estimate
Capital Cost Estimate
Item Unit Quantity Unit Price Extension Landside Infrastructure
Garage Parking Each 300 $20,000 $6,000,000 Ticket Booth Lump Sum 1 $25,000 $25,000 Waiting Shelters Each 3 $10,000 $30,000 Misc. Pedestrian Improvements Lump Sum 1 $140,000 $140,000 Subtotal – Landside Capital Costs $6,195,000
Waterside Infrastructure none n/a n/a n/a n/a Subtotal – Waterside Capital Costs $0 Total Capital Costs – Prince William Marina $6,195,000
Occoquan Harbour Marina
Like Prince William Marina, Occoquan Habour Marina offers many existing infrastructure improvements necessary for commuter ferry operations. The facility is located 0.3 miles from Route 1 and is accessed from Route 1 just north of the intersection of Route 1 and Route 123. Land‐side, an existing 217‐space parking lot, access road and pedestrian improvements exist on the property owned and operated by Occoquan Harbour Marina. From observations of the facility, the existing parking lot is primarily used on weekends and evenings by boaters and patrons of an on‐site restaurant leaving the lot largely empty during weekdays. However, additional parking capacity will likely be necessary. Water‐side, docks and fuel dispensing equipment exist on site. Only minimal capital improvements are necessary to utilize this marina as a commuter ferry stop. Table 6‐2 provides a conceptual cost estimate of both land‐side and water‐side improvements necessary for commuter ferry operations.
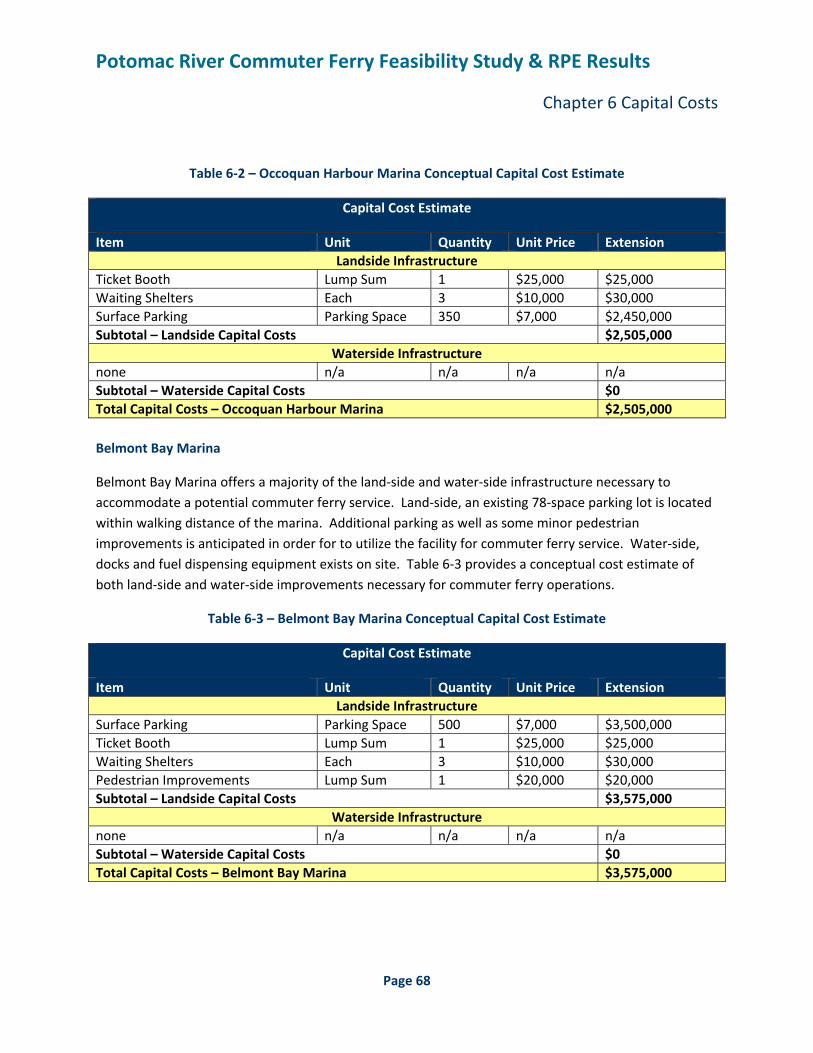
Potomac River Commuter Ferry Feasibility Study & RPE Results
Chapter 6 Capital Costs
Page 68
Table 6‐2 – Occoquan Harbour Marina Conceptual Capital Cost Estimate
Capital Cost Estimate
Item Unit Quantity Unit Price Extension Landside Infrastructure
Ticket Booth Lump Sum 1 $25,000 $25,000 Waiting Shelters Each 3 $10,000 $30,000 Surface Parking Parking Space 350 $7,000 $2,450,000 Subtotal – Landside Capital Costs $2,505,000
Waterside Infrastructure none n/a n/a n/a n/a Subtotal – Waterside Capital Costs $0 Total Capital Costs – Occoquan Harbour Marina $2,505,000 Belmont Bay Marina
Belmont Bay Marina offers a majority of the land‐side and water‐side infrastructure necessary to accommodate a potential commuter ferry service. Land‐side, an existing 78‐space parking lot is located within walking distance of the marina. Additional parking as well as some minor pedestrian improvements is anticipated in order for to utilize the facility for commuter ferry service. Water‐side, docks and fuel dispensing equipment exists on site. Table 6‐3 provides a conceptual cost estimate of both land‐side and water‐side improvements necessary for commuter ferry operations.
Table 6‐3 – Belmont Bay Marina Conceptual Capital Cost Estimate
Capital Cost Estimate
Item Unit Quantity Unit Price Extension Landside Infrastructure
Surface Parking Parking Space 500 $7,000 $3,500,000 Ticket Booth Lump Sum 1 $25,000 $25,000 Waiting Shelters Each 3 $10,000 $30,000 Pedestrian Improvements Lump Sum 1 $20,000 $20,000 Subtotal – Landside Capital Costs $3,575,000
Waterside Infrastructure none n/a n/a n/a n/a Subtotal – Waterside Capital Costs $0 Total Capital Costs – Belmont Bay Marina $3,575,000
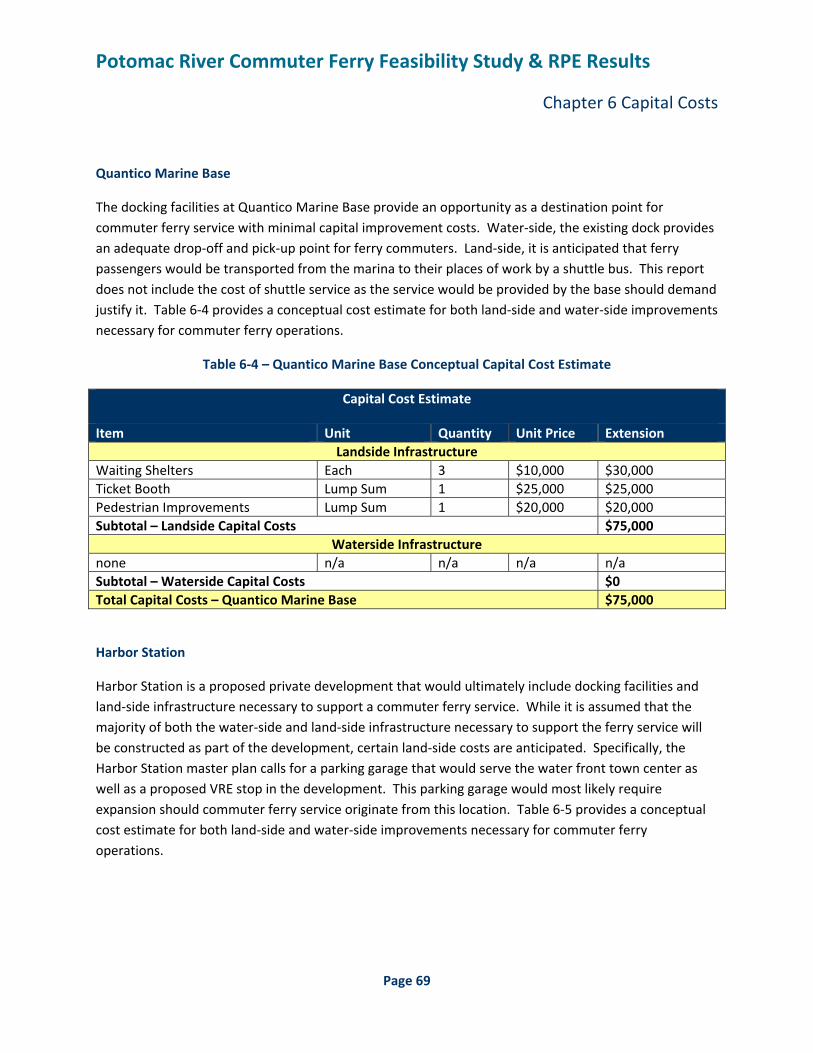
Potomac River Commuter Ferry Feasibility Study & RPE Results
Chapter 6 Capital Costs
Page 69
Quantico Marine Base
The docking facilities at Quantico Marine Base provide an opportunity as a destination point for commuter ferry service with minimal capital improvement costs. Water‐side, the existing dock provides an adequate drop‐off and pick‐up point for ferry commuters. Land‐side, it is anticipated that ferry passengers would be transported from the marina to their places of work by a shuttle bus. This report does not include the cost of shuttle service as the service would be provided by the base should demand justify it. Table 6‐4 provides a conceptual cost estimate for both land‐side and water‐side improvements necessary for commuter ferry operations.
Table 6‐4 – Quantico Marine Base Conceptual Capital Cost Estimate
Capital Cost Estimate
Item Unit Quantity Unit Price Extension Landside Infrastructure
Waiting Shelters Each 3 $10,000 $30,000 Ticket Booth Lump Sum 1 $25,000 $25,000 Pedestrian Improvements Lump Sum 1 $20,000 $20,000 Subtotal – Landside Capital Costs $75,000
Waterside Infrastructure none n/a n/a n/a n/a Subtotal – Waterside Capital Costs $0 Total Capital Costs – Quantico Marine Base $75,000
Harbor Station
Harbor Station is a proposed private development that would ultimately include docking facilities and land‐side infrastructure necessary to support a commuter ferry service. While it is assumed that the majority of both the water‐side and land‐side infrastructure necessary to support the ferry service will be constructed as part of the development, certain land‐side costs are anticipated. Specifically, the Harbor Station master plan calls for a parking garage that would serve the water front town center as well as a proposed VRE stop in the development. This parking garage would most likely require expansion should commuter ferry service originate from this location. Table 6‐5 provides a conceptual cost estimate for both land‐side and water‐side improvements necessary for commuter ferry operations.
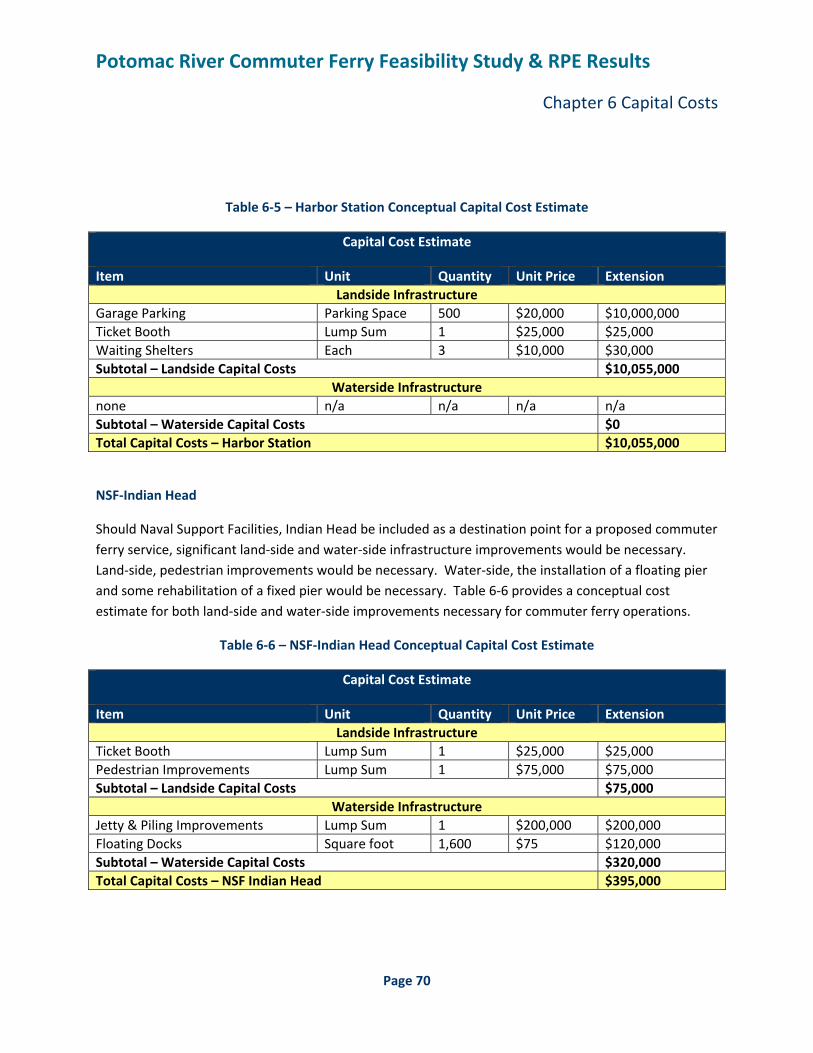
Potomac River Commuter Ferry Feasibility Study & RPE Results
Chapter 6 Capital Costs
Page 70
Table 6‐5 – Harbor Station Conceptual Capital Cost Estimate
Capital Cost Estimate
Item Unit Quantity Unit Price Extension Landside Infrastructure
Garage Parking Parking Space 500 $20,000 $10,000,000 Ticket Booth Lump Sum 1 $25,000 $25,000 Waiting Shelters Each 3 $10,000 $30,000 Subtotal – Landside Capital Costs $10,055,000
Waterside Infrastructure none n/a n/a n/a n/a Subtotal – Waterside Capital Costs $0 Total Capital Costs – Harbor Station $10,055,000
NSF‐Indian Head
Should Naval Support Facilities, Indian Head be included as a destination point for a proposed commuter ferry service, significant land‐side and water‐side infrastructure improvements would be necessary. Land‐side, pedestrian improvements would be necessary. Water‐side, the installation of a floating pier and some rehabilitation of a fixed pier would be necessary. Table 6‐6 provides a conceptual cost estimate for both land‐side and water‐side improvements necessary for commuter ferry operations.
Table 6‐6 – NSF‐Indian Head Conceptual Capital Cost Estimate
Capital Cost Estimate
Item Unit Quantity Unit Price Extension Landside Infrastructure
Ticket Booth Lump Sum 1 $25,000 $25,000 Pedestrian Improvements Lump Sum 1 $75,000 $75,000 Subtotal – Landside Capital Costs $75,000
Waterside Infrastructure Jetty & Piling Improvements Lump Sum 1 $200,000 $200,000 Floating Docks Square foot 1,600 $75 $120,000 Subtotal – Waterside Capital Costs $320,000 Total Capital Costs – NSF Indian Head $395,000
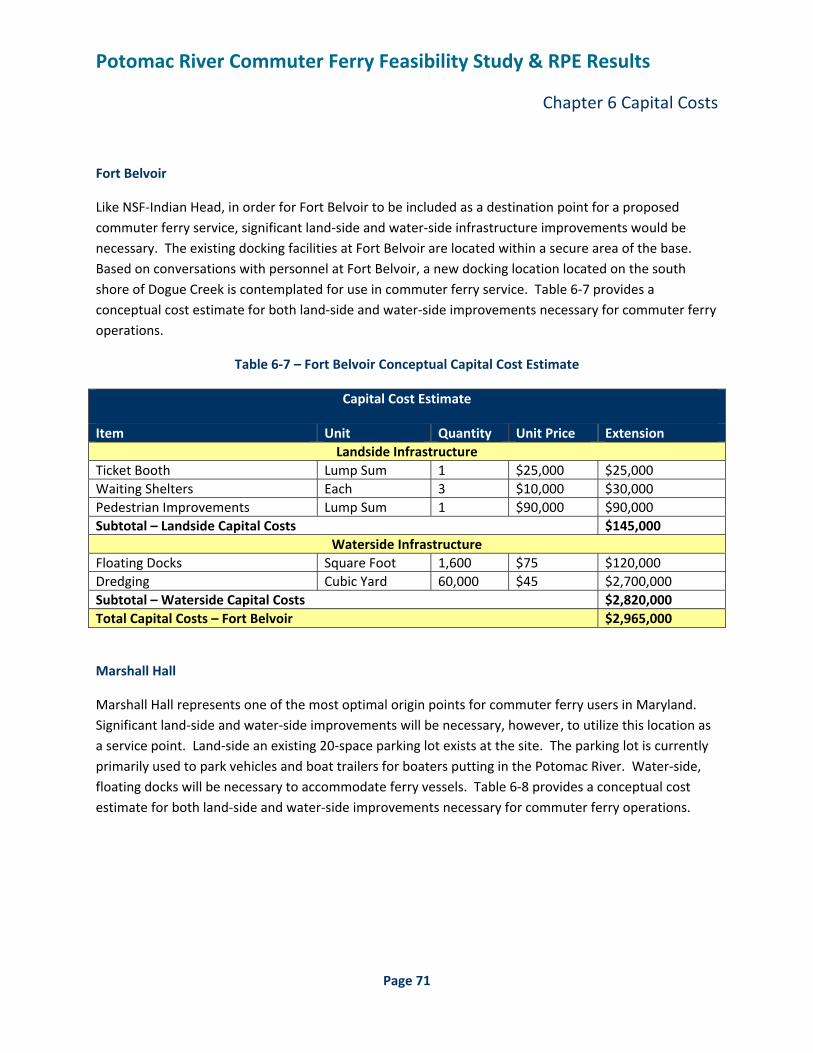
Potomac River Commuter Ferry Feasibility Study & RPE Results
Chapter 6 Capital Costs
Page 71
Fort Belvoir
Like NSF‐Indian Head, in order for Fort Belvoir to be included as a destination point for a proposed commuter ferry service, significant land‐side and water‐side infrastructure improvements would be necessary. The existing docking facilities at Fort Belvoir are located within a secure area of the base. Based on conversations with personnel at Fort Belvoir, a new docking location located on the south shore of Dogue Creek is contemplated for use in commuter ferry service. Table 6‐7 provides a conceptual cost estimate for both land‐side and water‐side improvements necessary for commuter ferry operations.
Table 6‐7 – Fort Belvoir Conceptual Capital Cost Estimate
Capital Cost Estimate
Item Unit Quantity Unit Price Extension Landside Infrastructure
Ticket Booth Lump Sum 1 $25,000 $25,000 Waiting Shelters Each 3 $10,000 $30,000 Pedestrian Improvements Lump Sum 1 $90,000 $90,000 Subtotal – Landside Capital Costs $145,000
Waterside Infrastructure Floating Docks Square Foot 1,600 $75 $120,000 Dredging Cubic Yard 60,000 $45 $2,700,000 Subtotal – Waterside Capital Costs $2,820,000 Total Capital Costs – Fort Belvoir $2,965,000
Marshall Hall
Marshall Hall represents one of the most optimal origin points for commuter ferry users in Maryland. Significant land‐side and water‐side improvements will be necessary, however, to utilize this location as a service point. Land‐side an existing 20‐space parking lot exists at the site. The parking lot is currently primarily used to park vehicles and boat trailers for boaters putting in the Potomac River. Water‐side, floating docks will be necessary to accommodate ferry vessels. Table 6‐8 provides a conceptual cost estimate for both land‐side and water‐side improvements necessary for commuter ferry operations.
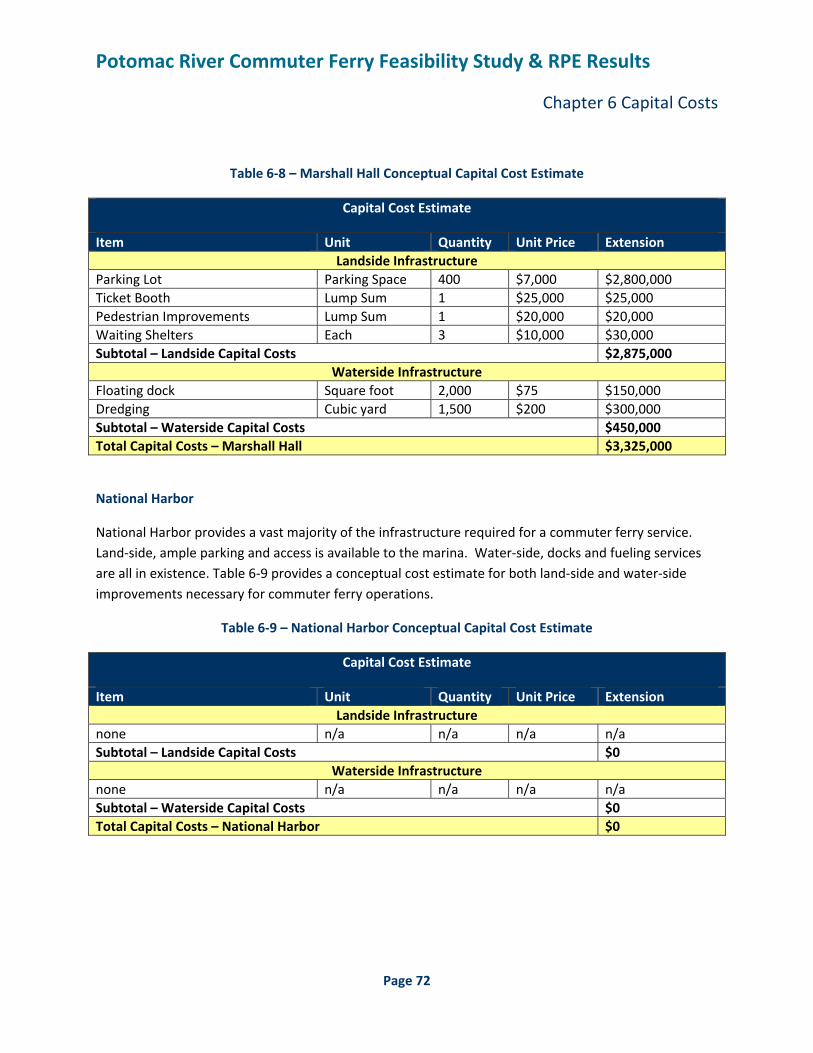
Potomac River Commuter Ferry Feasibility Study & RPE Results
Chapter 6 Capital Costs
Page 72
Table 6‐8 – Marshall Hall Conceptual Capital Cost Estimate
Capital Cost Estimate
Item Unit Quantity Unit Price Extension Landside Infrastructure
Parking Lot Parking Space 400 $7,000 $2,800,000 Ticket Booth Lump Sum 1 $25,000 $25,000 Pedestrian Improvements Lump Sum 1 $20,000 $20,000 Waiting Shelters Each 3 $10,000 $30,000 Subtotal – Landside Capital Costs $2,875,000
Waterside Infrastructure Floating dock Square foot 2,000 $75 $150,000 Dredging Cubic yard 1,500 $200 $300,000 Subtotal – Waterside Capital Costs $450,000 Total Capital Costs – Marshall Hall $3,325,000
National Harbor
National Harbor provides a vast majority of the infrastructure required for a commuter ferry service. Land‐side, ample parking and access is available to the marina. Water‐side, docks and fueling services are all in existence. Table 6‐9 provides a conceptual cost estimate for both land‐side and water‐side improvements necessary for commuter ferry operations.
Table 6‐9 – National Harbor Conceptual Capital Cost Estimate
Capital Cost Estimate
Item Unit Quantity Unit Price Extension Landside Infrastructure
none n/a n/a n/a n/a Subtotal – Landside Capital Costs $0
Waterside Infrastructure none n/a n/a n/a n/a Subtotal – Waterside Capital Costs $0 Total Capital Costs – National Harbor $0

Potomac River Commuter Ferry Feasibility Study & RPE Results
Chapter 6 Capital Costs
Page 73
Old Town Alexandria
Like National Harbor, the Alexandria City Pier provides a vast majority of the infrastructure required to support a commuter ferry service. Land‐side ample parking and access is available to the dock. All water‐side infrastructure necessary for commuter ferry operations is in place. Table 6‐10 provides a conceptual cost estimate for both land‐side and water‐side improvements necessary for commuter ferry operations.
Table 6‐10 – Old Town Alexandria Conceptual Capital Cost Estimate
Capital Cost Estimate
Item Unit Quantity Unit Price Extension Landside Infrastructure
none n/a n/a n/a $0 Subtotal – Landside Capital Costs $0
Waterside Infrastructure none n/a n/a n/a n/a Subtotal – Waterside Capital Costs $0 Total Capital Costs – Old Town Alexandria $0
Reagan National Airport
Reagan National Airport provides an attractive destination point for the commuter ferry service. In order for commuter ferry service to serve National Airport, significant water‐side infrastructure improvements would be necessary. As no facilities currently exist, a floating pier system would be necessary. Land‐side, shuttle buses would be required to transport commuters from the dock location to the airport terminals. Table 6‐11 provides a conceptual cost estimate for both land‐side and water‐side improvements necessary for commuter ferry operations.
Table 6‐11 – Reagan National Airport Conceptual Capital Cost Estimate
Capital Cost Estimate
Item Unit Quantity Unit Price Extension Landside Infrastructure
Waiting Shelter Each 3 $10,000 $30,000 Pedestrian Improvements Lump Sum 1 $20,000 $20,000 Subtotal – Landside Capital Costs $50,000
Waterside Infrastructure Floating Pier Square foot 2,000 $75 $150,000 Dredging Cubic yard 175,000 $45 $7,875,000 Subtotal – Waterside Capital Costs $5,150,000 Total Capital Costs – Reagan National Airport $5,200,000
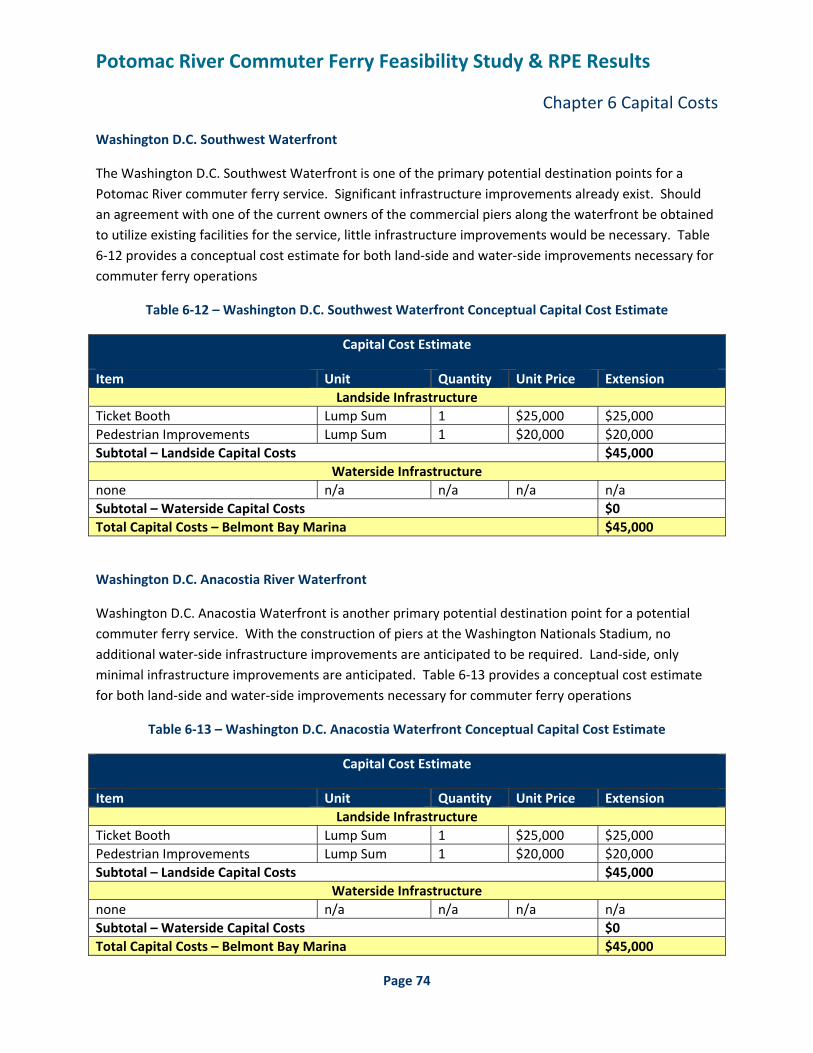
Potomac River Commuter Ferry Feasibility Study & RPE Results
Chapter 6 Capital Costs
Page 74
Washington D.C. Southwest Waterfront
The Washington D.C. Southwest Waterfront is one of the primary potential destination points for a Potomac River commuter ferry service. Significant infrastructure improvements already exist. Should an agreement with one of the current owners of the commercial piers along the waterfront be obtained to utilize existing facilities for the service, little infrastructure improvements would be necessary. Table 6‐12 provides a conceptual cost estimate for both land‐side and water‐side improvements necessary for commuter ferry operations
Table 6‐12 – Washington D.C. Southwest Waterfront Conceptual Capital Cost Estimate
Capital Cost Estimate
Item Unit Quantity Unit Price Extension Landside Infrastructure
Ticket Booth Lump Sum 1 $25,000 $25,000 Pedestrian Improvements Lump Sum 1 $20,000 $20,000 Subtotal – Landside Capital Costs $45,000
Waterside Infrastructure none n/a n/a n/a n/a Subtotal – Waterside Capital Costs $0 Total Capital Costs – Belmont Bay Marina $45,000
Washington D.C. Anacostia River Waterfront
Washington D.C. Anacostia Waterfront is another primary potential destination point for a potential commuter ferry service. With the construction of piers at the Washington Nationals Stadium, no additional water‐side infrastructure improvements are anticipated to be required. Land‐side, only minimal infrastructure improvements are anticipated. Table 6‐13 provides a conceptual cost estimate for both land‐side and water‐side improvements necessary for commuter ferry operations
Table 6‐13 – Washington D.C. Anacostia Waterfront Conceptual Capital Cost Estimate
Capital Cost Estimate
Item Unit Quantity Unit Price Extension Landside Infrastructure
Ticket Booth Lump Sum 1 $25,000 $25,000 Pedestrian Improvements Lump Sum 1 $20,000 $20,000 Subtotal – Landside Capital Costs $45,000
Waterside Infrastructure none n/a n/a n/a n/a Subtotal – Waterside Capital Costs $0 Total Capital Costs – Belmont Bay Marina $45,000
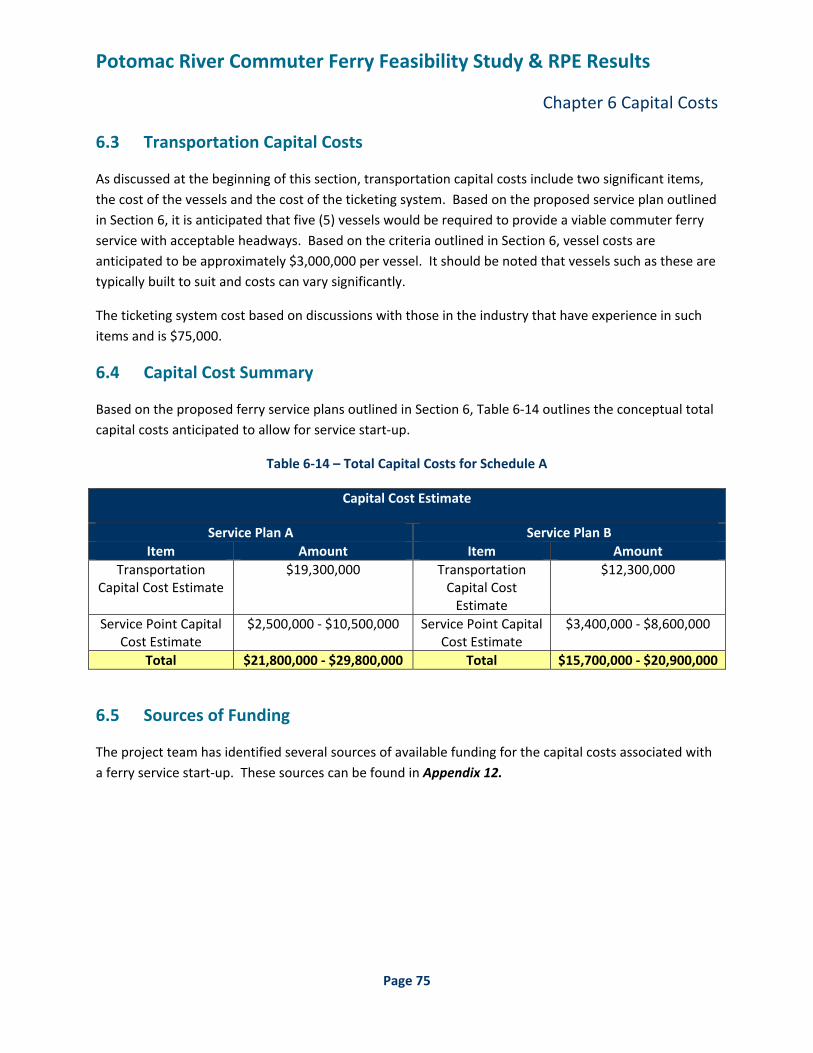
Potomac River Commuter Ferry Feasibility Study & RPE Results
Chapter 6 Capital Costs
Page 75
6.3 Transportation Capital Costs
As discussed at the beginning of this section, transportation capital costs include two significant items, the cost of the vessels and the cost of the ticketing system. Based on the proposed service plan outlined in Section 6, it is anticipated that five (5) vessels would be required to provide a viable commuter ferry service with acceptable headways. Based on the criteria outlined in Section 6, vessel costs are anticipated to be approximately $3,000,000 per vessel. It should be noted that vessels such as these are typically built to suit and costs can vary significantly.
The ticketing system cost based on discussions with those in the industry that have experience in such items and is $75,000.
6.4 Capital Cost Summary
Based on the proposed ferry service plans outlined in Section 6, Table 6‐14 outlines the conceptual total capital costs anticipated to allow for service start‐up.
Table 6‐14 – Total Capital Costs for Schedule A
Capital Cost Estimate
Service Plan A Service Plan B Item Amount Item Amount
Transportation Capital Cost Estimate
$19,300,000 Transportation Capital Cost Estimate
$12,300,000
Service Point Capital Cost Estimate
$2,500,000 ‐ $10,500,000 Service Point Capital Cost Estimate
$3,400,000 ‐ $8,600,000
Total $21,800,000 ‐ $29,800,000 Total $15,700,000 ‐ $20,900,000
6.5 Sources of Funding
The project team has identified several sources of available funding for the capital costs associated with a ferry service start‐up. These sources can be found in Appendix 12.
Potomac River Commuter Ferry Feasibility Study & RPE Results
Chapter 7 Operational Costs
Page 76
7.1 General
For most modes of mass transit, capital costs can be funded in large part through federal government grants. Operational costs on the other hand, receive little to no federal assistance and as a result, must be offset through fare collection and state/local government funding assistance. Operational costs, therefore, play a critical role in determining the feasibility of a new mode of mass transit. This section outlines the likely operational costs of a potential commuter ferry service.
7.2 Assumptions
In order to estimate the likely operational costs for a commuter ferry service, certain assumptions are required to be made. The list below outlines the assumptions made in estimating likely operational costs.
• A total of 6 boats are required to meet the proposed schedule outlined in Chapter 5. Of the 6 boats, 1 boat is assumed to be kept as reserve for situations in which a boat is out of service for repairs or Coast Guard inspection
• Service consists of non‐stop trips between Woodbridge, Virginia and Washington D.C.
• Ferry service operates only on weekdays. No weekend service is anticipated for the purposes of this estimate
• Each boat will be staffed by one captain and one deckhand. This assumption is based on the anticipated size of the boat. In addition, one part‐time captain and one part‐time deckhand will be on staff to fill holes due to sickness and vacation.
• There will be one main administrative office and one secondary office to oversee operations
• As a result of relatively high fuel consumption, this estimate assumes that fuel will be purchased at lesser prices due to volume.
• Fuel usage is estimated as follows: Assume 5 boats running 8 hours/day = 40 boat hours Assume 100 gallons of fuel per boat hour = 4,000 gallons/day
Assume boats run 250 days/year = 1,000,000 gallons/year
7.3 Operational Cost Estimate
Tables 7‐1 and 7‐2 outline likely operational costs for both Service Plans A (Woodbridge to Washington D.C.) and B (Marshall Hall to Fort Belvoir/Marshall Hall to Washington D.C.). The estimates are broken into five categories, salaries and benefits, boat maintenance and repairs, administrative office, vessel operations and infrastructure maintenance.
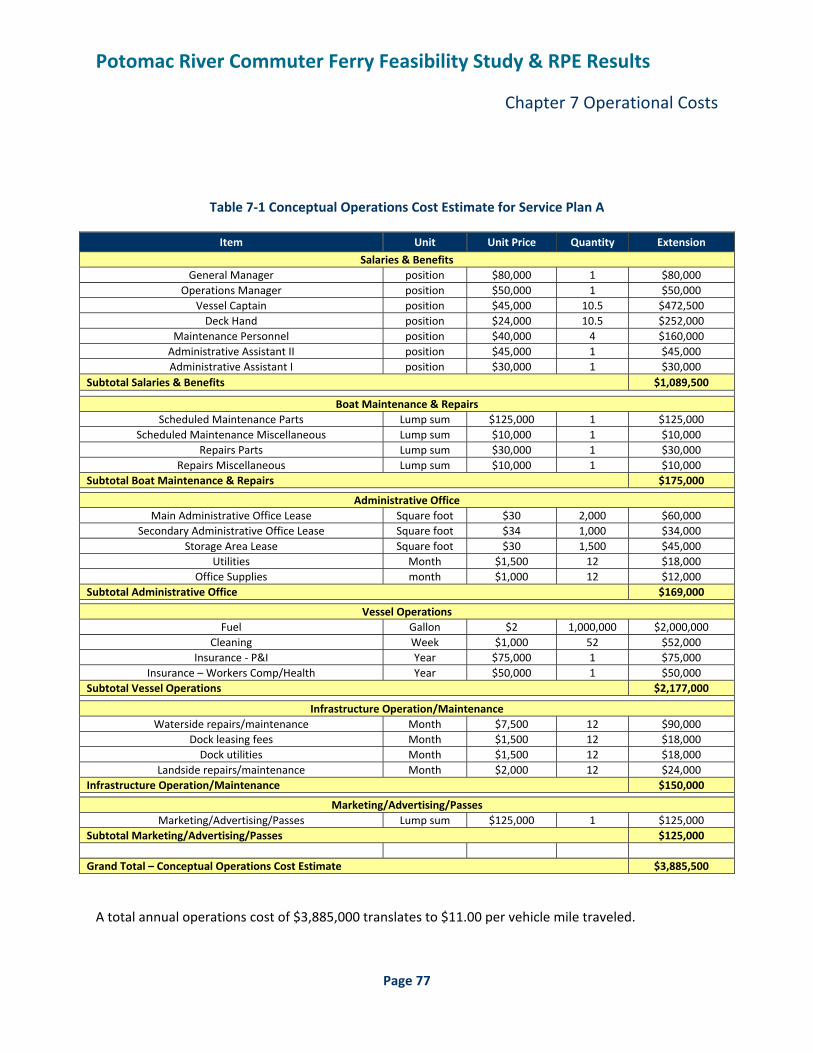
Potomac River Commuter Ferry Feasibility Study & RPE Results
Chapter 7 Operational Costs
Page 77
Table 7‐1 Conceptual Operations Cost Estimate for Service Plan A
Item Unit Unit Price Quantity Extension
Salaries & Benefits General Manager position $80,000 1 $80,000
Operations Manager position $50,000 1 $50,000 Vessel Captain position $45,000 10.5 $472,500 Deck Hand position $24,000 10.5 $252,000
Maintenance Personnel position $40,000 4 $160,000 Administrative Assistant II position $45,000 1 $45,000 Administrative Assistant I position $30,000 1 $30,000
Subtotal Salaries & Benefits $1,089,500
Boat Maintenance & Repairs Scheduled Maintenance Parts Lump sum $125,000 1 $125,000
Scheduled Maintenance Miscellaneous Lump sum $10,000 1 $10,000 Repairs Parts Lump sum $30,000 1 $30,000
Repairs Miscellaneous Lump sum $10,000 1 $10,000 Subtotal Boat Maintenance & Repairs $175,000
Administrative Office Main Administrative Office Lease Square foot $30 2,000 $60,000
Secondary Administrative Office Lease Square foot $34 1,000 $34,000 Storage Area Lease Square foot $30 1,500 $45,000
Utilities Month $1,500 12 $18,000 Office Supplies month $1,000 12 $12,000
Subtotal Administrative Office $169,000
Vessel Operations Fuel Gallon $2 1,000,000 $2,000,000
Cleaning Week $1,000 52 $52,000 Insurance ‐ P&I Year $75,000 1 $75,000
Insurance – Workers Comp/Health Year $50,000 1 $50,000 Subtotal Vessel Operations $2,177,000
Infrastructure Operation/Maintenance Waterside repairs/maintenance Month $7,500 12 $90,000
Dock leasing fees Month $1,500 12 $18,000 Dock utilities Month $1,500 12 $18,000
Landside repairs/maintenance Month $2,000 12 $24,000 Infrastructure Operation/Maintenance $150,000
Marketing/Advertising/Passes Marketing/Advertising/Passes Lump sum $125,000 1 $125,000
Subtotal Marketing/Advertising/Passes $125,000
Grand Total – Conceptual Operations Cost Estimate $3,885,500
A total annual operations cost of $3,885,000 translates to $11.00 per vehicle mile traveled.

Potomac River Commuter Ferry Feasibility Study & RPE Results
Chapter 7 Operational Costs
Page 78
Table 7‐2 Conceptual Operations Cost Estimate for Service Plan B
Item Unit Unit Price Quantity Extension
Salaries & Benefits General Manager position $80,000 1 $80,000
Operations Manager position $50,000 1 $50,000 Vessel Captain position $45,000 6.5 $292,500 Deck Hand position $24,000 6.5 $156,000
Maintenance Personnel position $40,000 3 $120,000 Administrative Assistant II position $45,000 1 $45,000 Administrative Assistant I position $30,000 1 $30,000
Subtotal Salaries & Benefits $773,500
Boat Maintenance & Repairs Scheduled Maintenance Parts Lump sum $110,000 1 $110,000
Scheduled Maintenance Miscellaneous Lump sum $10,000 1 $10,000 Repairs Parts Lump sum $20,000 1 $20,000
Repairs Miscellaneous Lump sum $10,000 1 $10,000 Subtotal Boat Maintenance & Repairs $150,000
Administrative Office Main Administrative Office Lease Square foot $30 2,000 $60,000
Secondary Administrative Office Lease Square foot $34 1,000 $34,000 Storage Area Lease Square foot $30 1,500 $45,000
Utilities Month $1,500 12 $18,000 Office Supplies month $1,000 12 $12,000
Subtotal Administrative Office $169,000
Vessel Operations Fuel Gallon $2 750,000 $1,500,000
Cleaning Week $750 52 $39,000 Insurance ‐ P&I Year $65,000 1 $65,000
Insurance – Workers Comp/Health Year $40,000 1 $40,000 Subtotal Vessel Operations $1,644,000
Infrastructure Operation/Maintenance Waterside repairs/maintenance Month $7,500 12 $90,000
Dock leasing fees Month $1,500 12 $18,000 Dock utilities Month $1,500 12 $18,000
Landside repairs/maintenance Month $2,000 12 $24,000 Infrastructure Operation/Maintenance $150,000
Marketing/Advertising/Passes Marketing/Advertising/Passes Lump sum $125,000 1 $125,000
Subtotal Marketing/Advertising/Passes $125,000
Grand Total – Conceptual Operations Cost Estimate $3,011,500
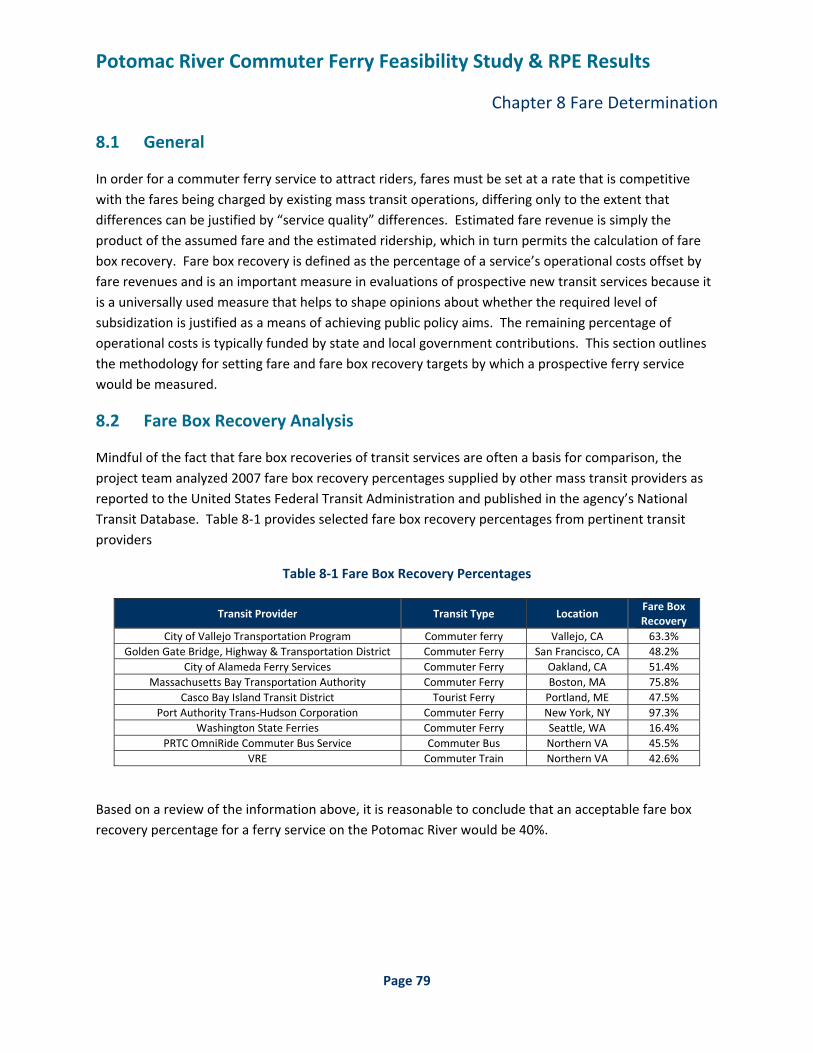
Potomac River Commuter Ferry Feasibility Study & RPE Results
Chapter 8 Fare Determination
Page 79
8.1 General
In order for a commuter ferry service to attract riders, fares must be set at a rate that is competitive with the fares being charged by existing mass transit operations, differing only to the extent that differences can be justified by “service quality” differences. Estimated fare revenue is simply the product of the assumed fare and the estimated ridership, which in turn permits the calculation of fare box recovery. Fare box recovery is defined as the percentage of a service’s operational costs offset by fare revenues and is an important measure in evaluations of prospective new transit services because it is a universally used measure that helps to shape opinions about whether the required level of subsidization is justified as a means of achieving public policy aims. The remaining percentage of operational costs is typically funded by state and local government contributions. This section outlines the methodology for setting fare and fare box recovery targets by which a prospective ferry service would be measured.
8.2 Fare Box Recovery Analysis
Mindful of the fact that fare box recoveries of transit services are often a basis for comparison, the project team analyzed 2007 fare box recovery percentages supplied by other mass transit providers as reported to the United States Federal Transit Administration and published in the agency’s National Transit Database. Table 8‐1 provides selected fare box recovery percentages from pertinent transit providers
Table 8‐1 Fare Box Recovery Percentages
Transit Provider Transit Type Location Fare Box Recovery
City of Vallejo Transportation Program Commuter ferry Vallejo, CA 63.3% Golden Gate Bridge, Highway & Transportation District Commuter Ferry San Francisco, CA 48.2%
City of Alameda Ferry Services Commuter Ferry Oakland, CA 51.4% Massachusetts Bay Transportation Authority Commuter Ferry Boston, MA 75.8%
Casco Bay Island Transit District Tourist Ferry Portland, ME 47.5% Port Authority Trans‐Hudson Corporation Commuter Ferry New York, NY 97.3%
Washington State Ferries Commuter Ferry Seattle, WA 16.4% PRTC OmniRide Commuter Bus Service Commuter Bus Northern VA 45.5%
VRE Commuter Train Northern VA 42.6%
Based on a review of the information above, it is reasonable to conclude that an acceptable fare box recovery percentage for a ferry service on the Potomac River would be 40%.
Potomac River Commuter Ferry Feasibility Study & RPE Results
Chapter 8 Fare Determination
Page 80
8.3 Fare Determination
Based on annual operational costs of $3,885,500 and assuming a desired fare box recovery percentage of 40%, it is necessary to generate total annual fares of $1,554,200. Given an anticipated 250 operational days per year, the total average daily fare collection is required to be $6,216.80. Given that 12 proposed round trips per day are reflected in the service plan in Chapter 6, the total average fare to be collected is $518.07 for each round trip.
Based on a review of published fares by VRE and PRTC, the round trip fare for bus service from Woodbridge to Washington D.C. Navy Yard is $13.00 if paying by cash and $9.50 if paying by SmarTrip. Based on rates effective June 29, 2009, the round trip fare for train service from Woodbridge to Washington D.C. is $15.70 if paying for individual trips, $12.52 if paying for a five‐day pass and approximately $9.86 if paying for a month pass.
Based on this information, it is reasonable to conclude that a round trip fare charge of $11.00 would price a potential ferry service competitively.
In order to generate a total average daily fare collection of $6,216.80 given an individual fare of $11.00, the commuter ferry service would be required to transport 565 people round‐trip per day or approximately 280,000 person‐trips annually on a round trip from Woodbridge, VA to Washington D.C. A plausible dispersion of ridership on the proposed ferry runs is shown in Table 8‐2.
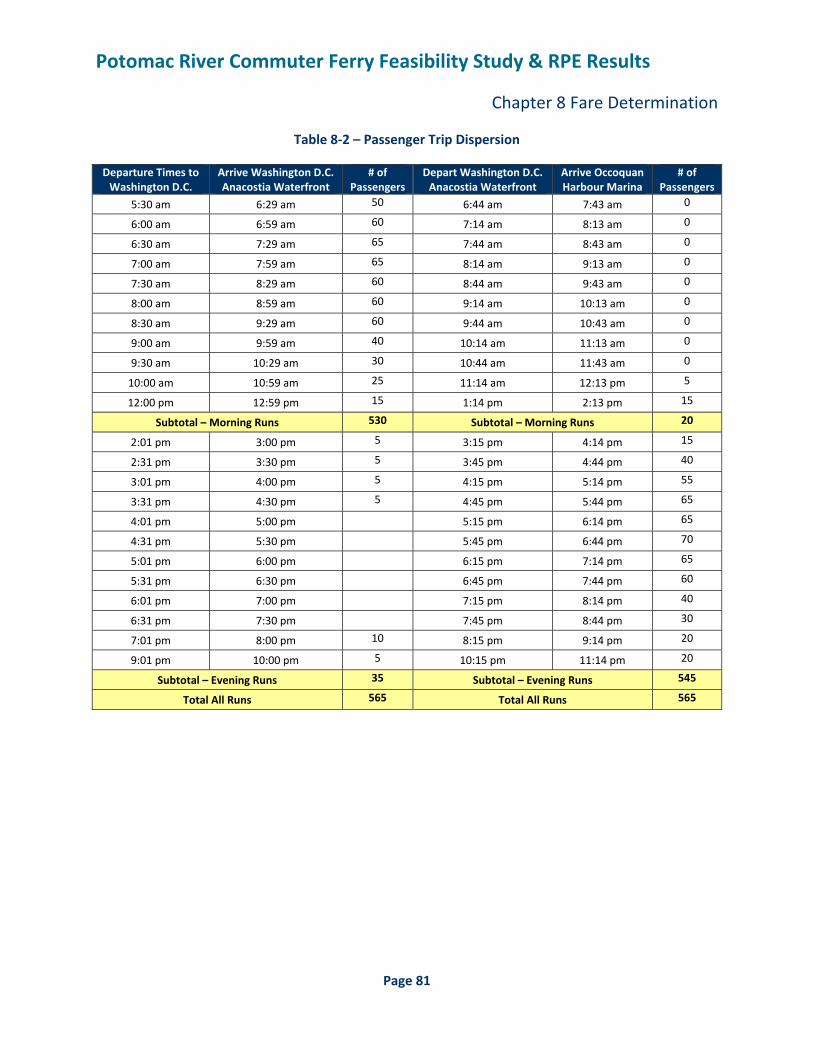
Potomac River Commuter Ferry Feasibility Study & RPE Results
Chapter 8 Fare Determination
Page 81
Table 8‐2 – Passenger Trip Dispersion
Departure Times to Washington D.C.
Arrive Washington D.C. Anacostia Waterfront
# of Passengers
Depart Washington D.C. Anacostia Waterfront
Arrive Occoquan Harbour Marina
# of Passengers
5:30 am 6:29 am 50 6:44 am 7:43 am 0
6:00 am 6:59 am 60 7:14 am 8:13 am 0
6:30 am 7:29 am 65 7:44 am 8:43 am 0
7:00 am 7:59 am 65 8:14 am 9:13 am 0
7:30 am 8:29 am 60 8:44 am 9:43 am 0
8:00 am 8:59 am 60 9:14 am 10:13 am 0
8:30 am 9:29 am 60 9:44 am 10:43 am 0
9:00 am 9:59 am 40 10:14 am 11:13 am 0
9:30 am 10:29 am 30 10:44 am 11:43 am 0
10:00 am 10:59 am 25 11:14 am 12:13 pm 5
12:00 pm 12:59 pm 15 1:14 pm 2:13 pm 15
Subtotal – Morning Runs 530 Subtotal – Morning Runs 20
2:01 pm 3:00 pm 5 3:15 pm 4:14 pm 15
2:31 pm 3:30 pm 5 3:45 pm 4:44 pm 40
3:01 pm 4:00 pm 5 4:15 pm 5:14 pm 55
3:31 pm 4:30 pm 5 4:45 pm 5:44 pm 65
4:01 pm 5:00 pm 5:15 pm 6:14 pm 65
4:31 pm 5:30 pm 5:45 pm 6:44 pm 70
5:01 pm 6:00 pm 6:15 pm 7:14 pm 65
5:31 pm 6:30 pm 6:45 pm 7:44 pm 60
6:01 pm 7:00 pm 7:15 pm 8:14 pm 40
6:31 pm 7:30 pm 7:45 pm 8:44 pm 30
7:01 pm 8:00 pm 10 8:15 pm 9:14 pm 20
9:01 pm 10:00 pm 5 10:15 pm 11:14 pm 20
Subtotal – Evening Runs 35 Subtotal – Evening Runs 545
Total All Runs 565 Total All Runs 565
Potomac River Commuter Ferry Feasibility Study & RPE Results
Chapter 9 Service Demands & Final Analysis
Page 82
9.1 General
As the scope of this study does not allow for the development of a detailed ridership model, the project team employed the ridership model utilized in the commuter ferry feasibility report prepared by the Virginia Department of Transportation in 2000. In the VDOT 2000 feasibility report, the model utilized was an extension of models that were constructed and utilized in predicting likely ridership on the VRE system. A variation of this model was also used in a 1988 study conducted by the Metropolitan Washington Council of Governments to predict likely ridership on a proposed commuter ferry service. The model is a nested logit formulation that predicts the proportion of transit trips from a point of trip generation to a point of trip destination as well as the overall proportion of transit trips to the number of total trips overall. In the VDOT 2000 feasibility report, three modes of transit was compared, PRTC bus, VRE train and the proposed commuter ferry service. Appendix 13 contains information from the VDOT 2000 feasibility study detailing the model. The objective of this review was to compare the assumptions utilized in preparing the 2000 model to both current conditions and the data obtained from the route proving exercise and draw conclusions as to likely ridership given these new conditions. As noted in the Chapter 1 of this report, the purpose of this exercise was to determine if additional analysis of travel demands through market studies and a new travel model is warranted. Sole reliance on the travel demand results in this report is not advisable as the model used to predict the travel demand cannot account for some current conditions not in existence at the time of model development. Examples of current conditions that cannot be accounted for in the existing model include direct commuter bus service from Woodbridge to the Navy Yard Metro Station and the addition of HOT lanes on I‐95.
9.2 Review of VDOT Trip Demand Analysis
The VDOT 2000 feasibility report model relied on three key variables to estimate ridership on a potential commuter ferry service. Those three variables were In‐Vehicle Time, Out‐of‐Vehicle Time and Cost.
In‐Vehicle Time In‐Vehicle Time is defined as the portion of a commute spent in a vehicle. In‐Vehicle Time includes the time spent on the primary transit vehicle of any mode (in this case; bus, train or ferry) as well as the time spent in a personal vehicle from home to the point of pick‐up by that mode. It also includes any additional time spent on a secondary mode of transit subsequent to drop‐off by that mode (i.e. time spent on METRO train or bus to get from a primary mode drop‐off point to a final destination). In the VDOT 2000 feasibility report, two potential In‐Vehicle Times were measured for a potential commuter ferry service. The In‐Vehicle Times were directly related to the speed at which the commuter ferry would travel. A “restricted” speed indicated that the proposed commuter ferry service would be obliged to slow for the existing no‐wake zones located in Alexandria, Virginia and on the Anacostia River in Washington D.C. The resulting In‐Vehicle Time was 70 minutes. An “unrestricted” speed indicated
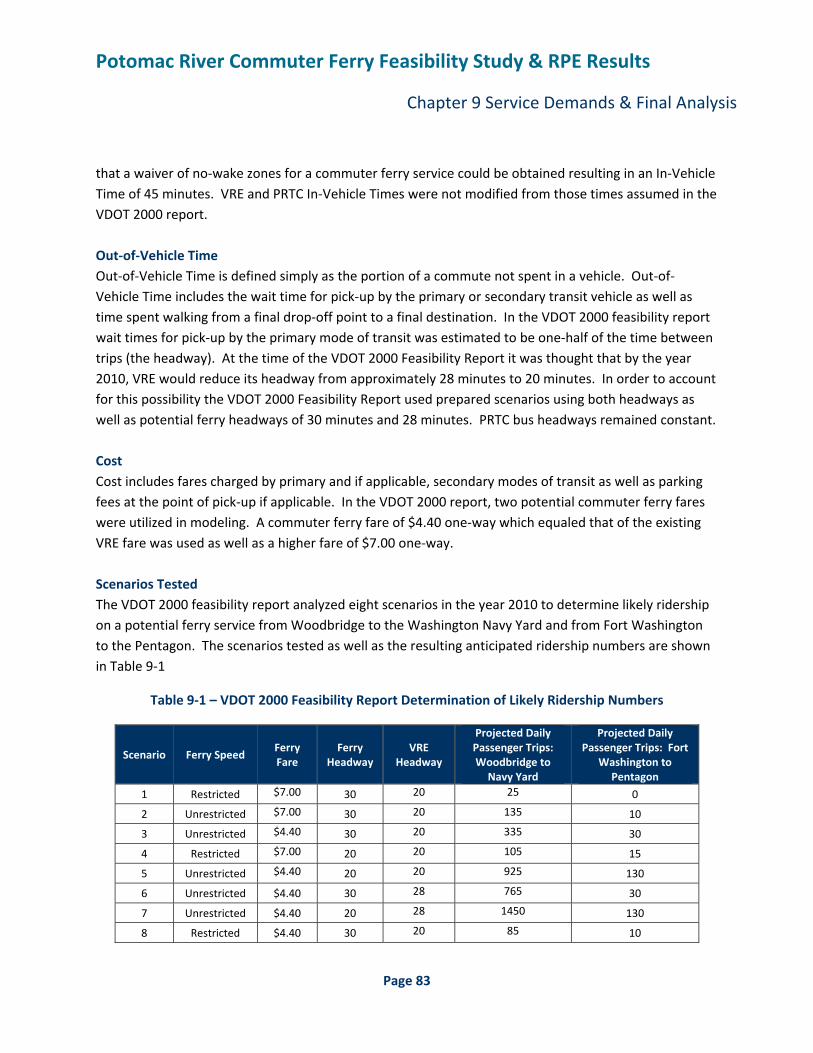
Potomac River Commuter Ferry Feasibility Study & RPE Results
Chapter 9 Service Demands & Final Analysis
Page 83
that a waiver of no‐wake zones for a commuter ferry service could be obtained resulting in an In‐Vehicle Time of 45 minutes. VRE and PRTC In‐Vehicle Times were not modified from those times assumed in the VDOT 2000 report. Out‐of‐Vehicle Time Out‐of‐Vehicle Time is defined simply as the portion of a commute not spent in a vehicle. Out‐of‐Vehicle Time includes the wait time for pick‐up by the primary or secondary transit vehicle as well as time spent walking from a final drop‐off point to a final destination. In the VDOT 2000 feasibility report wait times for pick‐up by the primary mode of transit was estimated to be one‐half of the time between trips (the headway). At the time of the VDOT 2000 Feasibility Report it was thought that by the year 2010, VRE would reduce its headway from approximately 28 minutes to 20 minutes. In order to account for this possibility the VDOT 2000 Feasibility Report used prepared scenarios using both headways as well as potential ferry headways of 30 minutes and 28 minutes. PRTC bus headways remained constant. Cost Cost includes fares charged by primary and if applicable, secondary modes of transit as well as parking fees at the point of pick‐up if applicable. In the VDOT 2000 report, two potential commuter ferry fares were utilized in modeling. A commuter ferry fare of $4.40 one‐way which equaled that of the existing VRE fare was used as well as a higher fare of $7.00 one‐way. Scenarios Tested The VDOT 2000 feasibility report analyzed eight scenarios in the year 2010 to determine likely ridership on a potential ferry service from Woodbridge to the Washington Navy Yard and from Fort Washington to the Pentagon. The scenarios tested as well as the resulting anticipated ridership numbers are shown in Table 9‐1
Table 9‐1 – VDOT 2000 Feasibility Report Determination of Likely Ridership Numbers
Scenario Ferry Speed Ferry Fare
Ferry Headway
VRE Headway
Projected Daily Passenger Trips: Woodbridge to
Navy Yard
Projected Daily Passenger Trips: Fort
Washington to Pentagon
1 Restricted $7.00 30 20 25 0
2 Unrestricted $7.00 30 20 135 10
3 Unrestricted $4.40 30 20 335 30
4 Restricted $7.00 20 20 105 15
5 Unrestricted $4.40 20 20 925 130
6 Unrestricted $4.40 30 28 765 30
7 Unrestricted $4.40 20 28 1450 130
8 Restricted $4.40 30 20 85 10
Potomac River Commuter Ferry Feasibility Study & RPE Results
Chapter 9 Service Demands & Final Analysis
Page 84
9.3 Analysis of Existing Conditions
The next task in estimating commuter ferry ridership was to analyze existing conditions and data obtained from the RPE to determine the scenario from Section 9.2 that best fit the service plan developed as part of this report. The project team reviewed commuter ferry travel times, fares and headways for both the proposed commuter ferry and existing VRE service.
Commuter Ferry Travel Times
As is discussed in Chapter 6, the project team determined that ferry service originating in Woodbridge (in this case, Occoquan Harbour Marina) and terminating in Washington D.C. (in this case Washington Nationals stadium) would take 58.5 minutes. This time roughly falls in the middle of the “restricted” and “unrestricted” travel times used in the VDOT 2000 feasibility report.
Fares
As is discussed in Chapter 8, the project team determined set the one‐way trip fare for commuter ferry service at $5.50 in order to roughly match the fare currently being charged by VRE when a passenger purchases a one‐month pass. This fare can then be considered equivalent to the $4.40 fare utilized in the VDOT 2000 feasibility study as it meets the two criteria necessary;
1) it equals the current VRE fare being charged
2) When discounted by the consumer price index to 1980 equivalent dollars, it equals $2.18. When the VDOT 2000 feasibility study discounted the $4.40 fare from 1999 dollars to 1988 dollars it also equaled $2.18. This factor is important as the model utilizes a value‐of‐time relationship developed for the year 1980.
Headways
As is discussed in Chapter 5, the project team set 30 minute headways for the proposed ferry service. A review of the schedule for the Fredericksburg line of VRE yields departure times from Woodbridge to Washington D.C. as shown in Table 9‐2.
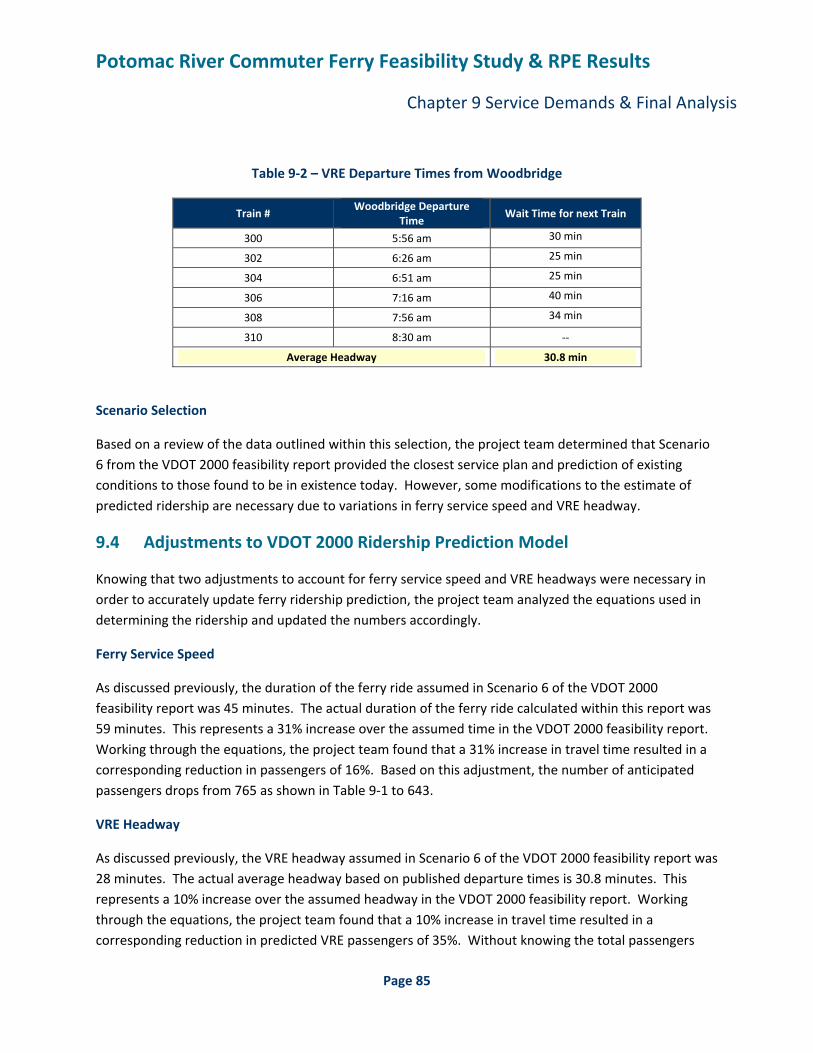
Potomac River Commuter Ferry Feasibility Study & RPE Results
Chapter 9 Service Demands & Final Analysis
Page 85
Table 9‐2 – VRE Departure Times from Woodbridge
Train # Woodbridge Departure
Time Wait Time for next Train
300 5:56 am 30 min
302 6:26 am 25 min
304 6:51 am 25 min
306 7:16 am 40 min
308 7:56 am 34 min
310 8:30 am ‐‐
Average Headway 30.8 min
Scenario Selection
Based on a review of the data outlined within this selection, the project team determined that Scenario 6 from the VDOT 2000 feasibility report provided the closest service plan and prediction of existing conditions to those found to be in existence today. However, some modifications to the estimate of predicted ridership are necessary due to variations in ferry service speed and VRE headway.
9.4 Adjustments to VDOT 2000 Ridership Prediction Model
Knowing that two adjustments to account for ferry service speed and VRE headways were necessary in order to accurately update ferry ridership prediction, the project team analyzed the equations used in determining the ridership and updated the numbers accordingly.
Ferry Service Speed
As discussed previously, the duration of the ferry ride assumed in Scenario 6 of the VDOT 2000 feasibility report was 45 minutes. The actual duration of the ferry ride calculated within this report was 59 minutes. This represents a 31% increase over the assumed time in the VDOT 2000 feasibility report. Working through the equations, the project team found that a 31% increase in travel time resulted in a corresponding reduction in passengers of 16%. Based on this adjustment, the number of anticipated passengers drops from 765 as shown in Table 9‐1 to 643.
VRE Headway
As discussed previously, the VRE headway assumed in Scenario 6 of the VDOT 2000 feasibility report was 28 minutes. The actual average headway based on published departure times is 30.8 minutes. This represents a 10% increase over the assumed headway in the VDOT 2000 feasibility report. Working through the equations, the project team found that a 10% increase in travel time resulted in a corresponding reduction in predicted VRE passengers of 35%. Without knowing the total passengers
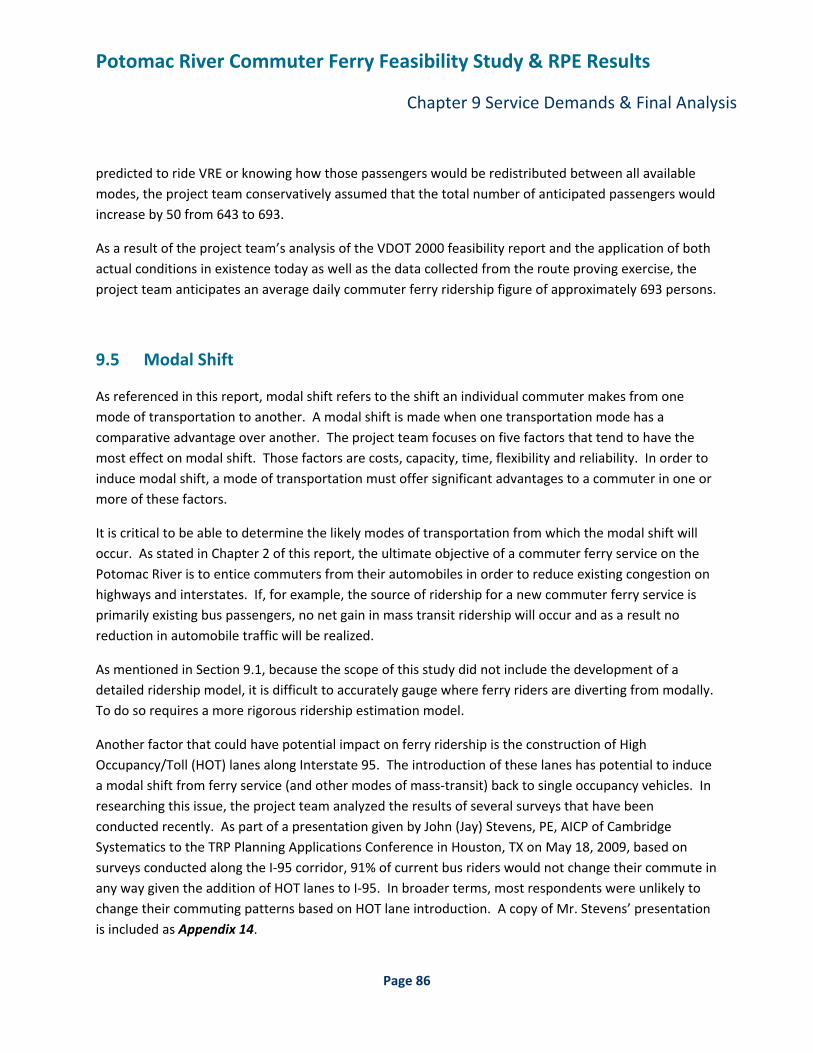
Potomac River Commuter Ferry Feasibility Study & RPE Results
Chapter 9 Service Demands & Final Analysis
Page 86
predicted to ride VRE or knowing how those passengers would be redistributed between all available modes, the project team conservatively assumed that the total number of anticipated passengers would increase by 50 from 643 to 693.
As a result of the project team’s analysis of the VDOT 2000 feasibility report and the application of both actual conditions in existence today as well as the data collected from the route proving exercise, the project team anticipates an average daily commuter ferry ridership figure of approximately 693 persons.
9.5 Modal Shift
As referenced in this report, modal shift refers to the shift an individual commuter makes from one mode of transportation to another. A modal shift is made when one transportation mode has a comparative advantage over another. The project team focuses on five factors that tend to have the most effect on modal shift. Those factors are costs, capacity, time, flexibility and reliability. In order to induce modal shift, a mode of transportation must offer significant advantages to a commuter in one or more of these factors.
It is critical to be able to determine the likely modes of transportation from which the modal shift will occur. As stated in Chapter 2 of this report, the ultimate objective of a commuter ferry service on the Potomac River is to entice commuters from their automobiles in order to reduce existing congestion on highways and interstates. If, for example, the source of ridership for a new commuter ferry service is primarily existing bus passengers, no net gain in mass transit ridership will occur and as a result no reduction in automobile traffic will be realized.
As mentioned in Section 9.1, because the scope of this study did not include the development of a detailed ridership model, it is difficult to accurately gauge where ferry riders are diverting from modally. To do so requires a more rigorous ridership estimation model.
Another factor that could have potential impact on ferry ridership is the construction of High Occupancy/Toll (HOT) lanes along Interstate 95. The introduction of these lanes has potential to induce a modal shift from ferry service (and other modes of mass‐transit) back to single occupancy vehicles. In researching this issue, the project team analyzed the results of several surveys that have been conducted recently. As part of a presentation given by John (Jay) Stevens, PE, AICP of Cambridge Systematics to the TRP Planning Applications Conference in Houston, TX on May 18, 2009, based on surveys conducted along the I‐95 corridor, 91% of current bus riders would not change their commute in any way given the addition of HOT lanes to I‐95. In broader terms, most respondents were unlikely to change their commuting patterns based on HOT lane introduction. A copy of Mr. Stevens’ presentation is included as Appendix 14.
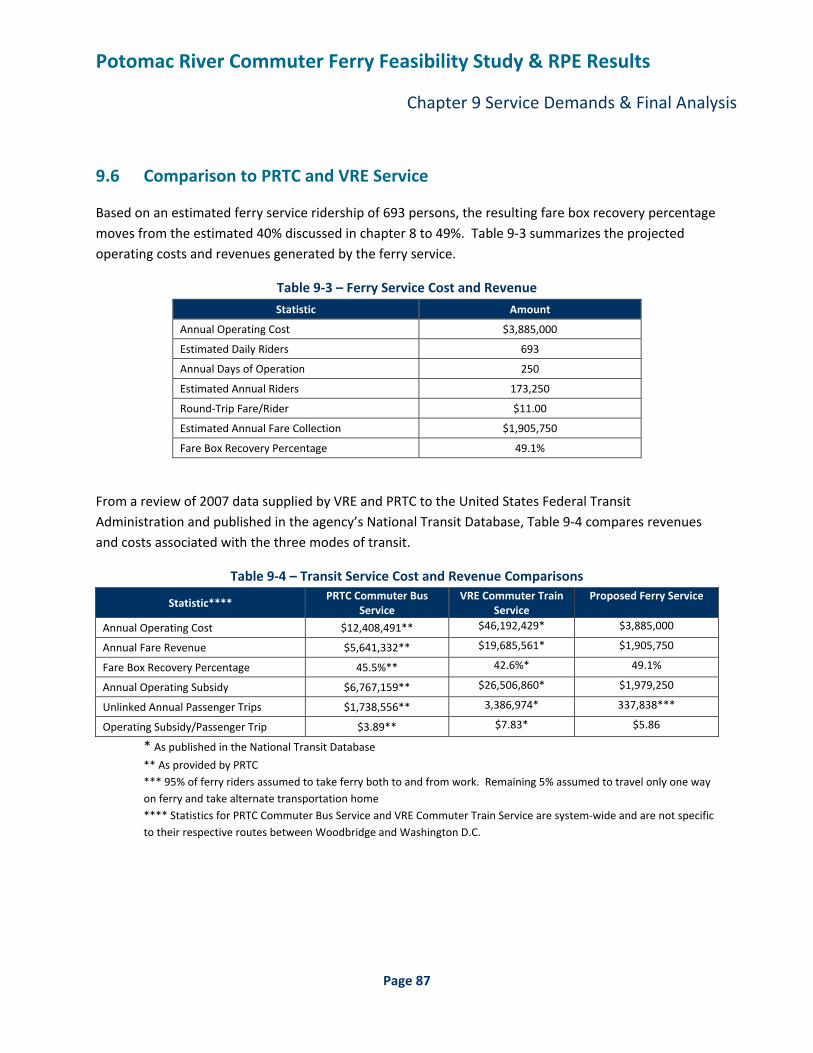
Potomac River Commuter Ferry Feasibility Study & RPE Results
Chapter 9 Service Demands & Final Analysis
Page 87
9.6 Comparison to PRTC and VRE Service
Based on an estimated ferry service ridership of 693 persons, the resulting fare box recovery percentage moves from the estimated 40% discussed in chapter 8 to 49%. Table 9‐3 summarizes the projected operating costs and revenues generated by the ferry service.
Table 9‐3 – Ferry Service Cost and Revenue
Statistic Amount
Annual Operating Cost $3,885,000
Estimated Daily Riders 693
Annual Days of Operation 250
Estimated Annual Riders 173,250
Round‐Trip Fare/Rider $11.00
Estimated Annual Fare Collection $1,905,750
Fare Box Recovery Percentage 49.1%
From a review of 2007 data supplied by VRE and PRTC to the United States Federal Transit Administration and published in the agency’s National Transit Database, Table 9‐4 compares revenues and costs associated with the three modes of transit.
Table 9‐4 – Transit Service Cost and Revenue Comparisons
Statistic**** PRTC Commuter Bus
Service VRE Commuter Train
Service Proposed Ferry Service
Annual Operating Cost $12,408,491** $46,192,429* $3,885,000
Annual Fare Revenue $5,641,332** $19,685,561* $1,905,750
Fare Box Recovery Percentage 45.5%** 42.6%* 49.1%
Annual Operating Subsidy $6,767,159** $26,506,860* $1,979,250
Unlinked Annual Passenger Trips $1,738,556** 3,386,974* 337,838***
Operating Subsidy/Passenger Trip $3.89** $7.83* $5.86
* As published in the National Transit Database ** As provided by PRTC
*** 95% of ferry riders assumed to take ferry both to and from work. Remaining 5% assumed to travel only one way on ferry and take alternate transportation home **** Statistics for PRTC Commuter Bus Service and VRE Commuter Train Service are system‐wide and are not specific to their respective routes between Woodbridge and Washington D.C.
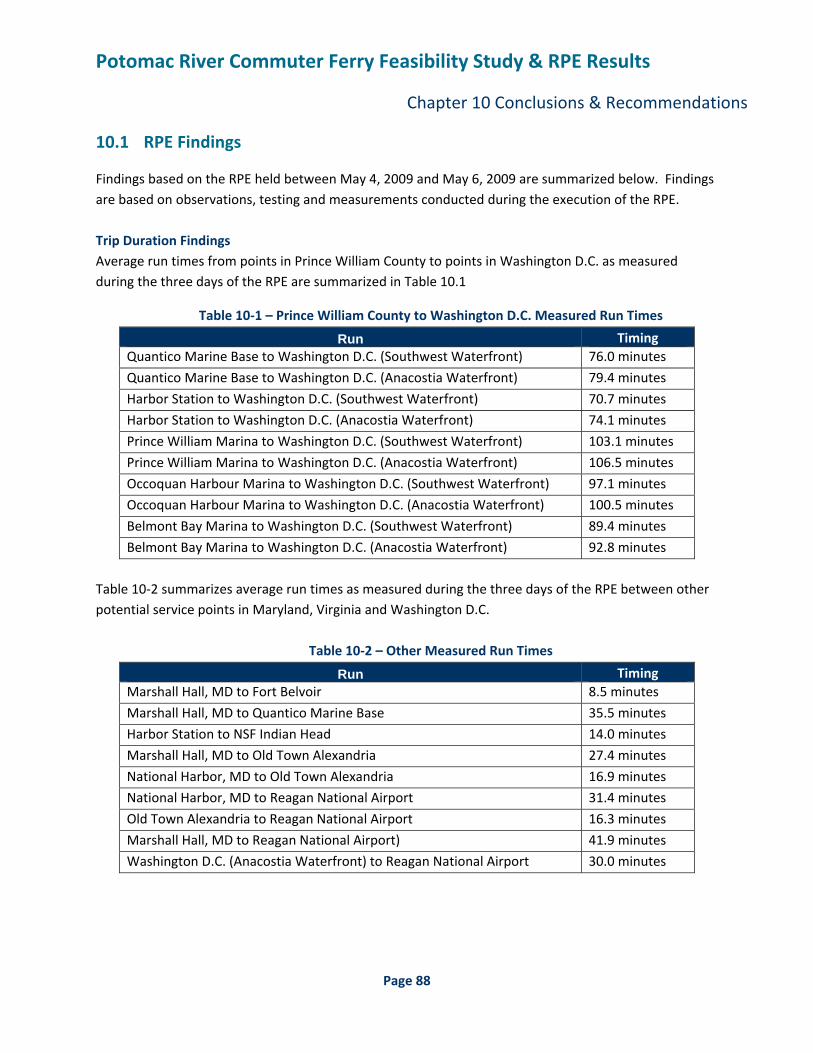
Potomac River Commuter Ferry Feasibility Study & RPE Results
Chapter 10 Conclusions & Recommendations
Page 88
10.1 RPE Findings
Findings based on the RPE held between May 4, 2009 and May 6, 2009 are summarized below. Findings are based on observations, testing and measurements conducted during the execution of the RPE. Trip Duration Findings Average run times from points in Prince William County to points in Washington D.C. as measured during the three days of the RPE are summarized in Table 10.1
Table 10‐1 – Prince William County to Washington D.C. Measured Run Times
Run Timing Quantico Marine Base to Washington D.C. (Southwest Waterfront) 76.0 minutes
Quantico Marine Base to Washington D.C. (Anacostia Waterfront) 79.4 minutes
Harbor Station to Washington D.C. (Southwest Waterfront) 70.7 minutes
Harbor Station to Washington D.C. (Anacostia Waterfront) 74.1 minutes
Prince William Marina to Washington D.C. (Southwest Waterfront) 103.1 minutes
Prince William Marina to Washington D.C. (Anacostia Waterfront) 106.5 minutes
Occoquan Harbour Marina to Washington D.C. (Southwest Waterfront) 97.1 minutes
Occoquan Harbour Marina to Washington D.C. (Anacostia Waterfront) 100.5 minutes
Belmont Bay Marina to Washington D.C. (Southwest Waterfront) 89.4 minutes
Belmont Bay Marina to Washington D.C. (Anacostia Waterfront) 92.8 minutes
Table 10‐2 summarizes average run times as measured during the three days of the RPE between other potential service points in Maryland, Virginia and Washington D.C.
Table 10‐2 – Other Measured Run Times
Run Timing Marshall Hall, MD to Fort Belvoir 8.5 minutes
Marshall Hall, MD to Quantico Marine Base 35.5 minutes
Harbor Station to NSF Indian Head 14.0 minutes
Marshall Hall, MD to Old Town Alexandria 27.4 minutes
National Harbor, MD to Old Town Alexandria 16.9 minutes
National Harbor, MD to Reagan National Airport 31.4 minutes
Old Town Alexandria to Reagan National Airport 16.3 minutes
Marshall Hall, MD to Reagan National Airport) 41.9 minutes
Washington D.C. (Anacostia Waterfront) to Reagan National Airport 30.0 minutes
Potomac River Commuter Ferry Feasibility Study & RPE Results
Chapter 10 Conclusions & Recommendations
Page 89
The study team found several operational constraints that significantly affected the travel times listed in Tables 10‐1 and 10‐2. Those constraints were identified as follows:
1. The draft, defined as the depth of water to which a vessel is immersed under a given load, of the Provincetown III is 5.5 feet. Due to the draft of the Provincetown III combined with the relative shallowness of the Occoquan River, it was impossible for the Provincetown III to operate at speeds greater than 10 mph on the Occoquan for fear of striking the bottom of the river during acceleration.
2. The Provincetown III utilizes a propeller propulsion system. As a result the vessel was forced to slow on the Potomac River during runs conducted on Wednesday, May 6, 2009 due to debris in the river. It was feared that a propeller strike by a large piece of debris would disable the vessel.
3. A no‐wake zone located on the Potomac River along the frontage of Old Town Alexandria obliged the vessel to slow from its normal cruising speed of 32‐35 mph to 10 mph.
4. A no‐wake zone located on the Potomac River in Washington D.C. obliged the vessel to slow from its normal cruising speed of 32‐35 mph to 10 mph.
Service Point Findings Based on observations during the three days of the RPE, the project team found that several of the service points could be utilized for permanent ferry service with little initial land‐side or water‐side infrastructure improvements. Those service points include:
1. Washington D.C. Anacostia Waterfront – a docking facility is currently under construction at the Nationals baseball stadium that is scheduled to be in operation within the next six months
2. Washington D.C. Southwest Waterfront – several commercial piers exist that could serve a ferry operation assuming a lease agreement could be negotiated with the owners
3. Old Town Alexandria – the Alexandria City Pier currently serves commercial boating operations and could serve a ferry operation assuming a lease agreement could be negotiated with City.
4. National Harbor – docking facilities at National Harbor currently serve commercial boating operations and could serve a ferry operation assuming a lease agreement could be negotiated with the owner.
5. Harbour Station Marina – docking facilities and parking facilities at this site are suitable in supporting a ferry operation assuming a lease agreement could be negotiated with the owner.
Wake Measurement Findings As part of the RPE, the project team recorded wave measurements generated by the wake of the Provincetown III. Wake was measured during both low speed and high speed operations. During low speed operations, waves measured as a result of the vessel’s wake were not distinguishable from the waves being generated as a result of the wind. During high speed operations, waves measured as a result of the vessel’s wake were approximately 7 inches in height. The wave heights of 7 inches were found to be in accordance with the published specifications of the vessel manufacturer. Based on wave
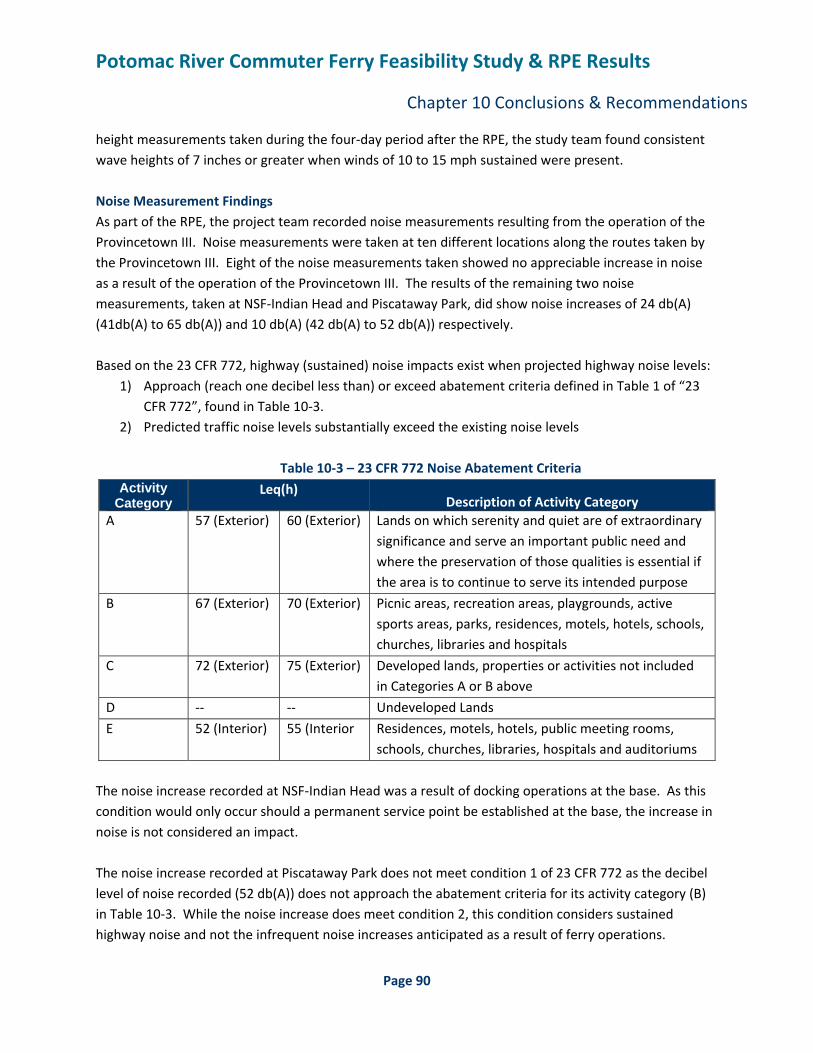
Potomac River Commuter Ferry Feasibility Study & RPE Results
Chapter 10 Conclusions & Recommendations
Page 90
height measurements taken during the four‐day period after the RPE, the study team found consistent wave heights of 7 inches or greater when winds of 10 to 15 mph sustained were present. Noise Measurement Findings As part of the RPE, the project team recorded noise measurements resulting from the operation of the Provincetown III. Noise measurements were taken at ten different locations along the routes taken by the Provincetown III. Eight of the noise measurements taken showed no appreciable increase in noise as a result of the operation of the Provincetown III. The results of the remaining two noise measurements, taken at NSF‐Indian Head and Piscataway Park, did show noise increases of 24 db(A) (41db(A) to 65 db(A)) and 10 db(A) (42 db(A) to 52 db(A)) respectively. Based on the 23 CFR 772, highway (sustained) noise impacts exist when projected highway noise levels:
1) Approach (reach one decibel less than) or exceed abatement criteria defined in Table 1 of “23 CFR 772”, found in Table 10‐3.
2) Predicted traffic noise levels substantially exceed the existing noise levels
Table 10‐3 – 23 CFR 772 Noise Abatement Criteria Activity
Category Leq(h)
Description of Activity Category A 57 (Exterior) 60 (Exterior) Lands on which serenity and quiet are of extraordinary
significance and serve an important public need and where the preservation of those qualities is essential if the area is to continue to serve its intended purpose
B 67 (Exterior) 70 (Exterior) Picnic areas, recreation areas, playgrounds, active sports areas, parks, residences, motels, hotels, schools, churches, libraries and hospitals
C 72 (Exterior) 75 (Exterior) Developed lands, properties or activities not included in Categories A or B above
D ‐‐ ‐‐ Undeveloped Lands
E 52 (Interior) 55 (Interior Residences, motels, hotels, public meeting rooms, schools, churches, libraries, hospitals and auditoriums
The noise increase recorded at NSF‐Indian Head was a result of docking operations at the base. As this condition would only occur should a permanent service point be established at the base, the increase in noise is not considered an impact. The noise increase recorded at Piscataway Park does not meet condition 1 of 23 CFR 772 as the decibel level of noise recorded (52 db(A)) does not approach the abatement criteria for its activity category (B) in Table 10‐3. While the noise increase does meet condition 2, this condition considers sustained highway noise and not the infrequent noise increases anticipated as a result of ferry operations.
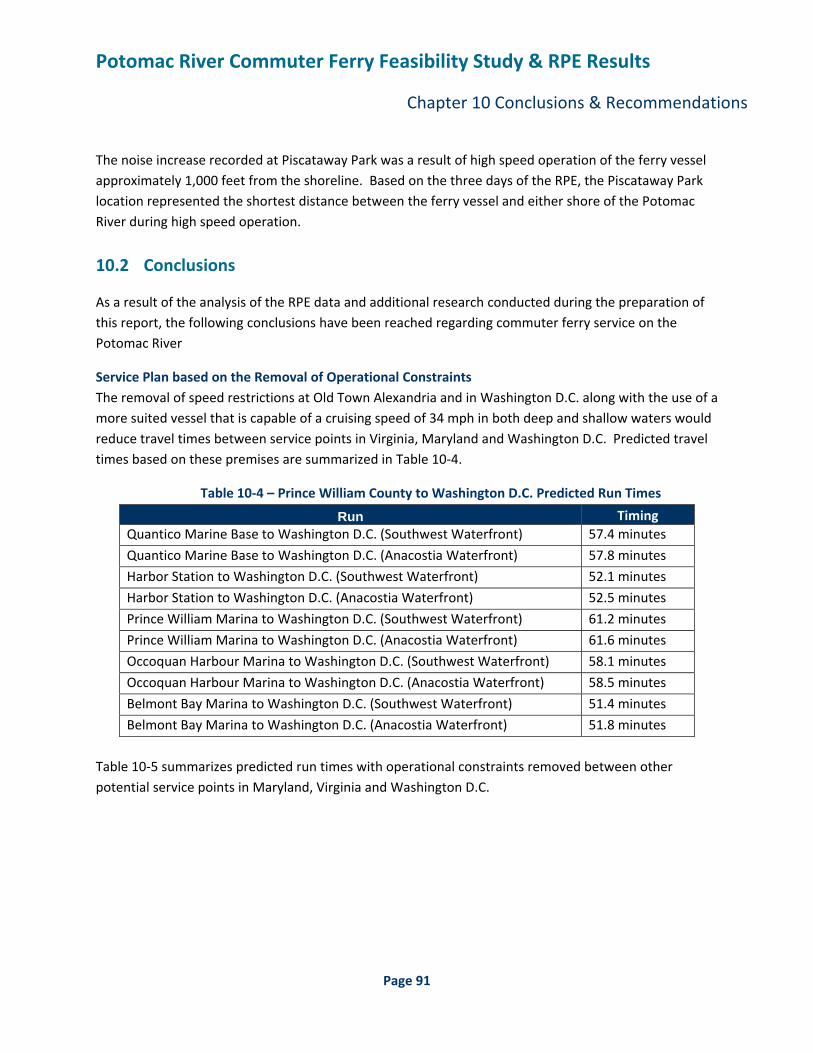
Potomac River Commuter Ferry Feasibility Study & RPE Results
Chapter 10 Conclusions & Recommendations
Page 91
The noise increase recorded at Piscataway Park was a result of high speed operation of the ferry vessel approximately 1,000 feet from the shoreline. Based on the three days of the RPE, the Piscataway Park location represented the shortest distance between the ferry vessel and either shore of the Potomac River during high speed operation.
10.2 Conclusions
As a result of the analysis of the RPE data and additional research conducted during the preparation of this report, the following conclusions have been reached regarding commuter ferry service on the Potomac River
Service Plan based on the Removal of Operational Constraints The removal of speed restrictions at Old Town Alexandria and in Washington D.C. along with the use of a more suited vessel that is capable of a cruising speed of 34 mph in both deep and shallow waters would reduce travel times between service points in Virginia, Maryland and Washington D.C. Predicted travel times based on these premises are summarized in Table 10‐4.
Table 10‐4 – Prince William County to Washington D.C. Predicted Run Times
Run Timing Quantico Marine Base to Washington D.C. (Southwest Waterfront) 57.4 minutes
Quantico Marine Base to Washington D.C. (Anacostia Waterfront) 57.8 minutes
Harbor Station to Washington D.C. (Southwest Waterfront) 52.1 minutes
Harbor Station to Washington D.C. (Anacostia Waterfront) 52.5 minutes
Prince William Marina to Washington D.C. (Southwest Waterfront) 61.2 minutes
Prince William Marina to Washington D.C. (Anacostia Waterfront) 61.6 minutes
Occoquan Harbour Marina to Washington D.C. (Southwest Waterfront) 58.1 minutes
Occoquan Harbour Marina to Washington D.C. (Anacostia Waterfront) 58.5 minutes
Belmont Bay Marina to Washington D.C. (Southwest Waterfront) 51.4 minutes
Belmont Bay Marina to Washington D.C. (Anacostia Waterfront) 51.8 minutes
Table 10‐5 summarizes predicted run times with operational constraints removed between other potential service points in Maryland, Virginia and Washington D.C.
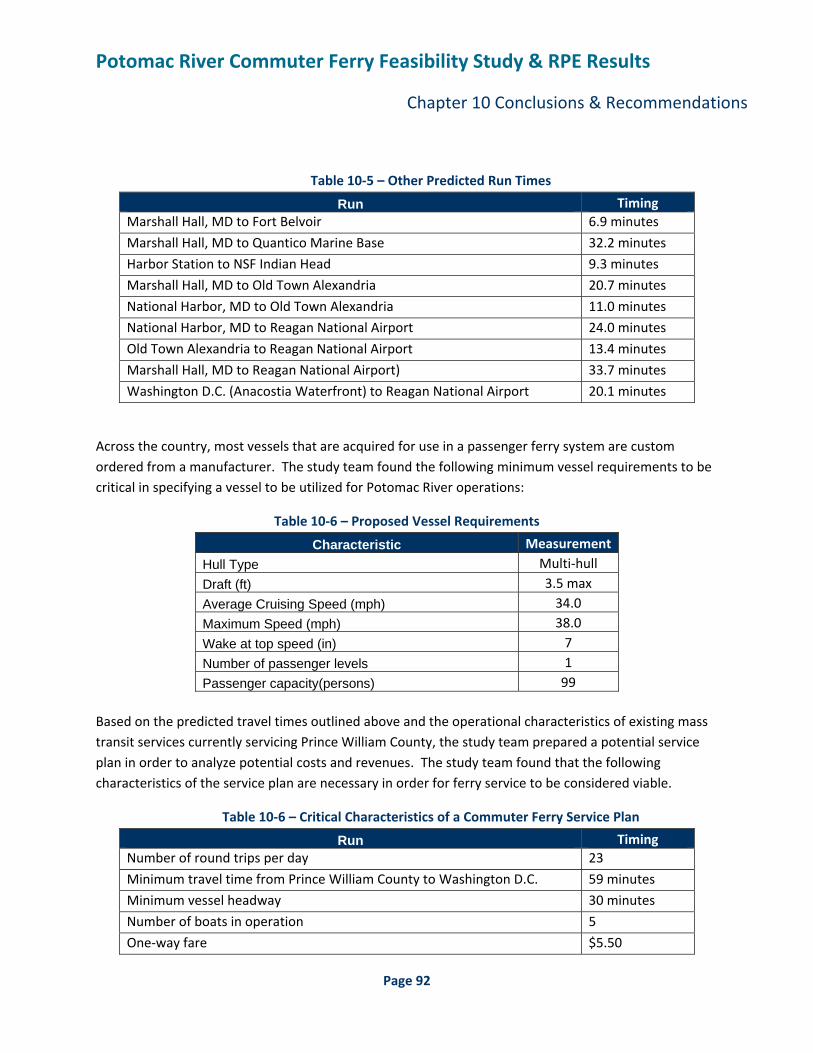
Potomac River Commuter Ferry Feasibility Study & RPE Results
Chapter 10 Conclusions & Recommendations
Page 92
Table 10‐5 – Other Predicted Run Times
Run Timing Marshall Hall, MD to Fort Belvoir 6.9 minutes
Marshall Hall, MD to Quantico Marine Base 32.2 minutes
Harbor Station to NSF Indian Head 9.3 minutes
Marshall Hall, MD to Old Town Alexandria 20.7 minutes
National Harbor, MD to Old Town Alexandria 11.0 minutes
National Harbor, MD to Reagan National Airport 24.0 minutes
Old Town Alexandria to Reagan National Airport 13.4 minutes
Marshall Hall, MD to Reagan National Airport) 33.7 minutes
Washington D.C. (Anacostia Waterfront) to Reagan National Airport 20.1 minutes
Across the country, most vessels that are acquired for use in a passenger ferry system are custom ordered from a manufacturer. The study team found the following minimum vessel requirements to be critical in specifying a vessel to be utilized for Potomac River operations:
Table 10‐6 – Proposed Vessel Requirements
Characteristic Measurement Hull Type Multi‐hull Draft (ft) 3.5 max Average Cruising Speed (mph) 34.0 Maximum Speed (mph) 38.0 Wake at top speed (in) 7 Number of passenger levels 1 Passenger capacity(persons) 99
Based on the predicted travel times outlined above and the operational characteristics of existing mass transit services currently servicing Prince William County, the study team prepared a potential service plan in order to analyze potential costs and revenues. The study team found that the following characteristics of the service plan are necessary in order for ferry service to be considered viable.
Table 10‐6 – Critical Characteristics of a Commuter Ferry Service Plan
Run Timing Number of round trips per day 23
Minimum travel time from Prince William County to Washington D.C. 59 minutes
Minimum vessel headway 30 minutes
Number of boats in operation 5
One‐way fare $5.50
Potomac River Commuter Ferry Feasibility Study & RPE Results
Chapter 10 Conclusions & Recommendations
Page 93
The study team also researched the effect certain environmental factors might have on a proposed ferry service. The study team found that the ferry service would be able to operate during most weather conditions with the exception of ice or high (greater than 40 mph sustained) winds. Most conditions affecting the operation of ferry vessels could be predicted several days in advance
Noise and Wake Impacts Based on the results of the testing conducted during the RPE, the study team found that noise impacts resulting from ferry operations will not have a significant impact on the residences and recreational areas that exist along the banks of the Potomac River. While certain areas along the banks of the Potomac River will experience increases in noise of approximately 10 db(A), the overall noise impact will not exceed the noise abatement criteria published in 23 CFR 772 for the type of land use and the noise impacts will only be experienced intermittently and during normal working hours of the week.
The study team found that wave impacts experienced during the RPE were consistent with wave impacts commonly experienced during periods of low to moderate wind speeds (10‐15 mph). The study team found that maximum wake impacts were experienced during periods of speed transition. Generally, should a vessel with characteristics outlined above be utilized for permanent commuter ferry service, little detrimental effects from vessel wake are anticipated.
Predicted Costs Based on the service plan outlined in this report, the study team developed estimates for both capital and operating costs of a Potomac River commuter ferry service. These costs are preliminary in nature and may vary depending on the final form a prospective commuter ferry operation takes.
The predicted capital cost associated with the start‐up of a commuter ferry service from Prince William County to Washington D.C. is predicted to be between 21.8 million and 29.8 million dollars (current year) depending on final service point selection. The predicted capital cost associated with the start‐up of a commuter ferry service between Marshall Hall, MD, Fort Belvoir, VA and Washington D.C. is predicted to be between 15.7 million and 20.9 million dollars (current year). Specific Federal grants do exist for ferry boat capital costs that may be utilized to fund the start‐up of the service.
Predicted annual operational costs for a ferry service are estimated to be approximately 3.9 million dollars annually (current year) for the Prince William County to Washington D.C. service and 3.0 million dollars annually (current year) for the Marshall Hall, MD, Fort Belvoir, VA and Washington D.C. service.
Predicted Ridership By inputting current commuting conditions from Prince William County to Washington D.C. into the existing model utilized in the VDOT 2000 ferry feasibility study, the study team found that predicted ridership on a permanent commuter ferry service would be approximately 340,000 person‐trips per year. A specific analysis of the modal shift expected as a result of a ferry service was not specifically included as part of the scope of this study. As noted in the opening section of this report, the purpose of
Potomac River Commuter Ferry Feasibility Study & RPE Results
Chapter 10 Conclusions & Recommendations
Page 94
this exercise was to determine if additional analysis of travel demands through market studies and development of a new travel model is warranted. Sole reliance on the travel demand results in this report is not advisable as the model used to predict the travel demand cannot account for some current conditions not in existence at the time of model development. Examples of current conditions that cannot be accounted for in the existing model include direct commuter bus service from Woodbridge to the Navy Yard Metro Station and the addition of HOT lanes on I‐95. Predicted Revenue Based on the service plan analyzed within this report and given an estimated ridership of approximately 340,000 person‐trips per year, the resulting annual operating income for the proposed ferry operation is approximately 1.9 million dollars annually. This translates to a fare box recovery of approximately 49%. This analysis indicates that in order for a commuter ferry service to be viable, the form of operation would need to be similar to the form of operation currently utilized for both VRE and PRTC. The ferry service would require public funding and the operation of the ferry service would need to be by a public agency such as PRTC and VRE.
Service Viability Based on the data and analysis contained herein, a Potomac River ferry operation has the potential to offer a commuting option to the public that in terms of travel time and service between the area of Occoquan, Virginia and SE Washington DC would be competitive with those commuter services offered by PRTC and VRE.
In addition to the service route between Prince William County and Washington D.C. that was the primary focus of this report, the study team analyzed service potential between points in Southern Maryland and Virginia. The study team found significant potential for a commuter ferry operation to serve that segment of the population currently commuting between Southern Maryland and Virginia. This is especially true for military installations along the Potomac River such as Fort Belvoir, NSF‐Indian Head and Quantico Marine Base.
10.3 Recommendations
Should it be determined that further action regarding the implementation of commuter ferry service is warranted, the following actions are recommended.
• Coordination with the proper authorities to obtain speed restriction waivers along the Potomac River should be initiated.
• A more rigorous market analysis should be undertaken to analyze prospective demand by market in order to account for all the significant variables bearing on usage and estimated ridership diversions by mode.
Potomac River Commuter Ferry Feasibility Study & RPE Results
Chapter 10 Conclusions & Recommendations
Page 95
• Continued coordination with local governments and military installations that front the Potomac River should be pursued. While commuter ferry service from Prince William County to Washington D.C. appears viable, there is great potential for a ferry operation to serve cross‐river commuters between Southern Maryland and Virginia.
• Initial investigations into an authority to oversee ferry operations should also be discussed with those counties and cities that might have an interest in commuter ferry service.

3635 Concorde Parkway, Suite 300 | Chantilly, Virginia 20151
www.G-and-O.com | Toll free: 866.322.8905 | Main: 703.263.1220