poultry ‘04 - usda · poultry ’04 is nahms’ second study of the u.s ... are rounded to the...
TRANSCRIPT

United StatesDepartment ofAgriculture
Animal andPlant HealthInspectionService
VeterinaryServices
NationalAnimal HealthMonitoringSystem
August 2005
Poultry ‘04Part II: Reference of Health and Managementof Gamefowl Breeder Flocks in the UnitedStates, 2004

Mention of companies or commercial products doesnot imply recommendation or endorsement by theUSDA over others not mentioned. USDA neitherguarantees nor warrants the standard of any productmentioned. Product names are mentioned solely toreport factually on available data and to providespecific information.
USDA:APHIS:VS:CEAHNRRC Building B, M.S. 2E72150 Centre AvenueFort Collins, CO 80526-8117970.494.7000E-mail: [email protected]/vs/ceah/ncahs
#N433.0805
The U.S. Department of Agriculture (USDA) prohibitsdiscrimination in all its programs and activities on thebasis of race, color, national origin, sex, religion, age,disability, political beliefs, sexual orientation, or maritalor family status. (Not all prohibited bases apply to allprograms). Persons with disabilities who requirealternative means for communication of programinformation (Braille, large print, audiotape, etc.) shouldcontact USDA’s TARGET Center at (202) 720-2600(voice and TDD).
To file a complaint of discrimination, write USDA,Director, Office of Civil Rights, Room 326-W, WhittenBuilding, 1400 Independence Avenue, SW,Washington, DC 20250-9410 or call (202) 720-5964(voice and TDD). USDA is an equal opportunityprovider and employer.
Cover photo: courtesy of UGBA

USDA APHIS VS / i
Acknowledgments
The Poultry ‘04 study was a cooperative effort among animal health officials,university researchers, extension personnel, and poultry producers. We want tothank the industry members who helped determine the direction and objectivesof this study.
We would also like to thank the United Gamefowl Breeders Association forcollaborating in the study’s development and implementation. Thanks also tothe personnel at the Centers for Epidemiology and Animal Health for theirefforts in generating reports from Poultry ‘04 data, and to our reviewers forproviding valuable expertise and guidance through their comments.
All participants are to be commended, particularly the gamefowl owners whosevoluntary efforts made the gamefowl component of the Poultry ’04 studypossible.
Thomas E. Walton
DirectorCenters for Epidemiology and Animal Health

ii / Poultry ‘04
Suggested bibliographic citation for this report:USDA. 2005. Part II: Reference of Health and Management of GamefowlBreeder Flocks in the United States, 2004
USDA:APHIS:VS,CEAH, National Animal Health Monitoring System, FortCollins, CO #N433.0805
Contacts for further information:Questions or comments on the Poultry ‘04 study methods or requests foradditional data analysis: Dr. Lindsey Garber 970.494.7000Information on reprints or other NAHMS reports: Ms. Anne Berry: 970.494.7000
E-mail: [email protected]

USDA APHIS VS / iii
Table of Contents
Introduction 1Terms Used In This Report 2
Section I: Population Estimates 4A. General Management 4
1. Bird numbers and types 42. Distances 83. Housing 94. Animal contact 11
B. Health and Health Care 151. Veterinary services 152. Medication 163. Vaccinations 194. Bird health 255. Health resources 28
C. Biosecurity 321. Dedicated footwear and clothing 322. Hand washing 343. Visitors 364. Ponds and bird feeders 37
D. Bird Movement 381. Bird introductions 382. Sales 443. Contact with other premises with birds 484. Bird transportation 53
E. Carcass and Litter Disposal 581. Dead birds 582. Litter 64
F. Producer Characteristics 671. Reason for having birds 672. Duration of bird ownership 703. Employment in commercial poultry industry 724. UGBA affiliates 73
Section II: Methodology 74A. Needs Assessment 74
B. Sampling and Estimation 741. Mailing list 742. Population inferences 74

iv / Poultry ‘04
C. Data Collection 75
D. Data Analysis 751. Validation and estimation 752. Response rate 75
Appendix I: Sample Profile 761. Number of respondents, by region: 762. Number of respondents, by flock size 76
Appendix II: U.S. Poultry Statistics—2004 77
Appendix III: Poultry ‘04 Study Objectives and Related Outputs 78

Introduction
USDA APHIS VS / 1
Introduction
The National Animal Health Monitoring System (NAHMS) is a nonregulatorydivision of the U.S. Department of Agriculture (USDA) designed to help meetthe Nation’s animal-health information needs.
Layers ’99 was NAHMS’ first national study on poultry baseline health andmanagement. Layers ’99 estimated the prevalence and associated risk factorsof Salmonella enterica Enteritidis in U.S. layer flocks.
Poultry ’04 is NAHMS’ second study of the U.S. poultry industry. For Poultry ’04,NAHMS conducted an extensive assessment to determine the informationneeds of the poultry industry, researchers, and Federal and State governments.This needs assessment indicated a lack of information regarding bird health,bird movement, and biosecurity practices of nontraditional poultry industries,such as backyard flocks, gamefowl, and live poultry markets.
Part I: Reference of Health and Management of Backyard/Small ProductionFlocks in the United States, 2004, was the first in a series of reports containingnational information from the Poultry ’04 study. A questionnaire wasadministered to noncommercial (backyard) flocks in 18 major poultry producingStates.
Part II: Reference of Health and Management of Gamefowl Breeder Flocks inthe United States, 2004, is the second report from the Poultry ‘04 study. Aquestionnaire was mailed to members of United Gamefowl Breeder Association(UGBA) State affiliates and to members of State associations not affiliated withUGBA.
The methods used and the number of respondents in the study can be found atthe end of this report.
Further information on NAHMS studies and reports is available online at:www.aphis.usda.gov/vs/ceah/ncahs
For questions about this report or additional copies, please contact:
USDA:APHIS:VS:CEAHNRRC Building B, M.S. 2E72150 Centre AvenueFort Collins, CO 80526-8117970.494.7000

Introduction
2 / Poultry ‘04
Terms Used InThis Report
Standard Errors(1.0)
10
9
8
7
6
5
4
3
2
1
0(0.3)
Examples of a 95% Confidence Interval
95% Confidence Intervals
Gamefowl: Breeds of chickens, such as Kelso, Hatch, Claret, and Roundhead,intended primarily for exhibition/competition and bred for beauty, strength,health, vitality, and longevity.
Flock size: Flock size is based on the total number of birds present on thepremises on the day of the survey. Small flocks are those with less than 100birds; medium flocks are those with 100-499 birds; and large flocks are thosewith 500 or more birds.
Pet birds: Bird breeds not normally used for food and usually housed in cagesin the home, e.g., parrots, cockatiels, parakeets, finches, and canaries.
Population estimates: Estimates in this report are provided with a measure ofprecision called the standard error. A 95-percent confidence interval can becreated with bounds equal to the estimate, plus or minus two standard errors. Ifthe only error is sampling error, the confidence intervals created in this mannerwill contain the true population mean 95 out of 100 times. In the example at theleft, an estimate of 7.5 with a standard error of 1.0 results in limits of 5.5 to 9.5(two times the standard error above and below the estimate). The secondestimate of 3.4 shows a standard error of 0.3 and results in limits of 2.8 and4.0. Alternatively, the 90-percent confidence interval would be created bymultiplying the standard error by 1.65 instead of 2.0. In general, whencomparing point estimates between categories, estimates with confidencelevels that overlap are not considered different. Most estimates in this reportare rounded to the nearest tenth. If rounded to 0, the standard error wasreported. If there were no reports of the event, no standard error was reported.
Premises: Location where birds are kept.
Regions (participating States):West: Arizona, California, Colorado, Hawaii, Nevada, New Mexico, Oregon,Utah, WashingtonSouth Central: Arkansas, Kansas, Missouri, Oklahoma, TexasNortheast: Connecticut, Delaware, Illinois, Maine, Maryland, Michigan, NewJersey, Ohio, Pennsylvania, Virginia, West VirginiaSoutheast: Alabama, Florida, Georgia, Kentucky, Louisiana, Mississippi, NorthCarolina, South Carolina, Tennessee

Introduction
USDA APHIS VS / 3
FL
NM
DEMD
TXOK
KS
NE
SD
ND
MT
WY
CO
UT
ID
AZ
NV
WA
CA
OR
KY
ME
NY
PA
MI
VT NH
MA
RICT
VA
WV
OHINIL
NC
TN
SCALMS
AR
LA
MO
IA
MN
WI
NJ
GA
Regions
CA
WA
OR
NV
ID
UT
NMAZ
WY
MT
CO
ND
SD
NE
KS
OKTX
MN
IA
MO
AR
LA
WI
IL
TN
KY
MS
IN
MI
OH
AL
FL
GASC
NC
VAWV
PA
MD DE
RINY
VTNH
ME
MACT
NJ
HI
West
South CentralNortheastSoutheast
Shaded States = Participating States
Regions

Section I: Population Estimates
4 / Poultry ‘04
Section I: Population Estimates
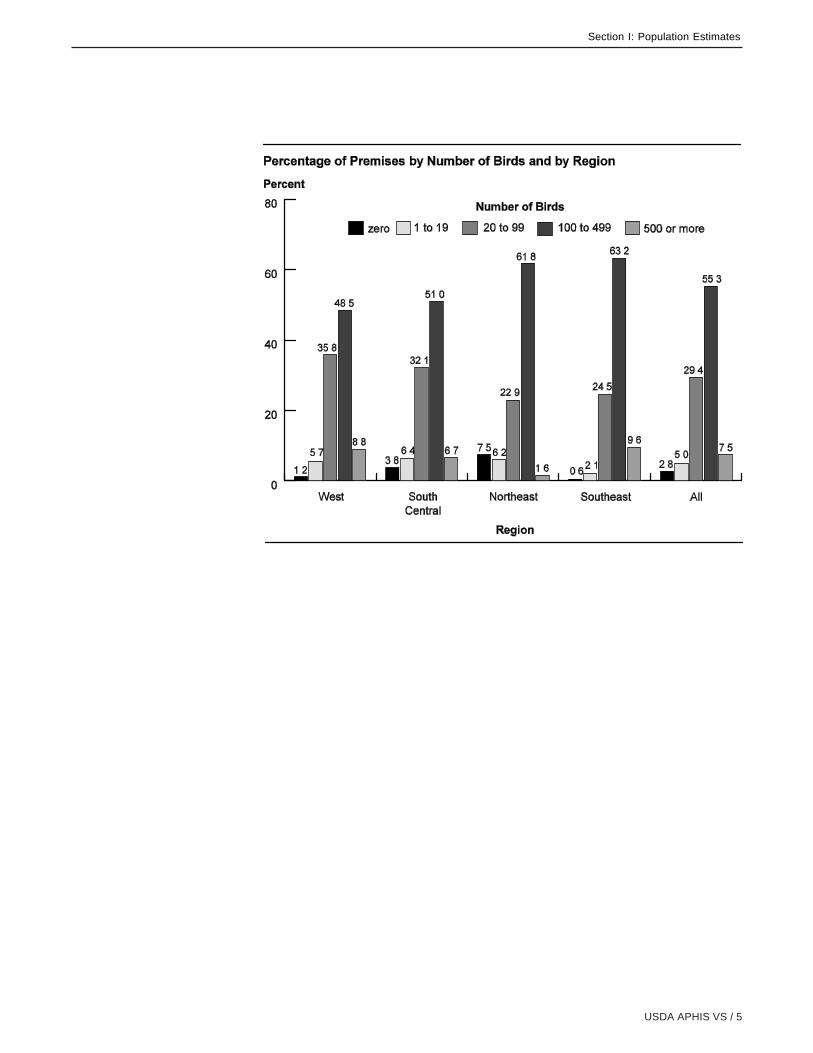
1. Bird numbers and typesA total of 2.8 percent of premises had no birds, ranging from 0.6 percent in theSoutheast region to 7.5 percent in the Northeast region. Over half of premises(55.3 percent) had between 100 and 499 birds, and 7.5 percent had 500 ormore birds.
a. Percentage of premises by number of birds and by region:
A. General Management
Percent Premises Region
West South
Central Northeast Southeast All Number of Birds* Pct.
Std. Error Pct.
Std. Error Pct.
Std. Error Pct.
Std. Error Pct.
Std. Error
0 1.2 (1.0) 3.8 (1.5) 7.5 (2.9) 0.6 (0.6) 2.8 (0.9)
1 to 19 5.7 (2.4) 6.4 (1.9) 6.2 (2.7) 2.1 (1.0) 5.0 (1.1)
20 to 99 35.8 (5.1) 32.1 (3.7) 22.9 (4.6) 24.5 (2.5) 29.4 (2.2)
100 to 499 48.5 (5.1) 51.0 (3.9) 61.8 (5.2) 63.2 (2.9) 55.3 (2.3)
500 or more 8.8 (3.0) 6.7 (2.0) 1.6 (1.5) 9.6 (1.8) 7.5 (1.2)
Total 100.0 100.0 100.0 100.0 100.0
* The Poultry ’04 Gamefowl survey was mailed to all members of the UGBA State affiliates, some of which had no birds at the time of the survey.
USDA APHIS VS / 5
Section I: Population Estimates

Section I: Population Estimates
6 / Poultry ‘04
Nearly all premises with birds (98.4 percent) had gamefowl. Over 10 percent ofpremises had other types of chickens and pet birds.
b. Percentage of premises with birds by type of bird of any age on the premisesand by region:
Percent Premises
Region
West South
Central Northeast Southeast All
Type of Bird Pct. Std. Error Pct.
Std. Error Pct.
Std. Error Pct.
Std. Error Pct.
Std. Error
Chickens: table egg breeds (e.g., leghorn, sex-link) 18.3 (3.8) 13.6 (2.7) 16.0 (3.4) 11.3 (2.0) 13.4 (1.6) Chickens: meat breeds (e.g., Cornish, broiler) 4.3 (2.1) 4.7 (1.7) 2.8 (1.6) 4.9 (1.2) 4.6 (1.0) Chickens: gamefowl 98.8 (0.7) 98.0 (1.1) 98.6 (1.3) 99.0 (0.6) 98.4 (0.6) Chickens: other (show/ exhibition) 18.9 (4.0) 8.8 (2.2) 11.7 (3.0) 10.5 (1.9) 10.5 (1.4)
Turkeys 4.1 (1.9) 3.6 (1.5) 2.5 (1.8) 2.3 (0.9) 3.2 (0.9)
Ducks 2.5 (1.4) 4.3 (1.6) 4.2 (2.4) 4.6 (1.4) 4.2 (1.0)
Other water fowl (e.g., geese, swans) 4.5 (2.2) 2.3 (1.2) 3.9 (2.2) 0.6 (0.6) 2.0 (0.7) Pigeons or doves 8.3 (2.8) 6.7 (2.0) 4.3 (1.7) 7.6 (1.8) 7.0 (1.2) Ratites (ostriches) 0.0 (--) 0.0 (--) 1.4 (1.3) 0.3 (0.3) 0.2 (0.1) Game birds (quail/ pheasant) 3.1 (1.6) 4.0 (1.6) 3.9 (2.2) 3.1 (1.0) 3.6 (0.9)
Guinea fowl 6.7 (2.5) 4.3 (1.6) 1.4 (0.8) 7.3 (1.6) 5.3 (1.0)
Peafowl 1.9 (1.3) 2.7 (1.3) 0.7 (0.7) 1.9 (0.7) 2.2 (0.7)
Pet birds (caged birds like parrots) 10.5 (3.0) 12.9 (2.7) 11.7 (3.5) 11.5 (2.1) 12.2 (1.6) Other bird species 0.0 (--) 0.0 (--) 0.0 (--) 0.3 (0.3) 0.1 (0.1)

USDA APHIS VS / 7
Section I: Population Estimates
Over one-third of premises (36.9 percent) had more than one type of bird.
c. Percentage of premises with more than one type of bird:
Percent Premises Standard Error
36.9 (2.3)
Note: The remainder of this report includes only premises with birds.
Overall, 5.7 percent of the birds on premises that had any gamefowl werespecies other than chickens.
d. For premises with any gamefowl, percentage of birds by bird type:
Bird Type Percent Birds Standard Error
Chickens–gamefowl 91.5 (2.0)
Chickens–other than gamefowl 2.8 (0.4)
Ducks and other waterfowl (e.g., geese, swans) 0.3 (0.1)
Pet birds 0.6 (0.2)
Other 4.8 (1.8)
Total 100.0

Section I: Population Estimates
8 / Poultry ‘04
2. DistancesWhile nearly all respondents could estimate the distance to the nearest feedstore, only about half could estimate the distance to the nearest auction, fleamarket, or commercial operation, and even fewer could estimate the distanceto the nearest live-bird market. Over one-third of premises (35.1 percent) werelocated within 5 miles of a feed store, while 21.6 percent (about half of thosethat provided a distance estimate) were located 20 or more miles from thenearest commercial operation.
a. Percentage of premises by number of miles to nearest . . .
Percent Premises
Feed Store
Auction Where Birds
Are Sold Flea Market/ Swap Meet
Live-Bird Market
Commercial Operation
Miles Pct. Std.
Error Pct. Std.
Error Pct. Std.
Error Pct. Std.
Error Pct. Std.
Error Less than 5 35.1 (2.3) 2.0 (0.7) 1.4 (0.5) 0.4 (0.2) 8.5 (1.1)
5 to 9 28.6 (2.1) 2.7 (0.8) 4.9 (1.0) 1.9 (0.7) 4.8 (0.8)
10 to 19 22.0 (1.9) 5.4 (0.8) 10.7 (1.4) 5.6 (1.1) 9.1 (1.3)
20 or more 12.2 (1.5) 32.0 (2.2) 34.6 (2.2) 17.2 (1.7) 21.6 (1.9)
Did not know 2.1 (0.7) 57.9 (2.3) 48.4 (2.3) 74.9 (2.0) 56.0 (2.2)
Total 100.0 100.0 100.0 100.0 100.0

USDA APHIS VS / 9
Section I: Population Estimates
Only 6.8 percent of premises were located within 1 mile of a commercialoperation. Of the respondents that did not know the distance to the nearestcommercial operation, most knew that there was no commercial operationwithin 1 mile.
b. Percentage of premises by number of commercial poultry operations within 1mile and by region:
3. HousingNine out of ten premises (91.5 percent) housed birds inside a barn or coop.Over half of all premises (57.0 percent) had birds that were able to leave theproperty, ranging from 44.2 percent of premises in the West region to 69.4percent in the Northeast region.
a. Percentage of premises by bird housing type and by region:
Percent Premises Region
West South
Central Northeast Southeast All Number Commercial Operations Pct.
Std. Error Pct.
Std. Error Pct.
Std. Error Pct.
Std. Error Pct.
Std. Error
0 92.7 (3.0) 94.8 (1.8) 98.2 (1.7) 90.0 (1.6) 93.2 (1.1)
1 2.8 (1.9) 4.0 (1.7) 0.0 (--) 5.0 (1.2) 4.0 (0.9)
2 or more 4.5 (2.5) 1.2 (0.9) 1.8 (1.7) 5.0 (1.2) 2.8 (0.7)
Total 100.0 100.0 100.0 100.0 100.0
Percent Premises Region
West South
Central Northeast Southeast All Housing Type Pct.
Std. Error Pct.
Std. Error Pct.
Std. Error Pct.
Std. Error Pct.
Std. Error
Outdoors, confined to property 90.8 (2.9) 82.5 (3.1) 89.4 (3.3) 89.7 (1.9) 86.0 (1.7) Outdoors, able to leave property 44.2 (5.1) 53.0 (4.0) 69.4 (5.4) 64.6 (2.9) 57.0 (2.4) Inside, as in a barn or coop 89.7 (3.2) 92.5 (2.1) 94.5 (2.6) 89.9 (1.9) 91.5 (1.3)

Section I: Population Estimates
10 / Poultry ‘04
Nearly all premises where birds were housed indoors (97.1 percent) kept somebirds in pens, while about half (54.7 percent) kept some birds in cages. Somepremises used both housing types.
b. For premises where birds were housed inside, percentage of premises bytype of indoor housing and by region:
Percent Premises Region
West South
Central Northeast Southeast All Housing Type Pct.
Std. Error Pct.
Std. Error Pct.
Std. Error Pct.
Std. Error Pct.
Std. Error
Cages 73.0 (4.7) 50.1 (4.2) 53.1 (6.1) 57.1 (3.1) 54.7 (2.5)
Pens 94.3 (2.6) 96.7 (1.5) 98.5 (1.4) 98.2 (0.9) 97.1 (0.9)
The majority of premises that housed birds indoors (83.6 percent) allowed atleast some birds outside access.
c. For premises that housed birds indoors, percentage of premises where atleast some birds were allowed outdoors, by region:
Percent Premises
Region
West South Central Northeast Southeast All
Pct. Std.
Error Pct. Std.
Error Pct. Std.
Error Pct. Std.
Error Pct. Std. Error
79.1 (4.4) 80.0 (3.4) 92.3 (3.3) 89.1 (2.0) 83.6 (1.9)

USDA APHIS VS / 11
Section I: Population Estimates
4. Animal contactPredators such as raccoons, foxes, skunks, or possums had access to birdareas on 42.6 percent of premises in the West region and 80.8 percent ofpremises in the Northeast region.
a. Percentage of premises where raccoons, foxes, skunks, or possums hadaccess to bird areas, by region:
Percent Premises
Region
West South Central Northeast Southeast All
Pct. Std.
Error Pct. Std.
Error Pct. Std.
Error Pct. Std.
Error Pct. Std. Error
42.6 (5.0) 54.5 (4.0) 80.8 (4.5) 71.7 (2.7) 60.7 (2.3)
While birds on 82.2 percent of premises had exposure to wild birds, only 5.3percent of premises reported that their birds had contact with neighbors’ poultry.Other animals consisted primarily of horses and wildlife.
b. Percentage of premises where birds had contact with other animals, by typeof animal and by region:
Percent Premises Region
West South
Central Northeast Southeast All
Type of Animal Pct. Std.
Error Pct. Std.
Error Pct. Std.
Error Pct. Std.
Error Pct. Std.
Error Owner’s dogs or cats 75.3 (4.5) 80.1 (3.2) 87.5 (3.8) 81.2 (2.3) 80.5 (1.9) Neighbors’ dogs or cats 18.2 (3.9) 19.8 (3.2) 24.2 (4.9) 18.9 (2.4) 19.6 (1.9)
Neighbors’ poultry 6.8 (2.7) 5.4 (1.8) 2.9 (2.0) 5.2 (1.4) 5.3 (1.1)
Wild birds 70.9 (4.7) 80.8 (3.2) 87.2 (3.5) 86.6 (2.0) 82.2 (1.8)
Pigs 3.1 (1.8) 3.4 (1.5) 2.9 (1.6) 2.9 (0.9) 3.2 (0.8)
Cattle/sheep/goats 27.0 (4.7) 23.4 (3.4) 15.0 (3.9) 26.0 (2.7) 24.1 (2.0)
Other animals 17.2 (4.0) 17.6 (3.0) 16.4 (4.2) 19.7 (2.5) 18.1 (1.8)

Section I: Population Estimates
12 / Poultry ‘04
Evidence of rodents was usually or sometimes observed on approximately halfof premises (48.3 percent). Evidence of rodents was similar across regions.
c. Percentage of premises by frequency that rodents or evidence of rodentswere observed in bird areas and by region:
Percent Premises Region
West South
Central Northeast Southeast All
Frequency Pct. Std. Error Pct.
Std. Error Pct.
Std. Error Pct.
Std. Error Pct.
Std. Error
Usually 10.2 (3.0) 10.2 (2.4) 6.5 (2.6) 10.3 (2.0) 10.0 (1.5)
Sometimes 41.3 (5.2) 35.2 (3.9) 47.1 (5.8) 41.0 (2.9) 38.3 (2.3)
Rarely 37.1 (5.0) 43.0 (4.0) 40.2 (5.8) 42.3 (3.0) 42.1 (2.4)
Never 11.4 (3.3) 11.6 (2.6) 6.2 (2.9) 6.4 (1.5) 9.6 (1.5)
Total 100.0 100.0 100.0 100.0 100.0
USDA APHIS VS / 13
Section I: Population Estimates
Bait was the most common form of rodent control used in all regions. Aprofessional exterminator was used on 7.8 percent of premises.
d. Percentage of premises by rodent control method used in bird areas and byregion:
Percent Premises Region
West South
Central Northeast Southeast All
Control Method Pct. Std.
Error Pct. Std.
Error Pct. Std.
Error Pct. Std.
Error Pct. Std.
Error
Bait 65.3 (4.9) 61.0 (3.9) 67.9 (5.1) 70.4 (2.8) 64.9 (2.3)
Traps and sticky tape 48.5 (5.2) 32.6 (3.8) 36.8 (5.6) 40.8 (3.0) 37.0 (2.3)
Cats 32.8 (4.8) 41.4 (4.0) 37.2 (5.5) 33.0 (2.9) 37.6 (2.4)
Dogs 49.5 (5.3) 51.6 (4.0) 41.3 (5.7) 58.1 (3.0) 52.9 (2.4)
Professional exterminator 10.6 (3.3) 9.1 (2.3) 1.8 (1.7) 6.1 (1.6) 7.8 (1.4)
Other 3.7 (1.8) 2.3 (1.2) 1.4 (0.8) 2.4 (0.9) 2.4 (0.7)
Any 93.8 (2.6) 93.2 (2.1) 92.8 (2.8) 95.4 (1.2) 94.0 (1.2)
Photo: Judy Rodriguez

Section I: Population Estimates
14 / Poultry ‘04
Bait was used more commonly on premises that usually or sometimesobserved evidence of rodents than on premises that rarely or never observedrodents.
e. Percentage of premises by rodent control methods used in the bird areasand by frequency of observing rodents:
Percent Premises
Frequency of Observing Rodents
Usually/Sometimes Rarely/Never
Control Method Percent Standard
Error Percent Standard
Error
Bait 75.4 (3.0) 54.8 (3.4)
Traps and sticky tape 42.1 (3.3) 30.7 (3.2)
Cats 37.3 (3.4) 37.1 (3.4)
Dogs 53.3 (3.4) 52.0 (3.4)
Professional exterminator 6.2 (1.7) 9.3 (2.1)
Other 1.7 (0.6) 3.3 (1.3)
Any 97.4 (1.0) 90.7 (2.1)

USDA APHIS VS / 15
Section I: Population Estimates
B. Health andHealth Care
1. Veterinary servicesOverall, 18.2 percent of premises had used the services of veterinarian in theprevious 12 months.
a. Percentage of premises that used veterinary services for any bird(s) for anyreason in the previous 12 months, by region:
Percent Premises
Region
West South Central Northeast Southeast All
Pct. Std.
Error Pct. Std.
Error Pct. Std.
Error Pct. Std.
Error Pct. Std. Error
15.1 (3.9) 19.0 (3.2) 8.7 (3.1) 19.4 (2.4) 18.2 (1.9)
For large flocks, more than 4 out of 10 premises (42.0 percent) used theservices of veterinarian in the previous 12 months.
b. Percentage of premises that used veterinary services for any bird(s) for anyreason in the previous 12 months, by flock size:
Percent Premises
Flock Size (Number of Birds) Small
(1 to 99) Medium
(100 to 499) Large
(500 or More)
Percent Standard
Error Percent Standard
Error Percent Standard
Error
16.0 (3.3) 16.7 (2.4) 42.0 (8.4)

Section I: Population Estimates
16 / Poultry ‘04
2. MedicationNearly all premises (91.6 percent) obtained some medication in the previous12 months. The most common source of medication was farm or feed store,followed by mail order or Internet.
a. Percentage of premises by source of birds’ medication in the previous12 months and by region:
Percent Premises Region
West South
Central Northeast Southeast All
Source Pct. Std.
Error Pct. Std.
Error Pct. Std.
Error Pct. Std.
Error Pct. Std.
Error Mail order or Internet 52.0 (5.3) 44.6 (4.0) 52.9 (5.6) 57.7 (3.0) 50.1 (2.4)
Farm or feed store 84.4 (3.8) 88.0 (2.6) 79.0 (4.6) 84.7 (2.1) 86.1 (1.6)
Make own 25.4 (4.5) 17.0 (3.0) 7.8 (2.8) 16.4 (2.3) 17.1 (1.8)
Veterinarian 18.6 (4.1) 13.6 (2.7) 23.1 (4.8) 18.7 (2.3) 16.3 (1.7)
Other suppliers 10.5 (3.0) 4.7 (1.7) 9.7 (3.3) 10.2 (1.8) 7.3 (1.1)
None 9.3 (3.0) 8.0 (2.2) 10.0 (3.4) 8.6 (1.6) 8.4 (1.3)
Obtaining medication via mail order or Internet increased as flock sizeincreased.
b. Percentage of premises by source of birds’ medication in the previous12 months and by flock size:
Percent Premises
Flock Size (Number of Birds)
Small
(1 to 99) Mediium
(100 to 499) Large
(500 or More)
Source Percent Std.
Error Percent Std.
Error Percent Std.
Error
Mail order or Internet 45.0 (4.1) 51.1 (3.1) 65.6 (8.5)
Farm or feed store 84.2 (3.0) 87.6 (1.9) 82.7 (6.6)
Make own 12.7 (2.7) 18.5 (2.5) 27.1 (7.3)
Veterinarian 13.0 (2.8) 16.3 (2.2) 29.6 (6.8)
Other suppliers 6.6 (2.1) 7.3 (1.3) 9.4 (4.1)
None 10.7 (2.5) 7.2 (1.5) 7.2 (4.6)

USDA APHIS VS / 17
Section I: Population Estimates
Use of injectable vitamins ranged from 46.5 percent of premises in theNortheast region to 83.1 percent of premises in the West region. Coccidiosisprevention or treatment increased as flock size increased (table d). Othermedication consisted mainly of dewormers and oral vitamins.
c. Percentage of premises that administered medication to the flock in theprevious 12 months, by medication and by region:
Percent Premises Region
West South
Central Northeast Southeast All
Medication Pct. Std.
Error Pct. Std.
Error Pct. Std.
Error Pct. Std.
Error Pct. Std.
Error
Injectable vitamins 83.1 (3.8) 71.8 (3.6) 46.5 (5.9) 62.7 (3.0) 68.4 (2.2)
Coccidiosis prevention or treatment 59.3 (5.2) 62.2 (3.9) 71.5 (5.2) 71.9 (2.7) 65.7 (2.3) Antibiotics for disease treatment 86.0 (3.7) 70.0 (3.7) 77.4 (4.7) 71.3 (2.7) 72.3 (2.2)
Other medication 13.0 (3.3) 23.2 (3.4) 31.4 (5.5) 32.9 (2.9) 25.9 (2.1)

Section I: Population Estimates
18 / Poultry ‘04
d. Percentage of premises that administered medication to the flock in theprevious 12 months, by medication and by flock size:
Percent Premises
Flock Size (Number of Birds)
Small
(1 to 99) Medium
(100 to 499) Large
(500 or More)
Medication Pct. Std.
Error Pct. Std.
Error Pct. Std.
Error
Injectable vitamins 71.0 (3.6) 66.1 (3.0) 72.0 (7.6)
Coccidiosis prevention or treatment 50.2 (4.2) 72.0 (2.8) 89.4 (3.8) Antibiotics for disease treatment 69.1 (3.9) 73.9 (2.8) 73.4 (7.6)
Other medication 22.4 (3.4) 28.5 (2.8) 24.9 (7.4)

USDA APHIS VS / 19
Section I: Population Estimates
3. VaccinationsOver half of all premises (58.6 percent) vaccinated birds, ranging from 44.8percent of premises in the Northeast region to 68.0 percent in the West region.Over three-fourths of large premises (78.3 percent) vaccinated birds.
a. Percentage of premises that vaccinated any birds in the previous 12 months,by region:
Percent Premises
Region
West South Central Northeast Southeast All
Pct. Std.
Error Pct. Std.
Error Pct. Std.
Error Pct. Std.
Error Pct. Std. Error
68.0 (4.9) 64.2 (3.9) 44.8 (5.5) 49.5 (3.0) 58.6 (2.3)
b. Percentage of premises that vaccinated any birds in the previous 12 months,by flock size:
Percent Premises
Flock Size (Number of Birds) Small
(1 to 99) Medium
(100 to 499) Large
(500 or More)
Percent Standard
Error Percent Standard
Error Percent Standard
Error
54.4 (4.1) 58.6 (3.0) 78.3 (6.8)

Section I: Population Estimates
20 / Poultry ‘04
Half of all premises (49.8 percent) vaccinated birds against pox, ranging from34.3 percent of premises in the Northeast region to 56.0 percent in the SouthCentral region.
c. Percentage of premises that vaccinated any birds against the followingdiseases in the previous 12 months, by region:
Percent Premises Region
West South
Central Northeast Southeast All
Vaccine Pct. Std.
Error Pct. Std.
Error Pct. Std.
Error Pct. Std.
Error Pct. Std.
Error
Newcastle disease 31.7 (4.9) 31.0 (3.9) 28.6 (5.2) 23.8 (2.6) 28.5 (2.2)
Laryngotracheitis 14.2 (3.7) 8.9 (2.4) 3.5 (2.1) 7.6 (1.7) 8.7 (1.4)
Pox 44.5 (5.1) 56.0 (4.2) 34.3 (5.7) 44.3 (3.0) 49.8 (2.4)
Infectious bronchitis 22.9 (4.5) 19.9 (3.3) 25.0 (5.2) 15.6 (2.3) 19.1 (2.0)
Infectious bursal disease 16.4 (4.0) 5.9 (2.0) 3.5 (2.4) 7.9 (1.9) 7.5 (1.3) Mycoplasma gallisepticum 18.1 (4.1) 8.9 (2.2) 16.0 (4.4) 16.0 (2.3) 12.6 (1.4) Avian encephalomyelitis 9.8 (3.2) 6.3 (2.0) 6.6 (3.0) 6.2 (1.7) 6.6 (1.2)
Fowl cholera 16.3 (3.9) 14.5 (2.9) 8.6 (3.6) 13.0 (2.2) 13.8 (1.7)
Other 7.3 (2.8) 5.1 (1.8) 11.3 (3.8) 9.1 (1.8) 7.0 (1.2)

USDA APHIS VS / 21
Section I: Population Estimates

Section I: Population Estimates
22 / Poultry ‘04
About two-thirds of large flocks (63.0 percent) were vaccinated against pox,and nearly half of large flocks (46.5 percent) were vaccinated againstNewcastle disease. The most common “other” disease vaccinated against wascoryza.
d. Percentage of premises that vaccinated any birds against the followingdiseases in the previous 12 months, by flock size:
Injection was the most common route used to administer vaccine for Newcastledisease (66.8 percent of premises).
e. For premises that vaccinated against Newcastle disease in the previous 12months, percentage of premises by route vaccine was administered:
Percent Premises
Route
Drinking Water Injection
Percent Standard Error Percent Standard Error
49.0 (4.8) 66.8 (4.4)
Percent Premises
Flock Size (Number of Birds)
Small
(1 to 99) Medium
(100 to 499) Large
(500 or More)
Vaccine Pct. Std. Error Pct.
Std. Error Pct.
Std. Error
Newcastle disease 31.0 (4.1) 24.4 (2.7) 46.5 (8.6)
Laryngotracheitis 13.4 (3.0) 5.9 (1.5) 8.8 (5.2)
Pox 52.7 (4.3) 46.1 (3.2) 63.0 (8.3)
Infectious bronchitis 22.2 (3.7) 16.2 (2.3) 25.1 (7.8)
Infectious bursal disease 11.0 (2.7) 4.0 (1.1) 17.8 (6.8)
Mycoplasma gallisepticum 12.3 (2.8) 11.4 (1.7) 21.3 (6.6)
Avian encephalomyelitis 9.5 (2.5) 4.7 (1.4) 8.7 (5.2)
Fowl cholera 16.5 (3.2) 12.3 (2.1) 14.2 (5.9)
Other 4.3 (1.8) 7.9 (1.5) 11.9 (5.7)

USDA APHIS VS / 23
Section I: Population Estimates
Photo: courtesy of UGBA
Drinking water was the most common route used for laryngotracheitisvaccination.
f. For premises that vaccinated against laryngotracheitis, percentage ofpremises by route vaccine was administered:
Percent Premises
Route
Eyedropper Spray Drinking Water
Percent Standard
Error Percent Standard
Error Percent Standard
Error
29.3 (7.6) 27.1 (8.1) 68.6 (8.1)

Section I: Population Estimates
24 / Poultry ‘04
The majority of premises that vaccinated birds reported that they hatchedchicks (96.1 percent of premises). For premises that vaccinated any birds,55.1 percent vaccinated chicks against Marek’s disease, and 41.0 percenthatched eggs but did not vaccinate chicks. Overall, 31.2 percent of all premisesvaccinated chicks against Marek’s disease.
g. For premises that vaccinated any birds, percentage of premises thatvaccinated chicks against Marek’s disease:
h. Percentage of all premises that vaccinated chicks against Marek’s disease:
Percent Premises
Yes No Did Not hatch chicks
Percent Standard
Error Percent Standard
Error Percent Standard
Error
55.1 (3.3) 41.0 (3.3) 3.9 (1.4)
Percent Premises Standard Error
31.2 (2.3)
USDA APHIS VS / 25
Section I: Population Estimates
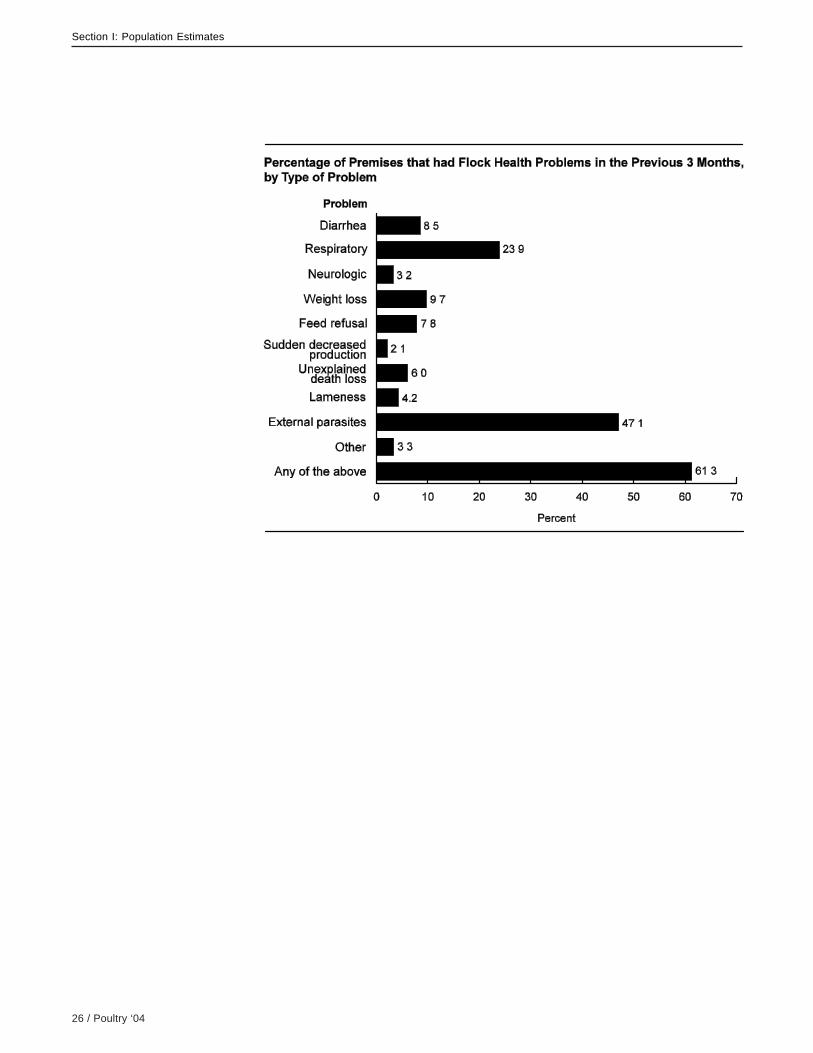
4. Bird healthAbout half of premises (47.1 percent) reported problems in their flocks withexternal parasites, and about one in four (23.9 percent) reported respiratoryproblems.
a. Percentage of premises that had the following flock health problems in theprevious 3 months, by region:
Percent Premises Region
West South
Central Northeast Southeast All
Problem Pct. Std.
Error Pct. Std.
Error Pct. Std. Error Pct.
Std. Error Pct.
Std. Error
Diarrhea 14.6 (3.7) 9.8 (2.4) 0.7 (0.6) 6.1 (1.3) 8.5 (1.4)
Respiratory (nasal/eye discharge, cough/sneeze, swollen sinuses) 26.7 (4.7) 26.5 (3.6) 13.2 (4.0) 21.1 (2.4) 23.9 (2.1) Neurologic (lack of coordination, weakness) 5.0 (2.4) 3.0 (1.4) 0.7 (0.6) 3.3 (0.9) 3.2 (0.8)
Weight loss 6.8 (2.6) 11.8 (2.6) 3.6 (2.0) 8.3 (1.6) 9.7 (1.5)
Feed refusal/depression (droopy birds) 7.9 (2.8) 9.2 (2.3) 5.7 (2.7) 6.0 (1.4) 7.8 (1.3) Sudden decreased production not related to molting (reduced egg laying, hatching rate, no weight gain) 0.6 (0.5) 2.7 (1.3) 0.0 (--) 1.9 (0.7) 2.1 (0.7)
Unexplained death loss 5.6 (2.4) 6.1 (2.0) 8.6 (3.2) 5.4 (1.4) 6.0 (1.2)
Lameness 6.9 (2.7) 4.1 (1.6) 3.9 (2.0) 3.6 (1.0) 4.2 (0.9)
External parasites (mites, lice, etc.) 49.9 (5.3) 48.3 (4.0) 59.8 (5.3) 42.1 (2.9) 47.1 (2.4)
Other 1.9 (1.4) 3.3 (1.4) 2.2 (1.0) 4.0 (1.2) 3.3 (0.8)
Any of the above 61.1 (5.2) 64.4 (3.9) 67.3 (5.0) 55.4 (3.0) 61.3 (2.3)
Section I: Population Estimates
26 / Poultry ‘04

USDA APHIS VS / 27
Section I: Population Estimates
b. Percentage of premises that had the following flock health problems in theprevious 3 months, by flock size:
Percent Premises
Flock Size (Number of Birds)
Small
(1 to 99) Medium
(100 to 499) Large
(500 or More)
Problem Percent Std.
Error Percent Std.
Error Percent Std.
Error
Diarrhea 4.2 (1.6) 10.8 (2.1) 11.0 (5.0)
Respiratory (nasal/eye discharge, cough/sneeze, swollen sinuses) 19.5 (3.4) 26.0 (2.8) 29.2 (7.5) Neurologic (lack of coordination, weakness) 0.6 (0.4) 3.5 (1.1) 12.5 (6.1)
Weight loss 7.2 (2.3) 11.2 (2.1) 10.5 (4.9)
Feed refusal/depression (droopy birds) 7.8 (2.5) 7.7 (1.7) 7.9 (4.7) Sudden decreased production not related to molting (reduced egg laying, hatching rate, no weight gain) 3.6 (1.7) 0.5 (0.3) 7.1 (4.6)
Unexplained death loss 4.3 (1.6) 6.9 (1.6) 5.8 (4.5)
Lameness 1.6 (1.0) 4.7 (1.4) 12.3 (5.2)
External parasites (mites, lice, etc.) 38.1 (4.0) 51.0 (3.1) 59.3 (8.1)
Other 1.7 (0.7) 3.8 (1.2) 7.0 (4.6)
Any of the above 50.9 (4.2) 66.6 (2.9) 70.1 (7.4)
Section I: Population Estimates
28 / Poultry ‘04
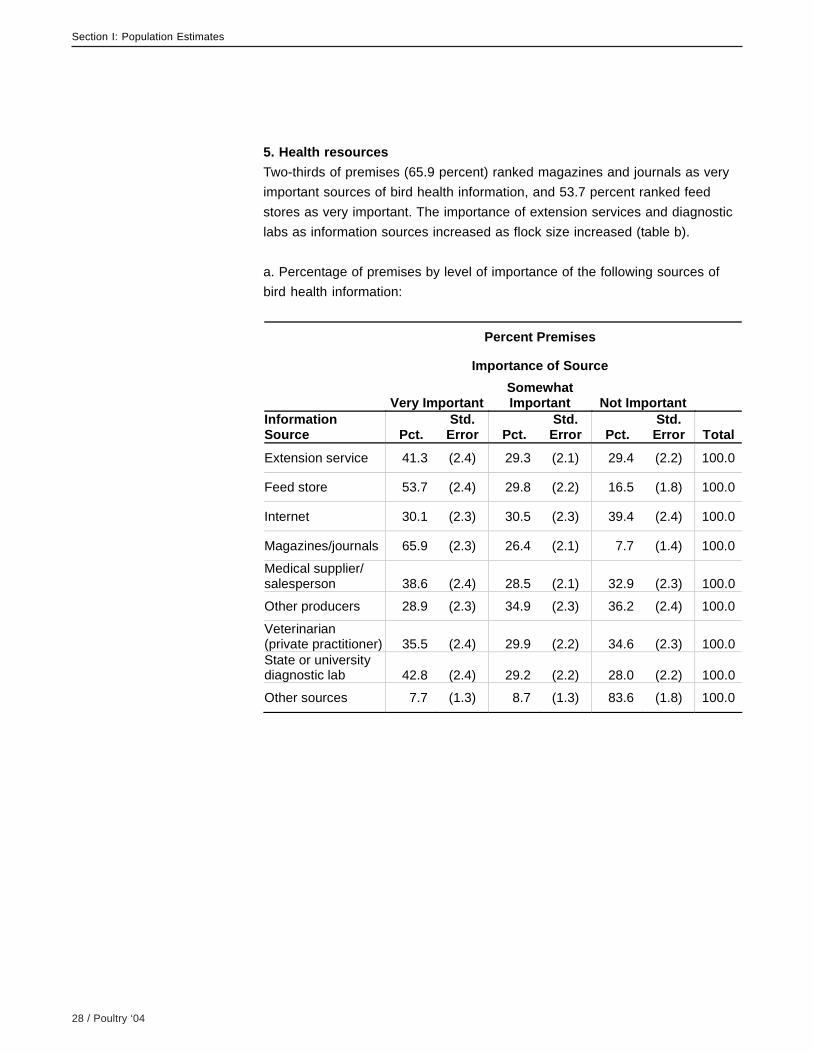
5. Health resourcesTwo-thirds of premises (65.9 percent) ranked magazines and journals as veryimportant sources of bird health information, and 53.7 percent ranked feedstores as very important. The importance of extension services and diagnosticlabs as information sources increased as flock size increased (table b).
a. Percentage of premises by level of importance of the following sources ofbird health information:
Percent Premises
Importance of Source
Very Important Somewhat Important Not Important
Information Source Pct.
Std. Error Pct.
Std. Error Pct.
Std. Error Total
Extension service 41.3 (2.4) 29.3 (2.1) 29.4 (2.2) 100.0
Feed store 53.7 (2.4) 29.8 (2.2) 16.5 (1.8) 100.0
Internet 30.1 (2.3) 30.5 (2.3) 39.4 (2.4) 100.0
Magazines/journals 65.9 (2.3) 26.4 (2.1) 7.7 (1.4) 100.0
Medical supplier/ salesperson 38.6 (2.4) 28.5 (2.1) 32.9 (2.3) 100.0
Other producers 28.9 (2.3) 34.9 (2.3) 36.2 (2.4) 100.0
Veterinarian (private practitioner) 35.5 (2.4) 29.9 (2.2) 34.6 (2.3) 100.0 State or university diagnostic lab 42.8 (2.4) 29.2 (2.2) 28.0 (2.2) 100.0
Other sources 7.7 (1.3) 8.7 (1.3) 83.6 (1.8) 100.0

USDA APHIS VS / 29
Section I: Population Estimates

Section I: Population Estimates
30 / Poultry ‘04
b. Percentage of premises that ranked the following sources of bird healthinformation as very important, by flock size:
The majority of premises reported that veterinary care, vaccinations, andmedications were readily available. However, veterinary care was more difficultto access than vaccinations and medications. Overall, 17.4 percent of premisesranked access to veterinary care as low (score 1 or 2 on a scale of 1 to 5),while 5.9 percent and 2.7 percent of premises ranked the availability ofvaccinations and medications as low, respectively. The availability of products/services increased as flock size increased (table e).
Percent Premises
Flock Size (Number of Birds)
Small
(1 to 99) Medium
(100 to 499) Large
(500 or More)
Information Source Percent Std.
Error Percent Std.
Error Percent Std.
Error
Extension service 39.1 (4.1) 39.2 (3.1) 65.4 (7.6)
Feed store 56.6 (4.1) 52.3 (3.1) 50.1 (8.5)
Internet 27.9 (3.9) 30.4 (2.9) 37.6 (8.0)
Magazines/journals 64.9 (4.0) 66.6 (2.9) 64.9 (8.6)
Medical supplier/ salesperson 40.8 (4.1) 35.6 (3.0) 49.7 (8.5)
Other producers 24.9 (3.8) 31.1 (3.0) 31.4 (8.0)
Veterinarian (private practitioner) 38.3 (4.1) 33.3 (3.0) 38.7 (8.3) State or university diagnostic labs 39.0 (4.1) 42.6 (3.1) 61.2 (8.3)
Other sources 6.7 (2.0) 8.1 (1.8) 8.8 (4.9)

USDA APHIS VS / 31
Section I: Population Estimates
c. On a scale of 1 to 5, with 1 being not available and 5 being readily available,percentage of premises by availability of products/services for birds (whether ornot they were used):
Percent Premises Product/Service Veterinary Care Vaccinations Medications
Score Percent Std.
Error Percent Std.
Error Percent Std.
Error
1 Not available 8.4 (1.3) 1.3 (0.5) 0.2 (0.1)
2 9.0 (1.4) 4.6 (1.1) 2.5 (0.8)
3 15.0 (1.7) 10.5 (1.5) 6.8 (1.2)
4 9.8 (1.5) 12.0 (1.5) 12.0 (1.6)
5 Readily available 57.8 (2.4) 71.6 (2.2) 78.5 (2.0)
Total 100.0 100.0 100.0
d. Percentage of premises where availability of products/services for birds waslow (score 1 or 2), by region:
Percent Premises Region
West South
Central Northeast Southeast All
Product/Services Pct. Std.
Error Pct. Std.
Error Pct. Std.
Error Pct. Std.
Error Pct. Std.
Error
Veterinary care 22.3 (4.3) 16.4 (3.0) 17.5 (3.9) 17.7 (2.4) 17.4 (1.8)
Vaccinations 2.9 (1.6) 6.3 (2.0) 8.6 (3.0) 5.7 (1.4) 5.9 (1.2)
Medications 1.2 (1.0) 2.7 (1.3) 3.0 (1.6) 2.9 (0.9) 2.7 (0.8)

Section I: Population Estimates
32 / Poultry ‘04
e. Percentage of premises where availability of products/services for birds waslow (score 1 or 2), by flock size:
Percent Premises
Flock Size (Number of Birds)
Small
(1 to 99) Medium
(100 to 499) Large
(500 or More)
Product/Service Percent Std.
Error Percent Std.
Error Percent Std.
Error
Veterinary care 20.8 (3.4) 16.2 (2.3) 11.5 (6.1)
Vaccinations 8.2 (2.4) 5.4 (1.4) 0.0 (--)
Medications 3.2 (1.5) 2.5 (1.0) 1.3 (1.2)
C. Biosecurity 1. Dedicated footwear and clothingAbout half of premises (52.2 percent) had some type of footwear-relatedrequirement for people entering the bird area. The percentage of premises withfootwear requirements increased as flock size increased (table b).
a. Percentage of premises by primary type of footwear-related precautionsrequired for anyone going into bird areas, and by region:
Percent Premises Region
West South
Central Northeast Southeast All
Precaution Pct. Std.
Error Pct. Std.
Error Pct. Std.
Error Pct. Std.
Error Pct. Std.
Error Boots or shoes worn only in bird area 20.6 (4.3) 12.1 (2.6) 17.5 (4.0) 22.0 (2.6) 16.4 (1.7) Disposable boot or shoe covers 5.1 (2.4) 9.8 (2.5) 4.4 (2.4) 5.6 (1.5) 7.7 (1.4) Use of footbath before or after entry 18.5 (4.1) 14.0 (2.8) 6.7 (3.1) 14.7 (2.1) 14.3 (1.7) Scrub boots/shoes before or after entry 7.3 (2.8) 12.6 (2.7) 5.6 (2.7) 4.9 (1.1) 9.1 (1.5) Combination of above 2.6 (1.7) 3.1 (1.4) 7.0 (3.3) 7.4 (1.5) 4.7 (0.9)
No requirements 45.9 (5.1) 48.4 (4.1) 58.8 (5.7) 45.4 (3.0) 47.8 (2.4)
Total 100.0 100.0 100.0 100.0 100.0

USDA APHIS VS / 33
Section I: Population Estimates
b. Percentage of premises by primary type of footwear-related precautionsrequired for anyone going into the bird areas, and by flock size:
Percent Premises
Flock Size (Number of Birds)
Small
(1 to 99) Medium
(100 to 499) Large
(500 or More)
Precaution Percent Std.
Error Percent Std.
Error Percent Std.
Error Boots or shoes worn only in bird area 16.8 (3.0) 16.4 (2.2) 16.3 (5.6) Disposable boot or shoe covers 6.9 (2.2) 9.3 (2.0) 0.0 (--) Use of footbath before or after entry 12.0 (2.7) 13.4 (2.1) 29.1 (7.8) Scrub boots/shoes before or after entry 12.0 (3.0) 7.9 (1.8) 4.5 (4.3)
Combination of above 1.7 (0.8) 5.3 (1.3) 13.7 (5.4)
No requirements 50.6 (4.2) 47.7 (3.2) 36.4 (8.2)
Total 100.0 100.0 100.0
Most premises never required dedicated clothing to be worn in bird areas.Requirements were similar across regions and flock sizes.
c. Percentage of premises that required dedicated clothing be worn beforeentering the bird areas, by frequency and by region:
Percent Premises Region
West South
Central Northeast Southeast All
Frequency Pct. Std.
Error Pct. Std.
Error Pct. Std.
Error Pct. Std.
Error Pct. Std.
Error
Always 5.9 (2.5) 7.1 (2.1) 7.5 (3.1) 6.3 (1.5) 6.7 (1.2)
Sometimes 17.2 (4.1) 16.2 (3.0) 18.5 (4.6) 17.0 (2.3) 16.7 (1.8)
Never 76.9 (4.6) 76.7 (3.5) 74.0 (5.2) 76.7 (2.6) 76.6 (2.1)
Total 100.0 100.0 100.0 100.0 100.0

Section I: Population Estimates
34 / Poultry ‘04
d. Percentage of premises that required dedicated clothing be worn beforeentering bird areas, by frequency and by flock size:
2. Hand washingOn 58.1 percent of premises, hand washing was always or sometimes requiredbefore handling poultry.
a. Percentage of premises that required hand washing before handling poultry,by frequency and by region:
Percent Premises Region
West South
Central Northeast Southeast All
Frequency Pct. Std.
Error Pct. Std.
Error Pct. Std.
Error Pct. Std.
Error Pct. Std.
Error
Always 21.9 (4.4) 27.5 (3.7) 21.4 (4.6) 26.1 (2.8) 26.2 (2.2)
Sometimes 30.5 (4.9) 33.2 (3.9) 41.4 (5.9) 28.5 (2.8) 31.9 (2.3)
Never 47.6 (5.3) 39.3 (4.0) 37.2 (5.8) 45.4 (3.1) 41.9 (2.4)
Total 100.0 100.0 100.0 100.0 100.0
Percent Premises
Flock Size (Number or Birds)
Small
(1 to 99) Medium
(100 to 499) Large
(500 or More)
Frequency Percent Std.
Error Percent Std.
Error Percent Std.
Error
Always 6.8 (2.1) 6.6 (1.6) 7.6 (4.8)
Sometimes 12.7 (2.7) 18.6 (2.5) 19.9 (6.2)
Never 80.5 (3.3) 74.8 (2.8) 72.5 (7.3)
Total 100.0 100.0 100.0
USDA APHIS VS / 35
Section I: Population Estimates
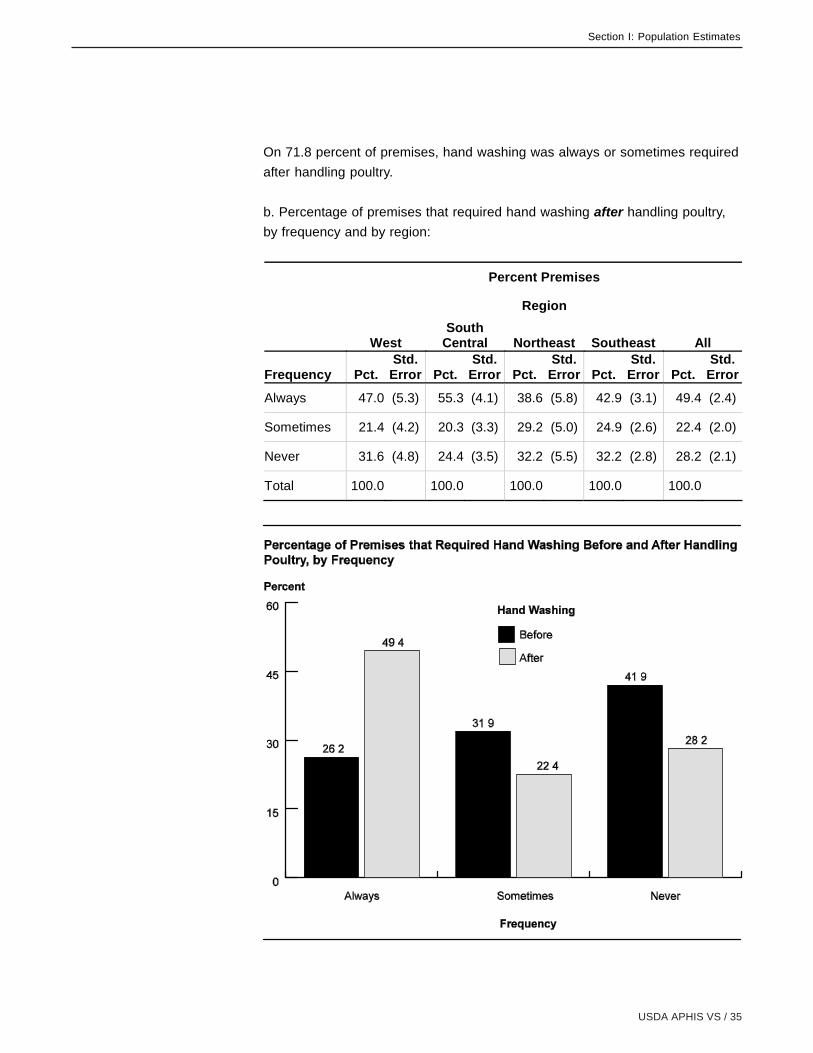
On 71.8 percent of premises, hand washing was always or sometimes requiredafter handling poultry.
b. Percentage of premises that required hand washing after handling poultry,by frequency and by region:
Percent Premises Region
West South
Central Northeast Southeast All
Frequency Pct. Std.
Error Pct. Std.
Error Pct. Std.
Error Pct. Std.
Error Pct. Std.
Error
Always 47.0 (5.3) 55.3 (4.1) 38.6 (5.8) 42.9 (3.1) 49.4 (2.4)
Sometimes 21.4 (4.2) 20.3 (3.3) 29.2 (5.0) 24.9 (2.6) 22.4 (2.0)
Never 31.6 (4.8) 24.4 (3.5) 32.2 (5.5) 32.2 (2.8) 28.2 (2.1)
Total 100.0 100.0 100.0 100.0 100.0

Section I: Population Estimates
36 / Poultry ‘04
3. VisitorsVisitors were sometimes or always allowed in bird areas on 46.3 percent ofpremises, and 61.8 percent of those premises asked visitors about contact withother birds before being allowed in bird areas (table c).
a. Percentage of premises where visitors such as neighbors, repairmen, meterreaders, etc., were allowed in bird areas, by frequency and by region:
Percent Premises Region
West South
Central Northeast Southeast All
Frequency Pct. Std.
Error Pct. Std.
Error Pct. Std.
Error Pct. Std.
Error Pct. Std.
Error
Always 9.0 (3.1) 5.4 (1.8) 8.9 (3.3) 6.5 (1.6) 6.3 (1.1)
Sometimes 29.7 (4.7) 37.4 (3.9) 44.1 (5.7) 46.3 (3.0) 40.0 (2.3)
Never 61.3 (5.1) 57.2 (4.0) 47.0 (5.8) 47.2 (3.0) 53.7 (2.4)
Total 100.0 100.0 100.0 100.0 100.0
b. Percentage of premises where visitors such as neighbors, repairmen, meterreaders, etc., were allowed in the poultry area, by frequency and by flock size:
Percent Premises
Flock Size (Number or Birds)
Small
(1 to 99) Medium
100 to 499 Large
500 or More
Frequency Percent Standard
Error Percent Standard
Error Percent Standard
Error
Always 7.1 (2.2) 5.3 (1.3) 8.5 (4.8)
Sometimes 37.7 (4.0) 41.7 (3.0) 38.0 (7.8)
Never 55.2 (4.1) 53.0 (3.1) 53.5 (8.3)
Total 100.0 100.0 100.0

USDA APHIS VS / 37
Section I: Population Estimates
c. For premises where visitors were allowed in bird areas, percentage ofpremises that asked visitors about contact with other birds before allowingentrance, by frequency:
Percent Premises
How Frequently Asked
Always Sometimes Never
Percent Standard
Error Percent Standard
Error Percent Standard
Error Total
21.5 (2.9) 40.3 (3.5) 38.2 (3.5) 100.0
4. Ponds and bird feedersPonds that attract wild waterfowl were present on 16.0 percent of all premises,ranging from 12.0 percent of premises in the West region to 24.4 percent in theNortheast region.
a. Percentage of premises with a pond on the property that attracts wildwaterfowl, by region:
Percent Premises
Region
West South Central Northeast Southeast All
Pct. Std.
Error Pct. Std.
Error Pct. Std.
Error Pct. Std.
Error Pct. Std. Error
12.0 (3.5) 14.8 (2.8) 24.4 (4.4) 17.5 (2.2) 16.0 (1.7)
Wild bird feeders on premises were more common in the Northeast andSoutheast regions than in the West and South Central regions.
b. Percentage of premises with a wild bird feeder, by region:
Percent Premises
Region
West South Central Northeast Southeast All
Pct. Std.
Error Pct. Std.
Error Pct. Std.
Error Pct. Std.
Error Pct. Std. Error
9.3 (2.8) 9.7 (2.4) 27.1 (4.7) 23.8 (2.6) 15.3 (1.6)

Section I: Population Estimates
38 / Poultry ‘04
D. Bird Movement 1. Bird introductionsFertilized eggs for hatching were brought onto 9.6 percent of premises in theprevious 12 months.
a. Percentage of premises that brought fertilized eggs for hatching onto thepremises in the previous 12 months, by region:
Percent Premises
Region
West South Central Northeast Southeast All
Pct. Std.
Error Pct. Std.
Error Pct. Std.
Error Pct. Std.
Error Pct. Std. Error
17.9 (4.0) 9.5 (2.4) 6.6 (2.5) 7.9 (1.7) 9.6 (1.4)
Just over half of premises (51.5 percent) introduced new birds into the flockone or more times during the previous 12 months, and 9.8 percent introducednew birds five or more times.
b. Percentage of premises by number of times in the previous 12 months thatnew birds were introduced into the flock, by region:
Percent Premises Region
West South
Central Northeast Southeast All
Number Pct. Std. Error Pct.
Std. Error Pct.
Std. Error Pct.
Std. Error Pct.
Std. Error
0 45.3 (5.2) 51.6 (4.1) 36.6 (5.7) 46.6 (3.0) 48.5 (2.4)
1 15.2 (3.8) 16.3 (3.0) 22.5 (4.9) 13.5 (2.0) 15.6 (1.7)
2 to 4 24.0 (4.6) 24.3 (3.5) 33.9 (5.6) 28.1 (2.6) 26.1 (2.1)
5 or more 15.5 (3.8) 7.8 (2.2) 7.0 (2.9) 11.8 (2.0) 9.8 (1.4)
Total 100.0 100.0 100.0 100.0 100.0

USDA APHIS VS / 39
Section I: Population Estimates
c. Percentage of premises by number of times in the previous 12 months thatnew birds were introduced into the flock, by flock size:
Percent Premises
Flock Size (Number of Birds)
Small
(1 to 99) Medium
(100 to 499) Large
(500 or More)
Number Percent Std. Error Percent
Std. Error Percent
Std. Error
0 50.2 (4.2) 45.7 (3.2) 60.0 (7.9)
1 16.9 (3.0) 15.9 (2.4) 8.0 (3.2)
2 to 4 24.6 (3.6) 27.7 (2.8) 21.4 (6.2)
5 or more 8.3 (2.4) 10.7 (1.8) 10.6 (5.2)
Total 100.0 100.0 100.0

Section I: Population Estimates
40 / Poultry ‘04
Most premises that introduced new birds in the previous 12 months introducedadult birds into the flock (85.0 percent of premises), while only 15.7 percentintroduced day-old chicks.
d. For premises that introduced new birds in the previous 12 months,percentage of premises by age group of new birds:
Percent Premises
Age Group
Day-Old Chicks Young Stock
(Not of Reproductive Age) Adult Birds
(Reproductive Age)
Percent Standard
Error Percent Standard
Error Percent Standard
Error
15.7 (2.4) 41.7 (3.2) 85.0 (2.4)
Only 3.5 percent of premises that introduced new birds in the previous 12months placed the new birds directly into the flock without a separation orquarantine period. The remainder either quarantined new arrivals (66.9 percentof premises) or had no other birds at the time of introduction (29.6 percent ofpremises).
e. For premises that introduced new birds in the previous 12 months,percentage of premises by whether new birds were separated or quarantinedfrom the rest of the flock:
Separated New Birds Percent Premises Standard Error
Yes 66.9 (3.1)
No 3.5 (1.2)
No other birds present upon arrival 29.6 (3.0)
Total 100.0
USDA APHIS VS / 41
Section I: Population Estimates
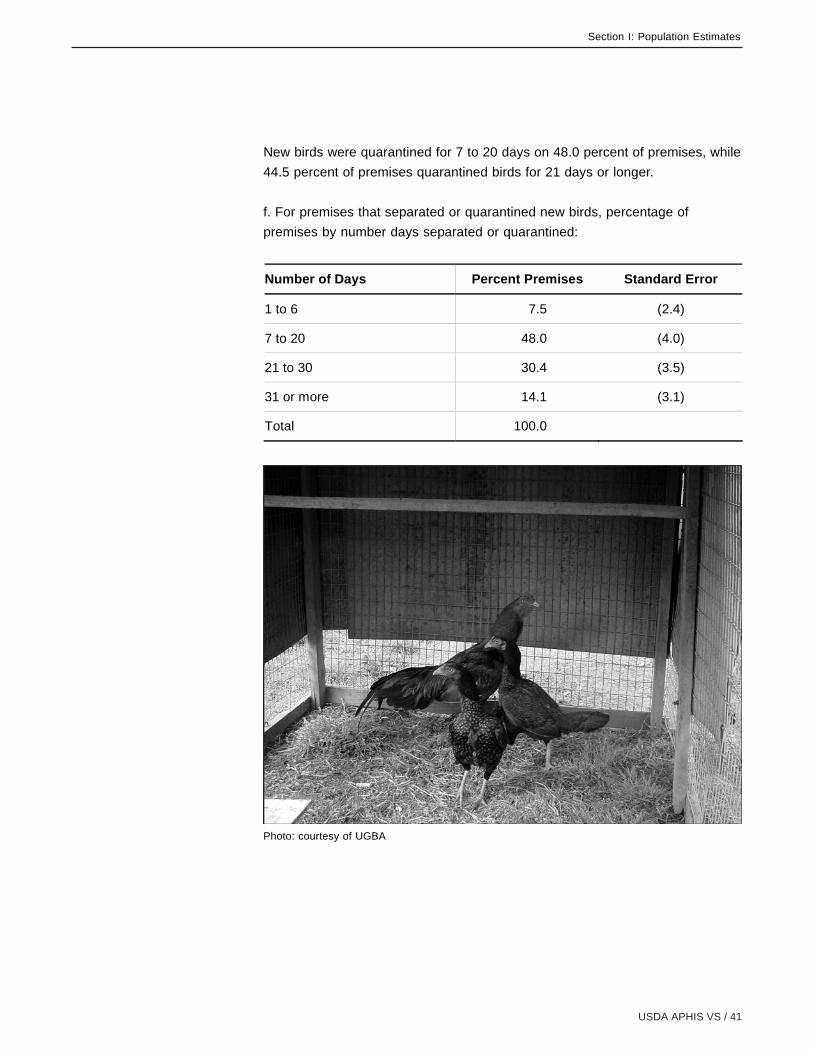
New birds were quarantined for 7 to 20 days on 48.0 percent of premises, while44.5 percent of premises quarantined birds for 21 days or longer.
f. For premises that separated or quarantined new birds, percentage ofpremises by number days separated or quarantined:
Number of Days Percent Premises Standard Error
1 to 6 7.5 (2.4)
7 to 20 48.0 (4.0)
21 to 30 30.4 (3.5)
31 or more 14.1 (3.1)
Total 100.0
Photo: courtesy of UGBA
Section I: Population Estimates
42 / Poultry ‘04
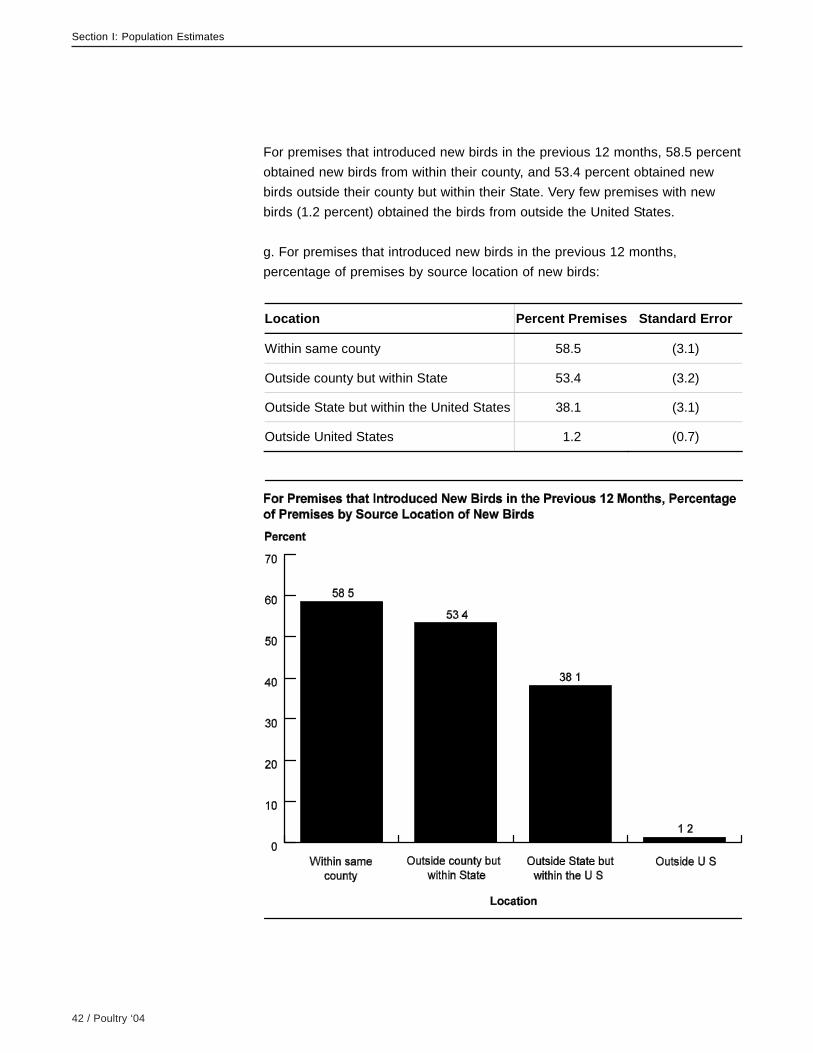
For premises that introduced new birds in the previous 12 months, 58.5 percentobtained new birds from within their county, and 53.4 percent obtained newbirds outside their county but within their State. Very few premises with newbirds (1.2 percent) obtained the birds from outside the United States.
g. For premises that introduced new birds in the previous 12 months,percentage of premises by source location of new birds:
Location Percent Premises Standard Error
Within same county 58.5 (3.1)
Outside county but within State 53.4 (3.2)
Outside State but within the United States 38.1 (3.1)
Outside United States 1.2 (0.7)

USDA APHIS VS / 43
Section I: Population Estimates
Health certificates accompanied all or some new birds on 31.0 percent ofpremises that received new birds.
h. For premises that introduced new birds in the previous 12 months,percentage of premises by proportion of new birds accompanied by a healthcertificate:
Proportion Percent Premises Standard Error
All 14.1 (2.3)
Some 16.9 (2.5)
None 69.0 (3.0)
Total 100.0
Private individuals such as neighbors and friends were the most commonsource of new birds (92.9 percent of premises), while 12.4 percent of premiseswith new additions obtained the birds via mail order or the Internet.
i. For premises that introduced new birds in the previous 12 months,percentage of premises by source of new birds:
Source Percent Premises Standard Error
Local commercial hatchery 2.1 (1.0)
Poultry wholesaler or dealer 4.2 (1.3)
Private individual (e.g., neighbor) 92.9 (1.7)
Feed or farm store 2.3 (0.9)
Fair or show 8.0 (1.9)
Flea or farmer’s market 2.2 (1.0)
Auction market 2.5 (1.0)
Mail order or Internet 12.4 (2.0)
Other 2.8 (1.1)

Section I: Population Estimates
44 / Poultry ‘04
For premises that introduced new birds, 70.1 percent destroyed the beddingmaterial that arrived with new birds. Of those premises that did not destroybedding, 21.9 percent reused the bedding for birds.
j. For premises that introduced new birds in the previous 12 months,percentage of premises that destroyed (e.g., burned) bedding material thatarrived with new birds:
Percent Premises Standard Error
70.1 (3.1)
k. For premises that did not destroy bedding, percentage of premises thatreused the bedding for birds:
Percent Premises Standard Error
21.9 (5.8)
2. SalesOverall, 70.9 percent of premises had sold or gave away live birds in theprevious 12 months. The percentage of premises that sold or gave away birdsincreased as flock size increased.
a. Percentage of premises that sold or gave away any live birds in the previous12 months, by region:
Percent Premises
Region
West South Central Northeast Southeast All
Pct. Std.
Error Pct. Std.
Error Pct. Std.
Error Pct. Std.
Error Pct. Std. Error
76.6 (4.5) 65.6 (3.9) 73.6 (4.6) 77.2 (2.6) 70.9 (2.2)

USDA APHIS VS / 45
Section I: Population Estimates
b. Percentage of premises that sold or gave away any live birds in the previous12 months, by flock size:
Percent Premises
Flock Size (Number of Birds)
Small (1 to 99)
Medium (100 to 499)
Large (500 or More)
Percent Standard
Error Percent Standard
Error Percent Standard
Error
60.5 (4.2) 75.9 (2.7) 83.1 (7.3)

Section I: Population Estimates
46 / Poultry ‘04
The most common means by which birds were sold or given away was to aprivate individual such as a neighbor or friend (93.3 percent of premises). Mailorder or the Internet was used by 12.6 percent of premises that sold or gaveaway live birds.
c. For premises that sold or gave away any live birds in the previous12 months, percentage of premises by means birds were sold or given away:
Means Percent Premises Standard Error
Poultry wholesaler or dealer 4.8 (1.2)
Private individual (e.g., neighbor) 93.3 (1.4)
Feed or farm store 3.8 (1.0)
Fair or show 5.6 (1.2)
Live bird market 2.8 (0.8)
Flea or farmer’s market 3.0 (0.7)
Auction market 4.6 (1.0)
Mail order or Internet 12.6 (1.9)
Other 1.6 (0.7)
For premises that sold or gave away any live birds in the previous 12 months,74.8 percent did so within their county, and 56.8 percent did so outside theirown county but within their State. Interstate sales occurred on one-third ofpremises (33.7 percent). Although obtaining birds from outside the UnitedStates was very rare (1.2 percent of premises that obtained birds, table 1g),international sales occurred on 14.3 percent of premises that sold birds.
d. For premises that sold or gave away any live birds in the previous12 months, percentage of premises by destination of birds sold or given away:
Destination Percent Premises Standard Error
Within same county 74.8 (2.4)
Outside county but within State 56.8 (2.8)
Outside State but within United States 33.7 (2.5)
Outside United States 14.3 (1.9)

USDA APHIS VS / 47
Section I: Population Estimates

Section I: Population Estimates
48 / Poultry ‘04
3. Contact with other premises with birdsTwo-thirds of premises (69.9 percent) took birds to locations where other birdswere present and returned them to the flock in the previous 12 months. Nearlyhalf of premises (44.4 percent) did so five or more times. Movement of birdswas more frequent in the Northeast region.
a. Percentage of premises by number of times in the previous 12 months birdswere taken to a location where other birds were present (fair, show, etc.) andreturned to the flock, and by region:
Percent Premises Region
West South
Central Northeast Southeast All
Number Pct. Std. Error Pct.
Std. Error Pct.
Std. Error Pct.
Std. Error Pct.
Std. Error
0 30.7 (4.9) 32.2 (3.8) 19.5 (4.7) 28.4 (2.8) 30.1 (2.2)
1 6.7 (2.7) 8.1 (2.2) 7.9 (2.9) 5.0 (1.2) 7.0 (1.3)
2 to 4 22.5 (4.4) 20.8 (3.3) 12.8 (4.3) 14.9 (2.1) 18.5 (1.9)
5 or more 40.1 (5.0) 38.9 (3.9) 59.8 (5.9) 51.7 (3.1) 44.4 (2.4)
Total 100.0 100.0 100.0 100.0 100.0

USDA APHIS VS / 49
Section I: Population Estimates
Medium and large flocks moved and returned birds more frequently than smallflocks.
b. Percentage of premises by number of times in the previous 12 months birdswere taken to a location where other birds were present (fair, show, etc.) andreturned to the flock, and by flock size:
Percent Premises
Flock Size (Number or Birds)
Small
(1 to 99) Medium
(100 to 499) Large
(500 or More)
Number Percent Std. Error Percent
Std. Error Percent
Std. Error
0 42.3 (4.2) 22.9 (2.7) 27.3 (7.6)
1 9.0 (2.5) 6.2 (1.5) 1.3 (1.2)
2 to 4 20.9 (3.5) 17.6 (2.4) 15.7 (6.5)
5 or more 27.8 (3.6) 53.3 (3.1) 55.7 (8.4)
Total 100.0 100.0 100.0
Section I: Population Estimates
50 / Poultry ‘04
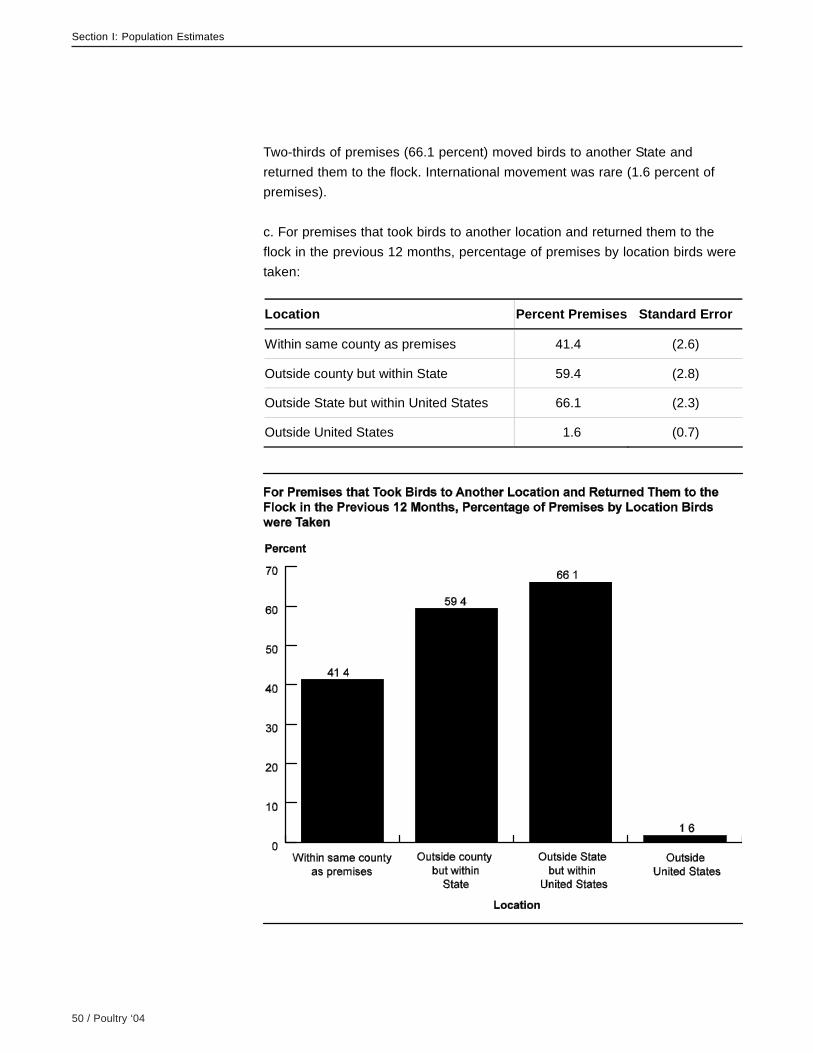
Two-thirds of premises (66.1 percent) moved birds to another State andreturned them to the flock. International movement was rare (1.6 percent ofpremises).
c. For premises that took birds to another location and returned them to theflock in the previous 12 months, percentage of premises by location birds weretaken:
Location Percent Premises Standard Error
Within same county as premises 41.4 (2.6)
Outside county but within State 59.4 (2.8)
Outside State but within United States 66.1 (2.3)
Outside United States 1.6 (0.7)

USDA APHIS VS / 51
Section I: Population Estimates
Birds were sometimes or always isolated upon returning to the home flock on69.7 percent of premises that moved and returned birds.
d. For premises that took birds to another location and returned them to theflock in the previous 12 months, percentage of premises that isolated the birdsbefore placing them with other birds on the premises, by frequency of isolation:
Frequency Percent Premises Standard Error
Always 41.4 (2.8)
Sometimes 28.3 (2.5)
Never 28.2 (2.6)
No other birds on premises 2.1 (0.8)
Total 100.0
Overall, 71.2 percent of respondents visited a location such as a market or feedstore where birds were present in the previous 3 months. This percentage wassimilar across regions and flock sizes.
e. Percentage of premises where respondent visited a location that had livebirds (e.g., market, feed store with birds, fair, or neighbor’s premises) in theprevious 3 months, by region:
Percent Premises
Region
West South Central Northeast Southeast All
Pct. Std.
Error Pct. Std.
Error Pct. Std.
Error Pct. Std.
Error Pct. Std. Error
74.6 (4.6) 69.1 (3.7) 65.7 (5.1) 74.6 (2.7) 71.2 (2.2)

Section I: Population Estimates
52 / Poultry ‘04
f. Percentage of premises where respondent visited a location that had livebirds (e.g., market, feed store with birds, fair, or neighbor’s premises) in theprevious 3 months, by flock size:
Most respondents who visited a location with live birds (71.9 percent), washedtheir hands before re-entering their own bird area. One-third of respondents(32.4 percent) showered before re-entering their bird area. Other precautionsincluded scrubbing boots.
g. For premises where respondent visited a location that had live birds in theprevious 3 months, percentage of premises where the following biosecuritymeasures were taken by respondent before re-entering their own bird area:
Biosecurity Measure Percent Premises Standard Error
Change clothes 36.9 (2.8)
Change boots or shoes (or foot covers) 42.1 (2.8)
Wash hands 71.9 (2.5)
Shower 32.4 (2.7)
Other precautions 11.4 (1.7)
Percent Premises
Flock Size (Number of Birds) Small
(1 to 99) Medium
(100 to 499) Large
(500 or More)
Percent Standard
Error Percent Standard
Error Percent Standard
Error
67.6 (4.0) 73.4 (2.8) 70.8 (8.3)

USDA APHIS VS / 53
Section I: Population Estimates
4. Bird transportationMost premises (85.4 percent) transported birds by vehicle at some time duringthe previous 12 months.
a. Percentage of premises that transported birds for any reason (using theirown vehicle or one under their control) in the previous 12 months, by flock size:
Percent Premises
Flock Size (Number of Birds) Small
(1 to 99) Medium
(100 to 499) Large
(500 or More) All
Percent Standard
Error Percent Standard
Error Percent Standard
Error Percent Standard
Error
76.9 (3.7) 89.5 (1.9) 92.9 (4.6) 85.4 (1.8)

Section I: Population Estimates
54 / Poultry ‘04
Only 9.4 percent of premises that transported birds by vehicle observedfeathers or droppings escape the vehicle while en route.
b. For premises that transported birds by vehicle, percentage of premises thatobserved feathers, droppings, or feather-down escape the vehicle while enroute:
Percent Premises Standard Error
9.4 (1.6)
Over one-third of premises that transported birds by vehicle (38.8 percent)averaged 150 or more miles per trip.
c. For premises that transported birds by vehicle, percentage of premises byaverage miles traveled per trip:
Miles Percent Premises Standard Error
1 to 5 5.3 (1.2)
6 to 149 55.9 (2.6)
150 or more 38.8 (2.6)
Total 100.0
Half of premises (50.2 percent) had taken an overnight trip.
d. For premises that transported birds by vehicle, percentage of premises thathad taken birds on any overnight trips:
Percent Premises Standard Error
50.2 (2.6)

USDA APHIS VS / 55
Section I: Population Estimates
Nearly all premises that transported birds by vehicle used wooden or fine-screen containers (92.0 percent), either exclusively (68.3 percent of premises)or in addition to special recyclable containers with airflow cardboard (23.7percent of premises).
e. For premises that transported birds by vehicle, percentage of premises bytype of travel containers (shipping crates) used:
Photo: courtesy of UGBA
Travel Container Percent Premises Standard Error
Wooden or fine screen only 68.3 (2.4)
Special recyclable with airflow cardboard only 3.6 (1.0)
Both types above 23.7 (2.2)
Other 4.4 (1.0)
Total 100.0

Section I: Population Estimates
56 / Poultry ‘04
Transportation by air was uncommon (15.1 percent of premises, overall),although over half of large flocks (56.2 percent) had transported birds by air inthe previous 12 months.
f. Percentage of premises that transported any birds by air (including U.S. Mail),by flock size:
Percent Premises
Flock Size (Number of Birds) Small
(1 to 99) Medium
(100 to 499) Large
(500 or More) All
Pct. Std.
Error Pct. Std.
Error Pct. Std.
Error Pct. Std.
Error
9.1 (2.2) 12.8 (1.8) 56.2 (8.4) 15.1 (1.6)

USDA APHIS VS / 57
Section I: Population Estimates
g. For premises that transported birds by air, percentage of premises byfrequency new (never used) shipping crates were used:
Frequency Percent Premises Standard Error
Always 80.8 (4.8)
Often 11.1 (3.7)
Sometimes 7.0 (3.4)
Rarely/never 1.1 (1.1)
Total 100.0

Section I: Population Estimates
58 / Poultry ‘04
Reusing the crates used for birds delivered to the premises was uncommon(17.6 percent of premises that transported by air). Most premises that reusedcrates (80.2 percent) disinfected them before reuse.
h. For premises that transported birds by air, percentage of premises thatreused the crates used to deliver birds to the premises:
Percent Premises Standard Error
17.6 (4.7)
i. For premises that transported birds by air and reused shipping crates,percentage of premises that disinfected the crates before reusing:
Percent Premises Standard Error
80.2 (10.3)
E. Carcass andLitter Disposal
1. Dead birdsOn 82.1 percent of premises, at least one bird died during the previous 12months (excluding birds slaughtered for human consumption). All premises with500 or more birds had at least one bird death (table b).
a. Percentage of premises where any birds died in the previous 12 months(excluding birds slaughtered for human consumption), by region:
Percent Premises
Region
West South Central Northeast Southeast All
Pct. Std.
Error Pct. Std.
Error Pct. Std.
Error Pct. Std.
Error Pct. Std. Error
78.2 (4.7) 79.2 (3.5) 82.6 (5.1) 87.5 (2.2) 82.1 (2.0)

USDA APHIS VS / 59
Section I: Population Estimates
b. Percentage of premises where any birds died in the previous 12 months(excluding birds slaughtered for human consumption), by flock size:
Percent Premises
Flock Size (Number of Birds) Small
(1 to 99) Medium
(100 to 499) Large
(500 or More)
Percent Standard
Error Percent Standard
Error Percent Standard
Error
72.3 (4.1) 86.6 (2.3) 100.0 (--)
Overall, 8.6 percent of birds died in the previous 12 months (excluding birdsslaughtered for human consumption). Although more large flocks had at leastone death compared to small flocks (table b), the percentage of birds that dieddecreased as flock size increased.
c. Percentage of birds that died1 in the previous 12 months (excluding birdsslaughtered for human consumption), by region:
d. Percentage of birds that died1 in the previous 12 months (excluding birdsslaughtered for human consumption), by flock size:
Percent Birds
Region
West South Central Northeast Southeast All
Pct. Std.
Error Pct. Std.
Error Pct. Std.
Error Pct. Std.
Error Pct. Std. Error
7.6 (1.2) 8.7 (1.7) 11.2 (1.5) 8.3 (0.9) 8.6 (0.9) 1As a percentage of inventory on day survey completed
Percent Birds
Flock Size (Number of Birds) Small
(1 to 99) Medium
(100 to 499) Large
(500 or More)
Percent Standard
Error Percent Standard
Error Percent Standard
Error
15.4 (1.6) 9.7 (0.8) 5.3 (1.7) 1As a percentage of inventory on day survey completed

Section I: Population Estimates
60 / Poultry ‘04
USDA APHIS VS / 61
Section I: Population Estimates
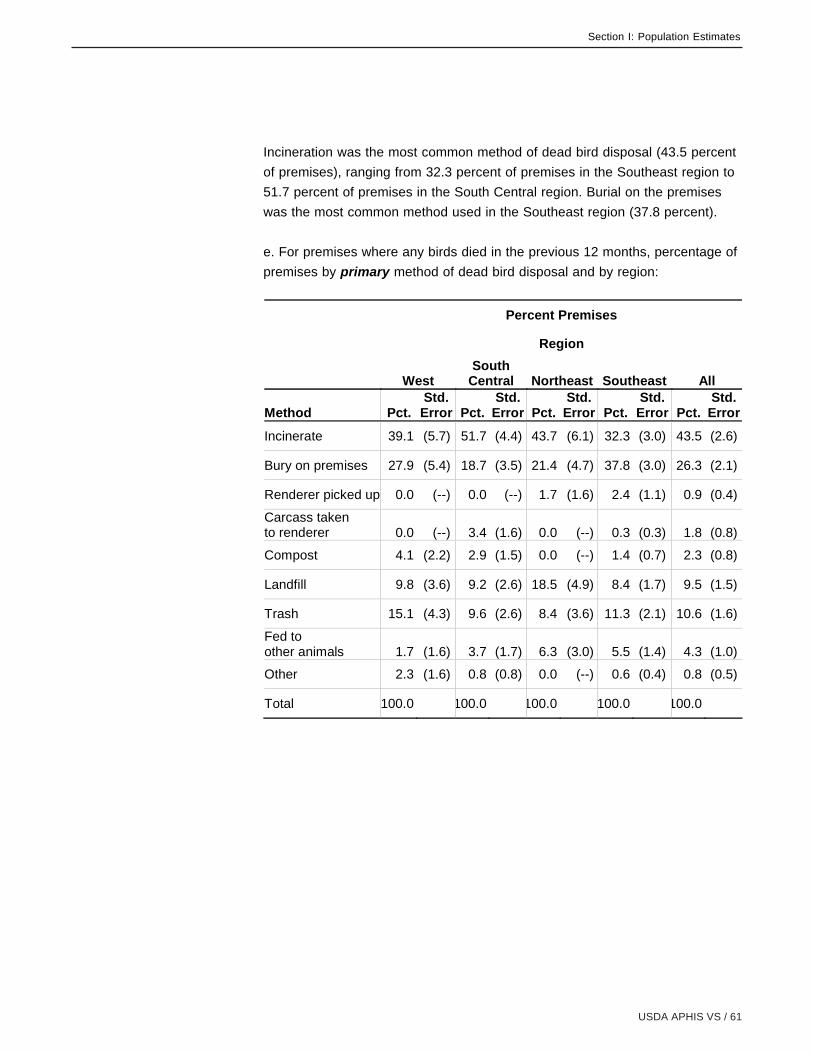
Incineration was the most common method of dead bird disposal (43.5 percentof premises), ranging from 32.3 percent of premises in the Southeast region to51.7 percent of premises in the South Central region. Burial on the premiseswas the most common method used in the Southeast region (37.8 percent).
e. For premises where any birds died in the previous 12 months, percentage ofpremises by primary method of dead bird disposal and by region:
Percent Premises Region
West South
Central Northeast Southeast All
Method Pct. Std.
Error Pct. Std.
Error Pct. Std.
Error Pct. Std.
Error Pct. Std.
Error
Incinerate 39.1 (5.7) 51.7 (4.4) 43.7 (6.1) 32.3 (3.0) 43.5 (2.6)
Bury on premises 27.9 (5.4) 18.7 (3.5) 21.4 (4.7) 37.8 (3.0) 26.3 (2.1)
Renderer picked up 0.0 (--) 0.0 (--) 1.7 (1.6) 2.4 (1.1) 0.9 (0.4)
Carcass taken to renderer 0.0 (--) 3.4 (1.6) 0.0 (--) 0.3 (0.3) 1.8 (0.8)
Compost 4.1 (2.2) 2.9 (1.5) 0.0 (--) 1.4 (0.7) 2.3 (0.8)
Landfill 9.8 (3.6) 9.2 (2.6) 18.5 (4.9) 8.4 (1.7) 9.5 (1.5)
Trash 15.1 (4.3) 9.6 (2.6) 8.4 (3.6) 11.3 (2.1) 10.6 (1.6)
Fed to other animals 1.7 (1.6) 3.7 (1.7) 6.3 (3.0) 5.5 (1.4) 4.3 (1.0)
Other 2.3 (1.6) 0.8 (0.8) 0.0 (--) 0.6 (0.4) 0.8 (0.5)
Total 100.0 100.0 100.0 100.0 100.0

Section I: Population Estimates
62 / Poultry ‘04
USDA APHIS VS / 63
Section I: Population Estimates
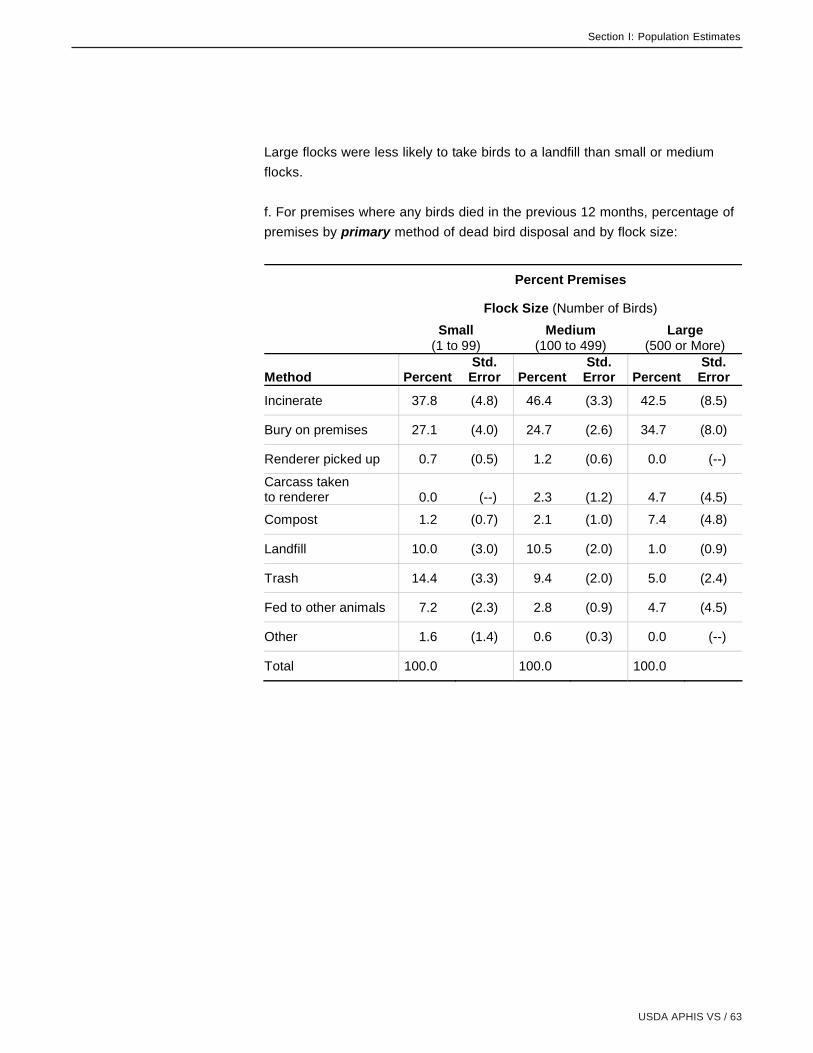
Large flocks were less likely to take birds to a landfill than small or mediumflocks.
f. For premises where any birds died in the previous 12 months, percentage ofpremises by primary method of dead bird disposal and by flock size:
Percent Premises
Flock Size (Number of Birds)
Small
(1 to 99) Medium
(100 to 499) Large
(500 or More)
Method Percent Std.
Error Percent Std.
Error Percent Std.
Error
Incinerate 37.8 (4.8) 46.4 (3.3) 42.5 (8.5)
Bury on premises 27.1 (4.0) 24.7 (2.6) 34.7 (8.0)
Renderer picked up 0.7 (0.5) 1.2 (0.6) 0.0 (--)
Carcass taken to renderer 0.0 (--) 2.3 (1.2) 4.7 (4.5)
Compost 1.2 (0.7) 2.1 (1.0) 7.4 (4.8)
Landfill 10.0 (3.0) 10.5 (2.0) 1.0 (0.9)
Trash 14.4 (3.3) 9.4 (2.0) 5.0 (2.4)
Fed to other animals 7.2 (2.3) 2.8 (0.9) 4.7 (4.5)
Other 1.6 (1.4) 0.6 (0.3) 0.0 (--)
Total 100.0 100.0 100.0

Section I: Population Estimates
64 / Poultry ‘04
2. LitterThe most common disposal method for litter and manure was to spread onfields or gardens (35.8 percent of premises), ranging from 30.8 percent ofpremises in the South Central region to 57.7 percent of premises in theNortheast region. About one-third of premises (32.8 percent) did not haveenough litter or manure to deal with. This percentage was similar across sizegroups (table b).
a. Percentage of premises by method that best describes how premisesdisposed of used poultry litter and manure, and by region:
Percent Premises Region
West South
Central Northeast Southeast All
Method Pct. Std.
Error Pct. Std.
Error Pct. Std.
Error Pct. Std.
Error Pct. Std.
Error Place in manure shed/composted 7.1 (2.8) 3.5 (1.5) 6.6 (2.6) 8.0 (1.7) 5.5 (1.0) Leave in an outdoor pile 5.2 (2.3) 4.3 (1.7) 8.4 (2.8) 4.2 (1.3) 4.6 (1.0) Spread on field/garden at premises’ location 45.5 (5.2) 30.8 (3.8) 57.7 (5.9) 36.9 (2.9) 35.8 (2.3) Taken to a landfill or put in trash 10.9 (3.4) 16.5 (3.0) 0.0 (--) 5.4 (1.5) 11.3 (1.7) Haul away (sell or give away) 2.4 (1.4) 3.4 (1.4) 7.3 (3.1) 2.9 (1.0) 3.4 (0.8) Other disposal methods 5.7 (2.4) 8.8 (2.3) 2.2 (1.5) 4.1 (1.3) 6.6 (1.3) Do not have enough litter/manure to deal with 23.2 (4.5) 32.7 (3.8) 17.8 (4.6) 38.5 (3.0) 32.8 (2.3)
Total 100.0 100.0 100.0 100.0 100.0

USDA APHIS VS / 65
Section I: Population Estimates

Section I: Population Estimates
66 / Poultry ‘04
b. Percentage of premises by method that best describes how premisesdisposed of used poultry litter and manure, and by flock size:
Percent Premises
Flock Size (Number of Birds)
Small
(1 to 99) Medium
(100 to 499) Large
(500 or More)
Method Percent Std.
Error Percent Std.
Error Percent Std.
Error Place in manure shed/composted 5.1 (1.8) 5.4 (1.4) 8.0 (3.2) Leave in an outdoor pile 2.8 (1.3) 6.1 (1.5) 1.6 (1.5) Spread on field/garden at premises location 32.5 (4.0) 36.4 (2.9) 42.9 (8.3) Taken to a landfill or put in trash 16.7 (3.5) 9.5 (2.0) 2.6 (2.5) Haul away (sell or give away) 0.7 (0.4) 4.5 (1.3) 6.1 (4.6) Other disposal methods 5.8 (2.0) 7.4 (1.8) 4.6 (4.4) Do not have enough litter/manure to deal with 36.4 (4.1) 30.7 (2.9) 34.2 (8.3)
Total 100.0 100.0 100.0

USDA APHIS VS / 67
Section I: Population Estimates
F. ProducerCharacteristics
1. Reason for having birdsThe most common reason for having birds was for fun/hobby, which rankedvery high for 75.9 percent of premises. In addition, 65.3 percent of premisesranked family tradition and lifestyle as very high reasons for having birds.“Other” reasons included love of birds, teaching children, and the right to ownbirds.
a. Percentage of premises by reason premises had birds and by level ofimportance1 of those reasons:
Percent Premises
Importance
Low
(1 to 3) Moderate
(4 to 6) High
(7 to 9) Very High
(10)
Reason Pct. Std. Error Pct.
Std. Error Pct.
Std. Error Pct.
Std. Error Total
Family tradition 9.4 (1.5) 8.5 (1.4) 16.8 (1.8) 65.3 (2.3) 100.0
Fun/hobby 3.6 (1.0) 3.3 (0.9) 17.2 (1.9) 75.9 (2.1) 100.0
Extra income 41.4 (2.4) 22.6 (2.1) 12.7 (1.7) 23.3 (2.1) 100.0
Food 64.1 (2.4) 18.5 (1.9) 8.9 (1.5) 8.5 (1.4) 100.0
Lifestyle/ambiance 4.7 (0.9) 8.3 (1.4) 21.7 (2.0) 65.3 (2.3) 100.0
Clubs/social interactions (4H, avian organizations) 40.4 (2.5) 19.3 (1.9) 15.9 (1.8) 24.4 (2.1) 100.0 Other reasons to have birds 70.8 (2.3) 0.9 (0.4) 2.0 (0.7) 26.3 (2.2) 100.0 1 On a scale of 1 to 10 with 1 being least important and 10 being most important

Section I: Population Estimates
68 / Poultry ‘04
Reasons for having birds were ranked high or very high by a similar percentageof respondents across regions.
b. Percentage of premises that rated the following reasons for having birds ashigh or very high (score of 7 to 10), by region:
Percent Premises Region
West South
Central Northeast Southeast All
Reason Pct. Std.
Error Pct. Std.
Error Pct. Std.
Error Pct. Std.
Error Pct. Std. Error
Family tradition 79.7 (4.4) 80.1 (3.3) 88.7 (4.0) 84.8 (2.2) 82.1 (1.9)
Fun/hobby 92.7 (2.8) 90.7 (2.4) 96.8 (2.1) 96.3 (1.1) 93.1 (1.3)
Extra income 33.2 (5.2) 38.5 (4.1) 16.7 (4.4) 36.3 (3.1) 36.0 (2.4)
Food 16.1 (4.0) 19.9 (3.5) 13.5 (3.7) 14.8 (2.2) 17.4 (1.9)
Lifestyle/ambiance 86.9 (3.8) 86.4 (2.9) 86.8 (4.1) 88.1 (1.9) 87.0 (1.7)
Clubs/social interactions (4H, avian organizations) 44.4 (5.5) 37.8 (4.2) 41.0 (5.9) 42.7 (3.1) 40.3 (2.4) Other reasons to have birds 26.0 (4.7) 29.0 (3.9) 19.8 (4.5) 29.6 (2.8) 28.3 (2.2)

USDA APHIS VS / 69
Section I: Population Estimates
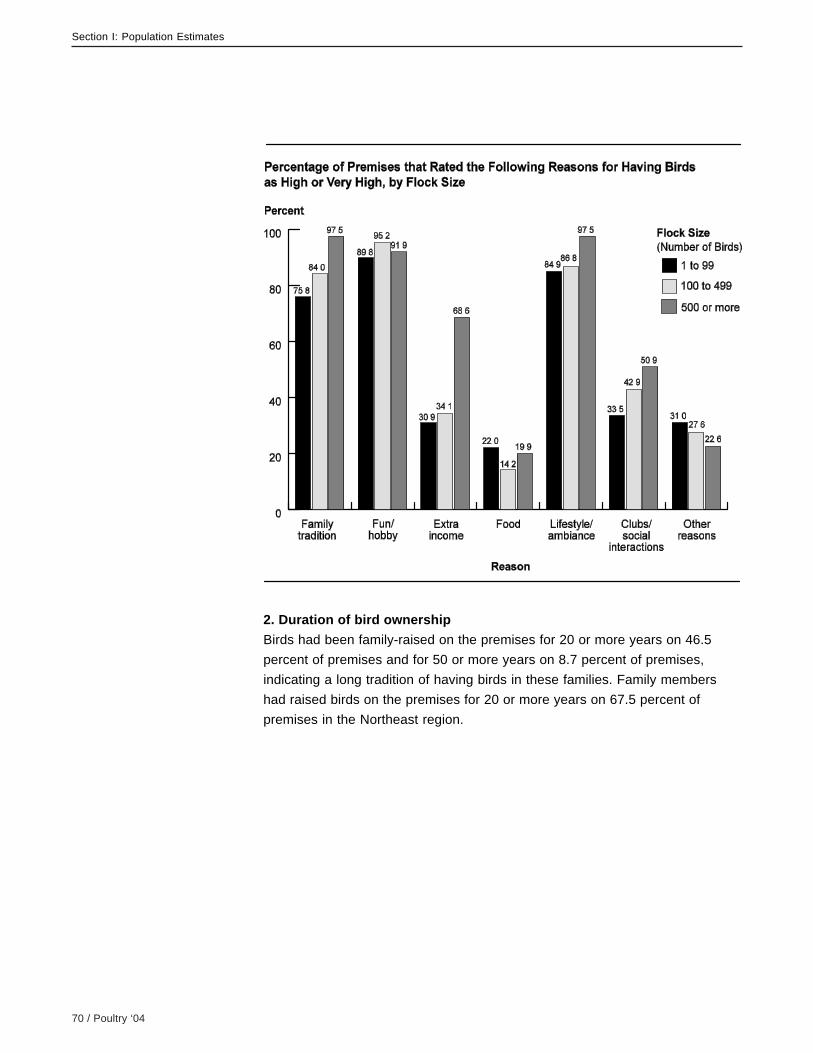
Family tradition, extra income, and clubs/social interaction increased inimportance as flock size increased.
c. Percentage of premises that rated the following reasons for having birds ashigh or very high (score of 7 to 10), by flock size:
Percent Premises
Flock Size (Number of Birds)
Small
(1 to 99) Medium
(100 to 499) Large
(500 or More)
Reason Percent Std.
Error Percent Std.
Error Percent Std.
Error
Family tradition 75.8 (3.8) 84.0 (2.3) 97.5 (1.7)
Fun/hobby 89.8 (2.8) 95.2 (1.5) 91.9 (5.1)
Extra income 30.9 (4.2) 34.1 (3.1) 68.6 (7.8)
Food 22.0 (3.8) 14.2 (2.3) 19.9 (7.2)
Lifestyle/ambiance 84.9 (3.3) 86.8 (2.1) 97.5 (1.7)
Clubs/social interactions (4H, avian organizations) 33.5 (4.2) 42.9 (3.2) 50.9 (8.5) Other reasons to have birds 31.0 (4.1) 27.6 (2.9) 22.6 (6.6)
Section I: Population Estimates
70 / Poultry ‘04
2. Duration of bird ownershipBirds had been family-raised on the premises for 20 or more years on 46.5percent of premises and for 50 or more years on 8.7 percent of premises,indicating a long tradition of having birds in these families. Family membershad raised birds on the premises for 20 or more years on 67.5 percent ofpremises in the Northeast region.

USDA APHIS VS / 71
Section I: Population Estimates
Percent Premises Region
West South
Central Northeast Southeast All
Number of Years Pct. Std.
Error Pct. Std.
Error Pct. Std.
Error Pct. Std.
Error Pct. Std.
Error
Fewer than 5 8.3 (2.9) 14.2 (2.8) 5.5 (3.0) 13.2 (2.0) 12.8 (1.6)
5 to 9 14.3 (3.6) 20.6 (3.3) 6.3 (2.9) 14.7 (2.0) 17.3 (1.9)
10 to 19 28.7 (4.8) 23.8 (3.5) 20.7 (4.3) 21.6 (2.5) 23.4 (2.0)
20 to 49 42.5 (5.1) 35.2 (3.8) 54.6 (5.4) 37.8 (2.9) 37.8 (2.3)
50 or more 6.2 (2.5) 6.2 (2.0) 12.9 (3.8) 12.7 (2.1) 8.7 (1.3)
Total 100.0 100.0 100.0 100.0 100.0
a. Percentage of premises by number of years birds had been raised by thefamily on that premises, and by region:

Section I: Population Estimates
72 / Poultry ‘04
3. Employment in commercial poultry industryOverall, less than 1 percent of premises had someone in the household thatworked for a commercial poultry operation.
a. Percentage of premises where someone in the household worked for acommercial poultry production or processing facility, by region:
Percent Premises
Region
West South Central Northeast Southeast All
Pct. Std.
Error Pct. Std.
Error Pct. Std.
Error Pct. Std.
Error Pct. Std. Error
1.3 (1.3) 0.7 (0.7) 1.8 (1.7) 0.6 (0.4) 0.8 (0.4)
b. Percentage of premises where someone in the household worked for acommercial poultry production or processing facility, by flock size:
Percent Premises
Flock Size (Number of Birds)
Small (1 to 99)
Medium (100 to 499)
Large (500 or More)
Percent Standard
Error Percent Standard
Error Percent Standard
Error
1.7 (1.1) 0.2 (0.2) 1.4 (1.3)

USDA APHIS VS / 73
Section I: Population Estimates
4. UGBA affiliatesThe survey for this report was mailed to members of UGBA State affiliates andto members of State associations not affiliated with UGBA. Overall, 87.0percent of respondents were UGBA State affiliate members, ranging from 79.0percent of respondents in the South Central region to 96.7 percent in theSoutheast region.
a. Percentage of premises where producer belonged to UGBA State affiliate, byregion:
Percent Premises
Region
West South Central Northeast Southeast All
Pct. Std.
Error Pct. Std.
Error Pct. Std.
Error Pct. Std.
Error Pct. Std. Error
93.0 (2.7) 79.0 (3.3) 92.8 (2.9) 96.7 (1.1) 87.0 (1.8)
b. Percentage of premises where producer belonged to UGBA State affiliate, byflock size:
Percent Premises
Flock Size (Number of Birds)
Small (1 to 99)
Medium (100 to 499)
Large (500 or More)
Percent Standard
Error Percent Standard
Error Percent Standard
Error
81.7 (3.5) 88.3 (2.3) 100.0 (--)
UGBA members had been invited recently to complete a similar survey byanother organization, but only 1.8 percent of respondents indicated they haddone so.
Percent Premises Standard Error
1.8 (0.7)
c. Percentage of premises that had completed a similar survey by anotherorganization in the previous 6 months:

Section II: Methodology
74 / Poultry ‘04
Section II: Methodology
A. Needs Assessment NAHMS develops study objectives by exploring existing literature andcontacting industry members and other stakeholders about their informationalneeds and priorities during a needs assessment phase. For Poultry ’04, thefollowing activities were conducted:
• A focus group consisting of industry, State, Federal, and university representatives met at the World Poultry Exposition in Atlanta, Georgia, in January 2002.
• A needs assessment questionnaire was distributed to poultry veterinarians via the presidents of the egg layer, broiler, and turkey veterinary groups. This questionnaire was also distributed to State and Federal veterinarians, and laboratory and research personnel.
• Discussions were held with each of the poultry veterinary groups at the American Association of Avian Pathologists meeting in Denver, Colorado, in July 2002.
• Additional discussions occurred at the United States Animal Health Association Transmissible Diseases of Poultry Committee. This committee recommended that Poultry ’04 focus its efforts addressing bird health, movement, and biosecurity practices of nontraditional poultry industries.
B. Samplingand Estimation
1. Mailing listThe entire mailing list for all State affiliates of the UGBA was selected(approximately 10,000 names). Articles appeared in several gamefowlmagazines promoting the study, and a presentation was made at the UGBAannual meeting in Biloxi, Mississippi, in August 2004.
2. Population inferencesInferences cover the population of UGBA members (and members of Stateassociations not affiliated with UGBA) in the United States. All respondent datawere statistically weighted for nonresponse to reflect the population from whichthey were selected. The number of surveys mailed to each State, or cluster ofsmall States, minus the number of undeliverable surveys returned was used asthe initial number of “good surveys” mailed out. Because individuals couldbelong to more than one affiliate organization, they may have been on morethan one list. Therefore, this number was reduced to account for the number ofduplicate surveys, calculated as the number undeliverable surveys returnedthat were duplicate addresses, to come up with the number of good surveysmailed out. This number was divided by the number of complete surveysreturned to create the weight.

Section II: Methodology
USDA APHIS VS / 75
C. Data Collection Surveys were mailed out in November 2004. Completed surveys returned byMarch 10, 2005, were entered into a SAS data set and summarized for thisreport.
D. Data Analysis 1. Validation and estimationData were entered into a SAS data set. Validation checks were performed toidentify numeric extremes, improper categorical responses, skip patterns notfollowed, and relational checks. Weighted point estimates were generatedusing SUDAAN software, which accounts for sampling methodology andclustering.
2. Response rateAn estimated 8,882 unique surveys were mailed out, with 628 usable surveysreturned (7.1 percent). Response rate ranged from 3 percent in Texas to 25percent in Colorado.
Number of surveys mailed out, returned undeliverable, duplicate addresses (forundeliverables), and completed surveys:
Mailed out 10,759
- Undeliverable 1,179
= Delivered 9,580
Duplicate undeliverable 86 (7.3%)
Estimated unique delivered (nonduplicate) 8,882 Returned Completed surveys 628 (7.1%)

Appendix I: Sample Profile
76 / Poultry ‘04
Appendix I: Sample Profile
1. Number of respondents, by region:
Number of Respondents
Region
West South Central Northeast Southeast Total
90 167 81 290 628
2. Number of respondents, by flock size:
Number of Respondents
Flock Size (Number of Birds)
0 1 to 99 100 to 499 500 or More Missing Total
13 200 362 47 6 628
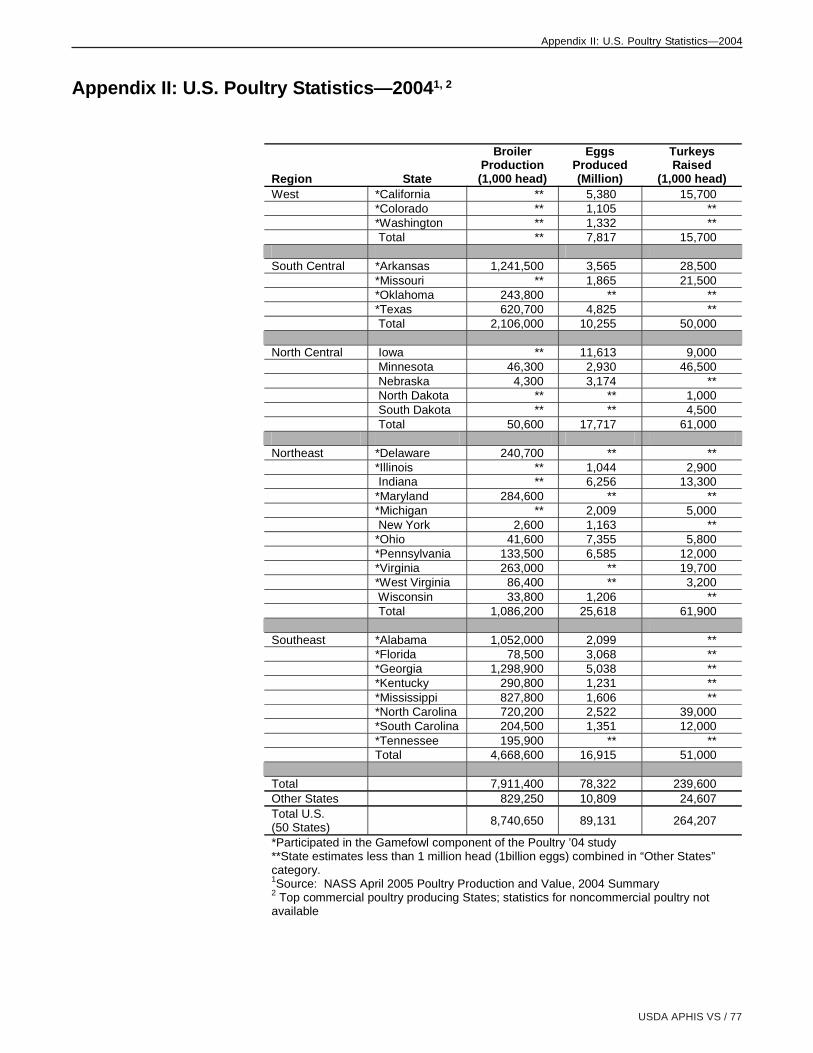
Appendix II: U.S. Poultry Statistics—2004
USDA APHIS VS / 77
Appendix II: U.S. Poultry Statistics—20041, 2
Region State
Broiler Production (1,000 head)
Eggs Produced (Million)
Turkeys Raised
(1,000 head) West *California ** 5,380 15,700 *Colorado ** 1,105 ** *Washington ** 1,332 ** Total ** 7,817 15,700 South Central *Arkansas 1,241,500 3,565 28,500 *Missouri ** 1,865 21,500 *Oklahoma 243,800 ** ** *Texas 620,700 4,825 ** Total 2,106,000 10,255 50,000 North Central Iowa ** 11,613 9,000 Minnesota 46,300 2,930 46,500 Nebraska 4,300 3,174 ** North Dakota ** ** 1,000 South Dakota ** ** 4,500 Total 50,600 17,717 61,000 Northeast *Delaware 240,700 ** ** *Illinois ** 1,044 2,900 Indiana ** 6,256 13,300 *Maryland 284,600 ** ** *Michigan ** 2,009 5,000 New York 2,600 1,163 ** *Ohio 41,600 7,355 5,800 *Pennsylvania 133,500 6,585 12,000 *Virginia 263,000 ** 19,700 *West Virginia 86,400 ** 3,200 Wisconsin 33,800 1,206 ** Total 1,086,200 25,618 61,900 Southeast *Alabama 1,052,000 2,099 ** *Florida 78,500 3,068 ** *Georgia 1,298,900 5,038 ** *Kentucky 290,800 1,231 ** *Mississippi 827,800 1,606 ** *North Carolina 720,200 2,522 39,000 *South Carolina 204,500 1,351 12,000 *Tennessee 195,900 ** ** Total 4,668,600 16,915 51,000 Total 7,911,400 78,322 239,600 Other States 829,250 10,809 24,607 Total U.S. (50 States) 8,740,650 89,131 264,207
*Participated in the Gamefowl component of the Poultry ’04 study **State estimates less than 1 million head (1billion eggs) combined in “Other States” category. 1Source: NASS April 2005 Poultry Production and Value, 2004 Summary 2 Top commercial poultry producing States; statistics for noncommercial poultry not available

Appendix III: Poultry ‘04 Study Objectives and Related Outputs
78 / Swine 2000
Appendix III: Poultry ‘04 Study Objectives and Related Outputs
Objectives: Provide a basic understanding of bird health, management, andmovement practices of nontraditional poultry industries, such as live birdmarkets, gamefowl, and backyard flocks.
• Part I: Reference of Health and Management of Backyard/Small Production Flocks in the United States, 2004, August 2005
• Part II: Reference of Health and Management of Gamefowl Breeder Flocks in the United States, 2004, August 2005
• Part III: Reference of Management Practices in Live Poultry Markets in the United States, 2004, spring 2006
• Part IV: Reference of Health and Management of Backyard/Small Production Flocks and Gamefowl Breeder Flocks in the United States, 2004
• Highlights: Health and Management of Backyard/Small Production Flocks in the United States, 2004, Info Sheet, summer 2005
• Highlights: Health and Management of Gamefowl Breeder Flocks in the United States, 2004, summer 2005
• Highlights: Management Practices in Live Poultry Markets in the United States, 2004, spring 2006