poverty in australia sensitivity analysis and recent ... · poverty in australia sensitivity...
TRANSCRIPT

Poverty in Australia Sensitivity Analysis and Recent Trends Peter Saunders, Trish Hill and Bruce Bradbury Report commissioned by Jobs Australia on Behalf of the Australian Council of Social Service (ACOSS)
SPRC Report 4/08
Social Policy Research Centre March 2008

For a full list of SPRC Publications see, www.sprc.unsw.edu.au or contact: Publications, SPRC, University of New South Wales, Sydney, NSW, 2052, Australia.
Telephone: +61 (2) 9385 7800 Fax: +61 (2) 9385 7838 Email: [email protected]
ISSN 1446 4179
ISBN: 978 0 7334 2616 2
© 2008, Social Policy Research Centre, University of New South Wales
Contact: Peter Saunders p.saunders unsw.edu.au
Suggested Citation:
Saunders P., T. Hill and B. Bradbury (2008), Poverty in Australia: Sensitivity Analysis and Recent Trends, SPRC Report No. 4/08, Social Policy Research Centre, University of New South Wales, Sydney.

POVERTY IN AUSTRALIA
i
Contents
1 Introduction and Key Findings .......................................................................... 1 1.1 Key Findings ............................................................................................................ 4
1.2 Updated Estimates for 2005-06 ............................................................................... 9
1.3 Report Outline ........................................................................................................ 10
2 Methodology ....................................................................................................... 12 2.1 Data ........................................................................................................................ 12
2.2 Exclusions .............................................................................................................. 13
3 Poverty Lines ..................................................................................................... 15
4 Results: Poverty in 2003-04 .............................................................................. 23 4.1 Benchmark Poverty Estimates ............................................................................... 23
4.2 Excluding Households with Zero or Negative Income and the Self-employed ..... 24
4.3 Exclusions Based on Expenditure .......................................................................... 26
4.4 State/Territory Comparisons .................................................................................. 31
5 Medium-Term Trends in Poverty, 1993-94 to 2003-04 .................................. 34 5.1 Overall Trends ....................................................................................................... 34
5.2 Adult and Child Poverty Trends ............................................................................ 36
5.3 Trends in State Poverty .......................................................................................... 38
5.4 Summary ................................................................................................................ 40
6 Recent Changes in Poverty: 2003-04 to 2005-06 ............................................. 42 6.1 Data Issues ............................................................................................................. 42
Appendix A: Detailed Poverty Estimates and Sensitivity Analysis, 2003-04 ........ 45
Appendix B: Detailed Poverty Estimates and Poverty Lines for 2005-06 ............. 57
Appendix C: Notes on the Exclusions Methodology ................................................ 66
Appendix D: Poverty and Wealth ............................................................................. 69
Appendix E: Poverty and Financial Stress ............................................................... 74
References .................................................................................................................... 80

POVERTY IN AUSTRALIA
ii
List of Tables
Summary Table S.1: Poverty Rates for Persons, Adults and Children in 2003-04, by Exclusion Category (percentages) .......................... 4
Summary Table S.2: Numbers of Persons, Adults and Children in Poverty in 2003-04 by Exclusion Category (thousands) .............................. 5
Summary Table S.3: Estimated Poverty Trends Based on Different Exclusion Methods and Different Poverty Lines (percentages) ............................................................................... 6
Summary Table S.4: Poverty Rates by Demographic Groups in 2003-04, No Exclusions, (percentages) ............................................................ 8
Summary Table S.5: Poverty Rates by State or Territory in 2003-04, No Exclusions, (percentages) ............................................................ 9
Summary Table S.6: Poverty Rates and Numbers of Persons, Adults and Children in Poverty in 2005-06, No Exclusions ......................... 9
Summary Table S.7: Overall Poverty Rates and Numbers in 2003-04 and 2005-06, No Exclusions ............................................................ 10
Table 1: Estimates of Median Income 2003-04 ...................................... 16
Table 2: Poverty Lines by Family Type in 2003-04: 50 per cent of Median Equivalised Disposable Income, modified OECD Equivalence Scale ($ per week) .................................... 18
Table 3: Poverty Lines by Family Type in 2003-04: 60 per cent of Median Equivalised Disposable Income, modified OECD Equivalence Scale ($ per week) .................................... 19
Table 4: Henderson Poverty Lines by Family Type in 2003-04: Head in the Workforce ($ per week) ............................................................ 20
Table 5: Henderson Poverty lines by Family Type in 2003-04: Head Not in the Workforce ($ per week) .................................. 21
Table 6: Comparison of the Median Income and Henderson Poverty Lines in the September Quarter 2003 ($ per week) ......................................................................................... 22
Table 7: Benchmark Poverty Rates: No Exclusions, 2003-04 (percentages) ............................................................................. 24
Table 8: Impact on Poverty Rates of Excluding Households with Zero or Negative Incomes and Self-employed Households (percentages) ......................................................... 25
POVERTY IN AUSTRALIA
iii
Table 9: Expenditure to Income Ratios Based on Different Exclusions and 50 per cent of Median Income Poverty Line ........................................................................................... 28
Table 10: Expenditure to Income Ratios Based on Different Exclusions and 60 per cent of Median Income Poverty Line ........................................................................................... 28
Table 11: Impact of Excluding High Expenditure Households on Estimated Poverty ..................................................................... 30
Table 12: Poverty Rates by State and Territory in 2003-04 Using Alternative Poverty Lines, No Exclusions (percentages) ......... 32
Table 13: Poverty Rates by State in 2003-04 based on the 50 per cent Median Income Poverty Line, By Exclusion Category (percentages).............................................................. 33
Table 14: Poverty Rates by State in 2003-04 based on the 60 per cent Median Income Poverty Line, By Exclusion Category (percentages).............................................................. 33
Table 15: The Impact of Exclusions on Sample Sizes and Estimated Poverty Rates in 1993-94 ......................................... 35
Table 16: The Impact of Exclusions on Estimated Poverty Rates in 1998-99 (percentages) ........................................................... 36
Table 17: Estimated Poverty Trends Based on Different Exclusion Methods and Different Poverty Lines (percentages) ............................................................................. 36
Table 18: Adult and Child Poverty Rate Trends Based on Different Poverty Lines and Exclusion Categories (percentages) ............................................................................. 37
Table 19: Numbers of Adults and Children in Poverty Based on Different Poverty Lines and Exclusion Categories (thousands of persons) .............................................................. 38
Table 20: Trends in State/Territory Poverty Rates based on the 50 per cent Median Poverty Line, by Exclusion Category (percentages) ............................................................................. 39
Table 21: Trends in State/Territory Poverty Rates based on the 60 per cent Median Poverty Line, by Exclusion Category (percentages) ............................................................................. 40
Table 22: Overall Poverty Rates and Numbers in 2003-04 and 2005-06, No Exclusions ............................................................ 43

POVERTY IN AUSTRALIA
iv
Table 23: Changes in Poverty by State and Territory: 2003-04 to 2005-06, No Exclusions (percentages) ..................................... 44
Table A.1: Poverty Rates for Persons, Adults and Children by Exclusion Category (per cent) ................................................... 45
Table A.2: Numbers of Persons, Adults and Children in Poverty by Exclusion Category (‘000s)....................................................... 46
Table A.3: Composition of Poverty: Persons, Adults and Children (percentages) ............................................................................. 46
Table A.4: Poverty Rates by Family Type (50 per cent of median income poverty line) (percentages) ........................................... 47
Table A.5: Poverty Rates by Family Type (60 per cent of median income poverty line) (percentages) ........................................... 47
Table A.6: Poverty Rates by Family Type (Henderson poverty line) (percentages) ..................................................................... 48
Table A.7: Composition of Poverty by Broad Family Type (50 per cent median poverty line) (percentages) ................................... 48
Table A.8: Composition of Poverty by Broad Family Type (60 per cent median poverty line) (percentages) ................................... 48
Table A.9: Composition of Poverty by Broad Family Type (Henderson poverty line) (percentages) .................................... 49
Table A.10: Poverty Rates by Age of the Oldest Person in the Household (50 per cent median poverty line) (percentages) ............................................................................. 49
Table A.11: Poverty Rates by Age of the Oldest Person in the Household (60 per cent median poverty line) (percentages) ............................................................................. 49
Table A.12: Poverty Rates by Age of the Oldest Person in the Household (Henderson poverty line) (percentages) .................. 49
Table A.13: Composition of Poverty by Age of the Oldest Person in the Household (50 per cent median poverty line) (percentages) ............................................................................. 50
Table A.14: Composition of Poverty by Age of the Oldest Person in the Household (60 per cent median poverty line) (percentages) ............................................................................. 50
Table A.15: Composition of Poverty by Age of the Oldest Person in the Household (Henderson poverty line) (percentages) ............ 50

POVERTY IN AUSTRALIA
v
Table A.16: Poverty Rates by Labour Force Status of Oldest Person in the Household (50 per cent median poverty line) (percentages) ............................................................................. 50
Table A.17: Poverty Rates by Labour Force Status of Oldest Person in the Household (60 per cent median poverty line) (percentages) ............................................................................. 51
Table A.18: Poverty Rates by Labour Force Status of Oldest Person in the Household (Henderson poverty line) (percentages) ............................................................................. 51
Table A.19: Composition of Poverty by Labour Force Status of Oldest Person in the Household (50 per cent median poverty line) (percentages) ........................................................ 51
Table A.20: Composition of Poverty by Labour Force Status of Oldest Person in the Household (60 per cent median poverty line) (percentages) ........................................................ 51
Table A.21: Composition of Poverty by Labour Force Status of Oldest Person in the Household (Henderson poverty line) (percentages) ..................................................................... 52
Table A.22: Poverty Rates by Principal Source of Household Income (50 per cent median poverty line) (percentages) .......... 52
Table A.23: Poverty Rates by Principal Source of Household Income (60 per cent median poverty line) (percentages) .......... 52
Table A.24: Poverty Rates by Principal Source of Household Income (Henderson poverty line) (percentages) ....................... 52
Table A.25: Composition of Poverty by Principal Source of Household Income (50 per cent median poverty line) (percentages) ............................................................................. 53
Table A.26: Composition of Poverty by Principal Source of Household Income (60 per cent median poverty line) (percentages) ............................................................................. 53
Table A.27: Composition of Poverty by Principal Source of Household Income (Henderson poverty line) (percentages) ............................................................................. 53
Table A.28: Poverty Rates by Number of Earners in the Household (50 per cent of median income poverty line) (percentages) ............................................................................. 53
Table A.29: Poverty Rates by Number of Earners in the Household (60 per cent of median income poverty line) (percentages) ............................................................................. 54

POVERTY IN AUSTRALIA
vi
Table A.30: Poverty Rates by Number of Earners in the Household (Henderson poverty line) (percentages) .................................... 54
Table A.31: Composition of Poverty by Number of Earners in the Household (50 per cent median poverty line) (percentages) ............................................................................. 54
Table A.32: Composition of Poverty by Number of Earners in the Household (60 per cent median poverty line) (percentages) ............................................................................. 54
Table A.33: Composition of Poverty by Number of Earners in the Household (Henderson poverty line) (percentages) .................. 54
Table A.34: Poverty Rates by State or Territory (50 per cent median poverty line) (percentages) ........................................................ 55
Table A.35: Poverty Rates by State or Territory (60 per cent median poverty line) (percentages) ........................................................ 55
Table A.36: Poverty Rates by State or Territory (Henderson poverty line) (percentages) ..................................................................... 55
Table A.37: Composition of Poverty by State or Territory (50 per cent median poverty line) (percentages) ................................... 55
Table A.38: Composition of Poverty by State or Territory (60 per cent median poverty line) (percentages) ................................... 56
Table A.39: Composition of Poverty by State or Territory (Henderson poverty line) (percentages) .................................... 56
Table B.1: Poverty Rates in 2005-06 for Persons, Adults and Children, No Exclusions (percentages) ..................................... 57
Table B.2: Numbers of Persons, Adults and Children in Poverty in 2005-06, No Exclusions (thousands) ........................................ 57
Table B.3: Composition of Poverty in 2005-06: Persons, Adults and Children, No Exclusions (percentages) .............................. 58
Table B.4: Poverty Rates in 2005-06 Based on Different Poverty Lines by Family Type, No Exclusions (percentages) ............... 58
Table B.5: Composition of Poverty in 2005-06 Based on Different Poverty Lines by Broad Family Type, No Exclusions (percentages) ............................................................................. 59
Table B.6: Poverty Rates in 2005-06 Based on Different Poverty Lines by Age of the Oldest Person in the Household, No Exclusions (percentages) ..................................................... 59

POVERTY IN AUSTRALIA
vii
Table B.7: Composition of Poverty in 2005-06 Based on Different Poverty Lines by Age of the Oldest Person in the Household, No Exclusions (percentages) ................................. 59
Table B.8: Poverty Rates in 2005-06 Based on Different Poverty Lines by Labour Force Status of Oldest Person in the Household, No Exclusions (percentages) ................................. 59
Table B.9: Composition of Poverty in 2005-06 Based on Different Poverty Lines by Labour Force Status of Oldest Person in the Household, No Exclusions (percentages) ....................... 60
Table B.10: Poverty Rates in 2005-06 Based on Different Poverty Lines by Principal Source of Household Income, No Exclusions (percentages) ........................................................... 60
Table B.11: Composition of Poverty in 2005-06 Based on Different Poverty Lines by Principal Source of Household Income, No Exclusions (percentages) ....................................... 60
Table B.12: Poverty Rates in 2005-06 Based on Different Poverty Lines by Number of Earners in the Household, No Exclusions (percentages) ........................................................... 60
Table B.13: Composition of Poverty Based on Different Poverty Lines by Number of Earners in the Household, No Exclusions (percentages) ........................................................... 61
Table B.14: Poverty Rates in 2005-06 Based on Different Poverty Lines by State or Territory, No Exclusions (percentages) ............................................................................. 61
Table B.15: Composition of Poverty in 2005-06 Based on Different Poverty Lines by State or Territory, No Exclusions (percentages) ............................................................................. 61
Table B.16: Poverty Lines by Family Type in 2003-04: 50 per cent of Median Equivalised Disposable Income, modified OECD Equivalence Scale ($ per week) .................................... 62
Table B.17: Poverty Lines by Family Type in 2003-04: 60 per cent of Median Equivalised Disposable Income, modified OECD Equivalence Scale ($ per week) .................................... 63
Table B.18: Poverty Lines by Family Type in 2005-06: 50 per cent of Median Equivalised Disposable Income, modified OECD Equivalence Scale ($ per week) .................................... 64
Table B.19: Poverty Lines by Family Type in 2005-06: 60 per cent of Median Equivalised Disposable Income, modified OECD Equivalence Scale ($ per week) .................................... 65

POVERTY IN AUSTRALIA
viii
Table D.1: Net Wealth to Income Ratios Based on Different Exclusions and 50 per cent of Median Income Poverty Line ........................................................................................... 70
Table D.2: Net Wealth to Income Ratios Based on Different Exclusions and 60 per cent of Median Income Poverty Line ........................................................................................... 70
Table D.3: Percentage of Poor Households with Wealth above Pension Assets Test Limits (weighted percentages) ................. 72
Table D.4: Composition of Households Below the 50 per cent Median Income Poverty Line Who Have Wealth Greater than and Below the Threshold for Commencing Pension Assets Test Withdrawal in 2004 (weighted percentages)............................................................................... 73
Table E.1: Financial Stress Questions Included in HES 2003-04 .................................. 75
Table E.2: Distribution of Financial Stress Indicators for People in Households Below the Poverty Line (percentages) .................. 79

POVERTY IN AUSTRALIA
ix
List of Figures
Figure 1: Cumulative Ratio of Total Expenditure to the Poverty Line (50 per cent of median income) ........................................ 29
Figure D.1: Distribution of Net Wealth and Net Wealth minus Owner Occupied Housing Wealth for Households under the 50 per cent of Median Income Poverty Line ............. 71
Figure D.2: Distribution of Net Wealth and Net Wealth minus Owner Occupied Housing Wealth for Households under the 60 per cent of Median Income Poverty Line ............. 72
Figure E.1: The Number of Financial Stress Indicators Experienced by Households Below the 50 per cent of Median Income Poverty Line (cumulative distribution of number of financial stress indicators) ....................................... 77
Figure E.2: The Number of Financial Stress Indicators Experienced by Households with Incomes Between 50 per cent and 60 per cent of Median Income (cumulative distribution of number of financial stress indicators) ................................... 78

POVERTY IN AUSTRALIA
1
1 Introduction and Key Findings
Despite the well-known limitations of statistical measurement, there is still a vital need to document the extent of overall poverty and its incidence among different groups in Australia. Without such evidence, it is impossible to establish how successful social and economic policies have been in alleviating poverty, or where additional resources need to be directed. The absence of such evidence is all the more concerning given the reliance placed in Australia on the efficient targeting of resources through means-testing and other policies (e.g. mutual obligation) designed to ensure that the assistance provided is cost-effective. At the very least, one would expect trends in poverty to be monitored regularly using a range of indicators.
Community concern over poverty remains at a high level. Evidence from large social survey conducted in the middle of 2006 by the Social Policy Research Centre (SPRC) indicates that when asked how big a problem poverty is in Australia today, almost one-third (32.1 per cent) thought it was ‘a big problem’ and almost everyone else thought that it was ‘a problem for some’. Less then five per cent thought that it was ‘a small problem’ and around one per cent thought it was ‘not a problem at all’.1
In response to this situation, the SPRC has been commissioned to undertake a detailed analysis of the extent of poverty in Australia in 2003-04 (the latest year for which this is possible with existing data), describe who is most affected by poverty, assess the robustness of the findings, to examine trends in poverty levels over the preceding decade, and update a limited range of poverty estimates to 2005-06 using recently released data.
Although research on income poverty using a poverty line approach can reveal only a single dimension of what is a complex and multi-faceted issue, it remains important – particularly in an era where ‘money matters’ more than ever before. Poverty research thus provides the statistical foundation on which other methods of measuring deprivation and social exclusion can build. Those other approaches may eventually replace the conventional approach with its emphasis on comparing incomes with a poverty line, but even those countries that are moving in this direction (e.g. the UK and Ireland) still include poverty rates measured using a range of poverty lines as part of the battery of indicators used to identify who is poor.
The approach taken in this report examines the sensitivity of poverty estimates to variations in the methods used to produce them. The basic idea is to check the robustness of estimated poverty rates by varying some of the underlying assumptions in order to establish their quantitative importance. Without such analysis, it is difficult to be confident about the findings from any single study. With them it is possible to check the robustness of the estimates and accumulate a body of knowledge that adds to our understanding in ways that can generate new insights and implications for policy.
1 The Community Understanding of Poverty and Social Exclusion (CUPSE) survey was
conducted between April and July 2006 on a random sample of the adult population drawn from the electoral rolls. It attracted over 2,700 responses equivalent to a response rate of 47 per cent. Initial findings from the survey are described by Saunders (2006, 2007).

POVERTY IN AUSTRALIA
2
Two approaches to sensitivity testing are taken in this report. The first approach varies the poverty line and assesses what difference this makes to the poverty rate (in aggregate, and for different socio-economic groups). It then seeks to establish whether such variation is great enough to influence conclusions about the direction of change. Many previous Australian studies have presented results using a variety of poverty lines (e.g. Saunders and Bradbury, 1991, 2006: Harding, Lloyd and Greenwell, 2001) and the approach dates back to the original studies associated with the work of Ronald Henderson (Henderson, Harcourt and Harper, 1970).
The second approach (the basis for which can also be found in Henderson’s early work) addresses the sensitivity issue not by varying the poverty line, but by varying the sample from which the poverty rates are estimated. The idea behind this second approach is that the information provided by some households when surveys are conducted may (often for legitimate reasons) be unreliable and cause a bias in the estimated poverty rate.
The best example of this relates to those households who are self-employed. Because of the difficulty involved in distinguishing between their business and personal income, many such households are able to report very low (sometimes negative) incomes as resulting from their business losses. However, this places them among the poverty statistics and can lead to an upwards bias in the estimated poverty rate.2 To allow for this possibility, such households can be excluded from the sample used to estimate the poverty rate and the impact of their exclusion assessed. Similarly, many poverty studies exclude from their sample those households reporting zero or negative incomes.
An innovative aspect of this research is the extension and systematic application of this second ‘exclusions’ approach to a wider range of household characteristics, including:
• Households who report zero and negative incomes;
• Self-employed households; and
• Low-income households with relatively high expenditures.
It also examines (in Appendices D and E) the relationship between poverty and wealth, and between poverty and financial stress as measured in household surveys conducted by the Australian Bureau of Statistics (ABS).
In overall terms, the approach is designed to assess the robustness of the findings and their sensitivity to specific adjustments to the data, with the ultimate aim of re-establishing Australian poverty research at the forefront of international best practice in the field.
Three poverty lines are used to estimate levels of poverty in 2003-04: 50 per cent of median equivalent disposable household income, 60 per cent of median equivalent
2 It is important to recognise that this bias is not inevitable. Some of those self-employed
households who report very low incomes may actually be below the poverty line, even after adjusting for any business losses.

POVERTY IN AUSTRALIA
3
disposable household income, (which are standard poverty lines used in poverty research here and internationally, including by the OECD, European Union, and in measuring the effectiveness of policies to reduce poverty in the UK and Ireland) and the Henderson Poverty Line, which was developed for the National Inquiry into Poverty in Australia in the 1970s and has been updated since by the Melbourne Institute.
To give an indication of the values of these poverty lines, the relevant poverty lines for a single adult living alone in 2003-04 were:
• $249 per week for the 50 per cent of median income poverty line
• $298 per week for the 60 per cent of median income poverty line
• $242 per week for the Henderson Poverty Line (where the person is not in the
labour force).
By 2005-06, the latest year for which data are available to estimate poverty, the two median income-based poverty lines had increased to:
• $281 per week for the 50 per cent of median income poverty line
• $337 per week for the 60 per cent of median income poverty line
The income unit used for the analysis is the household, and the equivalence scale used to adjust for family size is the ‘modified OECD’ equivalence scale in the case of the first two poverty lines, and the ‘simplified Henderson’ equivalence scale in the case of the Henderson Poverty Line.
The data used in the analysis are taken from the three most recent Household Expenditure Surveys (HES) conducted by ABS in 1993-94, 1998-99 and 2003-04 based on the different exclusions examined. The latest of these surveys was conducted in conjunction with the Survey of Income and Housing (SIH) and another SIH was conducted in 2005-06. Results from this latest SIH are used to update some of the poverty estimates to 2005-06, although attention focuses on results for 2003-04 since only these data allow the exclusions methodology to be applied in a full and consistent manner across the different years.
Two sets of estimates of poverty in 2003-04 are presented to reflect the way in which the data for that year were collected. Most of the analysis is conducted on the HES sub-set (around two-thirds) of the total sample for that year that was asked to provide detailed information about not only their incomes, but also details of their expenditures and wealth holdings. The full SIH data set for 2003-04 is used to estimate poverty for the purpose of estimating changes between then and the latest year for which data are available (2005-06) so that the estimates for the two years are directly comparable.
This implies that we have two sets of poverty estimates for 2003-04, although they differ only very slightly (by 0.1 of a percentage point in relation to the overall poverty rate). However, a consequence is that it is not possible to produce a consistent series of

POVERTY IN AUSTRALIA
4
poverty rates covering the entire period from 1993-94 to 2005-06.3 Instead, we provide consistent estimates for 1993-94 to 2003-04, and for 2003-04 to 2005-06, with a link in 2003-04 that shows the size of the discontinuity
1.1 Key Findings In summarising the key findings, we begin with the HES-based results for 1993-94 to 2003-04, presented with and without making an adjustment for exclusions. This is followed by the update results, derived from the two latest SIH surveys, showing changes between 2003-04 and 2005-06.
Summary Tables S.1 and S.2 present the resulting estimates of overall poverty rates and numbers of individuals and children living in poverty in 2003-04 and 2005-06. The estimates for the earlier year are shown with and without the exclusions that are described in the main report.4
Summary Table S.1: Poverty Rates for Persons, Adults and Children in 2003-04, by Exclusion Category (percentages) (a)
No exclusions
Exclusion 1 - households with
zero/negative income and/or self-employed
Exclusion 2 - exclusion 1 plus households with
expenditures more than median equivalised
income
50 per cent median income poverty line Adults 10.1 10.0 8.4
Over 65 years 17.7 17.8 16.2 Under 65 years 8.7 8.3 6.8
Children 9.4 9.1 8.1 Persons 9.9 9.8 8.4 60 per cent median income poverty line Adults 19.7 20.4 18.0
Over 65 years 41.7 42.8 40.5 Under 65 years 15.7 15.7 13.3
Children 20.2 20.4 18.4 Persons 19.8 20.4 18.1 Henderson poverty line Adults 11.8 10.9 9.2
Over 65 years 15.8 15.3 13.8 Under 65 years 11.0 10.0 8.2
Children 14.4 13.2 11.6 Persons 12.3 11.4 9.7 Notes: (a) Based on HES sub-sample for 2003-04.
3 A series of changes to the way in which some of the variables were defined were also
introduced in the latest survey, although these are not expected to have much of an impact on the estimates presented in this report. Further details are provided in ABS (2007).
4 All poverty rate estimates have been rounded to one decimal place to avoid any false sense of accuracy.

POVERTY IN AUSTRALIA
5
Summary Table S.2: Numbers of Persons, Adults and Children in Poverty in 2003-04 by Exclusion Category (thousands) (a)
No
exclusions
Exclusion 1- households with
zero/negative income and/or self-employed
Exclusion 2- exclusion 1 plus households with
expenditures more than median
equivalised income
50 per cent median income poverty line Adults
Over 65 years 421.8 398.0 354.7 Under 65 years 1,148.0 888.5 710.3 All adults 1,569.7 1,286.5 1,065.0
Children 365.3 280.2 247.2 Persons 1,935.0 1,566.6 1,312.2 60 per cent median income poverty line Adults
Over 65 years 996.7 955.2 868.5 Under 65 years 2076.8 1,669.3 1,378.4 All adults 3,073.5 2,624.4 2,247.0
Children 785.6 628.0 554.5 Persons 3,859.0 3,252.4 2,801.5 Henderson poverty line Adults
Over 65 years 377.6 340.9 301.6 Under 65 years 1,459.6 1,067.5 860.1 All adults 1,837.2 1,408.4 1,161.8
Children 559.6 408.8 351.8 Persons 2,396.8 1,817.2 1,513.5 Notes: (a) Based on HES sub-sample for 2003-04. The ‘headline’ poverty rates (before any households are excluded from the analysis) for 2003-04 are:
• 9.9 per cent using the 50 per cent of median income poverty line (9.4 per cent for children),
• 19.8 per cent using the 60 per cent of median poverty line (20.2 per cent for children),
• 12.3 per cent using the Henderson Poverty Line (14.4 per cent for children).
The equivalent numbers of people in poverty in 2003-04 are:
• 1.935 million using the 50 per cent of median income poverty line (including over 365 thousand children),
• 3.859 million using the 60 per cent of median poverty line (including over 785 thousand children),
• 2.397 million using the Henderson Poverty Line (including 560 thousand children).
POVERTY IN AUSTRALIA
6
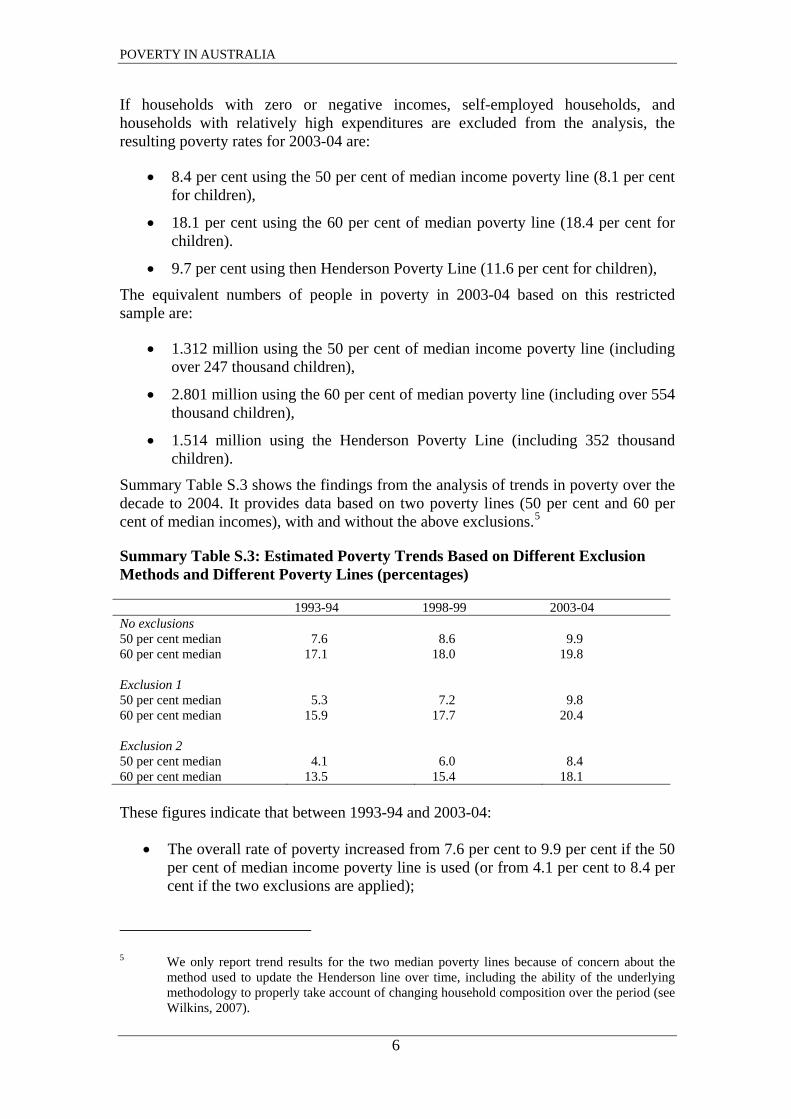
If households with zero or negative incomes, self-employed households, and households with relatively high expenditures are excluded from the analysis, the resulting poverty rates for 2003-04 are:
• 8.4 per cent using the 50 per cent of median income poverty line (8.1 per cent for children),
• 18.1 per cent using the 60 per cent of median poverty line (18.4 per cent for children).
• 9.7 per cent using then Henderson Poverty Line (11.6 per cent for children),
The equivalent numbers of people in poverty in 2003-04 based on this restricted sample are:
• 1.312 million using the 50 per cent of median income poverty line (including over 247 thousand children),
• 2.801 million using the 60 per cent of median poverty line (including over 554 thousand children),
• 1.514 million using the Henderson Poverty Line (including 352 thousand children).
Summary Table S.3 shows the findings from the analysis of trends in poverty over the decade to 2004. It provides data based on two poverty lines (50 per cent and 60 per cent of median incomes), with and without the above exclusions.5
Summary Table S.3: Estimated Poverty Trends Based on Different Exclusion Methods and Different Poverty Lines (percentages)
1993-94 1998-99 2003-04 No exclusions 50 per cent median 7.6 8.6 9.9 60 per cent median 17.1 18.0 19.8 Exclusion 1 50 per cent median 5.3 7.2 9.8 60 per cent median 15.9 17.7 20.4 Exclusion 2 50 per cent median 4.1 6.0 8.4 60 per cent median 13.5 15.4 18.1 These figures indicate that between 1993-94 and 2003-04:
• The overall rate of poverty increased from 7.6 per cent to 9.9 per cent if the 50 per cent of median income poverty line is used (or from 4.1 per cent to 8.4 per cent if the two exclusions are applied);
5 We only report trend results for the two median poverty lines because of concern about the
method used to update the Henderson line over time, including the ability of the underlying methodology to properly take account of changing household composition over the period (see Wilkins, 2007).

POVERTY IN AUSTRALIA
7
• The poverty rate increased from 17.1 per cent to 19.8 per cent if the 60 per cent of median income poverty line is used (or from 13.5 per cent to 18.1 per cent if the two exclusions are applied).6
It is thus apparent that although the application of the exclusions lowers the poverty rate in any given year, the effect is to cause the rise in poverty over the period to increase.
Updated results for 2005-06 (reported in detail later) indicate that, when measured on a consistent basis for the two years, poverty increased between 2003-04 and 2005-06 from 9.8 per cent to 11.1 per cent using the 50 per cent median poverty line, and from 19.3 per cent to 19.4 per cent using the 60 per cent median poverty line.
Certain population groups consistently face a higher than average risk of poverty, regardless of which poverty line is used. As Summary Table S.4 indicates, the following groups were most at risk of poverty in 2003-04:
• Among family types, single people and lone parents;
• Among age groups, mature age people (aged over 65) and young people;
• Unemployed people; and
• People in jobless households or whose main source of income is social security.
6 Some Australian studies (e.g. Harding, Lloyd and Greenwell, 2001) have estimated the trend in
poverty using a poverty line fixed at a percentage of mean (average) rather than median income. If this approach is used (without applying any exclusions) the poverty rates in each year are higher than those based on median income, and the trend over time differs somewhat from that shown in Summary Table B (reflecting the changes in income inequality that affect the relationship between the mean and the median of the distribution). The (person-weighted) poverty rates based on a poverty line set at 50 per cent of mean equivalised income are 13.16 per cent in 1993-94, 15.09 per cent in 1998-99 and 14.95 per cent in 2003-04.

POVERTY IN AUSTRALIA
8
Summary Table S.4: Poverty Rates by Demographic Groups in 2003-04, No Exclusions, (percentages)
50 per cent of median poverty
line
60 per cent of median poverty
line
Henderson poverty line
Family Type Single older person 39.0 60.1 38.6 Older couple 10.6 41.2 6.3 Single working-age 22.8 29.4 26.2 Working-age couple 7.4 14.2 7.5 Couples with children 7.0 13.1 9.7 Lone parent families 11.4 32.1 20.1 Age of oldest person in household Under 25 12.5 20.5 15.6 25 - 44 8.5 15.8 12.2 45 - 54 6.5 13.1 10.3 55 - 64 13.7 23.3 13.6 65 and over 15.1 37.1 13.8 Labour force status of oldest person in the household
Employed full-time 1.7 3.4 2.4 Employed part-time 4.5 10.6 8.9 Self-employed 12.0 20.4 20.4 Unemployed 40.2 62.1 63.7 Not in the labour force 20.3 42.4 20.6 Principal source of household income Zero or negative income 100.0 100.0 100.0 Wages and salaries 2.2 4.4 3.5 Own unincorporated business income 6.5 15.7 14.0 Government pensions and allowances 31.5 66.9 36.0 ALL 9.9 19.8 12.3 Summary Table S.5 indicates that the ranking of Australian States and Territories according to their poverty rates varies according to the poverty line used. However, Tasmania consistently has higher than average poverty levels, while poverty in the Northern territory and the Australian Capital Territory combined is consistently below the national average.7 There is relatively little variation in poverty rates across the remaining (more populous) States.
7 Data for the two Territories has been combined (by the ABS) because of small sample sizes to
protect the confidentiality of respondents, not because of any similarity in their poverty profiles. More detailed information on poverty rates by State/Territory is provided later and in Appendix A.

POVERTY IN AUSTRALIA
9
Summary Table S.5: Poverty Rates by State or Territory in 2003-04, No Exclusions, (percentages)
50 per cent of median poverty line
60 per cent of median poverty line
Henderson poverty line
New South Wales 9.9 19.9 12.0 Victoria 10.7 18.8 12.2 Queensland 8.9 21.3 12.2 South Australia 9.3 20.2 12.0 Western Australia 9.9 18.8 13.2 Tasmania 16.3 28.1 19.9 ACT and Northern Territory 7.4 11.4 7.7 All 9.9 19.8 12.3 Poverty estimates for 2005-06 that correspond to those shown in Summary Tables 4 and 5 are presented in Appendix B.
1.2 Updated Estimates for 2005-06 By 2005-06, the headline poverty estimates were:
• 11.1 per cent using the 50 per cent of median income poverty line (10.7 per cent for children),
• 19.4 per cent using the 60 per cent of median poverty line (19.5 per cent for children).
The equivalent numbers of people in poverty in 2005-06 are:
• 2.210 million using the 50 per cent of median income poverty line (including over 411 thousand children),
• 3.857 million using the 60 per cent of median poverty line (including 754 thousand children).
Further details are provided in Summary Table S.6.
Summary Table S.6: Poverty Rates and Numbers of Persons, Adults and Children in Poverty in 2005-06, No Exclusions
Poverty rate (%)
Numbers in poverty (‘000)
50 per cent median income poverty line Adults 11.3 1,798.0
Over 65 years 23.9 597.4 Under 65 years 8.9 1,200.5
Children 10.7 411.6 Persons 11.1 2,209.6 60 per cent median income poverty line Adults 19.4 3,103.4
Over 65 years 45.2 1,128.0 Under 65 years 14.7 1,975.3
Children 19.5 753.7 Persons 19.4 3,857.1

POVERTY IN AUSTRALIA
10
When the SIH sample is used to estimate poverty in 2003-04 and 2005-06 on a consistent basis for both years, the poverty rate is shown to increase:
• from 9.8 per cent to 11.1 per cent using the 50 per cent of median income poverty line, and
• from 19.3 per cent to 19.4 per cent using the 60 per cent of median income poverty line.
The numbers in poverty increase from 1.912 million to 2.210 million (50 per cent line) or from 3.761 million to 3.857 million (60 per cent line) – see Summary Table S.7.
Summary Table S.7: Overall Poverty Rates and Numbers in 2003-04 and 2005-06, No Exclusions (a)
2003-04 2005-06 Poverty rate (%): 50 per cent median poverty line Adults 10.0 11.3 Children 8.9 10.7 Persons 9.8 11.1 60 per cent median poverty line Adults 19.4 19.4 Children 18.8 19.5 Persons 19.3 19.4 Numbers below poverty line (thousands): 50 per cent median poverty line Adults 1,564.9 1,798.0 Children 347.2 411.6 Persons 1,912.1 2,209.6 60 per cent median poverty line Adults 3,027.1 3,103.4 Children 734.4 753.7 Persons 3,761.5 3,857.1
Further results for 2005-06 are provided in Appendix B, which includes poverty rates by family type, age, labour force status, principal source of income, number of earners and State/Territory.
1.3 Report Outline
The remainder of the report is structured as follows. Section 2 describes the exclusions methodology that has been used to derive the poverty estimates, focusing on their application to the latest (2003-04) HES data. Section 3 then describes the three poverty lines that have been used to estimate poverty and canvasses some of the issues involved in applying the underlying methods to the HES 2003-04 data. Section 4 discusses the methods used to apply exclusions based on very low values for reported income, whether or not the household is self-employed, and the balance between reported income and expenditure. It examines the impact of these exclusions on the numbers below the poverty line and on the overall poverty rate in 2003-04, measured using three alternative poverty lines. Section 5 presents the trend analysis, focusing on changes in overall poverty rates in the decade to 2003-04 using the limited number of

POVERTY IN AUSTRALIA
11
exclusions that can be applied consistently to the data from the three latest surveys. Section 6 examines recent changes in poverty, between 2003-04 and 2005-06.
There are also five appendices. Appendix A provides a set of tables that contain estimated poverty rates and the numbers of people in poverty, broken down according to family status, age, labour force status, main income source and State/Territory. These tables also provide an indication of the sensitivity of results to the different exclusions. Appendix B provides similar breakdowns of poverty rates for 2005-06. Appendix C provides a more detailed description of the methods used in this study. Appendices D and E explore the relationship between income poverty and two other factors: wealth holdings and the incidence of financial stress.8
8 Information on financial stress is available for 1998-99 but not for 1993-94, while information
on household wealth is only available for 2003-04. It is thus not possible to estimate decade-long changes in poverty after adjusting for exclusions based on these variables.

POVERTY IN AUSTRALIA
12
2 Methodology
2.1 Data The data used in the analysis are taken from the confidentialised unit record files (CURFs) derived from the Household Expenditure Surveys (HES) undertaken by ABS in 1993-94, 1998-99 and 2003-04 and the Survey of Income and Housing (SIH) conducted in 2005-06. Our base definition of poverty is derived from the income information collected in this survey, though some of our other measures also take account of expenditure.9 The HES survey runs throughout the financial year, with income data collected on a ‘current basis’ (e.g. usual weekly income from employment in jobs currently held, or most recent income support payment for current income support recipients).
A number of important changes were introduced in the 2003-04 survey that have affected the comparability of the income data for that year with the income data for the two earlier years. These changes are described and the impact of some of them estimated in ABS (2005) and Pietsch, McColl and Saunders (2006). For the purposes of this exercise, the income data reported in each survey have been taken at face value and no attempt has been made (nor could it be) to adjust for these changes in survey methodology. However, some of the adjustments described below are expected to minimise the impact of these changes in survey methodology and measurement on estimated poverty rates.10
Aside from these changes, the three sets of HES data represent a comprehensive basis on which to estimate the trends in poverty – in aggregate and for different groups in the community. Although most poverty studies have used data collected in what is now called the ABS Surveys and Income and Housing (SIH) – which is conducted more frequently than the HES and includes both current and annual income – the HES data can be used to examine the balance between income and expenditure when considering whether or not the income figures are reported accurately.
Also, in 2003-04, the HES and SIH surveys were combined and comprehensive data on the wealth holdings of Australian households was collected for the first time. This information provides another channel through which the accuracy and reliability of the reported income data (and of the poverty estimates based on them) can be assessed – at least for that year. That survey was also the second in which households were asked a series of questions about financial stress and these responses can also be used to get a better picture of the nature of poverty and who is poor (although this aspect is only examined briefly in Appendix E of this report).
The unit of analysis (within which income is assumed to be shared according to need among all members) is the household, and person weights are applied when estimating poverty rates for the population or sub-groups within it. Although the household is the
9 Using expenditure on its own is problematic because of ‘shopping variability’. People who do
not go shopping during the survey fortnight might erroneously be assumed to have a low consumption level. See Saunders and Bradbury (2006).
10 It is not possible to derive a fully consistent series covering all three surveys because many of the changes introduced in 2003-04 cannot be applied to the data from earlier surveys.

POVERTY IN AUSTRALIA
13
unit used to estimate poverty, the resulting estimates are presented on a nuclear family basis, where a family is defined as related individuals living together (single people, married couples, couples with children and lone parents with children), with children aged 15 and over treated for equivalence purposes as additional adults. Those households that contain unrelated individuals living together (group households, including multiple family households) are treated separately and aggregated into the ‘other households’ category.
The poverty rates presented below follow standard procedure and express the percentage of individuals living in households identified as being below the different poverty lines. This approach has the advantage that larger households below the poverty line are given greater weight. It is important to recognise, however, that the numbers of cases excluded using the different exclusions approaches refer to the number of households affected, not the number of individuals. It is thus possible for similar numbers of households to be excluded using different exclusion methods (or poverty lines) but for the resulting poverty rates to be different. The poverty rates depend not only on the numbers of households affected, but also on their size and composition, and these are influenced by where different households lie in the income distribution, and by the equivalence scale that affects both who is excluded and who is identified as poor.
2.2 Exclusions The benchmark poverty rates are based on estimates that cover all households for which the required data are available on the HES data files. Subsequent results apply a series of exclusions to the benchmark, progressively reducing the coverage of households in order to remove those for whom there are concerns about the accuracy or reliability of the income data reported in the survey. A more detailed explanation of the methodology used to exclude groups from the sample is provided at Appendix C.
The exclusion of households from the poverty counts (with consequent implications for estimated poverty rates) has not been allowed to affect the median income estimates used to derive the poverty lines (where relevant). The decision to keep the poverty line unchanged throughout the analysis was made to simplify the presentation of results and make it easier to assess the impact of the exclusions on poverty. The alternative approach would be to remove these households from the analysis altogether, with consequences for median income and hence for the poverty line and for the numbers who fall below it. However, it would then be necessary to check how much of the observed change in the poverty rate was due to the change in the poverty line and how much was due to the exclusion of certain households, making it more difficult to interpret the findings.
The approach adopted allows the impact of the different exclusions on poverty to be assessed using a fixed poverty line benchmark. In effect, this approach assumes that excluding households on the basis of information about variables other than income has no impact on the median of the income distribution, and hence the poverty line. It should be noted that even for income itself, the level of reported income would have to be greatly under-reported for it to make a difference to median income, since it would have to be large enough to move the household from well below the median (far enough for the household to fall below the poverty line) to above it. (A reporting error of less than this size will not affect the income ranking that determines the median,

POVERTY IN AUSTRALIA
14
even though it may affect whether or not the household’s income is below or above the poverty line).
The following exclusion adjustments have been made progressively to the benchmark (full sample) estimates:
1. Removal of all households with zero or negative incomes;
2. Removal of households with income from self-employment (or who report their labour force status as self-employed); and
3. Removal of households below the poverty line with ‘unusually’ high reported expenditures given their incomes - this will involve examining the distribution of expenditure among those below the poverty line in the benchmark case to identify where the exclusion cut-off should be set.
Poverty rates are presented on an overall basis (for all households, all persons, and separately for adults and children and for those aged under 65 and those aged 65 and over). Appendix A provides estimates of poverty rates disaggregated by family type, age, labour force status, number of earners, principal source of income and State/Territory of residence. Appendix B provides detailed poverty estimates for 2005-06 based on data from the latest SIH.

POVERTY IN AUSTRALIA
15
3 Poverty Lines
Three basic poverty lines have been used in the analysis:11
• A poverty line set at 50 per cent of median income, adjusted for need using the modified OECD equivalence scale
• A poverty line set at 60 per cent of median income, adjusted for need using the modified OECD equivalence scale
• The Henderson poverty line
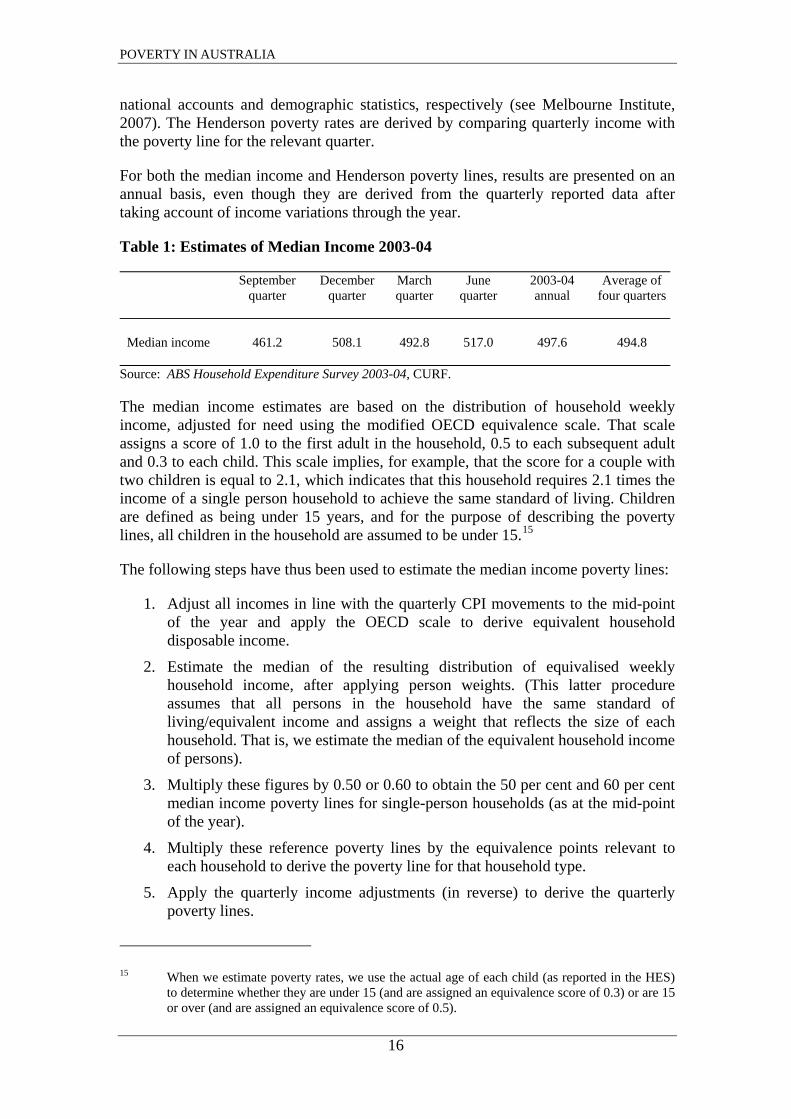
The median income poverty lines have been derived directly from the HES data.12 In calculating the median, account must be taken of the fact that the HES survey is spread throughout the year because of income variation over the year. There is considerable variation in median income across the four quarters, reflecting overall income growth through the year, combined with seasonal income variations and other (unidentified) factors. This is possible because the datasets contain a flag indicating in which quarter of the year the interview took place.
By way of illustration, Table 1 shows the values of median income in each quarter of the 2003-04 survey and the overall (annual) median, obtained by grouping all observations together. Since the individual incomes refer to a particular quarter of the year, they need to be compared with a poverty line that is defined for that quarter. However, the variability in median income across the quarters is too great (partly due to seasonal variation) to produce reliable estimates using the median for each quarter, and the use of the median for the year requires some adjustment to the data.
In responding to this issue, we have adjusted the reported incomes for each quarter to reflect quarterly movements in the CPI over the year, and then estimated the median of this adjusted income distribution for the year. Poverty rates are then derived by comparing adjusted quarterly reported incomes with the median of the adjusted incomes across all four quarters.13 This approach effectively adjusts all incomes so that they refer to the mid-point of the year.
The Henderson poverty line used is that published by the Melbourne Institute in its quarterly Poverty Lines: Australia reports. The Melbourne Institute poverty lines are derived from the ‘simplified’ Henderson equivalence scales, as explained in detail by Johnson (1987).14 The published figures are adjusted each quarter by movements in seasonally adjusted household disposable income per capita, derived from ABS
11 Update results for 2005-06 are based on the two median income poverty lines only. 12 As explained earlier, all the estimates have been derived from the confidentialised unit record
files (CURFs) for each year. These are publicly released data files that suppress some information for confidentiality reasons. The full data sets from recent surveys are available for analysis on the ABS Remote Access Data Laboratory (RADL) system but have not been used in this study.
13 In 2003-04 these adjustments produce an estimate of median income of $497.4, very close to the unadjusted figure of $497.6 shown in Table 1
14 The simplified Henderson equivalence scale makes specific assumptions about the ages of children and the labour force status of adults in each household.
POVERTY IN AUSTRALIA
16
national accounts and demographic statistics, respectively (see Melbourne Institute, 2007). The Henderson poverty rates are derived by comparing quarterly income with the poverty line for the relevant quarter.
For both the median income and Henderson poverty lines, results are presented on an annual basis, even though they are derived from the quarterly reported data after taking account of income variations through the year.
Table 1: Estimates of Median Income 2003-04
September quarter
December quarter
March quarter
June quarter
2003-04 annual
Average of four quarters
Median income
461.2
508.1
492.8
517.0
497.6
494.8
Source: ABS Household Expenditure Survey 2003-04, CURF.
The median income estimates are based on the distribution of household weekly income, adjusted for need using the modified OECD equivalence scale. That scale assigns a score of 1.0 to the first adult in the household, 0.5 to each subsequent adult and 0.3 to each child. This scale implies, for example, that the score for a couple with two children is equal to 2.1, which indicates that this household requires 2.1 times the income of a single person household to achieve the same standard of living. Children are defined as being under 15 years, and for the purpose of describing the poverty lines, all children in the household are assumed to be under 15.15
The following steps have thus been used to estimate the median income poverty lines:
1. Adjust all incomes in line with the quarterly CPI movements to the mid-point of the year and apply the OECD scale to derive equivalent household disposable income.
2. Estimate the median of the resulting distribution of equivalised weekly household income, after applying person weights. (This latter procedure assumes that all persons in the household have the same standard of living/equivalent income and assigns a weight that reflects the size of each household. That is, we estimate the median of the equivalent household income of persons).
3. Multiply these figures by 0.50 or 0.60 to obtain the 50 per cent and 60 per cent median income poverty lines for single-person households (as at the mid-point of the year).
4. Multiply these reference poverty lines by the equivalence points relevant to each household to derive the poverty line for that household type.
5. Apply the quarterly income adjustments (in reverse) to derive the quarterly poverty lines.
15 When we estimate poverty rates, we use the actual age of each child (as reported in the HES)
to determine whether they are under 15 (and are assigned an equivalence score of 0.3) or are 15 or over (and are assigned an equivalence score of 0.5).

POVERTY IN AUSTRALIA
17
Application of the method described above produces the 50 per cent and 60 per cent of median income poverty lines shown in Tables 2 and 3, respectively. They show the estimated annual poverty lines and the implicit poverty lines derived for each quarter of the year. As noted above, poverty rates are derived by comparing adjusted quarterly reported incomes with the median of the adjusted incomes across all four quarters.
Tables 2 and 3 indicate that the variation across the quarters in the poverty lines is now greatly reduced compared to that shown for the quarterly medians shown in Table 1. This implies that the method used to adjust the incomes reported in each quarter removes most of the variability across the year, without affecting the trend growth in income through the year.
The Henderson poverty lines for 2003-04 are shown in Tables 4 and 5. Those in Table 4 assume that the head is in the workforce, while those in Table 5 assume that the head is not in the workforce. In both cases, the poverty lines include housing costs – so that the poverty estimates presented later are expressed on a ‘before housing costs’ basis.16
Table 6 compares the two median income poverty lines with the Henderson poverty line for the September Quarter 2003. The ratios shown in the final two columns vary across the family types because of differences in the two equivalence scales (compared with the OECD scale, the Henderson scale assigns greater weight to the needs of children relative to adults, and to spouses relative to heads of family).
These comparisons indicate that the 50 per cent median income line is between 7 per cent and 17 per cent below the Henderson line, with the difference larger for sole parent families than for couple families. In contrast, the 60 per cent median line is between one per cent below and 11 per cent above the Henderson line, with the (positive) gap now larger for couple families than for sole parents. In overall terms, if the Henderson line were expressed as a percentage of median income in the September quarter of 2003, it would fall between 55 per cent and 60 per cent of median income.17
Poverty lines for 2005-06 based on median income derived from the SIH for that year and the corresponding SIH-based poverty lines for 2003-04 are presented in Tables B16 to B.19 of Appendix B. The lines for 2003-04 differ slightly from those shown for this year in Tables 2 and 3 because of differences in the coverage of the HES and SIH samples in that year (see Section 6 for a fuller explanation). The differences are not large: for example, the (annual) 50 per cent of median income poverty line in 2003-04 for a couple with two children based on the HES sample for that year is $522.3 (Table 2), whereas the SIH-based poverty line is $517.3 (Table B.16).
16 The simplified Henderson equivalence points differ according to the workforce status of both the
head and spouse in the family. The poverty estimates presented later apply the relevant poverty line according to the workforce status of the head (and spouse) in the family
17 This relativity changes over time because of differences in the movements of median income and household disposable income per capita.

POVERTY IN AUSTRALIA
18
Table 2: Poverty Lines by Family Type in 2003-04: 50 per cent of Median Equivalised Disposable Income, modified OECD Equivalence Scale ($ per week)
Family type
Annual (2003-04)
September quarter
December quarter
March quarter
June quarter
Lone person 248.7 246.4 247.6 249.8 251.1 Couple only 373.1 369.6 371.4 374.8 376.6 Couple with one child 447.7 443.5 445.6 449.7 451.9 Couple with two children 522.3 517.4 519.9 524.6 527.2 Couple with three children 596.9 591.3 594.2 599.6 602.5 Couple with four children 671.5 665.2 668.5 674.5 677.8 Lone parent with one child 323.3 320.3 321.9 324.8 326.4 Lone parent with two children 397.9 394.2 396.1 399.7 401.7 Lone parent with three children 472.6 468.1 470.4 474.7 477.0 Lone parent with four children 547.2 542.0 544.7 549.6 552.3 Poverty line for quarter as a proportion of the annual poverty line
99.1
99.6
100.5
100.9
Note: Poverty lines assume that all children are aged under 15 years. Source: ABS Household Expenditure Survey 2003-04, CURF.

POVERTY IN AUSTRALIA
19
Table 3: Poverty Lines by Family Type in 2003-04: 60 per cent of Median Equivalised Disposable Income, modified OECD Equivalence Scale ($ per week)
Family type
Annual (2003-04)
September quarter
December quarter
March quarter
June quarter
Lone person 298.5 295.6 297.1 299.8 301.3 Couple only 447.7 443.5 445.7 449.7 451.9 Couple with one child 537.2 532.2 534.8 539.6 542.3 Couple with two children 626.8 620.8 623.9 629.6 632.7 Couple with three children 716.3 709.5 713.0 719.5 723.0 Couple with four children 805.8 798.2 802.2 809.5 813.4 Lone parent with one child 388.0 384.3 386.2 389.7 391.6 Lone parent with two children 477.5 473.0 475.4 479.7 482.0 Lone parent with three children 567.1 561.7 564.5 569.6 572.4 Lone parent with four children 656.6 650.4 653.6 659.6 662.8 Poverty line for quarter as a proportion of the annual poverty line
99.1
99.6
100.5
100.9
Note: Poverty lines assume that all children are aged under 15 years. Source: ABS Household Expenditure Survey 2003-04, CURF.

POVERTY IN AUSTRALIA
20
Table 4: Henderson Poverty Lines by Family Type in 2003-04: Head in the Workforce ($ per week) Family Type September
quarter December
quarter March quarter
June quarter
Lone person 298.1
302.5
304.3
313.0
Couple only 398.8
404.6
407.1
418.8
Couple with one child 479.4
486.4
489.3
503.4 Couple with two children 560.0
568.1
571.6
588.0 Couple with three children 640.6
649.9
653.8
672.6 Couple with four children 721.2
731.6
736.0
757.2 Lone parent with one child 382.8
388.3
390.7
401.9 Lone parent with two children
463.3
470.0
472.8
486.4 Lone parent with three children
543.9
551.8
555.1
571.1 Lone parent with four children
624.5
633.5
637.3
655.7 Source: Table 1 Poverty Lines: Australia September 2003, December 2003, March 2004, and June 2004.

POVERTY IN AUSTRALIA
21
Table 5: Henderson Poverty lines by Family Type in 2003-04: Head Not in the Workforce ($ per week)
Family type
September quarter
December quarter
March quarter
June quarter
Lone person
241.8
245.3
246.7
253.8
Couple only 342.4
347.4
349.5
359.5 Couple with one child 423.0
429.2
431.8
444.2 Couple with two children 503.6
510.9
514.0
528.8 Couple with three children 584.2
592.7
596.2
613.4 Couple with four children 664.8
674.4
678.5
698.0 Lone parent with one child 326.3
331.0
333.0
342.6 Lone parent with two children
406.9
412.8
415.3
427.2 Lone parent with three children
487.5
494.5
497.5
511.8 Lone parent with four children
568.1
576.3
579.8
596.5 Source: Table 1 Poverty Lines: Australia September 2003, December 2003, March 2004, and June 2004.

POVERTY IN AUSTRALIA
22
Table 6: Comparison of the Median Income and Henderson Poverty Lines in the September Quarter 2003 ($ per week)
Family Type
50 per cent of median income
(a)
60 per cent of median income
(b)
Henderson
(c)
Ratio
(a)/(c)
Ratio (b)/(c)
Lone person 246.4 295.6 298.1
0.83
0.99
Couple only 369.6 443.5 398.8
0.93
1.11
Couple with one child 443.5 532.2 479.4
0.93
1.11 Couple with two children 517.4 620.8 560.0
0.92
1.11 Couple with three children
591.3 709.5 640.6
0.92
1.11 Couple with four children 665.2 798.2 721.2
0.92
1.11 Lone parent with one child
320.3
384.3
382.8
0.84
1.00
Lone parent with two children 394.2
473.0
463.3
0.85
1.02
Lone parent with three children
468.1
561.7
543.9
0.86
1.03
Lone parent with four children
542.0
650.4
624.5
0.87
1.04

POVERTY IN AUSTRALIA
23
4 Results: Poverty in 2003-04
4.1 Benchmark Poverty Estimates Table 7 presents estimated poverty rates derived from the full HES sample, i.e. before the exclusion of any households. The poverty lines used to derive the benchmark poverty rates differ for each household type, as explained earlier. The two median income poverty lines are based on the modified OECD equivalence scale and the quarterly income figures reported in the HES have been updated to reflect consumer price movements throughout the year. The Henderson poverty estimates have been estimated by comparing the (simplified) Henderson equivalised income in each quarter with the poverty lines for that quarter of 2003-04 published by the Melbourne Institute.
Comparing the poverty rates produced by the three poverty lines provides important evidence on the sensitivity issue. What is striking here is the large difference between the rates based on the 50 per cent and 60 per cent median income based lines, the poverty rate more than doubling when the poverty line shifts the extra 10 percentage points up the income distribution. The Henderson poverty line produces an estimate that is just over 2 percentage points higher than that produced by the 50 per cent median income line, but 7.5 percentage points below that produced by the 60 per cent of median poverty line. These findings imply that by 2003-04, the Henderson and the 50 per cent of median income poverty lines were quite close together – unlike in earlier years when the greater distance between them produced very different poverty rates.18
The first and final two rows of Table 7 show the total number of households in the original sample (prior to any being excluded) and the number of adults and children below each of the three poverty lines. The shift in the poverty line from 50 per cent to 60 per cent of median income increases the number of adults below the line by 1.5 million and the number of children by 420,000 – in both cases doubling the estimated numbers in poverty. Clearly, many individuals are living in households whose incomes leave them above the lower poverty line, but not far above it.
The breakdown of the overall poverty rate into its incidence among adults and children (more accurately, among households that contain children) shows no consistent pattern across the three poverty lines. This reflects the income positions of households with and without children in the region around the three poverty lines, combined with the different allowance for the costs of children implied in the two equivalence scales. Whichever poverty line is used, the estimates in Table 7 imply that between one-in-ten and one-in-five Australian children were in poverty in 2003-04, despite the strong economic growth experienced over the previous decade or more.
18 Harding and Szukalska (2000: Tables C5 and C9) estimate that the overall poverty rate in 1999
was 9.6 per cent using the 50 per cent of median income poverty line, but 22.6 per cent using the Henderson poverty line.

POVERTY IN AUSTRALIA
24
Table 7: Benchmark Poverty Rates: No Exclusions, 2003-04 (percentages) 50 per cent of
median income (modified
OECD equivalence scale)
60 per cent of median income
(modified OECD
equivalence scale)
Henderson poverty line
(simplified Henderson
equivalence scale)
Sample size (households) 6,957 6,957 6,957 Poverty rate: individuals 9.9 19.8 12.3 Poverty rate: adults 10.1 19.7 11.8 Poverty rate: children 9.4 20.2 14.4 Adults below poverty line (‘000s) 1,570 3,073 1,837 Children below poverty line (‘000s) 365 786 560 4.2 Excluding Households with Zero or Negative Income and the Self-employed It has long been recognised that the reported incomes of people who are self-employed are different from those of other households because of the ability of the self-employed to reduce their incomes by reporting some of it as business costs or trading losses. Total income from self-employment reported in household income surveys is also well below the amount included in other sources, such as the National Accounts (Siminski et al., 2003). The reliability of the income data reported by households with zero or negative income (some of whom will be self-employed) has also been questioned, and many studies either omit these observations directly, or do so indirectly by removing all outlying observations (i.e. those in the extreme lower and upper tails of the distribution) from the analysis.
Our first set of exclusions thus involves removing households who report zero or negative income, or who are self-employed. Three alternative definitions of self-employed were examined:
1. Those households who report any income (negative or positive) from own unincorporated business (SE1).
2. Those households that contain individuals who report their labour force status as employer, own account worker, contributing family worker or employee paid in kind in their main or second job (SE2).
3. Households who are defined as self-employed on either of the above definitions (SE3).
These definitions were applied to exclude self-employed households separately and in addition to the exclusion of households who report zero or negative income (from any source).
Table 8 shows the numbers of households affected by each exclusion, the impact on median income for the sample as a whole, and the impact on the 50 per cent and 60 per cent of median income poverty rates, calculated before and after the exclusion adjustments.19 The exclusions have been introduced progressively so that the incremental impact of each can be established. The first two columns show the impact
19 Results are not shown for the Henderson poverty line because this poverty line (but not the
resulting poverty rate) is unaffected by the exclusion of households from the sample.

POVERTY IN AUSTRALIA
25
on sample size (the numbers of households affected by each exclusion) and the flow-on impact on median income. Although relatively few households report zero or negative income (less than half of one per cent of all households), between 16.5 per cent and 18.0 per cent (around one-in-six) are affected by the self-employed exclusion (with the upper value corresponding to the broadest definition of self-employed, SE3). Around one-half of the very small number who report zero or negative incomes are affected by the self-employed exclusion. In terms of the numbers affected, it is thus clear that the exclusion of self-employed households is of far greater significance than the exclusion of those who report zero or negative income.
Table 8: Impact on Poverty Rates of Excluding Households with Zero or Negative Incomes and Self-employed Households (percentages)
Number of
persons affected (000s)
Median Income
($)
Poverty rate based on median of whole sample
Poverty rate based on medians adjusted for
the exclusions
50 per cent
median
60 per cent
median
50 per cent
median
60 per cent
median Whole sample 19,506 497.4 9.9 19.8 Number
excluded
Exclude zero and negative income (ZNY)
55 498.4 9.7 19.6 9.9 19.7
Exclude self-employed (SE) definition 1
3,069 488.4 10.3 20.8 9.1 19.7
Exclude SE definition 2 3,211 492.9 9.9 20.3 9.2 19.8 Exclude SE definition 3 3,511 490.4 10.0 20.5 9.0 19.7 Exclude ZNY and SE definition 1
3,100 489.6 10.1 20.6 9.1 19.8
Exclude ZNY and SE definition 2
3,237 493.6 9.7 20.2 9.1 19.7
Exclude ZNY and SE definition 3
3,537 491.1 9.8 20.4 9.0 19.6
The second column of Table 8 shows the impact of the different exclusions on median income. In all cases, the effects are small. The largest impact results from the exclusion of the self-employed on the first definition (SE1), but even here, the effect is to reduce the median from $497.4 to $488.4, or by 1.8 per cent. The fact that the median declines indicates that the majority of the self-employed report incomes that place them in the upper half of the income distribution. When the zero/negative income and self-employed exclusions are applied together, the median in all three cases is larger than when only the zero/negative income exclusion is applied, but in all cases the differences are again very small. This again indicates that those households who satisfy the self-employed definitions tend to lie disproportionately in the upper half of the distribution.
The fact that the estimate of median income is relatively insensitive to the exclusions shown in Table 8 provides a justification for the decision not to adjust the median (and hence the poverty line) after each exclusion rule is applied.20 The estimates in the four 20 This has the added advantage that the median income poverty lines, like the Henderson line,
remain unchanged throughout the analysis.

POVERTY IN AUSTRALIA
26
right-hand side columns of Table 8 indicate how the median income poverty rates change as the different exclusions are introduced.
As can be seen, the overall impact is generally quite low - a reflection of the small changes to median income already described. Adjusting the median causes the poverty rate to change, but generally by less than one percentage point (often by much less). This is true for a given poverty line when comparing the estimates based on different exclusions (i.e. comparing the entries down the columns in Table 8) or when account is taken of the impact of these exclusions on median income and the poverty line (i.e. comparing the entries for a given poverty line across the rows).
To take one example, if the most comprehensive definition of self-employed is applied (SE3), the poverty rate based on the 50 per cent median income poverty line increases from 9.92 per cent to 9.95 per cent (if the median is unchanged), or declines from 9.92 per cent to 9.02 per cent (if the median is varied in line with the self-employed exclusion). Thus, although the exclusion of self-employed households has a numerically large impact on the size of the sample, it has a rather small impact on the estimated half-median income poverty rate.
4.3 Exclusions Based on Expenditure Several studies have utilised information on expenditure rather than income to estimate poverty and other aspects of inequality (Barrett, Crossley and Worswick, 2000; Harding and Greenwell, 2002), while others have utilised information on both income and expenditure to estimate poverty (Saunders, 1997).21 As noted by Saunders and Bradbury (2006: pp. 344-5), the ABS has drawn attention to the balance between income and expenditure as a factor contributing to the reliability of the reported income data. Such concern provides a case for examining the reported data on income and expenditure in combination when deciding what either variable reveals about the underlying standard of living.
The variable used here to explore this issue is the ratio of expenditure to income. Although there are good reasons why households with low incomes may be forced to incur debt in order to meet their needs (and thus have an expenditure to income ratio that exceeds one), where this ratio is very high it raises doubts about the validity of the reported information on income, or on the reliability of income as an indicator of the standard of living of the household.22 One problem with the approach is that it raises questions about ‘how high is too high?’ to which there is no clear-cut answer.
Since it is necessary to set a threshold for the expenditure to income ratio before the exclusion can be applied, the best that can be done is to experiment with alternative expenditure to income ratios and be transparent about the basis on which the final selection has been made.23 In order to achieve this, we examine the distribution of the 21 A recent paper by Headey (2007) combines information on income, consumption expenditure
and wealth too derive a new experimental poverty measure using data from the HILDA survey. 22 There are also legitimate concerns about the sustainability of spending in excess of income for
those households with few other resources on which to draw. However, this observation raises a different set of issues and is not explored further.
23 This inevitably makes the process arbitrary to a degree, and the results presented below should thus be regarded as experimental.

POVERTY IN AUSTRALIA
27
spending to income ratio for all households below the poverty line before deciding where to set the exclusion threshold.
The expenditure variable used in this component of the analysis is weekly expenditure on total goods and services, which includes all items of expenditure except expenditure on income tax, principal repayments on mortgages, superannuation and life insurance. Income tax paid is not included as a component of expenditure because it is excluded from the income concept being used (disposable income). The other excluded expenditures are closer to ‘capital’ spending and are part of savings rather than consumption.24
Tables 9 and 10 show, for the 50 per cent and 60 per cent of median income poverty lines respectively, the distribution of two spending to income ratios among those households below the poverty line after applying two of the benchmark exclusions described in the previous section. The first ratio expresses total expenditure as a ratio of disposable income, while the second expresses equivalised total expenditure as a ratio of the 50 per cent of median income poverty line (which is also, by definition, equivalised).25 The distributions relate only to those households below the relevant poverty line, and the tables show the percentile values of the ratios after households have been ranked by the value of the ratio (so that those at the bottom have the lowest ratio, not the lowest income).
24 No attempt has been made to exclude ‘lumpy’ expenditures on consumer durables and other
major items. This has the effect of excluding some households who have a high expenditure to income ratio because they happened to purchase a large item in the period that the survey was conducted. However, the exclusion is only applied to households with incomes below the poverty line and it could be argued that their low incomes would, if accurately reported, have prevented them from incurring such large expenditures, thus providing a justification for applying the exclusion. Households with incomes above the poverty line who have high spending to income ratios have not been excluded, and remain in the sample. It would be possible in future work to try to separate out those whose high ratios reflect one-off purchases and treat them differently to those households whose high ratios appear to be more permanent.
25 We have used the same (50 per cent of median income) poverty line as the denominator of the ratio for both poverty lines because of its intuitive appeal; by setting the threshold ratio equal to two, this excludes all households below the poverty line with expenditure greater than median (equivalised) income.

POVERTY IN AUSTRALIA
28
Table 9: Expenditure to Income Ratios Based on Different Exclusions and 50 per cent of Median Income Poverty Line
Percentile of people in poor households
Households with negative and zero incomes excluded
Households with negative and zero incomes and self-employed households
(SE3) excluded Unadjusted
expenditure to income ratio
Equivalised expenditure to
poverty line ratio
Unadjusted expenditure to income ratio
Equivalised expenditure to
poverty line ratio 10th 0.7 0.6 0.6 0.6 20th 0.8 0.7 0.8 0.7 30th 1.0 0.8 1.0 0.8 40th 1.2 1.0 1.1 0.9 50th 1.3 1.1 1.2 1.0 60th 1.7 1.3 1.4 1.5 70th 2.1 1.6 1.8 1.4 80th 3.2 2.0 2.5 1.8 90th 5.5 2.6 4.7 2.5 100th 832.3 8.3 832.3 8.3 Sample size 884 782
Table 10: Expenditure to Income Ratios Based on Different Exclusions and 60 per cent of Median Income Poverty Line
Percentile of people in poor households
Households with negative and zero incomes excluded
Households with negative and zero incomes and self-employed households
(SE3) excluded Unadjusted
expenditure to income ratio
Equivalised expenditure to
poverty line ratio
Unadjusted expenditure to income ratio
Equivalised expenditure to
poverty line ratio 10th 0.7 0.6 0.6 0.6 20th 0.8 0.8 0.8 0.7 30th 0.9 0.9 0.9 0.9 40th 1.0 1.0 1.0 1.0 50th 1.2 1.1 1.1 1.1 60th 1.3 1.3 1.3 1.2 70th 1.6 1.5 1.5 1.4 80th 2.0 1.8 1.8 1.7 90th 3.3 2.4 2.8 2.2 100th 832.3 8.3 832.3 8.3 Sample size 1,588 1,418 As can be seen, the first ratio includes a small number of very high values which result from the low level of reported income rather than a high level of total expenditure.26 The second ratio overcomes this problem by expressing expenditure not as a ratio of reported income, but relative to the poverty line for that specific household type.
It is clear that a large proportion of those households with incomes below the poverty line have levels of expenditure that greatly exceed both their reported incomes and the incomes required to reach the poverty line. This finding is not sensitive to whether or not some households are excluded from the sample, or to where the poverty line is set. In some instances, the high ratio may reflect the struggle to make ends meet on an inadequate income. In others, it will reflect one-off expenditures that happened to take
26 The low-income exclusion applied earlier affects only those with negative or zero incomes,
leaving any household with a positive income (no matter how low) still included in the sample.

POVERTY IN AUSTRALIA
29
place in the survey week – if the fridge breaks down, there is no option but to repair or replace it, however much this will damage the household budget.
The results themselves provide no guidance about where to draw the line between those observations that may capture the reality of living on a low income, and those that reflect statistical anomalies in the data. After experimenting with a range of possibilities, we have used the ratio of equivalised expenditure to the 50 per cent of median income poverty line (which by definition incorporates the equivalence adjustment) as the basis for the expenditure exclusion, and set the threshold value of this ratio equal to two. This threshold implies that households who are excluded have incomes below the poverty line and equivalised expenditures that exceed median income. Those households with ratios that exceed this threshold are no longer included among those identified as in poverty.
As can be seen from Table 9 and as illustrated in Figure 1, if the threshold used to exclude households is set where equivalised expenditure exceeds median income (so that the ratio exceeds 2), this results in around one-fifth of households with incomes below the 50 per cent of median income poverty line being excluded. The corresponding exclusion percentage at the higher (60 per cent of median income) poverty line is somewhat lower, but still closer to 20 per cent than 10 per cent. The percentage of households excluded is slightly lower after the two earlier exclusions have been applied.
Figure 1: Cumulative Ratio of Total Expenditure to the Poverty Line (50 per cent of median income)
Table 11 draws together the implications of the three exclusions that have been applied so far: those affecting households with zero or negative income, those that affect self-employed households, and those that affect households below the poverty
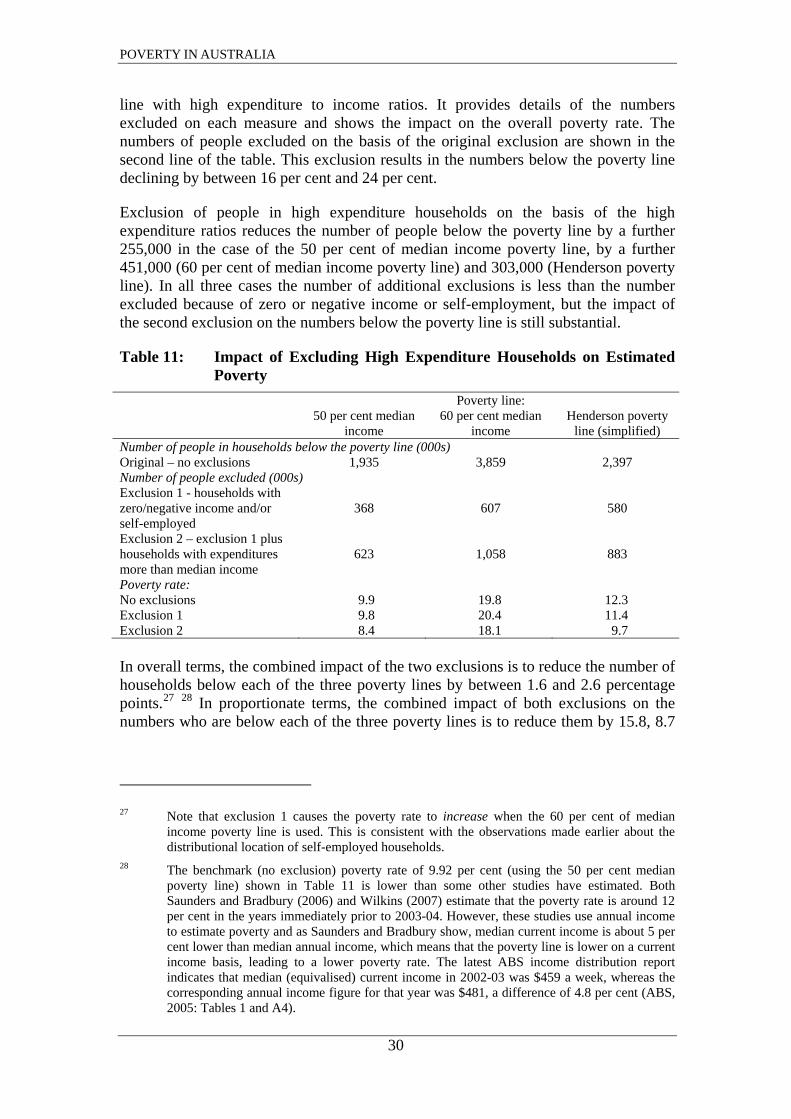
POVERTY IN AUSTRALIA
30
line with high expenditure to income ratios. It provides details of the numbers excluded on each measure and shows the impact on the overall poverty rate. The numbers of people excluded on the basis of the original exclusion are shown in the second line of the table. This exclusion results in the numbers below the poverty line declining by between 16 per cent and 24 per cent.
Exclusion of people in high expenditure households on the basis of the high expenditure ratios reduces the number of people below the poverty line by a further 255,000 in the case of the 50 per cent of median income poverty line, by a further 451,000 (60 per cent of median income poverty line) and 303,000 (Henderson poverty line). In all three cases the number of additional exclusions is less than the number excluded because of zero or negative income or self-employment, but the impact of the second exclusion on the numbers below the poverty line is still substantial.
Table 11: Impact of Excluding High Expenditure Households on Estimated Poverty
Poverty line: 50 per cent median
income 60 per cent median
income Henderson poverty
line (simplified) Number of people in households below the poverty line (000s) Original – no exclusions 1,935 3,859 2,397 Number of people excluded (000s) Exclusion 1 - households with zero/negative income and/or self-employed
368
607
580
Exclusion 2 – exclusion 1 plus households with expenditures more than median income
623
1,058
883
Poverty rate: No exclusions 9.9 19.8 12.3 Exclusion 1 9.8 20.4 11.4 Exclusion 2 8.4 18.1 9.7 In overall terms, the combined impact of the two exclusions is to reduce the number of households below each of the three poverty lines by between 1.6 and 2.6 percentage points.27 28 In proportionate terms, the combined impact of both exclusions on the numbers who are below each of the three poverty lines is to reduce them by 15.8, 8.7
27 Note that exclusion 1 causes the poverty rate to increase when the 60 per cent of median
income poverty line is used. This is consistent with the observations made earlier about the distributional location of self-employed households.
28 The benchmark (no exclusion) poverty rate of 9.92 per cent (using the 50 per cent median poverty line) shown in Table 11 is lower than some other studies have estimated. Both Saunders and Bradbury (2006) and Wilkins (2007) estimate that the poverty rate is around 12 per cent in the years immediately prior to 2003-04. However, these studies use annual income to estimate poverty and as Saunders and Bradbury show, median current income is about 5 per cent lower than median annual income, which means that the poverty line is lower on a current income basis, leading to a lower poverty rate. The latest ABS income distribution report indicates that median (equivalised) current income in 2002-03 was $459 a week, whereas the corresponding annual income figure for that year was $481, a difference of 4.8 per cent (ABS, 2005: Tables 1 and A4).
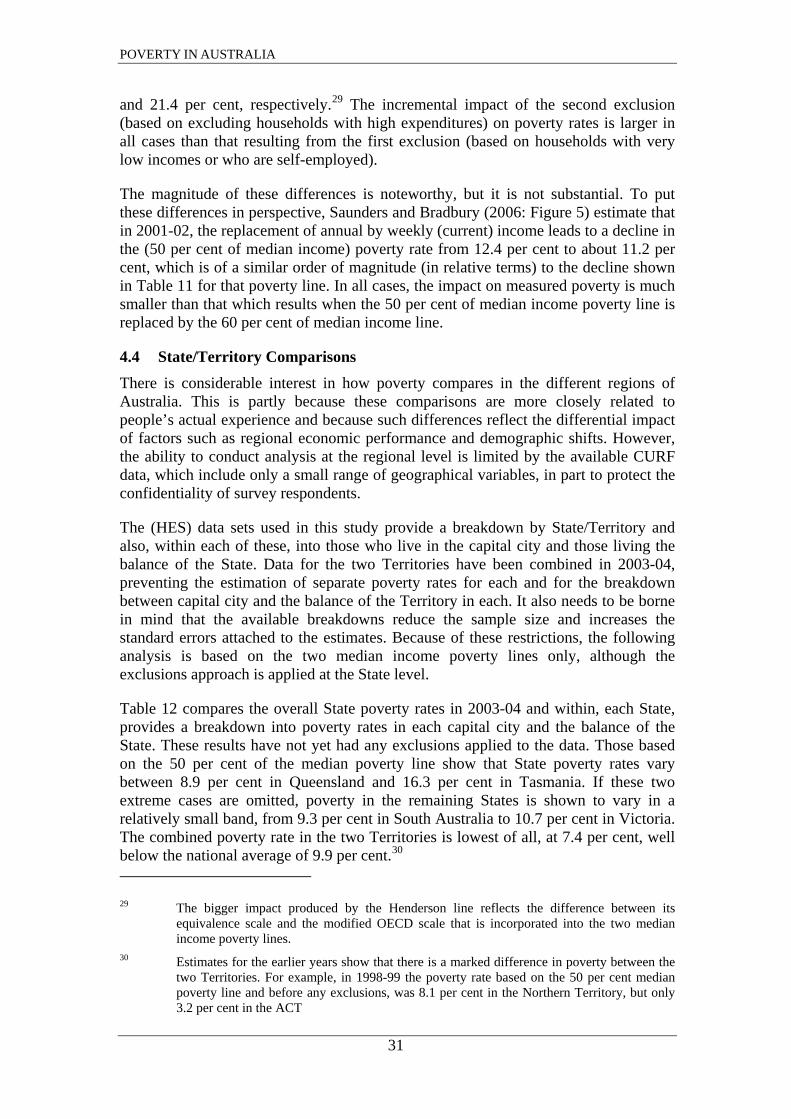
POVERTY IN AUSTRALIA
31
and 21.4 per cent, respectively.29 The incremental impact of the second exclusion (based on excluding households with high expenditures) on poverty rates is larger in all cases than that resulting from the first exclusion (based on households with very low incomes or who are self-employed).
The magnitude of these differences is noteworthy, but it is not substantial. To put these differences in perspective, Saunders and Bradbury (2006: Figure 5) estimate that in 2001-02, the replacement of annual by weekly (current) income leads to a decline in the (50 per cent of median income) poverty rate from 12.4 per cent to about 11.2 per cent, which is of a similar order of magnitude (in relative terms) to the decline shown in Table 11 for that poverty line. In all cases, the impact on measured poverty is much smaller than that which results when the 50 per cent of median income poverty line is replaced by the 60 per cent of median income line.
4.4 State/Territory Comparisons There is considerable interest in how poverty compares in the different regions of Australia. This is partly because these comparisons are more closely related to people’s actual experience and because such differences reflect the differential impact of factors such as regional economic performance and demographic shifts. However, the ability to conduct analysis at the regional level is limited by the available CURF data, which include only a small range of geographical variables, in part to protect the confidentiality of survey respondents.
The (HES) data sets used in this study provide a breakdown by State/Territory and also, within each of these, into those who live in the capital city and those living the balance of the State. Data for the two Territories have been combined in 2003-04, preventing the estimation of separate poverty rates for each and for the breakdown between capital city and the balance of the Territory in each. It also needs to be borne in mind that the available breakdowns reduce the sample size and increases the standard errors attached to the estimates. Because of these restrictions, the following analysis is based on the two median income poverty lines only, although the exclusions approach is applied at the State level.
Table 12 compares the overall State poverty rates in 2003-04 and within, each State, provides a breakdown into poverty rates in each capital city and the balance of the State. These results have not yet had any exclusions applied to the data. Those based on the 50 per cent of the median poverty line show that State poverty rates vary between 8.9 per cent in Queensland and 16.3 per cent in Tasmania. If these two extreme cases are omitted, poverty in the remaining States is shown to vary in a relatively small band, from 9.3 per cent in South Australia to 10.7 per cent in Victoria. The combined poverty rate in the two Territories is lowest of all, at 7.4 per cent, well below the national average of 9.9 per cent.30 29 The bigger impact produced by the Henderson line reflects the difference between its
equivalence scale and the modified OECD scale that is incorporated into the two median income poverty lines.
30 Estimates for the earlier years show that there is a marked difference in poverty between the two Territories. For example, in 1998-99 the poverty rate based on the 50 per cent median poverty line and before any exclusions, was 8.1 per cent in the Northern Territory, but only 3.2 per cent in the ACT

POVERTY IN AUSTRALIA
32
A similar pattern of difference emerges when the higher (60 per cent of the median) poverty line is used, except that the relative poverty rates in Victoria and Western Australia now improve, while those in Queensland and South Australia deteriorate. These shifts in the rankings probably reflect differences in the composition of the population in each State, including the percentage that is receiving an age pension or other form of Centrelink payment.
Table 12: Poverty Rates by State and Territory in 2003-04 Using Alternative Poverty Lines, No Exclusions (percentages)
50% of median 60% of median Capital
city Balance of State
Total Capital city
Balance of State
Total
New South Wales 7.7 13.4 9.9 14.8 28.2 19.9 Victoria 10.2 11.9 10.7 17.6 22.0 18.8 Queensland 9.9 8.0 8.9 20.6 21.7 21.2 South Australia 8.2 12.1 9.3 18.3 25.6 20.2 Western Australia 10.3 8.8 9.9 18.1 20.6 18.8 Tasmania 9.7 21.0 16.3 18.0 35.4 28.1 NT/ACT NA NA 7.4 NA NA 11.4 Total 9.1 11.5 9.9 17.2 24.8 19.8 Note: NA = not available Table 12 also shows that there are marked differences in the 50 per cent of median poverty rates in the State capitals, where Sydney has the lowest rate (7.7 per cent) and Perth the highest (10.3 per cent). Poverty in Sydney is also the lowest among State capitals when the higher poverty line is used, although Brisbane is now highest, at 20.6 per cent – almost 6 percentage points above that in Sydney.
When the lower poverty line is used, poverty is higher outside of the capital city than within it in four States (New South Wales, Victoria, South Australia and Tasmania), with the difference particularly large in the two smaller States. In contrast, poverty is lower outside of the capital cities of Queensland and Western Australia than within Brisbane and Perth, respectively – presumably a reflection of the strong agricultural and mining sectors in these two States. When the higher poverty line is used, poverty is always lower in the capital city than in the balance of the State, with the difference particularly large in New South Wales, South Australia and Tasmania.
Tables 13 and 14 show how these patterns are affected when the two exclusion adjustments described earlier are applied to the State-level data. The estimates indicate that most of the broad patterns described above are unchanged when the two exclusions are applied to the underlying data.

POVERTY IN AUSTRALIA
33
Table 13: Poverty Rates by State in 2003-04 based on the 50 per cent Median Income Poverty Line, By Exclusion Category (percentages)
No Exclusions Exclusions 1 Exclusions 2 Capital
city Balance of state
Capital city
Balance of state
Capital city
Balance of state
New South Wales 7.7 13.4 7.8 13.4 6.0 11.7 Victoria 10.2 11.9 9.8 10.4 8.0 8.7 Queensland 9.9 8.0 10.2 8.7 9.1 7.7 South Australia 8.2 12.1 8.4 10.7 7.9 10.2 Western Australia 10.3 8.8 10.1 9.4 8.4 7.5 Tasmania 9.7 21.0 10.7 20.3 8.1 19.6 Total 9.1 11.5 9.1 11.3 7.5 9.9 Table 14: Poverty Rates by State in 2003-04 based on the 60 per cent
Median Income Poverty Line, By Exclusion Category (percentages)
No Exclusions Exclusions 1 Exclusions 2 Capital
city Balance of state
Capital city
Balance of state
Capital city
Balance of state
New South Wales 14.8 28.2 15.9 29.3 13.3 26.6 Victoria 17.6 22.0 17.9 21.2 15.5 18.3 Queensland 20.6 21.7 21.4 23.1 19.0 21.8 South Australia 18.3 25.6 18.8 26.1 18.0 24.9 Western Australia 18.1 20.6 17.6 23.5 15.0 18.9 Tasmania 18.0 35.4 18.9 36.8 16.4 34.3 Total 17.2 24.8 17.8 25.7 15.5 23.3

POVERTY IN AUSTRALIA
34
5 Medium-Term Trends in Poverty, 1993-94 to 2003-04
This section applies the same exclusion methodology described in the previous section to data from the last three HES surveys (undertaken in 1993-94, 1998-99 and 2003-04). The goal is to examine trends in poverty rates over time and the extent to which they are influenced by the different exclusions made to the sample used to estimate poverty in each year. Attention focuses on changes in overall poverty rates, although it is possible to extend the analysis to the more detailed estimates presented in Appendix A. As noted earlier, we have focused on the two median income poverty lines because of concern about the ability of the Henderson Poverty line methodology to properly take account of changing household composition over this period (see Wilkins, 2007).31
5.1 Overall Trends Thus, in the following analysis, the exclusions that affect households below the poverty line with zero or negative reported incomes, are self-employed, and who have equivalised expenditure greater than median income (as shown in Table 10 for 2003-04) are applied consistently to all three years for which the HES data are available. In interpreting these results, it is important to note that no account has been taken of changes in the three surveys themselves that may have affected the definition and reliability of some of the variables included in the trend analysis.32 By way of comparison, the (CPI-adjusted through the year) values for equivalised median income in the two earlier years are $299.7 (in 1993-94) and $367.8 (in 1998-99). The corresponding median in 2003-04 is equal to $497.4.
When these procedures are applied to the earlier data, they produce the results shown in Tables 15 and 16 for 1993-94 and 1998-99, respectively, while the overall poverty trends are summarised in Table 17. In both years, and using both poverty rates, the first exclusion has a bigger impact on the numbers in poverty than the second (in isolation, although this may reflect the order in which they have been applied (since some of those excluded by the second exclusion may have already been affected by the first). The relative impact of both exclusions at the higher poverty line is also smaller in both years. Finally, the relative impact of all four exclusions has declined over time (possibly reflecting changes in the conduct of the surveys), which implies that the different exclusion approaches will have implications for the identified trends in poverty.
31 Overall poverty rates in each year based on a poverty line set at 50 per cent of mean income
are presented in footnote 5. 32 One example where definitions have changed concerns the definition used to identify self-
employed households, which was changed in the latest (2003-04) survey. We have used the new definition for the latest year, even though this implies that there is a break in continuity with data for the earlier years. The identification of households with zero or negative income in 1993-94 and 1998-99 was based on reported values for total weekly household gross income from all sources minus weekly household direct taxes, including the income of any children. The definition of self-employed covers those households who either report any income from own business of self-employment, or that have any person in the household who reports their labour force status as self-employed. These definitional changes are unlikely to have a marked impact on the results.

POVERTY IN AUSTRALIA
35
In terms of the impact of the different exclusions on poverty rates in the two earlier years, exclusion 1 has a larger effect than in 2003-04, while the impact of exclusion 2 is similar. Thus, for example, using the 60 per cent of median income poverty line, exclusion 1 reduced the poverty rate by 1.2 percentage points in 1993-94 but had little impact after that. In contrast, the incremental poverty rate impact of exclusion 2 (the exclusion of high-expenditure households below the poverty line) remained constant throughout the period at a reduction of around 2.4 percentage points in the poverty rate. This change may reflect efforts made by ABS in recent years to improve the quality of the data collected (combined with the changed definition of self-employment in the 2003-04 survey).
The estimated poverty rates and the implied trend shown in Table 17 are consistent with the findings from recent studies. Thus, Saunders and Bradbury (2006: Figure 5) show the 50 per cent of median income poverty rate increasing between 1993-94 and 1998-99 from 7.5 per cent to 9.0 per cent – close to the ‘no exclusions’ estimates shown in Table 17. The pattern of estimates produced by Wilkins (2007: Figure 1) is also similar to those shown in Table 17. However, his estimates are uniformly higher, in part because his are based on annual income and also because his study uses income survey rather than HES data.
Table 15: The Impact of Exclusions on Sample Sizes and Estimated Poverty Rates in 1993-94
Poverty line 50 per cent median
income 60 per cent median
income
Number of persons (‘000) in households below the poverty line (weighted) Original – no exclusions 1,326 2,958 Number of persons (‘000) in households excluded (weighted; progressive totals): Exclusion 1 - households with zero/negative income and/or self-employed
594
774
Exclusion 2 – exclusion 1 plus households with equivalised expenditure more than median income
771
1,152
Poverty rate: No exclusions 7.6 17.1 Exclusions 1 5.3 15.9 Exclusions 2 4.1 13.5

POVERTY IN AUSTRALIA
36
Table 16: The Impact of Exclusions on Estimated Poverty Rates in 1998-99 (percentages)
Poverty line: 50 per cent median
income 60 per cent median
income
Number of persons (‘000) in households below the poverty line (weighted) Original – no exclusions 1,574 3,294 Number of persons (‘000) in households excluded (weighted; progressive totals): Exclusion 1 - households with zero/negative income and/or self-employed
501
654
Exclusion 2 – exclusion 1 plus households with equivalised expenditure more than median income
698
1,064
Poverty rate: No exclusions 8.6 18.0 Exclusions 1 7.2 17.7 Exclusions 2 6.0 15.4 In terms of the overall trend over time, Table 17 shows that the pattern is robust with respect to the alternative median income poverty lines and to the different exclusion methods. Both of the poverty lines show a very similar increase in poverty over the period, the overall rate rising by between 2.3 (no exclusions) and 4.5 (exclusions 1 or 2) percentage points, with the increase accelerating after 1998-99.33
Table 17: Estimated Poverty Trends Based on Different Exclusion Methods and Different Poverty Lines (percentages)
1993-94 1998-99 2003-04 No exclusions 50 per cent median 7.6 8.6 9.9 60 per cent median 17.1 18.0 19.8 Exclusion 1 50 per cent median 5.3 7.2 9.8 60 per cent median 15.9 17.7 20.4 Exclusion 2 50 per cent median 4.1 6.0 8.4 60 per cent median 13.5 15.4 18.1 5.2 Adult and Child Poverty Trends
Table 18 provides a breakdown of the aggregate trends shown in Table 17 into adult and child poverty rates, while Table 19 shows the absolute numbers living below the poverty line in each case.
33 These findings are also consistent with Wilkins’ estimates.

POVERTY IN AUSTRALIA
37
Table 18: Adult and Child Poverty Rate Trends Based on Different Poverty Lines and Exclusion Categories (percentages)
1993-94 1998-99 2003-04 No exclusions: 50 per cent median Adults 7.0 8.4 10.1 Children 10.1 9.2 9.4 Persons 7.6 8.6 9.9 No exclusions: 60 per cent median Adults 15.8 17.8 19.7 Children 21.5 18.6 20.2 Persons 17.1 18.0 19.8 Exclusion 1: 50 per cent median Adults 4.9 7.1 10.0 Children 6.8 7.5 9.1 Persons 5.3 7.2 9.8 Exclusion 1: 60 per cent median Adults 15.0 17.7 20.4 Children 19.4 17.8 20.4 Persons 15.9 17.7 20.4 Exclusion 2: 50 per cent median Adults 3.6 5.8 8.4 Children 5.8 6.6 8.1 Persons 4.1 6.0 8.4 Exclusion 2: 60 per cent median Adults 12.4 15.3 18.0 Children 17.6 15.8 18.4 Persons 13.5 15.4 18.1 At the lower poverty line, adult poverty increased continuously over the period, rising by over 3 percentage points to exceed 10 per cent by 2003-04. In contrast, the child poverty rate fell between 1993-94 and 1998-99 but increased very slightly after that. On this basis, more than 1.9 million individuals were living below the poverty line in 2003-04, consisting of 1.6 million adults and 365 thousand children (Table 19). Although the higher poverty line produces higher poverty rates, the patterns of change over the period remain unaffected. On this basis, over 3.8 million Australians were in poverty in 2003-04, consisting of just over 3 million adults and 785 thousand children.
When the first exclusion adjustment is applied to the data, the increase in adult poverty over the decade to 2003-04 becomes more pronounced (more than doubling, from 4.9 per cent to 10 per cent at the lower poverty line) and child poverty is shown to increase consistently (though not at the higher poverty line, where a decline up to 1998-99 is again evident). These differences are further highlighted when the second exclusion adjusted is applied.
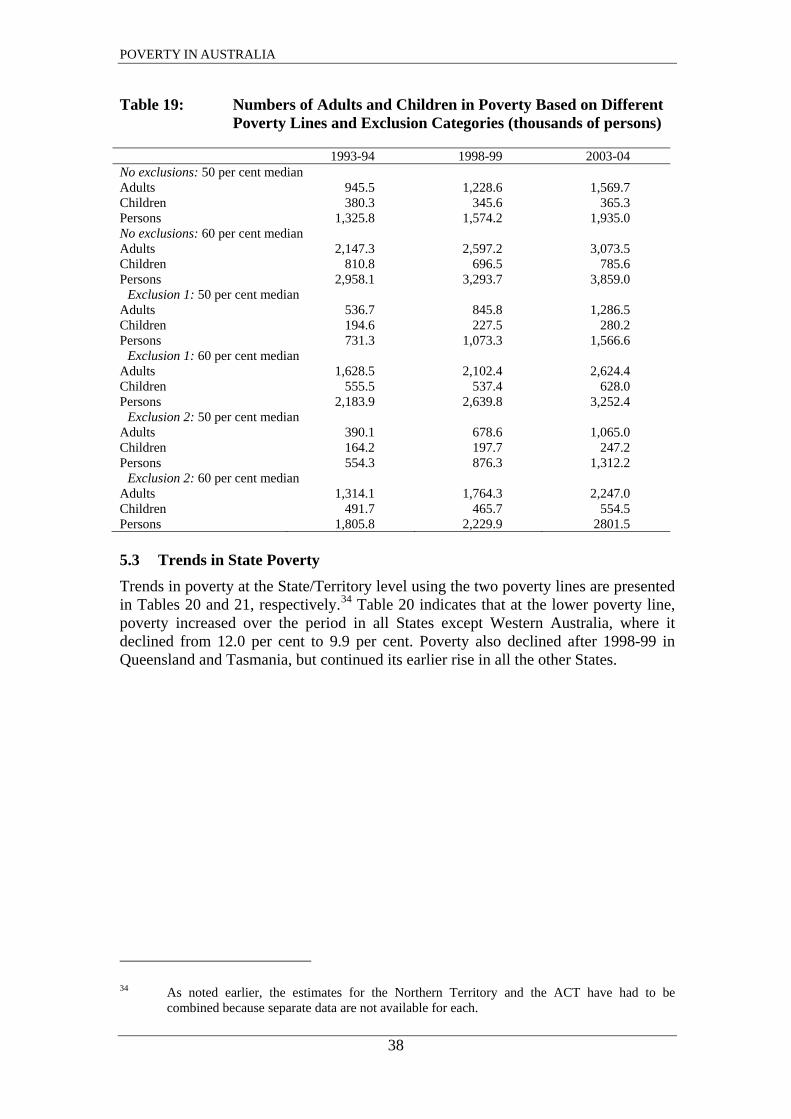
POVERTY IN AUSTRALIA
38
Table 19: Numbers of Adults and Children in Poverty Based on Different Poverty Lines and Exclusion Categories (thousands of persons)
1993-94 1998-99 2003-04 No exclusions: 50 per cent median Adults 945.5 1,228.6 1,569.7 Children 380.3 345.6 365.3 Persons 1,325.8 1,574.2 1,935.0 No exclusions: 60 per cent median Adults 2,147.3 2,597.2 3,073.5 Children 810.8 696.5 785.6 Persons 2,958.1 3,293.7 3,859.0
Exclusion 1: 50 per cent median Adults 536.7 845.8 1,286.5 Children 194.6 227.5 280.2 Persons 731.3 1,073.3 1,566.6
Exclusion 1: 60 per cent median Adults 1,628.5 2,102.4 2,624.4 Children 555.5 537.4 628.0 Persons 2,183.9 2,639.8 3,252.4
Exclusion 2: 50 per cent median Adults 390.1 678.6 1,065.0 Children 164.2 197.7 247.2 Persons 554.3 876.3 1,312.2
Exclusion 2: 60 per cent median Adults 1,314.1 1,764.3 2,247.0 Children 491.7 465.7 554.5 Persons 1,805.8 2,229.9 2801.5 5.3 Trends in State Poverty Trends in poverty at the State/Territory level using the two poverty lines are presented in Tables 20 and 21, respectively.34 Table 20 indicates that at the lower poverty line, poverty increased over the period in all States except Western Australia, where it declined from 12.0 per cent to 9.9 per cent. Poverty also declined after 1998-99 in Queensland and Tasmania, but continued its earlier rise in all the other States.
34 As noted earlier, the estimates for the Northern Territory and the ACT have had to be
combined because separate data are not available for each.

POVERTY IN AUSTRALIA
39
Table 20: Trends in State/Territory Poverty Rates based on the 50 per cent Median Poverty Line, by Exclusion Category (percentages)
1993-94 1998-99 2003-04 No exclusions: New South Wales 7.5 8.7 9.9 Victoria 7.7 7.1 10.7 Queensland 6.2 9.7 8.9 South Australia 6.7 8.2 9.3 Western Australia 12.0 9.4 9.9 Tasmania 9.2 16.8 16.3 Northern Territory/ACT 3.7 4.6 7.4 Total 7.6 8.6 9.9 Exclusion 1: New South Wales 5.7 7.4 9.9 Victoria 5.2 5.9 9.9 Queensland 3.8 7.6 9.4 South Australia 4.8 6.1 8.9 Western Australia 7.7 8.6 10.0 Tasmania 7.1 14.6 16.1 Northern Territory/ACT 2.7 4.7 7.5 Total 5.3 7.2 9.8 Exclusion 2: New South Wales 4.4 6.2 8.1 Victoria 4.3 5.2 8.2 Queensland 2.5 5.7 8.4 South Australia 4.5 5.2 8.4 Western Australia 5.6 6.5 8.2 Tasmania 3.6 14.5 14.7 Northern Territory/ACT 2.0 4.4 6.8 Total 4.1 6.0 8.4
After making the two exclusion adjustments, poverty is shown to increase all in States over the period, often by a considerable extent, with the increase tending to be larger after the more extensive Exclusion 2 adjustment. After the exclusion adjustments, the rise in poverty accelerates after 1998-99. These inter-State differences in poverty trends are robust with respect to where the poverty line is set, the patterns shown in Table 21 being broadly similar to those in Table 20. The main differences are in South Australia, where poverty no longer continues to rise after 1998-99, and Western Australia, where the rise slows after 1998-99. The rise in poverty in the Territories is also much slower when the higher poverty line is used.

POVERTY IN AUSTRALIA
40
Table 21: Trends in State/Territory Poverty Rates based on the 60 per cent Median Poverty Line, by Exclusion Category (percentages)
1993-94 1998-99 2003-04 No exclusions: New South Wales 17.1 18.1 19.9 Victoria 17.1 15.0 18.8 Queensland 15.5 19.5 21.2 South Australia 16.7 21.8 20.2 Western Australia 19.9 18.3 18.8 Tasmania 22.5 27.0 28.1 Northern Territory/ACT 11.4 11.6 11.4 Total 17.1 18.0 19.8 Exclusion 1: New South Wales 16.3 18.1 20.9 Victoria 15.3 14.6 18.7 Queensland 14.7 19.0 22.3 South Australia 15.5 21.6 20.6 Western Australia 18.0 18.2 19.2 Tasmania 22.1 27.1 29.0 Northern Territory/ACT 11.0 11.6 11.2 Total 15.9 17.7 20.4 Exclusion 2: New South Wales 14.3 15.7 18.2 Victoria 12.7 12.8 16.2 Queensland 12.3 16.0 20.5 South Australia 14.5 19.8 19.6 Western Australia 14.7 15.3 16.0 Tasmania 17.4 24.7 26.5 Northern Territory/ACT 7.9 10.3 10.3 Total 13.5 15.4 18.1
5.4 Summary These results provide a valuable summary of the main findings that emerge from the analysis. At both poverty lines and across all three years, the exclusion of households on the basis of information other than income results in an overall decline in the estimated poverty rate. However, the extent and timing of this decline, how it varies between the different States, and how it impacts upon adults and children are all dependent on which poverty line is used and which exclusion adjustments are applied to the data.
In 2003-04, for example, the exclusion of households who report zero or negative income or who are self-employed causes the overall poverty rate to fall by about one percentage point, while the further exclusion of those with low-income who report high expenditure reduces it by an additional one and a half percentage points. In 1993-94, the first exclusion causes the poverty rate to fall by over 2 percentage points, while the latter exclusion results in a further fall of less than one percentage point. These variations mean that conclusions about changes in poverty over time depend upon which exclusions are applied to the data: both exclusions examined here cause the poverty rate to fall in each year, but they also cause the change in poverty between successive surveys to rise – this latter effect being particularly strong over the most recent period.

POVERTY IN AUSTRALIA
41
Another striking feature of the results is that the estimated poverty rates are no more sensitive to the treatment of exclusions when the higher (60 per cent of median income) poverty line is used than when poverty is measured against the 50 per cent of median income benchmark. Thus, the exclusion results themselves provide no basis for choosing between these alternative poverty lines: this is an issue that must be determined on the basis of other criteria.
Above all, the exclusions approach does not provide the basis for any complacency about the extent of poverty in Australia. Even after excluding those households about whom greatest concern has been expressed about the reliability of the incomes they report in the surveys used to estimate poverty, around one-in-twelve adults and a similar proportion of children had incomes of less then half of the median, while approaching one-in-five of both groups had incomes below 60 per cent of the median. On this measure, adult poverty increased by between 4 and 6 percentage points over the decade to 2003-04, whereas the child poverty rate rose less much less, by between slightly below one and just over 2 percentage points.
State poverty rates varied in 2003-04 between 8.9 per cent (in Queensland) and 16.3 per cent (in Tasmania) using the lower poverty line and before any exclusions. The rate of increase of State poverty also varied over the decade to 2003-04, from a decline of over 2 percentage points in Western Australia to an increase of over 7 percentage points in Tasmania. Many of the State poverty trend comparisons are unaffected by where the poverty line is set, and by the exclusions applied to the data, although some are more sensitive, particularly to where the poverty lines is set. Because of these variations, it is difficult to make broad generalisations about relative State performance.
Overall, the analysis reveals that income poverty is not a statistical artefact that results from reporting errors or other anomalies in the data, but remains an issue that affects the lives of many Australians.

POVERTY IN AUSTRALIA
42
6 Recent Changes in Poverty: 2003-04 to 2005-06
6.1 Data Issues The results presented so far have been derived from household-level (unit record) data from the 2003-04 Household Expenditure Survey (HES), which was conducted in conjunction with the Survey of Income and Housing (SIH) in that year. A sub-set of the households who participated in the SIH were recruited to take part in the HES and it is this sub-set that has formed the basis of the analysis because information is available on both the incomes and expenditures of these households, allowing exclusion category 2 to be applied to the data.35 Since that analysis was undertaken, the ABS has released unit record data from the latest SIH, conducted in 2005-06, and this section reviews trends in poverty in the two-year period between 2003-04 and 2005-06.
In order to produce consistent findings for both years, it is necessary to use the SIH for 2003-04 rather than the HES sub-sample for that year. In terms of the coverage of the two surveys, information released by ABS (2006a) indicates that 9,753 households were approached for inclusion in both the HES and the SIH, while 4,792 households were only asked to participate in the SIH. The final samples contain 7,328 households (HES and SIH) and an additional 4,033 households (SIH only). The response rate for the former sample (71 per cent) is well below that of the SIH only sample (84 per cent) (ABS, 2006a, Table 2.2.1), where the difference presumably reflects the more onerous requirements of the lengthier HES questionnaire.
The first stage in estimating the change in poverty between 2003-04 and 2005-06 involves repeating the analysis conducted earlier using the full SIH sample for 2003-04.36 Other than this, the methods used are identical to those described earlier to produce the ‘No exclusions’ poverty estimates. However, because the SIH sample is larger than the HES sample, the median income changes slightly and this in turn affects the two poverty lines. The difference is not great. The value of median equivalised weekly household income (CPI-adjusted as explained earlier) declines slightly, from $497.4 based on the HES for 2003-04 to $492.6 based on the SIH for that year.
Table 22 provides an overview of the changes in poverty between 2003-04 and 2005-06 using the SIH data for both years and also includes, for the purposes of comparison, the HES-based estimates for the earlier year.37 Comparisons between the first two columns show the impact of switching from the HES to the larger SIH sample in 2003-04. This causes the poverty estimates to decline slightly (because of the lower median income, and hence poverty lines) but the changes are not large enough to be of concern (although at the higher poverty line they illustrate how
35 In principle, exclusion 1 can be applied to either the SIH or HES samples, but the latter has
been used for consistency. The results presented in Appendix D on poverty and wealth and Appendix E on poverty and financial stress are also based on the HES sub-sample.
36 This component of the analysis focuses on the ‘no exclusions’ estimates because most of the exclusions applied elsewhere in the report cannot be applied to the 2005-06 data (or to the SIH version of the 2003-04 data). It is also based only on the two median income poverty lines.
37 More detailed breakdowns of those in poverty in 2005-06 are provided in Appendix B.

POVERTY IN AUSTRALIA
43
sensitive the poverty rates can sometimes be to small variations in the poverty line at points in the income distribution where many households are closely bunched together).
Table 22: Overall Poverty Rates and Numbers in 2003-04 and 2005-06, No Exclusions
2003-04 (HES) 2003-04 (SIH) 2005-06 (SIH) Poverty rates (percentages): 50 per cent median poverty line Adults 10.1 10.0 11.3 Children 9.4 8.9 10.7 Persons 9.9 9.8 11.1 60 per cent median poverty line Adults 19.7 19.4 19.4 Children 20.2 18.8 19.5 Persons 19.8 19.3 19.4 Numbers below poverty line (thousands): 50 per cent median poverty line Adults 1,569.7 1,564.9 1,798.0 Children 365.3 347.2 411.6 Persons 1,935.0 1,912.1 2,209.6 60 per cent median poverty line Adults 3,073.5 3,027.1 3,103.4 Children 785.6 734.4 753.7 Persons 3,859.0 3,761.5 3,857.1 Focusing on the SIH-based changes between 2003-04 and 2005-06, Table 22 shows that poverty increased for adults and for children using the 50 per cent median poverty line but remained more stable using the 60 per cent line. It is important to note here that (equivalised, adjusted) median income grew strongly between 2003-04 and 2005-06, from $492.6 to $561.6, or by 14 per cent (in nominal terms).38 Using the lower line, the overall poverty rate increased from 9.8 per cent to 11.1 per cent, adult poverty rose from 10.0 per cent to 11.3 per cent, and the child poverty rate increased from 8.9 per cent to 10.7 per cent. In terms of the numbers affected, these increases saw the number of people below the poverty line increase by 297.5 thousand, consisting of an extra 233.1 thousand adults and an extra 64.4 thousand children. Poverty rates are much more stable when the higher poverty line is used, although there is still an increase in child poverty and a growth in the numbers below the poverty line because of an increase in population size. On this measure, about an extra 80 thousand adults and 20 thousand children fell below the poverty line over the two-year period.
Table 23 shows a breakdown of the changes in poverty in the recent period by State and Territory (where the two Territories have been combined, as explained earlier). When the lower poverty line benchmark is used, poverty increased in all States over the period, but declined in the Territories. The increase was most pronounced in South Australia, while the smallest increase was recorded in Western Australia. New South
38 This is well above the increase in the Consumer Price Index (CPI) over the same period, and
the increase in the standard and married rates of pension. The latter difference contributes to the high increase in poverty among older people between 2003-04 and 2005-06 (see Appendix Table B.4).

POVERTY IN AUSTRALIA
44
Wales moved from just below to just above the national average, but its poverty rate remained below that in Victoria. When the higher poverty line is used, several States show a decline in poverty, including New South Wales, Queensland and Western Australia. Poverty is again lowest overall in the Territories, and a strong decline in poverty there is still evident.
Table 23: Changes in Poverty by State and Territory: 2003-04 to 2005-06, No Exclusions (percentages)
2003-04 2005-06
50 per cent median poverty line New South Wales 9.7 11.3 Victoria 10.5 12.0 Queensland 9.7 10.6 South Australia 8.8 12.3 Western Australia 9.1 9.5 Tasmania 12.2 13.0 Northern Territory/ACT 7.5 5.1 Total 9.8 11.1 60 per cent median poverty line New South Wales 19.8 19.3 Victoria 18.5 20.3 Queensland 20.4 19.8 South Australia 19.1 20.7 Western Australia 18.3 17.3 Tasmania 23.1 24.3 Northern Territory/ACT 12.5 9.1 Total 19.3 19.4

POVERTY IN AUSTRALIA
45
Appendix A: Detailed Poverty Estimates and Sensitivity Analysis, 2003-04
The methodology used to derive the various poverty rates has been explained in the Section 4, which also shows the impact of the exclusions on the numbers below the three poverty lines and on the overall poverty rates. This Appendix contains a series of tables that provide the disaggregated results that correspond to the aggregate figures already discussed. The first set of disaggregated estimates provides a breakdown of poverty (rates, absolute numbers and composition) into broad categories (adults and children, and those over and under age 65). This is followed by a detailed breakdown of poverty rates and composition by family type, age, labour force status, number of earners, principal source of income and State/Territory of residence.
Table A.1: Poverty Rates for Persons, Adults and Children by Exclusion Category (per cent)
No exclusions
Exclusion 1 Exclusion 2
50 per cent median income poverty line All Adults 10.1 10.0 8.4 Over 65 years 17.7 17.8 16.2 Under 65 years 8.7 8.3 6.8 Children 9.4 9.1 8.1 Persons 9.9 9.8 8.4 60 per cent median income poverty line Adults 19.7 20.4 18.0 Over 65 years 41.7 42.8 40.5 Under 65 years 15.7 15.7 13.3 Children 20.2 20.4 18.4 Persons 19.8 20.4 18.1 Henderson poverty line Adults 11.8 10.9 9.2 Over 65 years 15.8 15.3 13.8 Under 65 years 11.0 10.0 8.2 Children 14.4 13.2 11.6 Persons 12.3 11.4 9.7

POVERTY IN AUSTRALIA
46
Table A.2: Numbers of Persons, Adults and Children in Poverty by Exclusion Category (‘000s)
No exclusions
Exclusion 1 Exclusion 2
50 per cent median income poverty line Adults
Over 65 years 421.8 398.0 354.7 Under 65 years 1,148.0 888.5 710.3
All adults 1,569.7 1,286.5 1,065.0 Children 365.3 280.2 247.2 Persons 1,935.0 1,566.6 1,312.2 60 per cent median income poverty line Adults
Over 65 years 996.7 955.2 868.5 Under 65 years 2,076.8 1,669.3 1,378.4
All adults 3,073.5 2,624.4 2,247.0 Children 785.6 628.0 554.5 Persons 3,859.0 3,252.4 2,801.5 Henderson poverty line Adults
Over 65 years 377.6 340.9 301.6 Under 65 years 1,459.6 1,067.5 860.1
All adults 1,837.2 1,408.4 1,161.8 Children 559.6 408.8 351.8 Persons 2,396.8 1,817.2 1,513.5 Table A.3: Composition of Poverty: Persons, Adults and Children
(percentages) No
exclusions Exclusion 1 Exclusion 2
50 per cent median income poverty line Adults
Over 65 years 21.8 25.4 27.0 Under 65 years 59.3 56.7 54.1
All adults 81.1 82.1 81.2 Children under 15 years 18.9 17.9 18.8 Total 100.0 100.0 100.0 60 per cent median income poverty line Adults Over 65 years 25.8 29.4 31.0 Under 65 years 53.8 51.3 49.2 All adults 79.6 80.7 80.2 Children 20.4 19.3 19.8 Total 100.0 100.0 100.0 Henderson poverty line Adults Over 65 years 15.8 18.8 19.9 Under 65 years 60.9 58.7 56.8 All adults 76.6 77.5 76.8 Children 23.4 22.5 23.2 Total 100.0 100.0 100.0

POVERTY IN AUSTRALIA
47
Table A.4: Poverty Rates by Family Type (50 per cent of median income poverty line) (percentages)
Family type No exclusions
Exclusion 1 Exclusion 2
Single older person 39.0 39.2 37.3 Older couple 10.6 10.3 8.8 Single working-age 22.8 23.2 20.3 Working-age couple 7.4 6.5 4.4 Couple with children:
1 child 7.4 7.6 6.3 2 children 8.6 6.7 5.1 3 children 5.6 5.2 5.0 4+ children 15.7 17.1 16.8
All couples with children 7.0 6.2 5.1 Lone parent family:
1 child 10.1 10.1 9.3 2 children 17.9 18.9 18.9 3 children 17.9 19.3 19.3 4+ children 19.2 19.2 19.2
All lone parent families 11.4 11.8 11.6 Mixed family households 6.8 6.4 4.0 All family types 9.9 9.8 8.4 Note: Number of children is based on number of children aged under 15 years. Table A.5: Poverty Rates by Family Type (60 per cent of median income
poverty line) (percentages) Family type No
exclusions Exclusion 1 Exclusion 2
Single older person 60.1 59.8 57.7 Older couple 41.2 42.4 39.9 Single working-age 29.4 29.9 26.1 Working-age couple 14.2 14.1 11.0 Couple with children:
1 child 13.7 14.2 12.1 2 children 13.7 11.4 9.0 3 children 14.8 15.0 13.7 4+ children 28.6 29.1 28.8
All couples with children 13.1 12.2 10.2 Lone parent family:
1 child 30.3 31.0 29.1 2 children 44.0 42.6 41.1 3 children 52.8 55.1 54.2 4+ children 72.6 72.6 69.9
All lone parent families 32.1 33.0 31.8 Mixed family households 11.6 11.4 8.9 All family types 19.8 20.4 18.1 Note: Number of children is based on number of children aged under 15 years.

POVERTY IN AUSTRALIA
48
Table A.6: Poverty Rates by Family Type (Henderson poverty line) (percentages)
Family type No exclusions
Exclusion 1 Exclusion 2
Single older person 38.6 37.9 36.2 Older couple 6.3 5.2 3.8 Single working-age 26.2 26.2 22.8 Working-age couple 7.5 6.0 4.2 Couple with children:
1 child 10.7 9.8 8.2 2 children 11.5 8.8 6.9 3 children 8.9 8.1 7.3 4+ children 23.4 21.0 20.6
All couples with children 9.7 8.0 6.6 Lone parent family:
1 child 18.1 17.8 15.6 2 children 33.4 31.3 29.6 3 children 33.3 34.1 32.7 4+ children 19.9 19.9 19.9
All lone parent families 20.1 19.8 18.5 Mixed family households
9.9
8.8
6.1 All family types 12.3 11.4 9.7 Note: Number of children is based on number of children aged under 15 years. Table A.7: Composition of Poverty by Broad Family Type (50 per cent median
poverty line) (percentages) No
exclusions Exclusion 1 Exclusion 2
Single older person 14.4 17.3 11.7 Older couple 7.3 8.2 5.5 Single working-age 14.7 16.3 18.3 Working-age couple 11.4 10.3 6.5 Couple with children 36.4 30.8 37.4 Lone parent family 11.7 13.2 18.6 Mixed family household 4.1 3.9 2.0 Total 100.0 100.0 100.0 Table A.8: Composition of Poverty by Broad Family Type (60 per cent median
poverty line) (percentages) No
exclusions Exclusion 1 Exclusion 2
Single older person 11.1 12.7 13.1 Older couple 14.3 16.4 17.1 Single working-age 9.5 10.1 9.6 Working-age couple 11.1 10.7 9.8 Couple with children 34.0 28.9 28.4 Lone parent family 16.5 17.9 19.3 Mixed family household 3.5 3.3 2.8 Total 100.0 100.0 100.0

POVERTY IN AUSTRALIA
49
Table A.9: Composition of Poverty by Broad Family Type (Henderson poverty line) (percentages)
No exclusions
Exclusion 1 Exclusion 2
Single older person 11.5 14.4 15.3 Older couple 3.5 3.6 3.1 Single working-age 13.6 15.8 15.6 Working-age couple 9.4 8.2 6.8 Couple with children 40.5 34.2 33.8 Lone parent family 16.6 19.1 21.6 Mixed family household 4.9 4.6 3.8 Total 100.0 100.0 100.0 Table A.10: Poverty Rates by Age of the Oldest Person in the Household (50 per
cent median poverty line) (percentages)
Age (years) No exclusions
Exclusion 1 Exclusion 2
Under 25 12.5 11.1 7.5 25 - 44 8.5 8.1 7.2 45 - 54 6.5 6.1 5.1 55 - 64 13.7 13.6 10.6 65 and over 15.1 15.2 13.5 All 9.9 9.8 8.4 Table A.11: Poverty Rates by Age of the Oldest Person in the Household (60 per
cent median poverty line) (percentages) Age (years) No
exclusions Exclusion 1 Exclusion 2
Under 25 20.5 19.6 15.8 25 - 44 15.8 15.4 13.6 45 - 54 13.1 13.2 11.7 55 - 64 23.3 24.3 19.9 65 and over 37.1 38.1 35.7 All 19.8 20.4 18.1 Table A.12: Poverty Rates by Age of the Oldest Person in the Household
(Henderson poverty line) (percentages) Age (years) No
exclusions Exclusion 1 Exclusion 2
Under 25 15.6 14.3 11.3 25 - 44 12.2 11.1 9.5 45 - 54 10.3 9.3 8.2 55 - 64 13.6 12.5 9.7 65 and over 13.8 13.3 11.6 All 12.3 11.4 9.7

POVERTY IN AUSTRALIA
50
Table A.13: Composition of Poverty by Age of the Oldest Person in the Household (50 per cent median poverty line) (percentages)
Age (years) No exclusions
Exclusion 1 Exclusion 2
Under 25 3.3 3.3 2.6 25 - 44 36.5 34.5 36.3 45 - 54 15.7 14.1 14.1 55 - 64 20.1 20.1 18.2 65 and over 24.5 27.9 28.8 All 100.0 100.0 100.0
Table A.14: Composition of Poverty by Age of the Oldest Person in the Household (60 per cent median poverty line) (percentages)
Age (years) No exclusions
Exclusion 1 Exclusion 2
Under 25 2.7 2.8 2.5 25 - 44 34.0 31.5 31.6 45 - 54 16.0 14.7 15.0 55 - 64 17.1 17.3 15.6 65 and over 30.2 33.6 35.3 Total 100.0 100.0 100.0 Table A.15: Composition of Poverty by Age of the Oldest Person in the
Household (Henderson poverty line) (percentages) Age (years) No
exclusions Exclusion 1 Exclusion 2
Under 25 3.3 3.7 3.4 25 - 44 42.4 40.7 41.3 45 - 54 20.2 18.6 19.4 55 - 64 16.0 15.9 14.4 65 and over 18.1 21.0 21.6 All 100.0 100.0 100.0 Table A.16: Poverty Rates by Labour Force Status of Oldest Person in the
Household (50 per cent median poverty line) (percentages) No
exclusions Exclusion 1 Exclusion 2
Employed full-time 1.7 1.4 0.8 Employed part-time 4.5 4.3 3.6 Self-employed 12.0 0.0 0.0 Unemployed 40.2 41.5 37.0 Not in the labour force 20.3 20.4 18.1 All 9.9 9.8 8.4

POVERTY IN AUSTRALIA
51
Table A.17: Poverty Rates by Labour Force Status of Oldest Person in the Household (60 per cent median poverty line) (percentages)
No exclusions
Exclusion 1 Exclusion 2
Employed full-time 3.4 3.3 2.4 Employed part-time 10.6 11.1 9.5 Self-employed 20.4 0.0 0.0 Unemployed 62.1 61.9 57.4 Not in the labour force 42.4 42.9 39.8 All 19.8 20.4 18.1 Table A.18: Poverty Rates by Labour Force Status of Oldest Person in the
Household (Henderson poverty line) (percentages) No
exclusions Exclusion 1 Exclusion 2
Employed full-time 2.4 2.2 1.4 Employed part-time 8.9 9.0 7.5 Self-employed 20.4 0.0 0.0 Unemployed 63.7 63.7 59.3 Not in the labour force 20.6 20.2 18.0 All 12.3 11.4 9.7
Table A.19: Composition of Poverty by Labour Force Status of Oldest Person in the Household (50 per cent median poverty line) (percentages)
No exclusions
Exclusion 1 Exclusion 2
Employed full-time 7.4 6.9 4.9 Employed part-time 5.3 5.4 5.4 Self-employed 12.0 0.0 0.0 Unemployed 10.5 12.2 12.0 Not in the labour force 64.9 75.6 77.8 All 100.0 100.0 100.0 Table A.20: Composition of Poverty by Labour Force Status of Oldest Person
in the Household (60 per cent median poverty line) (percentages) No
exclusions Exclusion 1 Exclusion 2
Employed full-time 7.6 7.9 6.5 Employed part-time 6.2 6.7 6.6 Self-employed 10.2 0.0 0.0 Unemployed 8.1 8.8 8.4 Not in the labour force 67.9 76.6 78.5 All 100.0 100.0 100.0

POVERTY IN AUSTRALIA
52
Table A.21: Composition of Poverty by Labour Force Status of Oldest Person in the Household (Henderson poverty line) (percentages)
No exclusions
Exclusion 1 Exclusion 2
Employed full-time 8.6 9.4 7.0 Employed part-time 8.3 9.8 9.6 Self-employed 16.5 0.0 0.0 Unemployed 13.4 16.1 16.1 Not in the labour force 53.2 64.7 67.3 All 100.0 100.0 100.0 Table A.22: Poverty Rates by Principal Source of Household Income (50 per
cent median poverty line) (percentages)
No exclusions
Exclusion 1 Exclusion 2
Zero or negative income 100.0 0.0 0.0 Wages and salaries 2.2 1.6 1.0 Own unincorporated business income 6.5 0.0 0.0 Government pensions and allowances 31.5 31.4 29.2 Other income 16.4 16.4 10.9 All 9.9 9.8 8.4 Table A.23: Poverty Rates by Principal Source of Household Income (60 per
cent median poverty line) (percentages)
No exclusions
Exclusion 1 Exclusion 2
Zero or negative income 100.0 0.0 0.0 Wages and salaries 4.4 3.9 2.8 Own unincorporated business income
15.7 0.0 0.0
Government pensions and allowances
66.9 67.1 64.9
Other income 19.9 20.4 13.6 All 19.8 20.4 18.1 Table A.24: Poverty Rates by Principal Source of Household Income
(Henderson poverty line) (percentages)
No exclusions
Exclusion 1 Exclusion 2
Zero or negative income 100.0 0.0 0.0 Wages and salaries 3.5 2.9 1.9 Own unincorporated business income
14.0 0.0 0.0
Government pensions and allowances
36.0 34.2 32.0
Other income 16.3 16.1 10.4 All 12.3 11.4 9.7

POVERTY IN AUSTRALIA
53
Table A.25: Composition of Poverty by Principal Source of Household Income (50 per cent median poverty line) (percentages)
No exclusions
Exclusion 1 Exclusion 2
Zero or negative income 2.9 0.0 0.0 Wages and salaries 14.3 11.2 8.1 Own unincorporated business income
4.5 0.0 0.0
Government pensions and allowances
68.0 77.7 83.6
Other income 10.4 11.1 8.3 Total 100.0 100.0 100.0 Table A.26: Composition of Poverty by Principal Source of Household Income
(60 per cent median poverty line) (percentages) No
exclusions Exclusion 1 Exclusion 2
Zero or negative income 1.4 0.0 0.0 Wages and salaries 14.4 13.3 10.9 Own unincorporated business income
5.5 0.0 0.0
Government pensions and allowances
72.3 80.1 84.4
Other income 6.3 6.6 4.7 Total 100.0 100.0 100.0
Table A.27: Composition of Poverty by Principal Source of Household Income (Henderson poverty line) (percentages)
No exclusions
Exclusion 1 Exclusion 2
Zero or negative income 2.3 0.0 0.0 Wages and salaries 18.8 17.5 13.8 Own unincorporated business income 7.9 0.0 0.0 Government pensions and allowances 62.7 73.1 79.4 Other income 8.3 9.4 6.8 Total 100.0 100.0 100.0
Table A.28: Poverty Rates by Number of Earners in the Household (50 per cent of median income poverty line) (percentages)
No exclusions
Exclusion 1 Exclusion 2
No earners 31.4 31.1 28.1 One earner 7.0 4.7 3.3 Two or more earners 2.0 0.4 0.2 All 9.9 9.8 8.4
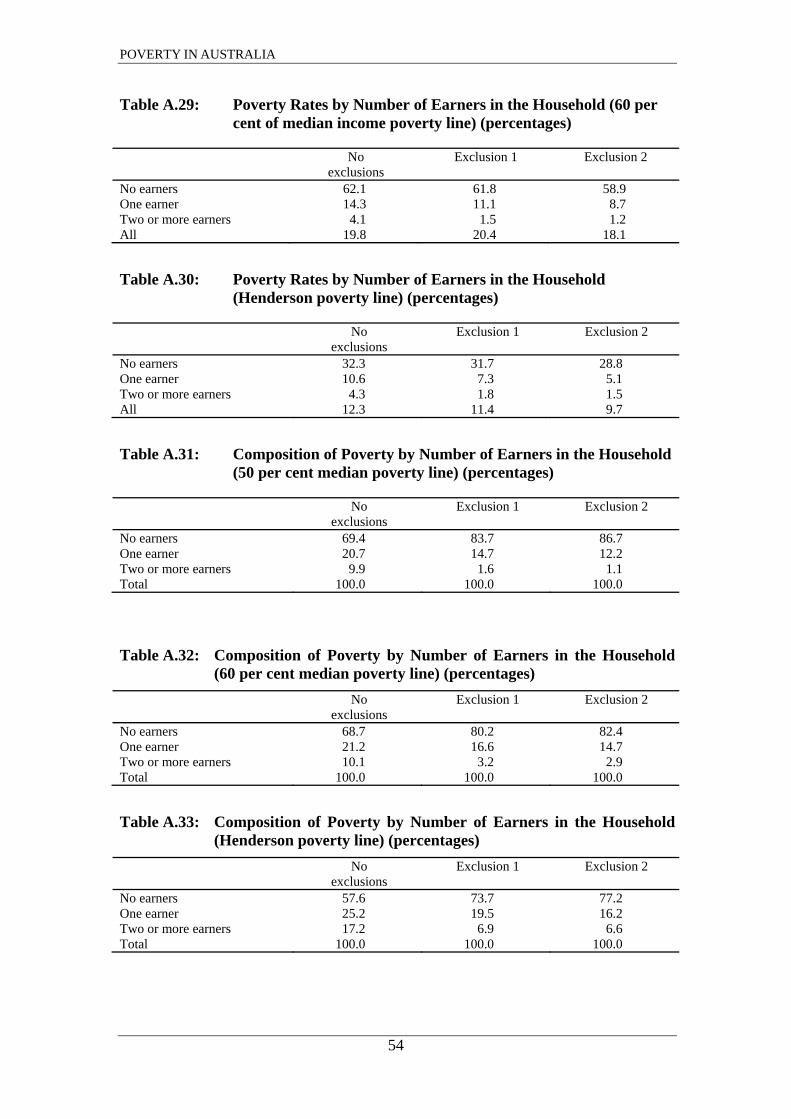
POVERTY IN AUSTRALIA
54
Table A.29: Poverty Rates by Number of Earners in the Household (60 per cent of median income poverty line) (percentages)
No exclusions
Exclusion 1 Exclusion 2
No earners 62.1 61.8 58.9 One earner 14.3 11.1 8.7 Two or more earners 4.1 1.5 1.2 All 19.8 20.4 18.1
Table A.30: Poverty Rates by Number of Earners in the Household (Henderson poverty line) (percentages)
No exclusions
Exclusion 1 Exclusion 2
No earners 32.3 31.7 28.8 One earner 10.6 7.3 5.1 Two or more earners 4.3 1.8 1.5 All 12.3 11.4 9.7
Table A.31: Composition of Poverty by Number of Earners in the Household (50 per cent median poverty line) (percentages)
No exclusions
Exclusion 1 Exclusion 2
No earners 69.4 83.7 86.7 One earner 20.7 14.7 12.2 Two or more earners 9.9 1.6 1.1 Total 100.0 100.0 100.0
Table A.32: Composition of Poverty by Number of Earners in the Household (60 per cent median poverty line) (percentages)
No exclusions
Exclusion 1 Exclusion 2
No earners 68.7 80.2 82.4 One earner 21.2 16.6 14.7 Two or more earners 10.1 3.2 2.9 Total 100.0 100.0 100.0
Table A.33: Composition of Poverty by Number of Earners in the Household (Henderson poverty line) (percentages)
No exclusions
Exclusion 1 Exclusion 2
No earners 57.6 73.7 77.2 One earner 25.2 19.5 16.2 Two or more earners 17.2 6.9 6.6 Total 100.0 100.0 100.0

POVERTY IN AUSTRALIA
55
Table A.34: Poverty Rates by State or Territory (50 per cent median poverty line) (percentages)
No exclusions
Exclusion 1 Exclusion 2
New South Wales 9.9 9.9 8.1 Victoria 10.7 9.9 8.2 Queensland 8.9 9.4 8.4 South Australia 9.3 8.9 8.4 Western Australia 9.9 10.0 8.2 Tasmania 16.3 16.1 14.7 ACT and Northern Territory 7.4 7.7 6.8 All 9.9 9.8 8.4
Table A.35: Poverty Rates by State or Territory (60 per cent median poverty line) (percentages)
No exclusions
Exclusion 1 Exclusion 2
New South Wales 19.9 20.9 18.2 Victoria 18.8 18.7 16.2 Queensland 21.3 22.3 20.5 South Australia 20.2 20.6 19.6 Western Australia 18.8 19.2 16.0 Tasmania 28.1 29.0 26.5 ACT and Northern Territory 11.4 11.2 10.3 All 19.8 20.4 18.1
Table A.36: Poverty Rates by State or Territory (Henderson poverty line) (percentages)
No exclusions
Exclusion 1 Exclusion 2
New South Wales 12.0 11.2 9.3 Victoria 12.2 11.2 9.1 Queensland 12.2 11.5 10.2 South Australia 12.0 10.5 9.9 Western Australia 13.2 12.3 10.2 Tasmania 19.9 18.5 16.4 ACT and Northern Territory 7.7 7.5 6.7 All 12.3 11.4 9.7 Table A.37: Composition of Poverty by State or Territory (50 per cent median
poverty line) (percentages) No
exclusions Exclusion 1 Exclusion 2
New South Wales 33.5 33.9 32.7 Victoria 26.7 25.4 24.7 Queensland 17.1 18.1 19.0 South Australia 7.2 7.1 7.9 Western Australia 9.8 9.7 9.3 Tasmania 4.0 4.0 4.3 ACT and Northern Territory 1.8 1.8 2.0 Total 100.0 100.0 100.0
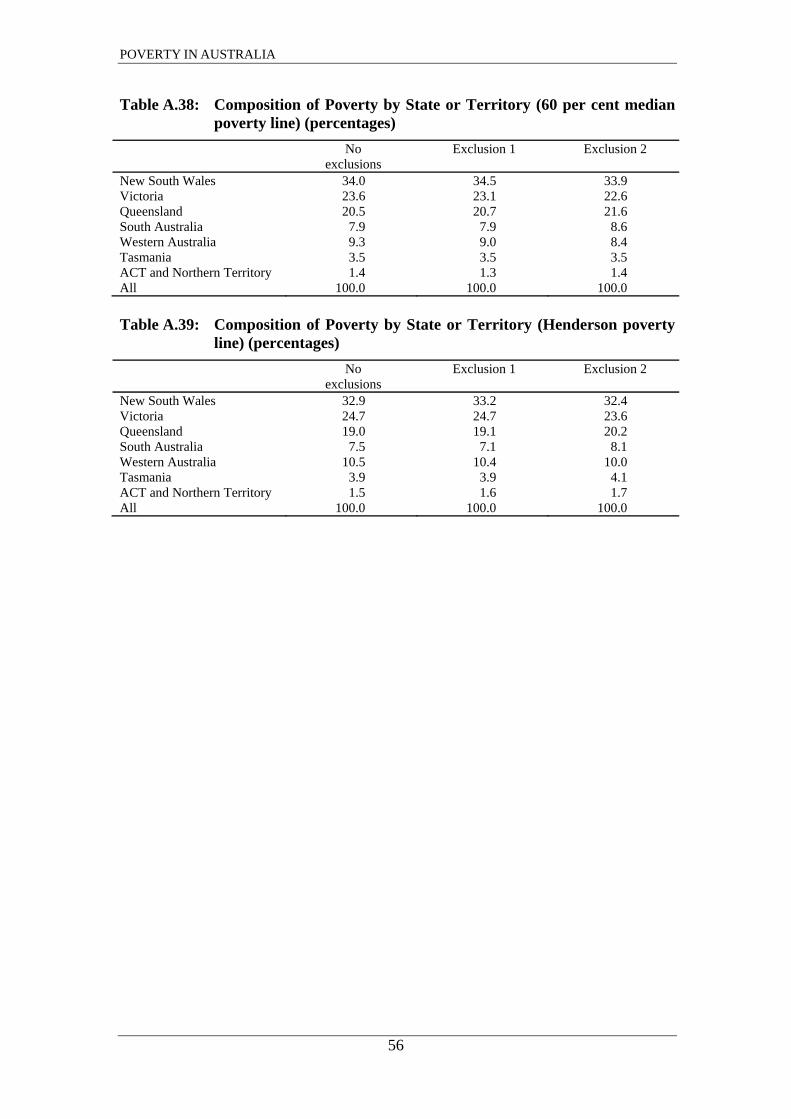
POVERTY IN AUSTRALIA
56
Table A.38: Composition of Poverty by State or Territory (60 per cent median poverty line) (percentages)
No exclusions
Exclusion 1 Exclusion 2
New South Wales 34.0 34.5 33.9 Victoria 23.6 23.1 22.6 Queensland 20.5 20.7 21.6 South Australia 7.9 7.9 8.6 Western Australia 9.3 9.0 8.4 Tasmania 3.5 3.5 3.5 ACT and Northern Territory 1.4 1.3 1.4 All 100.0 100.0 100.0 Table A.39: Composition of Poverty by State or Territory (Henderson poverty
line) (percentages) No
exclusions Exclusion 1 Exclusion 2
New South Wales 32.9 33.2 32.4 Victoria 24.7 24.7 23.6 Queensland 19.0 19.1 20.2 South Australia 7.5 7.1 8.1 Western Australia 10.5 10.4 10.0 Tasmania 3.9 3.9 4.1 ACT and Northern Territory 1.5 1.6 1.7 All 100.0 100.0 100.0

POVERTY IN AUSTRALIA
57
Appendix B: Detailed Poverty Estimates and Poverty Lines for 2005-06
Table B.1: Poverty Rates in 2005-06 for Persons, Adults and Children, No Exclusions (percentages)
50 per cent median income poverty line Adults 11.3
Over 65 years 23.9 Under 65 years 8.9
Children 10.7 Persons 11.1 60 per cent median income poverty line Adults 19.4
Over 65 years 45.2 Under 65 years 14.7
Children 19.5 Persons 19.4 Table B.2: Numbers of Persons, Adults and Children in Poverty in 2005-06,
No Exclusions (thousands)
50 per cent median income poverty line Adults 1,798.0
Over 65 years 597.4 Under 65 years 1,200.5
Children 411.6 Persons 2,209.6 60 per cent median income poverty line Adults 3,103.4
Over 65 years 1,128.0 Under 65 years 1,975.3
Children 753.7 Persons 3,857.1

POVERTY IN AUSTRALIA
58
Table B.3: Composition of Poverty in 2005-06: Persons, Adults and Children, No Exclusions (percentages)
50 per cent median income poverty line Adults
Over 65 years 27.0 Under 65 years 54.3
All adults 81.4 Children under 15 years 18.6 Total 100.0 60 per cent median income poverty line Adults
Over 65 years 29.2 Under 65 years 51.2
All adults 80.5 Children 19.5 Total 100.0 Table B.4: Poverty Rates in 2005-06 Based on Different Poverty Lines by
Family Type, No Exclusions (percentages) Family type 50 per cent median
60 per cent median
Single older person 46.9 65.9 Older couple 17.8 43.8 Single working-age 24.8 30.0 Working-age couple 6.5 11.2 Couple with children:
1 child 5.1 8.6 2 children 6.6 10.7 3 children 7.0 14.9 4+ children 16.3 27.4
All couples with children 7.0 11.8 Lone parent family:
1 child 16.7 33.4 2 children 21.4 41.3 3 children 21.5 58.6 4+ children 38.8 65.8
All lone parent families 16.4 33.4 Mixed family households 3.2 9.7 All family types 11.1 19.4 Note: Number of children is based on number of children under 15 years.

POVERTY IN AUSTRALIA
59
Table B.5: Composition of Poverty in 2005-06 Based on Different Poverty Lines by Broad Family Type, No Exclusions (percentages)
50 per cent median 60 per cent median
Single older person 15.8 12.7 Older couple 11.4 16.0 Single working-age 14.4 10.0 Working-age couple 9.1 8.9 Couple with children 31.3 30.4 Lone parent family 16.3 19.1 Mixed family household 1.7 2.9 Total 100.0 100.0 Note: Totals may not sum to 100 due to rounding Table B.6: Poverty Rates in 2005-06 Based on Different Poverty Lines by Age
of the Oldest Person in the Household, No Exclusions (percentages)
Age (years) 50 per cent median
60 per cent median
Under 25 11.0 20.6 25 - 44 9.5 16.0 45 - 54 7.3 12.7 55 - 64 11.7 18.2 65 and over 20.1 38.1 All 11.1 19.4 Table B.7: Composition of Poverty in 2005-06 Based on Different Poverty
Lines by Age of the Oldest Person in the Household, No Exclusions (percentages)
Age (years) 50 per cent median
60 per cent median
Under 25 2.6 2.8 25 - 44 35.0 33.8 45 - 54 15.7 15.6 55 - 64 16.1 14.3 65 and over 30.7 33.5 Total 100.1 100.0 Note: Totals may not sum to 100 due to rounding Table B.8: Poverty Rates in 2005-06 Based on Different Poverty Lines by
Labour Force Status of Oldest Person in the Household, No Exclusions (percentages)
50 per cent median 60 per cent median
Employed full-time 1.4 3.0 Employed part-time 5.2 13.0 Self-employed 13.5 20.3 Unemployed 44.7 64.8 Not in the labour force 25.7 44.9 All 11.1 19.4

POVERTY IN AUSTRALIA
60
Table B.9: Composition of Poverty in 2005-06 Based on Different Poverty Lines by Labour Force Status of Oldest Person in the Household, No Exclusions (percentages)
50 per cent median
60 per cent median
Employed full-time 5.9 7.6 Employed part-time 4.6 6.6 Self-employed 12.4 10.7 Unemployed 11.6 9.6 Not in the labour force 65.5 65.5 Total 100.0 100.0 Table B.10: Poverty Rates in 2005-06 Based on Different Poverty Lines by
Principal Source of Household Income, No Exclusions (percentages)
50 per cent median
60 per cent median
Zero or negative income 100.0 100.0 Wages and salaries 1.9 4.3 Own unincorporated business income
7.9 14.3
Government pensions and allowances
40.7 69.9
Other income 11.8 17.9 All 11.1 19.4 Table B.11: Composition of Poverty in 2005-06 Based on Different Poverty
Lines by Principal Source of Household Income, No Exclusions (percentages)
50 per cent median
60 per cent median
Zero or negative income 3.1 1.8 Wages and salaries 11.5 14.7 Own unincorporated business income
5.0 5.2
Government pensions and allowances
74.0 72.8
Other income 6.4 5.6 Total 100.0 100.1 Note: Totals may not sum to 100 due to rounding Table B.12: Poverty Rates in 2005-06 Based on Different Poverty Lines by
Number of Earners in the Household, No Exclusions (percentages)
50 per cent median
60 per cent median
No earners 39.9 65.5 One earner 6.9 14.5 Two or more earners 1.9 3.6 All 11.1 19.4
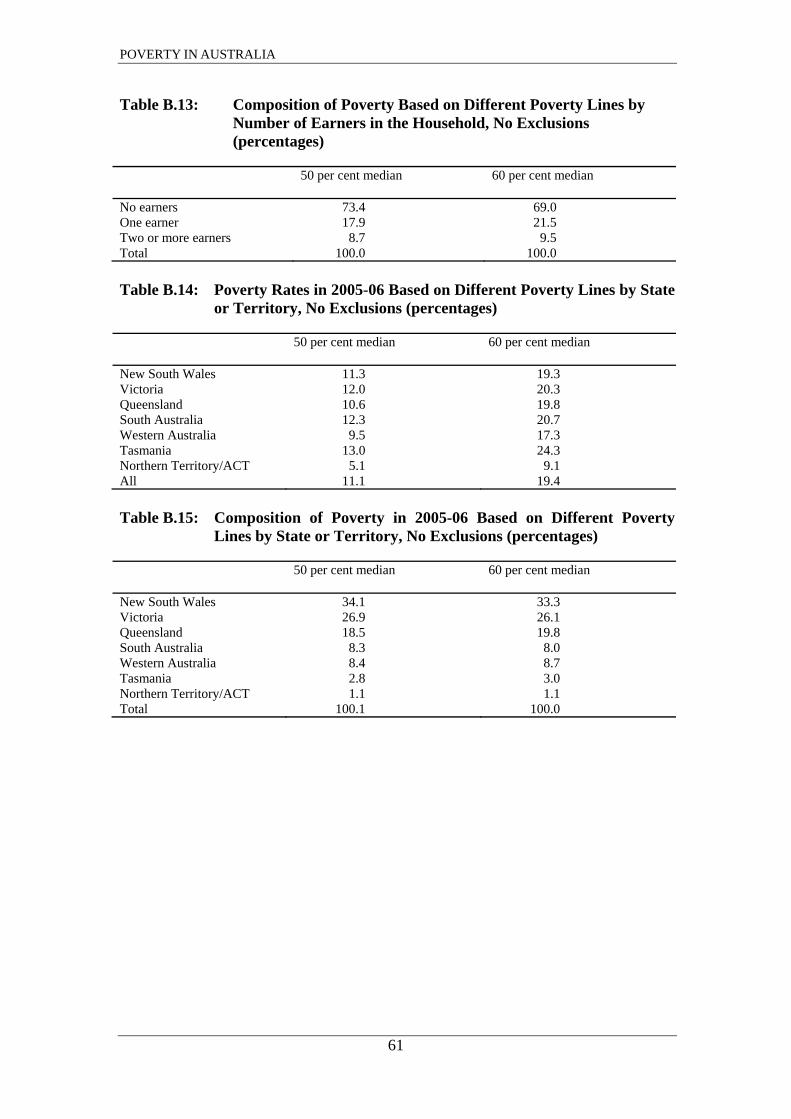
POVERTY IN AUSTRALIA
61
Table B.13: Composition of Poverty Based on Different Poverty Lines by Number of Earners in the Household, No Exclusions (percentages)
50 per cent median 60 per cent median
No earners 73.4 69.0 One earner 17.9 21.5 Two or more earners 8.7 9.5 Total 100.0 100.0 Table B.14: Poverty Rates in 2005-06 Based on Different Poverty Lines by State
or Territory, No Exclusions (percentages)
50 per cent median
60 per cent median
New South Wales 11.3 19.3 Victoria 12.0 20.3 Queensland 10.6 19.8 South Australia 12.3 20.7 Western Australia 9.5 17.3 Tasmania 13.0 24.3 Northern Territory/ACT 5.1 9.1 All 11.1 19.4 Table B.15: Composition of Poverty in 2005-06 Based on Different Poverty
Lines by State or Territory, No Exclusions (percentages)
50 per cent median
60 per cent median
New South Wales 34.1 33.3 Victoria 26.9 26.1 Queensland 18.5 19.8 South Australia 8.3 8.0 Western Australia 8.4 8.7 Tasmania 2.8 3.0 Northern Territory/ACT 1.1 1.1 Total 100.1 100.0

POVERTY IN AUSTRALIA
62
Table B.16: Poverty Lines by Family Type in 2003-04: 50 per cent of Median Equivalised Disposable Income, modified OECD Equivalence Scale ($ per week)
Family type
Annual (2003-04)
September quarter
December quarter
March quarter
June quarter
Lone person 246.3 244.0 245.2 247.4 248.6 Couple only 369.5 366.0 367.8 371.1 372.9 Couple with one child 443.4 439.2 441.3 445.4 447.5 Couple with two children 517.3 512.4 514.9 519.6 522.1 Couple with three children 591.1 585.6 588.5 593.8 596.7 Couple with four children 665.0 658.8 662.0 668.0 671.3 Lone parent with one child 320.2 317.2 318.7 321.6 323.2 Lone parent with two children 394.1 390.4 392.3 395.9 397.8 Lone parent with three children 468.0 463.6 465.9 470.1 472.4 Lone parent with four children 541.9 536.8 539.4 544.3 547.0 Poverty line for quarter as a proportion of the annual poverty line
99.1
99.5
100.5
100.9
Note: Poverty lines assume that all children are aged under 15 years. Source: ABS Survey of Income and Housing 2003-04, CURF.

POVERTY IN AUSTRALIA
63
Table B.17: Poverty Lines by Family Type in 2003-04: 60 per cent of Median Equivalised Disposable Income, modified OECD Equivalence Scale ($ per week)
Family type
Annual (2003-04)
September quarter
December quarter
March quarter
June quarter
Lone person 295.6 292.8 294.2 296.9 298.4 Couple only 443.4 439.2 441.3 445.4 447.5 Couple with one child 532.0 527.0 529.6 534.4 537.0 Couple with two children 620.7 614.8 617.9 623.5 626.5 Couple with three children 709.4 702.7 706.2 712.6 716.0 Couple with four children 798.0 790.5 794.4 801.7 805.5 Lone parent with one child 384.2 380.6 382.5 386.0 387.9 Lone parent with two children 472.9 468.4 470.8 475.1 477.4 Lone parent with three children 561.6 556.3 559.0 564.1 566.9 Lone parent with four children 650.3 644.1 647.3 653.2 656.4 Poverty line for quarter as a proportion of the annual poverty line
99.1
99.5
100.5
100.9
Note: Poverty lines assume that all children are aged under 15 years. Source: ABS Survey of Income and Housing 2003-04, CURF.

POVERTY IN AUSTRALIA
64
Table B.18: Poverty Lines by Family Type in 2005-06: 50 per cent of Median Equivalised Disposable Income, modified OECD Equivalence Scale ($ per week)
Family type
Annual (2005-06)
September quarter
December quarter
March quarter
June quarter
Lone person 280.8 277.4 278.9 281.3 285.7 Couple only 421.2 416.1 418.3 421.9 428.6 Couple with one child 505.5 499.3 502.0 506.3 514.3 Couple with two children 589.7 582.5 585.6 590.7 600.0 Couple with three children 674.0 665.7 669.3 675.1 685.7 Couple with four children 758.2 749.0 752.9 759.5 771.4 Lone parent with one child 365.1 360.6 362.5 365.7 371.4 Lone parent with two children 449.3 443.8 446.2 450.0 457.2 Lone parent with three children 533.5 527.0 529.9 534.4 542.9 Lone parent with four children 617.8 610.3 613.5 618.8 628.6 Poverty line for quarter as a proportion of the annual poverty line
98.8
99.3
100.2
101.7
Note: Poverty lines assume that all children are aged under 15 years. Source: ABS Survey of Income and Housing 2005-06, CURF.

POVERTY IN AUSTRALIA
65
Table B.19: Poverty Lines by Family Type in 2005-06: 60 per cent of Median Equivalised Disposable Income, modified OECD Equivalence Scale ($ per week)
Family type
Annual (2005-06)
September quarter
December quarter
March quarter
June quarter
Lone person 337.0 332.9 334.7 337.5 342.9 Couple only 505.5 499.3 502.0 506.3 514.3 Couple with one child 606.6 599.2 602.4 607.6 617.2 Couple with two children 707.7 699.0 702.8 708.8 720.0 Couple with three children 808.7 798.9 803.2 810.1 822.9 Couple with four children 909.8 898.7 903.6 911.3 925.7 Lone parent with one child 438.1 432.7 435.0 438.8 445.7 Lone parent with two children 539.2 532.6 535.4 540.0 548.6 Lone parent with three children 640.3 632.5 635.8 641.3 651.5 Lone parent with four children 741.4 732.3 736.2 742.6 754.3 Poverty line for quarter as a proportion of the annual poverty line
98.8
99.3
100.2
101.7
Note: Poverty lines assume that all children are aged under 15 years. Source: ABS Survey of Income and Housing 2005-06, CURF.

POVERTY IN AUSTRALIA
66
Appendix C: Notes on the Exclusions Methodology
Although the exclusions approach is straightforward in principle, its application raises several practical issues. These can best be understood with the aid of an example. Let S = the size of the full sample available for analysis and X = the size of a sub-sample that is a potential exclusion (because of concern about the quality of the reported data for this group). The full sample can be sub-divided into those who are at or below the poverty line (P) and those who are above the poverty line (NP), where P + NP = S and the standard (no exclusions) poverty rate (p) is given by:
p = P/(P + NP) = P/S (i)
Now for the treatment of the exclusions: firstly, it is important to recognise that there are two basic ways in which the exclusion can be applied.
1. The exclusion can be applied to the entire sample (i.e. to S)
2. The exclusion can be applied only to those households who are below the
poverty line (i.e. to P)
If the first approach is adopted then a distinction must be made between those in the excluded group who are at or below the poverty line (XP) and those who are above the poverty line (XNP). After applying the exclusion, the numbers in poverty are reduced from P to (P – XP), and the numbers not in poverty are reduced from NP to (NP – XNP). The adjusted poverty rate (p*) is then given by:
p* = (P – XP) / (NP – XNP) (ii)
This new poverty rate can be higher or lower than the original rate, depending on whether the poverty rate among the excluded group is above or below the poverty rate among rest of the population.39 However, the normal expectation is that the exclusion will reduce the poverty rate because of the high incidence of poverty among the excluded group (which is generally regarded as being artificially high, this provide the rationale for excluding this group in the first place).
The second approach to exclusion involves excluding only those in specific circumstances whose incomes place them below the poverty line. In this case, let ZP be the number in the group with reported incomes below the poverty line. Because there are concerns about the reliability of reported income for this group (based, for example, on the fact that they report higher levels of expenditure) the approach would exclude them from the poverty group, and consistency requires that they are also excluded from the population used to estimate the poverty rate. In this case, the adjusted poverty rate (p**) is given by:
p** = (P – ZP) / (S – ZP) (iii)
39 Equation (ii) can be rearranged to give p* = p/p(x), where p(x) is the poverty rate among the
excluded group. This implies that whether or not p* exceeds p depends upon whether or not p(x) exceeds p.

POVERTY IN AUSTRALIA
67
This new formula will always produce a decline in the poverty rate because P is less than S (i.e. not everyone is below the poverty line). Note that in this second approach, those with the same characteristics as the excluded group who have incomes above the poverty (ZNP) line remain included in the analysis as part of the overall sample (S) that is used to derive the poverty rate.40
Both of the exclusion approaches described above have been employed in previous studies of poverty. The former approach has often been applied to the self-employed, where concerns about deriving their poverty status from the incomes reported in surveys have led many analysts to remove the self-employed altogether when estimating poverty rates. This approach was adopted by the Poverty Commission, and has subsequently been regarded as a feature of the Henderson poverty line approach (Saunders, 1998). The latter approach has been used to exclude households with reported incomes that are thought to be unreliable because of apparent inconsistencies with other reported information (e.g. on household expenditure) (Saunders and Bradbury, 2006).
It is important to recognise that the two approaches reflect an underlying difference in attitude to the reported data. In the former case, concern focuses on the general validity of income as in indicator of the standard of living, this providing the case for excluding all households with the ascribed characteristic. In the latter case, the concern is more specific, focusing on the validity of using the reported income data to determine poverty status when there is other evidence that suggests that living standards may be higher than implied by income alone. Although this latter concern may apply to households at all points in the income distribution, only those households with incomes below the poverty line are excluded because it is here where the impact will affect estimated poverty rates.41
Whichever approach is taken to the treatment of exclusions, another issue that arises is whether or not the poverty line itself should also be changed to reflect the exclusion. This is not an issue for those poverty lines that are derived from external data (e.g. the Henderson poverty line), but it is important for those poverty lines that are based on median income, because the exclusions may affect the median of the distribution and hence the poverty line.
There is no ‘correct’ approach to this issue, and a case can be made for either using an unchanged median, or for adjusting it to reflect the exclusion. The argument for the former approach is that it is clearer to see the impact of the exclusion on the estimated poverty rate if the poverty line is held fixed. Against this, the latter approach is conceptually more consistent, but at a cost of reduced transparency and increased
40 An alternative approach in the second case would be to exclude the relevant group from the
ranks of those below the poverty line, but not exclude them from the sample. This is equivalent to assuming that their incomes are artificially low and that their ‘true’ position is above, not below the poverty line. The approach described in the main text assumes that their reported incomes are artificially low and that they should therefore be removed from the analysis altogether.
41 Income may also be a poor indicator of living standards for many other (non-poor) households, but their inclusion does not affect the poverty rate and so the case for excluding them in studies of poverty is much weaker.

POVERTY IN AUSTRALIA
68
complexity. In practice, both approaches produce similar results because the median itself is relatively insensitive to changes of the type examined in this report. In light of this, we have chosen to keep the median (and hence the poverty line) unchanged as we examine the impact of the different exclusions.42
42 One added advantage of the approach adopted is that the poverty lines based on percentages of
median income are treated in the same way as the Henderson line, i.e. they remain unchanged as the different exclusions are applied.

POVERTY IN AUSTRALIA
69
Appendix D: Poverty and Wealth
The importance that wealth plays in protecting people from poverty in Australia has generally focused on the role of housing wealth. Recognising that many Australians own their homes outright and thus face lower housing costs than those in other housing tenures (home purchasers and renters), the Henderson poverty line has often been used to estimate poverty before and after taking account of housing costs (King, 1998).
The former approach includes the housing component of costs in the equivalence scale and measures poverty on the basis of total (disposable) income, whereas the latter approach removes the housing component of the equivalence adjustment (which captures housing needs) and deducts actual housing costs from income before estimating poverty. Using this latter measure, homeowners face a larger deduction from the poverty line than from their income, causing their poverty rate to fall relative to those in other housing tenures. This impact is particularly striking for older people, where homeownership is most prevalent, and many regard the after housing costs measure as more reliable than the before housing costs measure for comparing movements in poverty over the life cycle.
More generally, low-income households who have access to any form of wealth are better able to avoid poverty than those with both low income and little or no wealth. To explore this issue further, the following analysis profiles the non-housing wealth holdings of the population with incomes below the relevant poverty lines in 2003-04 9the only year for which this is possible using HES data).
The two wealth variables included in the analysis are total household net wealth and net wealth minus owner-occupied housing wealth. The latter deducts the net value of housing wealth, i.e. the estimated sale price of the dwelling of homeowners, and this figure minus the principal outstanding on any loans relating to that dwelling for mortgagees. Tables D.1 and D.2 show the distributions of the ratio of net wealth (including housing wealth) to disposable income and the absolute value of net wealth for households with incomes below the 50 per cent and 60 per cent median income poverty lines, while Figures D.1 and D.2 show the cumulative distribution of net wealth and net non-housing wealth for those households below the two poverty lines.

POVERTY IN AUSTRALIA
70
Table D.1: Net Wealth to Income Ratios Based on Different Exclusions and 50 per cent of Median Income Poverty Line
Percentile of poor households
Households with negative and zero incomes excluded
Households with negative and zero incomes and self-employed households
(SE3) excluded Net wealth
($’000) Net wealth to income ratio
Net wealth ($’000)
Net wealth to income ratio
10th 10.5 28.9 9.5 23.0 20th 24.0 63.8 20.0 52.9 30th 42.8 152.9 31.3 98.6 40th 100.6 358.1 62.2 210.2 50th 191.0 621.4 159.4 542.2 60th 269.3 970.5 248.8 871.9 70th 374.3 1,394.2 320.6 1,284.1 80th 558.2 2,055.2 483.5 1,821.5 90th 833.8 4,064.7 750.1 3,236.1 100th 4,740.7 12,335.7 4,367.8 12,335.7 Table D.2: Net Wealth to Income Ratios Based on Different Exclusions and
60 per cent of Median Income Poverty Line
Percentile of poor households
Households with negative and zero incomes excluded
Households with negative and zero incomes and self-employed households
(SE3) excluded Net wealth
($’000) Net wealth to income ratio
Net wealth ($’000)
Net wealth to income ratio
10th 9.6 23.0 9.0 20.9 20th 22.1 53.1 19.0 45.9 30th 40.5 118.1 33.7 86.1 40th 111.3 258.6 76.0 200.4 50th 191.0 468.8 166.1 411.9 60th 265.6 689.9 243.9 660.6 70th 347.0 947.8 311.5 898.5 80th 475.8 1,370.7 431.0 1,299.3 90th 716.9 2,255.3 661.0 1,992.8 100th 4,740.7 12,335.7 4,367.8 12,335.7 It is clear that most households with incomes below the poverty line also have low levels of wealth, although a not insignificant proportion of them have considerable wealth, even after deducting net housing wealth.
Figure D.1 indicates that the value of net wealth (before and after the removal of owner-occupied housing wealth) increases rapidly amongst the wealthiest fifth of households with incomes below the poverty line, and accelerates among the wealthiest 10 per cent of these households (which includes a small number of extremely wealthy households).43 The picture is very similar when the higher, 60 per cent of median income poverty line is used (Figure D.2).
43 For example, there are 16 out of the 915 (unweighted) households under the 50 per cent of median
income poverty line who have net non-housing wealth in excess of one million dollars.

POVERTY IN AUSTRALIA
71
Figure D.1: Distribution of Net Wealth and Net Wealth minus Owner Occupied Housing Wealth for Households under the 50 per cent of Median Income Poverty Line
‐500000
0
500000
1000000
1500000
2000000
2500000
3000000
3500000
4000000
4500000
5000000
0 10 20 30 40 50 60 70 80 90 100
Net wealth minus owner occupied housing Net wealth
Percentile
$
To focus more closely on those households below the relevant poverty lines who nevertheless have significant wealth holdings, we examine those with non-housing assets valued above the levels at which the pensions assets test that applied between March and June 2004 started to reduce benefit entitlement, i.e. at $149,500 for a single person or $212,500 for a couple.44
This information is shown in Table D.3. For the no-exclusions poverty measures, between 16 and 18 per cent of poor households have wealth levels above these thresholds (depending upon the poverty line). When we exclude households with zero or negative income or self-employment, this drops to 13 to 15 per cent. If we also exclude households with high expenditures, then the percentage with high wealth levels drops further, to between 10 per cent and 11 per cent of those otherwise defined as poor.
Table D.4 provides some more information on the composition of the ‘wealthy’ poor. Of those households with incomes below the poverty line, those with wealth levels above the pension threshold are much more likely to have the oldest person in the household aged over 55, and this oldest person is most likely to be not in the labour force (i.e retired).
44 For this purpose, the single rate was applied to all households containing a single adult, and the
couple rate to all other households (including multi-family households).

POVERTY IN AUSTRALIA
72
Figure D.2: Distribution of Net Wealth and Net Wealth minus Owner Occupied Housing Wealth for Households under the 60 per cent of Median Income Poverty Line
‐500000
0
500000
1000000
1500000
2000000
2500000
3000000
3500000
4000000
4500000
5000000
0 10 20 30 40 50 60 70 80 90 100
Net wealth minus owner occupied housing Net wealth
Percentile
Table D.3: Percentage of Poor Households with Wealth above Pension Assets Test Limits (weighted percentages)
Poverty line: Poverty definition 50 per cent
median income 60 per cent
median income Henderson poverty
line (simplified) No exclusions
18.3 16.0 18.3
Exclusion 1- households with zero/negative income and/or self-employed
15.0 13.3 14.2
Exclusion 2 – exclusion 1 plus households with equivalised expenditure more than median income
11.2 9.7 10.4
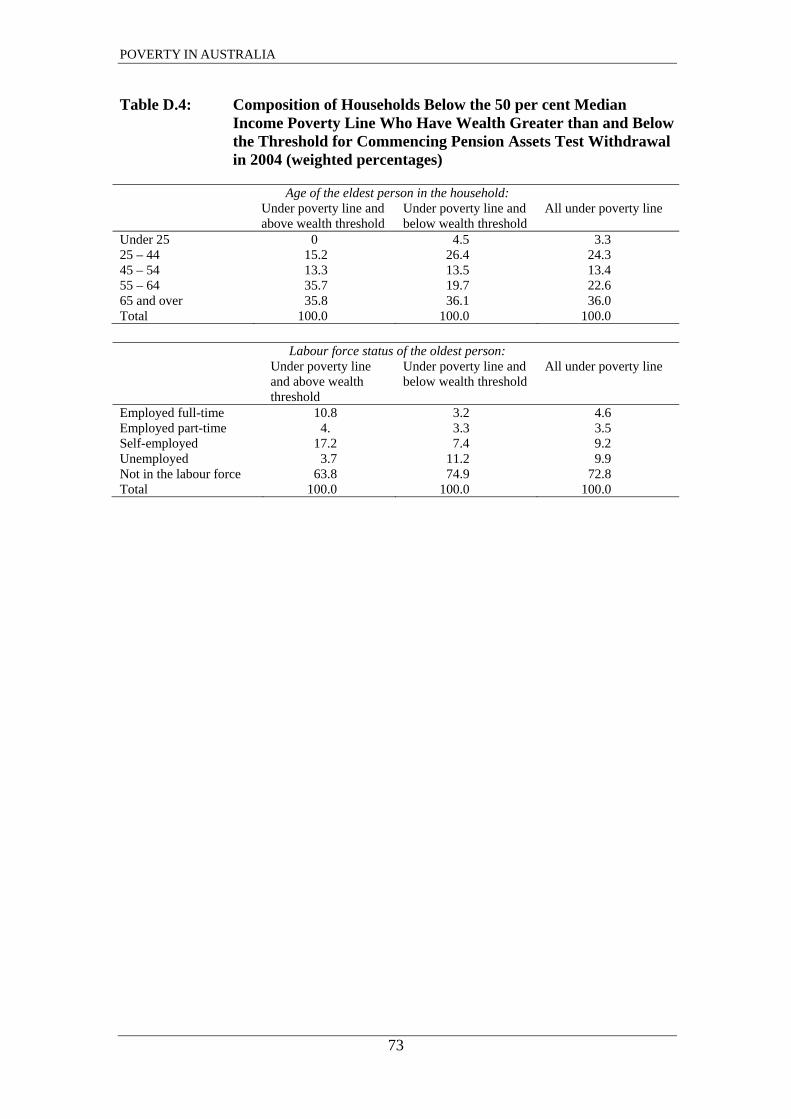
POVERTY IN AUSTRALIA
73
Table D.4: Composition of Households Below the 50 per cent Median Income Poverty Line Who Have Wealth Greater than and Below the Threshold for Commencing Pension Assets Test Withdrawal in 2004 (weighted percentages)
Age of the eldest person in the household: Under poverty line and
above wealth threshold Under poverty line and below wealth threshold
All under poverty line
Under 25 0 4.5 3.3 25 – 44 15.2 26.4 24.3 45 – 54 13.3 13.5 13.4 55 – 64 35.7 19.7 22.6 65 and over 35.8 36.1 36.0 Total 100.0 100.0 100.0
Labour force status of the oldest person: Under poverty line
and above wealth threshold
Under poverty line and below wealth threshold
All under poverty line
Employed full-time 10.8 3.2 4.6 Employed part-time 4. 3.3 3.5 Self-employed 17.2 7.4 9.2 Unemployed 3.7 11.2 9.9 Not in the labour force 63.8 74.9 72.8 Total 100.0 100.0 100.0

POVERTY IN AUSTRALIA
74
Appendix E: Poverty and Financial Stress
The 1998-99 and 2003-04 HES surveys included responses to a series of questions that relate to whether or not the household experienced different forms of financial stress over the previous twelve months. The questions ask specifically if the household’s experience of financial stress (or hardship) reflect their inability to afford certain items or activities due to a shortage of money. The aim of these questions has been to provide an indication of the ability of households to meet their needs within existing resources (income, wealth and access to formal and informal credit) and the responses have been used to estimate the extent of different forms of hardship or financial stress (McColl, Pietsch and Gatenby, 2001; Bray, 2001; Saunders, 2005).
These new questions and the data generated have been a useful supplement to other indicators of hardship (including poverty rates based on income) and similar questions have been included in the Household, Income and Labour Dynamics in Australia (HILDA) survey (see Breunig and Cobb-Clark, 2006). However, the questions relate to only a restricted number of actions that are indicative of hardship or deprivation and cannot therefore be regarded as providing a comprehensive picture of the extent of these problems (Saunders, 2007).
In addition, while the information on income and expenditure collected in the HES refers to the most recent week or fortnight, the financial stress indicators relate to problems experienced over the course of the previous twelve months. Fluctuations in income and deprivation will also not always coincide because those who experience a fall in income may have other resources available that allow them to defer (possible avoid) the resulting increase in hardship or deprivation, while those who have recently escaped income poverty may still experience financial stress while their living standard adjusts (Gordon, 2006).45
For all of these reasons, there is a need for considerable caution to be applied when interpreting the lack of overlap between low income and the incidence of financial stress or hardship. Further issues arise in relation to the reliance in the questions on actions that have arisen because of a shortage of money. Although this qualification has been included to eliminate those households who have chosen not to have the specific items referred to in the question from being included in the financially stressed group, the distinction between ‘don’t want’ and ‘cannot afford’ is problematic both conceptually and practically (McKay, 2004; Saunders, 2007). These qualifications need to be borne in mind when reviewing the evidence on financial stress.
Above all, the financial stress variables are indicators, not measures. They are also relatively new and more research is required before we have a full understanding of the implications for poverty as conventionally understood and measured. For all of these reasons, it would be premature to place too much weight on these results until we have a better understanding of the nature and impact of financial stress.
45 It is possible to examine the impact of this disjuncture using the longitudinal HILDA data,
although this is not possible with HES.

POVERTY IN AUSTRALIA
75
Table E.1 shows the full list of financial stress questions included in the 2003-04 HES. There are sixteen questions in total but attention is focused on the thirteen indicators that relate to specific forms of hardship, i.e. the seven actions taken due to a shortage of money and the six forms of activity that could not be afforded. (The remaining three questions – shown in italics in Table E.1 - relate to subjective perceptions of the overall circumstances of the household, including how their living standard has changed, do not relate directly to financial stress, and raise additional issues of interpretation).
Table E.1: Financial Stress Questions Included in HES 2003-04
Actions taken over the last year due to a shortage of money:
Cannot afford to participate in certain activities:
Assistance sought from welfare/ community organisations
A night out once a fortnight
Pawned or sold something A special meal once a week Sought financial help from friends/family Have friends or family over for a meal once a
month Unable to heat home A holiday away from home for at least one week a
year Went without meals Household members buy second hand clothes
most of the time (cannot afford brand new clothes)Could not pay gas/electricity/telephone bill on time
Household members do not spend time on leisure or hobby activities
Could not pay registration/insurance on time Other items: Ability of household to raise emergency money ($2,000 within a week)
Management of household income Present standard of living compared with 2 years ago
Poverty and financial stress are different concepts that are measured in different ways. Combining them into a single index or measure of deprivation is therefore difficult from both a theoretical and empirical viewpoint. However, we examine here in a preliminary way the relationship between poverty and financial stress as measured using these indicators. The approach adopted involved examining the incidence of reported stress for those households with incomes below the 50 per cent of median income poverty line, and for those whose incomes are between 50 per cent and 60 per cent of median income, i.e. those who lie between the two median income poverty lines (based on the sample that results after excluding those with zero and negative incomes).
Figures E.1 and E.2 show the cumulative distributions of the number of financial stress indicators experienced by households with incomes less than 50 per cent of median income, and by households with incomes between 50 per cent and 60 per cent of median income. In both cases, a simple index (or score) has been derived by summing together all of the separate indicators (out of a maximum total of 13) that each household experienced over the previous twelve months, and Figures E.1 and E.2 plot the distribution of these scores for households with low incomes.
In relation to the former measure, 64 per cent of individuals in households with incomes below the 50 per cent median poverty line report at least one financial stress indicator, while 36 per cent report a zero score on the financial stress index. A similar

POVERTY IN AUSTRALIA
76
percentage of individuals in households with incomes between 50 per cent and 60 per cent of the median report no, or at least one, indicator of financial stress.
Beyond that, Figures E.1 and E.2 show that the levels of financial stress rise steadily, with around one-quarter of households below the 50 per cent of median income poverty line experiencing four or more indicators and significant numbers experiencing more pronounced multiple combinations of financial stress. It is also clear that the financial stress profiles shown in Figures E.1 and E.2 are very similar, which suggests that those with incomes slightly above the 50 per cent threshold fare little better when it comes to avoiding financial stress. The overall mean financial stress scores for those with incomes below 50 per cent of the median, between 50 per cent and 60 per cent of the median, and below 60 per cent of the median are 2.20, 2.26 and 2.23, respectively. The similarity between these scores supports the case for adopting the higher line when using the financial stress indicators to shed light on poverty.
Table E.2 shows the distribution of financial stress among people who are identified as poor under the different exclusion populations. The correlation between stress and poverty increases as more groups are excluded from the poverty population. For example, using the 50 per cent poverty line, if no exclusions are applied, then 37 per cent of individuals live in households reporting no financial stresses. Once those with zero or negative incomes are excluded, this figure declines to 34 per cent, and if those with high expenditures are also excluded, it declines further to 29 per cent reporting no financial stresses. In contrast, the percentage of individuals who experience four or more financial stress indicators incresaes from 27 per cent to 34 per cent when the two exclusions are applied. A similar pattern applies if the other poverty lines are used.

POVERTY IN AUSTRALIA
77
Figure E.1: The Number of Financial Stress Indicators Experienced by Households Below the 50 per cent of Median Income Poverty Line (cumulative distribution of number of financial stress indicators)
0
2
4
6
8
10
12
0 10 20 30 40 50 60 70 80 90 100
Number of financial stress indicators
Percentile

POVERTY IN AUSTRALIA
78
Figure E.2: The Number of Financial Stress Indicators Experienced by Households with Incomes Between 50 per cent and 60 per cent of Median Income (cumulative distribution of number of financial stress indicators)
0
2
4
6
8
10
12
0 10 20 30 40 50 60 70 80 90 100
Number of financial stress indicators
Percentile

POVERTY IN AUSTRALIA
79
Table E.2: Distribution of Financial Stress Indicators for People in Households Below the Poverty Line (percentages)
Poverty line: Number of financial stress indicators
50 per cent median income
60 per cent median income
Henderson poverty line (simplified)
No exclusions: Zero 37.0 35.7 34.6 One 15.0 15.7 16.7 Two 13.2 13.1 12.2 Three 7.5 8.5 6.7 Four or more 27.4 27.0 29.8 Total 100.0 100.0 100.0
Exclusion 1- households with zero/negative income and/or self-employed: Zero 34.4 33.7 31.3 One 14.4 14.9 15.6 Two 12.9 13.4 12.3 Three 8.5 9.3 7.8 Four or more 29.8 28.6 33.0 100.0 100.0 100.0
Exclusion 2 – exclusion 1 plus households with equivalised expenditure more than median income: Zero 28.6 29.9 26.6 One 14.9 15.5 16.5 Two 14.4 14.3 12.8 Three 8.2 9.5 7.6 Four or more 33.9 30.9 36.6 100.0 100.0 100.0

POVERTY IN AUSTRALIA
80
References
Australian Bureau of Statistics (ABS, 2002), ‘Upgrading Household Income Distribution Statistics’ in Australian Economic Indicators, April 2002, Catalogue No. 1350.0, ABS, Canberra, pp. 3-8.
ABS (2003), ‘Revised Household Income Distribution Statistics’, in Australian Economic Indicators, June 2003, Catalogue No. 1350.0, ABS, Canberra, pp. 3-15.
ABS (2004), Household Income and Income Distribution, Australia 2002-03, Catalogue No. 6523.0, ABS, Canberra.
ABS (2005), Household Income and Income Distribution, Australia 2003-04, Catalogue No. 6523.0, ABS, Canberra.
ABS (2006a), Information Paper. Household Expenditure Survey and Survey of Income and Housing. User Guide, Australia 2003-04, Catalogue No. 6503.0, Canberra.
ABS (2006b), Measures of Australia’s Progress, 2006, Catalogue No. 1370.0, ABS, Canberra.
Barrett, G., Crossley, T. and Worswick, (2000), ‘Consumption and Income Inequality in Australia’, Economic Record, Vol. 76, pp. 116-38.
Bradshaw, J. and Finch, N. (2003), ‘Overlaps in Dimensions of Poverty’, Journal of Social Policy, Volume 32 (4), pp. 513-525.
Bray, J. R. (2001), Hardship in Australia. An Analysis of Financial Stress Indicators in the 1998-99 Australian Bureau of Statistics Household Expenditure Survey, Occasional Paper No. 4, Department of Family and Community Services, Canberra.
Breunig, R. and Cobb-Clark, D., (2006), ‘Understanding the Factors Associated with Financial Stress in Australian Households’, Australian Social Policy 2005, pp. 13-64.
Combat Poverty Agency (2002), Combating Poverty in a Changing Ireland: Combat Poverty Agency Strategic Plan 2002-2004, Combat Poverty Agency, Dublin.
Department for Work and Pensions (2003), Measuring Child Poverty Consultation: Preliminary Conclusions, Department for Work and Pensions, London.
Gordon, D. (2006), ‘The Concept and Measurement of Poverty’ in C. Pantazis, D. Gordon and R. Levitas (eds.), Poverty and Social Exclusion in Britain. The Millennium Survey, The Policy Press, Bristol, pp. 29-69.
Harding, A, and Greenwell, H. (2002), ‘Trends in Income and Expenditure Inequality in the 1980s and 1990s: A Re-examination and Further Results’, Discussion Paper No. 57, National Centre for Social and Economic Modelling, University of Canberra.
Harding, A., Lloyd, R. and Greenwell, H. (2001), Financial Disadvantage in Australia 1990 to 2000. The Persistence of Poverty in a Decade of Growth, The Smith Family, Sydney.

POVERTY IN AUSTRALIA
81
Harding, A. and Szukalska, A. (2000), Financial Disadvantage in Australia – 1999. The Unlucky Australians?, The Smith Family, Sydney.
Headey, B. (2007), ‘HILDA’s Financial Accounts: Their Value for Developing Improved Assessments of Economic Well-being and Poverty’, presented to the 3rd HILDA Users’
Henderson, R. F., Harcourt, A. and Harper, R. J. A. (1970), People in Poverty. A Melbourne Survey, Cheshire for the Institute of Applied Economic and Social Research, Melbourne.
Johnson, D. (1987), ‘The Calculation and Use of Poverty Lines in Australia’, Australian Economic Review, 4th Quarter, pp. 45–55.
King, A. (1998), ‘Income Poverty Since the 1970s’, in R. Fincher and J. Niewenhuysen (eds), Australian Poverty: Then and Now, Melbourne University Press, Melbourne, pp. 71–102.
McColl, R., Pietsch, L. and Gatenby, J. (2001), ‘Household Income, Living Standards and Financial Stress’, Australian Economic Indicators: June 2001, Catalogue No. 1350.0, ABS, Canberra, pp. 13–32.
McKay, S. (2004), ‘Poverty or Preference? What Do ‘Consensual Deprivation Indicators’ Really Measure?’ Fiscal Studies, Vol. 25, No. 2, pp. 201-23.
Melbourne Institute (2007), Poverty Lines: Australia. December Quarter 2006, The Melbourne Institute, University of Melbourne.
Nolan, B. and Whelan, C. T. (1996), Resources, Deprivation and Poverty, Clarendon Press, Oxford.
Pietsch, L., McColl, B. and Saunders, P. (2006), ‘The Sensitivity of Income Distribution Measures to Changes in Survey Collection Tools and Estimation Techniques in Australia’, presented at the 29th General Conference of the International Association for Research on Income and Wealth, Jeonsuu, Finland, August.
Saunders, P. (1997), ‘Living Standards, Choice and Poverty’, Australian Journal of Labour Economics, Vol. 1, pp. 49-70.
Saunders, P. (1998), ‘‘Setting the Poverty Agenda: The Origins and Impact of the Henderson Report’, in J. Nieuwenhuysen and R. Fincher (eds) Poverty: Then and Now, Melbourne University Press, pp. 325-350.
Saunders, P. (2005), The Poverty Wars: Reconnecting Research with Reality, UNSW Press, Sydney.
Saunders, P. (2006), ‘Identifying the Essentials of Life’ SPRC Newsletter No. 94, November, pp. 9-12.
Saunders, P. (2007), ‘Deprivation in Australia’, SPRC Newsletter No. 96, May, pp. 7-10.
Saunders, P. and Bradbury, B. (1991), ‘Some Australian Evidence on the Consensual Approach to Poverty Measurement’, Economic Analysis and Policy, Vol. 21, No. 1, pp.47-78.
POVERTY IN AUSTRALIA
82
Saunders, P. and Bradbury, B. (2006), ‘Monitoring Trends in Poverty and Income Distribution: Data, Methodology and Measurement’, Economic Record, Vol. 82, No. 258, pp. 341-64.
Siminski, P., Saunders, P, and Bradbury, B. (2003), ‘Reviewing the Inter-temporal Consistency of ABS Household Income Data Through Comparisons with External Aggregates’, Australian Economic Review, Vol. 36, No. 3, 2003, pp. 333-49.
Whelan, C. T., Layte, R. and Maître, B. (2003), ‘Persistent Income Poverty and Deprivation in the European Union: An Analysis of the First Waves of the European Community Household Panel’, Journal of Social Policy, Vol. 32, No. 1, pp. 1-18.
Wilkins, R. (2007), ‘The Changing Socio-Demographic Composition of Poverty in Australia: 1982 to 2004’, Working Paper No. 12/07, Melbourne Institute of Applied Economic and Social Research, University of Melbourne.