poverty, material hardship, and depression - brown.uk.com · epidemiology by providing a direct...
TRANSCRIPT
Poverty, Material Hardship,and Depressionn
Colleen M. Heflin, University of Missouri
John Iceland, Pennsylvania State University
Objective. Mental health disorders are of great social, economic, and policy con-cern. A higher incidence of major depressive disorder has been reported amongwomen living in or near poverty. Our study examines the extent to which therelationship between income and depression is mediated by measures of materialhardship. Methods. We use measures of depression at two points in time from thelongitudinal Fragile Families Survey to better discern the causal direction of therelationship between income poverty, hardship, and depression. More specifically,we use conditional logistic fixed-effect models that control for time-invariant un-measured heterogeneity in the sample. Results. We found a strong relationshipbetween hardships and depression. The most prominent hardships were problemspaying bills and phone turned off. We also found that hardship helped mediatemuch, though not all, of the link between poverty and depression in the conditionalfixed-effects logistic regression models. Conclusion. Our policy simulations suggestthat public health efforts to reduce depression may be enhanced from efforts thatfocus on specific forms of material hardship.
Mental health disorders are of great social, economic, and policy concern.Mental health is defined according to the Surgeon General as ‘‘a state ofsuccessful performance of mental function, resulting in productive activities,fulfilling relationships with other people, and the ability to adapt to changeand to cope with adversity’’ (U.S. Department of Health and Human Ser-vices, 1999:vii). Furthermore, mental health is required for an individual tomaintain social relationships with others and contribute to society.
At the individual level, the general association between health and incomeis well established and has been found in different places, time periods,genders, and ages (Lynch et al., 2004; Adams et al., 2003). In terms ofmental health disorders, Kessler et al. (1994) report a higher lifetime and 12-month incidence of depressive, anxiety, and substance use disorders amonglow-income individuals. More recently, Kessler et al. (2003) report a higher12-month incidence of major depressive disorder among those living in ornear poverty. Adults with serious psychological distress were more likely to
nDirect correspondence to Colleen M. Heflin, Truman School of Public Affairs, Uni-versity of Missouri, Columbia, MO 65211 [email protected]. Heflin will share alldata and coding information necessary to replicate the study.
SOCIAL SCIENCE QUARTERLY, Volume 90, Number 5, December 2009r 2009 by the Southwestern Social Science Association

have less than a high school degree (34 percent) than those without seriouspsychological distress (17 percent). Additionally, adults with serious psycho-logical distress were more likely to have family income below $20,000 (44percent) than those without (20 percent) (Pratt, Dey, and Cohen, 2007).
The relationship between income and mental health is not just found atthe very bottom of the income distribution or for those living below thefederal poverty line. There is a clear income gradient to health such thatevery step above the poverty line is associated with an incremental im-provement in health (Lynch et al., 2004; Ecob and Smith, 1999). While it isclear that depression results in lost income (Marcotte and Wilcox-Gok,2001; Kessler et al., 2006; Greenberg et al., 2003), there is a growingconsensus that socioeconomic disadvantage precedes poor mental health.Although reverse causation—poor mental health leading to lower earn-ings—is present, it is no longer considered the primary mechanism behindthe association between income and health (Lynch et al., 2004). Severallongitudinal studies have specifically examined the relationship between de-pression and socioeconomic status and concluded that the causal directionruns from socioeconomic status to depression (Muntaner et al., 2004;Miech et al., 1999; Johnson et al., 1999). Thus, exploring new dimensionsalong which the income-mental health gradient may operate is of substantialinterest.
At the present time, most recent research on mental health outcomescontinues to include either a measure of poverty, income, or socioeconomicstatus in the models (Perreira et al., 2005; Hawkins and Booth, 2005;Turner, Taylor, and Van Gundy, 2004; Serido, Almeida, and Wethington,2004; Evenson and Simon, 2005). There is no research explicitly examininghow material hardship mediates the effect of poverty on mental health.Moreover, the relatively few studies that looked at the broader associationbetween hardship and mental health suffer from two limitations (Heflinet al., 2005; Heflin et al., 2007; Laraia et al., 2006; Casey et al., 2004). First,they tended to focus on only one type of hardship. In this project, weexpand the scope to include five dimensions of hardship. Looking at mul-tiple forms of hardship allows us to determine if some forms are associatedmore closely with depression than others. Second, previous work relied oncross-sectional data or data from community-based studies. We use longi-tudinal data collected in the Fragile Families Survey—a survey of births incities with populations greater than 200,000 in 1999 in the United States.This allows us to conduct more precise causal modeling, via conditionallogistic fixed-effect models, that explicitly incorporates time-invariant un-measured heterogeneity. The data also provide insight on a population(households with new births) vulnerable to poverty and hardship and thathave been the focus of policy interventions in recent years, such as throughwelfare reform initiatives. Finally, we contribute to literature in socialepidemiology by providing a direct test of the extent to which the relation-ship between income and depression is mediated by material conditions.
1052 Social Science Quarterly

The Relationship Between Poverty and Material Hardship
Poverty is usually defined and operationalized by researchers in terms ofincome deprivation. The ‘‘official’’ U.S. poverty measure—the focus here—has two components: poverty thresholds and the definition of family incomethat is compared to these thresholds. The thresholds were originally devisedin the 1960s to represent the cost of a minimum diet multiplied by three toallow for expenditures on other goods and services. The thresholds vary byfamily size and age of household members, and have been updated yearly forinflation using the Consumer Price Index (CPI). The poverty threshold for afamily of two adults and two children was $19,806 in 2005. The definitionof family resources used consists of gross annual cash income from allsources, such as earnings, pensions, interest income, rental income, assetincome, and cash welfare. A family and its members are considered poor iftheir income falls below the poverty threshold for a family of that size andcomposition.
Many researchers have since noted the technical deficiencies of the officialpoverty measure (Ruggles, 1990; Citro and Michaels, 1995; Iceland, 2006).For example, the poverty lines, originally devised by multiplying the cost offood needs by three to account for other needs (such as clothing and shelter),no longer capture families’ basic needs because people today spend closer toone-seventh of their income on food rather than one-third. The definition ofmoney income used in the official measure—gross cash income—also in-adequately captures the amount of money people have at their disposal tomeet basic needs by omitting noncash transfers (such as housing subsidies).In tandem with these technical criticisms of the income poverty measure,there is a growing interest in using measures of material hardship to identifyindividuals who do not consume minimal levels of basic goods and servicessuch as food, housing, clothing, and medical care (Beverly, 2001; Bousheyet al., 2001; Ouellette et al., 2004). Many argue that the U.S. public is orshould be more concerned with meeting a basic set of needs instead ofproviding a basic level of income (Mayer and Jencks, 1989; Rector, Johnson,and Youssef, 1999).
The empirical literature on the association between income poverty andvarious hardship measures indicates that they are only moderately correlatedwith one another in the United States (Mayer and Jencks, 1989, 1993;Mayer, 1995; Rector, Johnson, and Youssef, 1999; Beverly, 2000; Bousheyet al., 2001; Perry, 2002; Bradshaw and Finch, 2003). On the one hand,poor people are more likely than nonpoor people to report a variety ofmaterial hardships. For example, Boushey et al. (2001) reported that whileabout 13 percent of respondents under 200 percent of the poverty levelreported not having enough food to eat, only 2 percent of those over 200percent of the poverty line said the same. While 25 percent of those under200 percent of the poverty line were unable to make housing or utilitypayments, the figure for those above 200 percent of the poverty line was 8
Poverty, Material Hardship, and Depression 1053
percent. On the other hand, as these findings indicate, many people withlow income do not report various types of material hardship, and somepeople who are not poor do. One of the best-developed measures of materialhardship, the Food Security Scale, correlates with income and poverty atapproximately 0.33 (Hamilton et al., 1997).
Iceland and Bauman (2004) find that income poverty is more stronglyassociated with some hardship measures, such as food insecurity, difficultypaying bills, and possession of consumer durables, and less strongly asso-ciated with others, including housing and neighborhood problems and fearof crime. They conclude that various hardship measures, often by design, tapinto distinct dimensions of well-being. Income poverty measures capture theflow of income that can be used to meet recurring needs, and by and largedo not attempt to take into account the stock of resources at people’sdisposal. Thus, neither a household’s wealth nor its debt is typically includedin these measures. Many of the material hardship measures, however, in-directly take a household’s wealth or debt into account. There are likelysome people with tremendous wealth who do not work and thus lookincome poor but may report no hardships. Conversely, there are people withhigh incomes who either hit a rough financial patch and report hardships, orwho have high fixed costs and may have trouble meeting basic expenses.1 Forprecisely some of these reasons, we believe it is important to investigate therelationship between health and both income poverty and material hardshipmeasures. We explore the consequences of using an income measure tied tothe federal poverty thresholds versus a material-hardship-based measure tomodel the risk of depression in a sample of mothers with new births.
Material Resources as Determinants of Depression
The premise that material hardship may mediate the income–mental-health relationship is based on what is known in the social epidemiologyfield as the neomaterial approach (Lynch et al., 2000). In the neomaterialtradition, material hardship measures could have a negative impact onmental health through a direct effect of nutritional shortfalls, exposure tounhealthy housing conditions, or deterioration in other basic living con-ditions. Previous research focused on components of the public infrastruc-ture such as education, health services, transportation, environmental andoccupational controls, quality of food, and quality of housing (Lynch et al.,2000).
At the individual level, research has focused on parsing out the relativecontribution of different mechanisms through which disadvantage may
1For a conceptual model outlining possible determinants of material hardship, see Heflin,Corcoran, and Siefert’s (2007) discussion of possible determinants of food insufficiency inwhich economic resources are only one factor. Other factors discussed include other types ofresources, household demands, and individual characteristics that may interfere with theability to cope with scarce resources.
1054 Social Science Quarterly

affect health over the lifecourse (Miech et al., 1999). For example, Macleodand colleagues (2002, 2005) have explored the relative contribution of ob-jective and subjective social status to health. Macleod and colleagues (2005)report that objective material conditions (such as lack of access to car orfather’s manual occupation), particularly those experienced earlier in life, area more important determinant of health than perceptions of relative status.
Previous research pointedly debates the contribution of psychosocial andneomaterial measures to health (Macleod and Smith, 2003; Muntaner et al.,2004); however, currently, no individual-level studies have empiricallydifferentiated the effects of income from measures of material well-being onmental health. This omission is largely the result of the conceptualization ofsocioeconomic status as a measure that encompasses an individual’s income,education, and occupation (see, e.g., Miech et al., 1999). Yet, the popu-lation statistics that are viewed by policymakers and public health officialsare usually released with results by income level and/or poverty status alone.Thus, understanding the extent to which income directly affects mentalhealth and the extent to which it operates through material conditions isquite relevant.
It is important to note that there are a myriad of causal pathways betweenincome and mental health that likely operate outside of variation in materialhardship experiences (e.g., neighborhood effects). Therefore, while we ex-pect material hardship to mediate a prime amount of the income–mental-health relationship, we expect that we have not captured all the possiblecausal pathways through which income can affect mental health. As a result,although we expect the direct effect to diminish in models containing ma-terial hardship, we expect that income will continue to be an importantpredictor of mental health.
Data
For this study, we analyze data from two waves of the Fragile Families andChild Wellbeing Study (FF), a longitudinal survey of 4,700 children. FFfollows a cohort of newborn children and their parents in 20 U.S. cities(located in 15 states). A multistaged sampling design was used to randomlysample cities, hospitals within cities, and then births within hospitals. Base-line interviews were conducted with a probability sample of 3,712 unmar-ried mothers and a comparison group of 1,196 married mothers from 1998to 2000. Mothers were interviewed in the hospital at the time of their child’sbirth (baseline) and over the telephone one and three years later. Trainedinterviewers conducted face-to-face interviews with the mothers betweenFebruary 1998 and September 2000. One-year follow-up interviews wereconducted between June 1999 and March 2002. The three-year follow-upinterviews were conducted between April 2001 and December 2003 (Reich-man et al., 2001). This project utilizes data from the one-year and three-year
Poverty, Material Hardship, and Depression 1055

follow-up interviews and is restricted to mothers with valid data on allvariables in the model.
One limitation of the data is that they are not necessarily representative ofthe experiences of the population as a whole, particularly those living outsidemajor metropolitan areas or households without children. The associationbetween poverty, hardship, and depression could indeed differ among otherpopulations. Nevertheless, the population here is of particular interest tomany policymakers and the public who seek to bolster the long-term well-being of these young families and their children. Additionally, no nationallyrepresentative data sets contain information on depression, income poverty,and multiple domains of material hardship.
Measures
Mental health will be assessed using an indicator for major depressivedisorder based on the definitions and criteria specified in the revised thirdedition of the American Psychiatric Association’s Diagnostic and StatisticalManual of Mental Disorders (DSM-III-R) (APA, 1987). The depressiondiagnosis is operationalized based on the 12-month screening version of theWorld Health Organization’s (WHO) Composite International DiagnosticInterview (CIDI) (WHO, 1990; Kessler et al., 1998). The CIDI is a struc-tured interview schedule designed to be used by trained interviewers whoare nonclinicians to assess the prevalence of specific psychiatric disorders(Robins and Regier, 1990). WHO field trials (Wittchen, 1994) and othermethodological studies (Blazer et al., 1994) have demonstrated acceptabletest-retest reliability and clinical validity of CIDI diagnoses. The measure isused here as a binary variable where a value of 1 indicates that the womanmeets the screening criteria for depression.
FF contains information on five types of material well-being at two pointsin time. In keeping with standard practice, each form of material hardship isrepresented with a dichotomous measure that indicates if the domain ifpresent (or not). The following questions are asked after the introductoryquestion is asked. ‘‘We are also interested in some of the problems familiesface making ends meet. In the past 12 months, did you do any of thefollowing because there wasn’t enough money?’’ FREE FOOD is indicated ifthe respondent answered in the affirmative to the question: ‘‘In the past 12months, did you receive free food or meals?’’2 Respondents were asked ifthey did not pay the full amount of rent or mortgage, did not pay the full
2This is not the strongest measure of food hardship. Other measures typically used includethe single-item food insufficiency question or the full 18-item Food Security Scale created bythe U.S. Department of Agriculture and included in the Current Population Survey and thePanel Study of Income Dynamics, among other surveys. However, since prior research has sostrongly indicated a relationship between food hardship and mental health, rather than leavethis dimension of material hardship out of the study, we include it but fully appreciate itsweaknesses.
1056 Social Science Quarterly

amount of a gas, oil, or electricity bill, or had to borrow money from friendsor family to help pay bills. If any of these three items is answered affirma-tively, the respondent is coded as having DIFFICULTY PAYING BILLS. LACK OF
MEDICAL CARE is indicated if the respondent answered in the affirmative to thequestion: ‘‘In the past 12 months, was there anyone in your household whoneeded to see a doctor or go to the hospital but couldn’t go because of thecost?’’ TELEPHONE TURNED OFF is indicated by an affirmative response to thequestion: ‘‘In past year, was telephone service ever disconnected?’’ Respon-dents were asked if they were evicted for nonpayment; stayed at a shelter, inan abandoned building, an automobile, or any other place not meant forregular housing even for one night; or moved in with other people even for alittle while because of financial problems. If any of these three items isanswered affirmatively, the respondent is coded as having UNSTABLE HOUSING.
Finally, we include standard control variables in models of mental health.Education level is captured at three levels: LESS THAN HIGH SCHOOL, HIGH
SCHOOL GRADUATES, MORE THAN HIGH SCHOOL. Race is measured with a seriesof dummy variables as WHITE if the respondent self-identified herself as non-Hispanic white; BLACK indicates non-Hispanic black; HISPANIC indicates thatthe respondent self-identified as Hispanic; and OTHER indicates NativeAmerican, Asian, or some other combination. AGE indicates the women’sage and has a range from 18 to 53. NUMBER OF CHILDREN indicates the totalnumber of children in the household under age 18. AGE OF YOUNGEST CHILD
indicates the age of the youngest children in the household under age 18.3
Marital status is controlled with three categorical variables—married, wid-owed/divorced, and never married, with the latter category serving as theomitted reference group. A measure of global self-rated health is included asa dichotomous variable with ‘‘fair’’ or ‘‘poor’’ health equal to 1 and ‘‘ex-cellent,’’ ‘‘very good,’’ or ‘‘good’’ health equal to 0. Finally, we create a seriesof measures of the ratio of total household income to the federal povertythreshold for the family size for less than 1.0 (the poverty line), an income toneeds ratio between 1.0 and 1.5, an income to needs ratio between 1.5 and2.0, an income to needs ratio between 2.0 and 4.0, and an income to needsratio greater than 4.0. This produces a common set of cutoffs that also havesufficient sample representation. All variables, with the exception of race, aretime varying as indicated in Table 1.
Methods
To estimate the relationship between depression and material well-being,we estimate a series of pooled cross-sectional and conditional logistic re-
3Variation in age of child comes from two sources. First, while the follow-up interviews areideally completed 12 months and 36 months after birth of the child, in reality there is a quite abit more variation. Second, in some cases, mothers have had additional children by the 36-monthfollowup.
Poverty, Material Hardship, and Depression 1057
gression models. The statistical model can be specified as:
ProbðYit ¼ 1Þ ¼ LðB0 þ B1Xi þ B2Zi þ tt þ eiÞ; ð1Þwhere Yi is the mental health outcome of individual i at time t. L representsthe logistic cumulative distribution function. X is a vector of measures ofmaterial well-being discussed above. Z is a vector of individual character-istics that have been shown to be associated with mental health. This in-cludes age, race, marital status, educational level, presence of children, age ofchildren, and physical health. Finally, t is a year indicator that controls forunmeasured factors associated with time. For all the logit models, Huber-White standard errors are presented and the standard errors are corrected to
TABLE 1
Descriptive Statistics (Unweighted)
Year 1 Followup%
Year 3 Followup%
Depression 15.9% 20.1%Material Hardship
Lack of medical care 5.3% 6.1%Free food 7.8% 9.6%Phone turned off 12.9% 20.9%Unstable housing 12.1% 9.7%Problems paying bills 39.0% 37.9%
Income to Needs Ratioo1.0 (reference group) 43.4% 41.1%1.0 too1.5 14.1% 13.9%1.5 too2.0 10.5% 11.5%2.0 too4.0 21.9% 21.8%� 4.0 10.2% 11.7%
Demographic ControlsLess than high school (reference group) 31.2% 29.6%High school diploma 30.6% 29.7%More than high school 38.7% 42.5%Mean number of children 2.3 2.4Mean age of youngest child 1.2 2.0Poor/fair self-reported health 13.0% 12.7%Mean age of householder 26.5 28.2White (reference group) 23.5% 23.7%African American 47.9% 47.6%Hispanic 24.9% 24.9%Other 3.8% 3.7%
Marital StatusMarried 35.0% 37.6%Divorced/widowed 8.7% 10.4%Never married (reference group) 56.3% 52.0%
Sample size 3,541 3,516
1058 Social Science Quarterly

account for the intraindividual correlation using the cluster subcommand inSTATA 10.0.
Once we determine if there is a direct relationship between material well-being and mental health, we then explore the extent to which this relation-ship modifies the relationship between mental health and poverty with thefollowing two models:
ProbðYit ¼ 1Þ ¼ LðB0 þ B1POVi þ B2Zi þ tt þ eiÞ; ð2Þwhere POV indicates a vector of categories indicating the income-to-needsratio of individual i, and the other terms are defined as above. Note that inthis model we exclude the X vector of measures of well-being in order tocapture the direct effect of poverty on health status.
ProbðYit ¼ 1Þ ¼ LðB0 þ B1POVi þ B2Zi þ B3Xi þ tt þ eiÞ ð3ÞFinally, in Equation (3), we examine the extent to which the marginal
effect of poverty on health status (B1) declines in the presence of the vectorof material well-being measures.
We begin by presenting results from the three models using the pooledcross-section.
Next, we consider the possibility that unmeasured heterogeneity is drivingthe relationship between material hardship and depression. Specifically, it ispossible that women who have a latent propensity to experience emotionaldistress may also have a latent propensity to suffer from unmet medical needand/or other material hardships. To consider this possibility we rewrite theerror term in Equations (1) to (3) as the standard error components forpanel data models ei 5Zit1ji, where ji captures person-specific and time-invariant unobserved heterogeneity and Zit is an independently and iden-tically distributed random error term.
To consider this possibility, we estimate conditional fixed-effect logisticregression models. Thus, our three models above become:
ProbðDYit ¼ 1Þ ¼ LðB1DXi þ B2DZi þ ZitÞ ð4Þ
ProbðDYit ¼ 1Þ ¼ LðB1DPOVi þ B2DZi þ ZitÞ ð5Þ
ProbðDYit ¼ 1Þ ¼ LðB1DPOVi þ B2DZi þ B3DXi þ ZitÞ ð6Þwhere D refers to the two-year difference operator such that DYi 5 Y2i�Y1i
for our measure of depression. The fixed-effect models include the same listof covariates as Equations (1)–(3). However, because the model uses vari-ation within an individual over time, factors that do not vary over time areunidentified. Additionally, coefficients are identified only using those indi-viduals with changes in depression status over the two waves of observation.In other words, neither women who never meet the criteria for depressionnor those who meet the criteria for depression at both waves are used toestimate the coefficients. As such, results from these models may not be
Poverty, Material Hardship, and Depression 1059

generalizable to the full sample of households with children in the 20 mostpopulous cities in the United States. Finally, unobserved factors that varyover time will continue to bias the estimated coefficients. For example, if awoman’s household management abilities change over time and are corre-lated with material hardship and mental health, then failing to control forthis variable would bias the estimates of the material hardship coefficients.Results may be interpreted as the change in the log odds of meeting thescreening criteria for depression associated with a unit change in materialhardship (or income to needs category).
Results
Sample Description
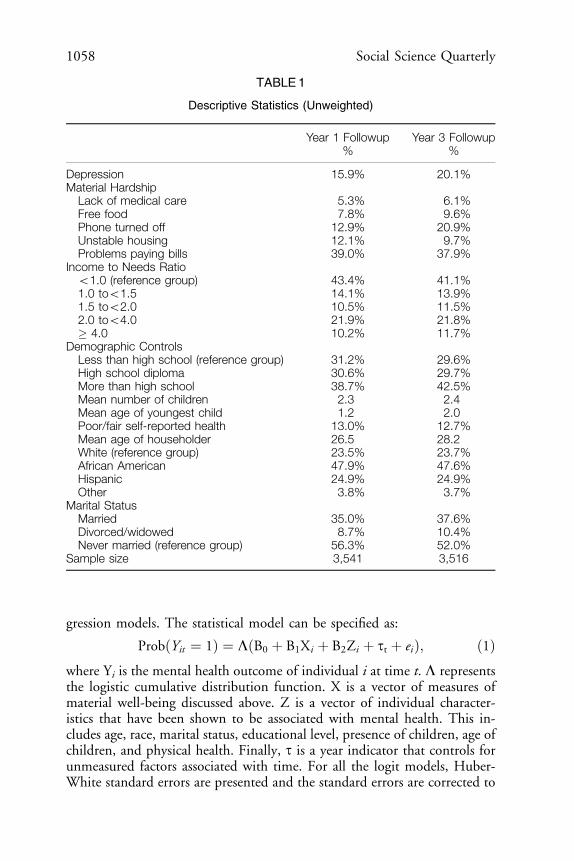
Table 1 presents descriptive statistics (means and standard deviations) forselected outcomes and demographics for the unweighted data at the Year 1and Year 3 follow-up interviews (hereafter Y1 and Y3). As indicated, 15.9percent of respondents meet the criteria for major depression disorder at Y1and 20.1 percent at Y3. This is higher than the 12-month national averagefor all women, 12.9 percent, but consistent with the finding that rates ofaffective disorders, which include major depression, decline monotonicallyas income and education increases (Kessler et al., 1994). Forty percent ofwomen had an improvement in depression status (1 to 0) and 60 percenthad a worsening of depression status (0 to 1) between the two observationpoints.
Reflecting the high rates of poverty that children in the United States areexposed to and the sampling focus of the FF data (urban births with anoversample of unmarried mothers), the prevalence of hardship and povertyare relatively high among the sample respondents. In terms of reports ofmaterial hardship, approximately 39.0 percent report having difficulty pay-ing bills at Y1, 12.9 percent report having a phone turned off, 12.1 percentreport having unstable housing, 7.8 percent report receiving free food ormeals, and 5.3 percent report an unmet medical need at Y1. The incidenceof hardships is similar at Y3, with the exception of having a phone turnedoff, which rises to 20.9 percent. In terms of income-to-needs levels, 43.4percent are under the poverty line; 14.1 percent are just above the povertyline with income to needs ratios between 1.0 and 1.5; 10.5 percent are nearpoor with income to needs ratios between 1.5 and 2.0; 21.9 percent haveincome to needs ratios between 2.0 and 4.0; and 10.2 percent have incometo needs ratios above 4.0 at Y1. In terms of education, 31.2 percent have lessthan a high school education, 30.6 percent have a high school diploma, and38.7 percent have education past the high school level at Y1. Both incomeand education levels rise slightly between the Year 1 and Year 3 follow-upinterviews.
1060 Social Science Quarterly
Pooled Cross-Sectional Models
In Table 2 we present the results of the pooled cross-sectional models. Inthe first set of columns we present results of the logistic regression modelthat examines the relationship between material hardship and depression.We find that each of the five forms of material hardship captured in theFragile Families data—PROBLEMS PAYING BILLS, LACK OF MEDICAL CARE, FREE
FOOD, PHONE TURNED OFF, and UNSTABLE HOUSING—are positively associatedwith elevated risk for depression.
Other demographic control variables follow as expected. The risk of de-pression is negatively associated with the age of the mother but is unrelated toage of youngest child or the number of children present in the household. Poorhealth is associated with an increased risk of depression. Finally, in terms ofrace, we find that while the risk of depression is lower for Hispanics comparedto whites, African Americans face no higher risk of depression compared towhites in this sample of new births. Women who are widowed, separated, ordivorced face higher odds of depression than never-married mothers.
In Model 2 of Table 2, we present the results of the logistic regressionmodel that omits the measures of material hardship but includes the mul-tiple categories of the income to need threshold in order to derive a baselineof the effect of the income to need ratio and depression with Model 3. Here,we find that risk of depression decreases in a straightforward monotonicrelationship. This result is exactly as expected and is consistent with thefindings of others (Kessler et al., 1994). It should be noted, however, thathaving income to needs ratios of less than 2.0 is statistically indistinguishablefrom living in poverty and only the top two categories are statistically sig-nificant. The odds ratio of the top income to needs ratio category indicates,for example, that women whose family income is four times the poverty lineare just over half as likely to report depression as women with family in-comes below the poverty line.
In Model 3 of Table 2, we present results of the logistic regression modelsincluding both the measures of material hardship and the income to needscategories. We find that while each of the reported forms of material hard-ship continues to have a strong positive effect on the risk of depression, eachof the income to needs categories is not statistically significant. This findingsuggests that the relationship between the income to needs ratio and de-pression is fully mediated by the inclusion of material hardship. Othercontrol variables remain consistent to what is reported in Model 1. How-ever, it is still possible that unmeasured heterogeneity is biasing the results.
Conditional Logistic Regression Models
As explained above, it is possible that women who have a latent propensityto report symptoms of depression may also have a latent propensity to report
Poverty, Material Hardship, and Depression 1061

TA
BLE
2
Logis
tic
Regre
ssio
nM
odels
Estim
ating
the
Pro
babili
tyof
Depre
ssio
n
Mod
el1
Mod
el2
Mod
el3
Beta
Od
ds
Ratio
SE
Beta
Od
ds
Ratio
SE
Beta
Od
ds
Ratio
SE
Mate
rialH
ard
ship
Lack
of
med
icalcare
0.5
65
nnn
0.1
24
0.5
58
nnn
0.1
25
1.7
60
1.7
47
Fre
efo
od
0.4
68
nnn
0.1
08
0.4
57
nnn
0.1
08
1.5
97
1.5
79
Phone
turn
ed
off
0.4
42
nnn
0.0
85
0.4
34
nnn
0.0
86
1.5
55
1.5
44
Unst
ab
lehousi
ng
0.3
60
nnn
0.1
00
0.3
59
nnn
0.1
00
1.4
34
1.4
32
Pro
ble
ms
payi
ng
bills
0.6
71
nnn
0.0
73
0.6
63
nnn
0.0
73
1.9
56
1.9
40
Incom
eto
Need
sR
atio
1.0
too
1.5
a�
0.0
71
0.1
00
�0.0
38
0.1
03
0.9
32
0.9
63
1.5
too
2.0
a�
0.1
61
0.1
21
�0.0
63
0.1
25
0.8
51
0.9
39
2.0
too
4.0
a�
0.2
93
nnn
0.1
07
�0.0
54
0.1
09
0.7
46
0.9
47
�4.0
a�
0.6
47
nnn
0.1
62
�0.2
07
0.1
62
0.5
24
0.8
13
Dem
ogra
phic
Contr
ols
Hig
hsc
hoold
iplo
ma
b�
0.1
36
0.0
96
�0.1
10
0.0
96
�0.1
31
0.0
97
0.8
73
0.8
96
0.8
78
More
than
hig
hsc
hoolb
0.0
47
0.0
98
0.1
55
0.1
02
0.0
77
0.1
03
1.0
48
1.1
68
1.0
80
Num
ber
of
child
ren
0.0
14
0.0
28
0.0
11
0.0
28
0.0
07
0.0
29
1.0
14
1.0
11
1.0
07
1062 Social Science Quarterly

TA
BLE
2—
continued
Mod
el1
Mod
el2
Mod
el3
Beta
Od
ds
Ratio
SE
Beta
Od
ds
Ratio
SE
Beta
Od
ds
Ratio
SE
Age
of
youngest
child
�0.0
06
0.0
36
�0.0
14
0.0
34
�0.0
06
0.0
36
0.9
94
0.9
86
0.9
94
Poor/
fair
self-
rep
ort
ed
health
1.1
73
nnn
0.0
89
1.3
66
nnn
0.0
84
1.1
65
nnn
0.0
89
3.2
33
3.9
19
3.2
07
Age
of
house
hold
er
�0.0
18
nnn
0.0
07
�0.0
20
nnn
0.0
07
�0.0
17
nn
0.0
07
0.9
82
0.9
80
0.9
83
Afr
ican
Am
eric
an
c0.0
20
0.1
01
�0.0
92
0.1
00
�0.0
01
0.1
02
1.0
20
0.9
12
0.9
99
His
panic
c�
0.3
26
nnn
0.1
14
�0.4
89
nnn
0.1
15
�0.3
51
nnn
0.1
17
0.7
21
0.6
13
0.7
04
Oth
er
�0.2
20
0.2
08
�0.2
79
0.2
05
�0.2
24
0.2
08
0.8
02
0.7
57
0.7
99
Marr
ied
d�
0.0
07
0.0
94
�0.0
63
0.1
00
0.0
14
0.0
95
0.9
93
0.9
39
1.0
14
Wid
ow
ed
/sep
ara
ted
/div
orc
ed
d0.4
84
nnn
0.1
22
0.5
49
nnn
0.1
17
0.4
82
nnn
0.1
22
1.6
23
0.0
67
1.7
31
0.0
64
1.6
19
Year
0.3
03
nnn
0.3
48
nnn
0.3
03
nnn
0.0
67
1.3
54
1.4
17
1.3
54
Sam
ple
Siz
e7,0
57
7,0
57
7,0
57
aThe
om
itted
refe
rence
gro
up
isth
ose
with
incom
eto
need
sra
tioso
1.0
.bThe
om
itted
refe
rence
gro
up
isle
ssth
an
hig
hsc
hool.
cThe
om
itted
refe
rence
gro
up
isw
hite
.dThe
om
itted
refe
rence
gro
up
isneve
rm
arr
ied
.
NO
TE:
nnnin
dic
ate
ssi
gnifi
cant
at
0.0
1;
nnin
dic
ate
ssi
gnifi
cant
at
0.0
50.
Poverty, Material Hardship, and Depression 1063

material hardship and/or low income to needs ratios. To allow for thispossibility, we estimate the same three models using conditional logisticfixed-effect regression. Assuming the unmeasured heterogeneity present isconstant across time, the estimates presented are consistent and unbiasedestimators. Table 3 presents the results of this analysis estimated on onlythose women who report a change in depression (N 5 1,282) and results aregeneralizable to this subgroup of the sample only.
In Model 1 of Table 3, we show that of the five forms of material hardshipexamined, after controlling for time-invariant heterogeneity, only two re-main predictive of an increased risk of depression—problem paying bills andphone turned off. In particular, women who reported problems paying billsand women who had their phones turned off were 1.8 times and 1.5 timesmore likely to be depressed than women who did not report changes inthose respective hardships. In contrast to prior work (Heflin et al., 2005),which shows a strong relationship between food insufficiency and mentalhealth, we find no relationship between changes in free food and depressionin the conditional logistic regression models. It is important to note that theitem used here differs significantly in terms of wording from what is used inprior studies that find a relationship between food hardship and mentalhealth. Similarly, while having unstable housing and lack of medical carewere significant in the pooled cross-sectional analyses, changes in thesedomains of material hardship are statistically insignificant here.4 Ofthe demographic controls, having a change in the number of children, theage of the householder, being widowed, separated, or divorced, and self-rated health are associated with a change in the risk of depression.
In Model 2 of Table 3, we present results omitting material hardship butincluding the income to needs categorical variables. Results here weakenfrom the pooled cross-sectional analysis. In the conditional logistic regres-sion model we find that a strong relationship exists between the change inthe income to needs categories between only the highest level and a changein the risk of depression.
Finally, in Model 3 of Table 3, we include both material hardship and theincome to needs ratio categories. We find that changes in reports of prob-lems paying bills and phone turned off remain significantly related to anincreased risk of change in depression, even after explicitly controlling for achange in the income to needs ratio. The top income to needs ratio cat-
4To check if the lack of significance for phone off, lack of medical care, free food, andunstable housing was due to the inclusion of other forms of material hardship in the model,we ran separate conditional logistic regression models for each form of material hardship.Although phone off, lack of medical care, and unstable housing were statistically significantwhen they were the only form of material hardship in the model, free food remainedstatistically insignificant. Additionally, we have run joint tests of significance for differences indomains of material hardship. Where coefficients are statistically significant (phone off andbill payment), each domain is statistically different from each of the other domains. Wheredomains are not statistically different from zero, we cannot reject the null of differencesbetween coefficients.
1064 Social Science Quarterly
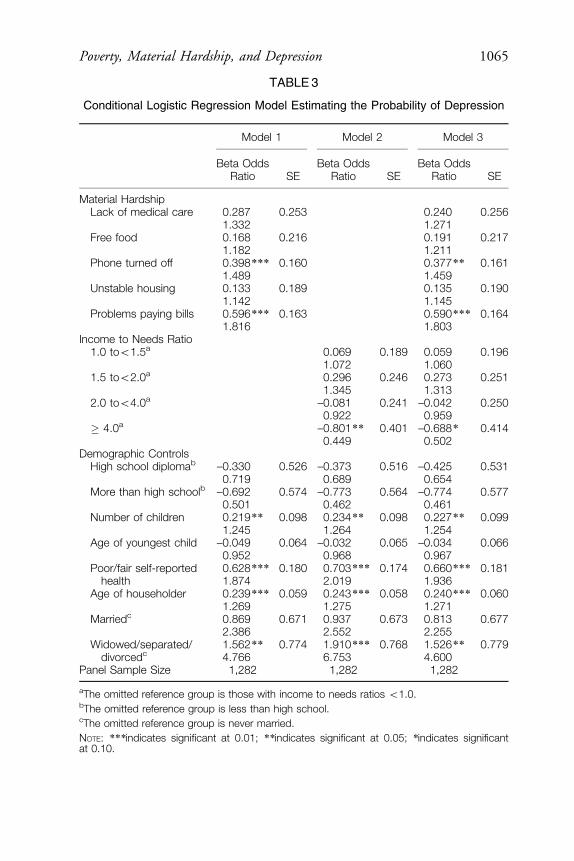
TABLE 3
Conditional Logistic Regression Model Estimating the Probability of Depression
Model 1 Model 2 Model 3
Beta OddsRatio SE
Beta OddsRatio SE
Beta OddsRatio SE
Material HardshipLack of medical care 0.287 0.253 0.240 0.256
1.332 1.271Free food 0.168 0.216 0.191 0.217
1.182 1.211Phone turned off 0.398n n n 0.160 0.377n n 0.161
1.489 1.459Unstable housing 0.133 0.189 0.135 0.190
1.142 1.145Problems paying bills 0.596 n n n 0.163 0.590n n n 0.164
1.816 1.803Income to Needs Ratio
1.0 too1.5a 0.069 0.189 0.059 0.1961.072 1.060
1.5 too2.0a 0.296 0.246 0.273 0.2511.345 1.313
2.0 too4.0a –0.081 0.241 –0.042 0.2500.922 0.959
� 4.0a –0.801 n n 0.401 –0.688 n 0.4140.449 0.502
Demographic ControlsHigh school diplomab –0.330 0.526 –0.373 0.516 –0.425 0.531
0.719 0.689 0.654More than high schoolb –0.692 0.574 –0.773 0.564 –0.774 0.577
0.501 0.462 0.461Number of children 0.219n n 0.098 0.234 n n 0.098 0.227n n 0.099
1.245 1.264 1.254Age of youngest child –0.049 0.064 –0.032 0.065 –0.034 0.066
0.952 0.968 0.967Poor/fair self-reported
health0.628n n n 0.180 0.703 n nn 0.174 0.660n n n 0.1811.874 2.019 1.936
Age of householder 0.239n n n 0.059 0.243 n nn 0.058 0.240n n n 0.0601.269 1.275 1.271
Marriedc 0.869 0.671 0.937 0.673 0.813 0.6772.386 2.552 2.255
Widowed/separated/divorcedc
1.562n n 0.774 1.910 n nn 0.768 1.526n n 0.7794.766 6.753 4.600
Panel Sample Size 1,282 1,282 1,282
aThe omitted reference group is those with income to needs ratios o1.0.bThe omitted reference group is less than high school.cThe omitted reference group is never married.
NOTE: nn nindicates significant at 0.01; n nindicates significant at 0.05; nindicates significantat 0.10.
Poverty, Material Hardship, and Depression 1065

egories remain statistically and negatively related to the risk of change indepression, with those with income to needs ratios over 4.0 facing half therisk of a change in depression than those living below the federal povertythreshold. The reduction in magnitudes in the relationship between materialhardship and depression from Table 2 to Table 3 suggests that endogeneityfrom time-invariant unmeasured heterogeneity were biasing the estimates inTable 2 upward. When we use conditional fixed-effect logistic regressionmodels, we find lower magnitudes but still a very robust relationship. It isalso interesting to note that the effects of an income to needs ratio above 4were underestimated in Table 2, suggesting that omitting individual fixedeffects suppressed the importance of income.
Simulating a Change in Income Versus a Change in Material Hardship
To interpret the estimated change in depression due to a change in in-come compared to a change in material hardship, we estimate a series ofsimulations.5 First, we estimate the predicted probability of depression forour base case—a black unmarried woman with a high school diploma andgood self-rated health of the median sample age, having the median numberof children in the sample, the youngest of which is at the median age ofyoungest child, income above twice the poverty line (income to needs 2.0–4.0), and no reports of our measures of material hardship. Then, we com-pare the increase in the predicted probability of depression that is associatedwith decreasing the income to needs category of the woman compared toadding the two types of material hardship for which we have reason tobelieve that a significant relationship exists with depression net of incomeand fixed effects—difficulty paying bills and telephone turned off. Thisallows us to compare the returns to focusing on an income-based versusmaterial hardship focused social policy intervention.
Table 4 presents results from this simulation for Model 3 estimated withboth logistic regression and conditional fixed-effect logistic regression. Thelatter here is our preferred model since it incorporates fixed effects, but thelogistic regression model simulations are a bit easier to interpret. Regardlessof which set of results is examined, the pattern regarding the relative increasein depression from a change in income to needs categories versus a change inmaterial hardship is consistent across both estimation techniques.
The first two columns of Table 4, which present the results from thelogistic regression, indicate that when poverty and all forms of materialhardship are not present, the predicted probability that a woman will meetthe criteria for depression is quite low—11.8 percent. If we decrease anaverage woman’s income substantially from the 2.0–4.0 income to needs
5Note that we do not directly compare magnitudes of log odds ratios for income versusmaterial hardship because they assume a linear effect with depression.
1066 Social Science Quarterly

category to below the federal poverty threshold, the risk of depression wouldincrease to 13.9 percent, representing an 18 percent increase over the base.
However, if we simulated a change in material hardship alone for thissame ‘‘average’’ woman while leaving the income to needs category un-changed from the base, we would see increases in the predicted probabilityof depression of 17.6 percent for difficulty paying bills, representing a 49percent increase over the base case. Similarly, the predicted probability ofdepression rises to 17.2 percent if we simulate having phone turned off. Ifwe simulated a change from the base case in which all five areas of materialhardship were present, we estimate that the predicted probability of de-pression would increase by 378 percent over the base to 56.6 percent,assuming the woman remains in the 2.0–4.0 income to needs category. If wesimulated a drop in the income to needs category as well as the presence ofall five types of material hardship, we estimate a predicted probability ofdepression of 62.8 percent.
Results for the conditional fixed-effect logistic regression models pre-sented in the last two columns of Table 4 demonstrate a qualitatively similarpattern of results, although the magnitudes differ because the underlyingprobability of meeting the criteria for depression is 0.500 instead of 0.119.However, even after controlling for fixed characteristics of the woman thatmight be correlated with depression, income, and material hardship, we find
TABLE 4
Simulation of Change in Income to Needs Versus Material Hardship in PredictingDepression Status
LogisticRegressiona
Conditional FELogistic
Regressionb
PredictedProbability
%DBase
PredictedProbability
%DBase
BASE: No poverty or hardships present 11.83% 50.00%Poverty present only 17.50 13.90% 22.32 61.16%Difficulty paying bills present alone 48.66 17.59% 46.29 73.15%Phone turned off present alone 45.02 17.16% 37.52 68.76%All five hardships present 377.92 56.55% 74.98 87.49%All five hardships and poverty present 430.91 62.82% 75.89 87.94%
aThe logistic regression column presents the predicted probability of meeting the criteria fordepression in the pooled cross-section.bThe conditional fixed-effect logistic regression column presents the predicted probability ofmeeting the criteria for depression at t 5 2 relative to the base estimation, given that the criteriawere not met at t 5 1. Since all cases have both 0s and 1 on depression status at one timeperiod, the base probability of observing depression is 0.50.
NOTE: The base model assumes median values for the number of children, age of youngestchild, age of householder, for a black unmarried women with a high school diploma and goodself-rated health with income to needs 2.0–4.0 and no hardship.
Poverty, Material Hardship, and Depression 1067
that simulating large drops in income to needs categories results in smallerincreases in depression than changes in a single area of material hardship.
Conclusion
Social stratification research has relied on the federal poverty line as amarker of material deprivation for many years. However, given recent cri-tiques of the federal poverty measure, the new availability of informationon subjective reports of material hardship, and the relatively low correla-tion between the two, it is necessary to rethink the strategy of usingincome alone for all investigations. Our study therefore examined the cor-relation between the federal poverty measure, reports of five differentforms of material hardship, and depression. We used longitudinal datacollected in the Fragile Families Survey—a survey of births in cities withpopulations greater than 200,000 in 1999 in the United States. We esti-mated fixed-effects models that allow us to conduct more precise causalmodeling and explicitly incorporate time-invariant unmeasured heteroge-neity in our models.
Our findings suggest that reports of each of the five forms of materialhardship are positively associated with an elevated risk for depression. Thetwo most prominent hardships that remained significant in our fixed-effectsmodels were problems paying bills and having the phone turned off. Theserelationships are consistent with theoretical perspectives that posit thathardships can have both direct and indirect effects on health (Lynch et al.,2004). Finally, we also found that hardship helped mediate much, thoughnot quite all, of the link between poverty and depression. This suggests thatthere are also other avenues by which income affects mental health, such asincreased presence of other chronic stressors due to, for example, living inpoor neighborhoods.
Our policy simulation suggests that one avenue open for addressing thepublic health problem of depression may be to focus on specific areas ofhardships. For example, our results on bill hardships suggest that programsthat help low-income populations deal with high heating costs or avoideviction may have higher social benefits than immediately apparent. How-ever, these programs need to be available to those with incomes up to at least200 percent of the poverty line as material hardship is not limited to thoseliving in poverty.
Future work on economic well-being and health could also focus onidentifying the mechanisms by which hardship affects depression, since ourstudy does not have the data necessary for such inferences. Finally, since oursample was limited to a cohort of new mothers of children born in largecities in 1999, further research using a nationally representative samplewould provide valuable evidence as to whether the findings of this study aregeneralizable to an even broader population.
1068 Social Science Quarterly

REFERENCES
Adams, Peter, Michael Hurd, Daniel McFadden, Angela Merrill, and Tiago Ribeiro. 2003.‘‘Healthy, Wealthy, and Wise? Test for Direct Causal Paths Between Health and Socio-economic Status.’’ Journal of Econometrics 112:3–56.
American Psychiatric Association (APA). 1987. Diagnostic and Statistical Manual of MentalDisorders. Washington, DC: American Psychiatric Association Publishing.
Beverly, Sondra. 2000. ‘‘Material Hardship in Working-Poor Households with Children.’’Presented at the Population Association of America. Los Angeles, CA.
———. 2001. ‘‘Measures of Material Hardship: Rationale and Recommendations.’’ Journalof Poverty 5(1):23–41.
Blazer, D., et al. 1994. ‘‘The Prevalence Level Distribution of Major Depression in a NaturalCommunity Sample.’’ American Journal of Psychiatry 151:979–86.
Boushey, Heather, Chauna Brocht, Bethney Gundersen, and Jared Bernstein. 2001. Hardshipsin America: The Real Story of Working Families. Washington, DC: Economic Policy Institute.
Bradshaw, J., and N. Finch. 2003. ‘‘Overlaps in Dimensions of Poverty.’’ Journal of SocialPolicy 32:513–25.
Casey, Patrick, Susan Goolsby, Carol Berkowitz, Deborah Frank, John Cook, Dina Cutts,Maureen Black, Nieves Zaldivar, Suzette Levenson, Tim Heeren, Alan Meyers, and theChildren’s Sentinel Nutritional Assessment Program Study Group. 2004. ‘‘Maternal De-pression, Changing Public Assistance, Food Security, and Child Health Status.’’ Pediatrics113(2):298–304.
Citro, Constance F., and Robert T. Michael, eds. 1995. Measuring Poverty: A New Approach.Washington, DC: National Academy Press.
Ecob, Russell, and George Davey Smith. 1999. ‘‘Income and Health: What is the Nature ofthe Relationship?’’ Social Science & Medicine 48:693–705.
Evenson, R., and Robin Simon. 2005. ‘‘Clarifying the Relationship Between Parenthood andDepression.’’ Journal of Health and Social Behavior 46(3):341–50.
Greenberg, P. E., R. C. Kessler, H. G. Birnbaum, S. A. Leong, S. W. Lowe, P. A. Berglund,et al. 2003. ‘‘The Economic Burden of Depression in the United States: How Did it ChangeBetween 1990 and 2000?’’ Journal of Clinical Psychiatry 64:1465–75.
Hamilton, William L., John T. Cook, William W. Thompson, Lawrence F. Buron, EdwardA. Frongillo, Christine M. Olson, and Cheryl A. Wehler. 1997. Household Food Security inthe United States in 1995. Technical report of the Food Security Measurement Project.Washington, DC: Food and Consumer Service, U.S. Department of Agriculture.
Hawkins, Daniel N., and Alan Booth. 2005. ‘‘Unhappily Ever After: Effects of Long-Term,Low-Quality Marriages on Well-Being.’’ Social Forces 84(1):451–71.
Heflin, Colleen, Mary E. Corcoran, and Kristine Siefert. 2007. ‘‘Work Trajectories, IncomeChanges and Food Insufficiency in a Michigan Welfare Population.’’ Social Service Review81(1):3–25.
Heflin, Colleen, Kristine Siefert, Mary E. Corcoran, and David R. Williams. 2005. ‘‘FoodInsufficiency and the Mental Health of Current and Recent Welfare Recipients: Findingsfrom a Longitudinal Survey.’’ Social Science & Medicine 61:1971–82.
Iceland, John. 2006. Poverty in America, 2nd ed. Berkeley, CA: University of California Press.
Poverty, Material Hardship, and Depression 1069

Iceland, John, and Kurt J. Bauman. 2004. Income Poverty and Material Hardship: How Strongis the Association? National Poverty Center Working Paper 04-17. Available at hhttp://www.npc.umich.edu/publications/workingpaper04/paper17/i.Johnson, J. G., P. Cohen, J. S. Brook, et al. 1999. ‘‘A Longitudinal Investigation of SocialCausation and Social Selection Processes Involved in the Association Between SocioeconomicStatus and Psychiatric Disorders.’’ Journal of Abnormal Psychology 108:490–99.
Kessler, R., H. S. Akiskal, M. Ames, H. Birnbaum, P. Greenberg, R. M. A. Hirschfeld, et al.2006. ‘‘Prevalence and Effects of Mood Disorders on Work Performance in a NationallyRepresentative Sample of U.S. Workers.’’ American Journal of Psychiatry 163:1561–68.
Kessler, R., G. Andrews, D. Mroczek, B. Ustun, and H. U. Wittchen. 1998. ‘‘The WorldHealth Organization Composite International Diagnostic Interview Short-Form (CIDI-SF).’’ International Journal of Methods in Psychiatric Research 7:171–85.
Kessler, R., P. Barker, L. Colpe, et al. 2003. ‘‘Screening for Serious Mental Illness in theGeneral Population.’’ Archives of General Psychiatry 60:184–89.
Kessler, R., Katherine A. McGonagle, Shanyang Zhao, Christopher B. Nelson, MichaelHughes, Suzann Eshlemann, Hans-Ulrich Wittchen, and Kenneth S. Kendler. 1994. ‘‘Life-time and 12-Month Prevalence of DSM-III-R Psychiatric Disorders in the United States.’’Archives of General Psychiatry 15:8–19.
Laraia, Barbara A., Anna Maria Siega-Riz, Craig Gundersen, and Nancy Dole. 2006. ‘‘Psy-chological Factors and Socioeconomic Indicators are Associated with Household Food In-security Among Pregnant Women.’’ Journal of Nutrition 136:177–82.
Lynch, John, George Davey Smith, Sam Harper, Marianne Hillemeier, Nancy Ross, GeorgeKaplan, and Michael Wolfson. 2004. ‘‘Is Income Inequality a Determinant of PopulationHealth? Part 1. A Systematic Review.’’ Millbank Quarterly 82(1):5–99.
Lynch, John, George Davey Smith, George A. Kaplan, and James S. House. 2000. ‘‘IncomeInequality and Mortality: Importance to Health of Individual Income, Psychosocial Envi-ronment, or Material Conditions.’’ British Medical Journal 320:1200–04.
Macleod, J., and G. Davey Smith. 2003. ‘‘Psychosocial Factors and Public Health: A SuitableCase for Treatment.’’ Journal of Epidemiology and Community Health 57:565–70.
Macleod, John, G. Davey Smith, Pauline Heslop, Chris Metcalfe, Douglas Carroll, andCarole Hart. 2002. ‘‘Psychological Stress and Cardiovascular Disease: Empirical Demon-stration of Bias in a Prospective Observational Study of Scottish Men.’’ British MedicalJournal 324:1247–51.
Macleod, John, G. Davey Smith, Chris Metcalfe, and Carole Hart. 2005. ‘‘Is SubjectiveSocial Status a More Important Determinant of Health than Objective Social Status?’’ SocialScience & Medicine 61(9):1916–29.
Marcotte, D. E., and V. Wilcox-Gok. 2001. ‘‘Estimating the Employment and EarningsCosts of Mental Illness: Recent Developments in the United States.’’ Social Science andMedicine 53:21–27.
Mayer, S. E. 1995. ‘‘A Comparison of Poverty and Living Conditions in the United States,Canada, Sweden and Germany.’’ In K. McFate, R. Lawson, and W. J. Wilson, eds., Poverty,Inequality and the Future of Social Policy: Western States in the New World Order. New York:Russell Sage Foundation.
Mayer, S. E., and Christopher Jencks. 1989. ‘‘Poverty and the Distribution of MaterialHardship.’’ Journal of Human Resources 24(1):88–114.
1070 Social Science Quarterly
———. 1993. ‘‘Recent Trends in Economic Inequality in the United States: Income vs.Expenditures vs. Material Well-Being.’’ In D. Papadimitriou and E. Wolff, eds., Poverty andProsperity in the USA in the Late Twentieth Century. London: MacMillan.
Miech, R. A., A. Caspi, T. Moffitt, et al. 1999. ‘‘Low Socioeconomic Status and MentalDisorders: A Longitudinal Study of Selection and Causation During Young Adulthood.’’American Journal of Sociology 104:112–47.
Muntaner, Carles, William W. Eaton, Richard Miech, and Patrice O’Campo. 2004. ‘‘So-cioeconomic Position and Major Mental Disorders.’’ Epidemiologic Review 26:53–62.
Ouellette, Tammy, Nancy Burstein, David Long, and Erik Beecroft. 2004. Measures ofMaterial Hardship: Final Report. Washington, DC: U.S. Department of Health and HumanServices, Office of the Assistant Secretary for Planning and Evaluation.
Perreira, Krista M., Natalia Deeb-Sossa, Kathleen Mullan Harris, and Kenneth A. Bollen.2005. ‘‘What Are We Measuring? An Evaluation of the CES-D Across Race/Ethnicity andImmigrant Generation.’’ Social Forces 83(4):1567–1601.
Perry, B. 2002. ‘‘The Mismatch Between Income Measures and Direct Outcome Measures ofPoverty.’’ Social Policy Journal of New Zealand 19:101–27.
Pratt, L. A., A. N. Dey, and A. J. Cohen. 2007. Characteristics of Adults with SeriousPsychological Distress as Measured by the K6 Scale: United States, 2001–2004. Advance Datafrom Vital Health and Statistics 382. Hyattsville, MD: National Center for Health Statistics.
Rector, R., K. A. Johnson, and S. E. Youssef. 1999. ‘‘The Extent of Material Hardship andPoverty in the United States.’’ Review of Social Economy 57(3):351–87.
Reichman, N., J. Teitler, I. Garfinkel, and S. McLanahan. 2001. ‘‘Fragile Families: Sampleand Design.’’ Children and Youth Services Review 23(4–5):303–26.
Robins, Lee N., and Darrel A. Regier, eds. 1990. Psychiatric Disorders in America: TheEpidemiologic Catchment Area Study. New York: Free Press.
Ruggles, Patricia. 1990. Drawing the Line: Alternative Poverty Measures and Their Implicationsfor Public Policy. Washington, DC: Urban Institute.
Serido, Joyce, David M. Almeida, and Elaine Wethington. 2004. ‘‘Chronic Stressors andDaily Hassles: Unique and Interactive Relationships with Psychological Distress.’’ Journal ofHealth and Social Behavior 45(1):17–33.
Turner, R. Jay, John Taylor, and Karen Van Gundy. 2004. ‘‘Personal Resources and De-pression in the Transition to Adulthood: Ethnic Comparisons.’’ Journal of Health and SocialBehavior 45(1):34–52.
U.S. Department of Health and Human Services. 1999. Mental Health: A Report of theSurgeon General—Executive Summary. Rockville, MD: U.S. Department of Health and Hu-man Services, Substance Abuse and Mental Health Services Administration, Center forMental Health Services, National Institutes of Health, National Institute of Mental Health.
Wittchen, H. U. 1994. ‘‘Reliability and Validity Studies of the WHO-Composite Inter-national Diagnostic Review (CIDI): A Critical Review.’’ Journal of Psychiatric Research28:57–84.
World Health Organization. 1990. Composite International Diagnostic Review, v. 1.0. Geneva,Switzerland: World Health Organization.
Poverty, Material Hardship, and Depression 1071