poverty reduction strategy the second progress · pdf filepoverty reduction strategy the...
TRANSCRIPT

THE UNITED REPUBLIC OF TANZANIA
POVERTY REDUCTION STRATEGY
THE SECOND PROGRESS REPORT 2001/02
DAR ES SALAAM March 2003
i
LIST OF ABBREVIATIONS AND ACRONYMS ADB - African Development Bank ADF - African Development Fund ADR - Alternative Dispute Resolution AGOA - African Growth Opportunity Act ASDP - Agriculture Sector Development Programme ASDS - Agriculture Sector Development Strategy ASLM - Agriculture Sector Lead Ministries ATC - Air Tanzania Corporation ATIP - Accountability, Transparency and Integrated Project BOT - Bank of Tanzania BSE - Basic Statistics on Education CAP - Country Action Programme CBOs - Community Based Organizations CEF - Community Education Fund Programme CFAA - Country Financial Accountability Assessment CFS - Child Friendly School Programme CHF - Community Health Fund COBET - Complimentary Basic Education in Tanzania CPI - Consumer Price Index CSOs - Civil Society Organizations DAC - Donor Aid Coordination DAWASA - Dar es Salaam Water and Sewerage Authority DBSPE - District Based Support to Primary Education DFID - Department for International Development DHS - Demographic and Health Survey DPT - Diptheria Pectusis Tetanus DRF - Drug Revolving Fund DSA - Dissemination, Sensitization and Advocacy EAC - East African Community EPZ - Export Processing Zones ESDP - Education Sector Development Programme ETP - Education and Training Policy EU - European Union FDI - Foreign Direct Investment FDTF - Fiscal Decentralization Task Force GATT - General Agreement on Trade and Tariffs GDP - Gross Domestic Product GER - Gross Enrolment Rate GFS - Government Financial Statistics GGCU - Good Governance Coordination Unit GOT - Government of Tanzania HBS - Household Budget Survey HIPC - Highly Indebted Poor Countries HIV/AIDS - Human Immuno-deficiency Virus/Acquired Immune Deficiency Syndrome HMIS - Health Management Information System HSR - Health Sector Reforms ICBAE - Integrated Community Based Adult Education ICT - Information and Community Technology IFAD - International Fund for Agricultural Development IFEM - Inter-Bank Foreign Exchange Market IFMS - Integrated Financial Management System ILFS - Integrated Labour Force Survey INSET - In-Service Training Programme
ii
IRP - Integrated Roads Programme ITN - Insecticide Treated Nets LGA - Local Government Authorities LGRP - Local Government Reform Programme MAFS - Ministry of Agriculture and Food Security MCM - Ministry of Cooperatives and Marketing MDA - Ministries, Departments and Agencies MDG - Millennium Development Goals MDT - Millennium Development Targets MIS - Management Information System MOEC - Ministry of Education and Culture MWLD - Ministry of Water and Livestock Development NACP - National Aids Control Programme NACSAP - National Anti-Corruption Strategy and Action Plan NAO - National Audit Office NER - Net Enrolment Rate NFE - Non-Formal Education NGOs - Non-Governmental Organizations OCAG - Office of the Controller and Auditor General PASS - Private Agribusiness Sector Support PCB - Prevention of Corruption Bureau PEDP - Primary Education Development Programme PER - Public Expenditure Review PHDR - Poverty and Human Development Report PMMP - Poverty Monitoring Master Plan PMS - Poverty Monitoring System PORALG - President’s Office, Regional Administration and Local Government PPA - Participatory Poverty Assessment PRBS - Poverty Reduction Budget Support PRS - Poverty Reduction Strategy PRSP - Poverty Reduction Strategy Paper QSP - Quick Start Project RDS - Rural Development Strategy REPOA - Research on Poverty Alleviation SADC - Southern Africa Development Community SEDP - Secondary Education Development Programme SMEs - Small and Medium Enterprises STI - Sexually Transmitted Infections TACAIDS - Tanzania Commission on Aids TAS - Tanzania Assistance Strategy TB - Tuberculosis TCCIA - Tanzania Chamber of Commerce, Industries and Agriculture TEDP - Teacher Education Development Programme TIC - Tanzania Investment Centre TNBC - Tanzania National Business Council TRC - Tanzania Railways Corporation TSED - Tanzania Socio-Economic Database URRP - Urgent Roads Rehabilitation Programmes VAT - Value Added Tax VPO - Vice President’s Office VTTP - Village Travel and Transport Programme WABEM - Ward Based Education Management Programme WSDP - Whole School Development Programme WSDS - Water Sector Development Strategy

iii
TABLE OF CONTENTS Page No. 1.0. INTRODUCTION … … … … … … … 1 2.0. STATUS OF POVERTY 2.1. Progress with Analysis of Poverty Data … … … … 2 2.2. Assessment of the Poverty Situation … … … … 3
2.2.1. Income Poverty … … … … … … 3 2.2.2. Trends in Headcount Ratios Between 1991/92 and 2000/01… 4 2.2.3. Urban Poverty … … … … … 6
2.3. Non-Income Poverty … … … … … … 8 2.4. The Millennium Development Goals (MDGs) and the
Poverty Reduction Strategy (PRS) … … … … 14 2.5. Next Steps … … … … … … … 16
3.0. SOCIO-ECONOMIC REFORMS IN 2001/02 3.1. Macroeconomic Performance … … … … 17
3.1.1. Structural Reforms … … … … 19 3.1.2. Linking Marco Policies, Growth and Poverty Reduction … 20
3.2. Poverty Orientation of the 2002/03 Budget … … … 22 3.3. Private Sector Development … … … … … 24 3.4. Globalization and Poverty … … … … … 25 3.5. Debt Sustainability … … … … … … 26
4.0. IMPLEMENTATION STATUS OF THE PRIORITY SECTORS
4.1. Overview … … … … … … … 27 4.2. Primary Education … … … … … … 27
4.3. Rural Roads … … … … … … … 32 4.4. Water … … … … … … … … 35 4.5. Legal and Judicial System … … … … … 39 4.6. Health … … … … … … … … 42 4.7. Agriculture … … … … … … … 45 5.0. CROSS CUTTING ISSUES 5.1. Overview … … … … … … … 56 5.2. The Rural Development Strategy … … … … 56 5.3. Environment … … … … … … … 58 5.4. HIV/AIDS … … … … … … … 60 5.5. Gender … …. …. … … … … 61 5.6. Governance … … … … … … … 62 5.7. Employment … … … … … … … 63 5.8. Local Government Reforms … … … … … 66 5.9. Human Capital Development … … … … … 68 6.0. BUDGET FRAMEWORK FOR POVERTY REDUCTION PROGRAMMES
6.1. Overview … … … … … … … 70 6.2. Resource Envelope: A Macroeconomic Perspective … … 70 6.3. Budget frame consideration for financing of priority sections … 70 6.4. Medium-Term Revenue Generating Measures … … … 71 6.5. Public Expenditure Management in the Medium Term … … 71

iv
7.0. POVERTY MONITORING AND EVALUATION 7.1. Overview … … … … … … … 73 7.2. Progress to-date … … … … … … 73
7.3. Financing of the PMMP … … … … … … 74 7.4. Next Steps … … … … … … … 75
8.0. ANNEXES Annex I: Budget Frame 2001/02-2004/05 Annex II: Budgetary Allocation for Priority Sectors (2000/01-2002/03 – July-June) Annex III: Priority Expenditures Within Priority Sectors 2000/01-2002/03 Annex IV: Central Government Expenditure on Priority Sectors 1998/99-2002/03 Annex V: Policy Matrix for Poverty Reduction Strategy 2002/03 – 2004/05 9.0. TABLES AND BOXES TABLES: Table 1: Poverty Headcount Ratios for Food and Basic Needs Poverty Lines 2000/01 Table 2: Trends in Income Poverty and Inequality Measures Between 1991/92 and 2000/01 Table 3: Baselines and Targets for the Key Indicators of Income Poverty Table 4: Illiteracy Rate Table 5: Baselines and Targets for Human Capability Indicators Table 6: Baselines and Targets for Survival Indicators Table 7: Baselines and Targets for Nutrition Indicators Table 8: Millennium Development Goals and Targets Table 9: Trends in Selected Macroeconomic Indicators 1997-2002 Table 10: Summary of Standard One Enrolment Table 11: Recruitment of New Primary School Grade “A” Teachers Table 12: Construction of New Classrooms Table 13: Estimated Financing Requirements for the Education Sector Development Programme (ESDP) 2001/02 – 2003/04/05 (July-June) Table 14: Roads: Summary of Programme Costing Table 15: Financing of Water Sector Programme 2002/03 – 2004/05 Table 16: Legal and Judicial Systems: Costing of Interventions Table 17: Financing of Primary Health 2002/03 – 2004/05 Table 18: Quick Wins for Agriculture Sector Development Programmes Table 19: Agriculture Sector Lead Ministries Approved Budget estimate for 2002/03 Table 20: Composition of Interventions in Agriculture Sector from GoT and Donors for 2002/03 Table 21: Estimate of Overall ASDP Requirements Table 22: Demand Driven Skills Training Programme 2002/03 – 2004/05 BOXES: Box 1: Income Poverty – Indicators and Targets Box 2: Human Capabilities – Indicators and Targets Box 3: Survival – Indicators and Targets Box 4: Nutrition – Indicators and Targets Box 5: Highlights for the 2002/03 Budget Measures Box 6: Major Policy Initiatives Linked to RDS
v
EXECUTIVE SUMMARY 1.0. INTRODUCTION
The second PRS progress report is a product of a consultative process involving stakeholders in government, civil society, private sector and development partners. The preparation of the report benefited from views gathered through the Participatory Poverty Assessment (PPA) exercise, which was carried out within the context of the Pover ty Monitoring System, with particular focus on vulnerability. It also benefited from the Poverty Policy Week, which was held for the first time in September this year, drawing participation from a wide range of stakeholders and from the Consultative Group meeting held in December 2-5.
2.0. POVERTY STATUS
The poverty status comprises both income poverty and non-income poverty. 2.1. Income Poverty:
The report on the status of poverty is based on the Household Budget Survey of 2000/01, which was carried out as part of the Poverty Monitoring System and the Integrated Labour Force Survey of 2000/01. The analysis has enabled Tanzania to establish baseline data for poverty and has facilitated revision of the PRS targets. • Results show that 18.7 percent of the Tanzanians live below the food poverty line and
35.7 percent live below the basic needs poverty line. Poverty is more severe in rural areas compared to urban areas. Indeed among the total poor population, the urban poor constitute about 13% compared to 87% in rural areas. Dar es Salaam has the least incidence of poverty. There is also growing inequality as shown by the rise in the Gini coefficient from 0.34 in 1991/92 to 0.35 in 2000/01.
• Urban poverty is also a matter of serious concern. Notable features are in the area of
low and uncertain incomes for people in the informal sector, limited formal employment opportunities particularly for youth, especially girls, lack of access to credit for business and housing for low income groups. There is also the problem of inability to afford decent and adequate housing for people living in unplanned settlements.
2.2. Non-Income Poverty:
The non-income poverty covers 4 main categories, namely: (i) human capabilities, (ii) survival, (iii) nutrition, and (iv) extreme vulnerability.
• Human capabilities:
Notable here is the impressive performance in the education sector attributed to the implementation of the Primary Education Development Programme (PEDP). There are dramatic increases in the intake in primary schools with gross enrolment reaching 100.4 percent in 2002 compared to 77.6 percent in 1990, and net enrolment rising from 58.8 percent in 1990 to 85 percent in 2002. The challenge is how to further improve the quality of education, the learning environment, eliminate gender inequality at all levels, health and other basic services. It is the government’s resolve to address all these issues appropriately.

vi
• Survival:
There has been an increase in the use of improved sources of drinking water in rural areas over the 1990s. But more efforts will be made to ensure that adequate resources are allocated to the provision of rural water. There are indications of slight increases in infant and under-five mortality rates in recent years, attributed mainly to HIV/AIDS pandemic. This poses a major challenge as far as the PRS targets are concerned.
• Nutrition:
Little progress was achieved during the 1990s with regard to the improvement of nutrition rates for children. There are significant disparities in the levels of under-nourishment between rural and urban areas, and between children from poorer and richer households.
• Extreme Vulnerability:
The PRS recognizes vulnerability as an important aspect in initiatives towards poverty reduction. However, setting targets and quantitative measures of extreme vulnerability remains a challenging task in the absence of a clear understanding of the concept and its manifestations in Tanzania. It is expected that the findings of the PPA will enhance this understanding and guide the design of effective policy interventions.
2.3. Millennium Development Goals and the PRS:
Tanzania is committed to the Millennium Development Goals (MDGs). Tanzania produced the first report on progress towards the MDGs in 2001 and a report on costing the achievements of the MDGs in 2002. The report also indicated the likelihood of achieving the targets for Tanzania. The government has put in place a sound policy framework for poverty reduction and a comprehensive Poverty Monitoring System to monitor p rogress towards the MDGs.
3.0. MACRO LEVEL PERFORMANCE AND LINKAGE TO THE MICRO LEVEL
The performance of the Tanzanian economy at macro level has been impressive and Tanzania is viewed as one of the top most improved countries in Sub- Saharan Africa. There have been notable improvements in fiscal performance, which ensured macroeconomic stability and growth achieved over the past recent years. This has enabled the government to steadily increase budget allocations to PRS priority sectors mostly education, health, water, agriculture and rural roads.
The HBS 2000/01 results report improvements in housing conditions, increased possession of consumer durables, decrease in distance to markets, shops, public transport etc., which are all pointers to improvement in welfare as a result of good macroeconomic performance.
Transforming this impressive macro performance into micro level benefits remains a big challenge for the government, and continues to be explored further. The Government is committed to strengthening ties between the rural and urban economy, improve rural infrastructure, encourage development of SMEs, facilitate provision of micro credits, strengthen local capacity and strive to achieve a more broad based economic growth. The government also seeks to ensure that poverty reduction continues to occupy center stage in the macro and sectoral policies.
vii
4.0. IMPLEMENTATION STATUS OF THE PRIORITY SECTORS
The implementation status is based on various performance reports of the sectors and covers all the PRS priority sectors, namely: Agriculture, Primary Education, Rural Roads, Water and Sanitation, Legal and Judicial System, and Health. In each of these sectors this progress report gives progress and achievements in relation to the last year’s planned activities, lessons learned and challenges ahead, planned interventions or next steps and costing of the interventions. Given that the baseline data on the key indicators has now been established, future PRS progress reports will go beyond sector performance reports into tracking changes in the impact and outcome indicators.
5.0. CROSS-CUTTING ISSUES
• The PRS has identified certain cross cutting issues that need to be addressed as they have a bearing on initiatives towards poverty reduction. These include environment, gender, good governance, HIV/AIDS and employment. Efforts are on the ground to address all these especially in capturing the dynamics underlying each one of them and their relation to poverty.
• Local Government Reform:
The restructuring of LGAs is an ongoing process. The reform programme is aimed at reorganization of structures of LGAs to meet the challenges of delivery of quality services. There is currently a Fiscal Decentralization Task Force (FDTF) established in November 2001 with the objective to establish stronger coordination with regard to the implementation of fiscal decentralization so that councils can have stronger financial autonomy and vibrant revenue bases.
6.0. POVERTY ORIENTATION OF THE 2002/03 BUDGET
The budget remains the key instrument in our ongoing efforts to consolidate further the macroeconomic situation and provides an environment conducive to poverty reduction. The implementation of the Poverty Reduction Strategy depends on the resources available from domestic as well as foreign sources. Financing of the PRS is outlined in the Medium Term Expenditure Framework (MTEF), and is annually reviewed through the PER process. An important development to note is the substantial increase in resources going to the priority sectors in line with the PRS objectives.
Given the importance of SMEs in employment creation and poverty reduction, the budget for 2002/03 has provided support to the SMEs. The government continues with the reform and privatization of the remaining parastatals, particularly those providing economic services. The aim is to increase their productive efficiency and reduce the burden on the government budget.
On the revenue front, the government has taken measures that aim at enhancing revenue collection, protecting the vulnerable and ensure that privatization contributes to economic growth, employment creation and poverty reduction.
7.0. POVERTY MONITORING SYSTEM
One of the innovations undertaken in Tanzania is the establishment of a comprehen sive Poverty Monitoring System. The system is now fully operational and is implemented through four (4) technical working groups. These are (i) Censuses and Surveys, (ii) Routine

viii
Data System, (iii) Research and Analysis; and (iv) Dissemination, Sensitiza tion and Advocacy.
• The Technical Working Groups have representation from a wide range of stakeholders
including Government, civil society organizations, representatives from development partners, private sector, and research and academic institutions. They have completed the Household Budget Survey (HBS 2000/01) and Integrated Labour Force Survey. These surveys have greatly informed on the status of poverty in the country. Recently the National Population and Housing Census was carried out throughout the country, the results of which will be published in the near future. Capacity building for data collection and processing at the local government levels is also being addressed.
• Studies have been carried out in the areas of poverty and vulnerability, macro-micro
linkage, urban poverty and geographic diversity of poverty. The first Poverty and Human Development Report has been prepared and Participatory Poverty Assessment (PPA) exercise conducted to get people’s own assessment of poverty. Popularization of policies and strategies on poverty, targeting both upstream policy level and down stream actors has been done. For the first time the Poverty Policy Week was held in September 2002. It is planned that this becomes an annual event to provide a more formal forum for stakeholders’ participation in the national dialogue to inform poverty reduction initiatives and feedback.
• The Government views the PMS as an important vehicle for generating information that
will better inform policy interventions. The government has thus included the cost of poverty monitoring in its budget for 2002/03 financial year and will continue to do so in future budgets. It has created a budget line under the Vice President’s Office for this purpose. Out of about 2.5 billion shillings required for implementing activities of the PMMP during 2002/03, the Government has already committed Tshs. 1.1 billion. A line item has also been established for capacity building on poverty related issues.

1
1.0. INTRODUCTION Preparation process: This second PRS progress report is the first to be prepared after Tanzania reached Completion Point in November 2001. The report is a product of a consultative process involving stakeholders in a number of ways. Views from the poor were gathered through the Participatory Poverty Assessment (PPA) exercise carried out in identified areas covering all the regions in Mainland Tanzania, which focused on vulnerability. The Poverty Policy Week held in mid September 2002 provided opportunity for stakeholders to discuss the outline and contents of the report. This was also done in several meetings involving government ministries, civil society organizations, the private sector and external development partners. The draft report was shared with develop ment partners who offered their comments. The report was further discussed during the Consultative Group Meeting held in December 2-5, 2002 involving all the stakeholders. The objectives of the report: The report highlights the mileage achieved during 2001/02. It provides a synthesized poverty profile in chapter 2.0 – after the new findings under HBS/LFS 2000/01, which provide the baseline data on the status of poverty. Chapter 3 provides information on macroeconomic policies and structural reforms and how they link to poverty reduction. Issues of private sector development, impact of globalization and debt sustainability are also part of this chapter. Chapter 4.0 dwells on implementation status of the key priority sectors for poverty reduction. Sectors report the milestones achieved so far on agreed actions for 2001/02, and spell out steps for 2002/03. Chapter 5.0 contains implementation status on cross cutting issues and the way forward. The RDS is elaborated and implementation status of the Local Government Reform programme is reported. The chapter also introduces a section on development of human capital. Chapter 6.0 reviews the budget framework for poverty reduction programmes including domestic resource mobilization plan and a macroeconomic perspective of resource envelope. Poverty monitoring and evaluation implementation status and the way forward is provided under chapter 7.0, which briefly discusses also the financing of the PMMP.

2
2.0. STATUS OF POVERTY
This chapter presents the status of poverty following completion of analysis of the 2000/01 Household Budget Survey (HBS), the 2000/01 Integrated Labour Force Survey (ILFS) and other selected studies conducted under the Poverty Monitoring System (PMS). 2.1. Progress with analysis of poverty data The HBS 2000/01, covering a sample of 22,178 households, produced a rich data set on income and non-income aspects of poverty. This allows setting of definitive baselines for the PRS, as it provides updates on many of the PRS indicators. It is recalled that at the time of writing the PRSP in 2000, the 1991/92 HBS was the only reliable source for many of the indicators, and was used to determine the baseline for PRS targets. With the HBS 2000/01 results now out some targets have been reviewed, particularly those on income poverty. Apart from providing definitive baseline values for many of the PRS indicators for future PRS monitoring, the 2000/01 HBS also allows us to assess the trend in poverty indicators over the 1990s and address additional dimensions of poverty, notably regional diversity. The Integrated Labour Force Survey contains useful information on the economic activities and employment patterns of the Tanzanian labour force. This helps to gain a better understanding of existing economic opportunities and how they might be strengthened under the PRS. In addition, the ILFS contained a component to assess the extent and nature of child labour in Tanzania. It provides evidence on this important phenomenon, which poses a serious threat to children’s right to education and health. During the design of the Poverty Monitoring System, the Government reaffirmed the need for the voices of the poor to be heard in monitoring progress. The PPA exercise was, therefore, carried out focusing on vulnerability. As part of the activities of the PMS a report on Poverty and Human Development was prepared. As part of the consultative process, the draft report was discussed by stakeholders during the Poverty Policy Week. The PHDR presents an overview of the status of the main poverty indicators, including their trends and magnitudes. It also covers issues of vulnerability and regional diversity of poverty.

3
2.2. Assessment of the poverty situation Overview: The emphasis in this section is the description of the baseline situation for the PRS, using newly available data. With the new data sets from the HBS 2000/01 and the ILFS it has become possible to establish the baselines for the year 2000/01, the year when PRS started to be implemented. Thus the PRS targets in this progress report are based on this baseline information. As we continue to review progress in implementing the PRS and the likelihood of achieving the set targets under the PMS, relevant adjustments will be made in subsequent PRS progress reports to reflect realities on the ground. The analysis of the 2000/01 HBS provides an overview of the PRS indicators, baseline, targets and the diversity of score for different parts of the population. For each indicator, the year and source of the next expected measurement is given, as well as methodological comments where required. In the few instances where very responsive indicators have been chosen (such as enrolment rates), changes since the start of the PRS are reported. Where trend data for the 1990s is available, they are assessed to draw important lessons for the PRS. A more detailed assessment of the poverty situation is presented in the Poverty and Human Development Report (2002), prepared as an important part of this PRS progress report. 2.2.1. Income Poverty Box 1: Indicators and Targets • Halving the proportion of the population below both basic needs and food poverty lines by 2010
with particular focus on the rural poor • Achieve an overall GDP growth of 6% by 2003 • Achieve an agricultural growth rate of at least 5% by 2003 • Expand and improve investment productivity • Develop a private sector strategy by 2003 • Roads: Ø Rehabilitate 4,500 km of feeder, district and regional roads in the 8 poorest regions Ø Upgrade from poor to fair quality about 7,000 km in 12 poorest regions Ø Carry out spot and emergency repairs over an estimated 50,000 km in all districts.
4
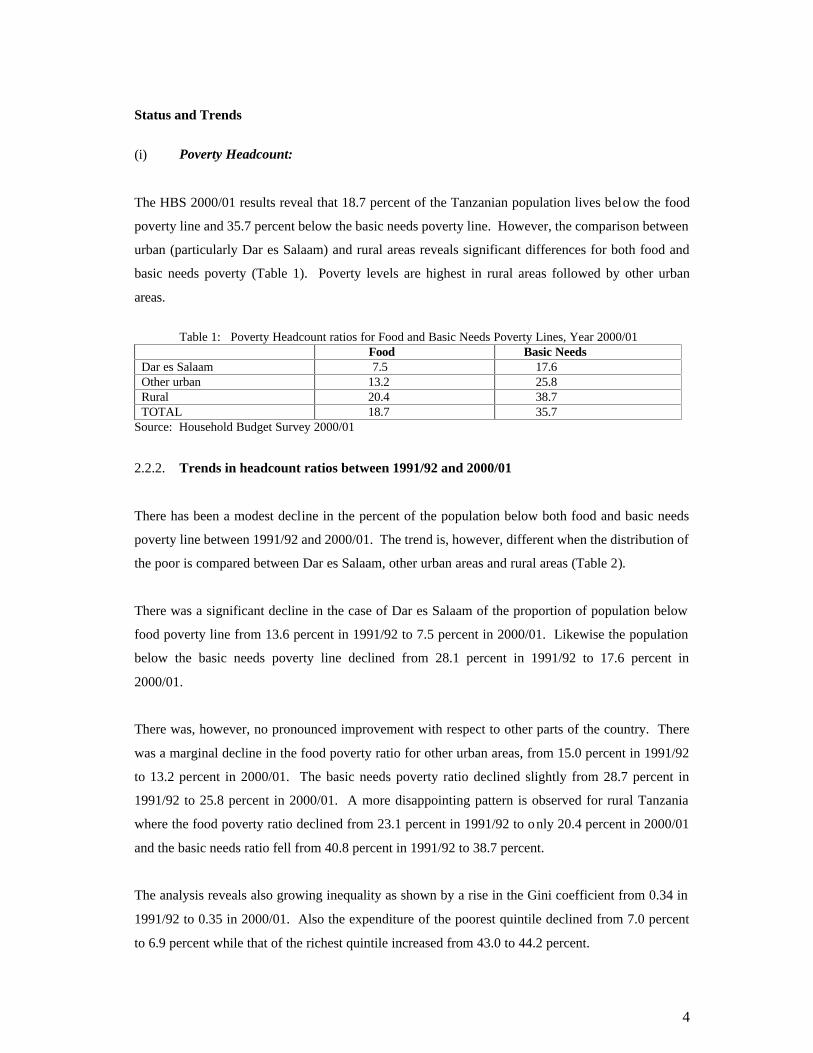
Status and Trends (i) Poverty Headcount: The HBS 2000/01 results reveal that 18.7 percent of the Tanzanian population lives below the food poverty line and 35.7 percent below the basic needs poverty line. However, the comparison between urban (particularly Dar es Salaam) and rural areas reveals significant differences for both food and basic needs poverty (Table 1). Poverty levels are highest in rural areas followed by other urban areas.
Table 1: Poverty Headcount ratios for Food and Basic Needs Poverty Lines, Year 2000/01 Food Basic Needs Dar es Salaam 7.5 17.6 Other urban 13.2 25.8 Rural 20.4 38.7 TOTAL 18.7 35.7
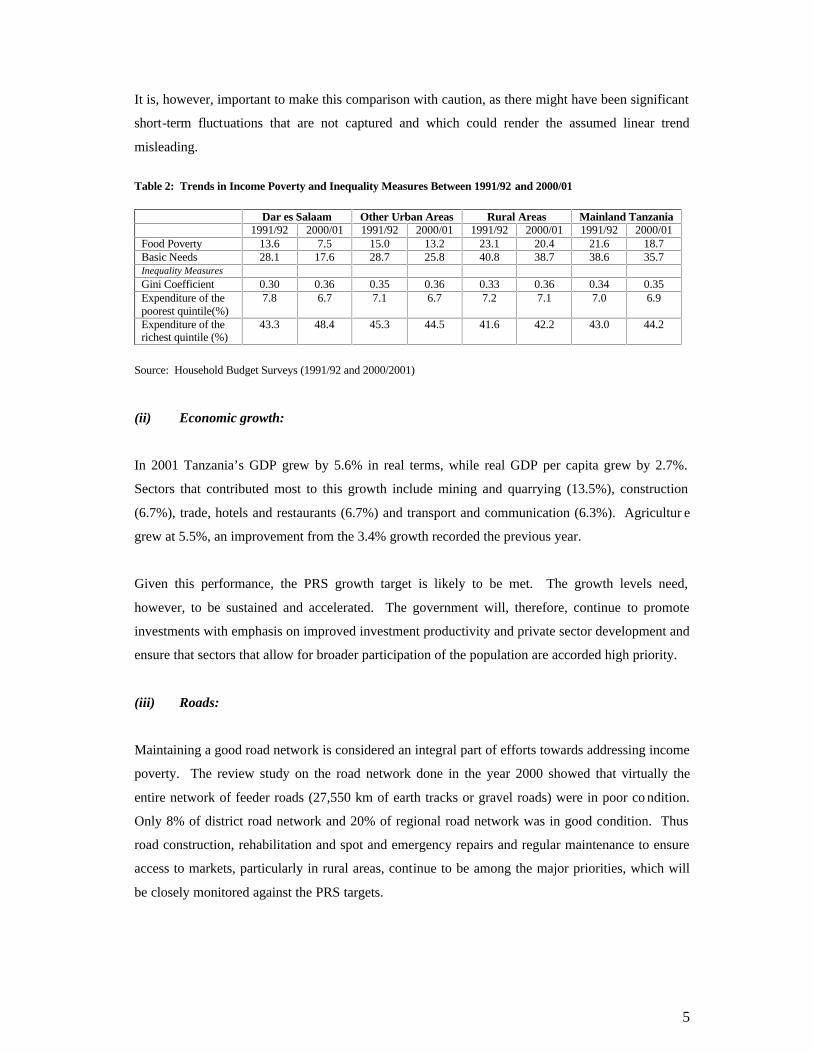
Source: Household Budget Survey 2000/01 2.2.2. Trends in headcount ratios between 1991/92 and 2000/01 There has been a modest decline in the percent of the population below both food and basic needs poverty line between 1991/92 and 2000/01. The trend is, however, different when the distribution of the poor is compared between Dar es Salaam, other urban areas and rural areas (Table 2). There was a significant decline in the case of Dar es Salaam of the proportion of population below food poverty line from 13.6 percent in 1991/92 to 7.5 percent in 2000/01. Likewise the population below the basic needs poverty line declined from 28.1 percent in 1991/92 to 17.6 percent in 2000/01. There was, however, no pronounced improvement with respect to other parts of the country. There was a marginal decline in the food poverty ratio for other urban areas, from 15.0 percent in 1991/92 to 13.2 percent in 2000/01. The basic needs poverty ratio declined slightly from 28.7 percent in 1991/92 to 25.8 percent in 2000/01. A more disappointing pattern is observed for rural Tanzania where the food poverty ratio declined from 23.1 percent in 1991/92 to only 20.4 percent in 2000/01 and the basic needs ratio fell from 40.8 percent in 1991/92 to 38.7 percent. The analysis reveals also growing inequality as shown by a rise in the Gini coefficient from 0.34 in 1991/92 to 0.35 in 2000/01. Also the expenditure of the poorest quintile declined from 7.0 percent to 6.9 percent while that of the richest quintile increased from 43.0 to 44.2 percent.
5
It is, however, important to make this comparison with caution, as there might have been significant short-term fluctuations that are not captured and which could render the assumed linear trend misleading. Table 2: Trends in Income Poverty and Inequality Measures Between 1991/92 and 2000/01
Dar es Salaam Other Urban Areas Rural Areas Mainland Tanzania 1991/92 2000/01 1991/92 2000/01 1991/92 2000/01 1991/92 2000/01 Food Poverty 13.6 7.5 15.0 13.2 23.1 20.4 21.6 18.7 Basic Needs 28.1 17.6 28.7 25.8 40.8 38.7 38.6 35.7 Inequality Measures Gini Coefficient 0.30 0.36 0.35 0.36 0.33 0.36 0.34 0.35 Expenditure of the poorest quintile(%)
7.8 6.7 7.1 6.7 7.2 7.1 7.0 6.9
Expenditure of the richest quintile (%)
43.3 48.4 45.3 44.5 41.6 42.2 43.0 44.2
Source: Household Budget Surveys (1991/92 and 2000/2001) (ii) Economic growth: In 2001 Tanzania’s GDP grew by 5.6% in real terms, while real GDP per capita grew by 2.7%. Sectors that contributed most to this growth include mining and quarrying (13.5%), construction (6.7%), trade, hotels and restaurants (6.7%) and transport and communication (6.3%). Agricultur e grew at 5.5%, an improvement from the 3.4% growth recorded the previous year. Given this performance, the PRS growth target is likely to be met. The growth levels need, however, to be sustained and accelerated. The government will, therefore, continue to promote investments with emphasis on improved investment productivity and private sector development and ensure that sectors that allow for broader participation of the population are accorded high priority. (iii) Roads: Maintaining a good road network is considered an integral part of efforts towards addressing income poverty. The review study on the road network done in the year 2000 showed that virtually the entire network of feeder roads (27,550 km of earth tracks or gravel roads) were in poor co ndition. Only 8% of district road network and 20% of regional road network was in good condition. Thus road construction, rehabilitation and spot and emergency repairs and regular maintenance to ensure access to markets, particularly in rural areas, continue to be among the major priorities, which will be closely monitored against the PRS targets.
6
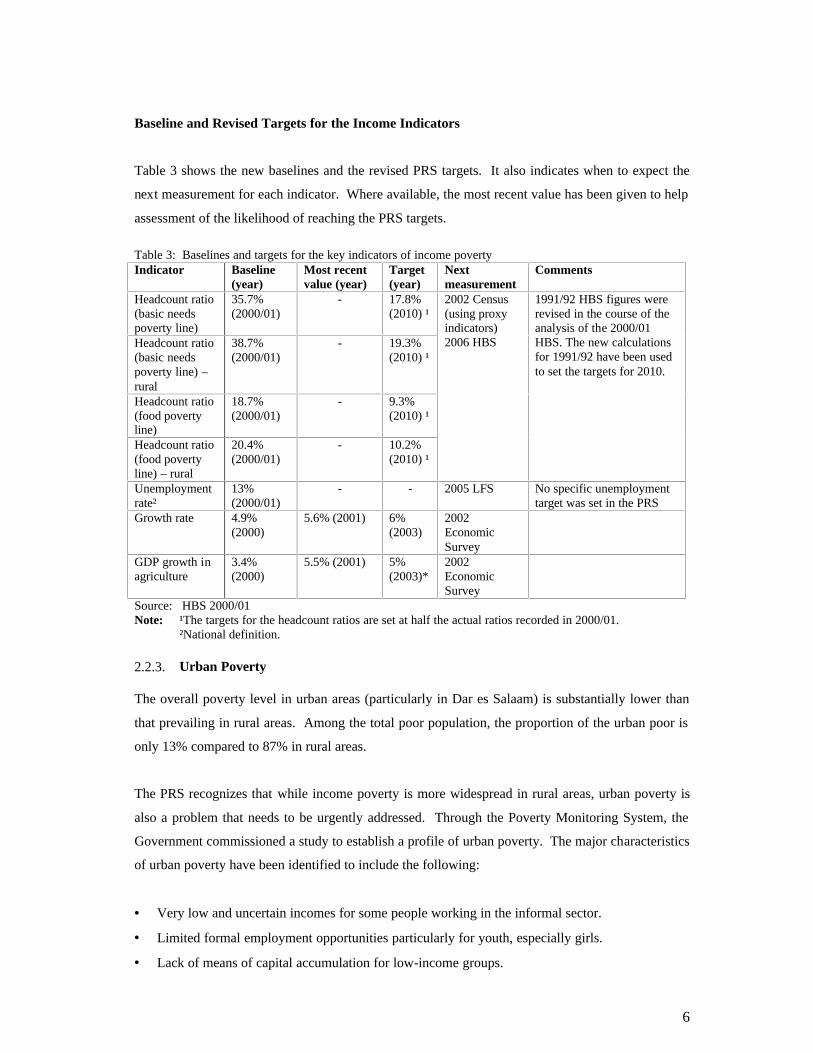
Baseline and Revised Targets for the Income Indicators Table 3 shows the new baselines and the revised PRS targets. It also indicates when to expect the next measurement for each indicator. Where available, the most recent value has been given to help assessment of the likelihood of reaching the PRS targets. Table 3: Baselines and targets for the key indicators of income poverty Indicator Baseline
(year) Most recent value (year)
Target (year)
Next measurement
Comments
Headcount ratio (basic needs poverty line)
35.7% (2000/01)
- 17.8% (2010) ¹
Headcount ratio (basic needs poverty line) – rural
38.7% (2000/01)
- 19.3% (2010) ¹
Headcount ratio (food poverty line)
18.7% (2000/01)
- 9.3% (2010) ¹
Headcount ratio (food poverty line) – rural
20.4% (2000/01)
- 10.2% (2010) ¹
2002 Census (using proxy indicators) 2006 HBS
1991/92 HBS figures were revised in the course of the analysis of the 2000/01 HBS. The new calculations for 1991/92 have been used to set the targets for 2010.
Unemployment rate²
13% (2000/01)
- - 2005 LFS No specific unemployment target was set in the PRS
Growth rate 4.9% (2000)
5.6% (2001) 6% (2003)
2002 Economic Survey
GDP growth in agriculture
3.4% (2000)
5.5% (2001) 5% (2003)*
2002 Economic Survey
Source: HBS 2000/01 Note: ¹The targets for the headcount ratios are set at half the actual ratios recorded in 2000/01. ²National definition. 2.2.3. Urban Poverty The overall poverty level in urban areas (particularly in Dar es Salaam) is substantially lower than that prevailing in rural areas. Among the total poor population, the proportion of the urban poor is only 13% compared to 87% in rural areas. The PRS recognizes that while income poverty is more widespread in rural areas, urban poverty is also a problem that needs to be urgently addressed. Through the Poverty Monitoring System, the Government commissioned a study to establish a profile of urban poverty. The major characteristics of urban poverty have been identified to include the following: • Very low and uncertain incomes for some people working in the informal sector. • Limited formal employment opportunities particularly for youth, especially girls. • Lack of means of capital accumulation for low-income groups.

7
• Very poor conditions for some people living in unplanned settlements. • Hopelessness and very distant proximity to the processes of decision making for some specific
poor groups, e.g., street beggars, and • People working in hazardous areas. A detailed profile of urban poverty, focusing on urban informal sector, living conditions, land ownership and access to social services, is given in the Poverty and Human Development Report. Implications for future policy measures and actions: There are three major observations emanating from the income poverty trend. First, with the exception of Dar es Salaam, poverty levels have not decreased significantly over the last decade and the poverty ratio figures are still very high. Considering the increase in population over the decade, the absolute number of the poor may have actually increased despite the marginal percentage decline of the population below both food and basic needs poverty lines. This assessment however needs to be gauged against the impressive growth performance and improvement in non-income dimensions of poverty, which provide impetus for more impact on poverty in the coming years. Second, the poverty burden has continued to weigh heavily on the rural population. This reaffirms the rationale for continued focus on rural development, and calls for increased efforts to ensure vigorous implementation of the Rural Development Strategy and the Agriculture Sector Development Strategy. Third, inequality, as measured by the Gini-coefficient and by the consumption share of each of the five quintiles of population, has increased. Inequality is notably higher in Dar es Salaam, implying that either the severity of poverty has increased (the poor being further away from the poverty line), or the rich have become richer, or both. A more careful investigation of the nature of the growing inequality will be carried out with the intention of devising targeted poverty interventions to address the situation. One of the most important lessons is that, although poverty is widespread in Tanzania, there are significant differences in the level and nature of poverty for different population groups and for different parts of the country. This suggests the need for regional and district poverty reduction strategies reflecting this diversity of poverty and area specific characteristics.

8
2.3. Non-Income Poverty The indicators of non-income poverty in the PRS are grouped under 4 main categories, namely: (i) human capabilities (ii) survival (iii) nutrition, and (iv) extreme vulnerability. A detailed discussion of the status and trends in non-income poverty is in the Poverty and Human Development Report. (a) Human capability Box 2: Indicators and Targets
• Reduce illiteracy by 100% by 2010 • Increase gross enrolment rate in primary schools to 85% by 2003 • Increase net enrolment rate in primary schools to 70% by 2003 • Reduce drop out rate in primary schools to 3% by 2003 • Increase the proportion of children passing Standard VII Examination to 50% by 2003 • Increase transition rate from primary to secondary school to 21% by 2003 • Increase the enrolment in secondary schools to 7% by 2003 • Achieve gender equity in enrolment rates in primary and secondary school by 2003 • Increase percentage of rural population with access to safe water to 85% by 2010
Status and Trends: Primary Education Tangible PRS results are reflected in the impressive rise in enrolment rates as a result of the implementation of the Primary Education Development Programme (PEDP). Gross enrolment reached 100.4 percent in 2002 compared to 77.6 percent in 1990, while net enrolment rose from 58.8 percent in 1990 to 85 percent in 2002. This is in response to the abolition of school fees, concerted enrolment drive supported by all levels of government and communities, including construction of new classrooms, recruitment of additional teachers and improvement in nutritional intake. The efforts at boosting enrollment levels are aimed at children at the age of 7-10. Although gender parity in primary education at national level has almost been achieved, there remain concerns of gender inequities at the higher levels of secondary and tertiary education. Indeed, the real gender issues in education go beyond enrolment, and are to do with performance and dropout of girls during the final stages of primary education and throughout secondary education. Gender relations in the classroom and in the curriculum will receive continued attention during implementation of the PRS.

9
Overall, however, progress on education indicators has been very impressive. It is important though to keep in mind the existing significant performance related disparities in view of the HBS analysis, which indicate that urban areas fare better on education indicators compared to rural areas. Access to safe water: There has been an increase in the use of improved sources of drinking water in rural areas over the 1990s. In Dar es Salaam, however, the proportion of households using improved water has fallen during the period. Other urban areas report little change. In spite of the overall improvement, nearly half of the households in Mainland Tanzania and over half of rural households use water from sources that cannot be considered safe. In order to reach the PRS targ et for 2010, the rate of improvement in rural areas needs to be accelerated. The government will thus ensure that adequate resources are allocated to provision of rural water. Literacy: The 2000/01 HBS provides estimates on the literacy status in Tanzan ia (Table 4). The survey asked respondents of 15 years of age and older about literacy in English, Swahili or other languages. It found out that 28.6 percent of the Tanzania population cannot read and write in any language. There is more illiteracy among women (36 percent) than men (20.4 percent). Dar es Salaam showed the lowest proportion of illiteracy (8.7 percent of the total population). The highest level of illiteracy is found in the rural population (33.1 percent), with women accounting for 41.2 percent compared with 23.9 percent for rural men. Table 4: Illiteracy Rate
Illiteracy Rate for Adult Males
Illiteracy Rate for Adult Women
Total Illiteracy Rate
Dar es Salaam 5.7 11.7 8.7 Other Urban 8.5 19.0 14.2 Rural 23.9 41.2 33.1 Total 20.4 36.0 28.6 Source: Household Budget Survey 2000/01 Baseline and Revised Targets: Table 5 provides figures for indicators for human capabilities for both baseline and targets, together with the most recent value and the PRS target for each of the human capability indicators.

10
Table 5: Baseline and Targets for Human Capability Indicators Indicator Baseline (year) Most recent
value (year) Target (year) Next
measurement Comments
Illiteracy rate 28.6% (2000/1) 30.88% (2002) 0% (2012) 2002 Census Trend is consistent
Gross enrolment rate (primary)
77.6% (2000) 100.4% (2002) 100.3% (2003) 2004 BSE Presence of over age pupils
Net enrolment rate (primary)
58.8% (2000) 85.0% (2002) 90% (2005) 2004 BSE Increase of official age
Drop-out rate (primary)
6.6% (2000) 5.5% (2001) 3% (2005) 2004 BSE Abolition of mandatory contribution
Pass rate Std 7 22% (2000) 28.6% (2001) 50% (2005) 2004 BSE Conducive T/L environment
Transition rate primary – secondary
21.7% (2000) 21.7% (2000) 28% (2005) 2004 BSE Expansion of secondary schools
Secondary Growth Enrolment Rate (GER)
6.6% (2001) 6.6 (2001) 8% (2005) 2004 BSE Expansion of secondary schools
Secondary Net Enrolment Rate (NER)
5.5% (2001) 5.5% (2001) 6.5% (2005) 2004 BSE Expansion of secondary schools
Girl/boy ratio – primary
0.98% (2000) 0.97% (2001) 1% (2005) 2004 BSE The right to education
Girl/boy ratio – secondary
0.85 (2000) 0.86 (2001) 0.90% (2005) 2004 BSE The right to education
Population with access to safe water (rural)
48.5% (2000) 50% (2001) 55% (2003) 85% (2010)
2002 Census
Source: HBS 2000/01 Implications for future policy measures and actions: • The increased enrolment under the Primary Education Development Programme (PEDP) puts a
new strain on the education system and on the quality of the services it provides. This calls for measures to ensure quality improvement. As elaborated in chapter 4 the Government has initiated measures to enhance the quality of education.
• As efforts to boost enrolment focus on younger children, the government is aware that there is still a group of children whose right to education is at risk because they are “over -age” and cannot presently be accommodated in primary schools. The Government is developing a strategy to ensure that complimentary education schemes such as COBET and ICBAE are expanded drastically to cater for these children.
• The government will maintain its policy of abolition of school fees to ensure access to education for all children, boys and girls, especially from the poorest households.
• To improve adult literacy, efforts will also be directed towards reviving adult education particularly for rural areas, targeting women in particular.

11
(b) Survival Box 3: Indicators and Targets • Reduce infant mortality rate from 99 per 1000 live births to 85 per 1000 by 2003 • Reduce under-five mortality by half from 158 per 1000 live births to 79 by 2010 • Increase the percentage of children under 2 years immunized against measles and DPT from
71% to 85% by 2003 • Contain sero-positive prevalence rate in pregnant women from 5.5 – 23% (1996) to 6 – 27% in
2010 • Ensure 75% of districts are covered by an active HIVAIDS awareness campaign • Reduce maternal mortality by half from 529 per 100,000 to 265 per 100,000 by 2010 • Increase coverage of births attended by trained personnel from 50% to 80% (by 2010) • Decrease malaria in-patient case fatality rate for under-fives from 12.85 (1997) to 8% by 2010 • Restore life expectancy to 52 years by 2010 Status and Trends: The 1990s showed no substantial progress in the reduction of infant and under-five mortality. There are even indications of slight increases in recent years, probably related to HIV/AIDS pandemic. This provides a major challenge as far as the PRS targets are concerned. To achieve them, a holistic approach to children's right to survival is desired and would be taken on board in the fight against poverty, HIV/AIDS, malaria and other infectious diseases. Immunization levels have increased but there are still large disparities, which require a more targeted approach in the delivery of preventive and curative health services. HIV prevalence rate shows a worrying trend, particularly for women of young age. Certainly HIV/AIDS is a threat to the attainment of the PRS objectives. The government endeavours, therefore, to build a deeper understanding of the pandemic through awareness campaigns with the aim to contain its further spread and thus minimize its impact. Data on the proportion of births attended by trained personnel show little improvement in access to reproductive health care over the 1990s. PRS aims to address this because of the importance of these services for ensuring safe motherhood and to containing the further spread of HIV/AIDS. A detailed situational analysis and policy implications can be found in the PHDR (2002). Life Expectancy: The PRS aims to restore life expectancy at birth to 52 years by 2010. The last reliable nation-wide life expectancy figures were based on the 1988 census. A new population and housing census was conducted this year and will provide the first update on life expectancy and the next Poverty and Human Development Report will report on life expectancy and other demographic indicators in more detail.

12
Baseline and Revised Targets: Table 6 below shows the baseline position and the target for each of the survival indicators: Table 6: Baseline and Targets for Survival Indicators Indicator Baseline (year) Target (year) Next
measurement Comments
Infant Mortality Rate
99 (1997) 85 (2003) 50 (2010) 20 (2025)
Under-five Mortality Rate
147 (1997) 127 (2003) 79 (2010)
2002 Census Infant and under-five mortality were most recently measured in the 1999 Tanzania Reproductive and Child Health Survey. However, as the figures refer to a five year recall period, they describe the situation in 1995-1999. Therefore, 1997, the mid-point of this period, is given as baseline year.
Life expectancy To be set by 2002 Census
52 (2010) 2002 Census
Seropositive rate in pregnant women
5.5%-23% 6-27% (2010) 2002 NACP surveillance
Maternal mortality rate
529 (1994) 450 (2003) 265 (2010)
2004 DHS Maternal mortality was most recently measured in the 1999 Tanzania Reproductive and Child Health Survey. However, as the figure refers to a five year recall period, it describes the situation in 1992-1996. Therefore, 1994, the mid-point of this period, is given as baseline year.
Births attended by a skilled health worker
36% (1999) 80% (2010) 2004 DHS Proxy indicator for access to reproductive health care
Malaria in-patient case fatality rate for under-fives
12.8% (1999) 10% (2003) 8% (2010)
Marlaria control programme data 2002
HMIS cannot currently measure this indicator reliably. Alternative indicator(s) to be adopted from the National Malaria Control Programmes coming from the annual reports
Children under 2 years immunised against measles and DPT
DPT: 81% (1999) Measles: 78% (1999)
85% (2003) 2004 DHS
Source: HBS 2000/01 Implications for future policy measures and actions: • Failure to record progress in reducing infant and under-five mortality rates is a matter of serious
concern to the government. Concerted efforts will be directed towards finding measures for increased strides in containing malaria and other infectious diseases, reducing income poverty,

13
and containing the further spread of HIV/AIDS. In addition immunization campaigns will be intensified with special focus on poor households in disadvantaged districts in rural areas.
• As regards maternal mortality, the government will continue to boost access to good quality
reproductive health care particularly to poor rural women. (c) Nutrition Box 4: Indicators and Targets
• Reduced prevalence of stunting from 43.4% to 20% by 2010 • Reduced prevalence of wasting from 7.2% to2% by 2010
Status and Trends: Little progress was achieved during the 1990s with regard to improvement of nutrition rates for children. There are significant disparities in the levels of under-nutrition between rural and urban areas, and between children from poorer and richer households. For example, the children of the poorest 20% of households are four times as likely to be severely underweight than the children of the richest 20%. It is intended that under the PRS, there will be progress in the reduction of nutritional problems for children through its focus on the reduction of income poverty and the control of disease. It also includes support for the enhancement of the capacity of communities to monitor the growth of children and take corrective actions, and support measures to discourage inappropriate feeding practices and address underlying gender issues. Baseline and Revised Targets: Table 7 shows the baseline situation in 1999 and the PRS targets for the nutrition indicators: Table 7: Baseline and Targets for Nutrition Indicators Indicator Baseline (year) Target (year) Next measurement Comments Prevalence of stunting
44% (1999) 20%
Prevalence of wasting
5% (1999) 2%
Prevalence of underweight
29% (1999) No target set
2004 DHS Underweight added as additional nutrition indicator.
Implications for future policy measures and action: The PHDR shows close correlation between the poverty status of households and nutritional status. Thus, by addressing income poverty the nutritional status of the households will also change. Equally important is the need to control diseases, improve feeding practices through enhanced
14
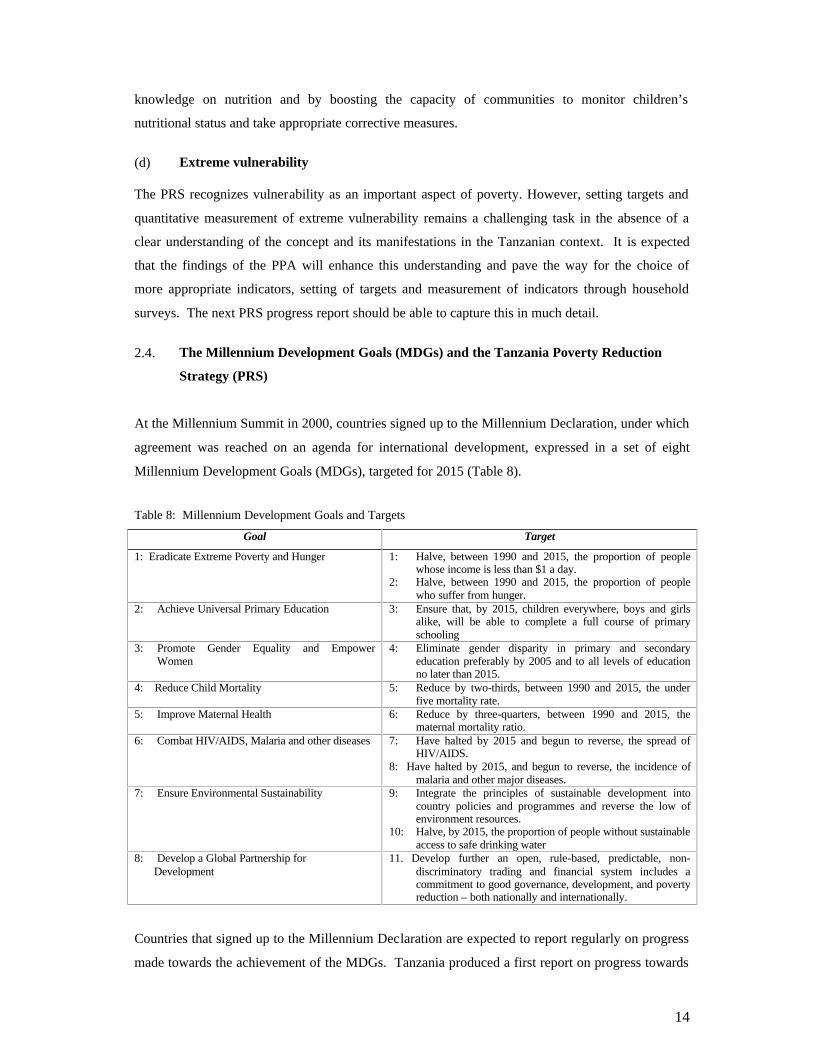
knowledge on nutrition and by boosting the capacity of communities to monitor children’s nutritional status and take appropriate corrective measures. (d) Extreme vulnerability The PRS recognizes vulnerability as an important aspect of poverty. However, setting targets and quantitative measurement of extreme vulnerability remains a challenging task in the absence of a clear understanding of the concept and its manifestations in the Tanzanian context. It is expected that the findings of the PPA will enhance this understanding and pave the way for the choice of more appropriate indicators, setting of targets and measurement of indicators through household surveys. The next PRS progress report should be able to capture this in much detail. 2.4. The Millennium Development Goals (MDGs) and the Tanzania Poverty Reduction
Strategy (PRS) At the Millennium Summit in 2000, countries signed up to the Millennium Declaration, under which agreement was reached on an agenda for international development, expressed in a set of eight Millennium Development Goals (MDGs), targeted for 2015 (Table 8). Table 8: Millennium Development Goals and Targets
Goal Target 1: Eradicate Extreme Poverty and Hunger 1: Halve, between 1990 and 2015, the proportion of people
whose income is less than $1 a day. 2: Halve, between 1990 and 2015, the proportion of people
who suffer from hunger. 2: Achieve Universal Primary Education 3: Ensure that, by 2015, children everywhere, boys and girls
alike, will be able to complete a full course of primary schooling
3: Promote Gender Equality and Empower Women
4: Eliminate gender disparity in primary and secondary education preferably by 2005 and to all levels of education no later than 2015.
4: Reduce Child Mortality 5: Reduce by two-thirds, between 1990 and 2015, the under five mortality rate.
5: Improve Maternal Health 6: Reduce by three-quarters, between 1990 and 2015, the maternal mortality ratio.
6: Combat HIV/AIDS, Malaria and other diseases 7: Have halted by 2015 and begun to reverse, the spread of HIV/AIDS.
8: Have halted by 2015, and begun to reverse, the incidence of malaria and other major diseases.
7: Ensure Environmental Sustainability 9: Integrate the principles of sustainable development into country policies and programmes and reverse the low of environment resources.
10: Halve, by 2015, the proportion of people without sustainable access to safe drinking water
8: Develop a Global Partnership for Development
11. Develop further an open, rule-based, predictable, non-discriminatory trading and financial system includes a commitment to good governance, development, and poverty reduction – both nationally and internationally.
Countries that signed up to the Millennium Declaration are expected to report regularly on progress made towards the achievement of the MDGs. Tanzania produced a first report on progress towards

15
the MDGs in 2001 and a report on costing the achievements of the MDGs in 2002. The report also indicated the likelihood of achieving the targets for Tanzania. Challenges ahead for MDG monitoring: The government has put in place a sound policy framework for poverty reduction and a comprehensive Poverty Monitoring System. There are, however, challenges that have to be faced in regard to monitoring progress towards achieving MDGs. The first challenge is to fully integrate MDGs into the national policy framework and poverty monitoring system. Whereas most of the goals and targets are already incorporated in the policy framework and the monitoring system, some remain to be addressed. This is particularly the case, for example, with MDGs that address environmental sustainability. The second challenge is to start addressing equity issues in relation to MDGs. The reports produced so far have focused on national averages, but for national policy making, it would be more helpful to explore how the status of MDG indicators differ by sex, rural/urban strata, region and so forth, in order to strengthen the national policies and strategies and make them more targeted and effective. The third challenge relates to the resources required to reach the MDG targets. Achieving the targets is beyond the current magnitude of government financial resources. The fourth challenge is the HIV/AIDS pandemic. HIV/AIDS will have a severe impact on the achievement of the MDGs. Failure to curb its further spread has real developmental implications as the resources, which could be allocated to reaching the goals, will be diverted to fighting the HIV/AIDS epidemic. It is important to take collective responsibility in the fight against the pandemic. Ongoing Activities: The Government is in the process of integrating fully the MDGs and monitoring of progress towards their achievement into the PRS process. There are two important factors in this endeavour: (i) The MDGs have a more distant time horizon than the PRS. Integrating the MDGs into the
PRS process will facilitate coherence between short-term and long-term poverty reduction targets. This will also reinforce linkages between the Vision 2025, the NPES and the PRS.
(ii) Integrating MDG monitoring with PRS will avoid proliferation of monitoring processes.

16
The Government has initiated detailed analytical work on the eight MDGs and the corresponding list of indicators in relation to the national policy framework and the national poverty monitoring system. This analysis will highlight any gaps and discrepancies that exist, and will form the basis of measures to integrate the MDGs more firmly into the PRS policy framework. Overall, however, the MDGs are fairly well covered in the policy framework. The next PRS Progress Report and the next Poverty and Human Development Report will document progress towards the MDGs as part of overall progress reporting. 2.5. Next steps: The PRS progress report for 2003 will include the findings of the Participatory Poverty Assessment (PPA) and will use these findings to draw conclusions on whether vulnerability is adequately addressed in the PRS in its current form or whether there is need for improvement. The most significant new data collection exercise in 2002/03 is the Population and Housing Census (August/September 2002). The importance of the Census for the assessment of the poverty situation in the country cannot be over-emphasised. Firstly, many of the poverty indicators are expressed as a rate, with population figures used as denominator. In the absence of recent population figures, these rates may well be unreliable by now. The results of the Census will rectify this situation. Secondly, the Census will measure directly a range of poverty indicators such as mortality and literacy rates. Thirdly, those indicators that are measured directly through the Census can be analysed at a very high level of disaggregation because the Census is administered to the whole population. This will be invaluable when attempting to make the PRS respond to local specific problems and when translating the national strategy into local action. Fourthly, the Census will lay the foundation for detailed poverty mapping, using the proxy indicators for income poverty, which have been included in the Census questionnaire. This will, for example, enable the estimation of the level of income poverty at district level. Full results of the Census are not expected until the second half of 2003, and the next PRS progress report will endeavour to report on preliminary findings of the census. The Surveys and Census Technical Working Group is also preparing to conduct an Agriculture Survey in 2003. The Survey is planned to include a consumption module to provide a clearer understanding of the linkages between poverty and agriculture. Given the importance of the agriculture sector in poverty reduction, this survey wil l also provide a crucial data set, which will inform the implementation of the PRS as well as the Rural Development Strategy and the Agriculture Sector Development Strategy.

17
3.0. SOCIO-ECONOMIC REFORMS IN 2001/02 3.1. Macroeconomic Performance Tanzania’s macroeconomic performance has continued to improve in 2001 and 2002. The annual growth rate reached 5.6 percent in 2001 and is projected to rise to 5.9 percent in 2002 despite substantial loss in the terms of trade. The rise in growth in 2001 was att ributed to relatively strong performance in agriculture, mining, wholesale and retail trade, as well as manufacturing. The agriculture sector grew by 5.5 percent in 2001 up from 3.4 percent in 2000, with most of the growth emanating from crop production and fishing. The growth of the mining sector remained strong at 13.2 percent and increased its contribution to GDP to 2.5 percent from a negligible level of 1.7 percent in 1997. Wholesale and retail trade (including tourism) rose by 7 percent in 2001. Industry – incorporating manufacturing, utilities, construction, transport and communication, rose at an average of 6 percent, representing overall improvement over the year 2000. While overall investment as a percentage of GDP did not increase significantl y between 2000 and 2001, foreign direct investment (FDI) during the period rose by 16.6 percent up from US$ 192.8 million to US$ 224.8 million. Increased government expenditure in the priority sectors, enhanced the growth of public administration and other services, from 2.7 percent in 1997 to 3.5 percent in 2001. Inflation as measured by the National Consumer Price Index (CPI) has continued to decline and was 4.5 percent by end June 2002. This decline is attributed to steady implementation of conservativ e fiscal policies supported by a cautious monetary policy. This provides a conducive environment for poverty reduction. The current account deficit (before grants) of the Balance of Payments has continued to decline from over 12 percent of GDP in 1999 to less than 10 percent in 2001, partly due to the coming on stream of gold exports. The recent performance in merchandize exports has recorded improvement following declining trend during 1996-1999. With the continued decline in the world commodity prices of Tanzania’s major primary exports, the structure of merchandize exports has shifted away from the dominance of traditional agricultural commodities towards non-traditional exports (minerals, fish and fish products, horticultural products and manufactured goods) which now account for more than 55 percent of merchandize exports. The export of services largely from transport and tourism has also increased in recent years, contributing about 50 percent to the total value of recorded exports. These developments, together with foreign programme assistance and debt relief under the enhanced HIPC initiative, have contributed to further strengthening of

18
international reserves. Gross official reserves increased steadily to the equivalent of 6 months of import cover of goods and non-factor services. Domestic resource mobilization has continued to improve following reforms in tax administration and revenue enhancing measures. Nonetheless the Government recognizes that more measures need to be taken to enhance the revenue yield. The adoption of the Public Expenditure Review (PER) and the Medium Term Expenditure Framework (MTEF) process, the Integrated Financial Management System (IFMS), and the new Acts on Public Finance and Public Procurement have substantially improved budget management, transparency and accountability. These processes have facilitated increased integration of donor finance into programme financing notably through the Government budget frame. The inter-bank foreign exchange market (IFEM) has continued to determine (freely) the exchange rate, with the intervention of the Bank of Tanzania limited to smoothening short-term fluctuations and occasional needs for meeting reserve targets. In the period under review, the exchange rate of the Tanzania shilling has been fairly volatile, mostly due to increased import demand, both for investment and consumption goods. The rate in the IFEM depreciated from shs. 888.9 per US Dollar in June 2001 to around shs. 980.00 per US Dollar by end-June 2002, before sliding back to around shs. 960.00 thereafter.
Average savings deposit interest rate declined from 4.2 percent in June 2001 to 3.5 percent by June 2002, while average lending rate declined from 19.6 percent to 16.4 percent over the same period. The spread between deposit and lending rates has remained wide, in spite of declining inflation over the period. While recent developments show that lending rates are becoming more flexible, the differential between short-term lending rates and deposit rates has remained particularly high during the period, with some deposit rates turning negative in real terms. Weaknesses in the legal and structural regime, (e.g. collateral enforcement) explain in part, the rigidity in the lending rates. The government is addressing these constraints with vigour (see 3.3). Table 9: Trends in Selected Macroeconomic Indicators (1997-2002)
1997 1998 1999 2000 2001 Real GDP growth (%) 3.3 4.0 4.7 4.9 5.6 Per capita income – Tshs. 147,026.3 170,732.7 193,169.2 208,894.0 231,426.0 Per capita income – USD 240.2 256.9 259.4 261.2 264.1 Population estimates (million) * 29.1 30.0 30.9 31.9 32.9 Real growth of agriculture (%) 2.4 1.9 4.1 3.4 5.5 Real growth of manufacturing (%) 5.0 8.0 3.6 4.8 5.0 Inflation (%) – annual average 16.1 12.9 7.8 6.0 5.2 Inflation (%) – year on year 15.4 11.2 7.0 5.5 4.9 Merchandize exports – USD (million) 752.6 588.5 543.3 663.2 776.4 Current a/c balance - USD (million) -372.3 -826.9 -738.6 -388.4 -413.5

19
Foreign reserves (months of imports) 4.1 3.3 4.2 5.6 6.0 Exchange rate (annual average) Tshs. 612.1 664.7 744.8 808.4 876.4 Exchange rate (end of period) 624.6 668.0 797.3 803.3 916.3 Investments (% of GDP) 14.8 16.2 15.5 17.6 17.4 External debt service (% of exports) 36.9 36.4 27.2 28.6 21.6 1997/98 1998/99 1999/00 2000/01 2001/02 Domestic revenue (% of GDP) 12.6 12.5 11.3 12.2 12.2 Total government expenditure (% of GDP)
14.8 14.8 17.1 16.8 18.8
Fiscal deficit (before grants) – (% of GDP)
-2.4 -2.3 -5.8 -4.6 -6.6
Growth of money supply (M2) % 5.0 7.9 15.2 14.9 12.3 Average savings deposit interest rate (%)
10.0 7.9 7.1 4.2 3.5
Average lending interest rate (%) 24.0 24.5 22.1 19.6 16.4 * Based on 1988 population census Sources: National Bureau of Statistics; Ministry of Finance; Bank of Tanzania 3.1.1. Structural Reforms: The Government is committed to improving the quality of public service delivery and is taking a series of measures to that end, including the following: • A range of legal, regulatory and administrative reforms are under implementation, with a view
to strengthening integrity of government’s public financial management. • Progress in public financial management reform was reviewed in depth in 2001 as part of a
Country Financial Accountability Assessment. The findings of the review have been incorporated in a revised Public Financial Management Reform Programme.
• Public Expenditure Review process is well established, to monitor, inform and improve the
quality of government spending in line with the PRS priorities and targets. The process is very transparent, involving the participation of all interested stakeholders including political parties, civil society, the donor community, faith organs and government ministries, departments and agencies (MDAs).
• An “expenditure tracking” study was conducted in 2001 as part of PRSP/HIPC, and it revealed
that Tanzania has made very positive progress relative to other 22 countries included in the study. Tanzania met 8 of the 15 benchmarks and made encouraging progress on the remaining 7 benchmarks.
• The Government is publishing quarterly budget execution reports, drawn from the Integrated
Financial Management System (IFMS). The government is also publishing in newspapers,

20
information on budget resource transfers to ministries, departments and agencies, including local government authorities. Individual and consolidated quarterly revenue and expenditure accounts of local governments are also underway for publication.
• This year has seen even further increased transparency and political debate in the media on
budget proposals for 2002/03. • A new National Debt Strategy has been developed to guide overall debt management with a
view to ensuring debt sustainability. An important feature of the debt strategy is the tightening of approval procedures for new borrowings.
• A new Public Finance Act (PFA) and a new Public Procurement Act (PPA) were enacted by
Parliament and became effective from July 1, 2001. The Public Service Act was passed by Parliament in April 2002, which will enable better enforcement of sanctions and disciplinary measures against non-compliance with financial and procurement regulations.
• The Office of the Controller and Auditor General (OCAG) has been reformed into National
Audit Office (NAO) with greater independence and improved access to resources. 3.1.2. Linking Macro Policies, Growth and Poverty Reduction: As noted in previous sections, the performance of the Tanzanian economy at the macro level has been impressive. The Africa Competitiveness Report (2000) ranks Tanzania among the top most improved countries in Sub-Saharan Africa. This view is also shared by the World Bank and the Intelligence Unit of the Economist Magazine (1999). A notable outcome of the macroeconomic stability and moderate growth achieved over recent years is the improved fiscal performance. The Government has steadily increased budget allocations to PRS priority sectors mostly education, health, water and roads. The HBS 2000/01 also noted improvement in housing conditions, increased possession of consumer durables, decrease in distance to markets, shops, public transport etc., which are all pointers to improvement in welfare as a result of good macroeconomic performance. However, this improvement is not captured in the expenditure variables used to calculate poverty headcounts and hence potentially understating the decline in poverty incidence. The challenge remains on how to transform the good macro performance into micro level benefits, which would create more appreciation at the individual, micro level, an issue to be further explored. As part of the response package, the Government will continue to strengthen ties between the rural and urban economy, improve rural infrastructure, encourage development of SMEs, facilitate provision of micro credits,

21
strengthen local capacity and strive to bring about broad based economic growth. The government will continue also to ensure that poverty reduction continues to be the central objective of all macro and sectoral policies. On tax policy, the Government has implemented many tax reform measures aimed at enhancing revenue, while also reducing the tax burden on the poor. Such measures include: (i) Abolition of all taxes on agricultural inputs (ii) Removal of stamp duty on farm produce sales. (iii) A 5% cap on produce and livestock cess (iv) Abolition of VAT on investments relating to education. (v) Abolition of primary school fees and other contributions. (vi) Abolition of taxes on life-saving drugs and supplies. (vii) Removal of various other taxes on agriculture sector. There are sectors in Tanzania which have taken advantage of the reforms and have made great strides ahead of others. The “pacemakers”, are tourism and mining. However, studies on tourism in Tanzania have shown that the sector employs less than 1% of the labour force (17 million people), which is about 170,000 people, while contributing 14% to GDP. The Government is exploring ways for making the tourist sector more pro-poor (PHDR 2002). The share of mining and quarrying in GDP is still small (2.5% in 2001). Large-scale mining in Tanzania has not yet made insignificant direct impact on the lives of the poor Tanzanians (excluding few who can access social services provided by mining companies). For instance, employees in the sector are estimated to be only 0.6% of the labour force (PHDR 2002). The Government is exploring various ways to support small mining activities. Agriculture continues to be a dependable pro-poor sector. In 2001 the contribution of agriculture to GDP remained high, above 50 percent (about 44 percent of the sector contribution is non-monetary agriculture). Also, the sector contributes about 70-80 percent to total employment and about 55 percent of the country’s foreign exchange earnings in 2001. The sector grew at 5.5 percent in 2001 compared with 3.4 percent in 2000 – still lower than the required rate of 6-7 percent required to have a significant impact on the lives of the poor. The experience of other countries, e.g., South East Asia suggests that rapid growth and poverty reduction require emphasis on improving productivity and incomes in agricultural and non-farm rural activities. In order to address the need for improving productivity in this critical sector, the government increased the budget allocation to the sector in 2002/03 by 102 percent. The funds are to be used in facilitating production of crops, livestock,

22
seeds, traditional irrigation, cooperatives, marketing, extension services, agro-chemicals, veterinary drugs, and rural roads with emphasis on the increased role of lower levels of government and the private sector. In addition, the government is designing a micro-finance strategy and programmes, which will enable the rural poor to access credit. Another area is that of the competitiveness and impact of exchange rate on exports. The gains from the recent exchange rate depreciation of the shilling, especially for low income exporters (e.g. cotton, coffee and cashew-nuts) were substantially offset by the declining commodity prices in the world market. On trade policy, the removal of excessive trade barriers, internal and external, has improved the distribution of food in the country – improving food security. It is, however, recognized that sometimes a change in macro incentives may not filter to individual farmers. Middlemen tend to benefit more than the poor producers. For example, the liberalization of the coffee and cotton marketing has increased competition in the sectors such that farmers are now paid promptly for their crops, but they are not getting good prices because of decline in commodity prices and locational disadvantages. 3.2. Poverty Orientation of the 2002/03 Budget Developments on this front are also impressive. The 2002/03 Budget is the second since the government launched this Poverty Reduction Strategy (PRS). In the area of expenditure, the budget provides a substantial increase in resources for the priority sectors in line with the PRS objectives. Also, the 2002/03 Budget has provided for civil servants salary increase as well as enhancement of minimum pension. Given the importance of SME to employment creation and poverty reduction, the budget has provided support to the SMEs. The government continues with the reform and privatization of the remaining parastatals, particularly those providing economic services. The aim is to increase their productive efficiency and reduce the burden on the government budget. Terminal benefits have been set aside in preparation for privatization of earmarked parastatals. On the revenue front, the government has taken measures to enhance revenue collection, protecting the vulnerable and ensure that privatization contributes to economic growth, employment creation and poverty reduction. The government has written off all unpaid liabilities emanating from stamp duty on school fees and subsequently abolished them, rationalized the levies and fees collected by ministries, government departments and regions, written off arrears (unpaid) in land rent resulting from reduction of the rent rate in 2001/02. The income tax structure was also changed. A summary of budget measures targeting pro-poor sectors is presented in box 5 below.

23
Box 5: Highlights for the 2002/03 Budget Measures Agriculture • Reduction of suspended duty rate on all imported fresh milk from the current rate
of 25 percent to 20 percent. The measure aims at reducing the price of imported milk for those areas that do not have sufficiently locally produced milk.
• Abolished suspended duty on milk products e.g. powdered milk, cheese, and yoghourt) etc to supplement locally produced products.
• Introduced suspended duty of 10% on imported fully refined edible oil. This measure is intended to encourage local industries, including small-scale industries, to use domestic oil seeds produced by Tanzanian farmers and therefore encourage farmers to increase production.
• Re-introduction of VAT refund system for VAT paid by farmers on transportation, processing and packaging material for export crops.
• Write off of arrears (unpaid) land rent which was fixed at Tshs. 600/= per acre, accrued before the introduction of the new land rent of 200/= in 2001/02. This measure aims at removing unnecessary burden on farmers and livestock keepers.
• The government has established an export credit guarantee scheme under the management of Bank of Tanzania.
Private sector investment and development
• Promotion of export processing zones. • Encouraged production of exports within the framework of manufacturing “under
bond.” • Goods sold by domestic industries to foreign institutions operating in Tanzania,
which enjoy exemption from import duty, are recognized as deemed exports, and the concerned industries are entitled to duty drawback facility in respect of imported raw materials.
• Extension of duty drawback application period from three months to six months. This measure aims at enabling eligible industries to claim refunds of import duty without undue impediments.
• Customs duty on raw materials reduced to zero. Employment • The Pay-As-You-Earn (PAYE) threshold has been increased to Tshs. 50,000/=
per month. The aim is to exempt from tax those earning below Tshs. 50,000/=. • Increase of the minimum threshold for taxation of benefit in kind to employees
from Tshs. 1000/= to 50,000/=, the aim being to provide tax relief to low-income earners.
• Rationalization of levies and fees rates collected by ministries, government departments and regions to ensure conformity with the fiscal policy objective including minimizing hurdles for employment creation.
• The budget has set aside Tshs. 1.0 billion to support the development of small and medium size enterprises sector.
Education • Abolition of stamp duty on school fees earned by government owned schools, colleges, private schools and training institutions.
• Write off of all unpaid liabilities emanating from stamp duty on school fees. • The government has set aside Tshs. 1.5 billion for helping those students with
excellent academic ability but denied the right of continuing with further studies due to poverty.
Roads • Adjustment of fuel levy rate up by Tshs. 10/= per litre. This move is intended to enhance resources for the road fund for improving road maintenance.
Health • Increased budgetary allocation for health sector Water • Increased budgetary allocation for water sector. HIV/AIDs • Increased budgetary allocation for war against HIV/AIDs. Legal and Judicial system • Increased budgetary allocation for Legal and Judicial system. Governance • Continued progress in Civil Service Reform including adjustment of civil
servants salary structure. • The minimum pension has been adjusted upward.
Structural Reform • The budget made a provision for terminal benefits to workers of public enterprises earmarked for privatization/ leasing. These include DAWASA, TRC and ATC.
3.3. Private Sector Development
24
The government recognizes the central role the private sector plays in the development process in the country. The government has thus been undertaking wide ranging fiscal and structural reforms to foster private sector development in the country. The overarching focus of government policy is to maintain a conducive environment for private sector led growth and development. The corner stones of government policy in providing a conducive economic environment are: • Maintaining macroeconomic stability to ensure predictability in the operating environment; • Continuing with the privatization programme, now focusing on large utilities and banks; • Rationalizing the taxation system with a view to making it more transparent and efficient; • Improving the jurisprudence system so that ‘the rules of the game’ remain enforceable and
property rights protected; and • Improving human capital and physical infrastructure for improved competitiveness. The establishment of the Tanzania National Business Council (TNBC) has enabled increased dialogue between the government and the private sector on development issues. Some of the measures undertaken by the government as a result of the dialogue include: • In July 2002 Tanzania hosted an International Investors Round Table. The International IRT
members acknowledged the advanced level of development of private-public partnership in Tanzania, and undertook to be part of the advocacy in creating positive image of Tanzania. The IRT also acknowledged issues and recommendations of the local investment roundtable and the GoT commitment to resolve outstanding issues, key ones being:
- Use of land as collateral, land registration, etc. - Labour law - Tax and tax administration - Governance - Bureaucracy (red tape), and - Enhancement of regulatory framework The International Investors Round Table agreed to meet again in Tanzania in the near future.
• Four Community Banks have been established as microfinance facilities • The establishment of a credit guarantee scheme to guarantee credit for marketing of agricultural
crops, and later other exports.

25
• A comprehensive review of micro credit schemes has also been carried out and a sector-wide study, covering banks and non-bank financial intermediaries, and the insurance schemes has been carried out.
• Substantial progress has been made in reducing the number of licenses (and collecting agencies) impacting on individual businesses.
• The government has prepared a draft Construction Policy, which together with the Public Procurement Act, 2001 clarifies the role of the private sector in the construction of roads.
• The government has taken steps to enable Tanzania to benefit from international and regional risk guarantee schemes.
The government has strengthened the effectiveness of the Tanzania Investment C entre (TIC) in promoting and facilitating private sector investment. The TIC has been restructured, with its role transformed from granting investment certificates and tax incentives, to providing the services of a modern investment facilitation center. 3.4. Globalization and Poverty The process of globalization is an inevitable reality and no country can afford to opt out. The challenge is how Tanzania positions itself and works out modalities for meaningful participation in ensuring maximum gain. This is to be done within the context of Vision 2025 and the PRS. As Tanzania implements its Poverty Reduction Strategy, which among others, entails transforming the economy for higher and equitable growth, it has to take into account the challenges brou ght by the forces of globalization in terms of the changing economic environment, technological advances, and movement of capital and labour. Tanzania is bracing herself to deal with issues emerging from the global interdependences to take the fullest advantage of the opportunities arising from such changes. Cognizant of the fact that Tanzania’s economic growth can only be sustainable if it is responsive to the international competitive environment to fully capture export opportunities as they arise, the Government is taking measures to enhance the promotion of Export Processing Zones (EPZ) and the development of processing capacity to add value to agricultural produce and encourage exports of final products to the extent possible. Increased trade liberalization at global level, growing regional integration (e.g. EU, SADC, EAC, etc.) have created challenges for promoting economic growth and sustainable development, that is necessary in combating poverty. In line with these developments Tanzania has adopted policies, in particular industrial and trade policies, to respond to increased competition in regional and international markets. Steps taken to enhance private sector development form part of the strategy.

26
Measures that are taken to respond to the challenges posed by global competition and changes in technology include the following: • Diversification of exports with increasing value addition through processing and new non-
traditional agricultural exports. • Improving efficiency in production, processing and marketing of current and potential export
commodities to strengthen Tanzania’s competitiveness in the world markets. • Establishment and maintenance of sound, consistent and stable investment policies, which are
conducive to encouraging development and promotion of investment, technology and the export sector.
• Restructuring aid relationships in ways, which ensure control and ownership of the development agenda by Tanzania, through the implementation of Tanzania Assistance Strategy (TAS).
• Enhancing and encouraging intra-regional trade and other forms of regional cooperation. • Attaching great importance to development of ICT. 3.5. Public Debt Management and Debt Sustainability Public debt developments have broadly been on track. A revised National Debt Strategy was adopted by the Government in August 2002. The strategy enunciates the importance of fiscal sustainability of public debt through improved management of risks, development of local financial markets, and a strengthening of the legal and institutional arrangements for borrowing and debt management. The strategy also presents options for dealing with the likely fiscal implications of the debt arising from the parastatal privatization process. Domestic debt market developments were particularly favourable during the year. Encouraged by the successful floatation at the stock exchange of the 5-year treasury bond in February 2002, the government launched a 7-year fixed rate treasury bond in August 2002. The new 5 and 7-year bonds are expected to be an important test for the ongoing efforts to convert unsecuritized debt into marketable securities.
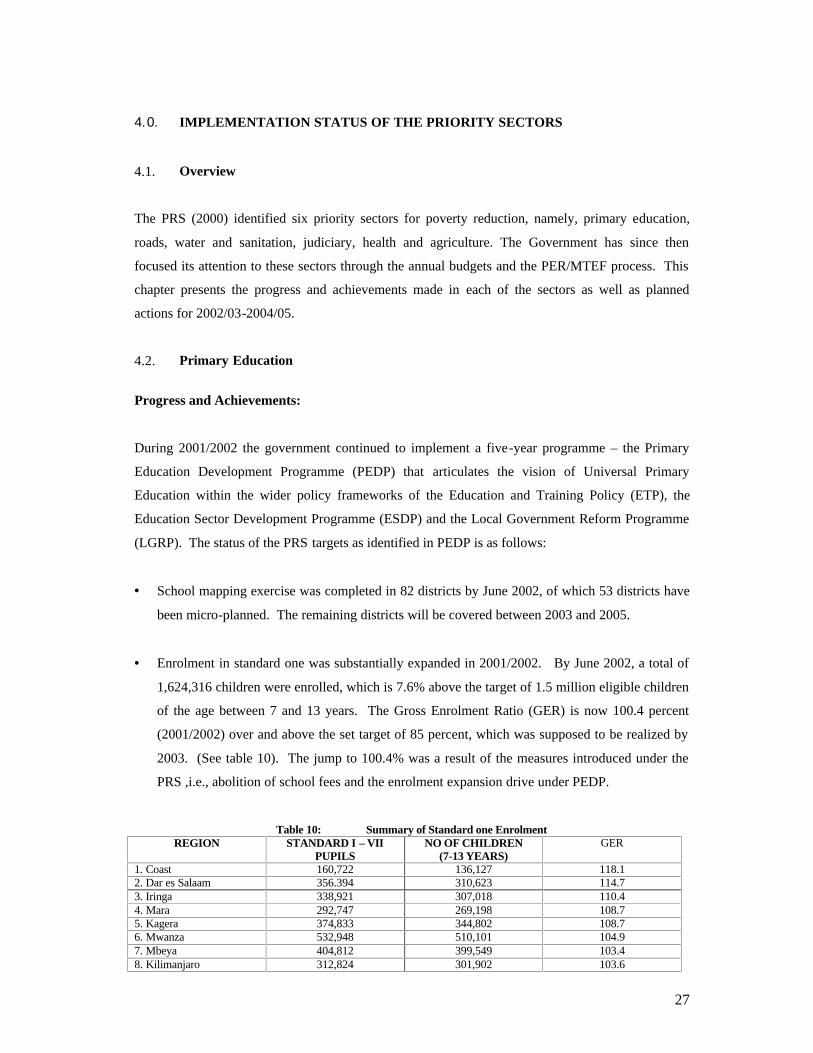
27
4.0. IMPLEMENTATION STATUS OF THE PRIORITY SECTORS 4.1. Overview The PRS (2000) identified six priority sectors for poverty reduction, namely, primary education, roads, water and sanitation, judiciary, health and agriculture. The Government has since then focused its attention to these sectors through the annual budgets and the PER/MTEF process. This chapter presents the progress and achievements made in each of the sectors as well as planned actions for 2002/03-2004/05. 4.2. Primary Education Progress and Achievements: During 2001/2002 the government continued to implement a five-year programme – the Primary Education Development Programme (PEDP) that articulates the vision of Universal Primary Education within the wider policy frameworks of the Education and Training Policy (ETP), the Education Sector Development Programme (ESDP) and the Local Government Reform Programme (LGRP). The status of the PRS targets as identified in PEDP is as follows: • School mapping exercise was completed in 82 districts by June 2002, of which 53 districts have
been micro-planned. The remaining districts will be covered between 2003 and 2005. • Enrolment in standard one was substantially expanded in 2001/2002. By June 2002, a total of
1,624,316 children were enrolled, which is 7.6% above the target of 1.5 million eligible children of the age between 7 and 13 years. The Gross Enrolment Ratio (GER) is now 100.4 percent (2001/2002) over and above the set target of 85 percent, which was supposed to be realized by 2003. (See table 10). The jump to 100.4% was a result of the measures introduced under the PRS ,i.e., abolition of school fees and the enrolment expansion drive under PEDP.
Table 10: Summary of Standard one Enrolment
REGION STANDARD I – VII PUPILS
NO OF CHILDREN (7-13 YEARS)
GER
1. Coast 160,722 136,127 118.1 2. Dar es Salaam 356.394 310,623 114.7 3. Iringa 338,921 307,018 110.4 4. Mara 292,747 269,198 108.7 5. Kagera 374,833 344,802 108.7 6. Mwanza 532,948 510,101 104.9 7. Mbeya 404,812 399,549 103.4 8. Kilimanjaro 312,824 301,902 103.6

28
9. Kigoma 250,439 242,742 103.2 10. Ruvuma 215,052 210,643 102.1 11. Singida 208,255 207,174 100.5 12. Morogoro 294,054 292,808 100.4 13. Arusha 402,852 403,138 99.9 14. Tanga 316,115 324,753 97.3 15.Mtwara 178,699 191,824 93.2 16. Rukwa 190,559 208,954 91.2 17. Tabora 249,674 277,648 89.9 18. Shinyanga 460,166 513,346 89.6 19. Dodoma 275,541 319,444 86.3 20. Lindi 117,585 146,604 80.2 Grand Total 5,933,192 5,908,398 100.4 Source: MoEC and PO-RALG (July 2002) • The Net Enrolment Ratio (NER) in primary schools has increased from 65% in 2000/01 to 85%
in 2001/02. Again this increase is attributed to, among others, the abolition of school fees and other enrolment related contributions and enforcement of compulsory enrolment. The target of raising NER to 70% by 2003 has therefore been surpassed.
• The transition rate from primary education to secondary education has increased from 19.5
percent in 2000 to 21.7 percent in 2001. • To cope with the rising enrolment ratios and sustain the quality of education, the following
training programmes targeting Head-Teachers, Assistant Head-Teachers, School Committees and Ward Education Coordinators were conducted in 2001/02:
- District Based Support to Primary Education Programme (DBSPE), - Community Education Fund Programme (CEF), - Child Friendly School Programme (CFS), - Whole School Development Programme (WSDP), and - Ward Based Education Management (WABEM) Programme.
• To enhance quality of teaching and learning and reduce shortage of teachers across schools and
regions, the government recruited 7,277 (80%) new Grade “A” teachers out of the targeted number of 9,100 by June 2002 (See Table 11). The recruitment was necessitated by the demand exerted by the enrolment expansion drive. It has become necessary also to raise the target teacher pupil ratio from 1:38 (1999) to 1:45 by 2004 as a temporary measure to cope with the expanded enrolment.

29
Table 11: Recruitment of New Primary School Grade A Teachers (Up to 27/06/2002)
REGION ALLOCATION RECRUITED VACANT Arusha 543 543 0 Dar es Salaam 451 451 0 Dodoma 281 241 40 Iringa 260 260 0 Kagera 1019 582 442 Kigoma 878 724 332 Kilimanjaro 7 7 0 Lindi 0 0 0 Mara 166 166 0 Mbeya 519 519 0 Morogoro 238 238 0 Mtwara 0 0 0 Mwanza 810 781 29 Pwani 149 149 0 Rukwa 427 202 225 Ruvuma 20 20 0 Shinyanga 1903 1323 598 Singida 455 455 0 Tabora 743 345 404 Tanga 231 231 0 Grand Total 9,100 7,277 2,070
Source: MoEC and PO-RALG (September 2002) • In 2001/2002, the government continued to upgrade teachers’ qualifications through Teacher
Resource Centres (TRCs) and distance learning. Comprehensive In-service and Pre-service teacher professional development programmes are being developed to integrate In-Service Training Programme (INSET) into the Primary Education Development Programme (PEDP). These programmes aim at enhancing the quality of the learning environment.
• Having surpassed the enrolment targets in 2001/02 the focus is now directed towards sustaining
the enrolment expansion drive and raising the standard of education. For instance, the pass rate in the Primary School Leaving Examination was raised from 22 percent (2000/01) to 28.6 percent (2001/02).
• A total of 2,228 staff (teachers) houses have been constructed, the majority of these are in rural
areas. This has acted as an incentive for teachers to continue teaching in remote areas. • The construction of 12,868 new classrooms was completed in 2001/02, details of which are
shown in table 12.

30
Table No.12: Construction of New Classrooms
REGION TOTAL NO. OF SCHOOLS
CONSTRUCTION FUNDS
ALLOCATED CLASSROOMS
Arusha 768 2,309,290,038.57 704 Dar es Salaam 208 2,748,852,243.83 840 Dodoma 573 2,095,052,690.00 647 Iringa 767 1,282,041,020.81 379 Kagera 787 2,708,140,657.87 839 Kigoma 280 2,603,063,446.30 814 Kilimanjaro 736 1,496,236,880.18 448 Lindi 373 976,326,005.56 252 Mara 579 1,700,292,871.47 519 Mbeya 875 2,464,413,469.11 754 Morogoro 663 1,836,514,937.78 563 Mtwara 513 1,548,776.338.62 439 Mwanza 890 4,583,582,211.01 1427 Pwani 415 1,828,500,775.96 532 Rukwa 433 956,234,682.72 291 Ruvuma 569 1,144,552,060.50 347 Shinyanga 974 4,285,516,500.07 1334 Singida 387 1,400,344,817.01 429 Tabora 550 1,815,456,597.96 561 Tanga 739 2,416,811,782.67 749 Grand Total 12,079 42,200,028,000.00 12,868
Source: MoEC and PO-RALG (May 2002) Lessons and Challenges: • The commencement of PEDP in FY 2001/02 has played a significant role in realising the PRS
targets, despite the financial shortfall of about Tsh. 83 billion (28.0%). The government managed to mobilize a total of Tsh. 215 billion which is 72.0% of the total PEDP budget of Tsh. 299 billion. The gap is attributed to delays in affirming pledges to support the programme by the education sector development partners.
Recognizing that the achievement is still low compared to the target of 50 percent, efforts are underway to ensure that the target is reached by 2005. Measures being undertaken include: • Raising Standard IV pass mark from an average of 25% to 45% out of 150, with the pass mark
for every subject not below 15% out of 50.

31
• Raising Standard VII pass mark from an average of 61% to 65% out of 150 for three subjects. • It is anticipated that the prospect of opening new government aided community secondary
schools will contribute in meeting the target of 28 percent in 2005. Next steps: During the period 2002/03-2004/05 the government intends to develop a national strategy for secondary education. The strategy would necessitate the development of Secondary Education Development Programme (SEDP). The government will also develop a national strategy for teacher education and a Teacher Education Development Programme (TEDP). The Inspectorate System will also be strengthened with the aim to provide supervisory services to enhance teaching-learning processes and improve the quality of education. As efforts to boost enrolment focus on younger children, there is a substantial number of older out-of-school children who risk losing out. The government is determined to address this by increasing resources to complementary basic education schemes such as COBET and ICBAE. Particular emphasis will be on those regions that have recorded very low GER. A National Strategy for Non-Formal Education (NFE) is being developed and is expected to lead to the development of an out-of-school basic education programme for children aged 11 – 13. The government is also planning to revive adult education. The exercise of recruiting new teachers in primary schools will continue in the coming years with particular focus on those regions that have critical shortage of teachers. Costing
TABLE 13: Estimated Financing Requirements for the Education Sector Development Programme (ESDP), 2001/02 – 2003-04/05 (July-June)
2001/02 Expenditure Requirements Actual
2002/03 Budget
2003/04 Projections
2004/05 Projections
(In billions of Tanzania shillings) 1 Primary schools 173.3 100.7 150.2 237.3 263.0 Capitation grant 48.6 27.5 70.7 83.5 100.0 Construction of new
classrooms 60.3 42.0 29.1 58.5 62.7
Investment grant/Development
24.3 1.5 0.9 35.8 36.0
Primary school fees (cost of abolition)
11.0 11.0 11.5 12.0 12.5
Classroom rehabilitation 3.6 0.4 0.3 0.5 0.8
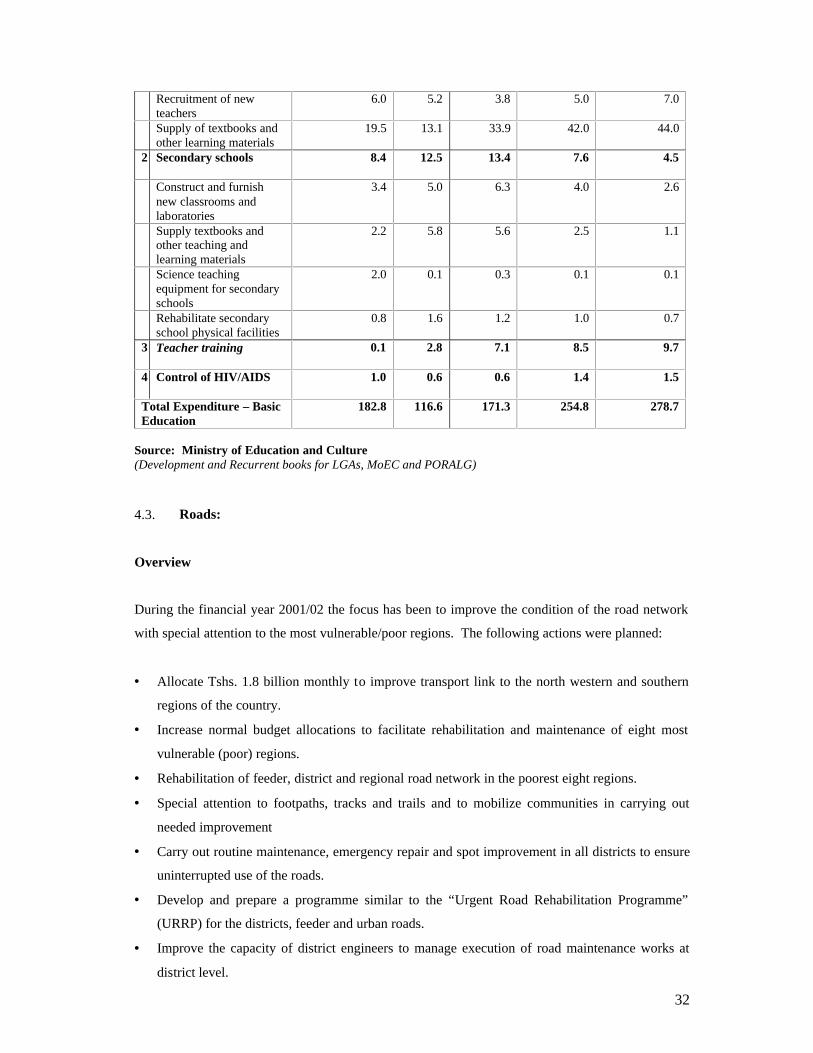
32
Recruitment of new teachers
6.0 5.2 3.8 5.0 7.0
Supply of textbooks and other learning materials
19.5 13.1 33.9 42.0 44.0
2
Secondary schools 8.4 12.5 13.4 7.6 4.5
Construct and furnish new classrooms and laboratories
3.4 5.0 6.3 4.0 2.6
Supply textbooks and other teaching and learning materials
2.2 5.8 5.6 2.5 1.1
Science teaching equipment for secondary schools
2.0 0.1 0.3 0.1 0.1
Rehabilitate secondary school physical facilities
0.8 1.6 1.2 1.0 0.7
3
Teacher training 0.1 2.8 7.1 8.5 9.7
4
Control of HIV/AIDS 1.0 0.6 0.6 1.4 1.5
Total Expenditure – Basic Education
182.8 116.6 171.3 254.8 278.7
Source: Ministry of Education and Culture (Development and Recurrent books for LGAs, MoEC and PORALG) 4.3. Roads: Overview During the financial year 2001/02 the focus has been to improve the condition of the road network with special attention to the most vulnerable/poor regions. The following actions were planned: • Allocate Tshs. 1.8 billion monthly to improve transport link to the north western and southern
regions of the country. • Increase normal budget allocations to facilitate rehabilitation and maintenance of eight most
vulnerable (poor) regions. • Rehabilitation of feeder, district and regional road network in the poorest eight regions. • Special attention to footpaths, tracks and trails and to mobilize communities in carrying out
needed improvement • Carry out routine maintenance, emergency repair and spot improvement in all districts to ensure
uninterrupted use of the roads. • Develop and prepare a programme similar to the “Urgent Road Rehabilitation Programme”
(URRP) for the districts, feeder and urban roads. • Improve the capacity of district engineers to manage execution of road maintenance works at
district level.
33
Progress and Achievement: (i) Increase budgetary allocations The budget of the road sub-sector was steadily increased. In financial year 2001/02, the Ministry of Works received a total of Tsh. 46 billion (Road Fund and Consolidated Fund); the approved budget for 2002/03 is Tsh. 51.5 billion to cater for maintenance and development of the road network. Likewise, PO-RALG received Tsh. 19.7 billion towards maintenance of the district roads in financial year 2001/2002 and the approved budget for financial year 2002/2003 is Tsh. 22.1 billion. The budget increase is over and above the planned monthly allocations of Tsh.1.8 billion set-aside for the special project, whose funds reached Tsh. 34.5 billion as of June 2002. (ii) The use of the Tsh. 1.8 billion per month (Special Project). The Government allocated these funds to cater for the improvement of the transport link to the northern-western and southern regions. The aim was to upgrade to bitumen standard some road sections on the Southern Corridor (Dar es Salaam-Lindi-Mingoyo) and Central Corridor (Dar es Salaam-Dodoma-Singida). This was to be implemented as a special project. The implementation status involves procurement of designing consultants, procurement of contractors for supervision of works and signing of contracts, which were accomplished by June 2002. Work on the roads has already commenced. (iii) Three year programme of rehabilitation of regional roads Preparations of tender documents for the 774 km road works in four regions (Kagera, Dodoma, Singida and Tabora), which are under ADB and GoT financing have been completed. This is out of 2,326 km earmarked for rehabilitation under the regional roads. On the other hand, Lindi and Kigoma regional network rehabilitation programme involving about 120 km will start as soon as the agreement between OPEC and GoT is signed. (iv) Maintenance Works Routine maintenance works were carried out on 5,058 km out of 9,071 km earmarked during the year, while spot emergency improvement was carried out on 1,637 km against the planned 778 km, which is more than 50% above the target. The targets for routine and periodic maintenance could not be achieved due to inadequate funds. The development of a programme for district, feeder and urban roads, similar to that of rehabilitation programme under the Ministry of Works, will be done by PO-
34
RALG. Capacity building for district engineers to manage the execution of road works (both maintenance and construction) remains an issue to be addressed seriously in the current year. (v) Improvement of feeder roads, footpaths, track and trails, and use of IMT . During the year under review a total network under PO RALG of 6,599 km of rural roads (65.2%) out of 10,120 km planned, received routine and periodic maintenance while 1588 km (61%) out of 2578 km received spot improvement. The reason for achieving 65% only of the planned works is due to inadequate capacity at district level as well as unavailability of funds. Similarly under PO-RALG a Village Travel and Transport Programme (VTTP) is being carried out in seven districts of Iramba, Masasi, Rufiji, Morogoro, Mbozi, Iringa rural and Muheza to ease transport between villages. The programme was conceived under the then Integrated Roads Project (IRP) and has been promoting (i) the improvement of transport infrastructure including paths, tracks, and trails; (ii) the use of appropriate intermediate means of transport (IMT) and (iii) increasing access by villages to selected services namely water for domestic use, fuel-wood and grain grinding mills. Lessons learned and Challenges: Integration of the reforms in the road-subsector at all levels remains a challenge. The Local Government Authorities still lack capacity to manage district, urban and feeder roads. Under the ongoing reforms, PO-RALG will establish a mechanism that will ensure that the road network under the jurisdiction of the local authorities is managed properly. A comprehensive policy on rural roads is also under preparation. At the same time the government underscores the importance of strengthening and retaining capacity at the district level. Next Steps and Planned Interventions In the 2002/03 fiscal year the government is implementing measures to address outstanding problems in the sector, including the following: • The government continues with the special project to improve transport link to the north-
western and southern regions of the country, and is implementing the rehabilitation and maintenance of 4,500 km. in eight most poor regions and spot repair in all regions.
• Special attention is given to footpaths, tracks and trails and mobilization of communities in their maintenance.
• Emergency repair and spot improvement is carried out in all districts. • An Urgent Road Rehabilitation Programme (URRP) is under preparation.

35
• The capacity of District Engineers is being strengthened to manage execution of road maintenance work.
Table 14: Summary of Programme Costing (T Sh. Million)
Road Sector1 2002/03 2003/04 2004/05 Sector Requirement 260,170 299,274 344,255
Allocation 208,415 226,669 243,261 Gap 51,755 72,605 100.994
Breakdown between Trunk, Regional and Rural Roads Trunk Roads & Regional Roads Construction (Budgeted) 133,483 145,174 155,801 Maintenance 50,700 55,141 59,177
TOTAL 184,183 200,315 214,978 Gap 31,457 44,130 61,385
Rural Roads* Construction 4,927 5,358 5,750 Maintenance 19,305 20,996 22,533
TOTAL 24,232 26,354 28,283 Rural Roads Requirement 44,530 54,829 67,892
Gap 20,298 28,475 39,609 1 The sector requirement is the overall road sector including the construction costs for trunk, regional, district, urban and feeder roads 4.4. Water Overview: The contribution of the water sector to poverty reduction is through reduction of time spent in fetching water, improvement in health standards, creating a conducive environment for increased school attendance and an increased opportunity for socio-economic activities. The objectives and medium term targets of the Water Sector are: • Sustainable provision of adequate, safe and clean water for different social groups in rural,
urban and peri-urban areas, • Sustainable development of urban sewerage facilities, • Development of integrated water resources for social-economic development in the country,
and • Protection of water sources including controlling pollution levels. The sector has set the following targets in its strategic plan:

36
(i) Raising the proportion of rural population that has access to safe and clean water from 48.5% in 2000, to 55% by December 2004,
(ii) Increasing, over the same period, the corresponding ratio for urban population from 68% to 78%,
(iii) Strengthening water resource environmental and pollution control network in order to reduce pollution levels from 20% in 2000, to 10% by December, 2004, and
(iv) Reinforcing legal and institutional involvement of local communities and the private sector in developing water supply schemes, and water sources environmental protection throughout the country by the year 2005.
Priority Interventions: In order to achieve the targets in the Medium Term Strategic Plan the priority interventions include: (i) Rehabilitation of malfunctioning water supply systems including pumping facilities,
treatment plants, distribution mains and networks in both rural and urban areas. (ii) Expansion of existing water supply systems in both rural and urban areas, (iii) Construction of new water supply schemes to increase coverage of areas not covered by
existing water supply systems in both rural and urban areas including peri-urban areas, (iv) Development, extension and upgrading of urban sewerage facilities, (v) Rehabilitation and expansion of hydrological, hydro-geological and hydro-meteorological
networks, (vi) Exploration of underground water in finding new water sources especially in dry areas, and (vii) Protection of water sources from pollution, and close monitoring of water quality. Progress and Achievements:
The following are important achievements during 2001/02: (i) The urban water supply coverage has increased from 68% in December 2000 to 73% in June
2002. Measures behind this increase include:-
• Rehabilitation and expansion of urban water supply systems in Morogoro, Tabora, Dodoma, Tanga, Arusha, and Moshi, added with progress in rehabilitation and expansion of urban water supply systems in all urban water authority areas.

37
• Capacity and institutional strengthening in all Urban Water Authorities pertaining to control and reduction of unaccounted for water through retooling to improve the billing system and metering.
• Development and expansion of new water sources in urban areas including drilling of boreholes.
(ii) Rural water supply coverage has increased from 48.5% in December 2000 to 50% in June
2002. Measures behind this increase include:
• Rehabilitation and expansion of 13 rural water schemes and 8 deep boreholes. • Installation of 6 water pumping machines in 6 national water schemes. • Construction of Mwanahinya and Maswa dams in Shinyanga, and • Drilling of 540 boreholes.
(iii) The Government adopted a revised National Water Policy in July 2002.
(iv) During year 2001/02 measures were taken to test water quality involving 675 water samples
for standard amount of chemicals, 990 water samples for turbidity and 56 industries were inspected to control industrial effluents. Sensitization of communities and Local Government Authorities to enact by-laws protecting water sources were also among measures taken to strengthen water resource environmental management and pollution control.
(v) A private operator for DAWASA has been selected, and is expected to start operation soon. Lessons learned and challenges: (i) Performance of most Urban Water Authorities, national water supply schemes and
upcoming projects are affected negatively by accumulating electricity bill s, which are largely a result of high tariffs charged by TANESCO.
(ii) Village water funds are important financial sources for water sector’s recurrent expenditure especially for operation and maintenance of water supply infrastructure in respective areas, and can be used to develop new sources of water in the same areas. What is needed is a legal framework to govern the operations and management of the Village Water Funds to ensure transparency and avoid misappropriation of these funds. The government will address this area in the coming year.
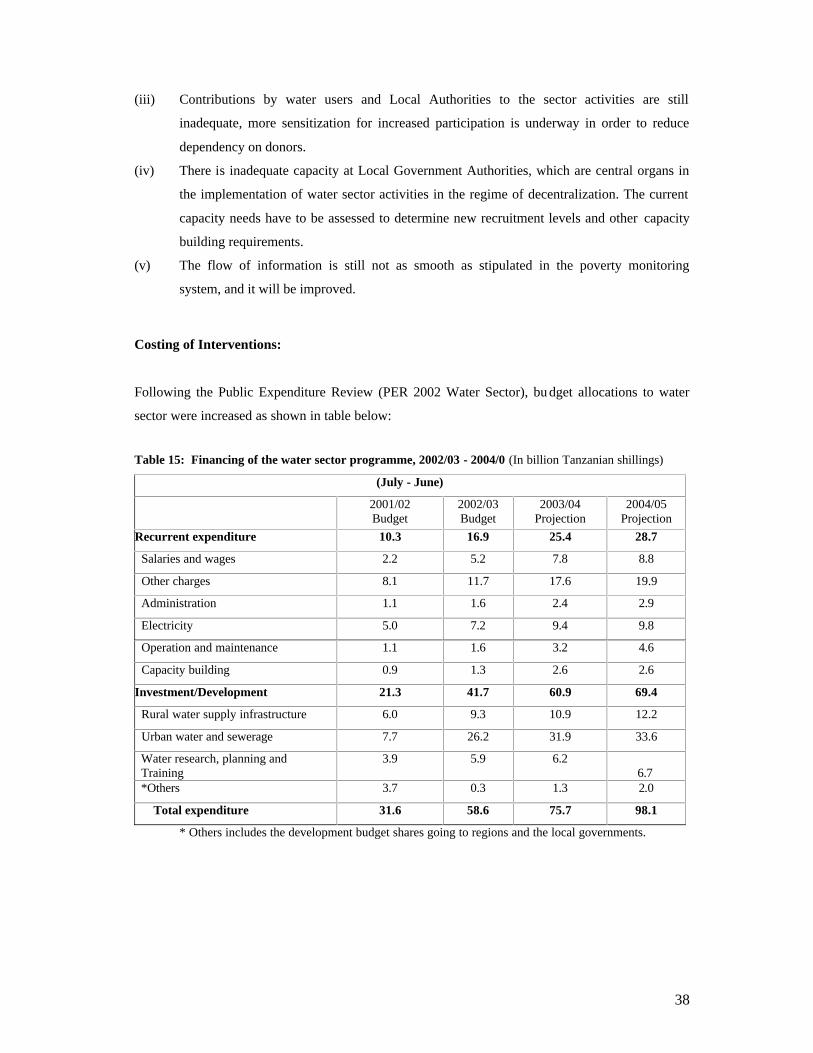
38
(iii) Contributions by water users and Local Authorities to the sector activities are still inadequate, more sensitization for increased participation is underway in order to reduce dependency on donors.
(iv) There is inadequate capacity at Local Government Authorities, which are central organs in the implementation of water sector activities in the regime of decentralization. The current capacity needs have to be assessed to determine new recruitment levels and other capacity building requirements.
(v) The flow of information is still not as smooth as stipulated in the poverty monitoring system, and it will be improved.
Costing of Interventions: Following the Public Expenditure Review (PER 2002 Water Sector), bu dget allocations to water sector were increased as shown in table below: Table 15: Financing of the water sector programme, 2002/03 - 2004/0 (In billion Tanzanian shillings)
(July - June) 2001/02
Budget 2002/03 Budget
2003/04 Projection
2004/05 Projection
Recurrent expenditure 10.3 16.9 25.4 28.7 Salaries and wages 2.2 5.2 7.8 8.8 Other charges 8.1 11.7 17.6 19.9 Administration 1.1 1.6 2.4 2.9 Electricity 5.0 7.2 9.4 9.8 Operation and maintenance 1.1 1.6 3.2 4.6 Capacity building 0.9 1.3 2.6 2.6 Investment/Development 21.3 41.7 60.9 69.4 Rural water supply infrastructure 6.0 9.3 10.9 12.2 Urban water and sewerage 7.7 26.2 31.9 33.6 Water research, planning and Training
3.9
5.9
6.2 6.7
*Others 3.7 0.3 1.3 2.0 Total expenditure 31.6 58.6 75.7 98.1
* Others includes the development budget shares going to regions and the local governments.

39
4.4.7. Next Steps
The sector will continue to implement the medium term strategic plan (2001/02-2004/05), the financing of which will be informed through the Medium Term Expenditure Framework 2002/03-2004/05. During the coming year the sector plans to carry out the following activities: (i) Implement the Shinyanga/Kahama water supply project, which will draw water from Lake
Victoria. (ii) Support to grade C and B Urban Water Supply and Sewerage Authorities to qualify to
autonomous grade A authorities after which resources will be redirected to rural water supply.
(iii) Support to establishment of basin offices in the four remaining water basins and strengthen
the existing five water basin offices as water resources management units in the country.
(iv) Facilitation of establishment of, and capacity building for water user entities in rural areas. (v) Preparations of Water Sector Development Strategy (WSDS), which will consist of, among
others, identification of major problems in the sector, possible causes, possible effects and proposals for comprehensive solutions (strategies) for sector development.
4.5. Legal and Judicial Systems Progress and Achievements: The Government has taken various initiatives to improve efficiency and fairness in delivery of legal and judicial services. These include: • Establishment of a Commercial Court in August 1999. This has substantially improved the
disposition of commercial disputes. Time taken for settlement of commercial disputes has been reduced to between 3 and 6 months.
• Recruitment of 22 Resident Magistrates, 26 Primary Court Magistrates and 16 State Attorneys was undertaken in fiscal year 2001/02.
• An Alternative Dispute Resolution (ADR) System was introduced in 1994. The system has contributed to a significant reduction in the backlog of pending civil cases in the High Court and Resident Magistrate Courts. The Government extended this system to all Resident Magistrates and District Courts in April 2002.
• The Institute of Judicial Administration (IJA) was established in Lushoto to train Primary Court Magistrates and administrative support staff for the Judiciary. Thirty (30) students graduated in 2001/02.
40
• Establishment of the Human Rights and Good Governance Commission in March 2002. • The adoption in 1999 of a broad legal sector reform programme has revamped the legal and
judicial systems. The programme continues to guide development partners as well as the Government in supporting improvement in the delivery of justice.
• In the context of gearing up for the appraisal of the reform programme, several activities have been initiated such as exploring the best options for the establishment of a School of Law, and preparing the design for primary courts.
• A pilot scheme (under the quick-start project) for community participation in rehabilitation and construction of priority primary courts and district courts has been launched in Arusha and Manyara regions. Although this is still at an early stage, discussions with the communities have taken place to ensure their involvement. The pilot is expected to provide a model for a more comprehensive programme in the context of the legal sector reform programme.
• The Ministry of Justice and Constitutional Affairs and the Judiciary with technical support from the Civil Service Department is preparing a strategic plan that identifies the needs of the Ministry and the Judiciary in improving service delivery.
• The budget for the Judiciary was raised from Tshs. 8.0 billion in 2001/02 to Tshs. 12.4 billion in 2002/03. The Attorney General’s Chambers and the Law Reform Commission budgets were also increased from Tshs. 2.6 billion and Tshs. 173 million in 2001/02 to Tshs. 3.7 billion and Tshs. 261 million in 2002/03, respectively.
• To enable building a better case for appropriate allocation of resources and linking more closely the request for resources with the PRS targets for the sector, a position of Director for Policy and Planning has been established in the Ministry of Justice and Constitutional Affairs, and a Director for Planning has been recruited.
Lessons learned and challenges: Despite these achievements the sector continues to face the following challenges: • Although there has been a substantial increase in the budget appropriation for “Other Charges”
in the Judiciary, there still remains a big gap between the sector’s budgetary requirements and allocations.
• Effective and fair delivery of judicial services remains a problem across the country. It is imperative to address the problems, by way of capacity building in terms of human resources and physical assets – to enable the law and order institutions to function properly.

41
Next steps: Specific measures of immediate focus include the following: • Extend the Commercial Court Sub-Registries in Arusha and Mwanza regions. • Construct two Juvenile Courts in Mtwara and Mbeya regions and enhance juvenile justice. • Recruit 125 Resident Magistrates, 70 State Attorneys and 135 Primary Court Magistrates. • Ensure effective functioning of the independent Judicial Ethic Committees and strengthening of
supervision mechanism. • Enhance the capacity of the Law Reform Commission through provision of adequate working
tools and training. Construction of the new office building is underway. • Design a training programme for the Legal Sector Institutions. • Continue with capacity building for IJA, Lushoto. • Identification of appropriate support staff for the Legal Sector. • Improve budgetary allocations to all law and order institutions as per approved costings. • Rehabilitation of buildings and other facilities of primary courts. The government plans to
mobilize additional funds from development partners for the national community-based programme on district based support to Judiciary, which will also support the infrastructure development programme under the proposed Tanzania Accountability, Transparency and Integrity Project (ATIP), which is in progress.
Costing of Interventions: Table 16: Legal and Judicial Systems - Costing of Interventions:
ACTIVITY SOURCE OF FUNDS
TOTAL COST IN TSHS MILLIONS
VOTE 40 VOTE 41 VOTE 59 TOTAL Reducing backlog of pending cases
GOT 53,034.38 891.08 - 53,925.46
Enhancing supervision, division of work and administrative support
GoT/QSP 9,943.50 459.50 - 10,403.00
Updating legal framework and legal research
GoT/QSP - 437.20 741.00 1,039.80
Improvement of civil registration GoT - 650.70 - 650.70 Training GoT/QSP 362.00 261.00 - 675.00 Improvement of office accommodation
GoT/QSP/ATIP 7,900.00 945.00 - 8,845.00
Transfers GoT 486.50 19.00 - 505.50 Establishment of new Divisions/ Institutions
GoT 431.67 - - 4312.67
Legal Sector Reform Programme - 1,529.00 - 1,529.00
TOTAL Basket Fund 72,158.05 5,192.48 741.00 78,091.53

42
4.6. Health Sector Overview: Community-based studies and health care-provider reports indicated that major diseases affecting the population continued to be malaria, HIV/AIDS related diseases, respiratory infections, water-borne and water-washed diseases (such as typhoid, cholera, dysentery and parasites). Malaria is responsible for about 17 percent of all deaths, perinatal and maternal causes about 15 percent, and diarrhea, pneumonia, tuberculosis and AIDS about 5 to 6 percent each. Progress and Achievements: During the year 2001/02 the following progress and achievements were made in the health sector: (i) All districts were covered by an active HIV/ AIDS awareness campaign, and have prepared
respective HIV/ AIDS plans. All the sectors at both national and sub- national levels have also developed action plans to address prevention and control of the epidemic. In addition, the MOH in collaboration with other stakeholders, including districts, have developed a programme for care and access to drugs for people living with HIV/AIDs.
(ii) Births attended by trained personnel increased from 50 percent to 80 percent in 2001/02 in line with the health sector reform targets. In addition, the health sector reform was synchronized with the local government reforms.
(iii) To create the necessary linkages and adopt a common frame, the PRS was mainstreamed in the health sector policy.
(iv) A coordination desk has been established to promote private sector participation in health service delivery, e.g., facilitated registration of three medical schools, and health facilities.
(v) TV and radio programmes were prepared and transmitted messages for advocating the health sector reform programme.
(vi) The Drug Revolving Fund (DRF) has been introduced in all district hospitals. Community Health Funds have been introduced in 37 districts and the National Health Insurance Fund (NHIF) is currently operational and all civil servants are now receiving treatment under the scheme.
(vii) The national malaria medium term strategic control programme was developed. The strategy will be discussed and distributed to all stakeholders and its implementation has started by the introduction of SP (Isulphadoxine Pyrimethamine) as the first line drug of choice and advocacy of ITN (Insecticide Treated Nets).

43
(viii) The number of children under 2 years immunized against measles and DPT in 2001/2002 increased from 74% to 79%.
(ix) In order to provide adequate and equitable maternal and child services, promote adequate nutrition and control of communicable diseases, the ministry did set aside funds under Preventive Department and provided essential obstetric equipment to all 82 reforming councils.
(x) TACAIDS is now operational following completion of structures and recruitment of key staff.
Lessons and Challenges: • The introduction of health care financing options including CHF and user fees have improved
availability, access, provision and use of services by beneficiaries as drugs are now available in health facilities all the time.
• Implementation of HSR which involves other ministries and communities (multisectoral) improves quality of services through promotion of self-ownership.
• Resources allocated for the priority areas including malaria, HIV/AIDS and TB are still not enough to fully implement the identified activities.
• Capacity building, particularly at sub-national level is another major challenge that needs to be addressed in order to implement fully the Health Sector Reform (HSR) activities.
• Monitoring system for the sector needs to be strengthened to enable effective tracking of progress towards the agreed targets and indicators.
• Delays in disbursement of resources pledged by development partners also need to be addressed. • More advocacy regarding HSR is needed at all levels of administration, governance, leadership
and implementation. • Other challenges that need to be addressed are:
- Shortage of transport for referral purposes especially for pregnant mothers. - Shortage of trained personnel especially at dispensaries and health center levels.
Next steps: Year 2002/03 is the fourth year of the implementation of the Health Sector Reform Programme. The planned activities include: • To continue the expansion of the Integrated Management of Child Illness (IMCI) programme.
46 more councils are planned to be covered. • To continue immunization against measles and DPT for children under 2 years to increase
coverage to 85%.
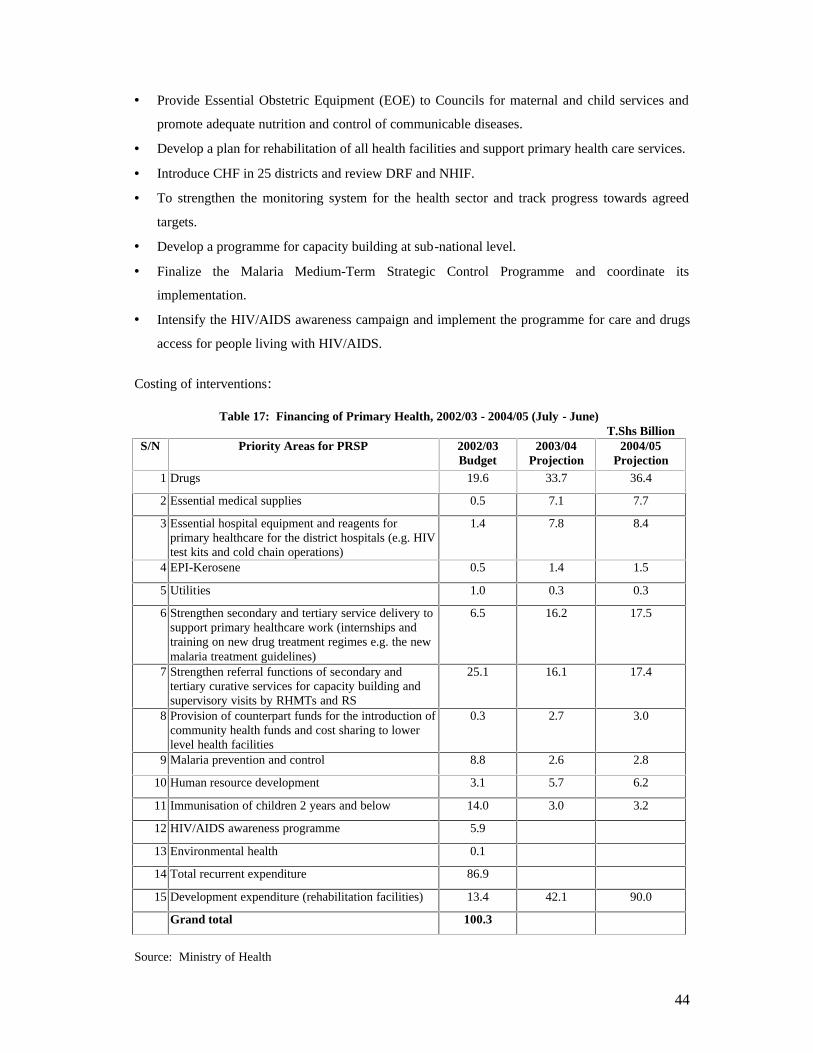
44
• Provide Essential Obstetric Equipment (EOE) to Councils for maternal and child services and promote adequate nutrition and control of communicable diseases.
• Develop a plan for rehabilitation of all health facilities and support primary health care services. • Introduce CHF in 25 districts and review DRF and NHIF. • To strengthen the monitoring system for the health sector and track progress towards agreed
targets. • Develop a programme for capacity building at sub-national level. • Finalize the Malaria Medium-Term Strategic Control Programme and coordinate its
implementation. • Intensify the HIV/AIDS awareness campaign and implement the programme for care and drugs
access for people living with HIV/AIDS. Costing of interventions:
Table 17: Financing of Primary Health, 2002/03 - 2004/05 (July - June) T.Shs Billion
S/N Priority Areas for PRSP 2002/03 Budget
2003/04 Projection
2004/05 Projection
1 Drugs 19.6 33.7 36.4 2 Essential medical supplies 0.5 7.1 7.7 3 Essential hospital equipment and reagents for
primary healthcare for the district hospitals (e.g. HIV test kits and cold chain operations)
1.4 7.8 8.4
4 EPI-Kerosene 0.5 1.4 1.5 5 Utilities 1.0 0.3 0.3 6 Strengthen secondary and tertiary service delivery to
support primary healthcare work (internships and training on new drug treatment regimes e.g. the new malaria treatment guidelines)
6.5 16.2 17.5
7 Strengthen referral functions of secondary and tertiary curative services for capacity building and supervisory visits by RHMTs and RS
25.1 16.1 17.4
8 Provision of counterpart funds for the introduction of community health funds and cost sharing to lower level health facilities
0.3 2.7 3.0
9 Malaria prevention and control 8.8 2.6 2.8 10 Human resource development 3.1 5.7 6.2 11 Immunisation of children 2 years and below 14.0 3.0 3.2 12 HIV/AIDS awareness programme 5.9 13 Environmental health 0.1 14 Total recurrent expenditure 86.9 15 Development expenditure (rehabilitation facilities) 13.4 42.1 90.0
Grand total 100.3
Source: Ministry of Health

45
4.7 Agriculture Overview: The Agricultural Sector Development Strategy (ASDS) was completed and adopted in 2001. This marked one of the key steps in the implementation of Poverty Reduction Strategy. ASDS identifies five strategic issues for agriculture: (i) strengthening the institutional framework (ii) creating a favourable environment for commercial activities (iii) clarifying public and private sector roles in improving services (iv) strengthening marketing efficiency for inputs and outputs and (v) mainstreaming planning for agricultural development in other sectors. The Agricultural Sector Development Programme (ASDP) has been developed as a tool for implementing the Agricultural Sector Development Strategy (ASDS). ASDP has been organized around three sub-programmes, namely: (i) Agricultural sector support and implementation at district and field level , through
District Agricultural Development Programmes (DADP) and District Development Plans (DDPs) with an indicative funding allocation of approximately 75% to 85%; this sub -programme will focus on establishing an enabling environment for agriculture and channeling public sector support to productive activities;
(ii) Agricultural sector support at the national level: This Sub-programme would focus on
the national enabling environment and on defining the specific role of central government, with an indicative funding allocation of 15% to 20%;
(iii) Cross-cutting issues with other Sectors at national level, to manage links between ASDP
and other sectors, with an indicative funding allocation of 2% to 5%. The ASDP has been formulated in two phases. Phase One entails formulation of ASDP Framework and Process document, defining sub-programmes, components, prioritization and preparation of indicative cost estimates. Phase two identifies the main partners for the respective sub-programme, components and detailed formulation. Progress and achievements: Considering the importance of agriculture in poverty reduction, the government increased substantially the budget for the sector in 2002/03. However, as the full cost of implementing the

46
Agriculture Sector Development programme are finalized, there will still be need for continued increase in budget allocations to the sector. During the year 2001/02 a number of measures were carried out in private agribusiness sector support and in crop, livestock, the cooperatives and marketing sub-sectors. The following are activities carried out under each: (i) Private Agribusiness Sector Support (PASS): Investment maps for pyrethrum, tea, cotton and oilseeds to be submitted to TCCIA as support for lobbying for the sector were prepared and capacity building was carried out for eleven farmer groups in mushroom production as well as for one mushroom wholesaler/processor in mushroom production and management of contract growers. Capacity building was also carried out for one oil seed production and contract farming. Private Agribusiness Sector Support (PASS) windows were opened at CRDB branches in Mbeya, Iringa, and Dodoma. (ii) Crop sub-sector: Measures undertaken in this area focused on: (i) Supporting research and extension services:
• Extension and development of various crop approaches including participatory methodologies.
• Training of farmers and extension officers on soil and water conservation has been undertaken.
• Curricula for Agriculture Institutes to undertake refresher courses, which include agri-business and the environment for extension officers, farmers and agricultural technicians were adjusted and eight extension reference manuals were prepared.
• Crop research especially on production of improved seeds, agricultural technologies, soil investigations and techniques for control of crop diseases and pests continued. Five new varieties of maize and two of rice have been adopted by the Ministry of Agriculture and Food Security.
• Research Trust Funds in the seven Agro-ecological zones were established. • Training of experts and farmers continued. The Institutes had 548 new students; 122
females and 426 males under Government sponsorships of 85 per cent. About 4000 farmers received formal training at the training institutes and many others in their localities through the Farmers Field Schools and other training methodologies.
47
• Reference manuals, pamphlets and books relating to natural resources, agri-business, rearing and production of dairy cows, diseases and animal health, irrigation, crop pest and disease control and improved seed production were produced.
(ii) Pest losses:
• Crop losses resulting from pests is estimated to be about 30 to 40 per cent per annum. Pest control was focused on quelea quelea birds, armyworms, grain borer, rodents, locusts and various crop diseases. In addition, participatory control techniques have been introduced and are functioning successfully in the control of crop pests in cotton, coffee, vegetables, sweet potatoes, maize and cassava.
(iii) Supporting small scale irrigation schemes:
• 27 irrigation schemes with a total area of 9578 hectares were completed. Five (5) irrigation schemes with a total area of 3830 hectares under the Agricultural Sector Programme Support are at various stages of implementation.
• A National Irrigation Master Plan Study was started in October 2001 and completion is expected in March 2004.
(iv) Credit facilities:
• A new inputs loans issuance scheme from the National Agricultural Inputs Trust Fund through local banks was completed.
(v) Supporting agro-processing:
• Cashewnuts processing factories at Masasi and Kibaha and four cotton ginneries: Mwaya, Ulanga, Kilosa, Mandera at Bagamoyo and Korogwe were rahabilited.
• A total of 10,500 tons of cashewnuts were processed out of 67,400 tons produced during the 2001/2002 year.
(vi) Strengthening the legal framework in relation to agriculture:
• The Sugar, Tobacco, Coffee and Cotton Acts were completed and became operational in July 2002.
(vii) Agricultural mechanization:
• Improved farm machinery and implements such as 170 power tillers were distributed to the regions. Training of 105 technicians and 7090 farmers were undertaken.

48
(iii) Livestock Sub-Sector During the 2001/02 activities in the sub-sector were directed towards the following areas: (a) Improving animal breads:
• 3,546 in calf heifers were distributed to small-scale livestock keepers, 2,583 were distributed by NGO’s and 963 were obtained from Government Livestock multiplication units.
• 696 improved dairy goats were distributed by NGO’s. • A programme for rapid distribution of improved cattle in the Southern regions has been
completed. Heifer Project International distributed 60 in calf heifers in Lindi, Mtwara and Ruvuma.
• Infrastructure at the Arusha National Artificial Insemination Centre (NAIC) was rehabilitated. Production of liquid nitrogen was started for artificial insemination of cattle belonging to small-scale keepers. 37,852 doses of semen were produced and distributed to livestock keepers against 21,000 in the previous year.
(b) Information, Education and Communication:
• 8000 pamphlets were distributed to farmers on modern beef production, and control of anthrax, CBPP, and swine fever.
• Livestock keepers were trained on modern livestock keeping on cattle and small stock including chicken.
(c) Land demarcation:
• Land demarcation for livestock rearing was undertaken in several areas in the country 83 in Meatu and Igunga districts; 38 villages in Sengerema, Bukombe and Handeni.
(d) Improving animal feed:
• Pasture seed production at Langwira seed farm in Mbeya and Vikuge in Coast region were strengthened for seed production of annual and leguminous pastures.
(e) Control of diseases:
• 48 charcos dams were constructed in 12 regions of the country through contribution of funds by beneficiaries and the Government.
• Continuation of Control of Celebral Thelleriosis and Foot and Mouth and swine fever diseases.
49
• Sensitization of stakeholder to open agro-processing industries eg. the new Arusha Fruit Processing Industries.
(iv) Cooperatives and Marketing Sub-sector The following activities were undertaken during 2001/02: • A new Cooperative Policy was completed. • Loans from local banks for 7 primary cooperative societies and 15 Unions for crop purchase and
for crop export purposes were guaranteed under the ECGS. • A special unit to cater for cooperatives fraud cases has been established in the country’s court
system. • A leadership code for cooperatives has been established in order to enforce leadership ethics. • Some rural roads, markets and selling points are being strengthened through the Agricultural
Marketing Infrastructure Project. Lessons and Challenges: • There has been an increase in resource allocation to the sector during 2002/03. However,
resources allocated to the identified quick wins are not enough to implement fully the identified activities.
• A monitoring system for the sector needs to be developed which will set performance targets and indicators for tracking progress made in implementing ASDP within the PRS monitoring framework.
• Agricultural sector involves a wide range of stakeholders. A strong coordination mechanism at all levels needs to be developed. This will be addressed under ASDP.
• The agricultural sector is still faced with a multiplicity of taxes at Local Government level. PO-RALG in collaboration with the Ministry of Finance is preparing guidelines and strategy for rationalization and harmonization of local taxes.
• Capacity building particularly at district level needs to be enhanced in order to develop and implement District Agricultural Development Programmes.
• Financing of the agricultural sector especially the private sector (farmers processors etc) need to be resolved.
• Most of the agricultural products are still exported in their raw form and fetch low prices in the markets. A study is underway to identify constraints to private sector participation in agro-processing for major crops.

50
Next Steps: 1. The main actions to be taken for launching the second phase of ASDP are as follows:
(i) Roundtable meeting with main partners to identify the respective sub-programmes and components for intervention.
(ii) Detailed formulation of sub-programmes and components. Under the Agriculture Sector Development Programme various studies will be carried out to asses s the distributional impacts of various interventions. Studies will concentrate on impact of tax reforms, review of the functioning of Crop Boards, removal of internal and cross border barriers on food crops, establishment of sustainable rural financial services and on re-orientation of research extension delivery system towards a demand driven approach. These studies will provide information on the linkages between the planned actions and their effects on either commercial and/or on subsistence farmers. 2. Sample Census of Agriculture 2003/2004 The government will, during the year 2003/04 carry out Sample Census of Agriculture in an effort to improve the agricultural data bank for the sector. This is a strategic tool for effective development plans from the village to the national level. The Sample Census will be a follow-up to the 1993/94 Census, which is normally carried out every 10 years. The 2003/2004 Census will cover about 3300 selected rural villages of Tanzania mainland, about 2000 large scale farms and all villages for livestock counts, and will include a consumption module. 3. Food Security Policy
During the year 2002/2003 the government is formulating Food Security Policy. The Food Security Policy will be based on an analysis of the role of Strategic Grain Reserves, current practices of providing food aid to food insecure regions and a review of powers given to regional and district authorities with respect to regulating movements of food crops, and the need to remove trade barriers which inhibit access to internal and regional markets.. 4. Financing of the Agricultural Sector Modalities of financing farmers and the agriculture sector in general to increase production and productivity will focus on specific well costed interventions drawn from the ASDP.

51
5. Agricultural Sector Support Database As part of business development, the PASS initiative will be intensified during the implementation of ASPS II, which will commence in year 2003. 6. Monitoring and Evaluation In Phase II of ASDP formulation, a number of follow-up tasks will be undertaken to elaborate the M&E framework which will include review of existing M & E systems and capacity in the sector in order to identify best practices and training needs; review of the different sector related indicators; TORs for M & E roles within the ASDP Secretariat and others; study on information management needs for agricultural sector in order to strengthen the existing MIS in Agriculture Sector Lead Ministries (ASLMs); and work to complete the database on sector support activities and link with PO-RALG’s inventory of programmes. The ASDP M & E framework will fit within the broader poverty monitoring system established under the Poverty Monitoring Master Plan. This will require routine tracking at national level of a core set of agricultural indicators such as issues related to changes in income and farmers’ share of producer prices. The farmers share of retail or export prices will be an indicator of agricultural incentive structure. Agricultural statistics will be produced from the Agricultural Survey to be conducted in 2003 that will act as a benchmark. Other indicators will be formulated by interpreting the Poverty Monitoring Master Plan with regular feedbacks. Five sets of indicators will be used to track the progress of ASDP namely process indicators, input indicators, output indicators, impact indicators and sustainability indicators. Costing of Interventions: Estimates of indicative funding requirements for ASDP implementation over the next five years have been prepared, which are based on estimates of existing sources of funding from Central Government, and donors at a national level. The importance of private sector investment in agriculture is recognized, and preliminary attempts are being made to establish broad estimates. During the next phase these will be improved so as to form a baseline for ASDP tracking of private sector investment. Also further analysis of NGO financial contribution outside official donor funding will be undertaken once the ASDP database is operational.
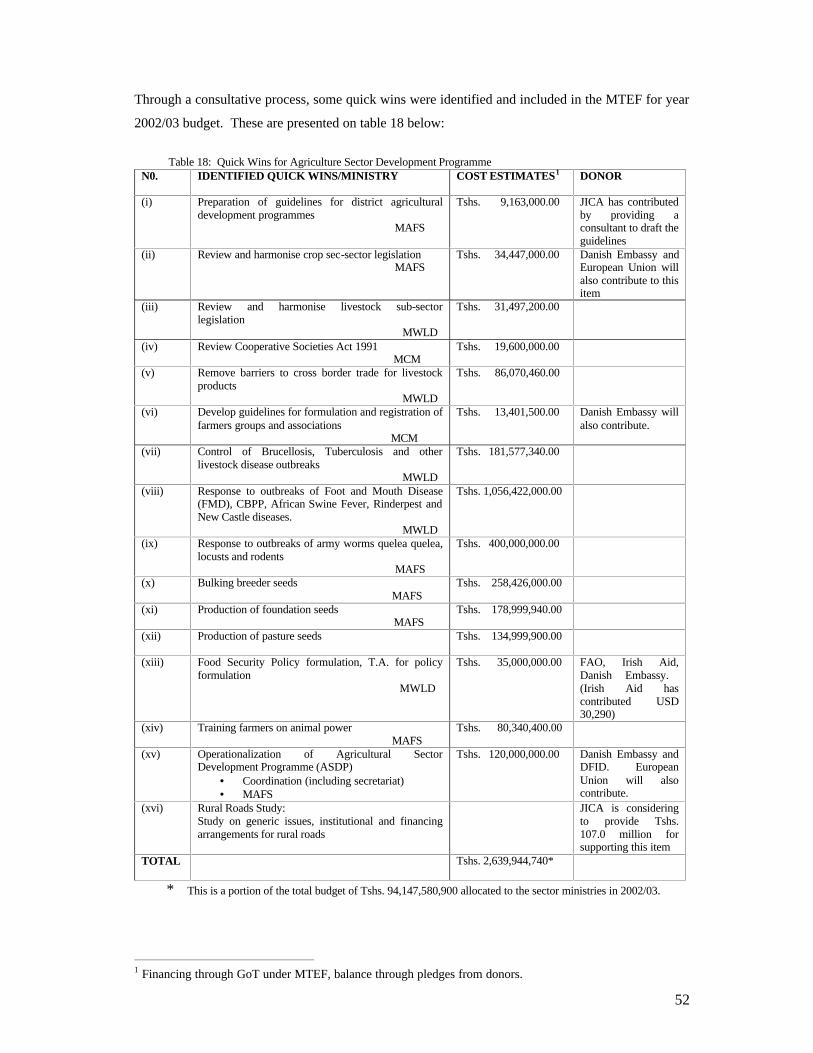
52
Through a consultative process, some quick wins were identified and included in the MTEF for year 2002/03 budget. These are presented on table 18 below: Table 18: Quick Wins for Agriculture Sector Development Programme
N0. IDENTIFIED QUICK WINS/MINISTRY COST ESTIMATES1
DONOR
(i) Preparation of guidelines for district agricultural development programmes MAFS
Tshs. 9,163,000.00 JICA has contributed by providing a consultant to draft the guidelines
(ii) Review and harmonise crop sec-sector legislation MAFS
Tshs. 34,447,000.00 Danish Embassy and European Union will also contribute to this item
(iii) Review and harmonise livestock sub-sector legislation MWLD
Tshs. 31,497,200.00
(iv) Review Cooperative Societies Act 1991 MCM
Tshs. 19,600,000.00
(v) Remove barriers to cross border trade for livestock products MWLD
Tshs. 86,070,460.00
(vi) Develop guidelines for formulation and registration of farmers groups and associations MCM
Tshs. 13,401,500.00 Danish Embassy will also contribute.
(vii) Control of Brucellosis, Tuberculosis and other livestock disease outbreaks MWLD
Tshs. 181,577,340.00
(viii) Response to outbreaks of Foot and Mouth Disease (FMD), CBPP, African Swine Fever, Rinderpest and New Castle diseases. MWLD
Tshs. 1,056,422,000.00
(ix) Response to outbreaks of army worms quelea quelea, locusts and rodents MAFS
Tshs. 400,000,000.00
(x) Bulking breeder seeds MAFS
Tshs. 258,426,000.00
(xi) Production of foundation seeds MAFS
Tshs. 178,999,940.00
(xii) Production of pasture seeds
Tshs. 134,999,900.00
(xiii) Food Security Policy formulation, T.A. for policy formulation MWLD
Tshs. 35,000,000.00 FAO, Irish Aid, Danish Embassy. (Irish Aid has contributed USD 30,290)
(xiv) Training farmers on animal power MAFS
Tshs. 80,340,400.00
(xv) Operationalization of Agricultural Sector Development Programme (ASDP)
• Coordination (including secretariat) • MAFS
Tshs. 120,000,000.00 Danish Embassy and DFID. European Union will also contribute.
(xvi) Rural Roads Study: Study on generic issues, institutional and financing arrangements for rural roads
JICA is considering to provide Tshs. 107.0 million for supporting this item
TOTAL
Tshs. 2,639,944,740*
* This is a portion of the total budget of Tshs. 94,147,580,900 allocated to the sector ministries in 2002/03.
1 Financing through GoT under MTEF, balance through pledges from donors.

53
Table 19 presents the overall situation for the 2002/03 approved budget estimates for the Agricultural Sector Lead Ministries (ASLM) for both recurrent and development costs. Table 19: Agricultural Sector Lead Ministries Approved Budget Estimates for 2002/03 Tshs Million
Recurrent PE OC Total
Development Total
Overall Total
MAFS 3,625 11,033 14,658 18,604 33,262 MWLD2 2,054 5,440 7,494 4,619 12,113 MCM 226 5,672 5,898 1,197 7,095 PO-RALG & RS3 180 112 292 292 LGAs 17,340 2,090 9,430 952 9,525 PMO3 310 3,310
TOTALS 13,424 24,347 37,771 23,492 62,5964 The estimate of TShs 64.3 billion (equivalent to US$65.6 million) represents the funds GOT has committed to expend from its own resources, and donor resources which are captured through the official budgeting process. The sources of funds for the development budget are primarily from donors, with GOT’s contribution amounting to TShs 2.4 billion; less than 10 percent. There are, however, additional donor resources, which are outside the budgetary process. The Ministry of Finance maintains a database to cover all donor commitments and, taking into account those for the agricultural sector, it would appear that there would be an additional TShs 16.7 billion, (equivalent to approximately US$17 million) to be disbursed during 2002/03. This gives a total development estimate of approximately US$43 million, and an overall budget estimate of US$80.5 million, of which 46.7 percent is for recurrent budget expenditure. Development estimates are based on the needs of projects and programmes. As such, they often include running costs, so in reality the real investment content of the budget would be somewhat lower than the estimated US$43 million reported as development budget. 2 The common services for water and livestock have been divided in proportion to the sector-specific departments. 3 This is an estimate based on the actual budget estimates of the Regional Secretariat for Economic Services, with an average of three agricultural officers working in the agricultural sector. 4This is taken from the RALG estimates for the LGAs with an estimation procedure for the PE costs for the six regions where they were not separated for the agricultural budget. 2Only three regions reported any development fund allocation for agriculture 3 Only the development estimates for the IFAD and African Development Fund supported Rural Finance and Marketing Projects are included.

54
Estimates for the Future: Increased investment in agriculture from both public and private sectors is required during the ASDP. However, it will be necessary to direct additional funding to the strategic areas identified in the ASDP. A detailed analysis of where present investments through GOT and donors are being directed will be part of the initial work of the ASDP Secretariat. Table 20 gives the breakdown of the Agriculture Sector Development Budget for the year 2002/03 and the proposed growth. The emphasis of ASDP is on two broad fronts: commercialising agriculture and decentralising to districts and field level. The first entails major increases in marketing and finance for farmers, traders and processors, and encouragement to invest. It also requires greater attention to policy and regulatory improvements, which will provide such encouragement. It will not be difficult to increase both areas significantly. In the case of marketing and finance, the existing programmes are in selected areas and experience can be used to extend these (an estimate of 30 percent is used); in the case of policy and regulatory work the present funding level could readily be increased to include further work to enhance the attractiveness of investing in agriculture (an estimate of 40 percent is used). For the decentralisation and reorientation process, additional funding would be required, so an estimate of increasing spending for institutional support is given as 30 percent. In addition, the research and advisory services should continue to be targeted as overall engines for agricultural sector growth, as outlined in the PRSP. There will be elements of these in many programmes, and whether or not there are separate programmes for these areas, there will be a need for increased funding of at least 20 percent.
Table 20: Composition of Interventions in Agricultural Sector from GOT and Donors for 2002/03
Area of Intervention TShs Million Percent Proposed annual increase (percent)
Research 6,527 15 20 Extension and advisory services 9,404 22 20 Livestock production 792 2 10 Crop production 5,164 12 10 Irrigation 6,919 16 10 Marketing and finance 7,996 19 30 Policy and regulatory work 1,805 4 40 Food security 488 1 10 Institutional Support 3,749 9 30 Training Institutions 97 - 10 Total 42,940 100 20 4 This total does not include funds for the Ministry of Works TShs 8.615 billion, and funds for agriculture credit under the export commodity guarantee scheme by the Bank of Tanzania TShs 6.0 billion.

55
Combining the projections for Development and Recurrent over the next 5-year period of ASDP gives an overall projected requirement of TShs 617.2 billion, or approximately US$625 million. The breakdown of this is given in Table 21 below. These preliminary estimates require considerable further refinement during ASDP implementation. They do, however, provide an initial assessment of the levels of funding that will be required to support the activities falling within the ASDP coordination framework. They represent a very significant increase in funding, which will be supported by continuing reforms and capacity building.
Table 21: Estimate of Overall ASDP Requirements (Tshs Billion)
Sub-Programme
Year 1 Year 2 Year 3 Year 4 Year 5 Total
Type A
19.9 29.5 42.1 58.6 80.1 230.3
% A of Development
38.7% 47.7% 56.8% 65.9% 75.0%
Type B
29.0 29.2 28.3 25.9 21.4 133.8
% B of Development
56.3% 47.3% 38.2% 29.1% 20.0%
Type C
2.6 3.1 3.7 4.4 5.3 19.2
% C of Development
5.0% 5.0% 5.0% 5.0% 5.0%
Total Development
51.5 61.8 74.2 89.0 106.8 383.2
Personnel Emoluments5 14.5
15.4 16.1 16.8 17.3 73.3
% PE of Recurrent 35.1%
34.3% 34.3% 34.1% 33.6%
Other Charges 26.8
29.4 30.9 32.5 34.1 144.6
% OC of Recurrent 64.9%
65.7% 65.7% 65.9% 66.4%
Total Recurrent 41.3 44.8 47.1 49.3 51.4 217.9
Overall Total 92.8 106.6 121.3 138.3 158.2 617.2
5 It is assumed that salary increases will be offset by reduction in total number of staff.

56
5.0. CROSS CUTTING ISSUES 5.1. Overview The Government initiated a process to integrate cross cutting issues in Poverty Reduction Strategy and budget. This chapter highlights status of progress and achievements in six identified areas which include elaboration of rural development strategy, environment, HIV/AIDS, Gender, Governance and Employment. It includes also discussion on the implementation status of the Local Government Reform and Development of Human Capital. 5.2. The Rural Development Strategy The overall objective of the Rural Development Strategy (RDS) is to provide a s trategic framework for coordination of strategies concerned with the development of rural communities. In particular, the RDS supports the implementation of the Poverty Reduction Strategy and will create a development environment that will enable rural communities and households to achieve sustainable livelihoods. In this respect the Rural Development Strategy identifies short and medium term priorities to support sustainable livelihoods, and contribute to the long-term goal of sustained economic growth as outlined in Vision 2025. The Policy Context of RDS The Rural Development Strategy has linkages with other major policy initiatives, all of which are complementary to one another (See box 6 below).
Box 6: Major policy initiatives linked to RDS • The Tanzania Development Vision 2025 - TDV (1999). • The National Poverty Eradication Strategy-NPES (1998). • Tanzania Assistance Strategy -TAS (2001). • The Poverty Reduction Strategy Paper-PSRP (2000) • The Agriculture Sector Development Strategy- ASDS (2001) • Rural Development Policy (Draft 2001) • Community Development Policy (1996) • National Employment Policy (1997) • Sustainable Industrial Development Policy (1996) • National Micro Finance Policy (2000) • Agriculture and Livestock Policy (1997) • Mineral Policy of Tanzania (1997) • Tanzania Women in Development Policy (1998) • National Environmental Policy (1997) • SME Development Policy (2002) • The Wildlife Policy of Tanzania (1998) • National Forestry Policy (1998) • National Fisheries Sector Policy and Strategy Statement (1997) • Health Sector Reform (1994) as updated • Education Sector Reform and Development Programme (1999) • Cooperative Development Policy (1997) • Rural Water Policy (1997) • Women Development and Gender Policy (2000) • Road Sector Development Programme (1997) • National Land Policy (1995)
57
The Dimensions of RDS: The Rural Development Strategy defines:
• An institutional framework for co-coordinating and linking sector specific strategies and
programmes for the development of the rural population. • The roles of central Government, local authorities, the private sector and civil society in the
implementation and monitoring of rural development programmes. • The key linkages between sector specific strategies and programmes, and how those linkages
will be strengthened. • The gaps in current policies and strategies, including implementation constraints, and outline of
strategic actions to address those gaps. • The criteria for identification of geographical differences and measures to redress regional
disparities. • The coordination mechanisms. • The criteria for monitoring and evaluating the implementation of the Rural Development
Strategy. The realization of rural development in the context of the country’s development vision largely depends on the pace of growth in the agricultural sector, the adoption of a positive mindset by the rural society, and focus on capacity building for the institutional framework in the rural areas. In this context, measures are directed towards attaining the following: • High quality livelihood • An enabling and peoples empowering environment • Self-reliance and self-sustainance • Trade and international competitiveness The Strategy: A cohesive strategy for rural development in Tanzania involves four categories of strategic interventions; (i) promoting pro-poor growth; (ii) increasing opportunities and access to services and assets of the poor; (iii) reducing risks and vulnerability; (iv) adherence to good governance.

58
Improving the living standards of the rural people will depend on improvements on several initiatives. These include intensifying and commercializing small-holder agriculture, providing infrastructure and services, improving access to economic and social services such as education, health, land, financial services and markets, and ensuring sustainable management of the natural resource base. Effective management of resources, ensuring social well being, and developing the capacity to cope with climatic, economic and social threats are also important. Next steps: The Rural Development Strategy is the framework for the implementation of the Rural Development Policy, and will enhance the realization of the Poverty Reduction Strategy as it focuses on areas where 80 percent of the country’s population lives. • The RDS will establish and strengthen the link between growth of rural economy and
macroeconomic policies. • Strengthening the implementation of the local government reforms for efficient service delivery. • Strengthening good governance and poverty reduction linkages/efforts.
5.3. Environment The Government has, in collaboration with stakeholders, initiated a process aimed at the integration of environment into the PRSP. Priority actions were identified and the progress achieved on these priority actions since June 2001 is as follows: • The Government appointed ‘environment champions’ to serve in the technical working groups
of the poverty monitoring system. The ‘champions’ provide technical expertise as well as advocating environmental/livelihoods issues into the PRS process. Terms of References for the ‘champions’ were developed and an initial briefing meeting on the PRS process was held in May 2002.
• In addition a wider ‘think-tank’ of environmental experts was formed to (a) provide the four
champions with additional expertise as required and (b) be able to provide inputs to other PRS related fora that go beyond direct participation in the four technical working groups of the PMS.
• Potential partners for data delivery and the development of an environment module to be
included in the Tanzania Socio-Economic Database were identified and contacted.
59
• The Government conducted a workshop to formulate a comprehensive programme on the integration of environment into the Poverty Reduction Strategy process. A wide group of stakeholders comprising different government institutions, academia and NGOs brainstormed on objectives, outputs and potential activities of the forthcoming programme. The programme will focus on broad-based capacity building, data management and advocacy to systematically address poverty-environment linkages. It will provide the means to implement the main priorities agreed upon during the June 2001 consultative meeting as well as a range of additional activities.
• The Division of Environment in VPO and the National Environmental Management Council
with technical advice from the champions developed an initial proposal for integration of environment as a crosscutting issue into the PER/MTEF process.
Next steps: The forthcoming programme on integration of environment into the PRS process will address: • Capacity strengthening of key government institutions to foster the integration of environment
into the PRS process including transformation of these institutions from production oriented agencies to resource management agencies.
• Improving access to and utilization of poverty-environment related data in the PRS process and at local level planning, building on the ongoing poverty monitoring work and existing data systems, e.g. the TSED, and the PO-RALG M&E system.
• Establishment of a set of relevant national and sub-national level indicators and targets to track poverty-environment changes, and to monitor impact of policy interventions.
• Improving knowledge and awareness on poverty-environment linkages through a broad based advocacy, sensitization and dissemination strategy. This will include, among others, the consolidation of existing good practices, additional research, training and other forms of dissemination, targeting government, civil society and the private sector.
• Strengthening institutional framework for environmental management, including rationalization of roles and responsibilities, review of priority sectoral policies and development plans, identification of gaps and overlapping issues that would hamper enforcement of relevant rules.
• Initiation of a process with a view to reviewing existing laws and regulations governing the utilization and management of open access resources (coastal fisheries and forests) and initiate implementation of community-based management of these resources.
• Commencement of the consolidation of various laws governing environmental management in a single environmental framework law.
60
5.4. HIV/AIDS Progress and Achievements: The Government has continued its efforts to address HIV/AIDs pandemic. The following achievements have been made so far: (a) An Act of Parliament to formally establish TACAIDS was passed by Parliament and
became operational on 21/1/2002, giving TACAIDS the legal power to operate. (b) A special DAC HIV/AIDS group has been formed to work with government to address
HIV/AIDS issues. (c) Advocacy and sensitization workshops and seminars for religious leaders, civil-military
alliance and workplace interventions were undertaken. (d) HIV/AIDS/STI surveillance is carried out and reported annually by the National AIDS
Control Programme under the Ministry of Health. Monitoring the trend of the epidemic is also a high priority.
(e) HIV/AIDS has been included in the PER/MTEF process. HIV/AIDS activities have been
mainstreamed in budgets of all sectors. During 2001/02 T.Shs.7.3 billion was set aside for HIV/AIDS activities, out of which, T.Shs, 4.0 billion was local funds and T.Shs.3.3 billion was foreign grants. Due to low institutional capacity at this formative stage, a good proportion of those funds could not be utilized.
Next steps: • Following the endorsement of TACAIDS’ organizational structure, the formation of its
secretariat is at an advanced stage. • The national multi-sectoral strategic framework for HIV/AIDs will be finalized during this fiscal
year. The framework will spell out priority areas and programmes for intervention. • The Commission will continue with its mandatory role of policy formulation, strategic planning,
advocacy, monitoring and evaluation and public dissemination of information on HIV/AIDS through electronic and print media as well as other dissemination channels.

61
5.5. Gender Overview: In 2000/01 the Government continued to address capacity development problem within Government Ministries/Sectors to implement the Women and Gender Development Policy. This included mainstreaming gender into poverty reduction strategy and budget through MTEF/PER process. Progress and achievements: • A draft terms of reference for mainstreaming gender in the Public Expenditure Review has been
developed. As part of engendering the PER process, some tools and gender training activities were developed to support planners/budget officials in priority sectors to mainstream gender in MTEF budget processes. A needs assessment on the establishment of gender focal points in sectors has been completed.
• A draft National Strategy for gender development and a draft framework for implementation of the women and gender development policy have been developed. These will be shared with a wide range of stakeholders, before finalization.
• The sector development strategies and programmes which were developed in 2001/02 were engendered through participation of gender experts during preparation and consultation process. The poverty monitoring process has also been engendered by including gender experts in its technical working groups.
• The Inheritance and Marriage Act 1971 and Laws relating to children have been reviewed to address key gender concerns.
• In view of the high prevalence of HIV/AIDS among young women and girls, a community- based strategy framework for the protection of women and children against HIV/AIDS/STIS has been developed.
Lessons Learned: • Engendering policies is a continuous process. However, it is taking time to change people’s
attitudes towards gender. The process is also constrained by insufficient skills in gender analysis and limited financial resources.
62
Next Steps: • The institutionalization of gender in central and local government machineries will be continued
through establishment and strengthening of gender focal points. • Women and gender development policy will be operationalized through mainstreaming gender
into poverty reduction strategies and training of key staff in priority sectors on mainstreaming gender in the MTEF/PER and strengthening of gender analysis in the poverty monitoring system. Review of gender discriminatory laws will also be intensified with a view to amending them.
• The Ministry of Community Development, Women Affairs and Children in collaboration with other stakeholders will also develop gender monitoring and evaluation tools and techniques.6
5.6. Governance Progress and Achievements During fiscal year 2001/02, the government continued to undertake various interventions aimed at bolstering good governance. The interventions were directed towards reduction of corruptive practices, improving public financial management and strengthening of the judicial system. Specific undertakings during the year included: • Use of mass media in the anti-corruption strategy and action plans. Mass media were involved
on various occasions including public rallies, seminars, regular meetings, newsletters, posters, leaflets and radio programmes to raise awareness of the public on anti-corruption strategy and action plans.
• The Ethics Secretariat has been given authority to receive anonymous complaints, thus being able to conduct proactive investigation against leaders suspected to break the code of ethics.
• Following progress in implementation of the Anti Corruption Strategy, Tanzania has been ranked 71 out of 106 countries as compared with the 91 position held previously in the transparency international corruption perception survey.
• Reporting capabilities have been enhanced especially with regard to Government activities at the regional level. Each Sub-Treasury is on IFMS (though on a stand alone mode) due to technical problems that are being worked out.
• A Country Financial Accountability Assessment (CFAA) was carried out for fiscal year 2001/02 with the involvement of development partners. Measures to integrate CFAA recommendations into a broad public finance reform programme are being discussed.
6 The name of the Ministry has been changed to “Ministry of Community Development, Gender and Children”

63
• The Ethics Division of the Civil Service Department has been conducting several information, education and communication activities to create a greater awareness among public servants of their responsibilities, rights and avenues for reporting cases of misconduct.
• The Government continues to improve the PER process as a vehicle to review public expenditure performance.
• The Government is committed to improving the salaries of public servants particularly professional, technical and managerial staff. Pay increases were effected for this year and the Government continues to be committed to the pay reform under the public service reform programme that will ensure improved service delivery.
• The Government has set up a coordination mechanism in the Chief Secretary’s Office (Good Governance Coordination Unit-GGCU) to ensure that all complementary activities are well harmonized for maximum impact on improving governance. The GGCU has developed a reporting format that will enable better follow-up of their undertakings.
• MDAs have developed anti-corruption action plans that are incorporated into the broader strategic plans b eing put in place as part of the public service reform programme.
Next steps: The government, in collaboration with development partners, will continue to strengthen the process of reporting within the context of the National Anti Corruption Strategy and Action Plan (NACSAP). In particular, it will begin to report on a number of cross-cutting functions of government to minimize corrupt practice. The Government will also facilitate the development of an Anti Corruption Strategy for local governments, private sector, civil society and the mass media. Further, the government will continue to support initiatives to strengthen the capacity of CSO, NGOs and mass media to enable them to participate fully in the war against corruption. 5.7 Employment Overview: The government has noted with deep concern the fact that although the ongoing reforms in Tanzania have resulted in economic growth recovery and recorded macro-economic stabilization, such growth does not seem to have made a substantive improvement in enhancing access to productive and quality employment among the majority of Tanzanians, especially the youth. The government has thus prepared a Country Action Programme (CAP) for employment creation under the PRS process. The programme has identified 17 project areas covering institutional
64
capacity building, employment promotion, support to SMEs, job creation through agricultural production, smallscale mining, and labour intensive infrastructure. The projects include those designed to enhance capacity building for policy analysis and coordination of employment creation initiatives including provision of key inputs into the employment creation activities. They also include those which address cross cutting issues, namely, gender mainstreaming, support to people with disabilities and prevention of further spread of HIV/AIDS. Progress and Achievements: Demand – Driven Skills Training Programme for Employment Promotion • The programme conducted training in 19 districts. The training included various types of
farming (crops, vegetables, fish, animal husbandry and poultry keeping), carpentry, masonry, beekeeping, small business, tailoring, food preparation and nutrition. The total number of trainees was 348 of which 167 were males and 181 females.
• The government has upgraded the employment section of the Department of Labour to a fully-
fledged division on employment with qualified staff and working facilities. The division is responsible for employment promotion and other related matters.
• A Labour Exchange Centre has been established in Dar es Salaam. A total of 3,131 job seekers
have been registered (30% females, 70% males) of which 63% are youths (20 -35 years). Professionally the registered job seekers comprise 31% University graduates, 24% secondary education graduates, 15% college education and 18% primary education leavers. Out of total job seekers, 1,357 were referred to employers for job interviews and employment, out of which 119 were hired. 423 job seekers were provided with job search information and adv ice to enhance their chances of success in their efforts to look for jobs on their own. 108 registered job seekers were provided with vocational guidance and counseling.
Addressing the problem of Child Labour • In collaboration with stakeholders the Government has prepared a National policy to guide
interventions against child labour. • The national child labour survey has been carried out to establish the extent of Child labour in
the country. A total of 4.8 million children have been identified to be working in various economic sectors including the most hazardous types of work.
65
• The Government has formed the National Inter-Sectoral Coordination Committee responsible
for coordination of programme interventions. • Through the coordination by the Child Labour Unit, about 4,000 children have been withdrawn
from worst forms of labour in Iringa, Mbeya, Singida, Morogoro and Ruvuma regions. They have now been provided with suitable alternatives including formal education and skills training.
• About 800 poor families have been supported to undertake income-generating activities. This
has reduced parents’ dependence on child labour and has enabled them take up parental responsibilities. This has been successful in Iringa, Singida and Ruvuma regions.
• The Government is coordinating the implementation of the programme against worst forms of
child labour in 11 districts; out of which 8 districts have already set up district implementation and coordination mechanisms while the remaining 3 are being contracted.
• The Government is reviewing labour laws to ensure that children are protected against
employment. • Social Welfare Services: In collaboration with other partners the government has rehabilitated the Orphan Centre building at Kurasini and has constructed a workshop at Upanga remand home for equipping inmates with necessary skills for self-employment. Next Steps: The Government will continue to implement CAP with particular focus on demand-driven skills programme at district level. Other activities planned to be carried out include: • Finalization of the National Employment Policy • Finalization of the Child Labour Policy • Finalization of the Elderly Policy • Revision of outdated labour laws • Strengthening of the Dar es Salaam Labour Exchange Centre and establishment of Labour
Exchange Offices in each region

66
• Review of micro credit schemes for youth, women and other groups. • Finalization of new SME Policy. Costing of interventions: Table 22: Demand driven skills training programme (2002/03-2004/05)
Components Budget (Tshs. Million) 2002/03 2003/04 2004/05 Allocation Estimated Allocation Estimated Allocation
Training additional people in districts already covered and extending to other districts
76.0 276.0 76.0 276.0 76.0
Equipment 4.0 4.0 4.0 4.0 4.0 Other costs (Admin) 20.0 20.0 20.0 20.0 20.0 TOTAL 100.0 300.0 100.0 300.0 100.0 RESOURCE GAP 200.0 200.0 5.8 Local Government Reforms An Overview: Restructuring of LGA’s is an ongoing process which is aimed at reorganization of structures of LGAs to meet the challenges of delivery of quality services. The reform programme facilitated and backstopped the preparation of councils’ strategies and performance indicators. This was done in collaboration with sector ministries and was aimed to ensure that sector policies, service standards and staffing levels are captured in the Councils’ restructuring exercise. The reform programme has also provided financial support for restructuring activities and capacity building within local authorities. Progress and achievements: A draft framework for participatory planning and budgeting at the local level was developed. Steps have been taken to streamline institutional and legal framework to pave the way for the decentralization process. Measures taken include establishment of Legal Harmonization Task Force to advise on interventions for pushing forward the sector law harmonization exercise.
67
During 2001/02, Councilors’ and grassroots leaders’ training materials and guidelines were developed with the aim to operationalize the Local Government Staff Regulations of 2000. The reform programme provided a manual to guide LGAs to enhance revenue collection from own sources and popularize a handbook for management of finances at primary school level. The Fiscal Decentralization Task Force (FDTF) was established in November 2001 with the objective of establishing stronger coordination on the implementation of fiscal decentralization so that councils can have stronger financial autonomy. Key issues for the implementation of fiscal decentralization include assessment criteria for selection of councils for greater financial autonomy and capacity building for LA staff to enable them manage the process. The ultimate objective is to have all councils qualify for the greater financial autonomy. Challenges: The reform programme is confronted with the following challenges: • Blockages which are stalling financial decentralization including provision of block grants to
LGAs. • Blockages which are hampering the progress of decentralizing the management of staff by
LGAS. • Lack of skilled and properly motivated manpower for the Councils. • Various sectoral laws not in consonance with the government resolve to decentralize authority,
responsibilities and resources to the people through their LGAs, and • Institutional set-up that does not facilitate speedy and smooth implementation of the reforms. Next Steps: During this fiscal year the programme will continue to implement the following activities under the LGRP Medium Term Plan (2002/03-2004/05): • Training Ward Executive Officers, councilors and leaders at grassroot level. • Training of regional secretariat staff on poverty auditing. • Continue with the LGAs restructuring process. • Publish and distribute booklets on good governance and the LGRP in general. • Educate and sensitize the general public on the LGRP through radio and TV programmes. • Assist LGAs to prepare framework for local anti-corruption plans and monitor their
implementation with PCB.

68
• Finalize and implement a framework for participatory planning and budgeting. • Provide in-house training to LG staff to improve management of finances and enhance financial
accountability. • Provide training to LG staff on implementation of Integrated Financial Management System
(IFMS). • FDTF to finalize the methodology for selection of councils for greater financial autonomy,
involving data collection, analysis and reporting. • Design of alternative formula-based method of allocating grants to enhance transparency and
ensure the system is sensitive to policy changes. 5.9. Human Capital Development Human capital development is critical for the success of the PRS. The Government has decided to monitor progress on the development of human capital under PRS’s cross cutting issues. The focus will continue to be on strengthening leadership and management qualities, meritocracy, restoration of ethical conduct, gender equality and pay reform. These are ongoing activities which will be continued and tracked under the Public Service Reform Programme for the Central Government and the Local government Reform Programme for the local authorities. The public service reform and the local government reform programmes will develop through a consultative process, indicators to monitor progress on capacity building for the central and local government respectively. Progress and achievements in developing and strengthening human capital will then be assessed through use of indicators and reported in the PRS monitoring framework. The Government recognizes that children and young people are key to sustained future workforce. Specific sectors contribute to improving conditions for children and young people, notably in education and health. Critical cross-sectoral concerns, including the struggle against HIV/AIDs, need to be given more attention especially as they relate to children and young people. The government will thus continue its efforts to identify and address specific problems affecting children and young people in the context of Poverty Reduction Strategy. Progress and Achievements: • Increasing enrolment in primary schools • Maintaining high immunization rates
69
Challenges: • Increasing support for most vulnerable children and livelihoods for young people. • Increasing coverage and use of insecticide-treated nets, especially in poor households. • Improving quality and performance in primary education, especially performance of girls. • Improving access to education for those who are being left out and those who had dropped out
of primary schooling. • Reducing rates of malnutrition in young children through greater attention to child-care and
feeding practices, easier access to water and fuel supplies, and involvement of men in caring for young children.
• Improving rates of attended births nationally to match the experiences of some surveillance sites.
• Strengthening capacities of communities and local authorities for participatory planning processes which are inclusive of children and young people.
• Strengthening provision of technical training for young people. • Supporting establishment of network of youth-friendly health services. • Expanding support for livelihood strategies for young people. Next Steps: • Expand consultation with representatives of children and the young. • Review plans and budgets from the perspective of children and the young and reallocate
resources according to emerging priorities. • Provide increased support for most vulnerable children. • Support, monitor and document experiences in innovative programmes to improve livelihoods
of children and the young.

70
6.0. BUDGET FRAMEWORK FOR POVERTY REDUCTION PROGRAMMES 6.1. Overview This section focuses on the budget framework for poverty reduction. It assesses and projects the budgetary resources available now and likely to be available in relation to requirements of priority sectors over the medium term. It is clear that the financing gap for priority sectors will persist in the medium-term and additional resource enhancing measures need to be deployed. This section also highlights measures taken by the government to improve resource mobilization in 2001/02 and 2002/03 and the government plans in the medium term. 6.2 Resource envelope: a macroeconomic perspective Financing of the PRS is outlined in the Medium Term Expenditure Framework (MTEF). The macroeconomic policy targets for the period 2002/03 – 2004/05 have been drawn ensuring consistency with the revised medium term targets for the PRS as outlined below: • Real economic growth of 5.9 percent in 2002, rising to 7.0 percent by the year 2005. • A consumer price inflation rate of 4.2 percent by end-June 2003, declining to 4.0 percent by
end-June 2004 and thereafter remaining consistent with major competitors and trading partners; • Domestic revenue yield at equivalent of 12.3 percent of GDP in 2002/03, increasing to 12.8
percent in 2003/04 and with a target of up to 14.0 percent in 2004/05; • Expansion of broad money supply (M2) consistent with macro-fiscal targets; • Maintenance of foreign reserves above the equivalent of 4.0 months of imports of goods and
services. 6.3 Budget frame consideration for financing of priority sectors The Government remains steadfast in continuing to implement policies that can enhance domestic resource mobilization to raise government domestic resources and giving priority to funding poverty reduction programme, and to reduce dependency on foreign aid. The outcome of recent efforts has been encouraging. In fiscal year 2001/02, domestic sources reached Tsh. 1,056 billion which is about 70 percent of constrained requirements of priority sectors, which stood at Tsh. 1,498 billion. In the medium term, priority sector requirements are projected to be much higher, as sector development programmes become operationalised. Given the projected resource envelope and expenditure requirements for 2002/03 – 2004/05 (Appendix I Table 1), there will not be adequate domestic
71
resources to meet all requirements for priority sectors. While the government is intensifying efforts to raise further domestic revenue, it will still need enhanced financial support from development partners including concessional financing. 6.4. Medium-Term Revenue Generating Measures The large size of the informal economy including the dominance of peasant agriculture, coupled with the high level of poverty, in large part explain the narrow revenue base. Positive economic growth combined with measures to streamline tax policy and tax administration, have generated improvements in revenue in the past five years. However, the revenue yield relative to GDP remains low. In the budget for 2002/03 the Government took additional measures to reduce revenue leakage, improve voluntary compliance and expand the tax base including further reduction of exemptions. It is important to mention here the focus n of reforms directed at Taxpayer Department, which has performed strongly during the year and promises potential for more revenue yield in the coming years. The government is committed to enhance the revenue base in the medium-term through a number of additional measures, including the following: • An Act on Export Processing Zones (EPZ) was enacted by Parliament early 2002. However, to
avoid the possibility of revenue leakage in future, the government is reviewing this legislation with a view to directing the focus to take advantage of export markets under the United States’ AGOA and European Union’s Everything–But–Arms (EBA) arrangements. In this regard, the implementation of EPZs will start on the basis of the regulations that focus on access to AGOA and EU, while the required amendments to the act are being processed.
• The Government intends to review tax laws, starting with the income tax legislation with a view to rationalizing them to enhance the tax yield.
• The government will continue to review the remaining exemptions with a view to cutting them back to enhance the tax base.
• The government will review the tax contribution of the high-growth sectors such as mining, to enhance revenue.
• A centralized motor vehicle registration system has been adopted to increase efficiency and curb revenue leakage.

72
6.5 Public Expenditure Management in the Medium Term The Government intends to pursue further reforms to enhance public expenditure management. In order to allow better tracking of outlays to priority sectors, the government will harmonize the presentation of priority expenditures based on uniform budgetary codes across PRS, the budget, and budget execution reports, starting with the budget guidelines for 2003/04. The recording and reporting of donor-funded project expenditure continues to be strengthened in collaboration with development partners. As in the last year, public financial management policies for 2002/03 are focusing on supervision and enforcement of expenditure discipline. The provisions of the Public Finance Act and the Public Procurement Act (both of 2001) will continue to be enforced. The procurement regulations will be reviewed to facilitate efficiency improvement in government procurement. The IFMS, now operational in all ministries and departments, will be strengthened in the regions to ensure that expenditure and revenue reports are captured directly by the system. Expenditures for all votes in the 2002/03 Budget include provision for payment of all taxes. The government is taking measures to harmonise and classify local government budgets into the GFS classification. In order to increase transparency and accountability, local governments have started publishing the consolidated fiscal accounts on a quarterly basis with a view to do the same for their individual reports. The consolidated report was published in October 2002. Finally, the fiscal year of local governments will be brought in line with that of the central government by 2004/05.
73
7.0. POVERTY MONITORING AND EVALUATION 7.1. Overview: The Poverty Monitoring Master Plan was published in December 2001. The Plan is operationalized through activities of four (4) technical working groups, namely, Censuses and Surveys; Routine Data System; Research and Analysis; and Dissemination, Sensitization and Advocacy. 7.2. Progress to-date: Surveys and Censuses - The major task planned during 2001/02 was the completion of Household Budget Survey (HBS) - 2000/01. The survey was finalized in March 2001. Analysis of HBS results was finalized in July 2002. The final report on the results of the Household Budget Survey have been published and disseminated. The group also coordinated the Integrated Labour Force Survey during the year. Recently the group coordinated the National Population and Housing Census carried out throughout the country as part of the multi-year planned surveys to feed into the Poverty Monitoring System.
Routine Data –Within the Local Government reform the group has continued its effort to link the Poverty Monitoring System and the Local Government Monitoring and Evaluation system. The immediate main task of the group is capacity building for data collection and processing, at the local government level. The group has undertaken sensitization activities on the Poverty Monitoring System with focus on roles of local authorities in data generation, collection, processing, and analysis. Research and Analysis – The group has undertaken several studies as part of the PMS research agenda. The studies include (i) Poverty and Vulnerability (ii) Macro-Micro Linkage, (iii) Urban Poverty and (iv) geographic diversity of poverty. The findings of these studies coupled with the analysis of the HBS 2000/01 and the ILFS have been reported in the Poverty and Human Development Report (PHDR) 2002 for Tanzania, which was also prepared by this group.

74
Dissemination, Sensitization and Advocacy – In close consultation and collaboration with the other technical working groups, the DSA group has continued with popularization of policies and strategies on poverty targeting both upstream policy level and down stream actors. During 2001/2002 the group produced a simplified popular version of PRSP Progress Report (2002/01) in both English and Kiswahili languages. The popular versions along with ordinary versions were officially launched in April 2002. The group has also prepared a user guide for the Poverty Monitoring Master Plan to ensure that different target groups understand the Master Plan and this was launched during the Poverty Policy Week in September 2002.
7.3. Financing of the Poverty Monitoring Master Plan The Government has included the cost of poverty monitoring in its budget for 2002/03 financial year. It has created a budget line under the Vice President’s Office for this purpose. Out of about 2.5 billion shillings estimated for implementing activities of the PMMP during 2002/03, the Government has allocated 1.1 billion shillings. The Government is mobilizing additional funding from external development partners. It has also devised a mechanism for joint donor funding for the poverty monitoring system. A Memorandum of Understanding for management of pooled funds in this respect has been prepared. Lessons and Challenges The Tanzania approach can provide a number of key lessons for other countries preparing national systems for poverty monitoring. The most important are: • Adopting a multi-stakeholder approach enhances legitimacy and help build consensus on key
goals and objectives. It also brings on board as much existing capacity as possible to meet the many demands that will come to bear on the system.
• Taking a coordinated approach to working both within government and with external partners, besides building legitimacy, the system taps a wide range of expertise and financing during the early phases of PMS design.
• Linking traditional survey based instruments with the administrative data system and a programme of PPAs to create a holistic analysis of poverty trends and progress against public actions identified in the PRS.
75
7.4. Next Steps The Poverty Monitoring Technical Working Groups have planned to undertake the following during 2002/03: • Surveys and Censuses Technical Working Group has planned to finalize the analysis of
the National Population and Housing Census during the 2002/03. The group is also preparing for the Agricultural Survey to be conducted in 2003, which will include a consumption module.
• Routine Data Technical Working Group will continue with capacity building initiatives at
local government levels, on data generation, collection and analysis. The group will also carry out zonal sensitization workshops on poverty monitoring system at all levels of local government authorities, especially stressing the importance of administrative data in the monitoring process.
• Research and Analysis Technical Working Group will continue implementation of the
planned research agenda. It will undertake analysis of the data arising from national population and housing census. The group will also finalize the PPA exercise. Analysis of population and housing census and PPA will provide important input into the Poverty and Human Development Report (PHDR) and PRS Progress Report for 2002/03.
• Dissemination, Sensitization and Advocacy Technical Group will continue with the
dissemination of the user guide for the Poverty Monitoring System and ensure it reaches a wider audience particularly the poor. The group has also planned to further disseminate results of 2000/01 HBS widely, as well as producing a popular version for the Poverty and Human Development Report (2001/02). During 2002/03 the group will coordinate as an annual event, Poverty Policy Week, around September 2003. Radio programmes and feature articles in newspapers will also be prepared.

76
Short term challenges: • Getting monitoring output meaningfully fed into processes of policy revision and resource re-
allocation:
This is an ongoing challenge but in the short term two actions are necessary: Ø First action is to make it clear to users, especially policymakers and politicians, what they
can expect in terms of flow of monitoring output in the coming years, how best to access it and what will be the most useful and effective way to handle data.
Ø Second, action needs to be taken to link poverty information to policy formulation and implementation. In the short run this means building links between the poverty monitoring system and the ongoing PER and Budget/MTEF processes. The benefit from monitoring will depend on the quality of the link between poverty information and subsequent actions which includes the link between PRS targets and the budget.
• More Systematic participation by CSO
The value-added of a comprehensive system of poverty monitoring is its ability to embrace the information and data needs, as well as ideas on analysis and dissemination, of a broader stakeholder group. The involvement of CSOs in the PPA is significant but equally important is the mainstreaming of CSO participation throughout the system. The need to enhance the capacity of CSOs is thus emphasized.
Medium Term Challenges • Improving both the upward and downward flow of monitoring information at all Government
levels.
This is crucial for developing a culture of evidence-based policy making. But given the centralized nature of Government in Tanzania, and the difficulties experienced by the LGRP, this will be a major medium to long-term challenge. The emphasis has to be on getting the LGM&E system up and running, also it is likely to be slow, and the data needs in the meantime that require some kind of monitoring below national level.
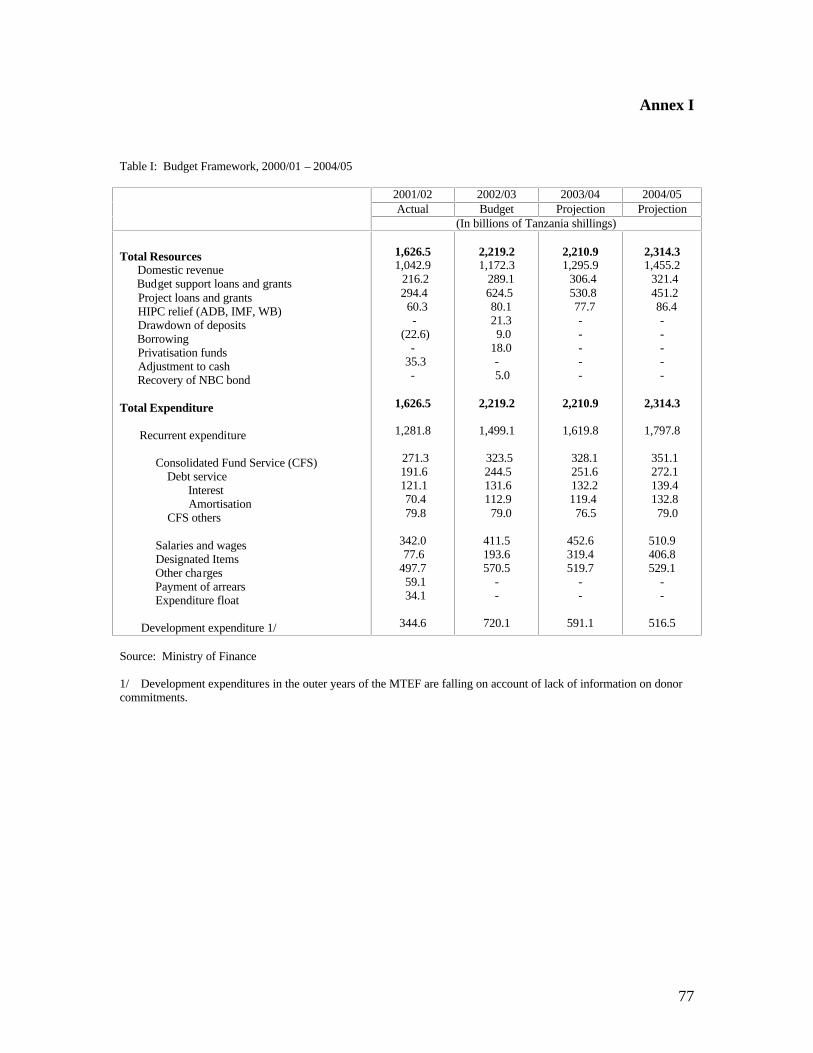
77
Annex I Table I: Budget Framework, 2000/01 – 2004/05
2001/02 2002/03 2003/04 2004/05 Actual Budget Projection Projection
(In billions of Tanzania shillings) Total Resources Domestic revenue Budget support loans and grants Project loans and grants HIPC relief (ADB, IMF, WB) Drawdown of deposits Borrowing Privatisation funds Adjustment to cash Recovery of NBC bond Total Expenditure Recurrent expenditure Consolidated Fund Service (CFS) Debt service Interest Amortisation CFS others Salaries and wages Designated Items Other charges Payment of arrears Expenditure float Development expenditure 1/
1,626.5 1,042.9 216.2 294.4 60.3
- (22.6)
- 35.3
-
1,626.5
1,281.8
271.3 191.6 121.1 70.4 79.8
342.0 77.6 497.7 59.1 34.1
344.6
2,219.2 1,172.3 289.1 624.5 80.1 21.3 9.0 18.0
- 5.0
2,219.2
1,499.1
323.5 244.5 131.6 112.9 79.0
411.5 193.6 570.5
- -
720.1
2,210.9 1,295.9 306.4 530.8 77.7
- - - - -
2,210.9
1,619.8
328.1 251.6 132.2 119.4 76.5
452.6 319.4 519.7
- -
591.1
2,314.3 1,455.2 321.4 451.2 86.4
- - - - -
2,314.3
1,797.8
351.1 272.1 139.4 132.8 79.0
510.9 406.8 529.1
- -
516.5 Source: Ministry of Finance 1/ Development expenditures in the outer years of the MTEF are falling on account of lack of information on donor commitments.

78
Annex II
Table 2: Budgetary Allocation for Priority Sectors, FY 2000/01 – 2002/03 (July – June)
2000/01 2001/02 2002/03 Actual Actual Budget
(In billions of Tanzania shillings) Education Recurrent Development Health Recurrent Development Water Recurrent Development Judiciary Recurrent Development Agriculture Recurrent Development Roads Recurrent Development HIV/AIDS Total Expenditures in Priority Sectors Total Expenditures as percent of GDP
254.9 189.2 65.7
100.7 70.3 30.4
18.3 8.1 10.1
9.2 8.8 0.4
19.1 10.3 8.7
92.5 60.7 31.7
-
494.6
6.4
344.9 282.1 62.8
142.1 90.9 51.2
32.5 15.5 17.0
18.8 14.8 4.0
31.9 17.2 14.7
179.6 65.7 113.9
7.3
757.1
8.8
414.8 400.0 14.8
172.3 128.6 43.7
58.5 16.9 41.6
23.8 18.9 4.9
62.6 34.2 28.4
208.4 73.6 134.8
15.6
956.1
10.1
Memorandum Item: GDP at market prices 7,727 8,613 9,498 Source: Ministry of Finance
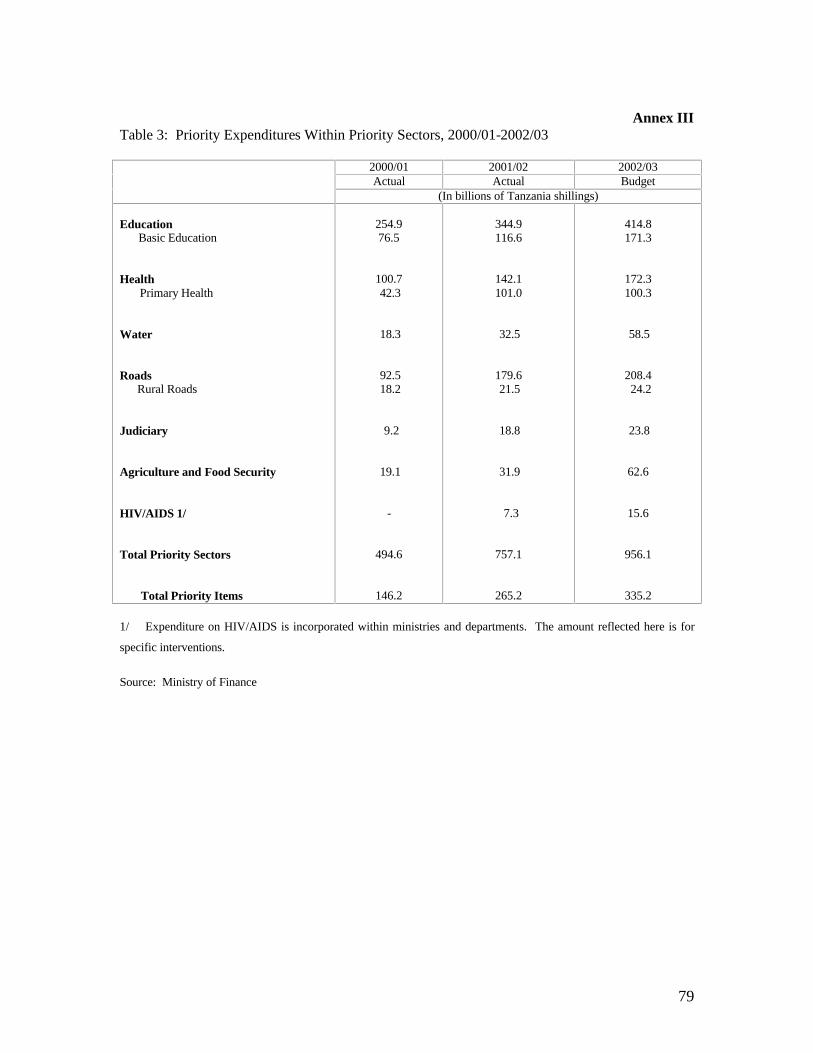
79
Annex III
Table 3: Priority Expenditures Within Priority Sectors, 2000/01-2002/03
2000/01 2001/02 2002/03 Actual Actual Budget
(In billions of Tanzania shillings) Education Basic Education Health Primary Health Water Roads Rural Roads Judiciary Agriculture and Food Security HIV/AIDS 1/ Total Priority Sectors Total Priority Items
254.9 76.5
100.7 42.3
18.3
92.5 18.2
9.2
19.1 -
494.6
146.2
344.9 116.6
142.1 101.0
32.5
179.6 21.5
18.8
31.9
7.3
757.1
265.2
414.8 171.3
172.3 100.3
58.5
208.4 24.2
23.8
62.6
15.6
956.1
335.2 1/ Expenditure on HIV/AIDS is incorporated within ministries and departments. The amount reflected here is for specific interventions. Source: Ministry of Finance

80
ANNEX IV
Table 4: Central Government Expenditure on Priority Sectors, 1998/99 - 2002/03
1998/99 1999/00 2000/01 2001/02 2002/03 Actual Actual Actual Actual Actual
(In billions of Tanzania shillings) Total expenditure in priority sectors Education Health Water Agriculture Roads Judiciary TACAIDS 1/ Recurrent expenditure in priority sectors Education Health Water Agriculture Roads Judiciary TACAIDS Development expenditure in priority sectors Education Health Water Agriculture Roads Judiciary TACAIDS
342.3
164.9 72.5 14.4 14.9 66.7 5.5 0.0
233.0
117.6 50.7 7.1 8.6 43.9 5.2 0.0
107.5
47.3 21.9 7.3 6.3 22.8 0.3 1.7
418.6
218.0 81.2 14.5 21.6 70.8 8.3 0.0
282.0
158.9 53.9 5.4 13.7 42.2 7.9 0.0
134.4
59.1 27.3 9.1 7.9 28.6 0.4 2.1
499.7
254.9 100.7 18.3 19.1 92.5 9.2 0.0
347.5
189.2 70.3 8.1 10.3 60.7 8.8 0.0
149.4
65.7 30.4 10.1 8.7 31.7 0.4 2.3
715.2
294.9 142.1 32.5 31.9 179.6 18.8 7.3
440.3
232.1 90.9 15.5 17.2 65.7 14.8 4.0
266.8
62.8 51.2 17.0 14.7 113.9 4.0 3.3
956.1
414.8 172.3 58.5 62.6 208.4 23.8 15.6
676.8
400.0 128.6 16.9 34.2 73.6 18.9 4.5
279.3
14.8 43.7 41.6 28.4 134.8 4.9 11.1
Source: Ministry of Finance 1/ Government agency formed in 2001 to coordinate AIDS related priority interventions

81
ANNEX 5: POLICY MATRIX FOR POVERTY REDUCTION STRATEGY, 2002/03 – 2004/05.
OBJECTIVE
PROGRESS TO-DATE
PLANNED ACTIONS
I. Reduce Income Poverty
Agriculture Create an enabling and conducive environment for improving profitability of the sector, and ensure food security
• Action programme completed • Rural Development Strategy developed in 2001 • Problems impeding agricultural growth are being
addressed. • Agriculture Sector Development Programme
framework and process document completed • Restrictions on internal trade on agriculture products
removed
• Formulate phase II of ASDP. • Undertake sample census of agriculture survey
2003/04. • Formulate Food Security Policy. • Intensify Private Agribusiness Sector Support
(PASS). • Develop a monitoring and evaluation system for
ASDP. • Review and propose options for a unified tax
collection system for agricultural exports consistent with the ongoing work on harmonization of local government taxes and levies.
• Review the role and funding arrangements of Crop Boards to limit their functions to regulatory activities.
• Assess the effectiveness of coordination mechanisms for ASDP implementation.
• Prepare a viable prioritized strategic plan for implementation of the Land Act and Village Land Act.
Roads Improve rural and district and cross border road network to enhance access to farm and agriculture markets
• Somanga-Masaninga including construction of Matandu bridge, Nangurukuru-Mbwemkulu, Mbwemkulu-Mingoyo, Dodoma-Manyoni and Manyoni-Singida road sections:
• 34% increase in budget allocation for FY 2002/03 to finance rehabilitation and maintenance of 4,500 km roads.
• Allocating 1.8 billion monthly for the north-western and southern regions linkage.
• Enhancing budgetary allocation to road rehabilitation and periodic maintenance and spot repairs.
• Mobilize communities in maintenance of footpaths, tracks and trails.
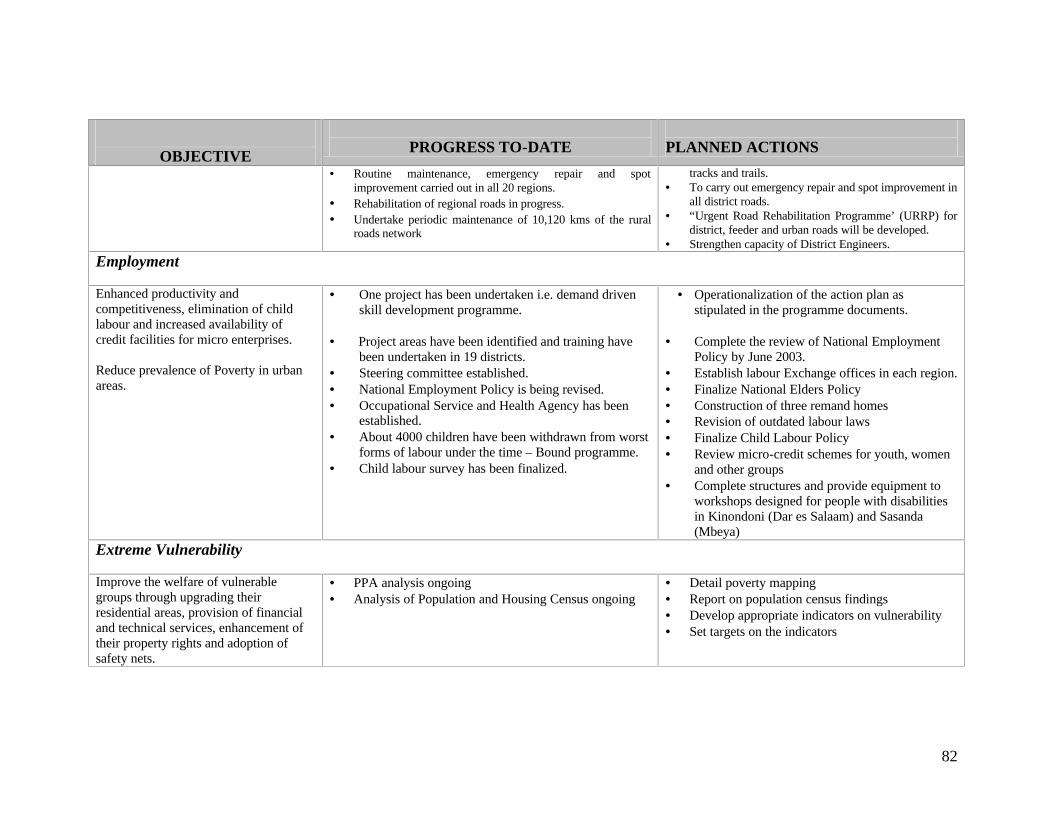
82
OBJECTIVE
PROGRESS TO-DATE
PLANNED ACTIONS
• Routine maintenance, emergency repair and spot improvement carried out in all 20 regions.
• Rehabilitation of regional roads in progress. • Undertake periodic maintenance of 10,120 kms of the rural
roads network
tracks and trails. • To carry out emergency repair and spot improvement in
all district roads. • “Urgent Road Rehabilitation Programme’ (URRP) for
district, feeder and urban roads will be developed. • Strengthen capacity of District Engineers.
Employment Enhanced productivity and competitiveness, elimination of child labour and increased availability of credit facilities for micro enterprises. Reduce prevalence of Poverty in urban areas.
• One project has been undertaken i.e. demand driven skill development programme.
• Project areas have been identified and training have
been undertaken in 19 districts. • Steering committee established. • National Employment Policy is being revised. • Occupational Service and Health Agency has been
established. • About 4000 children have been withdrawn from worst
forms of labour under the time – Bound programme. • Child labour survey has been finalized.
• Operationalization of the action plan as stipulated in the programme documents.
• Complete the review of National Employment
Policy by June 2003. • Establish labour Exchange offices in each region. • Finalize National Elders Policy • Construction of three remand homes • Revision of outdated labour laws • Finalize Child Labour Policy • Review micro-credit schemes for youth, women
and other groups • Complete structures and provide equipment to
workshops designed for people with disabilities in Kinondoni (Dar es Salaam) and Sasanda (Mbeya)
Extreme Vulnerability Improve the welfare of vulnerable groups through upgrading their residential areas, provision of financial and technical services, enhancement of their property rights and adoption of safety nets.
• PPA analysis ongoing • Analysis of Population and Housing Census ongoing
• Detail poverty mapping • Report on population census findings • Develop appropriate indicators on vulnerability • Set targets on the indicators

83
OBJECTIVE
PROGRESS TO-DATE
PLANNED ACTIONS
II. Improve Human Capabilities
Education Raise gross and net enrolment and enhance the quality of basic education
• Gross enrolment ratio is at 100.4% and net enrolment ratio at 85% in 2001/02. A total of 12,868 classrooms have been built.
• Development and capitation grant to the tune of Tshs. 73.036 billion were disbursed to the local authorities.
• 82 districts have been school mapped and 53 districts
micro-planned by June 2002.
• Construct 13,396 classrooms, 7,732 teachers houses and toilet blocks.
• Carry out school mapping in 38 districts and micro-planning in 68 districts.
• Strengthen the primary school inspectorate system.
• Develop a national strategy for Teachers Education and TEDP.
• Maintain the provision of US 10 per child per
annum. The pass rate in the primary schools leaving examination
has increased from 22 percent in 2000/01 to 28 percent in 2001/02 • Upgrade 50,000 grade “C/B” teachers to grade
“A” under a new upgrading programme. • Continue to strengthen community capacities in
managing primary schools. • Improve availability of textbooks and teaching
materials in primary schools. • Finalize the strategy for Non-Formal Education
(NFE). • Revive Adult Education. • Develop a national strategy for secondary
education and SEDP. Health Strengthen Immunization services, malaria control, National Programme, reduced maternal and child mortality rate and reduce prevalence of HIV/AIDS.
• The integrated management of child illness has been increased from 31 to 93 districts in 2001/2002.
• Number of children under 2 years immunized against measles and DPT increased from 74% to 79% in 2001/02.
• Increase level and improve allocation of budget resources for basic health care from the current level of USD 5.4 per capita to USD 9.0.
• Introduce IMCI programme in 46 councils.

84
OBJECTIVE
PROGRESS TO-DATE
PLANNED ACTIONS
• There is continuing increase in the utilization of MCH services which include reproductive health and family planning. The MCH services are accessed free of cost at the time of use.
• Proportion of birth assisted by trained personnel has increased from 50 percent to 80 percent in 2001/02
• The legal framework of restructuring MMC is in place, the MNH board and management has been established, parallel with capacity building in management.
• Intensify the HIV/AIDS awareness campaign, and • Implement PCDA for people living with HIV/AIDS. • Increase the percentage of children under 2 years
immunized against measles and DPT from 79% to 85% by 2003.
• Provide adequate and equitable maternal and child services,
• Promote nutritional education control of communicable diseases and advocate good feeding practices for children.
• Provide essential obstentric equipment to councils. • Strengthen and reorient secondary and tertiary services
delivery to support primary health care services. • Develop a plan for rehabilitation of all health facilities
at different levels. • Implement fully the malaria control programme.
• Drug Revolving Fund is introduced in all district hospitals. 37 districts introduced Community Health Fund and National Health Insurance introduced for all civil servants.
• Introduce CHF in 25 districts and review DRF and NHIF implementation.
• Strengthen monitoring system for the health sector. • Develop a programme for capacity at sub-national level.
Water Provide adequate, clean and safe water and sanitation – with targets to increase its coverage from 48.5 percent to 55 percent in 2004.
§ E.g. the new Chalinze water supply scheme is around 50 percent complete.
• 897 underground water areas explored and 540 boreholes drilled.
§ Rehabilitate and expand the existing water supply schemes in rural areas by 2006.
§ Increase underground water exploration to ease
construction of new water schemes especially in dry areas.
§ Ensure water boards are in place in all district
headquarters by 2006. Rehabilitation and expansion of urban water supply to increase service levels from 68 percent to 78 percent by 2004.
§ The study on pricing policy is on going. Rehabilitation and expansion of Sewerage System in Seven Municipalities is complete.
§ Restructure urban water supply pricing by the year 2004
§ Complete phase II of urban water supply by 2005.

85
OBJECTIVE
PROGRESS TO-DATE
PLANNED ACTIONS
Strengthen water resource environmental and pollution control network in order to reduce pollution levels from 20 percent to 10 percent by 2004.
§ Water samples were tested for standard amount of chemicals and for turbidity, advisory measures were taken. And industries were inspected to control industrial effluents.
§ The Rural Water Supply and Sanitation Project took off since April 2002 in three districts.
§ Increase activities for water resource environmental and pollution control.
§ Disseminate the policy and put in place Water Sector Development Strategy and Development Plan by June 2004.
§ Replicate intervention package to other nine districts during financial year 2002/2003.
§ Put in place basin offices in the remaining four basins by 2005. And rehabilitate the existing hydrometric networks and complete the network in all basins by 2005.
To improve Management of Water Resources (RBM) (New)
§ Five water basin offices in five Basins are in place. § 105 hydrometric stations were rehabilitated, 28 data
lodgers installed and one isotopic hydrometric station was built at Makutupora Sub-basin. • To build the capacity of Communities to initiate,
plan, implement, operate and maintain their own Water schemes.
HIV/AIDS Reduce HIV prevalence and promote behavior change across the board.
• TACAIDS was formally established by Act of Parliament, HIV/AIDS has been included in PER/MTEF process, HIV/AIDS activities has been mainstreamed in all sectors
• Awareness campaign conducted through media and public rallies.
• HIV/AIDS campaign has covered all districts • TACAIDS is now operational following completion of
structures and recruitment of key staff • Formation of a special DAC HIV/AIDS to work with
government to address HIV/AIDS issues
• TACAIDS Secretariat will be recruited before June 2003
• The National Multisectoral strategic framework for HIV/AIDS will be finalize before June 2003
• Advocacy and sensitization will continue in 2003
III. Improve Social well-being Local Government Strengthen the effectiveness of local government in the delivery of public services.
• In phase I reforming councils activities aiming at strengthening the effectiveness of LGAs in the provision of quality services continued to be implemented focusing on the following:
To implement the activities identified in the LGRP Medium term Plan (July 2002 to June 2005) the following activities will be implemented during the year 2002/2003.

86
OBJECTIVE
PROGRESS TO-DATE
PLANNED ACTIONS
(i) Good Governance concentrating on creating
awareness about the reforms and principles of democracy, transparency, accountability and the need to uphold the rule of law.
(ii) Financial decentralization underscoring the need for enhanced financial resources available to LGAs and improved management of those resources by councils.
(iii) Restructuring of the LGAs so that they can acquire organization structures which will enable improved delivery of basic services to the people.
• The LGRP Action Plan and Budget (July 1999 to
December 2004) was revised and a three year LGRP Medium Term Plan and Budget (July 2002 to June 2005) was developed and approved. The overall goal of LGRP now is focusing on the reduction of the proportion of Tanzanians living in poverty. The objective is to improve quality access and equitable delivery of public services particularly to the poor.
GOVERNANCE • Prepare and disseminate booklets and posters. • Conduct awareness, sensitization meetings and
workshops. • Develop and implement multi-media strategy for
publicizing LGRP. • Assist LGAs to prepare local anti-corruption
plans and monitor implementation with PCB. • Prepare guidelines on participatory planning and
budgeting for LGAs. RESTRUCTURING • Revise the restructuring manual in light of
experiences. • Assist LGAs to review their organizational
structures and finalize implementation plan for new strategies.
• Collect and compile the policies, guidelines, service and staffing standards to be used in LGAs restructuring.
FINANCE • Identify bottlenecks to fiscal decentralization and
propose strategies for clearing them. • Develop a formula-based method of allocating
grants and a performance measurement system. • Design, test and introduce planning and
reporting database to LGAs. • Facilitate and support implementation of Epicor
(Platinum) based IFMS in the pilot. • Facilitate development of Local Government
Procurement Regulations and Procurement Manual.
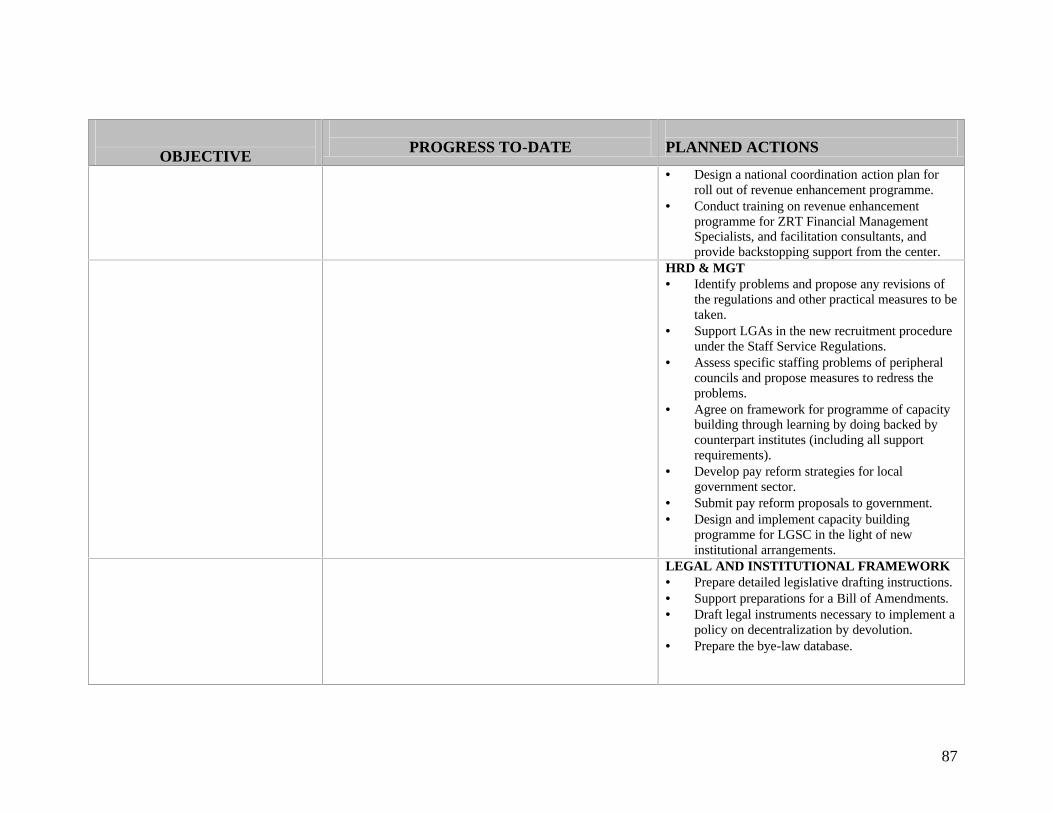
87
OBJECTIVE
PROGRESS TO-DATE
PLANNED ACTIONS • Design a national coordination action plan for
roll out of revenue enhancement programme. • Conduct training on revenue enhancement
programme for ZRT Financial Management Specialists, and facilitation consultants, and provide backstopping support from the center.
HRD & MGT • Identify problems and propose any revisions of
the regulations and other practical measures to be taken.
• Support LGAs in the new recruitment procedure under the Staff Service Regulations.
• Assess specific staffing problems of peripheral councils and propose measures to redress the problems.
• Agree on framework for programme of capacity building through learning by doing backed by counterpart institutes (including all support requirements).
• Develop pay reform strategies for local government sector.
• Submit pay reform proposals to government. • Design and implement capacity building
programme for LGSC in the light of new institutional arrangements.
LEGAL AND INSTITUTIONAL FRAMEWORK • Prepare detailed legislative drafting instructions. • Support preparations for a Bill of Amendments. • Draft legal instruments necessary to implement a
policy on decentralization by devolution. • Prepare the bye-law database.
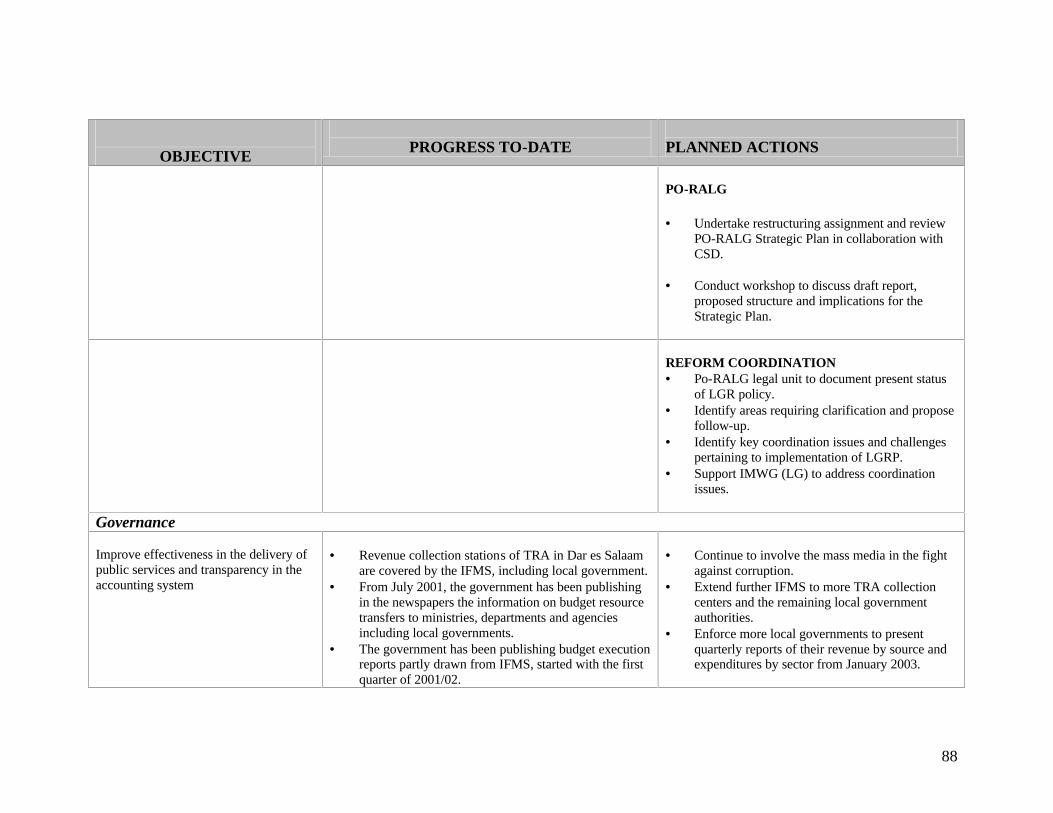
88
OBJECTIVE
PROGRESS TO-DATE
PLANNED ACTIONS
PO-RALG • Undertake restructuring assignment and review
PO-RALG Strategic Plan in collaboration with CSD.
• Conduct workshop to discuss draft report,
proposed structure and implications for the Strategic Plan.
REFORM COORDINATION • Po-RALG legal unit to document present status
of LGR policy. • Identify areas requiring clarification and propose
follow-up. • Identify key coordination issues and challenges
pertaining to implementation of LGRP. • Support IMWG (LG) to address coordination
issues.
Governance Improve effectiveness in the delivery of public services and transparency in the accounting system
• Revenue collection stations of TRA in Dar es Salaam
are covered by the IFMS, including local government. • From July 2001, the government has been publishing
in the newspapers the information on budget resource transfers to ministries, departments and agencies including local governments.
• The government has been publishing budget execution reports partly drawn from IFMS, started with the first quarter of 2001/02.
• Continue to involve the mass media in the fight
against corruption. • Extend further IFMS to more TRA collection
centers and the remaining local government authorities.
• Enforce more local governments to present quarterly reports of their revenue by source and expenditures by sector from January 2003.

89
OBJECTIVE
PROGRESS TO-DATE
PLANNED ACTIONS
• Each sub treasury is on IFMS on stand alone mode. • Few local governments have been able to present
quarterly reports of their revenue by source and expenditure by sector in fiscal year 2001/02.
• The Office of the Controller and auditor General
adopted a scheme of service. • Ethics secretariat has been authorized to receive
anonymous complaints. • Good governance coordination unit was established in
the Office of the Chief Secretary, State House. • MDAs have developed anti-corruption action plans
that are incorporated into the broader strategic plans been put in place as part of Public Service Reform Programme.
• A Country Financial Accountability Assessment
(CFAA) was carried out for 2001/02
• Process of report against the national anti-corruption strategy and action plan will be strengthen.
• Anti-corruption strategy for LGAs, private
sector, CSOs and media will be developed. • Capacity of CSOs, NGOs and the media will be
strengthen to enable them to participate in war against corruption.
• Extend IFMS further to more local government
authorities. • To bring in line the fiscal year of the local
government with that of the central government and to further increase transparency and political debate on the budget proposals.
Legal and Judicial System Improve the efficiency of clearing cases through the courts
• 22 Resident Magistrates, 26 Primary Court Magistrates and 16 State Attorneys were recruited in fiscal year 2001/02.
• The budget for the Judiciary raised from Tshs. 8 bilion in
2001/02 to Tshs.12.4 billion in 2002/03.
• Strengthen the capacity of the Judiciary through recruiting further new 125 Magistrates, 70 State Attorneys and 135 Primary Court Magistrates.
• Increase resource allocation to Legal and Judicial
system. • Extend Commercial Court Sub-Registries in Arusha
and Mwanza.

90
OBJECTIVE
PROGRESS TO-DATE
PLANNED ACTIONS
• Preparation of a Development Programme for rehabilitation of facilities of the Courts and other houses.
• The pilot scheme in Arusha Zone under the Quick Start Project became operational.
• Under the preparation of the Proposed ATIP, recruitment
process for the Consultants to design an infrastructure development programme began in April 2002.
• A level of 60% of actual Court of Appeal Sessions was
achieved by 30th June 2002. • A level of 63% of the decided cases was achieved by 30th June
2002. • Construction of 2 Juvenille courts in Mtwara and Mbeya
regions is in progress
• Ensure a fully documented pilot scheme under the quick start project is in order so as to provide lessons learnt from national community based programme to support improvement of judicial services at the lower courts.
• Develop appropriate management and coordination arrangements in place for implementation of the reform programme.
• Ensure priority areas for a fully costed civil works programme is identified.
• Ensure that the Legal Sector Reform Programme is appraised and development partners’ funding is identified.
• Ensure effective functioning of the Independent Judicial Ethic Committees and strengthen supervision.
• Development of the infrastructure development programme under the proposed ATIP.
• Raise the actual Court of Appeal sessions to 80% by end of 2003.
• Speed up court decisions and raising the ratio of decided cases to filed cases from 63% to 70% by 2003.
• Fnalize construction of 2 Juvenille Courts in Mtwara and Mbeya.
• Enhance capacity of Law Reform Commission, IJA (Lushoto) and the Legal Sector in general.
• Review and update the legal framework including progress indicators.
IV. Strengthen Prospects for Growth and Development Macroeconomic Stability • Attain GDP growth rate of 6 percent • Maintain low inflation rate in line
with the average rate of inflation for trading partners
• Sustainable current account balance
• Reel GDP growth increase to 5.6 percent by 2001 (compared to 4.9 in 2000) and is projected to rise to 5.9 percent in 2002
• Inflation rate declined to 4.5 percent by June 2002 compared to 5.3 in the same period in 2001
• By end December 2001, the gross foreign reserves had risen to six months of imports cover
• Sustain macroeconomic stability and enhance structural reforms
• Maintain gross foreign reserves above four months of imports cover

91
OBJECTIVE
PROGRESS TO-DATE
PLANNED ACTIONS
Tax reform Attain a sound taxation system Further reform measure taken for 2002/03 budget
• Re-introduction of VAT refund system for VAT paid by farmers on transportation, processing and packaging material for export crops.
• Promotion of export processing zones • Extension of duty drawback application period from
three months to six months. See Box 1: Highlights for the 2002/03 budget measures
Further reform measures in time for 2003/04 budget • The amendment made in the 2002 Finance Bill
relating to capital expensing will be redrafted to clarify reference to TIC certificate holders.
• The government is reviewing the exports processing zones legislation with a view to focusing it to taking advantage of export markets under the United States, AGOA and the European Union’s Everything – But – Arms facility
• The Government intends to review tax laws and exemptions.
Business Environment Provision of enabling environment for private sector investment
• The Government has successful floated at the Dar es Salaam Stock Exchange 5-year Treasury bond in February 2002, 7 year fixed rate Treasury bond in August 2002.
• Tanzania Investment Centre (TIC) restructured and transformed into a modern computerized investment facilitation center.
• Enhanced government/private sector dialogue on development issues through the establishment of the Tanzania National Business Council (TNBC).
• Float 10-year Treasury bonds by end October 2002.
• Develop private sector Development Policy by end December 2002.
• The Business Environment Strengthening in Tanzania (BEST) programme to be launched by March 2003.
• Privatization of TRC and ATC are as advance stages. The government has set aside Tshs 13 billion in the 2002/03 Budget to cover retrenchment costs of ATC, TRC and DAWASA
• The process of unbundling TANESCO into autonomous commercial entities before privatization is on going. A private management company has begun to improve the finances of TANESCO.
• Complete privatization of TRC, ATC and DAWASA during financial year 2002/03

92
OBJECTIVE
PROGRESS TO-DATE
PLANNED ACTIONS
Poverty Monitoring and Evaluation To improve information on poverty analysis and inform policy making process
• Processing and analysis of HBS 2000/01 and LFS was completed in June 2002.
• The work plan and costing of the poverty Monitoring Master Plan activities was finalized by October 2002
• Poverty and Human Development Report (PHDR, 2002) was produced and discussed during Poverty Week October 2002
• Finalize the analysis of the National Population and Housing Census – 2002/03.
• Undertake Agricultural Survey in 2003. • Strengthening Admin. Data Working Group. • Finalize PPA exercise undertaken wide
dissemination of the PHDR and results of the HBS 2000/01.
• Enhance capacity for poverty analysis. V. Other Issues Gender Enhance capacity for gender mainstreaming in plans, strategies projects and programmes
• A needs assessment on gender focal points in all ministries and public institutions has been done.
• Preparation of a Strategic Framework for Community Based Protection of Women and Children against HIV/AIDS/STIS.
• Sector development strategies and programmes were engendered
• Inheritance and Marriage Act 1971 and Laws relating to children were reviewed
• Draft National Strategy for Gender Development and its framework for implementation were developed.
• Further Institutionalize gender through establishment and strengthening of Focal points.
• Develop gender monitoring and evaluation tools and techniques.
• Continue review of gender discriminatory laws. • Develop guidelines to integrate gender in various
development programmes and in MTEF/PER. • Enhance capacity building of different actors
through training on gender and development. • Mainstream gender in the PRS and its
monitoring system. Environment Integration of environment into the PRS process to support sustained economic growth and development.
• Potential partners and sources of environmental module in TSED were identified.
• Comprehensive programme on integration of environmental concerns into PRS was formulated.
• The DoE and NEMC developed an initial proposal for the integration of environment as a crosscutting issue into the PER/MTEF process
• Capacity building of key government institutions to foster the integration of environment into the PRS process, and strengthen the institutional framework for environmental management.
• Strengthened poverty-monitoring system by the integration of poverty-environment data, including the development of indicators.
• Improved knowledge and awareness on poverty-environment linkages.

93