power aware storage cache management - ucsd
TRANSCRIPT

Power Aware Storage Cache Management
Qingbo Zhu and Yuanyuan Zhou
Department of Computer Science
University of Illinois at Urbana-Champaign
Urbana, IL 61801
{qzhu1,yyzhou}@uiuc.edu
Abstract
Reducing energy consumption is an important issue for data centers. Among the various components
of a data center, storage is one of the biggest energy consumers. Previous studies have shown that the
average idle period for a server disk in a data center is very small compared to the time taken to spin
down and spin up. This significantly limits the effectiveness of disk power management schemes.
This article proposes several power-aware storage cache management algorithms that provide more
opportunities for the underlying disk power management schemes to save energy. More specifically,
we present an off-line energy-optimal cache replacement algorithm using dynamic programming which
minimizes the disk energy consumption. We also present an off-line power-aware greedy algorithm that
is more energy-efficient than Belady’s off-line algorithm (which minimizes cache misses only). We also
propose two online power-aware algorithms, PA-LRU and PB-LRU. Simulation results with both real
system and synthetic workloads show that, compared to LRU, our online algorithms can save up to 22%
more disk energy and provide up to 64% better average response time. We have also investigated the
effects of four storage cache write policies on disk energy consumption.
Keywords: Power Management, Disk Storage, Storage Cache Replacement and Write Policies

1 Introduction
Trends in Internet infrastructure are driving a shift toward service-based computing. Data centers are
playing a key role in this new architecture since they are commonly used to provide a wide variety of
services including web hosting, application services, outsourced storage and other network services.
Storage is one of the biggest components in data centers. Storage demand is also growing by 60%
annually [36]. By 2008, data centers will manage ten times as much data as they do today.
The steady growth of data centers introduces a significant problem: energy consumption. Data centers
typically have very high power requirements. According to EUN (Energy User News) [35], today’s data
centers have power requirements that range from 75 W/ft2 for small- to medium-sized enterprises to 150-
200 W/ft2 for typical service providers. In the future, this is predicted to increase to 200-300 W/ft2 [35].
These increasing power requirements are driving energy costs up as much as 25% annually and making
it a growing consideration in the TCO (total cost of ownership) for a data center [36]. High energy
consumption also prevents easy expansion and has negative environmental implications.
Among various components of a data center, storage is one of the biggest consumers of energy.
A recent industry report [2] shows that storage devices account for almost 27% of the total energy
consumed by a data center. This problem is exacerbated by the availability of faster disks with higher
power needs as well as the increasing shift from tape backups to disk backups for better performance.
Although disk power management for mobile devices has been well studied in the past, only few
recent studies [8, 17, 16, 6, 40, 50, 51] have looked at power management for the multiple-disk storage
systems of data centers. The large volume of activity on these servers keeps the average idle period
between requests too small to justify the costs of spinning the disks up and down. Thus the potential
for saving energy is very limited. To address this problem, multiple-speed disks have been proposed by
Gurumurthi et al. [16] and Carrera et. al [6]. By introducing intermediate power modes, the spin-up and
spin-down costs are reduced and more energy can be saved in spite of the small idle periods [16].
Not all accesses to a storage system go to disks. A typical architecture for a modern storage system
is shown in Figure 1. Many modern storage systems use a large storage cache to reduce the number
of disk accesses and improve performance. For example, the EMC Symmetrix storage system with a
capacity of 10-50 TBytes can be configured with up-to 128 GB of non-volatile memory as the storage
cache [10]. The IBM ESS system can also have up-to 64 GB of storage cache [1]. Different from those

small (usually 1-4 MB) buffers on a SCSI disk, which are mainly used for read-ahead purposes, these
large caches are used to cache blocks for future accesses. Therefore, the cache replacement algorithm
plays a very important role in a storage system [49, 44, 34, 7].
ProcessorsL1/L2 Caches
Memory(Volatile or Non-volatile)
Controller Controller…
Database Server(IBM DB2, MS-SQL, Oracle,...)
File Server(NFS, CIFS,…)
…
Storage A
rea Netw
ork
Storage System
…
Figure 1: Modern storage architecture
The storage cache management policy influences the
sequence of requests that access disks. Different cache
management policies may generate different disk request
sequences, which directly affects disk energy consump-
tion. In other words, by changing the cache management
scheme, it is possible to change the average idle time be-
tween disk requests, thus providing more opportunities
for the disk power management scheme to save energy. For example, if the cache replacement algorithm
can selectively keep some blocks from a particular disk in the cache (without significantly increasing the
number of misses to other disks), that disk can stay in a low power mode longer. Since storage caches
are critical to storage system performance, our study assumes that storage caches are active all the time.
Besides disk energy consumption, I/O response time is another concern. If underlying disks use
power management schemes, some requests can be significantly delayed because it takes a long time
(a few seconds) for a disk to spin up from a low power mode to the active mode. Consequently, if a
cache replacement algorithm is only designed to minimize the number of cache misses and ignores the
underlying disk power management schemes, it can result in very high I/O response time. Therefore, it
is important to design cache management schemes that are power-aware (aware of the underlying disk
energy consumption and power management schemes).
This article studies the effects of storage cache management schemes on disk energy consumption
and proposes power-aware cache management schemes. We look into both cache management for read
accesses and for write accesses. Specifically:
• For read accesses, we first present an energy-optimal offline cache replacement algorithm using
dynamic programming, which minimizes the underlying disk energy consumption.
• Since the energy-optimal algorithm is too complicated to evaluate, we present a simple off-line
power-aware greedy algorithm. Simulations show that the greedy algorithm is more energy-
efficient than Belady’s off-line algorithm while still providing acceptable average response time.

• Based on the insights from our analysis of offline algorithms, we propose two new on-line power-
aware replacement algorithms, PA-LRU and PB-LRU, that are based on the same observation but
use very different approaches. Our simulation results with both real system and synthetic workloads
show that these two power aware algorithms can reduce disk energy consumption by up to 22%
compared to LRU and also provide up to 64% better average response time.
• For write accesses, we study the effects of storage cache write policies on disk energy consump-
tion. Our results show that write-back can save up-to 20% more energy compared to write-through.
Write-back with eager updates further reduces disk energy consumption of write-back up-to 45%.
We also propose a policy called write-through with deferred updates that reduce energy consump-
tion up-to 55% while still providing persistency semantics comparable to write-through.
This article is organized as follows. The next section briefly describes the background. Section 3 dis-
cusses the off-line energy-optimal algorithm and the off-line greedy power-aware algorithm. Section 4
presents two on-line power-aware algorithms. Section 5 describes our evaluation methodology followed
by simulation results for power-aware replacement algorithms in Section 6. Section 7 discusses the ef-
fects of four storage cache write policies on energy consumption. Several related issues are discussed in
Section 8. Section 9 summarizes related work. Finally, Section 10 concludes this article.
2 Background
2.1 Disk Power Model
To reduce energy consumption, modern disks use multiple power modes that include active, idle, standby
and other intermediate modes. In active mode, the platters are spinning and the head is seeking or the
head is actively reading or writing a sector. In idle mode, a disk is spinning at its full speed but no
disk activity is taking place. Therefore, staying in the idle mode when there is no disk request provides
the best possible access time since the disk can immediately service requests, but it consumes the most
energy. To simplify discussion, we do not differentiate active mode and idle mode since in both modes
the disk is operating at full power. In the standby mode, the disk consumes much less energy, but in
order to service a request, the disk has to incur significant energy and time to spin up to active mode.
Recently, Gurumuthi et al. have proposed multi-speed disks to increase the amount of energy saved

with data center workloads [16]. Lower rotational speed modes consume less energy compared to higher
speed modes, and the energy and time costs to shift between different rotational speeds are relatively
small compared to the costs for shifting from standby to active. Such multi-speed disks are still only a
design on paper and there are no real products yet. We however simulate and use multi-speed disks in
our experiments because of their potential to save more energy. A multi-speed disk can be designed to
either serve requests at all rotational speeds or serve requests only after a transition to the highest speed.
We choose the second option since it is a simple extension to the traditional 2-mode power model.
2.2 Disk Power Management
The goal of disk power management is to try and save energy by switching disks to lower power modes
whenever possible without adversely affecting performance [8, 6, 17, 16]. If the entire disk request se-
quence is known in advance, the power management scheme can make perfect decisions. This “Oracle”
based disk power management scheme (Oracle DPM) [31] gives us an upper bound on the energy that
can be saved for a given request sequence, assuming requests will not be pre-fetched or delayed. The
break-even time of a disk is defined as the minimum length of idle period which would justify the energy
cost of spinning the disk down and up [6]. At the end of every request the Oracle DPM looks at the time
till the next request, t. If t is greater than the break even time, then the disk is spun down and later spun
up just in time for the next request. If t is lesser than the break even time, the Oracle DPM decides that
it is better to keep the disk in idle mode.
t1 t4 t3 t2
E n
e r g
y C
o n
s u
m p
t i o
n
Interval Length
Mode 0 Mode 1 Mode 2 Mode 3
Mode 4
t0
Figure 2: Energy consumption for each
mode in a 5-mode disk power model and the
lower envelope LE(t) function
This scheme can easily be extended to disk models
with multiple power modes. Let us assume that Pi, (0 ≤
i ≤ m) is the power consumed in mode i and that Pi is
greater than Pj for all i < j. Once an idle interval starts,
Oracle DPM has to switch the disk to one of the m modes
that minimizes energy consumption. The disk must also
be back in mode 0 when the next request arrives.
To get the minimum energy consumption, we plot
lines Ei(t) = Pi ∗ (t − Ti) + Ci as in Figure 2 for each
power mode i, where Pi is the power dissipation in mode
i, and Ti and Ci are the time and energy required to spin-down and spin-up from mode i to 0 (T0 and

C0 is 0). Ei(t) is the energy consumed if the disk spends the entire interval of length t in mode i. Let
us call the lower envelope of all of these lines LE(t) = mini{Pi ∗ (t − Ti) + Ci}. This gives us the
minimum energy consumption possible for an interval of length T . If the next request is time T away
from the current request, Oracle DPM can use LE(t) to determine which power mode to switch the disk
to: if the disk is switched to the power mode j where LE(T ) = Ej(T ), the energy consumption during
this interval is minimized.
Practical disk power management (Practical DPM) schemes use thresholds to determine when to spin
down disks. In such schemes, after the disk remains idle at a power mode for a certain threshold time, it is
switched into the next lower power mode. Irani et al. have shown if the threshold values are determined
by the intersection points of the lines in Figure 2, the power management scheme is 2-competitive to the
Oracle scheme in terms of energy consumption [23]. This scheme transitions the disk from mode i to
mode i + 1 after time ti+1, where ti+1 is the time corresponding to the intersection point of lines Ei(t)
and Ei+1(t) as shown in Figure 2. We use thresholds obtained by this method in our study.
3 Power-Aware Off-line Caching Algorithms
Off-line caching algorithms have knowledge about the future. Such algorithms are usually studied be-
cause they provide upper and lower bounds for all on-line algorithms. For example, Belady’s off-line
algorithm [4, 33], which replaces the block with the longest future reference distance, is used to derive a
lower bound on the cache miss rate. Since the study of off-line algorithms is important to gain insights
into the problem, we first investigate off-line algorithms for power aware cache management. We will
describe two new on-line algorithms in Section 4 and discuss the effects of write policies in Section 7.
3.1 Energy-Optimal Problem
The goal of a power-aware cache replacement algorithm is to take a given request sequence as input and
generate a miss sequence for which the disks consume the least energy. If we use S to denote an I/O
request sequence, a replacement algorithm A is a function that maps S and a cache with k blocks into a
miss request sequence S ′, i.e. A : (S, k) → S ′ or A(S, k) = S ′. Given a disk power management scheme
P and a disk request sequence X , let P (X) be the total energy consumed by the disks. Therefore, we
have the following definition of an energy-optimal replacement algorithm:

Remark: Given an I/O request sequence S, a cache replacement algorithm A, a cache with k blocks,
and a disk power management scheme P , the total disk energy consumption is P (A(S, k)).
Definition: A storage cache replacement algorithm A is energy-optimal iff for any other algorithm B,
P (A(S, k)) ≤ P (B(S, k)) for any I/O request sequence S and any storage cache size k.
The number of misses resulting from a storage cache replacement algorithm obviously affects disk
energy consumption. One would expect that if there are few cache misses, the disks would consume little
energy. However, the energy consumption is also affected by the arrival patterns of the cache misses.
If misses are clustered together leaving long idle periods, it would allow disks to stay in the low power
mode for longer periods of time. On the other hand, if the misses arrive uniformly spaced, most idle
periods may be too small for a disk to save energy by going to the low power mode, or the disk may spin
up and down frequently, wasting a lot of energy in transitions. Furthermore, when there are multiple
disks, it is better if misses are directed to a cluster of disks rather than uniformly distributed over all the
disks. This allows the other disks to be in standby mode more often and thus save energy.
There are two reasons why Belady’s algorithm is not optimal for disk energy consumption. First, it
only minimizes the number of misses and pays no attention to arrival patterns of cache misses or how
they are clustered. In other words, it ignores all information about time. Below we give an example of
this case. Second, it does not consider the number and characteristics of disks in a multiple disk scenario.
Figure 3 gives an example to show why Belady’s cache replacement algorithm is not energy-optimal.
In this example, the storage cache has only four entries and the power model is the simple 2-mode model.
For simplicity, we assume that the disk can spin up and spin down instantaneously. We also assume that
disk spins down after 10 units of idle time. This disk power management scheme is a threshold-based
scheme (described in Section 2.2). The area of the shaded region in the figure represents the energy
consumed. In this example, using Belady’s algorithm results in more disk energy consumption than the
alternative algorithm, even though the alternative algorithm has 2 more misses than Belady’s algorithm.
3.2 Energy-Optimal Algorithm
In this subsection, we present an energy-optimal cache replacement algorithm using dynamic program-
ming. For simplicity, we will consider only two power modes and a single disk with b blocks. Let the
sequence S of disk references be a0, a1, ...an−1 where n is the input size. Let k be the number of blocks
in the cache. When a block is read from the disk, it is to be stored in the cache. If the cache is full, a

Time Req Belady Alternativecache Hit? cache Hit?
0 A [A,-,-,-] Miss [A,-,-,-] Miss1 B [A,B,-,-] Miss [A,B,-,-] Miss2 C [A,B,C,-] Miss [A,B,C,-] Miss3 D [A,B,C,D] Miss [A,B,C,D] Miss4 E [E,B,C,D] Miss [A,E,C,D] Miss5 B [E,B,C,D] Hit [A,B,C,D] Miss6 E [E,B,C,D] Hit [A,E,C,D] Miss7 C [E,B,C,D] Hit [A,E,C,D] Hit8 D [E,B,C,D] Hit [A,E,C,D] Hit...16 A [A,B,C,D] Miss [A,E,C,D] Hit
DiskPowerState
DiskPowerState
204 620 18161412108 22 24 26 28 30
204 620 18161412108 22 24 26 28 30
204 620 18161412108 22 24 26 28 30Time
Time
Time
ADCEBEDCBAREQUEST
SEQUENCE
ALTERNATIVE
BELADY
Figure 3: An example showing that Belady’s algorithm is not energy-optimal.
cache block is replaced. The disk spends 1 unit of energy per reference when it is switched on and does
not consume energy in standby mode. For simplicity, we also assume that the disk is back to standby
after m unit of time and I/O requests arrive uniformly at the rate of one per time unit. For other arrival
distributions, the optimal algorithm can be modified slightly by inserting some fake requests that will al-
ways hit in the cache (e.g. repeat the last I/O request) at each idle time unit. Due to space constraints, we
do not go into the details of this extension. The goal of an energy-optimal cache replacement algorithm
is to determine the sequence of cache replacement decisions that minimizes disk energy consumption.
We can construct a DAG (directed acyclic graph) to demonstrate a cache replacement algorithm. The
state of the cache can be represented by the tuple (C, t, i) which means that the cache contains the blocks
in set C after the first i + 1 references a0, a1, ...ai and the last t consecutive references were cache hits.
If the next reference ai+1 is found in the cache (ai+1 ∈ C), the next state is (C, t+1, i+1). If ai+1 6∈ C,
the next state could be one of several possible states (C ′, 0, i+1), where C ′ is one of k possible sets that
result from replacing one block in C by ai+1. Since the disk is accessed due to a cache miss, t goes to 0.

A(C, t, i) =
maxt′,C′ (A(C′, t′, i− 1)|
C ∈ repl(C′, ai) ∧ ai 6∈ C′ if ai ∈ C ∧ t = 0
A(C, t− 1, i− 1) + 1 if ai ∈ C ∧ t 6= 0 ∧ t > m
A(C, t− 1, i− 1) if ai ∈ C ∧ t 6= 0 ∧ t ≤ m
∞ if ai 6∈ C
(1)
1: for i = 0 to n− 1 do
2: for t = 0 to i do
3: for all C such that C is a set of b distinct disk blocks
do
4: if ai ∈ C ∧ t = 0 then
5: A(C, t, i) ← maxt′,C′ (A(C′ , t′, i − 1)|C ∈
repl(C′, ai) ∧ ai 6∈ C′)
6: else if ai ∈ C ∧ t 6= 0 ∧ t > m then
7: A(C, t, i)← A(C, t− 1, i− 1) + 1
8: else if ai ∈ C ∧ t 6= 0 ∧ t ≤ m then
9: A(C, t, i)← A(C, t− 1, i− 1)
10: else
11: A(C, t, i)←∞
12: end if
13: end for
14: end for
15: Maximum Standby Time← maxC,t(A(C, t, n− 1))
16: end for
In this model, minimal energy consumption
corresponds to the maximum time that the disk
can spend in the standby mode. We define
A(C, t, i) as the maximum time that the disk
spends in standby mode until some appropriate
sequence of cache replacements result in state
(C, t, i) being reached. A(C, t, i) can be obtained
in a recursive manner as Equation (1). repl(C, ai)
is the set of possible resulting caches after replac-
ing some block in C with ai. The equation can be
explained as follows. If t 6= 0, then from the tran-
sition diagram it is clear that state (C, t, i) can be
reached only from (C, t−1, i−1) where ai ∈ C,
hence the second and third cases. The second case adds 1 since if the disk is not accessed for t > m
references, the disk goes to standby mode. The fourth case states that (C, t, i) can never occur if ai 6∈ C
since every page reference has to be cached. However (C, 0, i) can be reached from any of the states
(C ′, t′, i−1) such that ai 6∈ C ′ and C can be obtained by replacing one block in C ′ with ai. The first case
maximizes over those possibilities. By computing A(C, t, i) in the lexical ordering of the pair (i, t) such
that t ≤ i, we can ultimately arrive at maxC,t(A(C, t, n− 1)) which is the maximum time for which the
disk can stay in standby mode over the entire input sequence. The algorithm is shown above.
Now we analyze the algorithm’s worst-case time complexity. Let us assume that A(C ′, t′, i′) values
are known for all C ′, t′ and i′ < i. If t 6= 0, then by the second and third cases in Equation 1, we
need O(1) time to find A(C, t, i). If t = 0, then we will have to maximize over all possible cache
configurations C ′ such that C ∈ repl(C ′, ai) and t′ ≤ i − 1. The number of different C ′ values is b, the
number of possible different blocks in the cache that ai can replace. The number of different t′ values
is i. Thus the total number of choices to be considered when computing A(C, 0, i) is i × b. t can vary

from 0 to i. Thus time taken to compute A(C, t, i) for all possible t ≤ i is i × b + i. This has to be
done for bk possible cache configurations. When summed over all i < n, we get the time complexity as
Σibki × (b + 1) which is O(bk+1n2).
The above algorithm can be extended to work with multiple disks with multiple power modes as
well. After representing the state as (C, t1, t2, ..., tr, i), a recursive formula can be written for A(), which
would be the maximum time that is spent in standby mode by putting all the disks together. We do not
go into the details due to space constraints.
3.3 Off-line Power-Aware Greedy Algorithm
Since the energy-optimal algorithm is too complex to implement and evaluate, we propose a heuristic
off-line power-aware greedy (OPG) algorithm that consumes less energy than Belady’s algorithm for
representative workloads. The main goal of the OPG algorithm is to minimize energy consumption by
taking advantage of information about future bound-to-happen misses based on cache content at some
point in time. We will call the bound-to-happen misses deterministic misses because they will happen
no matter what the replacement algorithm does later on.
If we know that there is a deterministic miss at a future time t, the disk from which this missed block
will be accessed has to be active at t to service this request. For convenience of description, for any
access a, we call the closest deterministic miss to the same disk but occurring before a as a’s leader.
Similarly, we call the closest deterministic miss to the same disk as a but occurring after a as a’s follower.
If the disk power management uses the Oracle scheme, the energy consumption for an idle period of
length t is LE(t) = min{Ei(t)} as described in Section 2.2 (see Figure 2). If the disks use the Practical
DPM, the disk energy consumption OL(t) during an idle period of length t can be calculated as follows:∑l−1
i=0(Pi ∗ (ti+1 − ti)) + Pl ∗ δ + Cl, where the disk goes to power mode i at time ti, tl(< t) is the cross
point closest to t and δ is the distance between t and tl, i.e. t = tl + δ, 0 ≤ δ < tl+1 − tl (see Figure 2).
The cache replacement algorithm uses energy penalties to choose from all the resident blocks
B1, · · · , Bi, · · · , Bk when it needs to evict a block, where k is the number of cache blocks. For any
i, let bi represent the next access to Bi. Suppose bi is, respectively, Li and Fi time apart from its leader
and its follower. If the algorithm evicts Bi, it will cause a miss for bi, whose energy penalty is as follows:
LE(Li) + LE(Fi) − LE(Li + Fi) if Oracle DPM
OL(Li) + OL(Fi) − OL(Li + Fi) if Practical DPM

Intuitively, with the Oracle DPM, the energy cost for the idle period between the leader and follower
is LE(Li + Fi) if bi is not a miss (therefore, there is no misses to this disk between leader and follower
based on the definitions of leader and follower). If bi is a miss, the original idle period is cut into two
chunks, whose aggregate energy cost is LE(Li) + LE(Fi). Thus, the energy penalty for evicting block
Bi is the difference between the two energy costs LE(Li)+LE(Fi)−LE(Li +Fi). The energy penalty
with the Practical DPM can be calculated in a similar way, replacing LE() by OL() in the formula.
Once the algorithm calculates the energy penalty for evicting every resident block, it evicts the block
with the minimum energy penalty. If multiple blocks have the same energy penalty, it evicts the one with
the largest forward distance, i.e., whose next access is the furthest in the future.
Initially, the set of deterministic misses, S, only includes all the cold misses. After each replacement,
the algorithm updates the set S. Suppose the currently accessed (missed) block is B1 and the evicted
block is B2. The algorithm deletes B1 from the set S and adds the first future reference to B2 into S.
Then the algorithm moves on to the next request until all requests are processed. The time complexity
for a list of n requests is at most O(n2) since the newly inserted deterministic miss can become the leader
or follower of many block accesses and the energy penalties of those blocks should thus be updated.
This algorithm is heuristic because it looks at only the current set of deterministic misses when calcu-
lating the energy penalty for evicting a block. Thus, it may not make the best decision at a replacement.
As we discussed in Section 3.1, each cache miss leads to a disk access, which costs additional energy.
Hence, higher miss ratios would increase the energy consumption. We use a simple mechanism to con-
sider both miss ratio and energy penalty for a miss: not to differentiate among blocks whose energy
penalties are smaller than a threshold η. Any energy penalty smaller than η is rounded up to η. Obvi-
ously, when η is large enough, it is Belady’s algorithm; when η = 0, it is the pure OPG algorithm. This
mechanism thus subsumes Belady’s algorithm at one extreme, and the pure OPG algorithm at the other.
4 Power-Aware On-line Caching Algorithms
In practice, we do not have knowledge about future accesses and thus cannot use the off-line power-
aware greedy algorithm. However, it gives us some insights on how to design a power aware online
algorithm that saves energy. Such an algorithm should avoid evicting blocks with larger energy penalties.
In this section, we present two new power-aware online caching algorithms. Both are based on the

above observation but use very different approaches. This first one, PA-LRU, evicts blocks that have the
largest estimated energy penalties at replacement. The second one, PB-LRU, divides the storage cache
into different partitions (with one for each disk) in a way to minimize energy consumption.
4.1 The First Algorithm: PA-LRU
PA-LRU is based one the observation that different disks have different workload characteristics such as
requests interarrival time distribution, the number of cold misses. These characteristics of a disk directly
affect the energy cost of an access to this disk.
We first investigate how the length of idle intervals affects energy saving. Figure 4 shows energy
savings that can be obtained by switching to lower power modes given an idle interval. Similar to
Figure 2, we plot lines ESi(t) = E0(t) − Ei(t) for each power mode i, where ESi is the energy saved
by going into mode i (ES0 = 0) and Ei is defined in Section 2. The upper envelope of all of these lines
UE(t) = maxi{ESi} gives us the maximum energy saved for an idle interval of length t.
Mode 1
Mode 2
Mode 3
Mode 4
Mode 0 t1 t4 t3 t2
E n
e r g
y S
a v
i n g
Interval Length
Figure 4: Energy savings (not Energy Con-
sumption) over mode 0 for each mode in a
5-mode disk as a function of interval length
The super-linear property of the upper envelope func-
tion, UE(t), indicates that even small increases in the
idle interval length of inactive disks can result in signifi-
cant energy savings. By keeping more blocks from inac-
tive disks in the cache, we can make the average interval
length for these disks larger. Then these disks could stay
in the low power modes longer. Although the average
interval lengths for other active disks may be decreased
due to an increased number of misses, the energy penalty
we pay for these other disks is much smaller than the en-
ergy savings we gain from the inactive disks. As shown
in Figure 4, even though the average idle period of disk 0 is reduced from t2 to t1, it results in the stretch-
ing of disk 1’s average interval from t3 to t4. Based on the super-linear property of UE(t), the amount
of energy saving at disk 1 is more than the energy cost at disk 0. Thus, overall energy saving is achieved.
However, average interval length is not the only factor that affects the amount of energy that can be
saved (1) the percentage of capacity misses (misses caused by previous evictions) should be reason-
ably large since a cache replacement algorithm cannot avoid any cold misses(misses due to first-time

accesses). If most of the accesses to a disk are cold misses, we cannot do much to avoid expensive disk
spin-ups or make interval lengths longer. (2) the distribution of accesses also affects the opportuni-
ties to save energy. For example, for the same average interval length t2 in Figure 4, disks with larger
deviation have more opportunities to save energy than disks with uniform arrivals.
To keep track of the number of cold misses, we use a Bloom Filter [5, 11] to identify cold misses.
The idea is to allocate a vector v of m bits, all set to 0 initially, and then choose k independent hash
functions, h1, h2, . . . , hk, each with range {1, . . . , m}. Given an access for block a, we check the bits
at positions h1(a), h2(a), . . . , hk(a). If any of them is 0, a is definitely a cold miss. In this case, the
bits at positions h1(a), h2(a), . . . , hk(a) in v are set to 1. Otherwise, we conjecture that a is already in
the set, which means it is not a cold miss, though there is a certain probability that we are wrong due
to hash collisions. But, fortunately, the probability of collisions is low if the bloom vector is reasonably
large. For example, if the system has 1.6M blocks and the bloomfilter vector has 2M entries with 7 hash
functions , the collision probability is only 0.0082.
0
0.2
0.4
0.6
0.8
1
Interval Length
Cumulative Probability
t2 t1 t7 t6 t5 t4 t8
p
Cumulative
Distribution
Function F(x)
t0 T t3 t9
Figure 5: The histogram approximates the
cumulative distribution function of interval
lengths.
To estimate the distribution of accesses for each disk,
instead of using mean and standard deviation, we em-
ploy a simple but effective epoch-based histogram tech-
nique [46]. In each epoch, we keep track of the interval
length between two consecutive accesses for each disk.
We obtain a histogram as shown in Figure 5. Let ni be
the number of intervals of length between [ti, ti + 1) and
let n be the total number of intervals. The height of each
bin in Figure 5 is∑i
j=0nj
n, which approximates the cu-
mulative probability of the interval length being less than
ti+1. All the bins together form a histogram, which approximates the cumulative distribution function
of interval length for a disk, i.e., F (x) = P [X ≤ x], where X is a random variable that represents the
interval length for a disk.
PA-LRU is based on these observations. Its main idea is to dynamically keep track of workload
characteristics for each disk, including the percentage of cold misses and the cumulative distribution
of interval lengths. Based on these characteristics, PA classifies all disks into two categories, regular
and priority. Disks that exhibit (1) small percentage of cold misses, and (2) large interval lengths with

high probability belong to “priority” class, and others belong to “regular” class. To adapt to workload
changes, the classification is epoch-based, adjusted periodically based on the latest workload.
This idea can be combined with most existing storage cache replacement algorithms to make them
“power aware”. This includes several recently proposed algorithms such as ARC [34], LIRS [24],
DEMOTE [44], and MQ [49]. In this article, we use the common LRU algorithm as an example and
refer it as Power-Aware LRU algorithm (PA-LRU).
PA-LRU maintains two LRU stacks, LRU0 which keeps blocks that belong to disks in the “regular”
class and LRU1 which keeps blocks that belong to disks in the “priority” class. When choosing a block
to evict, PA-LRU always evicts the bottom block of LRU0 if it is not empty. If LRU0 is empty, PA-LRU
evicts the bottom block from LRU1.
PA-LRU uses the request sequence’s characteristics during the previous epoch for each disk. If the
percentage of cold misses is larger than a threshold α, blocks from this disk go to LRU0 during the
current epoch. As shown in Figure 5, given a cumulative probability p, we can easily calculate the
corresponding T based on the cumulative distribution function, that is, P (X ≤ T ) = p. If T is less than
a threshold β, the blocks from this disk go to LRU0 as well. Otherwise, blocks go to LRU1. α, β, p and
the length of the epoch are tunable parameters.
4.2 The Second Algorithm: PB-LRU
Although the PA-LRU algorithm is more energy-efficient than LRU as shown in Section 6, it requires
some parameter tuning to set the values of α, β, p and the length of the epoch. In this section, we present
the second on-line power-aware algorithm called PB-LRU that requires little parameter tuning.
4.2.1 Main Idea
Similar to PA-LRU, PB-LRU (Partition-Based LRU) also differentiates disks with different character-
istics. But it does it in a very different way. PB-LRU differentiates disks by dynamically controlling
the number of cache blocks allocated to each disk. It divides the entire cache into separate partitions,
one for each disk. The partitions are divided in a way to minimize the total storage subsystem energy
consumption. The partition sizes are adjusted periodically at every epoch to adapt to workload changes.
Within an epoch, each partition is managed independently using the original replacement algorithm (e.g.

LRU). The epoch length is the only parameter. But our results show relative insensitiveness of PB-LRU’s
results to this parameter (See section 6.2.2).
In order to find an energy-optimal partitioning, we first estimate, for each disk, the energy that would
be consumed with different partition sizes. Symbolically, if we have n disks {1 . . . n}, we estimate the
energy, E(i, s), that would be consumed by disk i if it had a partition of size s. These estimates are then
used to find a partitioning that will minimize the total energy consumption of all disks. Of course, the
sum of each partition size cannot exceed the total cache size S.
Let us first formalize the problem. Suppose there are m possible partition sizes: 0 < p1 < p2 <
· · · < pm ≤ S. Let xij indicate whether disk i has a partition of size j (1 means “yes” and 0 means
“no”). Obviously, each disk can only have one partition size, so we have∑m
j=1 xij = 1. For disk i, its
partition size Si would be∑m
j=1 pjxij . Therefore, we have the following:
minimizen
∑
i=1
E(i, Si)
subject ton
∑
i=1
Si ≤ S, Si =
m∑
j=1
pjxij
m∑
j=1
xij = 1, xij = 0 or 1
This problem is a form of the Multiple Choice Knapsack
Problem (MCKP) [32], a variant of the famous 0-1 knapsack
problem. To solve this, PB-LRU needs to address two issues:
(1) accurate estimation of the energy, E(i, s), that would be
consumed by disk i if it had a partition size s and (2) solving
the MCKP which has been proved to be NP-hard [32].
4.2.2 Run-time Energy Estimation for Different Partition Sizes
In this subsection we describe a technique to dynamically determine the energy that each disk would
consume with various possible partition sizes. A disk’s energy consumption depends on the sequence
of cache misses and the time of each miss. Since we must estimate energy for various possible partition
sizes at run time, it is infeasible to conduct real measurement on the energy consumption with each
different partition size using real organizations.
Instead, PB-LRU uses a much more elegant technique to do the estimation. Essentially, we expect
to obtain a curve showing energy consumption as a function of partition size, for each disk, at run time.
This is similar to the miss ratio vs. cache size curve, which has been dynamically obtained in several
previous studies [26, 39] using the Mattson’s Stack algorithm. To our knowledge, our study is the first
to dynamically estimate how energy consumption varies with cache (partition) size.
Mattson’s Stack algorithm was initially proposed by Mattson et al. in 1970 [33] to reduce trace-

driven processor cache simulation time. It can determine the hit ratio of all processor cache sizes with
a single pass through the trace file. It was later extended by Hill et al. [21, 20] and Wang et al. [42]
to provide efficient trace simulations for set-associative caches. The main idea of this algorithm is to
take advantage of the inclusion property in many cache/memory replacement algorithms [33] including
the commonly used Least Recently Used (LRU) algorithm, the Least Frequently Used (LFU) algorithm
and the offline Belady’s algorithm. The inclusion property states that at any given time, the contents
of a cache of k blocks is a subset of the contents of a cache of k + 1 blocks for the same sequence of
accesses. Therefore, if we maintain a “stack” (e.g. an LRU stack), an access to a block at depth i in the
stack would lead to a miss in caches with size smaller than i, and a hit in others. Since the stack records
only addresses of blocks and not their data, the space overhead of the stack is small.
Unfortunately, the Mattson’s stack algorithm only gives us the correlation between cache size and
cache miss ratio. Our goal is to minimize total disk energy consumption, not the cache miss ratio. Even
though the miss ratio for two partition sizes may be significantly different, the resulting disk energy
consumption can still be similar because extra misses may not cause any disk spin-ups.
We extend Mattson’s Stack algorithm to dynamically track the variation of energy-consumption with
possible partition sizes for each disk. PB-LRU first uses the Mattson’s Stack algorithm to determine
whether a request would result in a cache hit or miss for different partition sizes. If a request is a miss
in a partition of size p (and all smaller sizes), the request will access the corresponding disk. If we know
the last access time to this disk (with partition size p), we can estimate the energy consumption from
the last access to the current one based on the underlying power management scheme. For example,
if Practical DPM is used, we can decide what the current disk power mode is and thus calculate how
much idle energy is consumed during this idle period (including the spin-up energy). The idle period is
obtained from the current and previous disk access times. To get the active energy, we first measured the
average disk access time on an IBM Ultrastar36Z15 disk and used this value (10ms) in our simulation.
As shown in Section 6, our energy estimation is very accurate with an error of at most 1.8%.
Therefore, for each disk and each possible partition size, PB-LRU maintains the last access time to
the disk (i.e. previous cache miss time) and its energy consumption. In our experiments, we set the basic
allocation unit to be 1MB. Thus, if the total cache size is 128MB, for each disk we maintain 128 energy
estimates and last access times corresponding to partition sizes of 1,2,3,. . . ,128MB. At each access,
besides changing the real cache to service this access based on the replacement algorithm, we also

1
5 4 3 2
Ghost Cache Ghost Cache Real Cache Real Cache
Cache Size
1
Energy Prev_Miss Time
5
4
3
2
T5
T5
T5
T5
T5
E5
E5
E5
E5
E5
Time: T1 T2 T3 T4 T5 T6 ... Access: 5 4 3 2 1 4 ...
Cache Size
1
Energy Prev_Miss Time
5
4
3
2
T5
T5
T6
T6
T6
E5
E5
E5+E(T6-T5)
E5+E(T6-T5)
E5+E(T6-T5)
1
3 2
4
5 3 2 1
4
2 1
(b) T6 (a) T5
Figure 6: An example of energy estimate in PB-LRU for a disk
1. Search the requested block number in the stack of the appropriate disk. If it is found to be the ith
element from the top of the stack, its depth is i. If it is not found, its depth is ∞.
2. For all partition sizes less than the depth, increment the energy estimates. Update the previous miss
time to the current access time.
3. Update the stack using the same replacement policy as the real cache, e.g. PB-LRU brings the
requested block number to the top of the stack.
Figure 6 illustrates the process of energy estimation for a disk with PB-LRU. Since the first five
accesses are cold misses, at time T5, the prev miss time is T5 and the energy consumed is E5, for all
partition sizes. At time T6 block 4 is accessed, which has a depth of 4 in the stack. For the partition
sizes less than 4, a miss would occur. So the prev miss time for those sizes is set to T6 and the total
energy consumption is incremented by the sum of idle energy consumed during the last idle period and
the active energy, which is E(T6 − T5) + 10ms ∗ ActivePower (calculated based on the underlying
DPM). However, if the partition for this disk has size of 4 or 5 blocks, there would have been a hit and
no change is needed. Finally, both the stack and the real cache are updated based on LRU.
Although in our study we use LRU as the basic replacement algorithm, the methodology of parti-
tioning described above is applicable to all policies that exhibit the property of inclusion such as LFU,
2Q [25] and MQ [49].
4.2.3 Solving the MCKP Problem
The Multiple-Choice Knapsack Problem has been proved to be NP-hard [32]. However, it can be solved
in pseudo-polynomial time by dynamic programming as described below. The time complexity of the

solution is O(nm2), where n is the number of disks and m is the number of potential partition sizes. Let
K(i, s) (s ∈ {p1, p2, . . . , pm}, 0 < p1 < . . . < pm ≤ S) be the energy consumed by i disks when a total
cache size of s is partitioned among those disks. K∗ gives the minimum total energy consumption when
a storage cache of size S is partitioned among all n disks.
K(0, s) =
0 if s = 0
∞ otherwise
K(i, s) =
min{j|0<pj≤s}{K(i− 1, s − pj) + E(i, pj)}
if s > 0
∞ otherwise
K∗ = min{s|0≤s≤S}{K(n, s)}
As results will demonstrate, this technique
has a tendency to increase the size assigned
to relatively inactive disks and give only small
sizes to active disks. This is because the en-
ergy penalty incurred by reducing the partition
size of an active disk is small, whereas the en-
ergy saved by increasing the partition size of a
relatively inactive disk is large.
5 Evaluation Methodology
5.1 Test Bed
IBM Ultrastar 36Z15
Individual Disk Capacity 18.4 GB
Maximum Disk Rotation Speed 15000 RPM
Minimum Disk Rotation Speed 3000 RPM
RPM Step-Size 3000 RPM
Active Power(Read/Write) 13.5 W
Seek Power 13.5 W
Idle Power@15000RPM 10.2 W
Standby Power 2.5 W
Spinup Time(Standby to Active) 10.9 secs
Spinup Energy(Standby to Active) 135 J
Spindown Time(Active to Standby) 1.5 secs
Spindown Energy(Active to Standby) 13 J
Table 1: Simulation Parameters
We simulate a complete storage system to eval-
uate our power-aware cache management schemes.
We have enhanced the widely used DiskSim sim-
ulator [12] and augmented it with a disk power
model. The power model we use is similar to that
used by Gurumurthi et al. [16] for multi-speed disks.
We have also developed a storage cache simulator,
CacheSim and we use it together with DiskSim to
simulate a complete storage system. CacheSim im-
plements several cache management policies. Ac-
cesses to the simulated disks first go through the simulated storage cache. The simulator reports the
energy consumed by each disk in every power mode and the energy consumed in servicing requests
(energy to perform seek, rotation, and transfer). Therefore, if a power-aware replacement algorithm
introduces extra misses, the disk energy consumed in servicing those extra misses is also reported.
The specifications for the disk used in our study are similar to that of the IBM Ultrastar 36Z15. The
parameters are taken from the disk’s data sheet [22, 6]. Some of these parameters are shown in Table 1.
Other than active and standby, we use four low-speed power modes: 12k RPM, 9k RPM, 6k RPM and
3k RPM. For convenience of description, we call them NAP modes: NAP1, NAP2, NAP3 and NAP4. To
calculate the parameters for each NAP mode, we use the linear power and time models proposed in [16].
We use the 2-competitive thresholds described in Section 2 for Practical DPM. For PA-LRU, we use an
epoch length of 15 minutes. Other parameters are α = 50%, p = 80% and β = 5seconds. α, β, p are
described in Section 4. β is set to be the same as the break-even time for NAP1 mode. All PB-LRU
results are achieved with the epoch length as 16000 requests. Section 6.2.2 will show that PB-LRU
results are insensitive to the epoch length as long as it is long enough for the cache to “warm-up” after
the repartitioning.
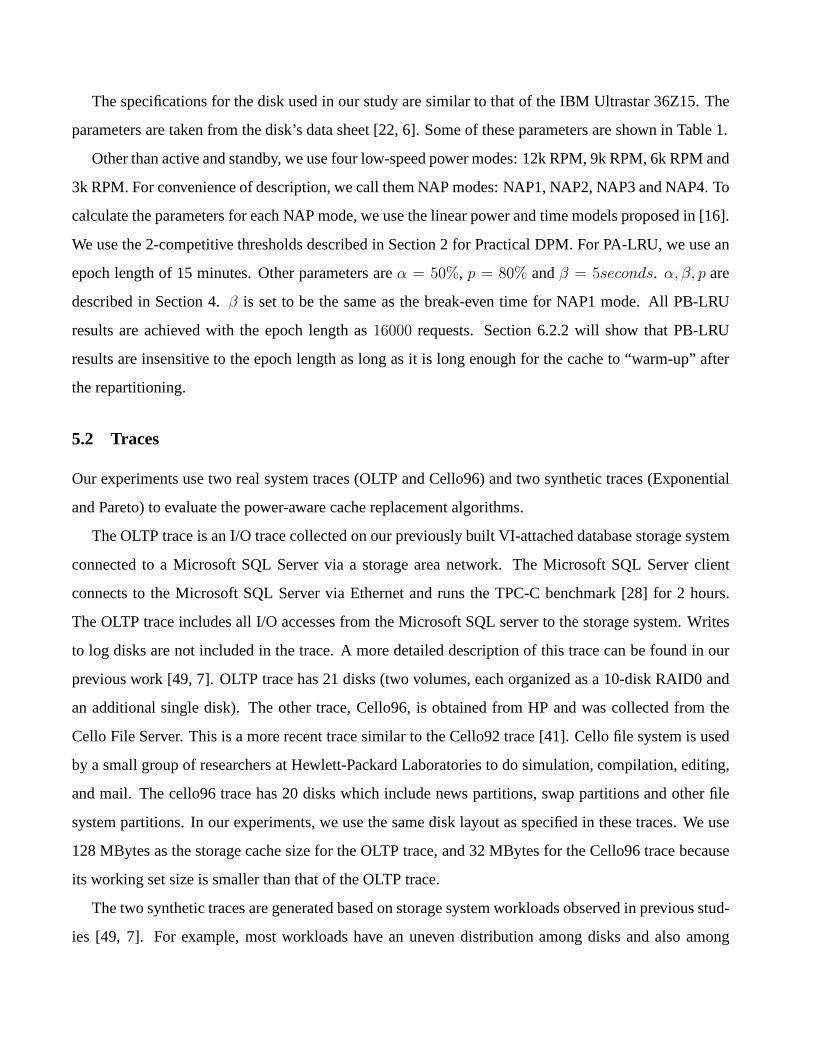
5.2 Traces
Our experiments use two real system traces (OLTP and Cello96) and two synthetic traces (Exponential
and Pareto) to evaluate the power-aware cache replacement algorithms.
The OLTP trace is an I/O trace collected on our previously built VI-attached database storage system
connected to a Microsoft SQL Server via a storage area network. The Microsoft SQL Server client
connects to the Microsoft SQL Server via Ethernet and runs the TPC-C benchmark [28] for 2 hours.
The OLTP trace includes all I/O accesses from the Microsoft SQL server to the storage system. Writes
to log disks are not included in the trace. A more detailed description of this trace can be found in our
previous work [49, 7]. OLTP trace has 21 disks (two volumes, each organized as a 10-disk RAID0 and
an additional single disk). The other trace, Cello96, is obtained from HP and was collected from the
Cello File Server. This is a more recent trace similar to the Cello92 trace [41]. Cello file system is used
by a small group of researchers at Hewlett-Packard Laboratories to do simulation, compilation, editing,
and mail. The cello96 trace has 20 disks which include news partitions, swap partitions and other file
system partitions. In our experiments, we use the same disk layout as specified in these traces. We use
128 MBytes as the storage cache size for the OLTP trace, and 32 MBytes for the Cello96 trace because
its working set size is smaller than that of the OLTP trace.
The two synthetic traces are generated based on storage system workloads observed in previous stud-
ies [49, 7]. For example, most workloads have an uneven distribution among disks and also among

blocks. To simulate these characteristics, we use zipf distribution to distribute requests among 24 dif-
ferent disks and also amongst blocks in each disk. Moreover, as observed by previous studies [49],
requests to storage systems have poorer temporal locality than those to first-level buffer caches and the
reuse distances are distributed in a “hill” shape, or theoretically speaking, are log-normally distributed.
Based on these characteristics, we use a log normal distribution with mean 32,000 references to re-
flect temporal locality. Spatial locality is controlled by the probabilities of sequential accesses, local
accesses and random accesses. A sequential access starts at the address immediately following the
last address accessed by the previously generated request. A spatially local request begins some short
distance (smaller than Maximum Local Distance) away from the previous request’s starting address.
Request Number 1 million
Disk Number 24
Exponential Distribution 1
λ= 100ms
Pareto Distribution 1 < α ≤ 2, β = 50ms
Write Ratio 0.2
Disk Size 18 GB
Sequential Access Probability 0.1
Local Access Probability 0.2
Random Access Probability 0.7
Maximum Local Distance 100 blocks
Table 2: Default Synthetic Trace Parameters
Similar to [16], we consider two types of distribu-
tions for interarrival time: Exponential and Pareto.
Exponential distribution models a Poisson process,
which is almost regular traffic without burstiness
while the Pareto distribution introduces burstiness in
arrivals. The Pareto distribution is controlled by two
parameters, Shape α and Scale β. We use a Pareto
distribution with a finite mean and infinite variance.
We call these two synthetic traces Exponential and
Pareto in the rest of this paper. The default parameters for the trace generator are listed in Table 2.
6 Evaluation of Power-Aware Cache Replacement Algorithms
6.1 Overall Results
We evaluate five cache replacement algorithms: OPG, Belady, PA-LRU, PB-LRU and LRU using the two
real-system traces and two synthetic traces. We have also measured the disk energy consumption with
an infinitely large cache size, in which case only cold misses go to disks. This serves as a lower bound
for the energy consumed as a result of any cache replacement algorithm because no cache replacement
algorithm with a limited cache size can save more energy if the underlying disks use the Oracle DPM.
With the Practical DPM, infinite storage cache size may cause more energy consumption than limited
cache sizes, so it cannot serve as a theoretical lower bound. To give an example, suppose the inter-

�����������������������������������������������������������������������������������������������������������������������������������������������������������������������������������������
�����������������������������������������������������������������������������������������������������������������������������������������������������������������������������������������
�������������������������������������������������������������������������������������������������������������������������������������������������������������������������������������������������������������
�������������������������������������������������������������������������������������������������������������������������������������������������������������������������������������������������������������
������������������������������������������������������������������������������������������������������������������������������������������������������������������������������������������������������������������������������������������������������������
������������������������������������������������������������������������������������������������������������������������������������������������������������������������������������
����������������������������������������������������������������������������������������������������������������������������������������������������������������������������������������������
����������������������������������������������������������������������������������������������������������������������������������������������������������������������������������������������
���������������������������������������������������������������������������������������������������������������������������
���������������������������������������������������������������������������������������������������������������������������
�������������������������������������������������������������������������������������������������������������������������������������������������������������������������������������������������������������������������������������������������������������������
�����������������������������������������������������������������������������������������������������������������������������������������������������������������������������������������
� � ������ ���� ����
1.0
0.9
0.8
0.7
0.6
0.5
0.4
0.3
0.2
0.1
0Practical DPM Oracle DPM
PB−LRUPA−LRULRUOPGBeladyInfinite
(a) OLTP
����������������������������������������������������������������������������������������������������������������������������������������������������������������������������������������������
����������������������������������������������������������������������������������������������������������������������������������������������������������������������������������������������
�����������������������������������������������������������������������������������������������������������������������������������������������������������������������������������������������������������������������������������������������������������������������������������������������
�������������������������������������������������������������������������������������������������������������������������������������������������������������������������������������������������������������
��������������������������������������������������������������������������������������������������������������������������������������������������������������������������������������������������������������������������������������������������������������������������
����������������������������������������������������������������������������������������������������������������������������������������������������������������������������������������������
����������������������������������������������������������������������������������������������������������������������������������������������������������������������������������������������
����������������������������������������������������������������������������������������������������������������������������������������������������������������������������������������������
�����������������������������������������������������������������������������������������������������������������������������������������������������������������������������������������������������������������������������������������������������������������������������������������������
�����������������������������������������������������������������������������������������������������������������������������������������������������������������������������������������������������������������������������������������������������������������������������������������������
��������������������������������������������������������������������������������������������������������������������������������������������������������������������������������������������������������������������������������������������������������������������������
����������������������������������������������������������������������������������������������������������������������������������������������������������������������������������������������
������ � � !!"" ##$$
1.0
0.9
0.8
0.7
0.6
0.5
0.4
0.3
0.2
0.1
0Practical DPM Oracle DPM
PB−LRUPA−LRULRUOPGBeladyInfinite
(b) Cello96
%�%�%%�%�%%�%�%%�%�%%�%�%%�%�%%�%�%%�%�%%�%�%%�%�%%�%�%%�%�%%�%�%%�%�%%�%�%%�%�%%�%�%%�%�%%�%�%%�%�%%�%�%%�%�%%�%�%%�%�%%�%�%%�%�%%�%�%%�%�%%�%�%%�%�%%�%�%%�%�%%�%�%%�%�%%�%�%%�%�%%�%�%
&�&�&&�&�&&�&�&&�&�&&�&�&&�&�&&�&�&&�&�&&�&�&&�&�&&�&�&&�&�&&�&�&&�&�&&�&�&&�&�&&�&�&&�&�&&�&�&&�&�&&�&�&&�&�&&�&�&&�&�&&�&�&&�&�&&�&�&&�&�&&�&�&&�&�&&�&�&&�&�&&�&�&&�&�&&�&�&&�&�&&�&�&
'�'�'�''�'�'�''�'�'�''�'�'�''�'�'�''�'�'�''�'�'�''�'�'�''�'�'�''�'�'�''�'�'�''�'�'�''�'�'�''�'�'�''�'�'�''�'�'�''�'�'�''�'�'�''�'�'�''�'�'�''�'�'�''�'�'�''�'�'�''�'�'�''�'�'�''�'�'�''�'�'�''�'�'�''�'�'�''�'�'�''�'�'�''�'�'�''�'�'�''�'�'�''�'�'�''�'�'�''�'�'�''�'�'�''�'�'�''�'�'�''�'�'�'
(�(�((�(�((�(�((�(�((�(�((�(�((�(�((�(�((�(�((�(�((�(�((�(�((�(�((�(�((�(�((�(�((�(�((�(�((�(�((�(�((�(�((�(�((�(�((�(�((�(�((�(�((�(�((�(�((�(�((�(�((�(�((�(�((�(�((�(�((�(�((�(�((�(�((�(�((�(�((�(�((�(�(
)�)�)�))�)�)�))�)�)�))�)�)�))�)�)�))�)�)�))�)�)�))�)�)�))�)�)�))�)�)�))�)�)�))�)�)�))�)�)�))�)�)�))�)�)�))�)�)�))�)�)�))�)�)�))�)�)�))�)�)�))�)�)�))�)�)�))�)�)�))�)�)�))�)�)�))�)�)�))�)�)�))�)�)�))�)�)�))�)�)�))�)�)�))�)�)�))�)�)�)
*�*�**�*�**�*�**�*�**�*�**�*�**�*�**�*�**�*�**�*�**�*�**�*�**�*�**�*�**�*�**�*�**�*�**�*�**�*�**�*�**�*�**�*�**�*�**�*�**�*�**�*�**�*�**�*�**�*�**�*�**�*�**�*�**�*�*
+�+�++�+�++�+�++�+�++�+�++�+�++�+�++�+�++�+�++�+�++�+�++�+�++�+�++�+�++�+�++�+�++�+�++�+�++�+�++�+�++�+�++�+�++�+�++�+�++�+�++�+�++�+�++�+�++�+�++�+�++�+�++�+�++�+�++�+�++�+�++�+�+
,�,�,,�,�,,�,�,,�,�,,�,�,,�,�,,�,�,,�,�,,�,�,,�,�,,�,�,,�,�,,�,�,,�,�,,�,�,,�,�,,�,�,,�,�,,�,�,,�,�,,�,�,,�,�,,�,�,,�,�,,�,�,,�,�,,�,�,,�,�,,�,�,,�,�,,�,�,,�,�,,�,�,,�,�,,�,�,,�,�,
-�-�-�--�-�-�--�-�-�--�-�-�--�-�-�--�-�-�--�-�-�--�-�-�--�-�-�--�-�-�--�-�-�--�-�-�--�-�-�--�-�-�--�-�-�--�-�-�--�-�-�--�-�-�--�-�-�--�-�-�--�-�-�--�-�-�--�-�-�--�-�-�--�-�-�--�-�-�--�-�-�--�-�-�--�-�-�--�-�-�--�-�-�--�-�-�--�-�-�--�-�-�--�-�-�--�-�-�--�-�-�--�-�-�--�-�-�--�-�-�--�-�-�-
.�.�.�..�.�.�..�.�.�..�.�.�..�.�.�..�.�.�..�.�.�..�.�.�..�.�.�..�.�.�..�.�.�..�.�.�..�.�.�..�.�.�..�.�.�..�.�.�..�.�.�..�.�.�..�.�.�..�.�.�..�.�.�..�.�.�..�.�.�..�.�.�..�.�.�..�.�.�..�.�.�..�.�.�..�.�.�..�.�.�..�.�.�..�.�.�..�.�.�..�.�.�..�.�.�..�.�.�..�.�.�..�.�.�..�.�.�..�.�.�..�.�.�.
/�/�/�//�/�/�//�/�/�//�/�/�//�/�/�//�/�/�//�/�/�//�/�/�//�/�/�//�/�/�//�/�/�//�/�/�//�/�/�//�/�/�//�/�/�//�/�/�//�/�/�//�/�/�//�/�/�//�/�/�//�/�/�//�/�/�//�/�/�//�/�/�//�/�/�//�/�/�//�/�/�//�/�/�//�/�/�//�/�/�//�/�/�//�/�/�/
0�0�00�0�00�0�00�0�00�0�00�0�00�0�00�0�00�0�00�0�00�0�00�0�00�0�00�0�00�0�00�0�00�0�00�0�00�0�00�0�00�0�00�0�00�0�00�0�00�0�00�0�00�0�00�0�00�0�00�0�00�0�00�0�0
1�11�12�22�2 3344 5566
1.0
0.9
0.8
0.7
0.6
0.5
0.4
0.3
0.2
0.1
0Practical DPM Oracle DPM
PB−LRUPA−LRULRUOPGBeladyInfinite
(c) Exponential
7�7�77�7�77�7�77�7�77�7�77�7�77�7�77�7�77�7�77�7�77�7�77�7�77�7�77�7�77�7�77�7�77�7�77�7�77�7�77�7�77�7�77�7�77�7�77�7�77�7�77�7�77�7�77�7�77�7�77�7�77�7�77�7�77�7�77�7�77�7�77�7�77�7�77�7�77�7�77�7�7
8�8�88�8�88�8�88�8�88�8�88�8�88�8�88�8�88�8�88�8�88�8�88�8�88�8�88�8�88�8�88�8�88�8�88�8�88�8�88�8�88�8�88�8�88�8�88�8�88�8�88�8�88�8�88�8�88�8�88�8�88�8�88�8�88�8�88�8�88�8�88�8�88�8�88�8�88�8�8
9�9�99�9�99�9�99�9�99�9�99�9�99�9�99�9�99�9�99�9�99�9�99�9�99�9�99�9�99�9�99�9�99�9�99�9�99�9�99�9�99�9�99�9�99�9�99�9�99�9�99�9�99�9�99�9�99�9�99�9�99�9�99�9�99�9�99�9�99�9�99�9�99�9�99�9�99�9�99�9�99�9�9
:�:�::�:�::�:�::�:�::�:�::�:�::�:�::�:�::�:�::�:�::�:�::�:�::�:�::�:�::�:�::�:�::�:�::�:�::�:�::�:�::�:�::�:�::�:�::�:�::�:�::�:�::�:�::�:�::�:�::�:�::�:�::�:�::�:�::�:�::�:�::�:�::�:�::�:�::�:�::�:�::�:�:
;�;�;�;;�;�;�;;�;�;�;;�;�;�;;�;�;�;;�;�;�;;�;�;�;;�;�;�;;�;�;�;;�;�;�;;�;�;�;;�;�;�;;�;�;�;;�;�;�;;�;�;�;;�;�;�;;�;�;�;;�;�;�;;�;�;�;;�;�;�;;�;�;�;;�;�;�;;�;�;�;;�;�;�;;�;�;�;;�;�;�;;�;�;�;;�;�;�;;�;�;�;;�;�;�;;�;�;�;;�;�;�;;�;�;�;;�;�;�;
<�<�<<�<�<<�<�<<�<�<<�<�<<�<�<<�<�<<�<�<<�<�<<�<�<<�<�<<�<�<<�<�<<�<�<<�<�<<�<�<<�<�<<�<�<<�<�<<�<�<<�<�<<�<�<<�<�<<�<�<<�<�<<�<�<<�<�<<�<�<<�<�<<�<�<<�<�<<�<�<<�<�<<�<�<
=�=�==�=�==�=�==�=�==�=�==�=�==�=�==�=�==�=�==�=�==�=�==�=�==�=�==�=�==�=�==�=�==�=�==�=�==�=�==�=�==�=�==�=�==�=�==�=�==�=�==�=�==�=�==�=�==�=�==�=�==�=�==�=�==�=�==�=�==�=�==�=�==�=�==�=�==�=�==�=�=
>�>�>>�>�>>�>�>>�>�>>�>�>>�>�>>�>�>>�>�>>�>�>>�>�>>�>�>>�>�>>�>�>>�>�>>�>�>>�>�>>�>�>>�>�>>�>�>>�>�>>�>�>>�>�>>�>�>>�>�>>�>�>>�>�>>�>�>>�>�>>�>�>>�>�>>�>�>>�>�>>�>�>>�>�>>�>�>>�>�>>�>�>>�>�>>�>�>
?�?�??�?�??�?�??�?�??�?�??�?�??�?�??�?�??�?�??�?�??�?�??�?�??�?�??�?�??�?�??�?�??�?�??�?�??�?�??�?�??�?�??�?�??�?�??�?�??�?�??�?�??�?�??�?�??�?�??�?�??�?�??�?�??�?�??�?�??�?�??�?�??�?�??�?�??�?�??�?�??�?�?
@�@�@@�@�@@�@�@@�@�@@�@�@@�@�@@�@�@@�@�@@�@�@@�@�@@�@�@@�@�@@�@�@@�@�@@�@�@@�@�@@�@�@@�@�@@�@�@@�@�@@�@�@@�@�@@�@�@@�@�@@�@�@@�@�@@�@�@@�@�@@�@�@@�@�@@�@�@@�@�@@�@�@@�@�@@�@�@@�@�@@�@�@@�@�@@�@�@@�@�@@�@�@
A�A�A�AA�A�A�AA�A�A�AA�A�A�AA�A�A�AA�A�A�AA�A�A�AA�A�A�AA�A�A�AA�A�A�AA�A�A�AA�A�A�AA�A�A�AA�A�A�AA�A�A�AA�A�A�AA�A�A�AA�A�A�AA�A�A�AA�A�A�AA�A�A�AA�A�A�AA�A�A�AA�A�A�AA�A�A�AA�A�A�AA�A�A�AA�A�A�AA�A�A�AA�A�A�AA�A�A�AA�A�A�AA�A�A�AA�A�A�A
B�B�BB�B�BB�B�BB�B�BB�B�BB�B�BB�B�BB�B�BB�B�BB�B�BB�B�BB�B�BB�B�BB�B�BB�B�BB�B�BB�B�BB�B�BB�B�BB�B�BB�B�BB�B�BB�B�BB�B�BB�B�BB�B�BB�B�BB�B�BB�B�BB�B�BB�B�BB�B�BB�B�BB�B�B
C�CC�CD�DD�D EEFF GGHH
1.0
0.9
0.8
0.7
0.6
0.5
0.4
0.3
0.2
0.1
0Practical DPM Oracle DPM
PB−LRUPA−LRULRUOPGBeladyInfinite
(d) Pareto
Figure 7: Energy Consumption (normalized to LRU)
IJIJIIJIJIIJIJIIJIJIIJIJIIJIJIIJIJIIJIJIIJIJIIJIJIIJIJIIJIJIIJIJIIJIJIIJIJIIJIJIIJIJIIJIJIIJIJIIJIJIIJIJIIJIJIIJIJIIJIJIIJIJIIJIJIIJIJIIJIJIIJIJIIJIJI
KJKJKKJKJKKJKJKKJKJKKJKJKKJKJKKJKJKKJKJKKJKJKKJKJKKJKJKKJKJKKJKJKKJKJKKJKJKKJKJKKJKJKKJKJKKJKJKKJKJKKJKJKKJKJKKJKJKKJKJKKJKJKKJKJKKJKJKKJKJKKJKJKKJKJK
LJLJLLJLJLLJLJLLJLJLLJLJLLJLJLLJLJLLJLJLLJLJLLJLJLLJLJLLJLJLLJLJLLJLJLLJLJLLJLJLLJLJL
MJMJMMJMJMMJMJMMJMJMMJMJMMJMJMMJMJMMJMJMMJMJMMJMJMMJMJMMJMJMMJMJMMJMJMMJMJMMJMJMMJMJM
NJNJNNJNJNNJNJNNJNJNNJNJNNJNJNNJNJNNJNJNNJNJNNJNJNNJNJNNJNJNNJNJNNJNJNNJNJNNJNJNNJNJNNJNJNNJNJNNJNJNNJNJNNJNJNNJNJNNJNJNNJNJNNJNJNNJNJNNJNJNNJNJNNJNJNNJNJNNJNJNNJNJNNJNJNNJNJNNJNJNNJNJN
OJOJOOJOJOOJOJOOJOJOOJOJOOJOJOOJOJOOJOJOOJOJOOJOJOOJOJOOJOJOOJOJOOJOJOOJOJOOJOJOOJOJOOJOJOOJOJOOJOJOOJOJOOJOJOOJOJOOJOJOOJOJOOJOJOOJOJOOJOJOOJOJOOJOJOOJOJOOJOJOOJOJOOJOJOOJOJOOJOJOOJOJO
PJPJPJPPJPJPJPPJPJPJPPJPJPJPPJPJPJPPJPJPJPPJPJPJPPJPJPJPPJPJPJPPJPJPJPPJPJPJPPJPJPJPPJPJPJPPJPJPJPPJPJPJPPJPJPJPPJPJPJPPJPJPJPPJPJPJPPJPJPJPPJPJPJPPJPJPJPPJPJPJPPJPJPJPPJPJPJPPJPJPJPPJPJPJPPJPJPJPPJPJPJPPJPJPJPPJPJPJPPJPJPJPPJPJPJPPJPJPJP
QJQJQJQQJQJQJQQJQJQJQQJQJQJQQJQJQJQQJQJQJQQJQJQJQQJQJQJQQJQJQJQQJQJQJQQJQJQJQQJQJQJQQJQJQJQQJQJQJQQJQJQJQQJQJQJQQJQJQJQQJQJQJQQJQJQJQQJQJQJQQJQJQJQQJQJQJQQJQJQJQQJQJQJQQJQJQJQQJQJQJQQJQJQJQQJQJQJQQJQJQJQQJQJQJQQJQJQJQQJQJQJQQJQJQJQQJQJQJQ
RRSS
TTUU
1.21.11.00.90.80.70.60.50.40.30.20.1
0OLTP Cello96
PB−LRUPA−LRULRUOPGBelady
(a) OLTP and Cello96
VJVJVVJVJVVJVJVVJVJVVJVJVVJVJVVJVJVVJVJVVJVJVVJVJVVJVJVVJVJVVJVJVVJVJVVJVJVVJVJVVJVJVVJVJVVJVJVVJVJVVJVJVVJVJVVJVJVVJVJVVJVJVVJVJVVJVJV
WJWJWWJWJWWJWJWWJWJWWJWJWWJWJWWJWJWWJWJWWJWJWWJWJWWJWJWWJWJWWJWJWWJWJWWJWJWWJWJWWJWJWWJWJWWJWJWWJWJWWJWJWWJWJWWJWJWWJWJWWJWJWWJWJWWJWJW
XJXJXXJXJXXJXJXXJXJXXJXJXXJXJXXJXJXXJXJXXJXJXXJXJXXJXJXXJXJXXJXJX
YJYJYYJYJYYJYJYYJYJYYJYJYYJYJYYJYJYYJYJYYJYJYYJYJYYJYJYYJYJYYJYJY
ZJZJZZJZJZZJZJZZJZJZZJZJZZJZJZZJZJZZJZJZZJZJZZJZJZZJZJZZJZJZZJZJZZJZJZZJZJZZJZJZZJZJZZJZJZZJZJZZJZJZZJZJZZJZJZZJZJZZJZJZZJZJZZJZJZZJZJZZJZJZZJZJZ
[J[J[[J[J[[J[J[[J[J[[J[J[[J[J[[J[J[[J[J[[J[J[[J[J[[J[J[[J[J[[J[J[[J[J[[J[J[[J[J[[J[J[[J[J[[J[J[[J[J[[J[J[[J[J[[J[J[[J[J[[J[J[[J[J[[J[J[[J[J[[J[J[
\J\J\\J\J\\J\J\\J\J\\J\J\\J\J\\J\J\\J\J\\J\J\\J\J\\J\J\\J\J\\J\J\\J\J\\J\J\\J\J\\J\J\\J\J\\J\J\\J\J\\J\J\\J\J\\J\J\\J\J\\J\J\\J\J\\J\J\\J\J\\J\J\\J\J\\J\J\\J\J\
]J]J]]J]J]]J]J]]J]J]]J]J]]J]J]]J]J]]J]J]]J]J]]J]J]]J]J]]J]J]]J]J]]J]J]]J]J]]J]J]]J]J]]J]J]]J]J]]J]J]]J]J]]J]J]]J]J]]J]J]]J]J]]J]J]]J]J]]J]J]]J]J]]J]J]]J]J]]J]J]
^^__
``aa
1.21.11.00.90.80.70.60.50.40.30.20.1
0Exponential Pareto
PB−LRUPA−LRULRUOPGBelady
(b) Synthetic Traces
Figure 8: Average Response Time (normalized to LRU)
arrival time between two consecutive cold misses to the same disk is just slightly larger than the idle
threshold value. After the first cold miss, the disk will transition into a low-power mode after remaining
idle for a threshold period of time. Then it has to immediately transit back to active in order to service
the second cold miss. So it spends extra energy in disk spin-down/spin-up. However, if a replacement
algorithm can introduce another miss in between these two cold misses, it is possible to avoid the disk
spin-down/spin-up.
Figures 7 compares the disk energy consumption for all five storage cache replacement algorithms
and an infinite cache with both Oracle DPM and Practical DPM. Figure 8 shows the average response
time for the five storage cache replacement algorithms with the Practical DPM. Since the Oracle DPM
can always spin up disks in time for the next request, the average response time difference among the
five schemes is very small, which we do not present here.
Comparing two off-line algorithms, though Belady’s algorithm gives the optimal cache miss ratios,
OPG can consume up to 9.8% less energy than Belady’s algorithm. With the Cello96 trace, OPG con-
sumes 5.7% less energy than Belady’s algorithm. For the OLTP trace, OPG consumes 9.8% less energy
than Belady’s algorithm if disks use the Oracle scheme. With the Practical DPM, OPG’s energy sav-

ings is smaller, only 1.4%. In terms of average response time, OPG is 4.2% better for OLTP but 6.3%
worse for Cello96. For two synthetic traces, OPG can consume 5.3-9.3% less energy than the Belady’s
algorithm while provide 2.5-3.5% better average response time.
For two online power-aware algorithms, Figure 7 shows they can save up-to 22% more energy com-
pared to LRU. For the OLTP trace, PA-LRU consumes 14-16% less and PB-LRU consumes 11-13%
less energy than LRU. For the Exponential trace, both PA-LRU and PB-LRU can save 22% energy over
LRU. PB-LRU performs better than PA-LRU in other two traces: for the Pareto trace, PB-LRU saves
16.6% more and PA-LRU saves 7.7% more energy than LRU; for the Cello96 trace, PA-LRU saves less
than 1% energy over LRU while PB-LRU is 7.6-7.7% more energy-efficient than LRU.
The reason why PA-LRU can only save less than 1% energy for Cello96 is because in Cello96, 64%
of accesses are cold misses. In other words, 64% of accesses will go to disk no matter what cache
replacement policy is used. In addition, the requests’ interarrival gap is very small, even for the cold
miss sequence, which does not allow PA-LRU to save much energy. Even with the infinite-size cache,
the largest possible energy savings are only 12.4%-12.6%. In this sense, PB-LRU does a decent job.
In terms of average response time with Practical DPM, Figure 8 shows that PA-LRU and PB-LRU
improves the average response time by 62-64% for the Exponential trace, 40-50% for the OLTP trace
and 7-13% for the Pareto trace while for Cello96, the improvements by both are less than 1%. Again,
the dominant cold misses in Cello96 account for this.
6.2 Performance Analysis
In the next two subsections, we use the OLTP with Practical DPM to understand why PA-LRU and
PB-LRU can save more energy and provide better response time.
6.2.1 Analyzing PA-LRU
Figure 9 (a) shows the percentage time breakdowns for two representative disks. Each breakdown gives
the percentage of time consumed in each power mode and also during spin-up/spin-downs. Disk 14
spends 59% of time in standby mode with PA-LRU whereas it spends only 16% of time in standby mode
with LRU. Moreover, PA-LRU significantly reduces time in performing spin-up/downs from 25% to
13%. Even though PA-LRU increases the percentage of time in active mode for other disks such as disk
4 from 78% to 84%, the amount of increase is very small. PA-LRU also reduces the time that disk 4

(a) Percentage time breakdown (b) Mean inter-arrival time
Figure 9: Percentage time breakdown and mean request inter-arrival time for two representative disks in OLTP
spends in spin-up/downs from 16% to 6%. Also, because of the significantly fewer disk spin-up/downs,
PA-LRU has 50% lower average I/O response time.
Figure 9 (b) shows the mean request inter-arrival time for the same two representative disks (disk 4
and disk 14). The mean request inter-arrival time shown is much larger than the inter-arrival time in the
original application I/O sequence because requests are first filtered through a 128 MByte storage cache.
Since PA-LRU keeps blocks from disk 14 in the priority LRU list, there are fewer accesses to disk
14. As a result, the mean request inter-arrival time on disk 14 from a PA-LRU-managed cache is three
times as large as that from a LRU-managed cache. With 40 second inter-arrival gaps, disk 14 has a lot
of long idle periods to stay in low power modes, and thus saves significant amounts of energy.
To favor disk 14’s blocks, disk 4’s blocks are more likely to be evicted with PA-LRU than with LRU.
Thus, the mean request inter-arrival time on disk 4 with PA-LRU is a factor of 2.4 shorter than that
with LRU, which explains why PA-LRU causes disk 4 to stay in the active mode longer. Since the
original mean inter-arrival time with LRU is already smaller than the threshold, disk 4 does not have
much opportunity to go to the low power modes. Thus, shortening the mean inter-arrival time on disk 4
does not cause disk 4 to spend significantly less time in low power modes.
6.2.2 Analyzing PB-LRU
Accuracy of Energy Estimation Figure 10 (a) shows the difference between energy actually con-
sumed by real cache and that estimated by PB-LRU for the same size, for each of the 21 disks in a
random epoch. We can see the largest deviation of estimated energy from real energy is 1.8%, suggest-
ing that the energy estimation is accurate.
Assignment of Cache Sizes Figure 10 (b) shows, in a random epoch, the partition sizes which assigned
by the MCKP solver. For the first 10 disks, the MCKP solver only assigns 1MB to their caches while

0
10
20
30
40
Disk Number
En
erg
y(kJ
)
1 11 10 9 8 7 6 5 4 3 2 21 2 0
1 9
18 17 16 15 14 13 12
Real Energy Estimated Energy
0
2
4
6
8
10
12
14
1 2 3 4 5 6 7 8 9 10 11 12 13 14 15 16 17 18 19 20 21
Disk Number
Cac
he
Siz
e(M
Byt
es)
(a) Real Energy Vs.Estimation (b) Cache Sizes Assigned
Figure 10: Validation of PB-LRU in a random epoch for OLTP
0
0.04
0.08
0.12
0.16
0.2
30 60 120 300 600
Epoch Length(minutes)
En
erg
y S
avin
g
0
0.1
0.2
0.3
0.4
0.5
30 60 120 300 600
Epoch Length(minutes) A
vera
ge
Res
po
nse
Tim
e
Imp
rove
men
t
(a)Energy Consumption (b)Average Response Time
Figure 11: The energy saving and average response time improvement (PB-LRU over LRU) for OLTP tracechange with the increasing of epoch length
11-12MB is given to the next 10 disks. The OLTP workloads are such that the first 10 disks are active
while the next 10 are relatively inactive. The MCKP solver has a tendency to increase the size assigned
to relatively inactive disks and give only small sizes to disks which remain active. This is because the
energy penalty incurred by reducing the cache size of a disk that remains active is small while large
gains are made by increasing the cache size of a relatively inactive disk, as doing so allows it to remain
in lower-power modes longer. In this way, overall energy savings can be made.
Cache partition size also affects the response time. Since the first 10 disks are in active modes,
accesses to those disks do not need to wait several seconds for the disk to spin-up before requests are
serviced. Because of the greater partition space given to the next 10 disks, the number of misses and
consequently the number of expensive spin-ups from low-power to active mode is reduced and thus
response time improves.
Effects of Epoch Length One drawback of many previous studies [8, 16, 17, 6], including our PA-
LRU, is that they depend on multiple parameters. Tuning those parameters to adapt to different charac-
teristics of workloads is time-consuming and hard. An important benefit of PB-LRU is that it does not

need much parameter tuning for different workloads. The only parameter is the epoch length.
The epoch length cannot be too small or infinitely large. Fortunately, our results indicate that once it
is large enough to accommodate the “warm-up” period after re-partitioning, the results of PB-LRU are
relatively insensitive to the epoch length within a very large range, as shown in Figure 11. The results
for the other traces are similar. In real systems, it is not difficult to pick a large enough epoch length,
especially since most data center workloads are continuously running for days or even months.
6.3 Effects of Spin-up Cost
0%
2%
4%
6%
8%
10%
12%
14%
16%
18%
33.75 67.5 101.25 135 202.5 270 675
Spinup Cost(J) E
ner
gy
Sav
ing
Per
cen
tag
e
PA-LRU PB-LRU
Figure 12: Percentage energy-savings
for PA-LRU and PB-LRU over LRU versus
spin-up cost (energy needed for transitioning
from standby mode to active mode) for the
OLTP trace
In our simulations, we use the spin-up cost of the IBM
Ultrastar 36Z15 (135J) from standby to active mode.
In this section, we discuss how spin-up cost affects the
energy-savings of PA-LRU and PB-LRU over LRU using
the OLTP trace. We vary spin-up costs as energy needed
for transitioning from standby to active mode. The spin-
up costs from other modes to active mode are still calcu-
lated based on the linear power model described earlier.
Figure 12 shows the percentage energy-savings for
PA-LRU and PB-LRU over LRU for the OLTP trace.
Both algorithms demonstrate the same effects. Between
67.5J and 270J, the energy-savings of PA-LRU and PB-
LRU over LRU are fairly stable. The spin-up costs of
most current SCSI disks lie in this range. At one extreme, with the increase of spin-up cost, the break-
even times increase. Therefore, the thresholds calculated based on the break-even times also increase. In
this case, due to lack of long enough intervals, disks have less opportunities to stay in low power modes
even using power-aware algorithms as PA-LRU and PB-LRU. At the other extreme, if the spin-up cost
decreases a lot and spin-up becomes very cheap, the energy savings of PA-LRU and PB-LRU decreases
because in this case, even with LRU, disks are already in low-power modes most of the time.
Since both the energy and time cost of spin-down account for only 1/10 of spin-up in the IBM Ultra-
star 36Z15, the effect of considering both spin-up and spin-down cost is similar to that of Figure 12.

7 Effects of Write Policies on Disk Energy Consumption
In this section, we investigate the effects of four storage cache write policies on energy consumption. The
first two policies, write-back and write-through, are commonly used in caches. The write-back caching
policy only writes a dirty block to disks when the block is evicted from the cache. This policy reduces
the number of disk writes and enables fast response to clients, but could compromise data persistency
if the cache is on volatile storage. The write-through caching policy always writes dirty blocks to disk
immediately and does not tell clients that the writes are successful until the data is committed to disks.
The two other policies are variations of the write-back and write-through policies. “Write-back with
eager update” (WBEU) does not wait for a dirty block to be evicted from the cache before writing it
to the disk. The policy writes back dirty blocks of a disk whenever that disk becomes active. “Write-
through with deferred update” (WTDU) temporarily writes dirty blocks to a log instead of writing them
to their true destinations, if the destination disks are in low power modes.
To evaluate the effects of write policies, we use the two synthetic traces with varying write/read ratios.
We use LRU as the cache replacement algorithm in our simulation.
Write-back (WB) vs. Write-through (WT) Intuitively, write-back is more energy-efficient than
write-through due to a reduced number of writes and potentially longer idle periods. However, few stud-
ies have measured the difference in energy consumption quantitatively. Is the difference large enough to
justify trading persistency for energy?
Figure 13(a1) and (a2) show the percentage energy savings of write-back over write-through. Fig-
ure 13(a1) shows the results for a mean inter-arrival time of 250ms, and varying write ratios from 0%
to 100%. Figure 13(a2) shows the results when the write ratio is 50% and the mean inter-arrival time
varies from 10ms to 10,000ms. The results with Oracle DPM are similar to those with Practical DPM,
so we only present results with Practical DPM. For the extremely small or large interarrival time, the
differences between write polices are small since disks are active or sleeping most of the time already.
In a medium range, the results exhibit the similar effects to those of 250ms. For write ratio close to zero,
write policies do not matter and thus make no difference. However, the energy benefit over write-through
policy increases with write ratio. With 100% writes, write-back can save around 20% energy compared
to write-through. When fewer than 40% of the requests are writes, the percentage energy savings of
write-back over write-through is less than 5%. As shown in Figure 13 (a2), with a write ratio of 0.5,

0
10
20
30
40
50
60
70
0 0.2 0.4 0.6 0.8 1
Ene
rgy
Sav
ing
Per
cent
age
Write Ratio
Exponential TrafficPareto Traffic
0
10
20
30
40
50
60
70
0 0.2 0.4 0.6 0.8 1
Ene
rgy
Sav
ing
Per
cent
age
Write Ratio
Exponential TrafficPareto Traffic
0
10
20
30
40
50
60
70
0 0.2 0.4 0.6 0.8 1
Ene
rgy
Sav
ing
Per
cent
age
Write Ratio
Exponential TrafficPareto Traffic
(a1) WB vs. WT (b1) WBEU vs. WT (c1) WTDU vs. WT
(1) Percentage energy savings for different write ratios (inter-arrival time: 250ms)
0
5
10
15
20
25
10 20 50 100 200 500 1000 5000 10000
Ene
rgy
Sav
ing
Per
cent
age
Mean Interarrival Time(ms)
Exponential TrafficPareto Traffic
0
5
10
15
20
25
10 20 50 100 200 500 1000 5000 10000
Ene
rgy
Sav
ing
Per
cent
age
Mean Interarrival Time(ms)
Exponential TrafficPareto Traffic
0
5
10
15
20
25
10 20 50 100 200 500 1000 5000 10000
Ene
rgy
Sav
ing
Per
cent
age
Mean Interarrival Time(ms)
Exponential TrafficPareto Traffic
(a2) WB vs. WT (b2) WBEU vs. WT (c2) WTDU vs. WT
(2) Percentage energy savings for different mean inter-arrival time (write ratio: 50%)
Figure 13: Effects of write policies on disk energy consumption (All the numbers are percentage energysavings relative to the write-through policy. The underlying disk uses the Practical DRM. Results withthe Oracle DPM are similar.) Note that X-asis is not uniform in figure (2).
the benefits of write-back peaks during 100ms to 1000ms mean inter-arrival time, but the benefits are
always smaller than 10%. The benefits of write-back over write-through are slightly better in the traces
with exponential distributions than in the traces with Pareto distributions because the latter has bursty
requests, which can reduce the number of disk spin-ups.
Write-back with Eager Updates (WBEU) The energy consumption with write-back can be further
reduced by eagerly flushing dirty blocks to disks when the corresponding disks become active due to a
read miss. In the extreme case, if a disk D always stays in a low-power mode, the storage cache will
end up with a lot of D’s dirty blocks. To avoid this scenario, if the number of such dirty blocks reaches
a certain threshold, D is forced to transition into active mode and the storage cache flushes D’s dirty
blocks. This policy is similar to the ones used in [45, 37, 8]. The advantage of this write policy is that
writes avoid causing energy-expensive disk spin-ups.
Figure 13 (b1) and (b2) show the percentage energy savings of WBEU over write-through. WBEU
can significantly reduce energy consumption. If 100% of the requests are writes, WBEU can save
60-65% more energy than write-through. Therefore, when the percentage of writes is significant in a
workload, it is much more energy-efficient to use WBEU if persistency is not a big concern.

For the traces with exponential distributions, WBEU is more sensitive to the mean inter-arrival time.
With a write ratio of 0.5, if the mean inter-arrival time is large (10,000ms), the benefits of WBEU are
very small. This is because disks are “sleeping” most of the time and requests only cause little energy
consumption. If the mean inter-arrival time is small (10ms), WBEU does not provide huge benefits,
either. This is because disks are active most of the time due to fast arriving read requests. Mean inter-
arrival time has less effect on WBEU’s benefits with Pareto traffic because disks have longer idle periods
and tend to stay in low power modes.
Write-through with Deferred Update (WTDU) Since write-through causes a lot of energy consump-
tion, WTDU defers updates using a persistent log to avoid spinning up a disk in low power mode. This
log can reside in any persistent device such as NVRAM or a log disk that is likely to be always ac-
tive. In databases, log disks are usually always active because databases rely on its performance for fast
transaction commits. With such a log, we can defer energy-expensive updates in write-through.
To ensure persistency, we divide the log space into log regions with one for each disk. The first block
of a log region keeps the timestamp for the corresponding disk. This timestamp is also stored together
with each block in the log region. The storage cache also keeps a pointer for each disk to remember
the next free block in the corresponding log region. When a write request arrives for an inactive disk
D, the blocks are first written to the corresponding log region and each block is timestamped with D’s
timestamp. The cache copies of these blocks are marked as “logged”. When D becomes active due to
a read miss, all “logged” blocks are flushed from the storage cache into D before servicing any write
requests. Then the timestamp stored in the first block of D’s log region is incremented by one. Finally,
the corresponding free block pointer is reset.
The timestamp is used to ensure consistent recovery when system crashes. After the system reboots,
it first checks each log region to get the timestamps from its first block. Suppose the timestamp for a
region A is n. If the timestamps of some blocks in the same region are also n, it means some blocks may
not have been written back to the data disk. Thus, the recovery process will write all blocks with the
same timestamp back to the data disk. Otherwise, all blocks are already written back and the recovery
process does not need to do anything for this log region and can move on to the next log region.
Figure 13(c1) and (c2) show the percentage energy savings for WTDU over write-through. When
we evaluate WTDU, the extra energy consumption for writing to log regions is included in WTDU’s
results. If all accesses are writes, WTDU can reduce the disk energy consumption by 55% compared to

write-through, which indicates WTDU is quite effective. Since this scheme can also provide persistency,
it is good for workloads which have a high percentage of writes and require persistency semantics.
8 Discussions
In this section, we discuss several issues such as the effects of disk layout, how to apply our scheme
to the other multi-speed power model which services requests in low-power modes, how to solve disk
contention due to a small subset of active disks and interaction with CPU energy.
8.1 Effects of Disk Layout
In our simulation, we use the same disk layouts as indicated in the trace documents. However, it is true
that if all disks belong to the same striping group, all disks would have similar characteristics, and both
PA-LRU and PB-LRU would behave similarly to LRU.
Fortunately, in reality, most data center workloads run on configurations with multiple striping groups
because of two reasons: (1) scalability limitation: due to the throughput limitation of RAID controllers,
most commercial storage systems usually configure only 20-40 disks to each RAID controller, but in-
ternally a storage system is connected to many such RAID controllers. (2) reliability concern: since the
multiple-disk failure rate grows quickly with the number of disks in a striping group, it is much more
reliable to use multiple smaller striping groups than one large group. Therefore, most users of high-end
storage systems (e.g. EMC Symmetrix) are recommended to configure the system with multiple striping
groups, all of which share the storage cache and the storage processors inside the storage box.
Therefore, both PA-LRU and PB-LRU would be useful to partition the storage cache in a way ac-
cording to the different characteristics of each striping group. As a matter of fact, our OLTP trace was
collected on a real system that the DBMS (Microsoft SQL Server) creates the TPC-C database on two
striping groups (This is specified by the TPC-C benchmark kit, which was provided by Microsoft).
Recently, Pinheiro et al. has proposed PDC (Popular Data Concentration) [40] to employ energy-
aware disk layout. PDC keeps track of file popularity and periodically migrates most popular files to the
first disk, the second most popular files to the second disk and so on. By concentrating loads to a small
set of disks, other disks can stay in a low power mode longer. Our power-aware cache algorithms can be
combined with their disk layout to further reduce disk energy consumption.

8.2 Effects of Multi-Speed Power Model
The multi-speed disk architecture proposed by Gurumurthi et [16] can be designed to either serve re-
quests at all rotational speeds or serve requests only after a transition to the full-speed mode. We choose
the second option because it is a simple extension to the traditional 2-mode power model. Recently,
Pinheiro et al. [40] have used the first power model in designing energy-efficient disk layout. Therefore,
it is interesting to consider using our power-aware cache algorithm with multi-speed disks that serves
requests at low speeds.
The ideas of both PA-LRU and PB-LRU can be directly applied to this type of multi-speed disks.
For example, by selectively keeping blocks from certain disks or assigning large cache partition size to
them, those disks can serve requests at a lower speed due to lighter load and thus save energy. However,
to make things work, significant changes are needed because of its different underlying disk power
management scheme. For example, currently, both PA-LRU and PB-LRU use the length of idle periods
as an important energy implication. Moreover, these two algorithms count spinup/spindown cost as a
major part of energy penalty. Therefore, the modified PA-LRU and PB-LRU need to keep track of the
load (IO/s) instead and use a different method to calculate energy penalty since spinup/spindown is not
a big issue any more. We plan to investigate more on this direction in our future work.
8.3 Disk Contention
Both PA-LRU and PB-LRU might incur disk contention because lots of requests are concentrated to a
small set of active disks. As a result, those requests might have larger response times due to queueing
delay. We have developed a new technique that guarantees that performance will not be degraded beyond
a user-specified limit [30]. It dynamically monitors the performance degradation at run time and forces
to shut down the power management scheme when the degradation exceeds the specified limit. When
this method is combined with power-aware cache management, it may turn off the energy-optimizing
features of our algorithm, for example, by switching from PA-LRU to traditional LRU or preventing
PB-LRU from assigning small cache partition size to a certain disk.

8.4 Impacts on CPU Energy
Smarter cache management policy such as PA-LRU and PB-LRU might incur more processor cycles
and thus more CPU energy. However, disk drives in data centers consume more energy than processors
because of their high volume. For example, in Dell PowerEdge6650 reporting TPC-C performance [3]
which is equipped with 4 Intel Xeon 2.0GH processors (58W each) and 292 15K RPM hard disks (15W
each), hard disks consume nineteen times as much energy as processors. Moreover, our cache manage-
ment can be handled by those relatively slow but low-power processors inside the storage system.
9 Related Work
Modeling Disk Power Consumption Modeling disk energy consumption is important to design ef-
fective power management schemes. Greenawalt, for example, uses a purely analytical model which
assumes requests arrive according to a Poisson distribution [15]. Helmbold et al. model disk power
consumption in terms of seconds of activity instead of using Joules [19]. A recent study conducted
by Zedlewski et al. [47] presented a disk simulator called Dempsey which can accurately model energy
consumption of a single disk for mobile devices.
Power Management for Mobile Devices Most of previous research has focused on power manage-
ment for a single disks in mobile devices such as laptops. These studies can be roughly divided into two
categories. The first one does not change the timing for a given request sequence, but try to dynamically
adapt thresholds used to switch to low power modes based on these workloads. Many adaptive schemes
have been proposed to vary thresholds [14, 9, 27, 19]. [29, 23] calculates the threshold analytically. A
recent study [13] uses program counter based techniques to predict the length of upcoming idle periods.
The second category investigates ways to reorganize idle periods in I/O request sequences by delaying
or pre-fetching requests. Weissel et al. proposed a scheme called Cooperative I/O to allow applications
to specify deferrable or abortable I/O operations which provide more flexibility for underlying disk
power management [43]. T. heath et al. considered application transformation to increase idle periods
and inform the operating system about the length of each upcoming idle period [18]. Papathanasiou
suggested delaying asynchronous requests when the disk is at low-power mode and pre-fetching some
requests when the disk is at full power mode [37, 38].
Our study also tries to reorganize idle periods in I/O request sequences, however, it differs from other

studies in two aspects. First, our work using the storage cache to reorganize idle periods and does not
require any modifications to applications. Second, our work focuses on multiple disks with data center
workloads instead of a single disk with interactive I/O workloads.
Power Management for Data Centers Some recent studies [8, 16, 17, 6, 40] have looked into energy
management for high-end storage systems. A number of them [6, 16, 17] have shown that the average
idle period between requests in server workloads is small compared to the spin-up and spin-down cost
of server disks, which limits the possible energy saving. Gurumurthi et al. have proposed multi-speed
disks to address this problem [16]. Carrera et al. have studied a combination of laptop disks and server
disks and also suggested the use of multi-speed disks to save energy [6]. These works motivate our study
on power-aware cache management. However, these studies do not look at the effect of storage cache
on disk energy consumption.
Colarelli and Grunwald [8] proposed a disk backup organization called MAID that uses a small
number of disks as “cache drives” to save energy by reducing the spin-ups of data drives. However, they
rely on traditional LRU algorithm to manage the cache disks. Our algorithm can be directly used for
cache disks to further reduce energy consumption.
10 Conclusions
In this article, we show that power-aware storage cache management policies can help the underlying
disk energy management scheme save more energy and provide better I/O response time. More specif-
ically, we present an off-line energy-optimal cache replacement algorithm using dynamic programming
which minimizes the underlying disk energy consumption. Moreover, we present an off-line power-
aware greedy algorithm that is more energy-efficient than Belady’s off-line algorithm. We also propose
two online power-aware cache replacement algorithms. Our simulation results with both real-system
and synthetic workloads show that, compared to LRU, our online algorithms can save up to 22% more
disk energy and provide up to 64% better average response time. Even though PA-LRU and PB-LRU are
based on LRU, these techniques can also be applied to other replacement algorithms such as ARC [34]
or MQ [49]. We also evaluate the effects of different cache write policies on disk energy consumption.
Our study has some limitations that remain as our future work. First, since our study focuses on
high-end storage systems, our power-aware on-line algorithms are designed for multiple disks only. We

are still in the process of designing power-aware on-line algorithms that work for a single disk. Second,
we are in the process of adding a disk power model to our previously built V3 storage system [48] to
emulate disk spin up/spin down. This will allow us to measure energy consumption in a real storage
system. Third, we plan to combine the performance-guaranteed techniques with our power-aware cache
management and evaluate its effectiveness. Fourth, it is also interesting to investigate how to modify our
algorithm to work with a multi-speed disk which services requests at low speeds.
References
[1] IBM Enterprise Storage Server. www.storage.ibm.com/hardsoft/products/ess/ess.htm IBM Corporation, 1999.
[2] Power, heat, and sledgehammer. White paper, Maximum Institution Inc. www.max-t.com/downloads/whitepapers/
SledgehammerPowerHeat20411.pdf, 2002.
[3] Dell poweredge 6650 executive summary. http://www.tpc.org/results/individual-results/Dell/dell-6650-010603-es.pdf,
2003.
[4] L. A. Belady. A study of replacement algorithms for a virtual-storage computer. IBM Systems Journal, 5(2):78–101,
1966.
[5] B. H. Bloom. Space/time trade-offs in hash coding with allowable errors. Commun. ACM, 13(7):422–426, 1970.
[6] E. V. Carrera, E. Pinheiro, and R. Bianchini. Conserving disk energy in network servers. In Proceedings of the 17th
annual international conference on Supercomputing, pages 86–97. ACM Press, 2003.
[7] Z. Chen, Y. Zhou, and K. Li. Eviction-based cache placement for storage caches. In Proceedings of USENIX Technical
Conference, San Antonio, Texas, June 2003.
[8] D. Colarelli and D. Grunwald. Massive arrays of idle disks for storage archives. In Proceedings of the 2002 ACM/IEEE
conference on Supercomputing, pages 1–11. IEEE Computer Society Press, 2002.
[9] F. Douglis, P. Krishnan, and B. Bershad. Adaptive disk spin-down policies for mobile computers. In Proc. 2nd USENIX
Symp. on Mobile and Location-Independent Computing, 1995.
[10] EMC Corporation. Symmetrix 3000 and 5000 Enterprise Storage Systems product description guide., 1999.
[11] L. Fan, P. Cao, J. Almeida, and A. Z. Broder. Summary cache: a scalable wide-area Web cache sharing protocol.
IEEE/ACM Transactions on Networking, 8(3):281–293, 2000.
[12] G. R. Ganger, B. L. Worthington, and Y. N. Patt. The DiskSim simulation environment - version 2.0 reference manual.
citeseer.nj.nec.com/article/ganger99disksim.html.
[13] C. Gniady, Y. C. Hu, and Y.-H. Lu. Program counter based techniques for dynamic power management. In 10th
International Symposium on High Performance Computer Architecture, pages 24–35, Feb. 2004.
[14] R. A. Golding, P. B. II, C. Staelin, T. Sullivan, and J. Wilkes. Idleness is not sloth. In USENIX Winter, 1995.
[15] P. Greenawalt. Modeling power management for hard disks. In the Conference on Modeling, Analysis, and Simulation
of Computer and Telecommunication Systems, Jan 1994.
[16] S. Gurumurthi, A. Sivasubramaniam, M. Kandemir, and H. Franke. DRPM: Dynamic speed control for power manage-
ment in server class disks. In Proceedings of the International Symposium on Computer Architecture, pages 169–179,
June 2003.
[17] S. Gurumurthi, J. Zhang, A. Sivasubramaniam, M. Kandemir, H. Franke, N. Vijaykrishnan, and M. Irwin. Interplay of
energy and performance for disk arrays running transaction processing workloads. In Proceedings of the International
Symposium on Performance Analysis of Systems and Software, Mar. 2003.
[18] T. Heath, E. Pinheiro, J. Hom, U. Kremer, and R. Bianchini. Application transformations for energy and performance-
aware device management. In Proceedings of the 11th International Conference on Parallel Architectures and Compi-
lation Techniques, Sept 2002.
[19] D. P. Helmbold, D. D. E. Long, T. L. Sconyers, and B. Sherrod. Adaptive disk spin-down for mobile computers. Mobile
Networks and Applications, 5(4):285–297, 2000.
[20] M. D. Hill. Aspects of Cache Memory and Instruction Buffer Performance. PhD thesis, Unversity of Berkeley, 1987.
[21] M. D. Hill and A. J. Smith. Evaluating associativity in CPU caches. IEEE Transactions on Computers, 38(12), 1989.
[22] IBM hard disk drive - Ultrastar 36Z15. http://www.hgst.com/hdd/ultra/ul36z15.htm.
[23] S. Irani, S. Shukla, and R. Gupta. Competitive analysis of dynamic power management strategies for systems with
multiple power saving states. Technical report, UCI-ICS, Sept 2001.
[24] S. Jiang and X. Zhang. LIRS: an efficient low inter-reference recency set replacement policy to improve buffer cache
performance. In Proceedings of the International Conference on Measurement and Modeling of Computer Systems
(SIGMETRICS), pages 31–42. ACM Press, 2002.
[25] T. Johnson and D. Shasha. 2Q: A low overhead high performance buffer management replacement algorithm. In
J. Bocca, M. Jarke, and C. Zaniolo, editors, International Conference on Very Large Data Bases(VLDB), pages 439–
450, Los Altos, CA 94022, USA, 1995. Morgan Kaufmann Publishers.
[26] J. Kim, J. Choi, J. Kim, S. Noh, S. Min, Y. Cho, and C. Kim. A low-overhead high-performance unified buffer man-
agement scheme that exploits sequential and looping references. Proceedings of the Fourth Symposium on Operating
System Design and Implementation, 2000.
[27] P. Krishnan, P. M. Long, and J. S. Vitter. Adaptive disk spindown via optimal rent-to-buy in probabilistic environments.
In 12th International Conference on Machine Learning, 1995.
[28] S. T. Leutenegger and D. Dias. A modeling study of the TPC-C benchmark. SIGMOD Record, 22(2):22–31, June 1993.
[29] K. Li, R. Kumpf, P. Horton, and T. E. Anderson. A quantitative analysis of disk drive power management in portable
computers. In USENIX Winter, pages 279–291, 1994.
[30] X. Li, Z. Li, F. David, P. Zhou, Y. Zhou, S. Adve, and S. Kumar. Performance-directed energy management for main
memory and disks. In Proceedings of the Eleventh International Conference on Architectural Support for Programming
Languages and Operating Systems (ASPLOS’04), October 2004.
[31] Y.-H. Lu and G. D. Micheli. Comparing system-level power management policies. IEEE Design and Test of Computers,
18(2):10–19, March 2001.
[32] S. Martello and P. Toth. Knapsack problems: Algorithms and computer implementations. J. Wiley, Ltd., 1990.

[33] R. L. Mattson, J. Gecsei, D. Slutz, and I. L. Traiger. Evaluation techniques for storage hierarchies. IBM Systems Journal,
9(2):78–117, 1970.
[34] N. Megiddo and D. S. Modha. ARC: A self-tuning, low overhead replacement cache. In Proc. 2nd USENIX Conference
on File and Storage Technologies (FAST 03), San Franciso, CA, 2003.
[35] B. Moore. Taking the data center power and cooling challenge. Energy User News, August 27th, 2002.
[36] F. Moore. More power needed. Energy User News, Nov 25th, 2002.
[37] A. E. Papathanasiou and M. L. Scott. Increasing disk burstiness for energy efficiency. Technical report, University of
Rochester, November 2002.
[38] A. E. Papathanasiou and M. L. Scott. Energy efficient prefetching and caching. In USENIX’04 Annual Technical Conf.,
June 2004.
[39] R. H. Patterson, G. A. Gibson, E. Ginting, D. Stodolsky, and J. Zelenka. Informed prefetching and caching. In
Proceedings of the 15th ACM Symposium on Operating Systems Principles, 1995.
[40] E. Pinheiro and R. Bianchini. Energy conservation techniques for disk array-based servers. In the 18th International
Conference on Supercomputing, June 2004.
[41] C. Ruemmler and J. Wilkes. UNIX disk access patterns. In Proceedings of the Winter 1993 USENIX Conference, 1993.
[42] W.-H. Wang and J.-L. Baer. Efficient trace-driven simulation method for cache performance analysis. In Proceedings
of the 1990 ACM SIGMETRICS conference on Measurement and modeling of computer systems, pages 27–36. ACM
Press, 1990.
[43] A. Weissel, B. Beutel, and F. Bellosa. Cooperative I/O: a novel I/O semantics for energy-aware applications. volume 36,
pages 117–129. ACM Press, 2002.
[44] T. Wong and J. Wilkes. My cache or yours? making storage more exclusive. In Proceedings of the Usenix Technical
Conference, 2002.
[45] R. Youssef. RAID for mobile computers. Master’s thesis, CMU, 1995.
[46] W. Yuan and K. Nahrstedt. Energy-efficient soft real-time cpu scheduling for mobile multimedia systems. In Proceed-
ings of the nineteenth ACM symposium on Operating systems principles, pages 149–163. ACM Press, 2003.
[47] J. Zedlewski, S. Sobti, N. Garg, F. Zheng, A. Krishnamurthy, and R. Wang. Modeling hard-disk power consumption.
In Proceedings of the Second Conference on File and Storage Technologies (FAST ’03), pages 217–230, Mar. 2003.
[48] Y. Zhou, A. Bilas, S. Jagannathan, C. Dubnicki, J. F. Philbin, and K. Li. Experiences with VI communication for
database storage. In ISCA’02, May 2002.
[49] Y. Zhou, J. F. Philbin, and K. Li. The multi-queue replacement algorithm for second level buffer caches. In Proceedings
of the Usenix Technical Conference, June 2001.
[50] Q. Zhu, F. M. David, C. F. Devaraj, Z. Li, Y. Zhou, and P. Cao. Reducing energy consumption of disk storage using
power-aware cache management. In the Tenth International Symposium on High Performance Computer Architecture
(HPCA-10), Mar. 2004.
[51] Q. Zhu, A. Shankar, and Y. Zhou. Power aware storage cache replacement algorithms. In the 18th International
Conference on Supercomputing, June 2004.