power consumption analysis of constant bit rate video...
TRANSCRIPT
General rights Copyright and moral rights for the publications made accessible in the public portal are retained by the authors and/or other copyright owners and it is a condition of accessing publications that users recognise and abide by the legal requirements associated with these rights.
• Users may download and print one copy of any publication from the public portal for the purpose of private study or research. • You may not further distribute the material or use it for any profit-making activity or commercial gain • You may freely distribute the URL identifying the publication in the public portal
If you believe that this document breaches copyright please contact us providing details, and we will remove access to the work immediately and investigate your claim.
Downloaded from orbit.dtu.dk on: May 24, 2018
Power consumption analysis of constant bit rate video transmission over 3G networks
Ukhanova, Ann; Belyaev, Evgeny; Wang, Le ; Forchhammer, Søren
Published in:Computer Communications
Link to article, DOI:10.1016/j.comcom.2012.05.010
Publication date:2012
Document VersionPublisher's PDF, also known as Version of record
Link back to DTU Orbit
Citation (APA):Ukhanova, A., Belyaev, E., Wang, L., & Forchhammer, S. (2012). Power consumption analysis of constant bitrate video transmission over 3G networks. Computer Communications, 35(14), 1695-1706. DOI:10.1016/j.comcom.2012.05.010

Power consumption analysis of constant bit rate video transmission over3G networks
Anna Ukhanova a,⇑, Evgeny Belyaev b, Le Wang c, Søren Forchhammer a
a DTU Fotonik, Technical University of Denmark, Ørsteds Plads, B. 343, 2800 Kgs. Lyngby, Denmarkb Tampere University of Technology, Korkeakoulunkatu 10, 33720 Tampere, Finlandc Aalto University, P.O. Box 13000, FI-00076 Aalto, Finland
a r t i c l e i n f o
Article history:Available online 27 May 2012
Keywords:3GVideo transmissionConstant bit ratePower consumption modelingPower saving
a b s t r a c t
This paper presents an analysis of the power consumption of video data transmission with constant bitrate over 3G mobile wireless networks. The work includes the description of the radio resource controltransition state machine in 3G networks, followed by a detailed power consumption analysis and mea-surements of the radio link power consumption. Based on this description and analysis, we proposeour power consumption model. The power model was evaluated on a smartphone Nokia N900, which fol-lows 3GPP Release 5 and 6 supporting HSDPA/HSUPA data bearers. We also propose a method for param-eter selection for the 3GPP transition state machine that allows to decrease power consumption on amobile device taking signaling traffic, buffer size and latency restrictions into account. Furthermore,we discuss the gain in power consumption vs. PSNR for transmitted video and show the possibility of per-forming power consumption management based on the requirements for the video quality.
� 2012 Elsevier B.V. All rights reserved.
1. Introduction
Wireless networks have gone through an extensive develop-ment throughout the recent years. After the Internet, in the1990s, came the second generation wireless systems with addi-tional features for communication by means of cellular phones.With the move from analog (1G) to digital transmission (2G), thecapacity of the cellular systems have been significantly improved.Further demand for greater bandwidth resulted in the develop-ment of third generation mobile telecommunications (3G), provid-ing a mobile broadband access to handheld devices.
The number of mobile cellular subscriptions has also been rap-idly growing in the last decade, and now the rough estimate has al-most reached 6 billions. Nowadays 3G systems are also becomingubiquitous: the number of active mobile-broadband subscriptionsreaches almost 1.2 billion [1]. As wireless communication technol-ogy advances, in new generation mobile phones 3G networks pro-vide a large amount of various services including high data rateInternet access, videoconferencing, global positioning, high qualitymusic and video downloading, and gaming capabilities.
Mobile TV and video-on-demand services are also rising in pop-ularity and expected to be a significant driver for the wireless con-sumer industry. Consumers demand for video data, quality of
experience of mobile multimedia and its usability is pushing thedevelopment of Mobile TV and related services. Therefore, videotransmission for mobile terminals is a major application in the3G and beyond systems and may play a key role in their success[2]. According to Cisco research, ‘‘two-thirds of the world’s mobiledata traffic will be video by 2015’’ [3]. As a consequence, theseadditional features are bringing the power consumption of mobilephones to the level of desktop computers. However, the lack of aconstant power supply and limited battery capacity [4] pose strictlimits to the overall power consumption of the device. Therefore,minimization of the power consumption of wireless devices is agreat challenge for the entire electronic industry, at all system lev-els. Hence, an intense research in this field has focused on powermanagement [5–7].
In our work we analyze the power consumption in case of up-link transmission, show how the power consumption depends onthe transmission parameters and explain how it can be reducedby optimizing the power management policy. We analyze the caseswith buffer and latency restrictions and show how to choose trans-mission parameters in these scenarios. Due to the growing interestin various mobile video applications, the analysis is then extendedto the case of constant bit rate video transmission. Experimentalresults show that in this case the proposed solution allows to savepower on video transmission if compared to the conventionalapproach.
Our paper starts with a review of some prior work on the powerconsumption in wireless networks in Section 2. Then we present
0140-3664/$ - see front matter � 2012 Elsevier B.V. All rights reserved.http://dx.doi.org/10.1016/j.comcom.2012.05.010
⇑ Corresponding author. Tel.: +45 45256567, mobile: +45 50679631; fax: +4545936581.
E-mail address: [email protected] (A. Ukhanova).
Computer Communications 35 (2012) 1695–1706
Contents lists available at SciVerse ScienceDirect
Computer Communications
journal homepage: www.elsevier .com/locate /comcom

the 3G mobile transmission system in Section 3, where weexplain the idea of state machine applied to mobile devices and de-scribe the communication between transmitter and receiver. InSection 4 the state power model is provided, with particular focuson Cell_FACH (Cell Forward Access Channel) and Cell_DCH (CellDedicated Channel) states. We propose a model of power consump-tion in Cell_DCH state and show that power consumption is relatedto the packet size and transmission interval. In Section 5 we proposea method of parameter selection for the 3GPP transition state ma-chine that allows to decrease power consumption on the mobile de-vice in case of constant bit rate data transmission. Section 6 presentsthe power consumption for constant bit rate video transmission andprovides the results for trade-off between video quality and powerconsumption for several standard test video sequences.
2. Power consumption in wireless networks
There exists a large number of approaches for power manage-ment in communication networks for handheld devices and theyhave been studied throughout the recent years.
An overview of the methods to reduce the large and growingenergy consumption of the Internet was provided in [8]. However,since that time the Internet has been adopted and widely used inmany other devices other than networked desktop computers,and deployment of next generation networks in the mobile deviceshas significantly contributed to it.
Yeh et al. [9] as well as Sklavos and Touliou [10] provided ananalysis of power consumption in 3G networks. Markov chainsare used in [9] to analyze the 3GPP transition state machine andexamine how different timer values affect the power consumptionof the device. The analysis is based on several assumptions aboutthe device power consumption in different states. Sklavos andTouliou [10] considered different units of the mobile phone (suchas memory, display, cellular engine), analyzed power consumptionon each of them and addressed different power management tech-niques for different units, thereby focusing on the device powerconsumption. They also state the need for power control tech-niques, e.g. based on method of idling the modules that are notused. A similar approach of dividing the processes in stages andapplying different power saving mechanisms to them is describedin [11]. For the reception stage, which requires most of the power,the solution is to send multimedia data in larger amounts at lessfrequent intervals by hiding the traffic temporarily from a mobilestation, thus allowing it to sleep longer and achieve power savings.Korhonen and Wang [12] also proved that in IEEE 802.11 power ofthe receiver can be saved if data packets are transmitted as bursts.
Perrucci [5] provided a broad overview of existing approachesand studied the strategies for efficient use of the wireless commu-nication in three main focus areas, namely Cross Layer, OverlayNetworks and Cooperation. The energy savings on mobile devicesare achieved by choosing the most efficient available network,using wake-up systems (described in detail in [13]) and sharingcellular links between mobile users. Another analysis of ap-proaches for achieving energy-efficient web access on mobile de-vices is provided in [14].
Two good overviews of the past and future research directions inthe field of power management for mobile networks are given in[6,7]. In [6] the mobile device and battery capacity evolutions, mul-tiaccess nature of modern mobile devices and the respective impli-cations for power management are described, as well as a proposalof an information-centric approach to networking, which allowsaudio/video streaming to be transformed from an energy-heavynetwork service to a lightweight one. However, the last would re-quire an adoption of a new networking paradigm and a change inthe way the information is distributed to its intended recipients.
Zhang et al. [7] provided a survey of many issues related topower-aware mobile multimedia, such as power-management formobile devices, rate-distortion-complexity optimized video codecdesign, and computational complexity and power aware cross-layer design and optimization. The authors have pointed out thechallenges and the corresponding future research directions inpower-aware video coding and power-aware video delivery, suchas power management in mobile devices, rate-distortion-complex-ity analysis of video codecs and network information feedback andcross-layer signaling.
Considering wireless video transmission from mobile devices, itis necessary to take into account that some energy has to be spenton the video capturing and compression. On average, a mobilecamera may consume less than 60 mW for CIF resolution videoat 30 Hz [15]. According to [16], the power needed for compressionis also lower than the one needed for the transmission. Neverthe-less, cross-layer approaches could be applied here as well and worklike [17] discusses joint power control and bit allocation for videotransmission in wireless networks. A good overview of works onthis topic is also given in [18].
Chen et al. [19] described the fundamental trade-offs in wirelessnetworks, such as deployment efficiency – energy efficiency, spec-trum efficiency – energy efficiency, bandwidth – power, and delay– power trade-offs. Kim et al. [20] and Vuyst et al. [21] explored thetrade-offs between delay and power consumption for sleep-modeoperation in mobile WiMAX. In [22,23] the possibility for trade-off between video quality and power saving in the receiver wasdemonstrated. In [22] the mobile broadcast standard DVB-H alongwith JPEG2000 for video encoding was used to show how to allowreceivers to control the level of power consumption depending onthe priorities. As any other scalable codec could be used instead ofJPEG2000, the work was further extended to the Scalable Extensionof H.264/AVC [23].
Unlike the work in [22,23], this time we consider the case ofpower consumption for the uplink transmission only and therebyfocus on the device. However, the main idea – that it is possibleto control the trade-off between the level of power consumptionand video quality – has been kept. Moreover, we also take the delay– power trade-off into account and show how it influences theachieved power savings. We provide a power model for devicesfor 3G systems, and perform power-aware cross-layer optimiza-tion by controlling the transmission parameters and adjustingthe time periods spent by the mobile device in the state with activedata transmission. We also show the potential for power manage-ment for video transmission that is content-dependent as differentvideos can have different rate-distortion characteristics.
3. Mobile transmission system overview
3G systems provide global communication with various ser-vices including telephony, messaging and access to Internet. 3Gnetworks consist of three domains: Core Network (CN), UMTSTerrestrial Radio Access Network (UTRAN) and User Equipment(UE). UE interoperates with Base Station (called Node B). The RadioResource Control (RRC) handles the control plane signaling be-tween the UEs and the UTRAN. For efficient use of radio resourcesand power consumption control, RRC introduces a state machinefor UE [24].
3.1. State machine
There are five states in the RRC: Idle, Cell_FACH (Cell ForwardAccess Channel), Cell_PCH (Cell Paging Channel), Cell_DCH (CellDedicated Channel) and URA_PCH (Utran Registration Area PagingChannel). Cell_PCH and URA_PCH can be considered as low power
1696 A. Ukhanova et al. / Computer Communications 35 (2012) 1695–1706

states, which consume only around 30 mW. The state of Cell_FACHconsumes around 400 mW and the state of Cell_DCH consumesaround 800 mW, according to our measurements on a smartphoneNokia N900. URA_PCH is very similar to Cell_PCH, although somevendors have not implemented it in their solution. In our workwe consider these two states largely equivalent.
The power consumption in Cell_FACH is roughly 50% of that inCell_DCH, and Cell_PCH state uses about 1–2% of the power con-sumption of Cell_DCH state [25]. Each state is now described inmore detail.
Idle. In this mode UE does not communicate with the networkalthough it does listen for broadcast messages. So it does not havea RRC Connection, but UE can still have an IP address and bereached by paging. In this state the mobile device consumes theleast amount of power.
Cell_PCH. In this state the channel is shared by all mobile de-vices so the inclusion of an additional mobile device does not haveany impact on the network. UE monitors paging messages from theRadio Network Controller (RNC). As in the Idle state, the powerconsumption is very small. In this state no dedicated physicalchannel is allocated to the UE, so no uplink activity is possible.
Cell_FACH. In the Cell_FACH the mobile device communicateswith the network via a shared channel. A few bits of data can betransmitted at a relatively low data rate, on the order of up to16 kbps in the uplink. The maximum amount of transmission dataalso depends on the overall loading of the common channels. Atthe same time the UE continuously monitors a FACH in the down-link. The mobile device power consumption is higher than it is inIdle or Cell_PCH states.
Cell_DCH. The mobile device is allocated a dedicated transportchannel both in downlink and uplink. It consumes the most net-work resources and the impact on the battery is at the very highlevel.
3.2. Communication between transmitter and receiver
It is UE that always initiates the RRC connection, then the estab-lishment and the release are handled by the RRC protocol. UE startsworking in Idle state, when an RRC connection has not yet beenestablished. Only one RRC connection is used at any time betweenthe UE and the network. When an RRC connection has been estab-lished between UE and Node B together with RNC, the Idle stateswitches to the RRC Connected mode.
To be more precise, from Idle mode through establishment of anRRC connection the UE enters the Cell_DCH state. Further it can bemoved by explicit signaling from Cell_DCH to other states. The UEdoes not generally listen to the broadcast channel in this state. IfNode B allocates to UE a common or shared traffic channel (i.e.,the channel is shared by several UEs), it enters Cell_FACH state.The data communication activities can only be performed in thesetwo states.
Depending on the activities of the UE and traffic volume, statescould be changed. Signaling messages (radio bearer configurationmessages) are sent between UE and Node B when states are chang-ing. Three timers are used to detect when a mobile device shouldmove to a lower power state in case of inactivity. These inactivitytimers T1, T2, and T3 are managed by RNC.
T1 is used in Cell_PCH. After T1 seconds (usually a very longtimer), the RRC connection will be released and the state will bechanged to Idle. T2 is an inactivity timer determining how longthe 3G device should remain in Cell_FACH state without any activ-ity. Timer T3 is used within Cell_DCH state and refers to the inac-tivity period after which the 3G device enters Cell_FACH.
As for the signaling traffic i.e. messages between UE and Node B,it is necessary to note that 3G was designed and implemented tosupport large amounts of data traffic (like long, uninterrupted data
sessions, video conferencing, etc.). But according to Thelander, CEOand founder of Signals Research Group (SRG), the reality is that‘‘signaling traffic is outpacing actual mobile data traffic by 30–50%, if not higher’’ [26].
4. Power consumption analysis of transition states
In this section, the power consumption of each state of the RRCis analyzed. We focus on modeling the power consumption inCell_DCH state. Then, our proposed model is compared with realmeasurements and a reference model which thoroughly analyzespower consumption for UDP traffic in 3G network and providespractical power model for the consumption.
4.1. The influence of packet sending intervals and packet size on powerconsumption of Cell_DCH state
Each RRC state requires varying power to maintain operationand differs when generating signals transferred between UEand RNC to establish, maintain and release connections as wellas transmit/receive data across the air interface. Compared toCell_FACH state, which is only applicable for transferring relativelysmall quantities of data, Cell_DCH state gives potential for UE totransfer large quantities of data and, thus, is the state where mostof the data communication happens, as specifically described inthe previous section. It is the most interesting state to examinethe effect of packet sending intervals and packet size on powerconsumption of UE radio interface.
Generally speaking, the size of a transport block specifies themaximum payload that can be transmitted within each Transmis-sion Time Interval (TTI), which decides the maximum packet send-ing or receiving rate. These two parameters together influence themaximum throughput and packet sending or receiving pattern inthe Physical layer. From the Transport layer perspective, applica-tion’s traffic pattern – namely packet sending or receiving intervaland packet size – directly decides underlaying layer’s behaviorregarding the size of transport block set and transmitting interval.Specifically, if the number of bits in a TTI is larger than the maxi-mum size which one physical block can contain, segmentation isperformed and the over-sized bits are sent during the next TTI. Ifthe packets are generated with an interval which is less than TTI,the transmitting interval is decided by TTI. Otherwise, it is decidedby the packet generating interval of the application. The powerconsumption of a radio interface increases proportionally to thenumber of transport block sets sent and received over one radiointerface.
Fig. 1 demonstrates the power consumption of packet transmis-sion on a smartphone Nokia N900 in downlink. A traffic generatoris used to generate UDP packets in different intervals as shown inthe figure. Each peak corresponds to the power consumption oftransmitting one transport block set. As it can be seen, the numberof peaks directly influences the power consumption of the radiointerface. A faster receiving interval leads to a larger number ofpeaks, and thus higher power consumption. In our experiments,we also observed the same phenomena in uplink on Nokia N900.Among the peaks, wide ones are due to the power consumptionof daemon processes of 3G modem and excluded from calculationin the following subsections. The power consumption was mea-sured in a stable environment. Otherwise, when the signal qualityof UE drops off or the UE moves away from the Node B, power con-trol mechanisms in 3G network have to increase transmissionpower in order to keep the received uplink Signal-to-InterferenceRatio (SIR) at a given SIR target. Moreover, the degradation of sig-nal quality also increases MAC layer retransmission, which leads tomore energy consumption for successful transmission of one bit.
A. Ukhanova et al. / Computer Communications 35 (2012) 1695–1706 1697
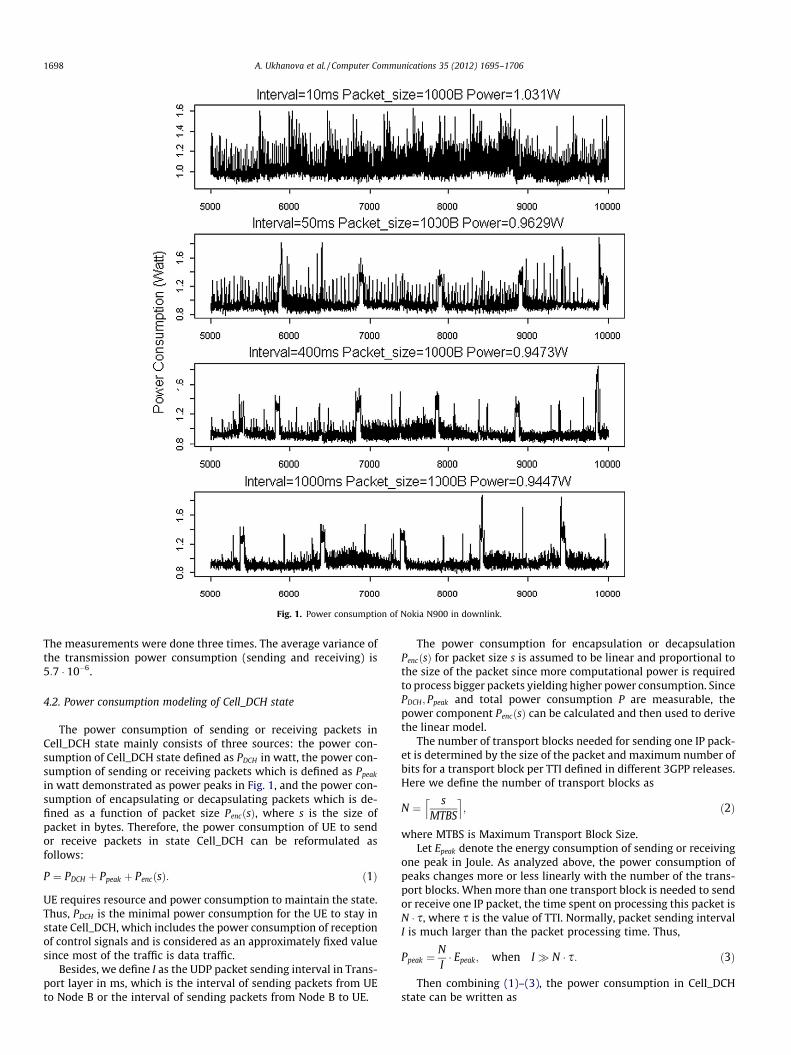
The measurements were done three times. The average variance ofthe transmission power consumption (sending and receiving) is5:7 � 10�6.
4.2. Power consumption modeling of Cell_DCH state
The power consumption of sending or receiving packets inCell_DCH state mainly consists of three sources: the power con-sumption of Cell_DCH state defined as PDCH in watt, the power con-sumption of sending or receiving packets which is defined as Ppeak
in watt demonstrated as power peaks in Fig. 1, and the power con-sumption of encapsulating or decapsulating packets which is de-fined as a function of packet size PencðsÞ, where s is the size ofpacket in bytes. Therefore, the power consumption of UE to sendor receive packets in state Cell_DCH can be reformulated asfollows:
P ¼ PDCH þ Ppeak þ PencðsÞ: ð1Þ
UE requires resource and power consumption to maintain the state.Thus, PDCH is the minimal power consumption for the UE to stay instate Cell_DCH, which includes the power consumption of receptionof control signals and is considered as an approximately fixed valuesince most of the traffic is data traffic.
Besides, we define I as the UDP packet sending interval in Trans-port layer in ms, which is the interval of sending packets from UEto Node B or the interval of sending packets from Node B to UE.
The power consumption for encapsulation or decapsulationPencðsÞ for packet size s is assumed to be linear and proportional tothe size of the packet since more computational power is requiredto process bigger packets yielding higher power consumption. SincePDCH; Ppeak and total power consumption P are measurable, thepower component PencðsÞ can be calculated and then used to derivethe linear model.
The number of transport blocks needed for sending one IP pack-et is determined by the size of the packet and maximum number ofbits for a transport block per TTI defined in different 3GPP releases.Here we define the number of transport blocks as
N ¼ sMTBS
l m; ð2Þ
where MTBS is Maximum Transport Block Size.Let Epeak denote the energy consumption of sending or receiving
one peak in Joule. As analyzed above, the power consumption ofpeaks changes more or less linearly with the number of the trans-port blocks. When more than one transport block is needed to sendor receive one IP packet, the time spent on processing this packet isN � s, where s is the value of TTI. Normally, packet sending intervalI is much larger than the packet processing time. Thus,
Ppeak ¼NI� Epeak; when I� N � s: ð3Þ
Then combining (1)–(3), the power consumption in Cell_DCHstate can be written as
Fig. 1. Power consumption of Nokia N900 in downlink.
1698 A. Ukhanova et al. / Computer Communications 35 (2012) 1695–1706

P ¼ PDCH þEpeak
Is
MTBS
l m� �þ PencðsÞ: ð4Þ
Eq. (4) formulates the power consumption of one connection ofuplink or downlink traffic. This model shows that power consump-tion can be determined by the number of peaks, namely set bypacket sending or receiving interval I and packet size s, which isthe influential factor of power consumption of the radio interface.This model can be extended to formulate the power consumptionfor multiple connections by counting the amount of bits sent or re-ceived in a certain interval. As long as mobile devices are capable torecord transmitted and received packet intervals and sizes, theproposed model can be extended to estimate power consumptionof the radio interface in runtime.
4.3. Experimental setup
In order to have sufficient measurement accuracy and an unin-terrupted power source, the battery of the N900 was replaced witha battery adapter, which was serially connected to a 4.1 V DCpower supply and a 0.1 Ohm resistor. A NI cRIO-9215 was thenused as a data logger to record voltage fluctuations of the N900at a sample rate of 1000 sample/s. A Linux traffic generator wasalso used to generate packets with various packet sizes and send-ing intervals. UDP traffic was generated instead of TCP to avoid TCPhand-shake and retransmissions. The packet sending interval ran-ged from 10 ms to 1000 ms to avoid UE switching to Cell_FACHstate. The packet size ranged from 10 bytes to 1500 bytes, whichis the typical Maximum Transmission Unit (MTU) for Ethernet.When measuring the power consumption of sending packets, theUDP packets generated on the N900 were sent to Node B via uplink,and then forwarded to the Linux server. When measuring thepower consumption of receiving packets, the UDP packets weregenerated on the Linux server and received by the N900 indownlink.
4.4. Evaluation of power models
The power model was evaluated on Nokia N900, which followsa 3GPP Release 5 and 6 supporting HSDPA/HSUPA data bearers. Themeasured average energy consumption of peak Epeak, averagepower consumption in Cell_DCH PDCH and related parametersneeded for (1) are listed in Table 1. Through (4), the power con-sumption of sending or receiving packets is thereby decided by Iand s.
In order to evaluate our model, we use another power con-sumption model, which is based on the assumption that powerconsumption is linear in the data rate r [27]. The referenced modeldesignates two independent variables.
� Time of data communication.� Amount of data sent or received during the communication.
The energy consumption of UDP-type session, therefore, is ex-pressed as follows.
E ¼ t � ðrt þ r � rdÞ þ c; ð5Þ
where rd is the energy consumption rate for data in Joule/KByte, rt ispower consumption in Watt, r is data rate, t is transmission time insecond and constant c represents the offset term of the energy con-sumption, which is independent of the process duration. The modelis introduced as a general equation of energy consumption to de-scribe UDP-type of data session. In order to compare it with ourpower consumption model, the equation needs to be divided bytime t. The power consumption model can be formulated as a linearequation.
Table 1Parameters for the experiment applied on Nokia N900.
Uplink Downlink
UE category HSUPA category 5 HSDPA category 5TTI 10 ms 2 msMaximum Transport
Block Size (MTBS)20000 bits 7298 bits
Data rate 2 Mbit/sa 2 Mbit/sEpeak 0.4532E�3 J 0.4435E�3 JPDCH 0.8556 W 0.8478 W
a Note: The uplink data rate is limited to 2 Mbit/s due to the type of data packet.The maximum data rate is 3.65 Mbit/s.
840
860
880
900
920
940
960
980
10 200 400 600 800 1000 1200 1400Packet size, Byte
Pow
er C
onsu
mpt
ion,
mW
Experimental data
Proposed model
Reference power model [21]
Fig. 2. Uplink power consumption for experiment, proposed model and referencemodel for time interval = 10 ms.
820
840
860
880
900
920
940
960
980
1000
1020
10 200 400 600 800 1000 1200 1400Packet size, Byte
Pow
erC
onsu
mpt
ion ,
mW
Experimental data
Proposed model
Reference power model [21]
Fig. 3. Downlink power consumption for experiment, proposed model and refer-ence model for time interval = 10 ms.
A. Ukhanova et al. / Computer Communications 35 (2012) 1695–1706 1699

P ¼ rt þ r � rd: ð6Þ
The fitted values of the proposed model and reference model,and the measured values from experiments are shown in Figs. 2and 3. To compare two models, rate r in the reference model isexpressed as the product of packet size s and packet sendingfrequency I�1 such that two models share the same coordinate.Our proposed model shows a better approximation than the refer-ence model. We also compared the two models with their MeanAbsolute Percentage Error (MAPE) for downlink and uplink powerconsumption, which is defined as follows.
MAPE ¼ 1n�Xn
i¼0
jAi � FijAi
; ð7Þ
where n is the number of measured values of power consumption,Ai is the actual value and Fi is the fitted value. The MAPEs of the pro-posed model is 5.0% for downlink and 4.7% for uplink power con-sumption, which is about 28% more accurate than that of thereference model.
5. Uplink power consumption analysis of transition statemachine
Section 5 provides the uplink power consumption analysis ofthe transition state machine (TSM) described in Section 3. As weconsider constant bit rate sources (in contrast to http-like datasources, modeled e.g. as Poisson source traffic [28]), it is easy topredict the source rate and find optimal parameters for TSM tominimize the uplink power consumption. This section starts withan evaluation of power consumption for ideal transition state ma-chine. Further this ideal TSM is used for parameter selection for3GPP TSM, and the differences between these two TSMs are alsodescribed. The paper continues with the analysis of the TSM andparameter selection in case for different limitations: the limitationfor the amount of signaling traffic (Section 5.3), the limitations forthe amount of signaling traffic and buffer size (Section 5.4), and thelimitations for the amount of signaling traffic and buffering latency(Section 5.5). The corresponding results for power savings in thesecases are presented on the figures in this Section.
5.1. Power consumption for ideal transition state machine
Let P denote the uplink power consumption of mobile device, rthe data source bit rate and c the channel bit rate. The optimal TSMhas to correspond to the following optimization task:
minimize P;
c P r:
�ð8Þ
Let us define BRLC as the uplink data buffer of UE, BTRLC as the buf-
fer threshold and tinact as the inactivity time. Then, the followingideal TSM can be introduced:
State 1 (Cell_PCH).If activity detection, then go to State 2,else go to State 1.
State 2 (Cell_FACH).If BRLC > BT
RLC , then go to State 3,else if tinact > T2, then go to State 1,else go to State 2.
State 3 (Cell_DCH).If BRLC ¼ 0, then go to State 2,else go to State 3.
Let us define p1; p2 and p3 as the power consumption in State 1,State 2 and State 3 respectively and c2 and c3 as channel rate in
State 2 and State 3. The power consumption of this TSM dependingon the data source bit rate r can be described as follows. If data rater ¼ 0, then UE is always working in State 1 and power consumptionis p1. If 0 < r 6 c2, then UE is always working in State 2 and haspower consumption p2. If r P c3, then UE is always working inState 3 and has power consumption p3. If c2 < r < c3 then thereis buffer accumulation in State 2 and buffer emptying in State 3.Accumulation time in State 2 is
t2 ¼BT
RLC
r � c2: ð9Þ
Emptying time in State 3 is
t3 ¼BT
RLC
c3 � r: ð10Þ
Finally, power consumption for the ideal TSM is:
P ¼
p1; if r ¼ 0;p2; if 0 < r 6 c2;
t2t2þt3� p2 þ t3
t2þt3� p3; if c2 < r < c3;
p3; otherwise:
8>>><>>>:
ð11Þ
Theorem 1. The state machine described above is a solution of theoptimization task (8) for data source bit rate r 2 ðc2; c3Þ.
Proof. From (11) it follows that for ideal TSM the channel ratec ¼ r for r 2 ðc2; c3Þ. Let us assume that another TSM with powerconsumption P0 < P exists. It is possible only if accumulation timet02 in State 2 for this TSM is more than the accumulation time t2 inState 2 for ideal TSM. But in this case channel rate c0 for this TSMwill be less than r. It means that this TSM does not exist. h
5.2. Power consumption for the 3GPP transition state machine
The ideal TSM can be used to select the parameters for 3GPPTSM [29]: BT
RLC which was defined in previous subsection and timerT3. Then 3GPP TSM differs from the ideal TSM only in State 3, thatcan be described as follows (see Fig. 4):
State 3 (Cell_DCH).If r < c3 more than T3 sec, then go to State 2,else go to State 3.
If data rate r ¼ 0, then UE is always working in State 1 andpower consumption is p1. If 0 < r 6 c2, then UE is always workingin State 2 and has power consumption p2. If r P c3, then UE is al-ways working in State 3 and has power consumption p3. Ifc2 < r < c3 then there is buffer accumulation in State 2 and bufferemptying in State 3. Finally, a power consumption model for 3GPPTSM is given by (11) with accumulation time in State 2
1 2 3
If active
If inactivitytime is morethan T2 sec
otherwise
If BRLC > BTRLC
If r < c3 for morethan T3 sec
otherwiseIf inactive
Cell_PCH Cell_FACH Cell_DCH
Fig. 4. 3GPP transition state machine.
1700 A. Ukhanova et al. / Computer Communications 35 (2012) 1695–1706

t2 ¼minfBT
RLC ; ðc3 � rÞ � T3gr � c2
ð12Þ
and emptying time in State 3 t3 ¼ T3.From Theorem 1 follows that if parameters T3 and BT
RLC of 3GPPTSM satisfy the equation
BTRLC ¼ ðc3 � rÞ � T3; ð13Þ
then 3GPP TSM is identical to ideal TSM and it is a solution of theoptimization task (8) too.
Figs. 5 and 6 show power consumption for TSM with experi-mentally obtained parameters and parameters for carrier 1 listed
in [24] and compared with TSM with proposed parameters se-lected using (13) for constant bit rate data. In fact, the parametersdepend on the operator; some additional data and discussionscould be found in [30]). These figures illustrate that with the pro-posed parameter selection the power consumption is growing lin-early with the growth of bit rate, which allows a significantdecrease of uplink power consumption of UE.
5.3. Parameter selection taking signaling traffic into account
As was mentioned in Section 3, one of the problems for 3G net-works is the increasing amount of the signaling traffic [31,32,24],as each time UE moves between the various RRC states it ex-changes signaling messages with the mobile network for mobilityand radio resource management. In this subsection we show thepossibility of controlling the total signaling traffic on the basestation.
Let us define n23 as the number of signaling messages needed tobe transmitted from UE to base station for the transition from State2 to State 3 and n32 as the one needed for the transition from State3 to State 2 and ns as the number of signaling messages per secondfor UE. Then, optimization task (8) can be modified as follows:
minimize P;
c P r;
ns 6 N�s ;
8><>: ð14Þ
where N�s > 0 is a maximum allowed number of signaling messagesper second for UE.
If c2 < r < c3 the UE works in State 2 and State 3 only. In case ofconstant bit rate transmission all working time can be divided intothe equal intervals t2 þ t3 seconds (see Fig. 7). The number of trans-mitted signaling messages in each interval is a sum of transitionsignaling messages for both states n23 þ n32. Therefore the numberof signaling messages per second can be calculated as
ns ¼n23 þ n32
t2 þ t36 N�s : ð15Þ
Combining (9), (10) and (15), it follows:
BTRLC P
ðn23 þ n32Þ � ðr � c2Þ � ðc3 � rÞN�s � ðc3 � c2Þ
: ð16Þ
The maximum needed BTRLC is
maxr
BTRLC ¼
ðn23 þ n32Þ � ðc3 � c2Þ4 � N�s
: ð17Þ
From (17) follows that 3GPP TSM is a solution of (14) if
BTRLC ¼
ðn23 þ n32Þ � ðc3 � c2Þ4 � N�s
;
T3 ¼BT
RLC
c3 � r:
8>>><>>>:
ð18Þ
In case of constant bit rate data transmission, (18) allows tocontrol the total network signaling traffic on the base station byselecting N�s for each UE.
5.4. Parameter selection taking signaling traffic and UE buffer sizerestrictions into account
In real applications the UE buffer size can be limited dependingon device properties. In this case, it is important to comply withthis limitation while choosing the parameters for the transmissionin the proposed method. Taking into account buffer size restric-tions, the optimization task (14) can be modified as follows:
300
400
500
600
700
800
900
0 400 800 1200 1600 2000Data bit rate, kbps
TSM with proposed parameters
TSM with parameters listed in [24]
300
400
500
600
700
800
900
0 400 800 1200 1600 2000
Pow
er c
onsu
mpt
ion,
mW
TSM with proposed parameters
TSM with parameters from experiment
Fig. 5. Uplink power consumption for transition state machine for constant bit ratedata transmission, c2 ¼ 16 kbps, c3 ¼ 2000 kbps, BRLC ¼ 8 kB, T3 ¼ 9 s, p2 ¼ 400mW, p3 ¼ 890 mW.
300
400
500
600
700
800
900
0 400 800 1200 1600 2000Data bit rate, kbps
Pow
erco
nsum
ptio
n,m
W
TSM with proposed parameters
TSM with parameters listed in [24]
Fig. 6. Uplink power consumption for transition state machine for constant bit ratedata transmission, c2 ¼ 16 kbps, c3 ¼ 2000 kbps, BRLC ¼ 543 B, T3 ¼ 5 s,p2 ¼ 460 mW, p3 ¼ 800 mW.
A. Ukhanova et al. / Computer Communications 35 (2012) 1695–1706 1701

minimize P;
c P r;
ns 6 N�s ;
BTRLC 6 Bmax
RLC ;
8>>><>>>:
ð19Þ
where BmaxRLC is the maximum possible UE buffer size.
Taking into account buffer size restrictions, the working time ofUE in State 2 is
t2 ¼Bmax
RLC
r � c2: ð20Þ
At the same time the working time of UE in State 3 can be written as
t3 ¼Bmax
RLC
c3 � rþ Dt3; ð21Þ
where Dt3 P 0 is an additional time needed to provide the maxi-mum allowed number of signaling messages per second N�s .
Taking into account (15), (20) and (21), the additional time hasto satisfy the following inequality:
Dt3 Pn32 þ n23
N�s� Bmax
RLC
r � c2� Bmax
RLC
c3 � r: ð22Þ
To minimize the power consumption and provide c ¼ r theinequality in (22) should be written as equality. As a result, forc2 < r < c3 3GPP TSM will be a solution of (19) if
BTRLC ¼ Bmax
RLC ;
T3 ¼ BmaxRLC
c3�r þmax 0; n32þn23N�s� Bmax
RLCr�c2� Bmax
RLCc3�r
n o:
8<: ð23Þ
Figs. 8 and 9 show the comparison between the power con-sumption for systems with TSM without any restrictions and withdifferent buffer limitations. Formula (23) shows that with the in-crease of restricted N�s the time portion of working in State 2 be-comes closer to the maximum possible value without restrictions(18). For low values of N�s there is an opposite situation, and theUE should stay longer in State 3, therefore the gain in power con-sumption savings is lower. For N�s ¼ 2 only the curve for Bmax
RLC ¼200 kB differs from the one without restrictions. That means thevalue of N�s is high enough to adapt the parameter values, unlessthe buffer becomes too small to keep the UE in State 2 long enough.Thus, the result of the gain in power consumption savings withbuffer restrictions depends on the current situation in the networkand limitations on N�s , imposed by the network operator.
5.5. Parameter selection taking signaling traffic and buffering latencyrestrictions into account
Another important restriction is buffering latency DT, which hasa significant meaning for real-time wireless communications. Nec-essary requirement for conversational services is an end-to-enddelay smaller than 250 ms [33], but, according to [34], the desireddelay in real time video applications is approximately 40 ms. Fornon-real time video applications the limit value is higher andshould not be greater than 10 s, as stated in [35]. This limitation
for buffering latency also influences our method for efficient powersavings.
Taking buffering latency restriction into account, the optimiza-tion task (14) can be modified as follows:
n23 n23n32 n32
t2 t2t3 t3BRLC = 0BRLC > BT
RLC BRLC > BTRLC BRLC = 0
full interval full interval
Fig. 7. Amount of signaling traffic for a transmission interval.
300
400
500
600
700
800
900
0 400 800 1200 1600 2000
Data bit rate, kbps
Pow
er c
onsu
mpt
ion,
mW
Proposed TSM without restrictionsProposed TSM, B_RL = 1100 kBProposed TSM, B_RL = 750 kBProposed TSM, B_RL = 500 kBProposed TSM, B_RL = 200 kB
maxRLCBmaxRLCBmaxRLCBmaxRLCB
Fig. 8. Power consumption with buffer restrictions and N�s = 0.4.
300
400
500
600
700
800
900
0 400 800 1200 1600 2000
Data bit rate, kbps
Pow
er c
onsu
mpt
ion,
mW
Proposed TSM without restrictionsProposed TSM, B_RL = 1100 kBProposed TSM, B_RL = 750 kBProposed TSM, B_RL = 500 kBProposed TSM, B_RL = 200 kB
maxRLCBmaxRLCBmaxRLCBmaxRLCB
Fig. 9. Power consumption with buffer restrictions and N�s = 2.
1702 A. Ukhanova et al. / Computer Communications 35 (2012) 1695–1706

minimize P;
c P r;
ns 6 N�s ;
DT 6 L;
8>>><>>>:
ð24Þ
where L is a buffering latency restriction.Taking this restriction into account, the working time of UE in
State 2 is
t2 ¼ L: ð25Þ
At the same time the working time of UE in State 3 can be written as
t3 ¼L � ðr � c2Þ
c3 � rþ Dt3; ð26Þ
where Dt3 P 0 is an additional time needed to provide the maxi-mum allowed number of signaling messages per second N�s . Taking(15) into account, Dt3 has to satisfy the following inequality:
Dt3 Pn32 þ n23
N�s� L� L � ðr � c2Þ
c3 � r: ð27Þ
In order to minimize the power consumption and provide c ¼ r,the inequality in (27) should be written as equality. As a result, forc2 < r < c3 3GPP TSM will be a solution of (24) if
BTRLC ¼ L � ðr � c2Þ;
T3 ¼ BTRLC
c3�r þmax 0; n32þn23N�s� L� L�ðr�c2Þ
c3�r
n o:
8<: ð28Þ
Figs. 10 and 11 show the comparison between the power con-sumption for system with TSM without any restrictions and TSMwith different latency limitations. As in the case with buffer limita-tions, (28) shows that with the increase of N�s , the time portion ofworking in State 2 can come closer to the maximum possible valuewithout restrictions, defined by (18). Instead, low values of N�smean that the UE will work more in State 3, and there is a smallergain in power consumption savings compared to the case withoutany restrictions. For N�s ¼ 2 a significant gain can be obtained forlatencies bigger than 5 s. On one hand, this is caused by the factthat limitation on latency allows for UE to stay in State 2 long en-ough to achieve the decrease of power consumption. At the sametime, due to a reasonably high value of N�s , the UE can also moveto State 3 and come back to State 2 after transmission often en-
ough. So, generally speaking for the case with latency restrictions,as well as for the case with buffer limitations, the resulting gain inpower consumption savings depends on the limitations on N�s .
6. Energy efficient constant bit rate video transmission over3GPP networks
In this section the analysis of video transmission over 3G net-works is presented. We are focusing our research on power con-sumption of constant bit rate video only. One source of constantbit rate video data is a single-layer codec with rate control mech-anism that helps to achieve constant bit rate of the compressed vi-deo data [36,37]. Constant bit rate transmission of variable bit ratestored video may be performed e.g. with the optimal choice of buf-fer size [38].
The system in general can operate as described on the Fig. 12.The UE decides the power saving mode according to its needs,and based on it the power saving controller chooses the optimal vi-deo bit rate, as demonstrated later in this section. At the same time,power saving controller finds the optimal parameters for RRC statemachine, as described in Section 5. Based on the given video bitrate, the video rate controller defines the compression parameters,which are used for encoding the video source. After this the com-pressed bit stream is ready for the transmission with optimalTSM parameters, providing the necessary level of power consump-tion for the UE.
300
400
500
600
700
800
900
0 400 800 1200 1600 2000Data bit rate, kbps
Pow
er c
onsu
mpt
ion,
mW
Proposed TSM without restrictionsProposed TSM, L = 0,1 secProposed TSM, L = 1 secProposed TSM, L = 5 secProposed TSM, L = 10 sec
Fig. 10. Power consumption with latency restrictions and N�s = 0.4.
300
400
500
600
700
800
900
0 400 800 1200 1600 2000Data bit rate, kbps
Pow
er c
onsu
mpt
ion,
mW
Proposed TSM without restrictionsProposed TSM, L = 0,1 secProposed TSM, L = 1 secProposed TSM, L = 5 secProposed TSM, L = 10 sec
Fig. 11. Power consumption with latency restrictions and N�s = 2.
Power saving controller
UMTS RRCState Machine
Videorate controller
Videoencoder/transcoder
Power saving mode
TSMparameters
Compressionparameters
Video bit rate
Video source
Compressedvideo stream
Uplinktransmission
Fig. 12. UE power saving based on trade off between video quality and powerconsumption.
A. Ukhanova et al. / Computer Communications 35 (2012) 1695–1706 1703

Another approach considers the use of scalable video coding(e.g. Scalable Extension of H.264/AVC [39]), with further extractionof the necessary amount of data under bit rate constraints (at thesame time, possibly maximizing quality) [40]. The latter approachcan practically be used in hybrid video surveillance systems, con-sisting of a camera that records video data in a scalable formatand a transmission terminal that is used for the delivery of the en-coded video data. For power saving reasons, in case of no motiondetection, the camera can transmit the base layer only. When themotion is detected, the camera starts transmitting several (up toall) quality layers of the video sequence, thus increasing the powerconsumption of the mobile terminal.
In this section we evaluate the necessary amount of power forthe video transmission for different levels of video quality. Forpractical experiments the H.264/AVC scheme in reference softwareJM codec v.16.2 [41] was used. Experimental results were obtainedfor several test video sequences: ‘‘Hall monitor’’, ‘‘Foreman’’, ‘‘Soc-cer’’ and ‘‘Akiyo’’ at QCIF (176 � 144) resolution, 15 Hz, 300 framesand CIF (352 � 288) resolution, 30 Hz, 300 frames, and also ‘‘Crew’’at QCIF, CIF and SD (704 � 576, 30 Hz, 300 frames) resolutions. Thefollowing GOP structure was used: IPPP, GOP size = 16.
Using the JM codec, we obtained the rate-distortion perfor-mance on the test video sequences, shown on Figs. 13 and 14.Using the analysis, provided in Sections 4 and 5, it is possible toevaluate the power consumption for uplink transmission takingdifferent restrictions into account, as it was done, for example,on Figs. 8–11. Thus, we know the dependency between the powerconsumption and the transmission rate. Combining these resultsand the rate-distortion performance, results demonstrating thetrade-off between video quality and power consumption can beobtained.
We used Figs. 13 and 14 and the power consumption for TSMwith proposed parameters without any restrictions (Fig. 5) to ob-tain Figs. 15–17. Similar results can be obtained if using powerconsumption for TSM with proposed parameters used for Fig. 6.They illustrate that, due to the combination of the proposed TSMparameter selection with a video encoder providing constant bitrate, it is possible to adapt the level of the power consumptionbased on the requirements.
Fig. 13 shows the PSNR of the luminance component vs. bit ratefor four standard CIF test video sequences. Fig. 14 shows the PSNRof the luminance component vs. bit rate for one test sequence
‘‘Crew’’ in three different resolutions. As the content/resolution ofthese sequences varies (e.g. slow motion for ‘‘Akiyo’’ and fast mo-tion for ‘‘Soccer’’, or, for example, QCIF and CIF resolutions for‘‘Crew’’), the performance of the video codec is also different. Asa consequence, the same video quality for different sequencescan be obtained at different bit rates.
As illustrated on Figs. 15 and 16, more power may be needed forthe transmission of one sequence with a certain quality thanfor another sequence with the same level of quality. For example,for a quality level around 36 dB, approximately 450 mW will beneeded for ‘‘Hall monitor’’ compared to 590 mW for ‘‘Soccer’’. Asimilar example can be found for ‘‘Crew’’ sequence, when thetransmission in QCIF resolution with quality around 36 dB will re-quire 440 mW compared to approximately twice as much powerfor SD resolution. That means, that it is possible to control thepower consumption of the UE, by defining the required level ofvideo quality for a particular sequence.
25
30
35
40
45
50
55
0 200 400 600 800 1000 1200 1400 1600 1800 2000Video bit rate, kbps
Y-PS
NR
, dB
SoccerHall monitorAkiyoForeman
Fig. 13. Rate-distortion performance for CIF test video sequences.
25
30
35
40
45
50
55
0 200 400 600 800 1000 1200 1400 1600 1800 2000Video bit rate, kbps
Y-PS
NR
, dB
Crew QCIFCrew CIFCrew SD
Fig. 14. Rate-distortion performance for ‘‘Crew’’ test video sequence.
400
500
600
700
800
900
25 30 35 40 45 50 55Y-PSNR, dB
Pow
er c
onsu
mpt
ion,
mW
SoccerHall monitorAkiyoForeman
Fig. 15. Trade-off between video quality and power consumption for CIF test videosequences.
1704 A. Ukhanova et al. / Computer Communications 35 (2012) 1695–1706
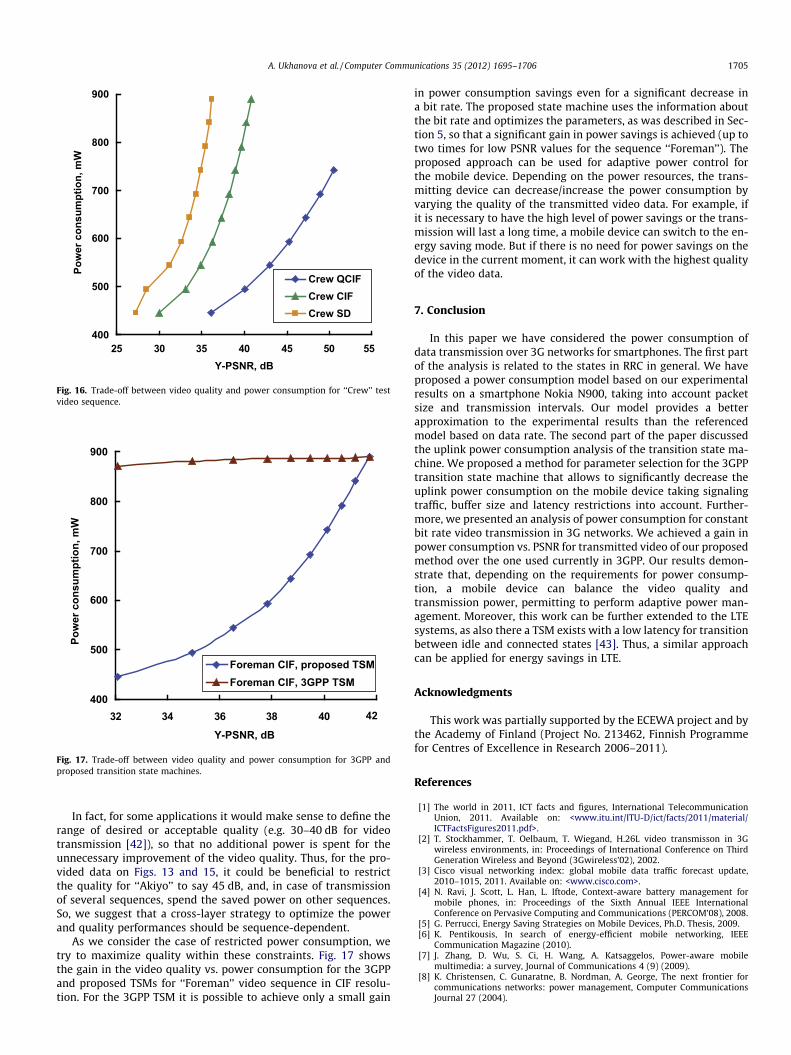
In fact, for some applications it would make sense to define therange of desired or acceptable quality (e.g. 30–40 dB for videotransmission [42]), so that no additional power is spent for theunnecessary improvement of the video quality. Thus, for the pro-vided data on Figs. 13 and 15, it could be beneficial to restrictthe quality for ‘‘Akiyo’’ to say 45 dB, and, in case of transmissionof several sequences, spend the saved power on other sequences.So, we suggest that a cross-layer strategy to optimize the powerand quality performances should be sequence-dependent.
As we consider the case of restricted power consumption, wetry to maximize quality within these constraints. Fig. 17 showsthe gain in the video quality vs. power consumption for the 3GPPand proposed TSMs for ‘‘Foreman’’ video sequence in CIF resolu-tion. For the 3GPP TSM it is possible to achieve only a small gain
in power consumption savings even for a significant decrease ina bit rate. The proposed state machine uses the information aboutthe bit rate and optimizes the parameters, as was described in Sec-tion 5, so that a significant gain in power savings is achieved (up totwo times for low PSNR values for the sequence ‘‘Foreman’’). Theproposed approach can be used for adaptive power control forthe mobile device. Depending on the power resources, the trans-mitting device can decrease/increase the power consumption byvarying the quality of the transmitted video data. For example, ifit is necessary to have the high level of power savings or the trans-mission will last a long time, a mobile device can switch to the en-ergy saving mode. But if there is no need for power savings on thedevice in the current moment, it can work with the highest qualityof the video data.
7. Conclusion
In this paper we have considered the power consumption ofdata transmission over 3G networks for smartphones. The first partof the analysis is related to the states in RRC in general. We haveproposed a power consumption model based on our experimentalresults on a smartphone Nokia N900, taking into account packetsize and transmission intervals. Our model provides a betterapproximation to the experimental results than the referencedmodel based on data rate. The second part of the paper discussedthe uplink power consumption analysis of the transition state ma-chine. We proposed a method for parameter selection for the 3GPPtransition state machine that allows to significantly decrease theuplink power consumption on the mobile device taking signalingtraffic, buffer size and latency restrictions into account. Further-more, we presented an analysis of power consumption for constantbit rate video transmission in 3G networks. We achieved a gain inpower consumption vs. PSNR for transmitted video of our proposedmethod over the one used currently in 3GPP. Our results demon-strate that, depending on the requirements for power consump-tion, a mobile device can balance the video quality andtransmission power, permitting to perform adaptive power man-agement. Moreover, this work can be further extended to the LTEsystems, as also there a TSM exists with a low latency for transitionbetween idle and connected states [43]. Thus, a similar approachcan be applied for energy savings in LTE.
Acknowledgments
This work was partially supported by the ECEWA project and bythe Academy of Finland (Project No. 213462, Finnish Programmefor Centres of Excellence in Research 2006–2011).
References
[1] The world in 2011, ICT facts and figures, International TelecommunicationUnion, 2011. Available on: <www.itu.int/ITU-D/ict/facts/2011/material/ICTFactsFigures2011.pdf>.
[2] T. Stockhammer, T. Oelbaum, T. Wiegand, H.26L video transmisson in 3Gwireless environments, in: Proceedings of International Conference on ThirdGeneration Wireless and Beyond (3Gwireless’02), 2002.
[3] Cisco visual networking index: global mobile data traffic forecast update,2010–1015, 2011. Available on: <www.cisco.com>.
[4] N. Ravi, J. Scott, L. Han, L. Iftode, Context-aware battery management formobile phones, in: Proceedings of the Sixth Annual IEEE InternationalConference on Pervasive Computing and Communications (PERCOM’08), 2008.
[5] G. Perrucci, Energy Saving Strategies on Mobile Devices, Ph.D. Thesis, 2009.[6] K. Pentikousis, In search of energy-efficient mobile networking, IEEE
Communication Magazine (2010).[7] J. Zhang, D. Wu, S. Ci, H. Wang, A. Katsaggelos, Power-aware mobile
multimedia: a survey, Journal of Communications 4 (9) (2009).[8] K. Christensen, C. Gunaratne, B. Nordman, A. George, The next frontier for
communications networks: power management, Computer CommunicationsJournal 27 (2004).
400
500
600
700
800
900
25 30 35 40 45 50 55Y-PSNR, dB
Pow
er c
onsu
mpt
ion,
mW
Crew QCIFCrew CIFCrew SD
Fig. 16. Trade-off between video quality and power consumption for ‘‘Crew’’ testvideo sequence.
400
500
600
700
800
900
32 34 36 38 40 42
Y-PSNR, dB
Pow
er c
onsu
mpt
ion,
mW
Foreman CIF, proposed TSMForeman CIF, 3GPP TSM
Fig. 17. Trade-off between video quality and power consumption for 3GPP andproposed transition state machines.
A. Ukhanova et al. / Computer Communications 35 (2012) 1695–1706 1705

[9] J.-H. Yeh, C.-C. Lee, J.-C. Chen, Performance analysis of energy consumption in3GPP networks, in: Proceedings of Wireless Telecommunications, Symposium,2004.
[10] N. Sklavos, K. Touliou, A system-level analysis of power consumption andoptimizations in 3G mobile devices, in: Proceedings of the 1st InternationalConference on NewTechnologies, Mobility and Security (NTMS’07), 2007.
[11] J. Adams, G. Muntean, Power save adaptation algorithm for multimediastreaming to mobile devices, in: Proceedings of IEEE International Conferenceon Portable Information Devices, 2007.
[12] J. Korhonen, Y. Wang, Power-efficient streaming for mobile terminals, in:Proceedings of the International Workshop on Network and OperatingSystems Support for Digital Audio and Video (NOSSDAV’05), 2005.
[13] G. Perrucci, F. Fitzek, G. Sasso, M. Katz, Energy saving strategies for mobiledevices using wake-up signals, in: Proceedings of 4th International MobileMultimedia Communications Conference (MobiMedia 2008), 2008.
[14] B. Yu, L. Wang, J. Manner, Energy-efficient web access on mobile devices, in:Proceedings of IEEE/ACM International Conference on Green Computing andCommunications & International Conference on Cyber, Physical and Social,Computing, 2010.
[15] STMicroelectronics VS6451 (ultra small CIF+ reflowable camera module)product description. Available on: <www.st.com>.
[16] H.-C. Chang, J.-W. Chen, B.-T. Wu, C.-L. Su, J.-S. Wang, J.-I. Guo, A dynamicquality-adjustable H.264 video encoder for power-aware video applications,IEEE Transactions on Circuits and Systems for Video Technology 19 (12)(2009).
[17] Q. Zhang, Z. Ji, W. Zhu, Y. Zhang, Power-minimized bit allocation for videocommunication over wireless channels, IEEE Transactions on Circuits andSystems for Video Technology 12 (2002).
[18] Y. Eisenberg, C.E. Luna, T. Pappas, R. Berry, A.K. Katsaggelos, Joint source codingand transmission power management for energy efficient wireless videocommunications, IEEE Transactions on Circuits and Systems for VideoTechnology 12 (2002).
[19] Y. Chen, S. Zhang, S. Xu, G.Y. Li, Fundamental trade-offs on green wirelessnetworks, IEEE Communications Magazine (2011).
[20] M. Kim, J. Choi, M. Kang, Trade-off guidelines for power managementmechanism in the IEEE 802.16e MAC, Computer Communications Journal 31(2008).
[21] S. De Vuyst, K. De Turck, D. Fiems, S. Wittevrongel, H. Bruneel, Delay versusenergy consumption of the IEEE 802.16e sleep-mode mechanism, IEEETransactions on Wireless Communications 8 (11) (2009).
[22] E. Belyaev, T. Koski, J. Paavola, A. Turlikov, A. Ukhanova, Adaptive power savingon the receiver side in digital video broadcasting systems based on progressivevideo codecs, in: Proceedings of the 11th International Symposium onWireless Personal Multimedia, Communications, 2008.
[23] E. Belyaev, V. Grinko, A. Ukhanova, Power saving control for the mobile DVB-Hreceivers based on H.264/SVC standard, in: Proceedings of the 8th WirelessTelecommunication, Symposium, 2008.
[24] F. Qian, Z. Wang, A. Gerber, Z.M. Mao, S. Sen, O. Spatscheck, Characterizingradio resource allocation for 3G networks, in: Proceedings of the 10th AnnualConference on Internet, Measurement, 2010.
[25] H. Haverinen, J. Siren, P. Eronen, Energy consumption of always-onapplications in WCDMA networks, in: Proceedings of the 65th Semi-AnnualIEEE Vehicular Technology Conference, 2007.
[26] White paper from wavion wireless networks, metro zone Wi-Fi for cellulardata offloading, 2010. Available on: <www.wavionnetworks.com>.
[27] K. Mahmud, M. Inoue, H. Murakami, M. Hasegawa, H. Morikawa, Measurementand usage of power consumption parameters of wireless interfaces in energy-aware multi-service mobile terminals, in: Proceedings of the 15th IEEEInternational Symposium on Personal, Indoor and Mobile Radio,Communications, 2004.
[28] K.-H. Lee, J.-H. Park, J.-S. Koh, User experience analysis of smartphone websurfing in UMTS networks, in: Proceedings of the 72th IEEE VehicularTechnology Conference, 2010.
[29] C. Johnson, Radio Access Networks for UMTS: Principles and Practice, JohnWiley & Sons, Ltd., 2008.
[30] P.H.J. Perala, A. Barbuzzi, G. Boggia, Theory and practice of RRC statetransitions in UMTS networks, in: Proceedings of 5th IEEE BroadbandWireless Access Workshop co-located with IEEE Globecom, BW-WAWS, 2009.
[31] P. Willars, Smartphone traffic impact on battery and network. Available on:<www.labs.ericsson.com/developer-community/blog/smartphone-traffic-impact-battery-and-networks>.
[32] Signals research group, smartphones and a 3G network. Available on:<www.signalsresearch.com>.
[33] T. Stockhammer, M.M. Hannuksela, T. Wiegand, H.264/AVC in wirelessenvironments, IEEE Transactions on Circuits and Systems for VideoTechnology 13 (2003).
[34] F. Fitzek, M. Krishnam, M. Reisslein, Providing application-level QoS in 3G/4Gwireless systems: a comprehensive framework based on multi-rate CDMA,IEEE Wireless Communications 9 (2) (2002).
[35] N. Baghaei, R. Hunt, Review of quality of service performance in wireless LANsand 3G multimedia application services, Computer Communications Journal27 (2004).
[36] MPEG-2 TM5 rate control and quantization control. Available on:http:<www.mpeg.org/MPEG/MSSG/tm5/Ch10/Ch10.html>.
[37] I. Shin, Y. Lee, H. Park, Rate control using linear rate-q model for H.264, SignalProcessing: Image Communication 19 (4) (2004).
[38] S. Sen, J.K. Dey, J.F. Kurose, J.A. Stankovic, D. Towsley, Streaming CBRtransmission of VBR stored video, in: Proceedings SPIE Symposium VoiceVideo and Data Communications, 1997.
[39] H. Schwarz, D. Marpe, T. Wiegand, Overview of the scalable video codingextension of the H.264/AVC standard, IEEE Transactions on Circuits andSystems for Video Technology 17 (9) (2007).
[40] E. Maani, A.K. Katsaggelos, Optimized bit extraction using distortion modelingin the scalable extension of H.264/AVC, IEEE Transactions on Image Processing18 (9) (2009).
[41] H.264/AVC JM reference software. Available on: <iphome.hhi.de/suehring/tml>.
[42] V. Vassiliou, P. Antoniou, I. Giannakou, A. Pitsillides, Requirements for thetransmission of streaming video in mobile wireless networks, in: ProceedingsICANN, 2006.
[43] Motorola, technical white paper, long term evolution (LTE): a technicaloverview, 2007.
1706 A. Ukhanova et al. / Computer Communications 35 (2012) 1695–1706