energy consumption and constant current operation in ... · pdf fileenergy consumption and...
TRANSCRIPT
Energy consumption and constant current operation in membrane capacitive deionization
Zhao, R., Biesheuvel, P.M., & Van der Wal, A.
This is a "Post-Print" accepted manuscript, which has been published in "Energy & Environmental Science".
This version is distributed under the Creative Commons Attribution 3.0 Netherlands License, which permits unrestricted use, distribution, and reproduction in any medium, provided the original work is properly cited.
Please cite this publication as follows:
Zhao, R., Biesheuvel, P.M., & Van der Wal, A. (2012). Energy consumption and constant current operation in membrane capacitive deionization. Energy & Environmental Science, 5(11), 9520.
You can download the published version at: http://dx.doi.org/10.1039/C2EE21737F

1
Energy Consumption and Constant Current Operation in Membrane Capacitive Deionization
R. Zhao,1,2 P.M.Biesheuvel1,2,* and A. van der Wal1,3 1Department of Environmental Technology, Wageningen University, Bornse Weilanden 9, 6708 WG
Wageningen, The Netherlands. 2Wetsus, centre of excellence for sustainable water technology, Agora
1, 8900 CC Leeuwarden, The Netherlands. 3Voltea B.V., Wasbeekerlaan 24, 2171 AE Sassenheim,
The Netherlands. e-mail: [email protected].
General interest paragraph (max 200 words)
Energy-efficient water desalination is essential for the economical use of groundwater and other
water resources for industry, agriculture, human consumption and household applications. Here, an
extensive data set is presented for the energy consumption of a novel water desalination technology,
called membrane capacitive deionization (MCDI). This data set is an essential tool to assess the
economic viability of MCDI. Also, we introduce an improved operation mode of MCDI in which
freshwater of a constant salt concentration is produced, i.e., unvarying in time. The salt level in the
produced freshwater can be tuned precisely using the electrical current and water flow rate as direct
control parameters.
Abstract
Membrane capacitive deionization (MCDI) is a water desalination technology based on applying a
cell voltage between two oppositely placed porous electrodes sandwiching a spacer channel that
transports the water to be desalinated. In the salt removal step, ions are adsorbed at the carbon-water
interface within the micropores inside the porous electrodes. After the electrodes reach a certain
adsorption capacity, the cell voltage is reduced or even reversed, which leads to ion release from the
electrodes and a concentrated salt solution in the spacer channel, which is flushed out, after which the
cycle can start over again. Ion-exchange membranes are positioned in front of each porous electrode
which has the advantage that co-ions are prevented from leaving the electrode region during ion
adsorption, while also allowing for ion desorption at reversed voltage. Both effects significantly
increase the salt removal capacity of the system per cycle.
The classical operation mode of MCDI at a constant cell voltage results in an effluent stream of
desalinated water of which the salt concentration varies with time. In this paper, we propose a different
operational mode for MCDI, whereby desalination is driven by a constant electrical current, which
leads to a constant salt concentration in the desalinated stream over long periods of time. Furthermore,
we show how the salt concentration of the desalinated stream can be accurately adjusted to a certain
setpoint, by either varying the electrical current level and/or the water flowrate.
Finally, we present an extensive data set for the energy requirements of MCDI, both for operation
at constant voltage, and at constant current, and in both cases also for the related technology in which
membranes are not included (CDI). We find consistently that in MCDI the energy consumption per
mole of salt removed is lower than in CDI. Within the range 10-200 mM ionic strength of the water to be

2
treated, we find for MCDI a constant energy consumption of ~22 kT per ion removed. Results in this
work are an essential tool to evaluate the economic viability of MCDI for the treatment of saltwater.
Introduction
Access to freshwater at moderate costs is essential for direct consumption, in many household
applications, and in agriculture and industry [1-7]. With the continuing growth of the human population
and the increase in per capita water use, new sources of freshwater must be made available. Water
desalination of brackish water, such as groundwater, is one potential solution. For energy-efficient
water desalination of these water sources of relatively low salt concentration, e.g. below 5,000 ppm
salt (<100 mM), instead of producing freshwater by evaporation (distillation), or by water-permeable
membranes (reverse osmosis), where pure water is separated from the saline water, it may be
advantageous to remove the relatively few salt molecules from the saline water and produce
freshwater in this manner. This is the approach followed in electrodialysis [8], water desalination using
nanochannels [9], batteries [10] microbial desalination cells [11] and wires [12], as well as in capacitive
deionization (CDI) and membrane capacitive deionization (MCDI). In this manuscript we focus on CDI
[2,13-40] and MCDI [41-49]. CDI also goes under the names of electrosorption desalination [15] and
capacitive desalination [50].
Water desalination by CDI is a technology related to energy storage using supercapacitors
[51,52,53], but with distinct differences. In CDI, by applying a cell voltage between two oppositely
positioned porous electrodes, ions in the water flowing through a transport channel in between the
electrodes are removed and stored in the electrical double layers (EDLs) in the micropores of the
electrodes. This is the ion removal-, ion adsorption-, or charging-step. During this step, anions are
adsorbed in the anode (electrode of positive polarity) and cations are stored in the cathode. After some
time, the cell voltage is reduced or even reversed and the previously stored ions are released (ion
release, ion desorption, discharge-step) and flushed out of the transport channel, after which a new
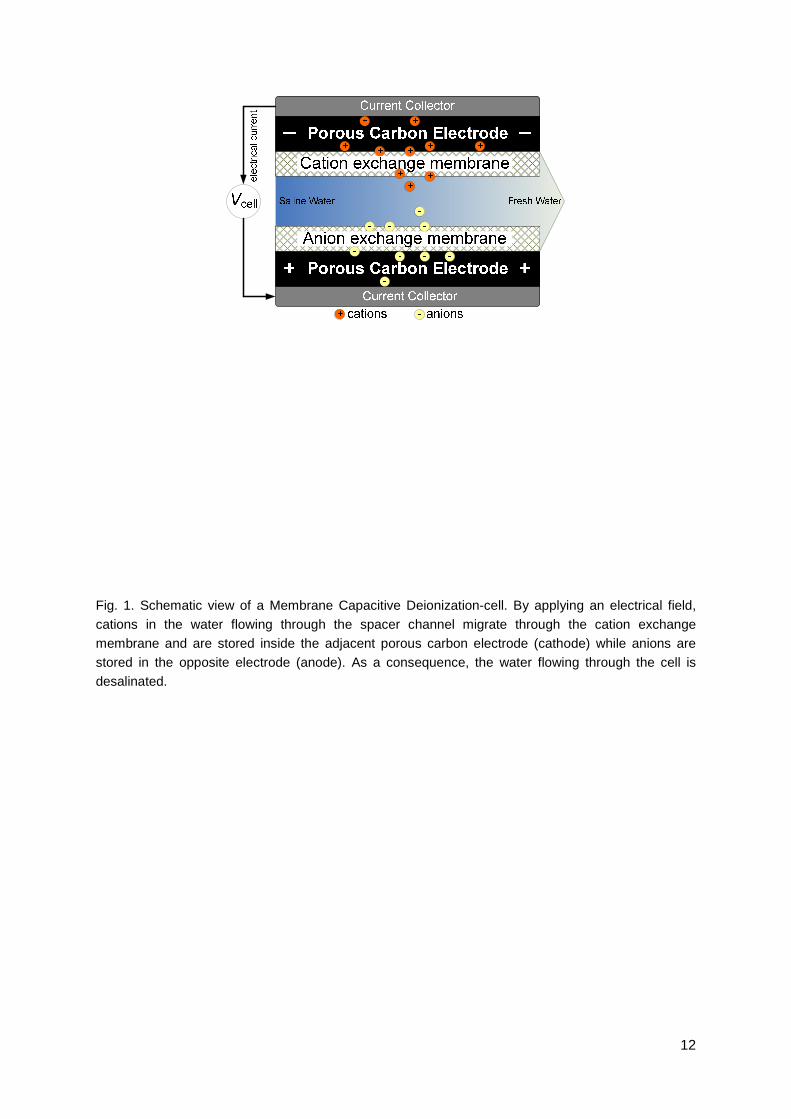
cycle can start. Membrane Capacitive Deionization (MCDI) is a modification of CDI by placing ion
exchange membranes in front of each electrode. Specifically, an anion exchange membrane is placed
in front of the anode, and a cation exchange membrane is placed in front of the cathode (Fig. 1).
Because of the use of ion exchange membranes, MCDI has two major advantages over
conventional CDI [43,48]. First of all, in MCDI, the co-ions that are expelled from the micropores during
charging are inhibited from leaving the electrode structure. [Note that the co-ion is defined as the ion of
the same charge as the electrode charge and is the ion that is repelled out of the electrode. The
counterions are those of opposite charge sign to that of the surface and are attracted into the electrode.
Thus a cation is the counterion in the cathode and the co-ion in the anode.] One may wonder how
co-ions can be present behind the membrane (within the electrode structure) in the first place. The
answer is that the membranes are slightly leaky to co-ions, and thus after several cycles, whatever the
initial salt concentration behind the membrane, a certain steady-state amount of co-ions is found. In
comparison, in CDI the co-ions are released from the electrodes, and end up in the spacer channel.
This leads to a reduced charge efficiency of the system, i.e., per amount of transported charge, a lower
number of salt molecules is removed from the water [20,27,54]. In MCDI, the co-ions expelled from the

3
micropores end up in the large transport pores, also called macropores, which are within the electrode
structure, see Fig. 2. In order to maintain electroneutrality in the macropores, additional counterions
are being transported through the membrane and stored in the macropores of the electrodes. As a
consequence, during the ion removal-step, the salt concentration can become much higher in the
macropores than in the spacer channel, and therefore in MCDI the macropores serve as a reservoir for
ion storage [48]. In comparison, in CDI, i.e., without membranes, the salt concentration in the
macropores is, during ion adsorption, just as high as that in the spacer channel, or even lower [55,56].
A second advantage of MCDI is that the cell voltage between the two electrodes can be reversed
during ion desorption, which leads to a shorter duration of the discharge step and more release of
counterions from the electrode [43,45,48], and thus an increase of the salt adsorption capacity of the
cell in the next cycle.
At present, it is common practice to control the desalination cycles of (M)CDI by applying a
constant cell voltage (the electrical potential difference between the two porous electrodes) during
charging (ion adsorption) and during discharging (ion desorption) of the electrodes. For example,
during ion adsorption, a typical value of Vcell=1.2 V is applied to adsorb ions and produce freshwater,
while during discharge, the two electrodes can be short-circuited, i.e., the cell voltage is reduced to 0 V.
However, operation at a constant cell voltage has as a disadvantage that the effluent salt concentration
changes in time, i.e., the ion concentration in the desalinated water stream (freshwater) changes
during the ion removal step. This is because at the start of the adsorption step, the EDLs are still
mainly uncharged, and thus the driving force over the channel is at a maximum (no loss of cell voltage
in the EDLs). Consequently, there is a large ion flux directed into the electrodes. As ion adsorption in
the EDLs progresses, the EDL voltage gradually increases and the remaining voltage across the
spacer channel steadily decreases in time. The overall effect is that the effluent salt concentration will
first decrease, go through a minimum, and then gradually increase again. This gradual change of
effluent concentration over time may not be desired in practical applications; instead, it may be more
advantageous if water is produced of a constant desalination level.
To obtain freshwater with a constant reduced salt concentration, we propose a different mode to
carry out the MCDI desalination cycles, namely by applying a constant current (CC) running between
the two electrodes, instead of using a constant cell voltage (CV). The externally applied constant
electron current, I, translates into an equally large ionic current in the cell, which has contributions from
the ionic flux of positive ions (such as Na+) and negative ions (such as Cl-). As we will show, in MCDI,
operation with constant current results in an effluent salt concentration which is constant in time, both
during the ion adsorption step and during the ion desorption-step. Another advantage of operation
using constant current is that the effluent concentration can be easily and accurately controlled at a
certain required value by varying the current level. This may be advantageous from the viewpoint of the
consumer who desires a supply of freshwater with constant and tunable salt concentration.
Furthermore, we present an extensive data set for the energy requirement of MCDI versus CDI, not
only for the novel operational mode of CC, but also for the classical CV-mode of operation. These data
can be used to assess the economic viability of the technology, as well as to validate process models;
models which are an essential tool for the design and optimization of CDI and MCDI. We show that the

4
energy requirement is closely linked to the dynamic charge efficiency, an important operational
parameter both in CDI and MCDI.
Experimental Section
Experimental setup
Our experimental setup [21,27,37,38,48,57,58] consists of a stack of N=8 parallel cells. Each MCDI
cell consists of one spacer, two membranes, two electrodes, and two current collectors, which are
connected to the external electrical circuit. Materials used are graphite current collectors, porous
carbon electrodes (Materials & Methods, PACMMTM 203, Irvine, CA, δe=362 µm, mtot=10.75 g total
mass in the stack), anion and cation exchange membranes (Neosepta AMX, δmem=140 µm, and
Neosepta CMX, δmem=170 µm, Tokuyama, Japan), and a polymer spacer (Glass fibre prefilter, Millipore,
Ireland, thickness after compression δsp=250 µm). The salt solution flows from outside the stack on all
four sides into a square 6x6 cm2 spacer channel of each of the N cells, and leaves from a hole (1.5x1.5
cm2) in the middle of each cell (standard value for total stack flow rate Φstack=60 mL/min). After
assembly, all layers in the stack are compressed and placed in a teflon housing. The stack is fed from
a 10 liter vessel storing an NaCl-solution as the electrolyte, to which the effluent is recycled. The
conductivity of the effluent is measured (not in the storage vessel) on-line and is converted into salt
concentration according to a calibration curve. The electric current through the stack is applied using a
potentiostat (Iviumstat Standard, Ivium Technologies, The Netherlands) which also measures the cell
voltage, Vcell. The salt adsorption and charge in an MCDI-cycle can be derived from the data of salt
effluent (outflow) concentration versus time, and electric current versus time. For salt adsorption, the
difference between inflow salt concentration and outflow concentration is integrated with time, and
multiplied with the water flow rate, while for charge, the current is integrated with time. After a few
cycles, the dynamic steady state is reached where the measured salt adsorption during one phase of
the cycle is close (ideally, equal) to the salt desorption in the other phase of the cycle (salt balance is
maintained). Likewise, the total charge transferred in one direction (from cathode to anode) during the
salt adsorption step, is close to the charge transfer directed in the opposite direction during the salt
release-step. In the standard experiment we apply ±1 A to the full stack of N=8 cells, which translates
to an average current density (per unit cell area) of ±38.4 A/m2.
Energy requirements
To calculate the energy requirement for the removal of an ion, as presented in Fig. 4, we take the
ratio of energy consumption over desalination, both calculated strictly based on the duration of the ion
adsorption step. In the present work, the adsorption step is defined to start and end at the exact
moments that voltage or current signals are changed, not by the moments that the effluent salt
concentrations drops below, or increases to beyond, the inlet salt concentration (which is 20 mM in
Figs. 3 and 4). Desalination is calculated from integration over time, during the ion adsorption step, of
the difference cin-ceffluent, and multiplying by water flow rate Φ, and by the factor 2. The factor 2 is
because we present data for the energy to remove an ion, not to remove a salt molecule. The energy is
5
calculated as cell voltage Vcell times current I, integrated again over the duration of the ion adsorption
step. The ratio energy/desalination gives us the energy in J per mole of ions removed. Dividing this
number by a factor RT (=2.48 kJ/mol at room temperature) results in the energy in units of “RT per
mole of ions”, which has the same numerical value as when expressed in “kT per ion” as in Fig 5a-c.
Dynamic charge efficiency
The dynamic charge efficiency, Λdyn, denotes the ratio of two properties: the total desalination
during ion adsorption (in moles), as described above, divided by total charge transferred in the same
period (charge with unit Coulomb must be divided by Faraday’s constant, F, to obtain charge in moles).
In the present work, the parameter Λdyn is obtained during relatively short cycles in which the EDLs are
not allowed to come to equilibrium with a well-known salt concentration in the pores next to it. Thus,
formally, we have not measured (nor do we theoretically model), the equilibrium charge efficiency, Λ,
as defined in refs. [20,21,27,37,38], which requires that the system becomes equilibrated at set values
of the cell voltage. Thus, to describe the measured ratio of desalination and charge, in the present
work we use the modified term, “dynamic charge efficiency.”
Theory
The theoretical model used to describe ion transport and storage in MCDI and CDI is described in
detail in refs. 38 and 48. Here we only give the general outline, and present in Table 1 the model input
parameters. Previous modeling work related to (M)CDI considered fully-mixed conditions in the spacer
channel [21,27], while salt storage was described using the Gouy-Chapman-Stern model which
assumes planar non-overlapping electrical double layers (EDLs) within the electrode
[20,21,27,43,55-59]. This EDL-model does not consider the difference between the two types of
porosity that can be distinguished in typical activated carbon electrodes, namely the macropores
(transport pathways) in between the porous activated carbon particles, and the micropores
(intraparticle porosity), see Fig. 2. It also does not recognize that within the micropores the EDLs are
strongly overlapping. To account for these effects we developed in refs. [38,40,48,56,60] an improved
“two-porosity” model which distinguishes between the charge-neutral macropores and the micropores
in which the EDLs are formed and counterions are preferentially stored. The EDLs are described using
a modified Donnan (mD) model which assumes a constant micropore potential and also includes a
non-electrostatic attractive term, µatt, when the ion enters the micropores. In between the ion- and
water-filled micropores and the charged carbon walls we assume the presence of a thin dielectric Stern
layer. To describe the water flow in the spacer channel along the electrode we model the system by
placing a number M of sub-cells in series, see Fig. 2, and refs. [38,43,48]. For details on the theoretical
model, we refer the reader to refs. [38,48]. Note that all calculations presented in this work (Figs. 3-5)
are based on a single set of parameter values, given in Table 1. A technical modification made in the
present work relative to refs. [38,48] is that the Stern layer capacity per unit area is lumped with the
area/volume ratio hp,mi to arrive at a volumetric capacity, while additionally we assume CSt,vol to be an
explicit (weak) function of micropore charge density, and not to depend explicitly on Stern voltage,
∆φSt2; thus we use ( )2
St T charge,mi St,vol,0 charge,mi/ /F V c C c∆φ = − ⋅ + α ⋅ see also refs. [37,40]. Also note that in

6
most of the experiments presented here we do not apply a constant voltage, but we apply a total
current to the whole cell. This total (average) ion current density, Itot, distributes self-consistently over
the M sub-cells, thus =
= ∑tot ii 1
1 M
I IM
is solved for all M sub-cells simultaneously. In all sub-cells, the cell
voltage is at each moment in time the same throughout the electrode. Beyond this modification of the
externally applied current-voltage characteristic, there is for the ions no fundamental difference
between CV- or CC-operation, in the sense that the forces acting on an ion to move into the pores and
to be stored there, are fundamentally unchanged.
Results and Discussion
in this section we show results of MCDI operation using different operational modes, focusing on
the difference between constant voltage (CV) and constant current (CC) operation. Results are
presented of two modes of CC operation. For these three modes in total, to be discussed below in
detail, we show in Fig. 3 experimental and theoretical results for three main operational characteristics:
effluent concentration, cell voltage, and current, all as function of time. Note that in all experiments of
Fig. 3 the inlet salt concentration is csalt,in=20 mM, even though Fig. 3c may suggest otherwise; but note
that here the effluent concentration of ~30 mM shown at time zero is not the inlet concentration but the
effluent concentration as produced during the previous desorption-step. Furthermore, in all cases (also
for Figs. 4 and 5), results are shown of a steady-state cycle, i.e., not the first or second cycle from a
new series, but a cycle which repeats itself almost unchanged for a prolonged period. In all nine panels,
data are presented as dashed red lines, and predictions of the theoretical model of ref. [48] are shown
by solid blue curves.
The three characteristics presented in Fig. 3 are: on the top row, first of all the effluent
concentration (the concentration of the freshwater during the first period, denoted “adsorption” in
panels a-c, and the concentration of the high-salinity stream in the desorption step); second the cell
voltage (middle row; either applied or measured); and finally the electrical current (bottom row; either
applied or measured). The first vertical column shows results of classical operation at constant voltage,
as used in practically all previous work in the literature of CDI and MCDI. In this case, operation is first
for a predetermined duration (here 300 s) at a preset value of the cell voltage, namely Vcell=1.2 V (see
panel d) to desalinate the water, followed by a stage of the same duration at zero cell voltage. The
current (panel g) is high at the start of each step and then decays back to zero. The salt effluent
concentration (panel a) shows the minimum during ion adsorption as discussed previously, while
during desorption we have a short peak in salt concentration before the concentration slowly decays
back to the inlet value.
In the second column we show results of applying constant current (CC) conditions, but in this case
CC is only applied during ion adsorption, while the ion desorption step is still defined by applying a zero
voltage (now for 500 s; CC-ZVD mode). The CC-condition is applied until a preset upper voltage limit
of Vcell=1.6 V is reached. At that moment we switch to the desorption step. Because of operation at CC
during ion adsorption, the cell voltage steadily increases, after an initial rapid increase due to Ohmic
resistances (panel e). Most importantly, we see in panel b that the freshwater salt effluent

7
concentration is now at a stable value during the ion adsorption step (after a brief initial transition
period), here around cfreshwater=10 mM.
In the third, right, column we show results of CC operation where also during desorption a constant
current is applied, of equal magnitude but opposite in sign compared to adsorption (see panel i;
CC-RCD mode). Both steps are now defined by limiting values of the cell voltage, being 1.6 V during
adsorption and 0 V during desorption. The cell voltage increases relatively linear for most of the time
except for brief transition periods where it rapidly changes because of the Ohmic resistances, which
we attribute in the theory to ion transport resistances in the spacer channel and in the electrode. Panel
c shows the main result, namely that using CC operation in both steps of the cycle leads to very stable
effluent ion concentrations, unvarying in time. Brief initial transition periods are due to the relatively
large mixing volumes after the stack in our small laboratory setup.
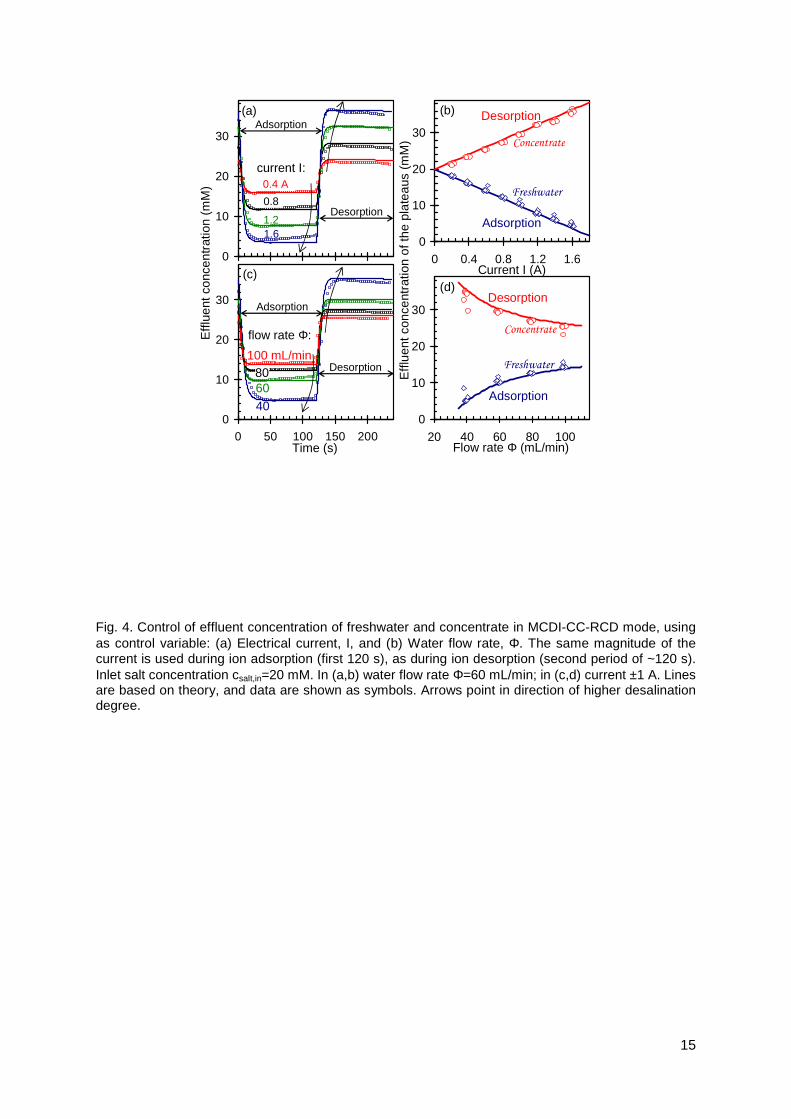
Fig. 3 has introduced the two novel modes of CC-operation, and shows how using CC-operation we
can achieve a stable effluent freshwater salt concentration. Next we show how we can tune this
effluent concentration by varying the current I, or the water flow rate Φ. As these are easily adjustable
parameters during operation, these are suitable control variables to be adjusted when the setpoint of
the system is to be changed, such as the salinity of the produced freshwater, or when we must correct
for any gradual losses of performance over prolonged use. Results of these experiments are shown in
Fig. 4, where we show the stable effluent concentration in the two steps of the cycle (first part with low
effluent concentration is the ion adsorption step; the second part is for ion desorption) as function of
current (panel a), and water flow rate (panel c). The duration of the adsorption step is set to 120 s,
while the desorption step ends when the cell voltage has returned to Vcell=0 V. It can be seen in panels
a and c that upon increasing the current or upon decreasing the flowrate (in both cases following the
direction of the arrows), the effluent salinity of the freshwater decreases. This is shown in more detail in
panels b and d where we show quantitatively the levels of the effluent concentration during adsorption
and desorption, as function of current I and flowrate Φ. Fig. 4b shows how the effluent concentration
depends linearly on current, while Fig 4d shows that varying the water inlet flowrate Φ by a factor of ~3,
allows us to change the effluent freshwater salinity also by a factor of ~3. This makes sense because
by reducing the water flow rate by a factor x, the total charge per unit water volume treated in a cycle
increases by x and thus, for the same charge efficiency (see below), this will lead to x times more
desalination per unit water volume. Fig. 4 shows, both experimentally and theoretically, how we can
tune the effluent salt concentration to a desired setpoint, with the expected dependency that higher
currents and lower water flow rates both lead to more desalination.
Finally, we show in Fig. 5 a large data set for the energy consumption per mole of ions removed in
MCDI, for the three operational modes discussed previously in Fig. 3, as function of operational mode,
system layout (with/out membranes), and inflow salt concentration, csalt,in. To be able to compare MCDI
with CDI, we add here data for CDI. Fig. 5 shows results both of experiments, and of the (M)CDI model
of ref. [48]. Note that energy recovery during the ion desorption step, possible in the CC-RCD mode of
operation, is not included in this calculation. Analyzing the integral of voltage vs time in Fig. 3f we find
that in our experiments the potential for energy recovery is about 40%, which would make the numbers
presented in Fig. 5c drop by the same amount. For the experiments reported in Fig. 5, operational
8
conditions are the same as in Fig. 3, except for the duration of each step in CV, which now is 500 s,
and for the fact that now we vary csalt,in. We observe that for MCDI a lower limit in energy consumption
is found of around 22 kT/ion removed. This value is independent of csalt,in for CC operation, while the
energy consumption increases moderately with csalt,in for CV-operation. For CDI, energy consumption
is higher than for MCDI, and more dependent on csalt,in, especially for CC-operation. Fig. 5 shows in
general somewhat lower energy consumption for CC-operation than for CV-operation, but not as
dramatic as a simple argument would suggest based on the fact that in CC-operation the average cell
voltage is lower; neither is the energy-consumption in CC-operation higher than for CV-operation,
which may be inferred in first approximation when considering that with the voltage increasing during
the cycle, the energetic penalty for an extra ion to adsorb (for each electron to be tranferred against the
growing cell voltage) will increase steadily. Instead we find more subtle differences between the
energy requirement in CC- and CV-operation, differences which will depend on the durations of the
adsorption- and desorption steps, salt concentration, and chosen voltage and current levels.
To explain, at least partly, the influence of the various variables on energy consumption, we
evaluate in the second row of Fig. 5 the dynamic charge efficiency, Λdyn. This parameter denotes the
ratio of two properties: the total desalination during ion adsorption, divided by total charge transferred
in that same period. For technical details of this calculation, see the Experimental Section. In Fig. 5, we
observe an almost 1:1 match between the data for Λdyn and energy consumption, with higher Λdyn
resulting in lower energy consumption.
Finally, quite surprisingly, Fig. 5 shows that the energy consumption does not decrease steadily
with increasing salt concentration, which in first approximation would be expected because the ionic
resistance in the spacer channel and macropores will decrease with increasing salinity. Instead, we
find that for MCDI the energy consumption is fairly independent of salt concentration, while for CDI it
even increases with csalt. Though these experimental observations are well reproduced by the theory,
as yet, we do not have available a simple argument to rationalize these counterintuitive results.
Conclusions
In conclusion, we have demonstrated that the use of constant electrical current operation in
membrane capacitive deionization (MCDI) results in a stable produced freshwater concentration, not
varying in time. By tuning the level of the electrical current, or the water flowrate, the freshwater salinity
can be accurately adjusted. We present an extensive data set for the energy requirements of water
desalination, both for CDI and for MCDI, and both for the constant current (CC) and constant voltage
(CV) mode of operation. According to both the data and the theoretical model, in all situations
considered, MCDI has lower energy requirements than CDI, and this difference is larger for
CC-operation than for CV-operation. This difference correlates with higher dynamic charge efficiency
(the ratio of salt adsorption over charge) for MCDI relative to CDI. The theoretical model reproduces
most experimental data for MCDI well, though deviations remain, especially for CDI at high ionic
strength and CV-operation. Nevertheless, the theoretical model is an essential tool to design and
optimize the MCDI system, and for the evaluation of the economic viability of this technology.

9
Acknowledgements
This work was performed in the TTIW-cooperation framework of Wetsus, Centre of Excellence for Sustainable Water Technology. Wetsus is funded by the Dutch Ministry of Economic Affairs, the European Union Regional Development Fund, the Province of Friesland, the City of Leeuwarden, and the EZ/Kompas program of the ‘Samenwerkingsverband Noord-Nederland’. We thank the participants of the theme “Capacitive Deionization” for their involvement in this research. References
1. R. Connor, WWAP (World Water Assessment Programme). 2012. The United Nations World
Water Development Report 4: Managing Water under Uncertainty and Risk. Paris, UNESCO.
2. T.J. Welgemoed and C.F. Schutte, Desalination, 2005, 183, 327.
3. M.A. Shannon, P.W. Bohn, M. Elimelech, J.G. Georgiadis, B.J. Marinas and A.M. Mayes, Nature,
2008, 452, 301.
4. A. Cipollina, Seawater desalination: conventional and renewable energy processes, Springer,
Berlin, 2009.
5. M. Elimelech and W.A. Phillip, Science, 2011, 333, 712.
6. A. Bajpayee, T. Luo, A. Muto and G. Chen, Energy Environm. Sci., 2011, 4, 1692.
7. M.M. Pendergast and E.M.V. Hoek, Energy Environ. Sci., 2011, 4, 1946.
8. H. Strathmann, in: R.W. Baker, Membrane Separation System: Recent Developments and Future
Directions; Noyes Data Corporation, Park Ridge, NJ., (1991) p. 396.
9. S.J. Kim, S.H. Ko, K.H. Kang and J. Han, Nat. Nanotechnol., 2010, 5, 297.
10. M. Pasta, C.D. Wessells, Y. Cui and F. La Mantia, Nano Lett., 2012, 12, 839.
11. C. Forrestal , P. Xu and Z. Ren, Energy & Environm. Sci., 2012, 5, 7161.
12. S. Porada, B.B. Sales, H.V.M. Hamelers, and P.M. Biesheuvel, J. Phys. Chem. Lett., 2012, 3,
1613.
13. B.B. Arnold and G.W. Murphy, J. Phys. Chem., 1961, 65, 135.
14. A.M. Johnson and J. Newman, J. Electrochem. Soc., 1971, 118, 510.
15. J.C. Farmer, S.M. Bahowick, J.E. Harrar, D.V. Fix, R.E. Martinelli, A.K. Vu and K.L. Carroll,
Energy & Fuels, 1997, 11, 337.
16. M.-W. Ryoo and G. Seo, Water Res., 2003, 37, 1527.
17. D. Qi, L. Zou and E. Hu, Research Journal of Chemistry and Environment, 2007, 11, 92.
18. Y. Oren, Desalination, 2008, 228, 10.
19. P. Xu, J.E. Drewes, D. Heil and G. Wang, Water Research, 2008, 42, 2605.
20. P.M. Biesheuvel, J. Colloid Interf. Sci., 2009, 332, 258.
21. P.M. Biesheuvel, B. van Limpt and A. van der Wal, J. Phys. Chem. C, 2009, 113, 5636.
22. R. Broséus, J. Cigana, B. Barbeau, C. Daines-Martinez and H. Suty, Desalination, 2009, 249, 217.
23. Y. Bouhadana, E. Avraham, A. Soffer and D. Aurbach, AIChE J., 2009, 56, 779.
24. L. Pan, X. Wang, Y. Gao, Y. Zhang, Y. Chen and Z. Sun, Desalination, 2009, 244, 139.
25. S. Nadakatti, M. Tendulkar and M. Kadam, Desalination, 2010, 268, 182.
26. M. Wang, Z.-H. Huang, L. Wang, M.-X. Wang, F. Kang and H. Hou, New J. Chem., 2010, 34,
1843.

10
27. R. Zhao, P.M. Biesheuvel, H. Miedema, H. Bruning and A. van der Wal, J. Phys. Chem. Lett.,
2010, 1, 205.
28. J.-H. Lee, W.-S. Bae and J.-H. Choi, Desalination, 2010, 258, 159.
29. R.T. Mayes, C. Tsouris, J.O. Kiggans Jr, S.M. Mahurin, D.W. DePaoli and S. Dai, J. Mater. Chem.,
2010, 20, 8674.
30. Y. Bouhadana, E. Avraham, A. Soffer and D. Aurbach, AIChE J., 2010, 56, 779.
31. H. Li, L. Pan, Y. Zhang, L. Zou, C. Sun, Y. Zhan and Z. Sun, Chem. Phys. Lett., 2010, 485, 161.
32. S.-J. Seo, H. Jeon, J.K. Lee, G.-Y. Kim, D. Park, H. Nojima, J. Lee and S.-H. Moon, Water Res.,
2010, 44, 2267.
33. M.A. Anderson, A.L. Cudero and J. Palma, Electrochimica Acta, 2010, 55, 3845.
34. J. Yang, L.D. Zou, H.H. Song and Z.P. Hao, Desalination, 2011, 276, 199.
35. B.G. Jeon, H.C. No and J.I. Lee, Desalination, 2011, 274, 226.
36. Z.-H. Huang, M. Wang, L. Wang and F. Kang, Langmuir, 2012, 28, 5079.
37. S. Porada, L. Weinstein, R. Dash, A. van der Wal, M. Bryjak, Y. Gogotsi and P.M. Biesheuvel,
ACS Appl. Mat. & Interf., 2012, 4, 1194.
38. S. Porada, M. Bryjak, A. van der Wal and P.M. Biesheuvel, Electrochimica Acta, 2012, 75, 148.
39. G. Wang, C. Pan, L. Wang, Q. Dong, C. Yu, Z Zhao and J Qiu, Electrochimica Acta, 2012, 69, 65.
40. R. Zhao, M. van Soestbergen, H.H.M. Rijnaarts, A. van der Wal, M.Z. Bazant and P.M. Biesheuvel,
J. Colloid Interface Sci. (2012). DOI: http://dx.doi.org/10.1016/j.jcis.2012.06.022
41. J.-B. Lee, K.-K. Park, H.-M. Eum and C.-W. Lee, Desalination, 2006, 196, 125.
42. H. Li, Y. Gao, L. Pan, Y. Zhang, Y. Chen and Z. Sun, Water Res., 2008, 42, 4923.
43. P.M. Biesheuvel and A. van der Wal, J. Membr. Sci., 2009, 346, 256.
44. Y.-J. Kim, J. Hur, W. Bae and J.-H. Choi, Desalination, 2010, 253, 119.
45. Y.-J. Kim and J.-H. Choi, Water Res., 2010, 44, 990.
46. J.-Y. Lee, S.-J. Seo, S.-H. Yun and S.-H. Moon, Water Res., 2011, 45, 5375.
47. M. Andelman, Sep. & Purif. Techn., 2011, 80, 262.
48. P.M. Biesheuvel, R. Zhao, S. Porada and A. van der Wal, J. Colloid Interf. Sci., 2011, 361, 239.
49. H. Li and L. Zou, Desalination, 2011, 275, 62.
50. M.E. Suss, Th. Baumann, B. Bourcier, Ch. Spadaccini, K.A. Rose, J.G. Santiago, and M.
Stadermann, Energy Environ. Sci., 2012, x, DOI: http://dx.doi.org/10.1039/C2EE21498A
51. J. Biener, M. Stadermann, M. Suss, M.A. Worsley, M.M. Biener, K.A. Rose and Th.F. Baumann,
Energy Environ. Sci., 2011, 4, 656.
52. Y Hou, R. Vidu and P. Stroeve, Ind. Eng. Chem. Res., 2011, 50, 8954.
53. S. Kondrat, V. Presser, C.R. Perez, Y. Gogotsi and A.A. Kornyshev, Energy Environm. Sci., 2012,
5, 6474.
54. S.Sigalov, M.D. Levi, G. Salitra, D. Aurbach, and J. Maier, Electrochem. Comm. 2010, 12, 1718.
55. P.M. Biesheuvel and M.Z. Bazant, Phys. Rev. E, 2010, 81, 031502.
56. P.M. Biesheuvel, Y. Fu and M.Z. Bazant, Phys. Rev. E, 2011, 83, 061507.
57. B.B. Sales, M. Saakes, J.W. Post, C.J.N. Buisman, P.M. Biesheuvel, H.V.M. Hamelers, Environ.
Sci. Technol., 2010, 44, 5661.
11
58. D. Brogioli, R. Zhao and P.M. Biesheuvel, Energy Environm. Sci., 2011, 4, 772.
59. N. Boon and R. van Roij, Mol. Phys., 2011, 109, 1229.
60. P.M. Biesheuvel, Y. Fu and M.Z. Bazant, Russ. J. Electrochem, 2012, 48, 580.
12
Fig. 1. Schematic view of a Membrane Capacitive Deionization-cell. By applying an electrical field, cations in the water flowing through the spacer channel migrate through the cation exchange membrane and are stored inside the adjacent porous carbon electrode (cathode) while anions are stored in the opposite electrode (anode). As a consequence, the water flowing through the cell is desalinated.

13
Fig. 2. Schematic view of MCDI model for ion transport and storage. Here, Jion,i is the ion flux from the spacer channel into the electrode in each of the i=1..M sequential sub-cells. The electrode contains both macropores and micropores. In the macropores cat- and anions have the same concentration cmA, while in the micropores the difference between cation and anion number is compensated by electronic charge present in the carbon matrix.

14
0
20
40
60
-0.1
0.4
0.9
-0.1
0.4
0.9
1.4
-0.1
0.4
0.9
1.4
-5
-3
-1
1
-5
-3
-1
1
-2
-1
0
1
0
20
40
60
0 200 400 600 Time (s)
Sal
t effl
uent
con
cent
ratio
n (m
M)
C
ell v
olta
ge (
V)
C
urre
nt (
A)
(a) (b) (c)
(d) (e) (f)
0
10
20
30
Adsorption
Desorption
Desorption
Adsorption
CC-Zero Volt Desorption
CC-Reverse Current Desorption Data
Theory
0 0
Adsorption
CV-Zero Volt Desorption
Desorption
(g) (h) (i)
0 200 400 600 Time (s)
0 50 100 150 200 Time (s)
0
(c)
0 0
Fig. 3. Comparison of three operational modes of MCDI: constant voltage (CV, left column); constant current during adsorption (CC) with zero voltage during desorption (ZVD, middle column); and CC with reverse current during desorption (RCD, right column). Shown are results for effluent salt concentration (top row), cell voltage (middle row), and current (bottom row), as function of time, for one cycle. Inlet salt concentration: csalt,in=20 mM. In the CV-mode we have adsorption at Vcell=1.2 V and desorption at Vcell=0 V (both steps have a duration of 300 s); in CC-ZVD we have salt adsorption at +1 A until Vcell=1.6 V, while during desorption Vcell=0 V for 500 s; in CC-RCD desorption is controlled by a current of -1 A until the voltage is back at 0 V. Solid blue lines: theoretical simulations, dashed red lines: experimental data.
15
0
10
20
30
0 0.4 0.8 1.2 1.60
10
20
30
0
10
20
30
0 50 100 150 2000
10
20
30
20 40 60 80 100
Time (s)
Effl
uent
con
cent
ratio
n (m
M)
Adsorption
Adsorption
Desorption
Desorption
1.6 A
0.4 A
0.8
1.2
100 mL/min 80 60 40
Effl
uent
con
cent
ratio
n of
the
plat
eaus
(m
M)
current I:
flow rate Φ:
Flow rate Φ (mL/min)
Current I (A)
(a) (b)
(c) (d)
Desorption
Adsorption
Adsorption
Desorption
Concentrate
Freshwater
Concentrate
Freshwater
Fig. 4. Control of effluent concentration of freshwater and concentrate in MCDI-CC-RCD mode, using as control variable: (a) Electrical current, I, and (b) Water flow rate, Φ. The same magnitude of the current is used during ion adsorption (first 120 s), as during ion desorption (second period of ~120 s). Inlet salt concentration csalt,in=20 mM. In (a,b) water flow rate Φ=60 mL/min; in (c,d) current ±1 A. Lines are based on theory, and data are shown as symbols. Arrows point in direction of higher desalination degree.

16
0
0.2
0.4
0.6
0.8
1
0 50 100 150 200 0 50 100 150 200
0 50 100 150 200
0
25
50
75
Salt concentration (mM) Salt concentration (mM)
Ene
rgy
per
ion
rem
oved
(kT
)
CDI-CC-ZVD
CDI-CC-ZVD
MCDI-CC-ZVD
MCDI-CC-ZVD
Dyn
amic
Cha
rge
effic
ienc
y
MCDI-CV
CDI-CV
MCDI-CV
CDI-CV
(b)
(e)
(a)
(d)
(c)
(f)
MCDI-CC-RCD
CDI-CC-RCD
MCDI-CC-RCD
CDI-CC-RCD
Salt concentration (mM)
CC-Zero Volt Desorption
CC-Reverse Current Desorption
CV-Zero Volt Desorption
Fig. 5. Energy consumption and dynamic charge efficiency in CDI and MCDI. Comparison of same three operational modes as in Fig. 3, but now as function of the inlet salt concentration, csalt,in. For other parameter settings, see main text and Fig. 3. Panels a-c show the the energy requirement per ion removed, and panels d-f show the dynamic charge efficiency, Λdyn, being the ratio of the salt adsorption vs charge. In all panels, lines are theory and points are data.

17
pmA,pmi electrode macroporosity, microporosity 30, 30 % * δ thickness of spacer, membrane, electrode 250,140,362 µm * X ion exchange capacity of the membrane 3000 mol/m3 - D ion diffusion coefficient in the spacer channel 1.68⋅10-9 m2/s - Dmem ion diffusion coefficient in the membrane 1.12⋅10-9 m2/s - CSt,vol,0 Stern layer capacitance at zero charge 0.12 GF/m3 *
α parameter to describe non-linear Stern capacity 17.3 F⋅m3/mol2 - Relec specific electrode resistance 0.12 Ω⋅mol/m * fraction of total flow going through one electrode 1 % - µatt chemical attraction term between ions and carbon 1.4 kT * M number of sequential sub-cells in the model 6 *
Table 1. Parameter settings for MCDI transport model. (*/- same/different compared to ref. [48]).

18
Graphical Abstract
0
10
20
30
40
0 50 100 150 200
charging =
ion-adsorption
discharge =
ion-release
low current
high current current reversed
Time (s) Effl
uent
sal
t con
cent
ratio
n (m
M)