power electronics technology for tomorrow’s solutions
TRANSCRIPT
Sameer Pendharkar
TI Senior Fellow and Vice President
Texas Instruments
July 29, 2021
Power electronics technologyfor tomorrow’s solutions
Agenda
• Trends driving electronics
• Importance of power
• Silicon scaling trends and future device requirements
• Recent technology innovations fueling growth
• Requirements to accelerate technology adoption
• Summary
2
3
An increasing appetite for data and electrification
• As electrification and data connectivity needs continue to grow across the globe,
semiconductors will play a key role in creating a better world by making electronics more
efficient and more affordable.
• However, the expectations of consumers will also continue to grow in that electronics and
the resulting semiconductors must also become more robust.
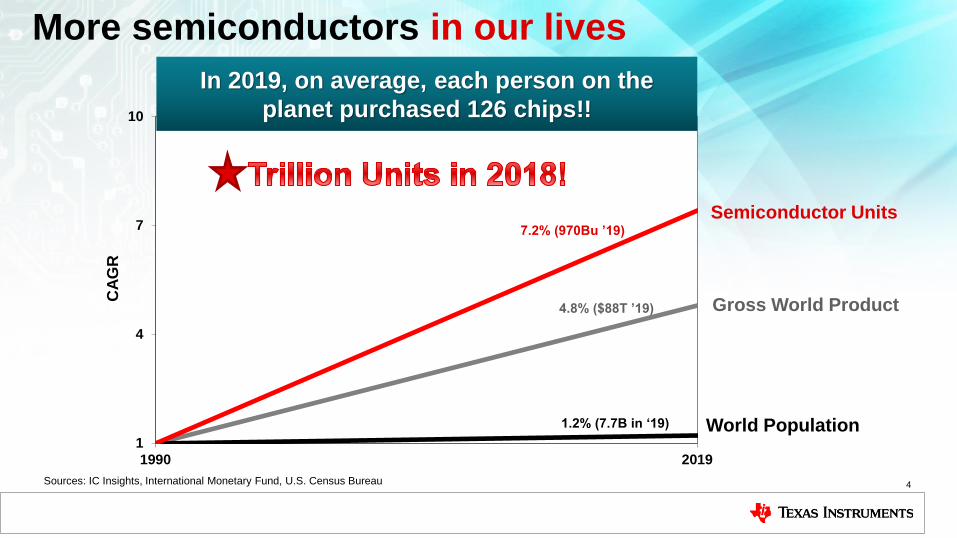
More semiconductors in our lives
4
1
4
7
10
1990 2019
Semiconductor Units
CA
GR
4.8% ($88T ’19)
1.2% (7.7B in ‘19)
Gross World Product
World Population
Sources: IC Insights, International Monetary Fund, U.S. Census Bureau
In 2019, on average, each person on the
planet purchased 126 chips!!
7.2% (970Bu ’19)
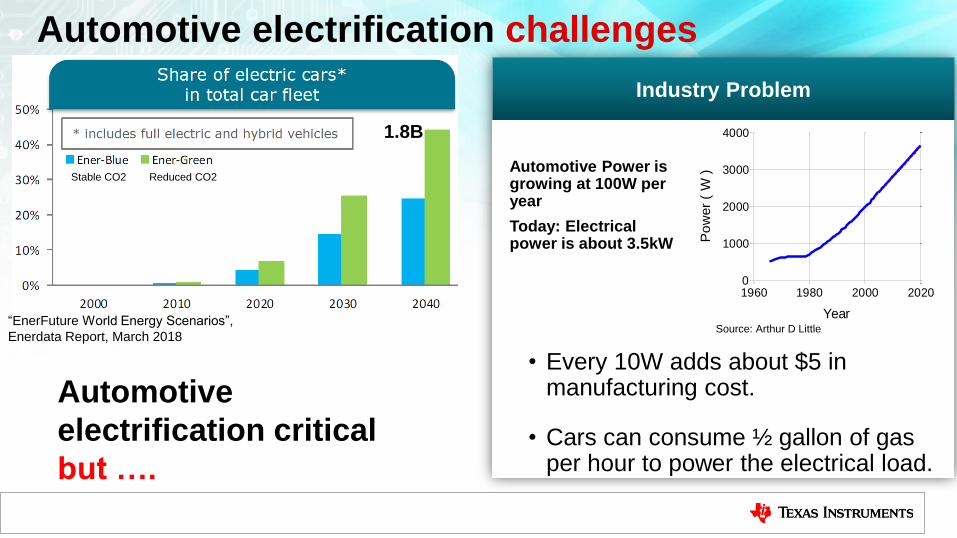
Automotive electrification challenges
Source: Indra Nooyi, President & CFO, Pepsico, April 09, 2005
“EnerFuture World Energy Scenarios”,
Enerdata Report, March 2018
Automotive
electrification critical
but ….
Industry Problem
Automotive Power is growing at 100W per year
Today: Electrical power is about 3.5kW
Source: Arthur D Little
• Every 10W adds about $5 in manufacturing cost.
• Cars can consume ½ gallon of gas per hour to power the electrical load.
1960 1980 2000 20200
1000
2000
3000
4000
Year
Po
wer
( W
)
1.8B
Stable CO2 Reduced CO2
Source: Indra Nooyi, President & CFO, Pepsico, April 09, 2005
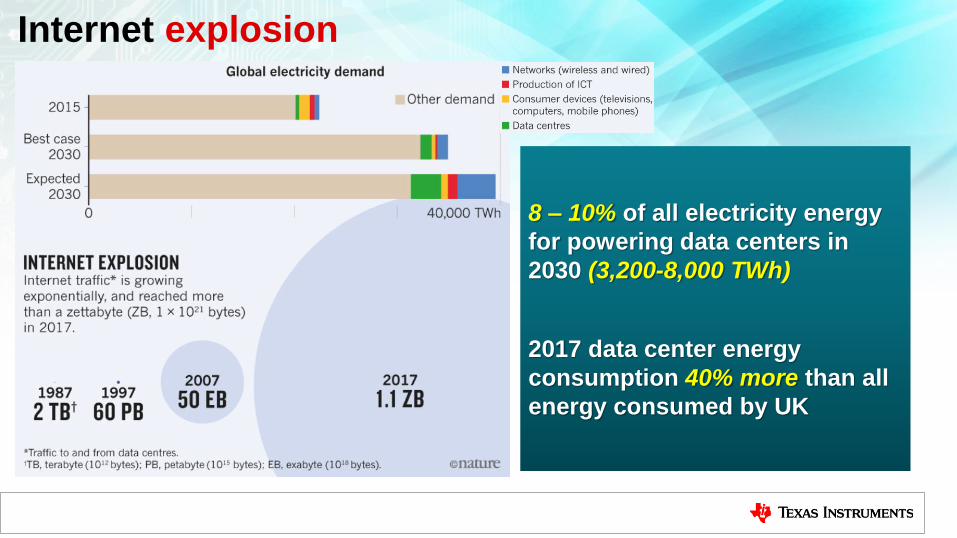
Internet explosion
8 – 10% of all electricity energy
for powering data centers in
2030 (3,200-8,000 TWh)
2017 data center energy
consumption 40% more than all
energy consumed by UK
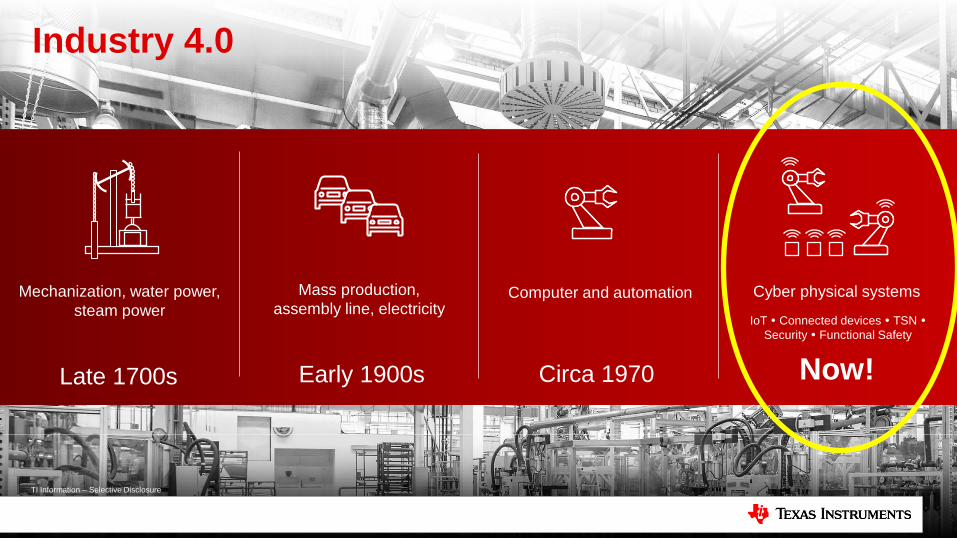
Mechanization, water power,
steam power
Mass production,
assembly line, electricityComputer and automation Cyber physical systems
Late 1700s Early 1900s Circa 1970 Now!
Industry 4.0
IoT Connected devices TSN
Security Functional Safety
7TI Information – Selective Disclosure
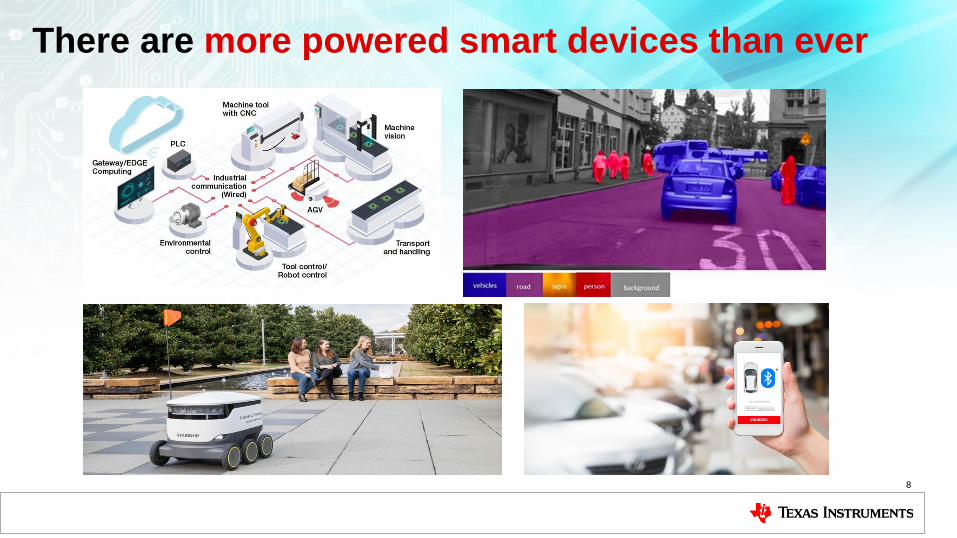
There are more powered smart devices than ever
8
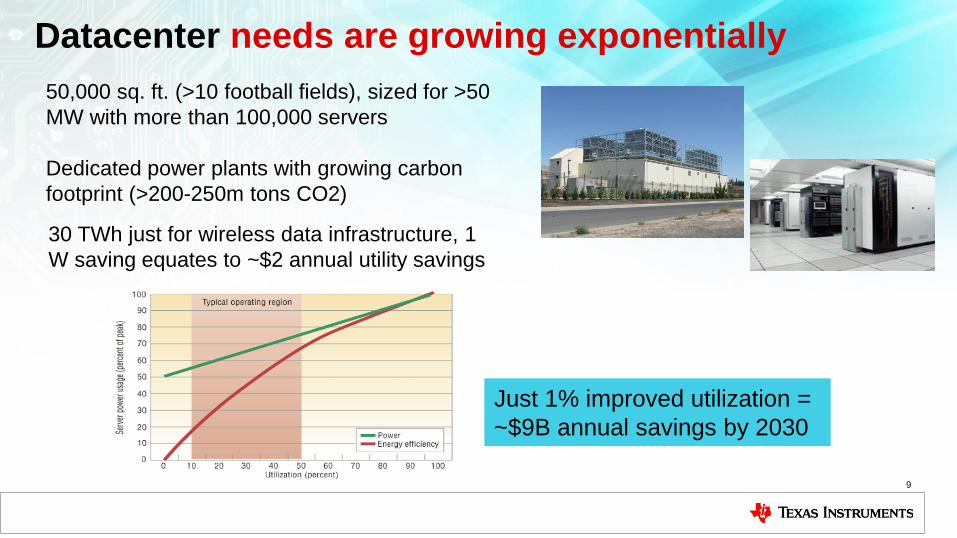
Datacenter needs are growing exponentially
9
50,000 sq. ft. (>10 football fields), sized for >50
MW with more than 100,000 servers
Dedicated power plants with growing carbon
footprint (>200-250m tons CO2)
30 TWh just for wireless data infrastructure, 1
W saving equates to ~$2 annual utility savings
Just 1% improved utilization =
~$9B annual savings by 2030
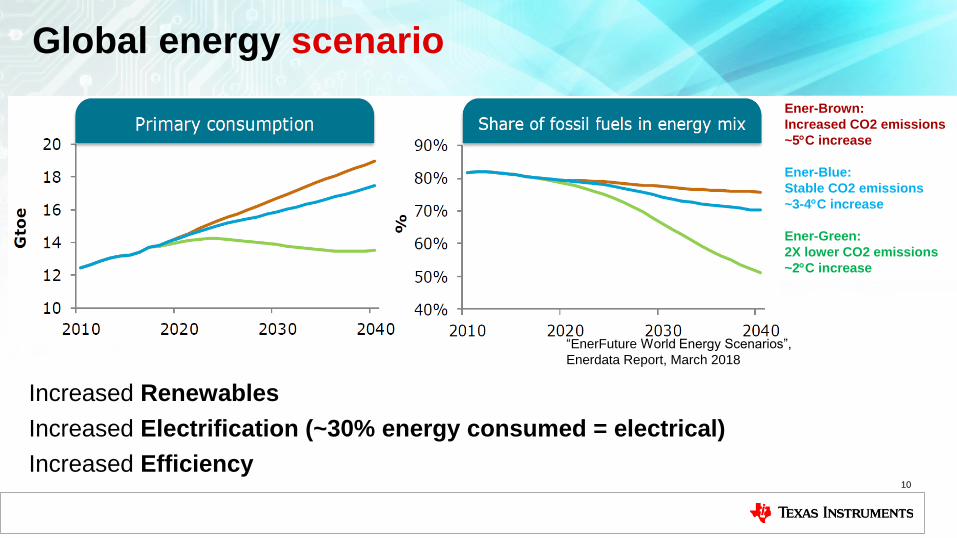
Global energy scenario
10
Increased Renewables
Increased Electrification (~30% energy consumed = electrical)
Increased Efficiency
“EnerFuture World Energy Scenarios”,
Enerdata Report, March 2018
Ener-Brown:
Increased CO2 emissions
~5C increase
Ener-Blue:
Stable CO2 emissions
~3-4C increase
Ener-Green:
2X lower CO2 emissions
~2C increase
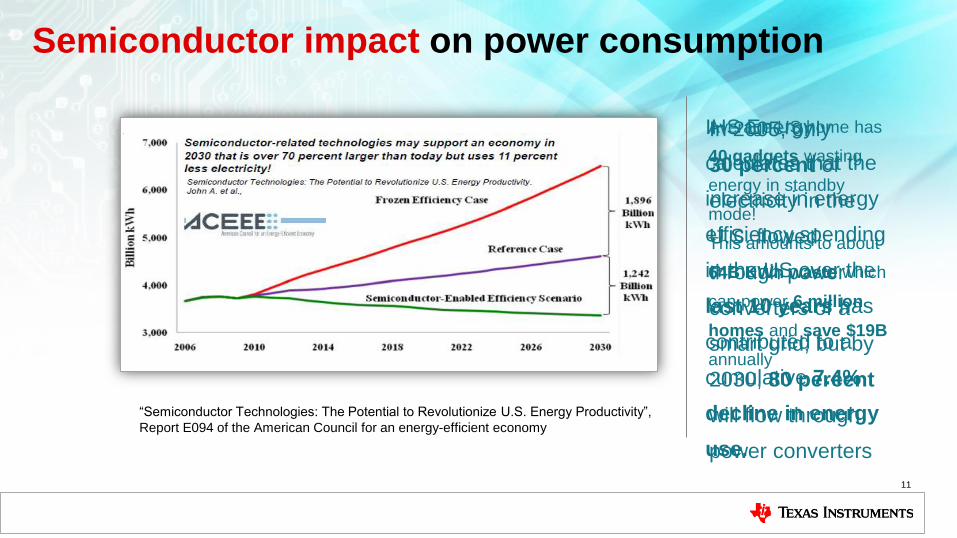
Semiconductor impact on power consumption
11
In 2005, only
30 percent of
electricity in the
U.S. flowed
through power
converters of a
smart grid; but by
2030, 80 percent
will flow through
power converters
“Semiconductor Technologies: The Potential to Revolutionize U.S. Energy Productivity”,
Report E094 of the American Council for an energy-efficient economy
IHS Energy
calculates that the
increase in energy
efficiency spending
in the US over the
last 10 years has
contributed to a
cumulative 7.4%
decline in energy
use.
Average US home has
40 gadgets wasting
energy in standby
mode!
This amounts to about
64B KWh waste which
can power 6 million
homes and save $19B
annually
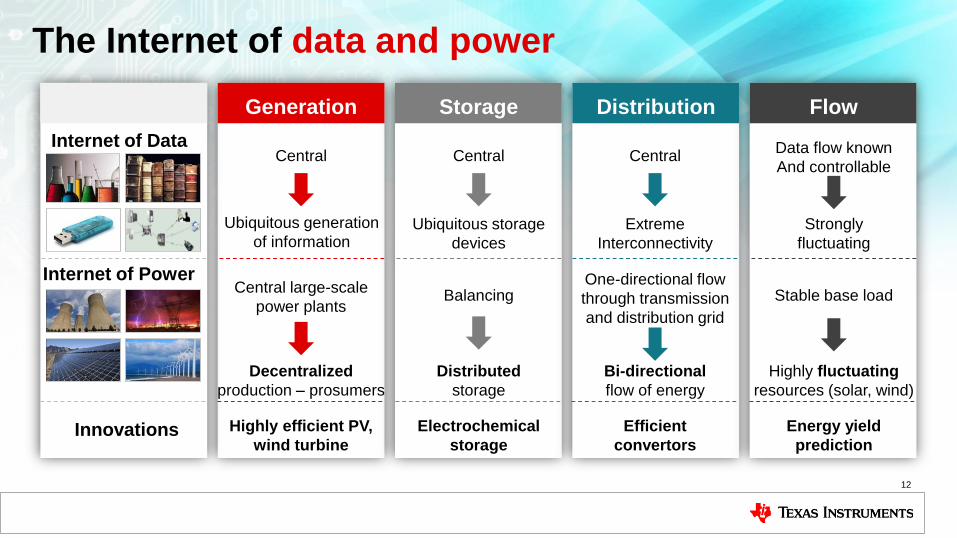
The Internet of data and power
12
Generation Storage Distribution Flow
Central
Ubiquitous generation
of information
Central large-scale
power plants
Decentralized
production – prosumers
Highly efficient PV,
wind turbine
Central
Ubiquitous storage
devices
Balancing
Distributed
storage
Electrochemical
storage
Central
Extreme
Interconnectivity
One-directional flow
through transmission
and distribution grid
Bi-directional
flow of energy
Efficient
convertors
Data flow known
And controllable
Strongly
fluctuating
Stable base load
Highly fluctuating
resources (solar, wind)
Energy yield
prediction
Internet of Data
Internet of Power
Innovations
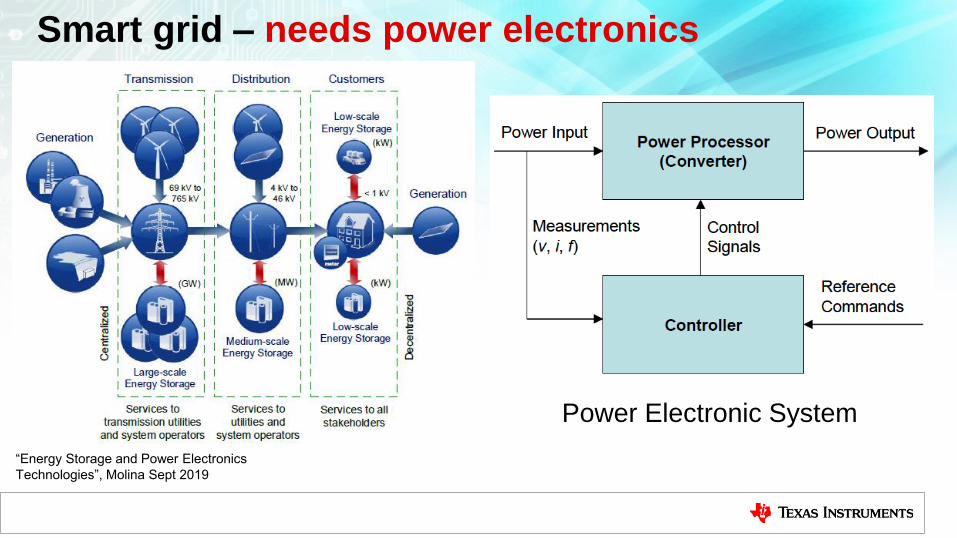
Smart grid
Source: Indra Nooyi, President & CFO, Pepsico, April 09, 2005
“Energy Storage and Power Electronics
Technologies”, Molina Sept 2019
Power Electronic System
– needs power electronics
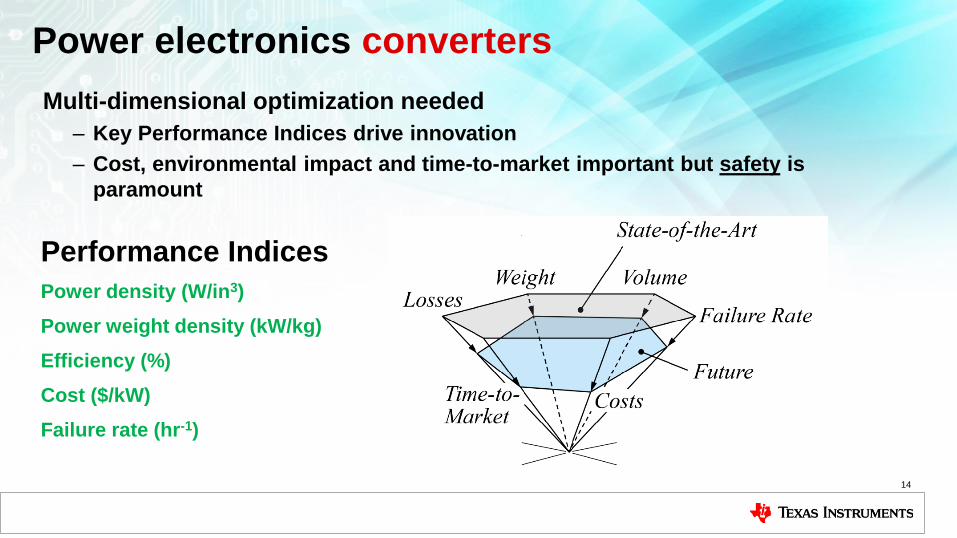
Power electronics converters
Multi-dimensional optimization needed
– Key Performance Indices drive innovation
– Cost, environmental impact and time-to-market important but safety is
paramount
14
Performance Indices
Power density (W/in3)
Power weight density (kW/kg)
Efficiency (%)
Cost ($/kW)
Failure rate (hr-1)
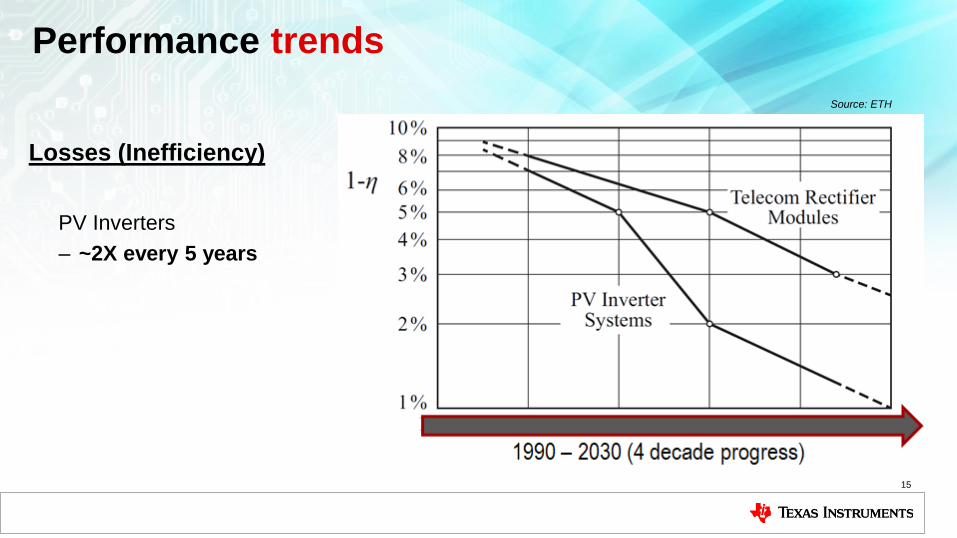
Performance trends
Losses (Inefficiency)
PV Inverters
– ~2X every 5 years
15
Source: ETH
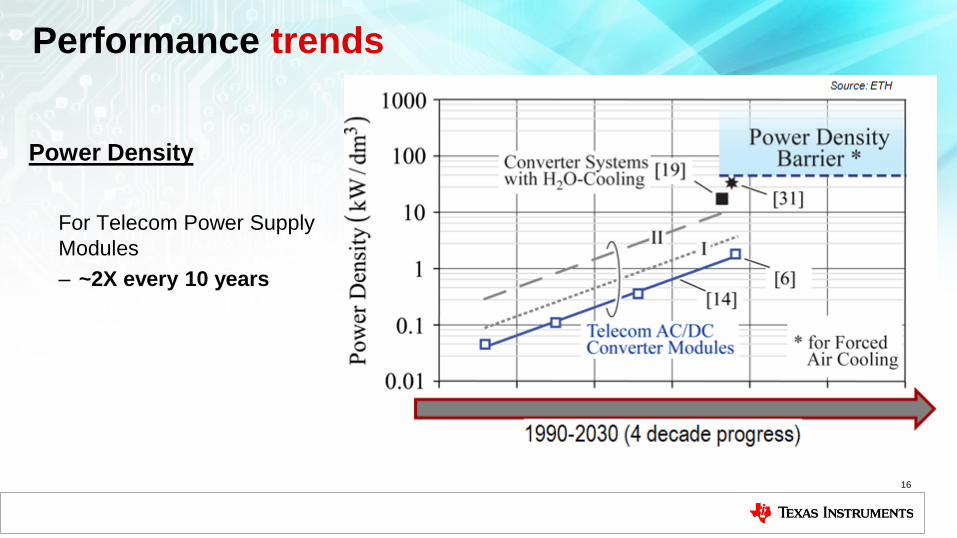
Performance trends
Power Density
For Telecom Power Supply
Modules
– ~2X every 10 years
16
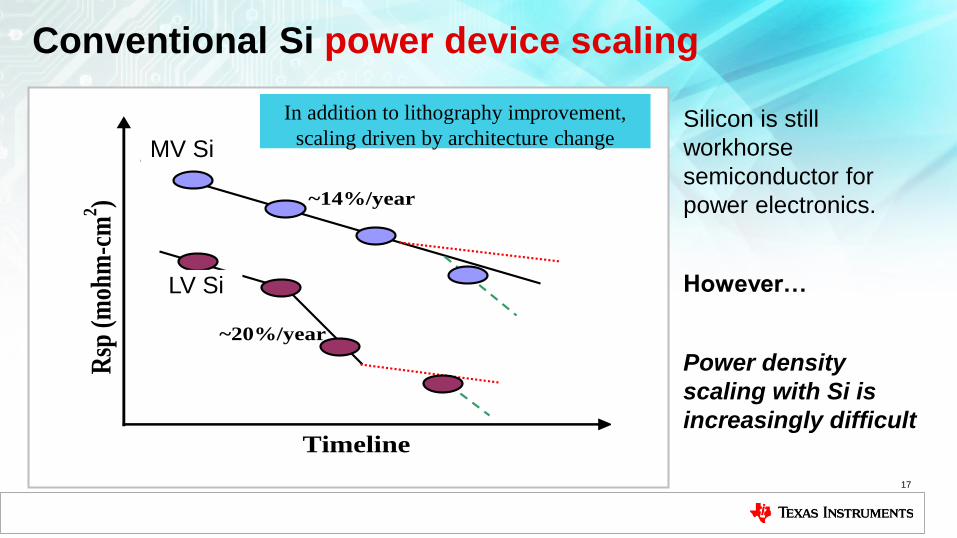
Conventional Si power device scaling
17
Silicon is still
workhorse
semiconductor for
power electronics.
However…
Power density
scaling with Si is
increasingly difficult
Rsp
(m
ohm
-cm
2 )
Timeline
~50V ldmos
~20V ldmos
~14%/year
~20%/year
In addition to lithography improvement,
scaling driven by architecture changeMV Si
LV Si
R.QG
R.Qsw
R.Qrr
R.QossPower
RSP
$.Ohm
GaN
SiC
Si SJ
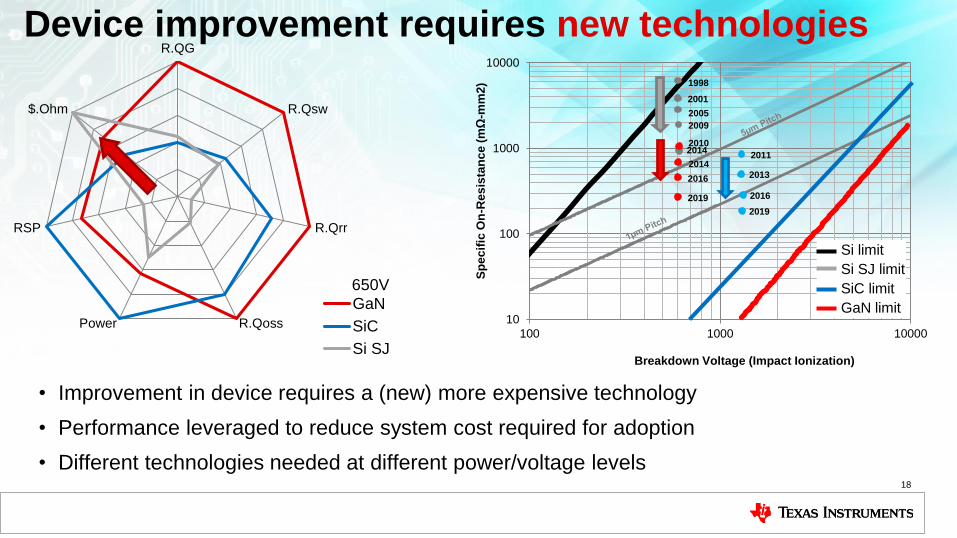
Device improvement requires new technologies
18
• Improvement in device requires a (new) more expensive technology
• Performance leveraged to reduce system cost required for adoption
• Different technologies needed at different power/voltage levels
10
100
1000
10000
100 1000 10000
Sp
ec
ific
On
-Re
sis
tan
ce
(m
Ω-m
m2
)
Breakdown Voltage (Impact Ionization)
Si limit
Si SJ limit
SiC limit
GaN limit
1998
2001
2005
2009
2014
650V
2011
2013
2016
2010
2014
2016
2019
2019
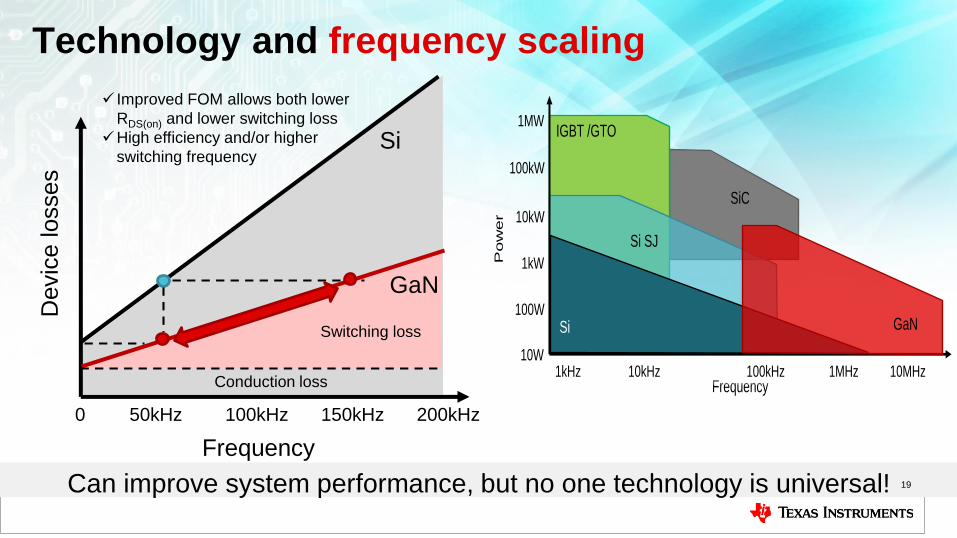
Technology and frequency scaling
Frequency
0 50kHz 100kHz 150kHz 200kHz
Devic
e losses
Si
GaN
Switching loss
Improved FOM allows both lower
RDS(on) and lower switching loss
High efficiency and/or higher
switching frequency
Conduction loss
Can improve system performance, but no one technology is universal! 19
Frequency1kHz 10kHz 100kHz 1MHz 10MHz
1MW
100W
1kW
10kW
100kW
10W
IGBT /GTO
GaNSi
Si SJ
SiC
Pow
er
7th Si SJ
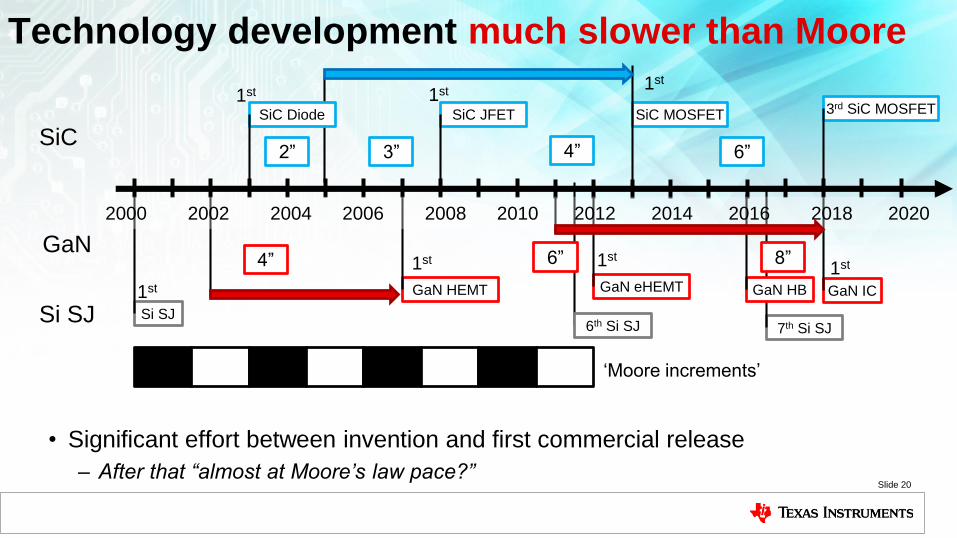
Technology development much slower than Moore
• Significant effort between invention and first commercial release
– After that “almost at Moore’s law pace?”Slide 20
SiC Diode SiC JFET
GaN eHEMT GaN IC
1st 1st1st
SiC MOSFET
GaN HEMT
1st1st
GaN HB
2” 3” 6”4”
4” 6” 8”
Si SJ
1st
6th Si SJ
3rd SiC MOSFET
2000 2002 2004 2006 2008 2010 2012 2014 2016 2018 2020
‘Moore increments’
SiC
GaN
Si SJ
1st
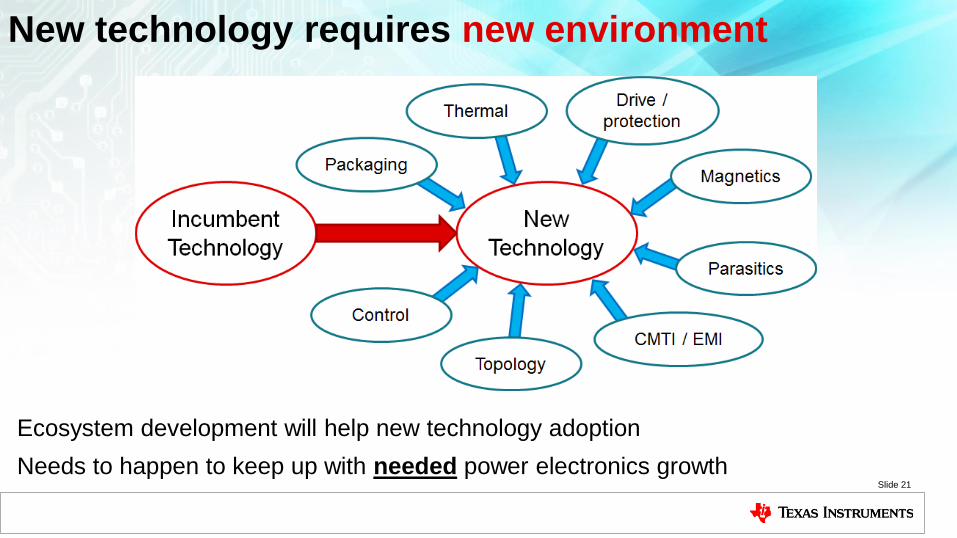
New technology requires new environment
Ecosystem development will help new technology adoption
Needs to happen to keep up with needed power electronics growthSlide 21
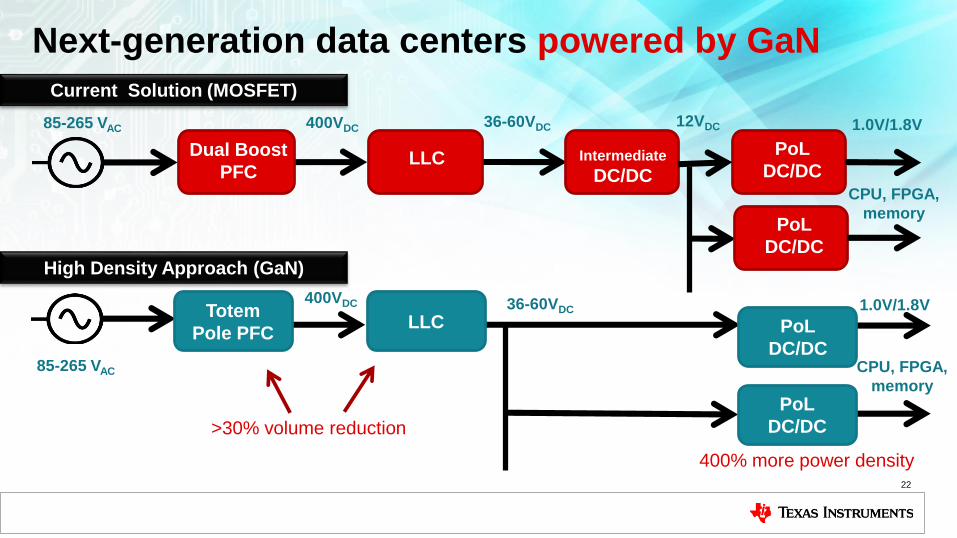
Next-generation data centers powered by GaN
22
Dual Boost
PFC
400VDC
LLC
36-60VDC
Intermediate
DC/DC
12VDC
CPU, FPGA,
memory
PoL
DC/DC
Current Solution (MOSFET)
LLC
High Density Approach (GaN)
85-265 VAC
85-265 VAC
36-60VDC400VDC
CPU, FPGA,
memory
Totem
Pole PFCLLC PoL
DC/DC
PoL
DC/DC>30% volume reduction
400% more power density
PoL
DC/DC
1.0V/1.8V
1.0V/1.8V
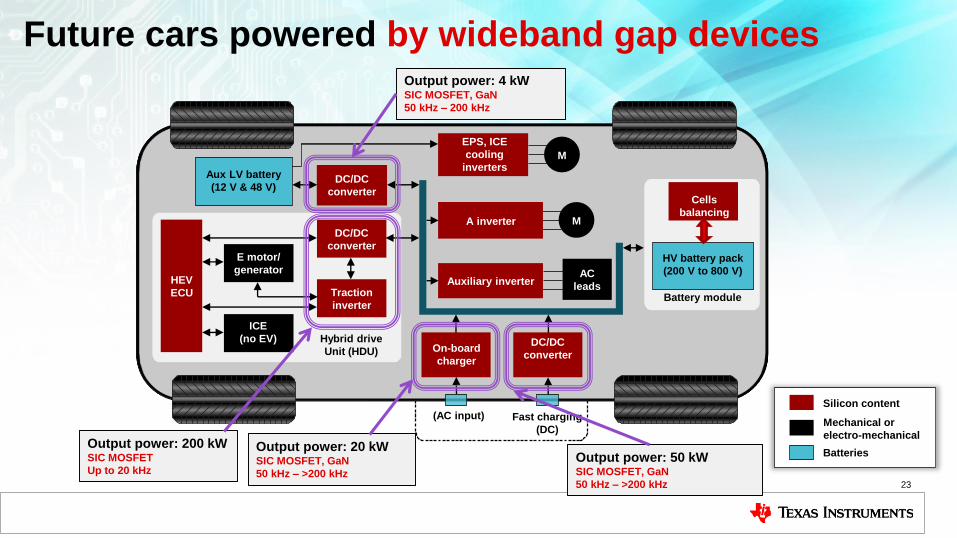
Future cars powered by wideband gap devices
23
Output power: 200 kWSIC MOSFET
Up to 20 kHz
Output power: 20 kWSIC MOSFET, GaN
50 kHz – >200 kHz
Output power: 4 kWSIC MOSFET, GaN
50 kHz – 200 kHz
Output power: 50 kWSIC MOSFET, GaN
50 kHz – >200 kHz
(AC input) Fast charging
(DC)
Silicon content
Mechanical or
electro-mechanical
Batteries
EPS, ICE
cooling
inverters
DC/DC
converter
HEV
ECU
E motor/
generator
ICE
(no EV)
Traction
inverter
Auxiliary inverter
A inverter
DC/DC
converter
On-board
charger
DC/DC
converter
Cells
balancing
M
AC
leads
HV battery pack
(200 V to 800 V)
Hybrid drive
Unit (HDU)
M
Battery module
Aux LV battery
(12 V & 48 V)
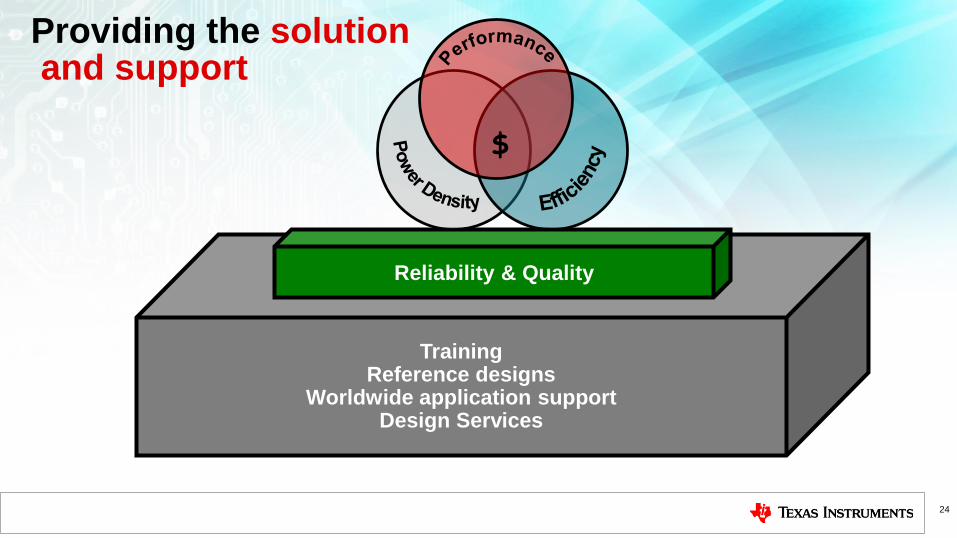
TrainingReference designs
Worldwide application supportDesign Services
Providing the solutionand support
24
Reliability & Quality
$
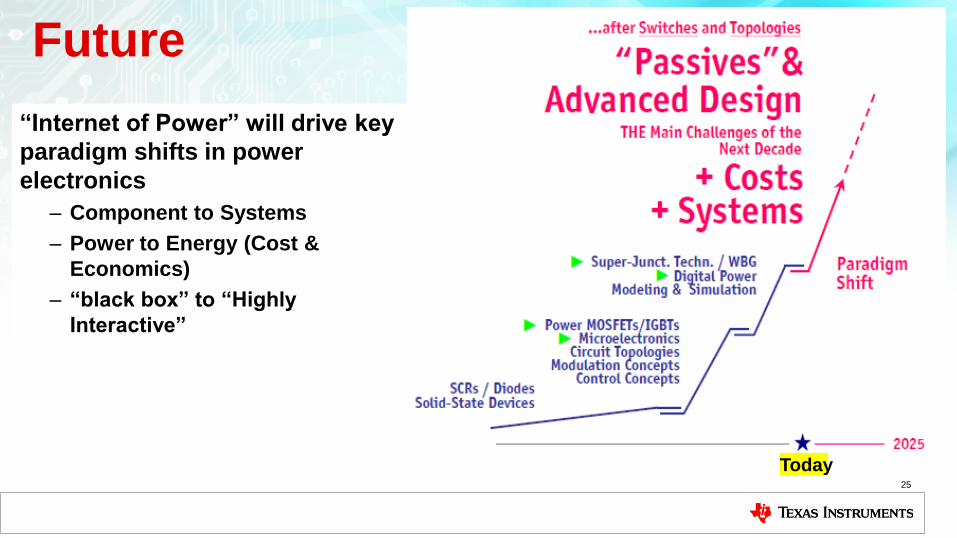
Future
“Internet of Power” will drive key
paradigm shifts in power
electronics
– Component to Systems
– Power to Energy (Cost &
Economics)
– “black box” to “Highly
Interactive”
25
Today
Summary
26
• Energy management is absolutely critical for a better tomorrow
• Technological advances in semiconductors fueling the growth and energy consumption
• However, innovations in the same (power) semiconductor industry and in power electronics and control crucial for improving energy efficiency

Thank you!
27