power grid corporation of india limited. stock idea power ... · ambitious plan to provide power ....
TRANSCRIPT

PGCIL
Power Grid Corporation of India Limited. STOCK IDEA
Power-Transmission & Distribution Rating: Buy
Date May 14, 2015 CMP (Rs.) 140 Target (Rs.) 181 Potential Upside 29% BSE Sensex 27,251 NSE Nifty 8,235 Scrip Code Bloomberg PWGR IN Reuters PGRD.BO BSE Group A BSE Code 532898 NSE Symbol POWERGRID Market Data Market Cap.(Rs. Cr) 73,478 Equity Sh. Cap. (Rs Cr) 5,232 52 Wk High/Low 159/102 Avg. Quarterly Volume 25,01,872 Face Value (Rs.) 10 Shareholding Pattern (As on 31st Mar 2015) FII 27.55 DII 7.94 Promoters 57.9 Public & Others 6.61 Total 100.00 Comparative Price Chart
Ravikant Sangepag Research Analyst [email protected] Arun Gopalan VP – Research & Investments [email protected]
Power Grid Corporation of India Limited. (PGCIL) is a Navratna company with around 70-80% market share in the transmission space with a near monopoly in inter-state transmission. The company is expected to directly benefit from the nation’s ambitious plan to provide power to all of India’s 1.2 billion people by 2022. With the government increasing its focus on under-invested T&D sector, huge investment is expected in 12th and 13th 5 year plan. Around 1,07,440 & 2,57,000 Ckt Km of grid network addition is expected in 12th and 13th plan respectively. 46,100 and 52,800 MW of inter-regional transmission capacity addition is envisaged in 12th and 13th plan respectively. PGCIL has gone into top gear and exceeded CAPEX in FY15 (Rs. 17,700 in 9M FY15) while CAPEX-commissioning remained in tandem. On the back of ongoing and future CAPEX, we believe that PGCIL’s medium-term earnings outlook remains robust (FY15-17E EPS CAGR: 21%). With a robust revenue model and clear visibility of earning, we believe that the company is the best play in a difficult sector where most of the companies are struggling.
Robust CAPEX plan coupled with focus on execution to keep revenue on the growth path: The company incurred capital expenditure of over Rs. 22,000 crore in FY14, Rs. 17,700 in 9M FY15 and plans to invest similar amounts during each of the two years until FY17. The company's major cost is capital expenditure on setting up transmission lines, while there is hardly any operational cost. As a result it has an operating margin as high as 90%. Capitalization ratio for 9M FY15 stood at 98%, significantly higher than 80% in FY14 and 86% in FY13 reflecting management’s focus on execution. On the back of robust CAPEX plans with timely execution, we expect PGCIL to register revenue growth of 17% & 18% in FY16 & FY17 respectively.
Low risk business model: Tariffs are set by the Central Electricity Regulatory Commission (CERC) allow the company a complete pass-through of costs plus an assured return on equity of 15.5% on its completed projects with an additional 0.5% for timely completion of projects. The company has already signed power transmission agreement with majority of the projects slotted for the 12th Plan. PGCIL's low-risk business model and strong earnings visibility offer a defensive investment opportunity in current volatile environment.
Quasi monopoly in industry even after opening entry for private players: Nearly 80% of the power transmission business is carried out and controlled by PGCIL, the sector was opened up to the private sector in 2011 to keep pace with the rapid expansion of generation capacity. Moreover opening up the sector for private players has not benefited them significantly because of provisions like “compressed time schedule” which vests discretion with the ministry to nominate PGCIL for executing projects if it is convinced that the bidding route could delay projects that are of critical nature, requiring time-bound execution.
Being an early player in transmission, PGCIL enjoys an unassailable position as market leader with a 70-80% market share. Its Navratna PSU status gives it a clear advantage in raising cheaper finance. PGCIL is advantageously positioned to benefit from economies of scale in future bidding, given its strong position as the leading inter-state transmission player, together with its strong balance sheet. Valuation & Outlook: At the current price of Rs 140, the stock trades at 1.6x FY16E book value of Rs 86, which is significantly lower than historical average of 2.1x. It trades at a premium to Tata Power and NTPC, the other listed players in the power sector with an assured return model. The higher multiple is justified, given the better earning visibility, shorter gestation for project execution that results in lower locked-up capital, and the better growth prospects. We value the company at 2.1x its FY16E book value and recommend buy with a target of Rs. 181, an upside of 29% in 12 months.
Particulars Sales (Rs. Cr)
EBITDA (Rs. Cr)
EBITDAM (%)
PAT (Rs. Cr)
PATM (%)
EPS (Rs.)
BVPS (Rs.)
P/E (x)
P/BV (x)
EV/EBITDA (x)
FY14 15,230 12,936 85 4,497 30 8.6 65.9 16.3 2.1 6.7 FY15E 16,753 14,358 86 4,722 28 9.0 74.9 15.6 1.9 6.0 FY16E 19,601 16,838 86 5,875 30 11.2 86.1 12.5 1.6 5.1 FY17E 23,130 19,961 86 6,896 30 13.2 99.3 10.6 1.4 4.3
100
110
120
130
140
150
160
May-14 Aug-14 Nov-14 Feb-15 May-15
PGCIL Sensex

PGCIL
The Story in Charts Stores & Advances Vs CWIP Installed (Rs 000 Cr)
CAPEX Plans (Rs. 000 Cr.)
Capitalization ratio (Capitalization/CAPEX)
-
5
10
15
20
25
30
35
40
20
10
-11
20
11
-12
20
12
-13
20
13
-14
9M
FY1
5
Const Stores & Advances CWIP Installed
7 8
11
14
18
20
22 22 23 23
5
7
9
11
13
15
17
19
21
23
25
FY0
8
FY0
9
FY1
0
FY1
1
FY1
2
FY1
3
FY1
4
FY1
5(E
)
FY1
6(E
)
FY1
7(E
)
61%
79% 86%
80%
98%
60%
65%
70%
75%
80%
85%
90%
95%
100%
20
10
-11
20
11
-12
20
12
-13
20
13
-14
9M
FY1
5
Focus on execution visible as stores & advances are getting converted in to CWIP
Increasing capitalization to boost revenue growth further.
Ongoing and future CAPEX plan impart revenue visibility

PGCIL
Industry Overview
Although, the Indian power sector is one of the fastest growing sectors in the world and energy availability has increased by around 36% in the past 5 years, India has always been a power-deficient country. The demand for power is huge in India and supply of power has not been able to meet its demand. Despite doubling of the installed generation capacity between FY13 and FY12, for most Indian states power deficit and blackouts are still common. One of the key reasons for this has been the skewed investment allocation in favor of generation instead of equal split with T&D. There is significant distance between power generation/ surplus centers like eastern & north-eastern regions and power consumption/deficit centers like southern region. The northern grid failure followed by a cascade impact and subsequent collapse of the Eastern and North Eastern power grids in 2012 was one of the biggest ever power failure in Indian history. In a vehement manner, it has established the need to earmark a greater investment towards T&D CAPEX and to create more robust transmission infrastructure backbone. Power distribution in India needs sweeping reforms if it is to bring back the country to a high growth trajectory and meet its goal of expanding access to electricity to all by 2019. Today, India’s annual per capita power
sector consumption at around 800 kWh is among the lowest levels in the world. A strong T&D system is critical for optimal utilization of resources through effective evacuation from surplus regions and dispensation in the deficit regions. In the 12th five year plan, the government has made an effort to correct this anomaly by increasing the share of T&D sector in the planned capital expenditure for the sector. Significant CAPEX allocation has been earmarked to create evacuation infrastructure for upcoming Independent Power Producer (IPP) generation facilities, to connect renewable energy facilities and to strengthen and modernize transmission infrastructure. The announcement of formation of Infrastructure Investment Trust for financing the infrastructure projects by Finance Minister in the budget will provide the opportunities to business to grow. The promotion of Public-Private Partnership (PPP) model is an effective tool to bring private-sector investments in the Infrastructure Sector. Transmission Capacity Addition (000 Ckt Km)
Inter-Regional Cumulative Transmission Capacity (000 MW)
0
100
200
300
400
500
600
700
9th
Pla
n
10
th P
lan
11
th P
lan
12
th P
lan
(E)
13
th P
lan
(E)
0
20
40
60
80
100
120
140
9th
Pla
n
10
th P
lan
11
th P
lan
12
th P
lan
13
th P
lan
India has always been a power-deficient country with skewed investment allocation in favor of generation instead of equal split with T&D
In the 12th five year plan, the government has made an effort to correct this anomaly by increasing the share of T&D sector in the planned capital expenditure.
Around 1,07,440 & 2,57,000 Ckt Km of grid network addition is expected in 12
th and 13
th plan
respectively.
Over 46,100 and 52,800 MW of inter-regional transmission capacity addition is expected in 12
th and 13
th plan respectively.

PGCIL
Company Background
Power Grid Corporation of India Limited, the 'Central Transmison Utility (CTU)' of the country and a 'Navratna' Company operating under Ministry of Power, Founded in 1981, the company is engaged in power transmission business with the responsibility for planning, implementation, operation and maintenance of inter-State transmission system and operation of National & Regional Power Grids. PGCIL along with its subsidiaries has been implementing various transmission projects for generation capacity addition under central sector, Ultra Mega Power Projects (UMPPs), Independent Power Producers (IPPs) and other projects. As on December 31, 2014, the Company owns & operates transmission network of about 1,13,587 Ckt Km of transmission lines and 188 nos. of EHVAC & HVDC substations with transformation capacity of about 2,19,579 MVA. The Company continues to wheel about 50% of total power generated in the Country. The company has established nationwide synchronous power grid, interconnecting five regional grids. As on December 31, 2014, National Grid capacity with inter-regional power transfer stands at 46,450 MW. The inter-regional power transfer capacity is envisaged to be augmented to about 72,250MW by the end of the XII Plan (2016-17). Eleven High Capacity Power Transmission Corridors (HCPTCs) have been finalized to meet bulk power evacuation requirement of various Independent Power Producers (IPPs) mainly coming up in resource rich and coastal States such as Chhattisgarh, Odisha, Madhya Pradesh, Sikkim, Jharkhand, Tamil Nadu and Andhra Pradesh at an estimated cost of about Rs. 75,000 Crore (PGCIL's scope: about Rs. 66,000 Cr). Implementation of these corridors has been taken up in a phased manner matching with generation projects. An investment of about Rs. 1,00,000 Crore has been envisaged by the Company for further development of inter-State transmission systems during XII Plan which includes development of High Capacity Power Transmission Corridors (HCPTCs) apart from inter-regional links for enhancement of National Grid capacity & various system strengthening schemes. This will be used for augmenting the transmission system by about 40,000 ckm of transmission lines and about 1,00,000 MVA of transformation capacity. To shore up its revenue and create value for its stakeholders, PGCIL diversified into telecom business and is managing a pan-India Broad Band Telecom Network of about 30,000 kms providing back-bone connectivity to all metros, major cities & towns including remote areas of J&K & North-eastern States etc. The Company is one of the three agencies selected by Govt. of India for providing connectivity for the prestigious 'National Knowledge Network' project which aims to connect all knowledge centers across the country such as IITs, IISc, etc. on high speed connectivity. POWERGRID has been nominated as one of the implementing agencies for this project and has been entrusted with the task of development and maintenance of the NOFN network in five states, namely Andhra Pradesh (Partial), Telangana, Himachal Pradesh, Jharkhand and Odisha. In addition, POWERGRID is offering consultancy services to various National clients & International clients, including many South Asian, African, and Middle East countries. PGCIL is playing a significant role in carrying forward the distribution reforms through undertaking RGGVY works on behalf of the Govt. of India in various parts of the country. The company has emerged as a strong player in South Asia and is playing an active role in formation of a strong SAARC grid for effective utilization of resources for mutual benefits. Presently, various electrical interconnections exist between India & Bhutan, India & Nepal and India & Bangladesh. Further, the interconnection between India & Bhutan and India & Nepal are being strengthened for substantial exchange of power across the borders. PGCIL has taken leadership initiative for development of Smart Grid technology in the country integrating all segments in power supply chain. In distribution system. PGCIL has established Smart Grid Control Centre at Puducherry with provision of Advanced Metering Infrastructure (AMI) solution and other functionalities like Outage Management System, Demand Response, Microgrid etc. are being taken up in a progressive manner. A number of such Smart Cities have been planned for other cities in the country. In Smart transmission, PGCIL has implemented Synchrophasor Technology in its Wide Area Measurement System (WAMS) Pilot Project through installation of PMUs (Phasor Measurement Units) in all 5 Regions, which facilitates better visualization and situational awareness of the grid events such as grid robustness, oscillations, angle/ voltage instability, system margin etc. as well as decision support tools. POWERGRID also acts as 'nodal point' in prestigious "India Smart Grid Task Force" Secretariat for Government's activities related to Smart Grid.
PGCIL is the largest power transmission utility in the country
The Company owns and operates 1,13,587 Ckt Km of transmission line with capacity of about 2,19,579 MVA
Diversification in consulting and
telecom business to strengthen
business model in longer term
As a leader in the T&D industry,
PGCIL is driving reforms on behalf
of Government of India
Huge potential lies with Smart Grid
Technology as 100 planned smart
cities are expected to come up in
near future
High Capacity Power Transmission Corridors (HCPTCs) offer additional potential opportunity of Rs. 66,000 Cr.
PGCIL
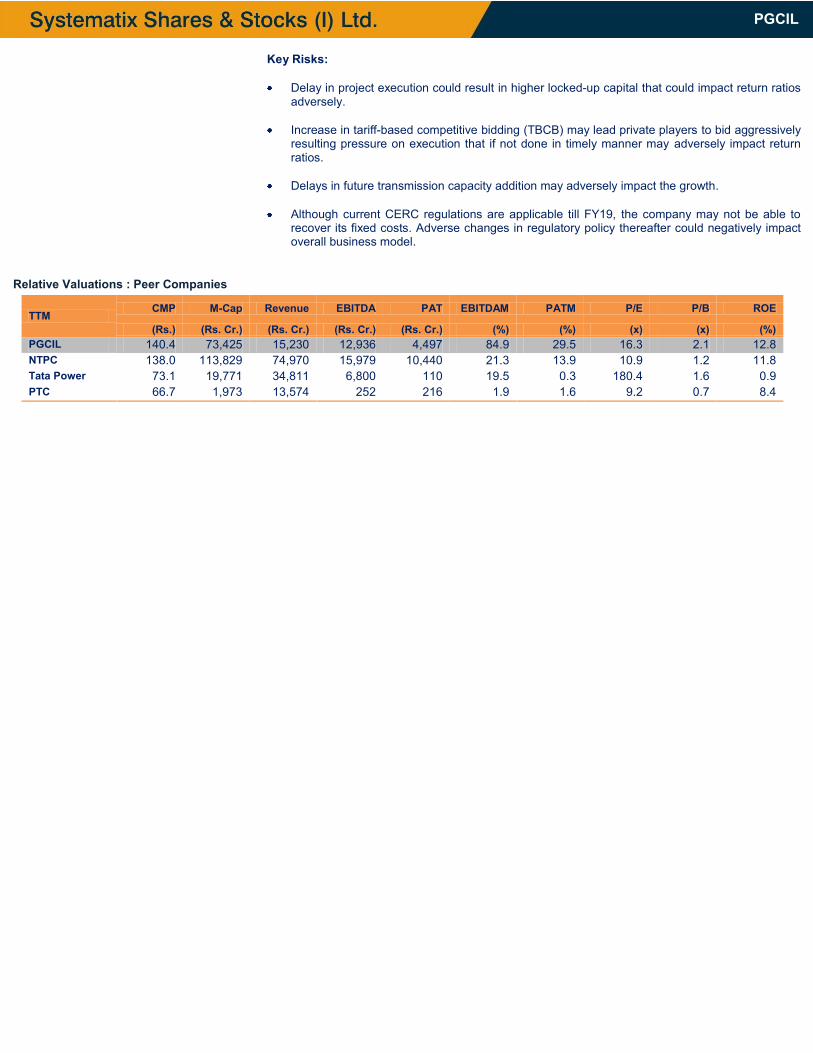
Key Risks: Delay in project execution could result in higher locked-up capital that could impact return ratios
adversely.
Increase in tariff-based competitive bidding (TBCB) may lead private players to bid aggressively resulting pressure on execution that if not done in timely manner may adversely impact return ratios.
Delays in future transmission capacity addition may adversely impact the growth.
Although current CERC regulations are applicable till FY19, the company may not be able to recover its fixed costs. Adverse changes in regulatory policy thereafter could negatively impact overall business model.
Relative Valuations : Peer Companies
TTM CMP M-Cap Revenue EBITDA PAT EBITDAM PATM P/E P/B ROE
(Rs.) (Rs. Cr.) (Rs. Cr.) (Rs. Cr.) (Rs. Cr.) (%) (%) (x) (x) (%) PGCIL 140.4 73,425 15,230 12,936 4,497 84.9 29.5 16.3 2.1 12.8 NTPC 138.0 113,829 74,970 15,979 10,440 21.3 13.9 10.9 1.2 11.8 Tata Power 73.1 19,771 34,811 6,800 110 19.5 0.3 180.4 1.6 0.9 PTC 66.7 1,973 13,574 252 216 1.9 1.6 9.2 0.7 8.4

PGCIL
FINANCIAL PERFORMANCE
PROFIT & LOSS (Rs Cr) CASH FLOW (Rs Cr)
Particulars FY13 FY14 FY15E FY16E FY17E Particulars FY13 FY14 FY15E FY16E FY17E
Revenue 12,758 15,230 16,753 19,601 23,130 Cash from operating act. 10,480 13,057 8,681 14,075 17,005 Transmission expenses 872 1,113 1,173 1,372 1,573 Cash from investing act. 24,508 29,451 7,400 23,083 25,210 Employee cost 886 942 988 1,156 1,318 Cash from financing act. 13,353 19,149 172 12,078 11,335 Other operating expenses 39 240 235 235 278 Net Change in Cash (675) 2,756 1,453 3,070 3,130
EBITDA 10,961 12,936 14,358 16,838 19,961
Depreciation 3,352 3,996 4,968 5,818 7,158 RATIO ANALYSIS
Other Income 571 491 529 627 740 Particulars FY13 FY14 FY15E FY16E FY17E
EBIT 8,180 9,431 9,919 11,646 13,543 General
Interest Expenses 2,535 3,168 3,965 4,256 4,814 EPS 9.1 8.6 9.0 11.2 13.2Profit Before Tax 5,645 6,264 5,954 7,390 8,730 BVPS 56.7 65.9 74.9 86.1 99.3Tax 1,410 1,766 1,232 1,515 1,833 ROE 17.0% 14.8% 12.8% 13.9% 14.2%PAT 4,235 4,497 4,722 5,875 6,896 WC as % of Sales -33.8% -45.9% -48.7% -42.6% -42.4%
Growth
BALANCE SHEET (Rs Cr) Revenue 25.5% 19.4% 10.0% 17.0% 18.0%Particulars FY13 FY14 FY15E FY16E FY17E EBITDA 29.1% 18.0% 11.0% 17.3% 18.5%Share Capital 4,630 5,232 5,232 5,232 5,232 PAT 30.1% 6.2% 5.0% 24.4% 17.4%Reserves & Surplus 21,610 29,228 33,950 39,825 46,721 Profitability
Total Shareholder funds 26,239 34,460 39,181 45,056 51,953 EBITDA Margin 85.9% 84.9% 85.7% 85.9% 86.3%Non Current Liabilities EBIT Margin 64.1% 61.9% 59.2% 59.4% 58.6%Longterm Borrowings 63,076 76,790 77,000 88,000 98,000 PAT Margin 33.2% 29.5% 28.2% 30.0% 29.8%Deferred Tax Liabilities 1,959 2,443 2,443 2,443 2,443 Stability
Other LT Liabilities 5,150 6,379 6,341 7,419 8,755 Debt/Equity 2.6 2.4 2.1 2.1 2.1Current Liabilities Current Ratio 0.4 0.5 0.6 0.7 0.7Trade Payables 3,031 5,109 4,477 5,238 6,181 Interest Coverage 3.2 3.0 2.5 2.7 2.8Other Current Liabilities 5,798 7,061 7,072 8,274 9,764 ST Borrowings 5,112 6,380 6,320 7,395 8,726 ST Provisions 769 968 955 1,118 1,319 TOTAL LIABILITIES 111,134 139,589 143,790 164,943 187,139
Non Current Assets
Net Block 61,401 73,154 90,186 107,368 123,210 CWIP 34,824 49,477 34,876 34,959 37,169 NC Investments 1,148 999 999 999 999 Current Assets
Inventories 552 713 695 814 960 Sundry Debtors 1,434 1,578 1,657 1,939 2,288 Cash and Bank 1,662 4,418 5,871 8,941 12,071 ST Loans and Advances 2,268 2,208 2,462 2,880 3,399 TOTAL ASSETS 111,134 139,589 143,790 164,943 187,139

DISCLOSURES/ APPENDIX
I. ANALYST CERTIFICATION I, Ravikant Sangepag, hereby certify (1) that the views expressed in this research report accurately reflect my personal views about any or all of the subject securities or issuers referred to in this research report, (2) No part of my compensation was, is, or will be directly or indirectly related to the specific recommendations or views expressed in this research report by Systematix Shares & Stocks (I) Limited or its Group/associates companies. (3) has taken reasonable care to achieve and maintain independence and objectivity in making any recommendations.
Disclosure of Interest Statement Response
Analyst holding in the stock No
Served as an officer, director or employee No
II. ISSUER SPECIFIC REGULATORY DISCLOSURES, UNLESS SPECIFICALLY MENTIONED IN POINT NO. 9 BELOW:
1. The Research Analyst(s), Systematix Shares & Stocks(I) Limited (SSSIL), Associate of Analyst or his relative does not have any financial interest in the company(ies) covered in this report. 2. The Research Analyst, SSSIL or its associates or relatives of the Research Analyst affiliates collectively do not hold more than 1% of the securities of the company (ies) covered in this report as of the end of
the month immediately preceding the distribution of the research report. 3. The Research Analyst, his associate, his relative and SSSIL do not have any other material conflict of interest at the time of publication of this research report. 4. The Research Analyst, SSSIL and its associates have not received compensation for investment banking or merchant banking or brokerage services or for any other products or services from the
company(ies) covered in this report, in the past twelve months. 5. The Research Analyst, SSSIL or its associates have not managed or co-managed in the previous twelve months, a private or public offering of securities for the company (ies) covered in this report. 6. SSSIL or its associates have not received compensation or other benefits from the company(ies) covered in this report or from any third party, in connection with the research report. 7. The Research Analyst has not served as an Officer, Director or employee of the company (ies) covered in the Research report. 8. The Research Analyst and SSSIL has not been engaged in market making activity for the company(ies) covered in the Research report. 9. Details SSSIL, Research Analyst and its associates pertaining to the companies covered in the Research report:
Sr. No.
Particulars Yes / No.
1 Whether compensation has been received from the company(ies) covered in the Research report in the past 12 months for investment banking transaction by SSSIL No
2 Whether Research Analyst, SSSIL or its associates or relatives of the Research Analyst affiliates collectively hold more than 1% of the company(ies) covered in the Research report No
3 Whether compensation has been received by SSSIL or its associates from the company(ies) covered in the Research report No
4 SSSIL or its affiliates have managed or co-managed in the previous twelve months a private or public offering of securities for the company(ies) covered in the Research report No
5 Research Analyst, his associate, SSSIL or its associates have received compensation for investment banking or merchant banking or brokerage services or for any other products or services from the company(ies) covered in the Research report, in the last twelve month
No
10. There are no material disciplinary action that been taken by any regulatory authority impacting equity research analysis activities. 11. Systematix Shares & Stocks (I) Limited is in a process of seeking registration under SEBI (Research Analyst) Regulations, 2014.
EXPLANATION TO RATINGS: BUY: TP>15%; ACCUMULATE: 5%<TP<15%; HOLD: -5%<TP<5%; REDUCE: -15%<TP<-5%; SELL: TP<-15%
III. DISCLAIMER The information and opinions contained herein have been compiled or arrived at, based upon information obtained in good faith from sources believed to be reliable. Such information has not been independently verified and no guaranty, representation of warranty, express or implied, is made as to its accuracy completeness or correctness.
This document is for information purposes only. This report is based on information that we consider reliable, but we do not represent that it is accurate or complete, and one should exercise due caution while acting on it. Descriptions of any company or companies or their securities mentioned herein are not complete and this document is not, and should not be construed as an offer or solicitation of an offer to buy or sell any securities or other financial instruments. Past performance is not a guide for future performance, future returns are not guaranteed and a loss of original capital may occur. All opinions, projections and estimates constitute the judgment of the author as on the date of the report and these, plus any other information contained in the report, are subject to change without notice. Prices and availability of financial instruments also are subject to change without notice.
This report is not directed to or intended for display, downloading, printing, reproducing or for distribution to or use by, any person or entity that is a citizen or resident or located in any locality, state, country or other jurisdiction where such distribution, publication, reproduction, availability or use would be contrary to law or regulation or what would subject to SSSIL or its affiliates to any registration or licensing requirement within such jurisdiction. If this report is inadvertently send or has reached any individual in such country, especially, USA, the same may be ignored and brought to the attention of the sender. Neither this document nor any copy of it may be taken or transmitted into the United State (to U.S.Persons), Canada, or Japan or distributed, directly or indirectly, in the United States or Canada or distributed or redistributed in Japan or to any resident thereof. Any unauthorized use, duplication, redistribution or disclosure of this report including, but not limited to, redistribution by electronic mail, posting of the report on a website or page, and/or providing to a third party a link , is prohibited by law and will result in prosecution. The information contained in the Report is intended solely for the recipient and may not be further distributed by the recipient to any third party.
SSSIL generally prohibits its analysts, persons reporting to analysts, and members of their households from maintaining a financial interest in the securities or derivatives of any companies that the analysts cover. Additionally, SSSIL generally prohibits its analysts and persons reporting to analysts from serving as an officer, director, or advisory board member of any companies that the analysts cover. Our salespeople, traders, and other professionals or affiliates may provide oral or written market commentary or trading strategies to our clients that reflect opinions that are contrary to the opinions expressed herein. Our proprietary trading and investing businesses may make investment decisions that are inconsistent with the recommendations expressed herein. The views expressed in this research report reflect the personal views of the analyst(s) about the subject securities or issues, and no part of the compensation of the research analyst(s) was, is, or will be directly or indirectly related to the specific recommendations and views expressed by research analyst(s) in this report. The compensation of the analyst who prepared this document is determined exclusively by SSSIL however, compensation may relate to the revenues of the Systematix Group as a whole, of which investment banking, sales and trading are a part. Research analysts and sales persons of SSSIL may provide important inputs to its affiliated company(ies).
Foreign currencies denominated securities, wherever mentioned, are subject to exchange rate fluctuations, which could have an adverse effect on their value or price, or the income derived from them. In addition, investors in securities such as ADRs, the values of which are influenced by foreign currencies effectively assume currency risk.
MUTUAL FUND INVESTMENTS ARE SUBJECT TO MARKET RISKS, READ ALL SCHEME RELATED DOCUMENTS CAREFULLY. SSSIL, its directors, analysts or employees do not take any responsibility, financial or otherwise, of the losses or the damages sustained due to the investments made or any action taken on basis of this report including but not restricted to fluctuation in the prices of shares and bonds, changes in the currency rates, diminution in the NAVs, reduction in the dividend or income, etc.
SSSIL and its affiliates, officers, directors, and employees subject to the information given in the disclosures may: (a) from time to time, have long or short positions in, and buy or sell the securities thereof, of company (ies) mentioned herein or (b) be engaged in any other transaction involving such securities and earn brokerage or other compensation (financial interest) or act as a market maker in the financial instruments of the company (ies) discussed herein or act as advisor or lender / borrower to such company (ies) or have other potential material conflict of interest with respect to any recommendation and related information and opinions. The views expressed are those of the analyst and the Company may or may not subscribe to the views expressed therein.
SSSIL, its affiliates and any third party involved in, or related to, computing or compiling the information hereby expressly disclaim all warranties of originality, accuracy, completeness, merchantability or fitness for a particular purpose with respect to any of this information. Without limiting any of the foregoing, in no event shall SSSIL, any of its affiliates or any third party involved in, or related to, computing or compiling the information have any liability for any damages of any kind. The Company accepts no liability whatsoever for the actions of third parties. The Report may provide the addresses of, or contain hyperlinks to, websites. Except to the extent to which the Report refers to website material of the Company, the Company has not reviewed the linked site. Accessing such website or following such link through the report or the website of the Company shall be at your own risk and the Company shall have no liability arising out of, or in connection with, any such referenced website
SSSIL shall not be liable for any delay or any other interruption which may occur in presenting the data due to any technical glitch to present the data. In no event shall the SSSIL be liable for any damages, including without limitation, direct or indirect, special, incidental, or consequential damages, losses or expenses arising in connection with the data presented by SSSIL through this presentation.
Neither SSSIL, nor any of its other group companies or associates, shall be responsible for any decisions taken on the basis of this report. Investors are advised to consult their Investment and Tax consultants before taking any investment decisions based on this report. Systematix Shares & Stocks (I) Ltd. CIN: U65993TN1995PLC031285 : SEBI Regn. No.: BSE: INB/F011132736 Member Code: 182 | NSE: INB/F/E231132730 Member Code : 11327 | MCX-SX: INB/F261132733 Member Code: 17560 | PMS SEBI Reg No. : INP000002692 | Depository Participant: IN-DP-CDSL-246-2004 | AMFI: ARN No. 64917 Corporate Office Address: A 603-606 , The Capital, BKC, Bandra (E), Mumbai, India - 400051