power profiling of cholesky and qr factorizations on ... · power profiling of cholesky and qr...
TRANSCRIPT
Power Profiling of Cholesky and QRFactorizations on Distributed Memory Systems
George Bosilca1 Hatem Ltaief2 Jack Dongarra1 3 4
1Innovative Computing LaboratoryUniversity of Tennessee Knoxville
2KAUST Supercomputing LaboratoryThuwal, Saudi Arabia
3Oak Ridge National Lab
4University of Manchester
International Conference on Energy-Aware High PerformanceComputing
Hamburg, GermanySept 12, 2012Bosilca, Ltaief, Dongarra (KAUST, UTK) Power Profiling of DLA Algorithms ENAHPC’12 1 / 26

Outline
1 Motivations
2 From LAPACK to PLASMA
3 From PLASMA to DPLASMA
4 Power Measurements Technique
5 Power Measurements Results
6 Summary and Future Work
Bosilca, Ltaief, Dongarra (KAUST, UTK) Power Profiling of DLA Algorithms ENAHPC’12 2 / 26

Motivations
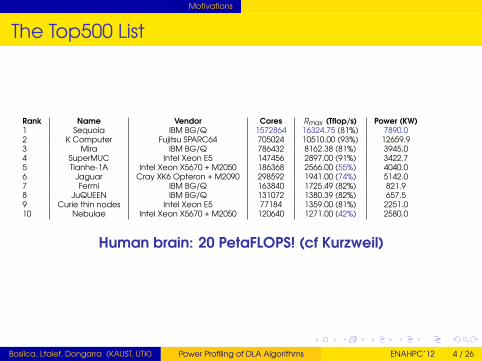
The Top500 List
Rank Name Vendor Cores Rmax (Tflop/s) Power (KW)1 Sequoia IBM BG/Q 1572864 16324.75 (81%) 7890.02 K Computer Fujitsu SPARC64 705024 10510.00 (93%) 12659.93 Mira IBM BG/Q 786432 8162.38 (81%) 3945.04 SuperMUC Intel Xeon E5 147456 2897.00 (91%) 3422.75 Tianhe-1A Intel Xeon X5670 + M2050 186368 2566.00 (55%) 4040.06 Jaguar Cray XK6 Opteron + M2090 298592 1941.00 (74%) 5142.07 Fermi IBM BG/Q 163840 1725.49 (82%) 821.98 JuQUEEN IBM BG/Q 131072 1380.39 (82%) 657.59 Curie thin nodes Intel Xeon E5 77184 1359.00 (81%) 2251.010 Nebulae Intel Xeon X5670 + M2050 120640 1271.00 (42%) 2580.0
Bosilca, Ltaief, Dongarra (KAUST, UTK) Power Profiling of DLA Algorithms ENAHPC’12 3 / 26
Motivations
The Top500 List
Rank Name Vendor Cores Rmax (Tflop/s) Power (KW)1 Sequoia IBM BG/Q 1572864 16324.75 (81%) 7890.02 K Computer Fujitsu SPARC64 705024 10510.00 (93%) 12659.93 Mira IBM BG/Q 786432 8162.38 (81%) 3945.04 SuperMUC Intel Xeon E5 147456 2897.00 (91%) 3422.75 Tianhe-1A Intel Xeon X5670 + M2050 186368 2566.00 (55%) 4040.06 Jaguar Cray XK6 Opteron + M2090 298592 1941.00 (74%) 5142.07 Fermi IBM BG/Q 163840 1725.49 (82%) 821.98 JuQUEEN IBM BG/Q 131072 1380.39 (82%) 657.59 Curie thin nodes Intel Xeon E5 77184 1359.00 (81%) 2251.010 Nebulae Intel Xeon X5670 + M2050 120640 1271.00 (42%) 2580.0
Human brain: 20 PetaFLOPS! (cf Kurzweil)
Bosilca, Ltaief, Dongarra (KAUST, UTK) Power Profiling of DLA Algorithms ENAHPC’12 4 / 26

Motivations
Today’s Special Meal
8 MW needed to feed the babyExascale roadmap says up to 20 MW Power EnvelopeHuge challenge: achieving 2 orders of magnitude inperformance by only doubling the power rateHigh level of concurrencyIngredients: Fine-grain parallelism, Dynamic runtime systems,Power EfficiencyFlops are cheap, Data movement is expensiveCo-designed Hardware and Software solutions
Bosilca, Ltaief, Dongarra (KAUST, UTK) Power Profiling of DLA Algorithms ENAHPC’12 5 / 26

From LAPACK to PLASMA
Block Algorithms
Panel-Update SequenceTransformations are blocked/accumulated within the Panel(Level 2 BLAS)Transformations applied at once on the trailing submatrix(Level 3 BLAS)Parallelism hidden inside the BLASFork-join Model
Bosilca, Ltaief, Dongarra (KAUST, UTK) Power Profiling of DLA Algorithms ENAHPC’12 6 / 26

From LAPACK to PLASMA
One-Sided Block Algorithms: LU
Bosilca, Ltaief, Dongarra (KAUST, UTK) Power Profiling of DLA Algorithms ENAHPC’12 7 / 26

From LAPACK to PLASMA
Block Algorithms: Fork-Join Paradigm
Bosilca, Ltaief, Dongarra (KAUST, UTK) Power Profiling of DLA Algorithms ENAHPC’12 8 / 26

From LAPACK to PLASMA
Tile Data Layout Format
LAPACK: column-major format PLASMA: tile format
Bosilca, Ltaief, Dongarra (KAUST, UTK) Power Profiling of DLA Algorithms ENAHPC’12 9 / 26

From LAPACK to PLASMA
PLASMA: Tile Algorithms
PLASMA: Parallel Linear Algebra for Scalable Multi-coreArchitectures =⇒ http://icl.cs.utk.edu/plasma/
Parallelism is brought to the foreMay require the redesign of linear algebra algorithmsTile data layout translationRemove unnecessary synchronization points betweenPanel-Update sequencesDAG execution where nodes represent tasks and edgesdefine dependencies between themDynamic runtime system environment QUARK
Bosilca, Ltaief, Dongarra (KAUST, UTK) Power Profiling of DLA Algorithms ENAHPC’12 10 / 26

From LAPACK to PLASMA
Dynamic Runtime System QUARK
Basic Ideas:
Conceptually similar to out-of-order processor schedulingDynamic runtime DAG schedulerOut-of-order execution flow of fine-grained tasksTask scheduling as soon as dependencies are satisfiedProducer-Consumer
Similar projects: SuperMatrix, OMPSs, StarPU
Bosilca, Ltaief, Dongarra (KAUST, UTK) Power Profiling of DLA Algorithms ENAHPC’12 11 / 26

From LAPACK to PLASMA
DataFlow Programming Model
Five decades OLD conceptProgramming paradigm that models a program as adirected graph of the data flowing between operations (cf.Wikipedia)Think "how things connect" rather than "how things happen"Assembly lineInherently parallel
Bosilca, Ltaief, Dongarra (KAUST, UTK) Power Profiling of DLA Algorithms ENAHPC’12 12 / 26

From PLASMA to DPLASMA
2D Block Cyclic Distribution
3
0
2
1
3
0
2
1
3
0
2
1
3
0
2
1
3
0
2
1
3
0
2
1
3
0
2
1
3
0
2
1
3
0
2
1
3
0
2
1
3
0
2
1
3
0
2
1
3
0
2
1
3
0
2
1
3
0
2
1
3
0
2
1
3
0
2
1
3
0
2
1
3
0
2
1
3
0
2
1
3
0
2
1
3
0
2
1
3
0
2
1
3
0
2
1
3
0
2
1
3
0
0
1
3
0
2
1
3
0
2
1
3
0
2
1
3
0
2
1
3
0
2
1
3
0
2
1
3 2
2
1
3
0
2
1
3
0
2
1
3
0
2
1
3
0
2
1
3
0
2
1
(a) Column-major data layout for-mat within a block.
3
0
2
1
3
0
2
1
3
0
2
1
3
0
2
1
3
0
2
1
3
0
2
1
3
0
2
1
3
0
2
1
3
0
2
1
3
0
2
1
3
0
2
1
3
0
2
1
3
0
2
1
3
0
2
1
3
0
2
1
3
0
2
1
3
0
2
1
3
0
2
1
3
0
2
1
3
0
2
1
3
0
2
1
3
0
2
1
3
0
2
1
3
0
2
1
3
0
2
1
3
0
0
1
3
0
2
1
3
0
2
1
3
0
2
1
3
0
2
1
3
0
2
1
3
0
2
1
3 2
2
1
3
0
2
1
3
0
2
1
3
0
2
1
3
0
2
1
3
0
2
1
(b) Tile data layout format within ablock.
Figure: Two-Dimensional Block Cyclic Data Distribution.
Bosilca, Ltaief, Dongarra (KAUST, UTK) Power Profiling of DLA Algorithms ENAHPC’12 13 / 26
From PLASMA to DPLASMA
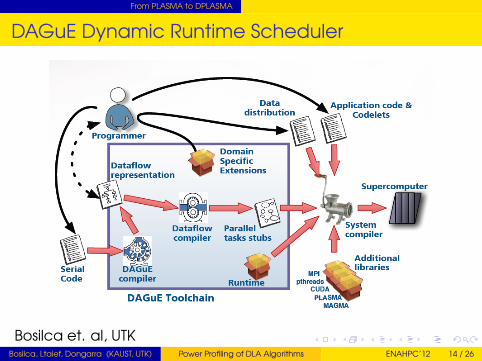
DAGuE Dynamic Runtime Scheduler
Bosilca et. al, UTKBosilca, Ltaief, Dongarra (KAUST, UTK) Power Profiling of DLA Algorithms ENAHPC’12 14 / 26

From PLASMA to DPLASMA
DAGuE Dynamic Runtime Scheduler
Bosilca et. al, UTKBosilca, Ltaief, Dongarra (KAUST, UTK) Power Profiling of DLA Algorithms ENAHPC’12 15 / 26

Power Measurements Technique
The PowerPack Framework
Dual-socket quad-core Intel Xeon system from Virginia Tech,clocked at 2.8GHz with 8GB of memoryMeasurements from power meters attached to thehardware of the systemFine-grain measurement (100ms) allows power consumptionto be measured on a per-component basisCPU, memory, hard disk, motherboard and System (as awhole)N = 40000 for all experiments
Bosilca, Ltaief, Dongarra (KAUST, UTK) Power Profiling of DLA Algorithms ENAHPC’12 16 / 26

Power Measurements Technique
The PowerPack Framework
K. Cameron et. al, Virginia Tech
Bosilca, Ltaief, Dongarra (KAUST, UTK) Power Profiling of DLA Algorithms ENAHPC’12 17 / 26

Power Measurements Results
0
5000
10000
15000
20000
25000
0 5 10 15 20 25 30 35
Po
we
r (W
att
s)
Time (seconds)
System
CPU
Memory
Network
(a) block size = 32.
0
5000
10000
15000
20000
25000
0 5 10 15 20 25 30 35
Po
we
r (W
att
s)
Time (seconds)
System
CPU
Memory
Network
(b) block size = 128.
0
5000
10000
15000
20000
25000
0 5 10 15 20 25 30 35
Po
we
r (W
att
s)
Time (seconds)
System
CPU
Memory
Network
(c) block size = 512.
Figure: Impact of the block size onthe power profiles (Watts) of theScaLAPACK Cholesky.
0
5000
10000
15000
20000
25000
0 5 10 15 20 25 30 35
Po
we
r (W
att
s)
Time (seconds)
System
CPU
Memory
Network
(a) tile size = 48.
0
5000
10000
15000
20000
25000
0 5 10 15 20 25 30 35
Po
we
r (W
att
s)
Time (seconds)
System
CPU
Memory
Network
(b) tile size = 192.
0
5000
10000
15000
20000
25000
0 5 10 15 20 25 30 35P
ow
er
(Wa
tts)
Time (seconds)
System
CPU
MemoryNetwork
(c) tile size = 768.
Figure: Impact of the tile size onthe power profiles (Watts) of theDPLASMA Cholesky.
Bosilca, Ltaief, Dongarra (KAUST, UTK) Power Profiling of DLA Algorithms ENAHPC’12 18 / 26

Power Measurements Results
0
5000
10000
15000
20000
25000
0 20 40 60 80 100
Po
we
r (W
att
s)
Time (seconds)
System
CPU
Memory
Network
(a) block size = 32.
0
5000
10000
15000
20000
25000
0 20 40 60 80 100
Po
we
r (W
att
s)
Time (seconds)
System
CPU
Memory
Network
(b) block size = 128.
5000
10000
15000
20000
0 20 40 60 80 100
Po
we
r (W
att
s)
Time (seconds)
System
CPU
Memory
Network
(c) block size = 512.
Figure: Impact of the block size onthe power profiles (Watts) of theScaLAPACK QR Factorization.
0
5000
10000
15000
20000
25000
0 50 100 150 200 250 300 350 400 450
Po
we
r (W
att
s)
Time (seconds)
System
CPU
Memory
Network
(a) tile size = 48.
0
5000
10000
15000
20000
25000
0 20 40 60 80 100
Po
we
r (W
att
s)
Time (seconds)
System
CPU
Memory
Network
(b) tile size = 192.
0
5000
10000
15000
20000
25000
0 20 40 60 80 100P
ow
er
(Wa
tts)
Time (seconds)
System
CPU
Memory
Network
(c) tile size = 768.
Figure: Impact of the tile size onthe power profiles (Watts) of theDPLASMA QR Factorization.
Bosilca, Ltaief, Dongarra (KAUST, UTK) Power Profiling of DLA Algorithms ENAHPC’12 19 / 26

Power Measurements Results
0
1000
2000
3000
4000
5000
6000
7000
0 5 10 15 20 25 30 35
Po
we
r (W
att
s)
Time (seconds)
System
CPU
Memory
Network
(a) Number of cores = 128.
0
5000
10000
15000
20000
25000
0 5 10 15 20 25 30 35
Po
we
r (W
att
s)
Time (seconds)
System
CPU
Memory
Network
(b) Number of cores = 512.
Figure: Impact of the number ofcores on the power profiles (Watts)of the ScaLAPACK CholeskyFactorization.
0
1000
2000
3000
4000
5000
6000
7000
0 5 10 15 20 25 30 35
Po
we
r (W
att
s)
Time (seconds)
System
CPU
Memory
Network
(a) Number of cores = 128.
0
5000
10000
15000
20000
25000
0 5 10 15 20 25 30 35
Po
we
r (W
att
s)
Time (seconds)
System
CPU
Memory
Network
(b) Number of cores = 512.
Figure: Impact of the number ofcores on the power profiles (Watts)of the DPLASMA CholeskyFactorization.
Bosilca, Ltaief, Dongarra (KAUST, UTK) Power Profiling of DLA Algorithms ENAHPC’12 20 / 26

Power Measurements Results
0
1000
2000
3000
4000
5000
6000
7000
0 20 40 60 80 100
Po
we
r (W
att
s)
Time (seconds)
System
CPU
Memory
Network
(a) Number of cores = 128.
0
5000
10000
15000
20000
25000
0 20 40 60 80 100
Po
we
r (W
att
s)
Time (seconds)
System
CPU
Memory
Network
(b) Number of cores = 512.
Figure: Impact of the number ofcores on the power profiles (Watts)of the ScaLAPACK QR.
0
1000
2000
3000
4000
5000
6000
7000
0 20 40 60 80 100
Po
we
r (W
att
s)
Time (seconds)
System
CPU
Memory
Network
(a) Number of cores = 128.
0
5000
10000
15000
20000
25000
0 20 40 60 80 100
Po
we
r (W
att
s)
Time (seconds)
System
CPU
Memory
Network
(b) Number of cores = 512.
Figure: Impact of the number ofcores on the power profiles (Watts)of the DPLASMA QR.
Bosilca, Ltaief, Dongarra (KAUST, UTK) Power Profiling of DLA Algorithms ENAHPC’12 21 / 26
Power Measurements Results
0
5000
10000
15000
20000
25000
0 5 10 15 20 25 30 35
Po
we
r (W
att
s)
Time (seconds)
System
CPU
Memory
Network
(a) ScaLAPACK.
0
5000
10000
15000
20000
25000
0 5 10 15 20 25 30 35
Po
we
r (W
att
s)
Time (seconds)
System
CPU
Memory
Network
(b) DPLASMA.
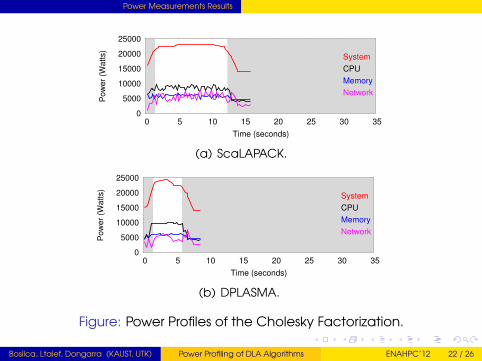
Figure: Power Profiles of the Cholesky Factorization.
Bosilca, Ltaief, Dongarra (KAUST, UTK) Power Profiling of DLA Algorithms ENAHPC’12 22 / 26

Power Measurements Results
0
5000
10000
15000
20000
25000
0 20 40 60 80 100
Po
we
r (W
att
s)
Time (seconds)
System
CPU
Memory
Network
(a) ScaLAPACK.
0
5000
10000
15000
20000
25000
0 20 40 60 80 100
Po
we
r (W
att
s)
Time (seconds)
System
CPU
Memory
Network
(b) DPLASMA.
Figure: Power Profiles of the QR Factorization.
Bosilca, Ltaief, Dongarra (KAUST, UTK) Power Profiling of DLA Algorithms ENAHPC’12 23 / 26

Power Measurements Results
# Cores Library Cholesky QR
128ScaLAPACK 192000 672000DPLASMA 128000 540000
256ScaLAPACK 240000 816000DPLASMA 96000 540000
512ScaLAPACK 325000 1000000DPLASMA 125000 576000
Figure: Total amount of energy (joule) used for each test based on thenumber of cores
Bosilca, Ltaief, Dongarra (KAUST, UTK) Power Profiling of DLA Algorithms ENAHPC’12 24 / 26

Summary and Future Work
Conclusion
Stressing the system’s componentsDPLASMA Cholesky algorithms decrease the energyconsumption up to 62% compared to ScaLAPACK CholeskyDPLASMA QR algorithms decrease the energy consumptionup to 40% compared to ScaLAPACK QRAsynchronous execution runtime and adapted algorithmscan lead to significantly improved efficiencies and powersaving
Bosilca, Ltaief, Dongarra (KAUST, UTK) Power Profiling of DLA Algorithms ENAHPC’12 25 / 26

Summary and Future Work
What’s next?
Power analysis of advanced numerical algorithms ondistributed systems (two-sided transformations, treereduction, mixed precisions)Comparisons with other DLA libraries: Elemental, Eigen-K,ELPADistributed heterogeneous architecturesScheduler interaction through DVFS/Intel RAPL technologyRunning on IBM BG P/Q and exploit embedded powercollection hardware tools.
Bosilca, Ltaief, Dongarra (KAUST, UTK) Power Profiling of DLA Algorithms ENAHPC’12 26 / 26