power quality measurement capabilities in smart revenue...
TRANSCRIPT
Power Quality Measurement Capabilities in
Smart Revenue Meters
November 5, 2014
Tom Cooke
Project Manager, EPRI
Power Quality Monitoring and Analytics
2 © 2014 Electric Power Research Institute, Inc. All rights reserved.
Overview
• Benefits of PQ in Smart Revenue Meters
• Barriers
• Assessment of Meters
• PQ Measurement Standards
• Standardizing PQ Measurements for Smart Revenue
Meters
• Questions / Discussions
3 © 2014 Electric Power Research Institute, Inc. All rights reserved.
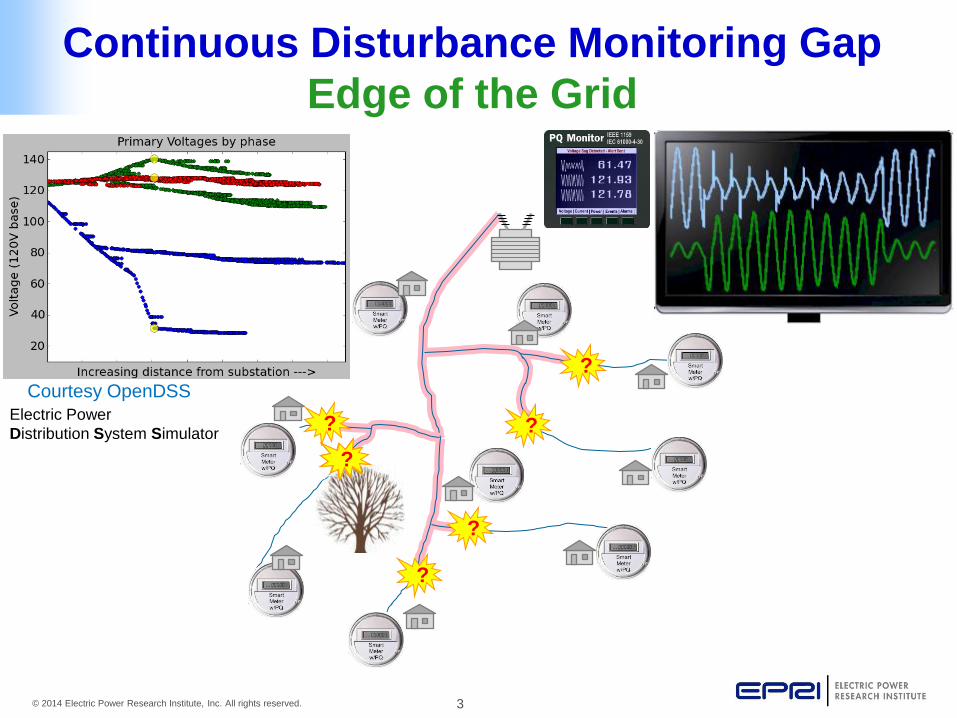
Continuous Disturbance Monitoring Gap
Edge of the Grid
?
?
?
? ?
? Courtesy OpenDSS
Electric Power
Distribution System Simulator
4 © 2014 Electric Power Research Institute, Inc. All rights reserved.
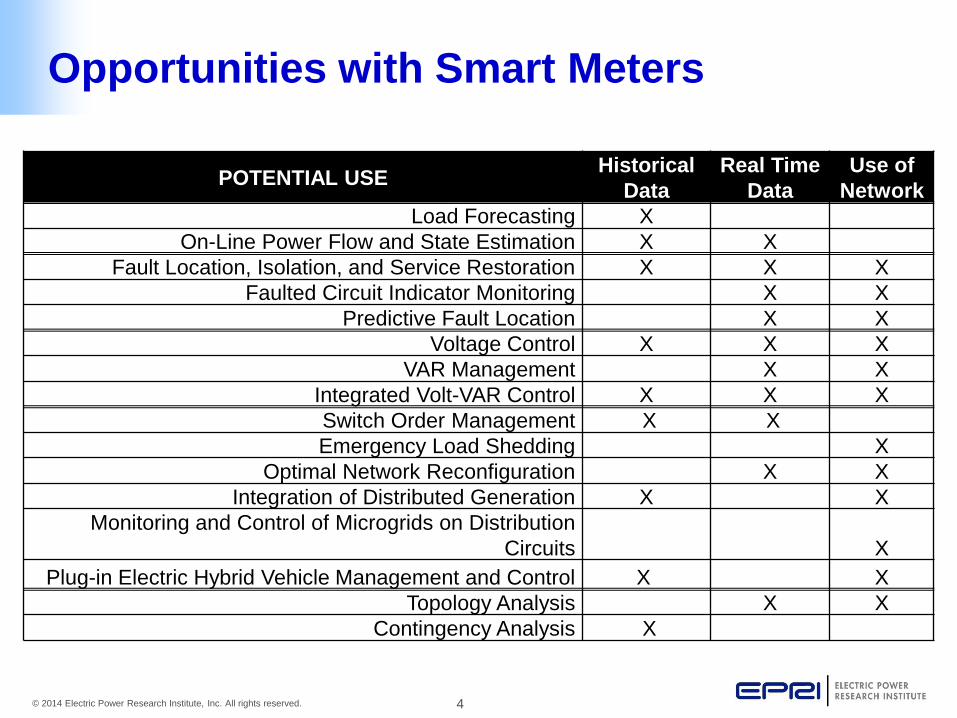
POTENTIAL USE Historical
Data
Real Time
Data
Use of
Network
Load Forecasting X
On-Line Power Flow and State Estimation X X
Fault Location, Isolation, and Service Restoration X X X
Faulted Circuit Indicator Monitoring X X
Predictive Fault Location X X
Voltage Control X X X
VAR Management X X
Integrated Volt-VAR Control X X X
Switch Order Management X X
Emergency Load Shedding X
Optimal Network Reconfiguration X X
Integration of Distributed Generation X X
Monitoring and Control of Microgrids on Distribution
Circuits X
Plug-in Electric Hybrid Vehicle Management and Control X X
Topology Analysis X X
Contingency Analysis X
Opportunities with Smart Meters

5 © 2014 Electric Power Research Institute, Inc. All rights reserved.
Barriers
• Current communications infrastructure cannot
accommodate bandwidth
• Current data storage systems are not
configured for long-term storage
• The cost of enabling PQ functions is too high
• Limited or no PQ capabilities in existing meter
model.
• Limit “high-end” Meters to strategic
locations (Bellwether Meters)
• Parameter based meters use less
communication bandwidth and
storage
• PQ and Smart Meter Standards
• IEEE 1159 (Recommend
Practice for PQ Monitoring)
• IEC 61000-4-30 (correct PQ
measurement algorithms )
• ANSI C12.19 (Utility Industry
End Device [Smart Meter] Data
Tables)
• ANSI 12.22 (Specification for
Interfacing to Data
Communication Networks)
Barriers to Implementation Potential Solutions

6 © 2014 Electric Power Research Institute, Inc. All rights reserved.
Smart Meter Test Laboratory
• GE (KV2c, i210+c)
• Itron (Sentinel, Centron)
• Elster (A3 Alpha, Rex2)
• Landis & Gyr (E330, E650)
• Echelon (ANSI 2S)
7 © 2014 Electric Power Research Institute, Inc. All rights reserved.
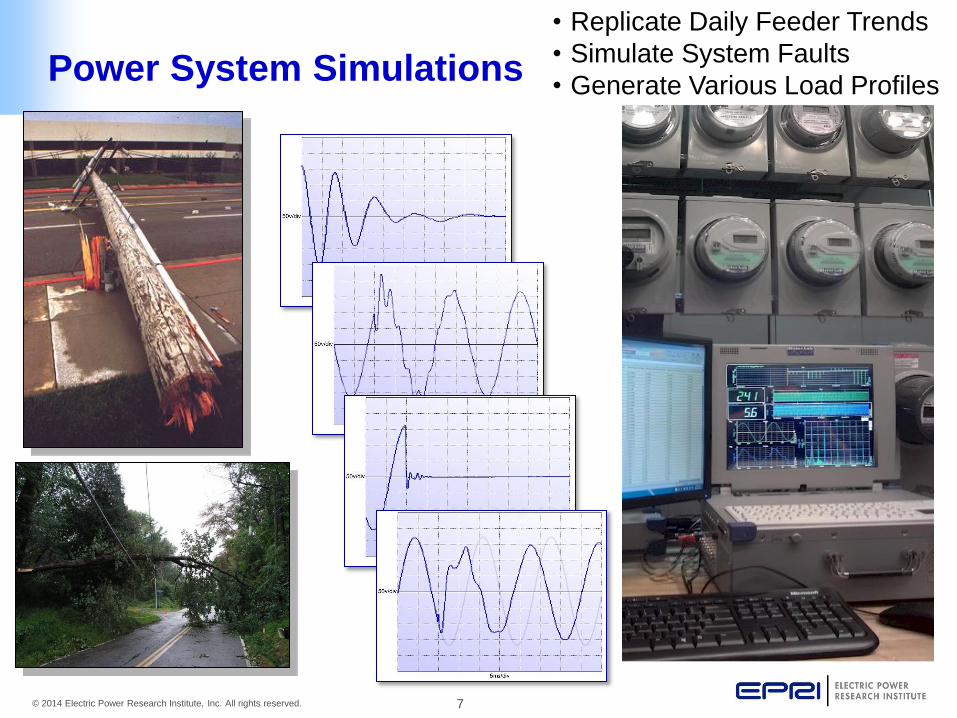
Power System Simulations
• Replicate Daily Feeder Trends
• Simulate System Faults
• Generate Various Load Profiles
8 © 2014 Electric Power Research Institute, Inc. All rights reserved.
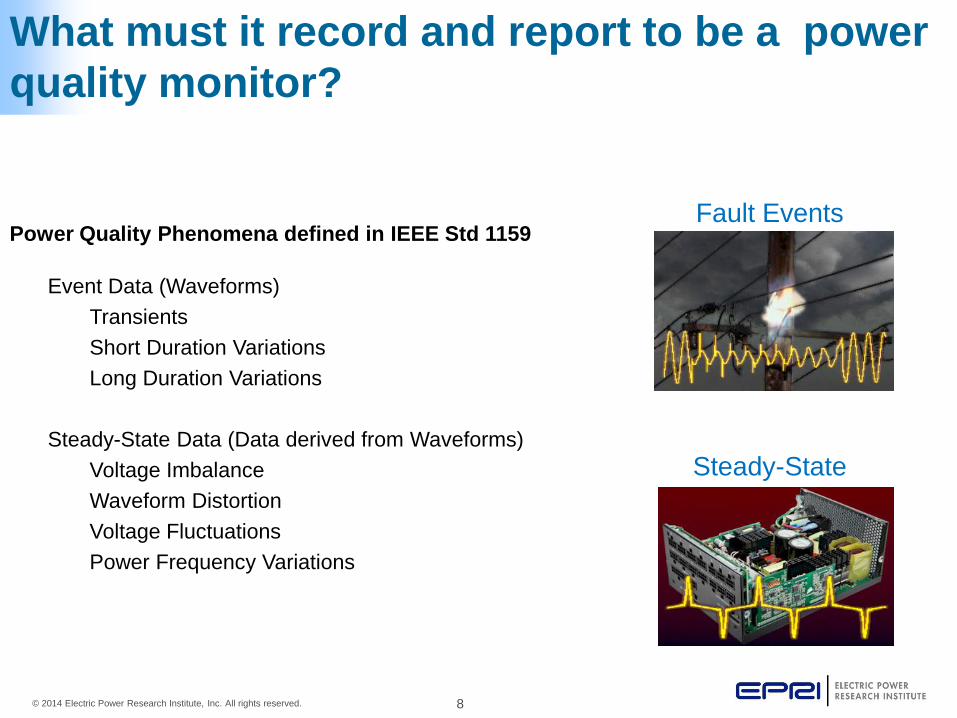
What must it record and report to be a power
quality monitor?
Event Data (Waveforms)
Transients
Short Duration Variations
Long Duration Variations
Steady-State Data (Data derived from Waveforms)
Voltage Imbalance
Waveform Distortion
Voltage Fluctuations
Power Frequency Variations
Power Quality Phenomena defined in IEEE Std 1159 Fault Events
Steady-State

9 © 2014 Electric Power Research Institute, Inc. All rights reserved.
Standards for Monitoring and PQ Data Calculations
• IEC Standard 61000-4-7, “Testing and measurement techniques – General guide on
harmonics and interharmonics measurements and instrumentation, for power supply systems
and equipment connected thereto”
• IEC Standard 61000-4-15, “Testing and measurement techniques – Flicker meter – Functional
and design specifications”
• IEC Standard 61000-4-30, “Testing and measurement techniques – Power quality
measurement methods
• IEEE Standard 112, “Standard Test Procedure for Polyphase Induction Motors and
Generators”
• IEEE Standard 519, “Recommended Practices and Requirements for Harmonic Control in
Electrical Power Systems”
• IEEE Standard 1159, “IEEE Recommended Practices for Monitoring Electric Power Quality”
• IEEE Standard 1159.3, “IEEE Recommended Practice for the Transfer of Power Quality Data”
• NERC Standard PRC-002-1, “Define Regional Disturbance Monitoring and Reporting
Requirements”
10 © 2014 Electric Power Research Institute, Inc. All rights reserved.
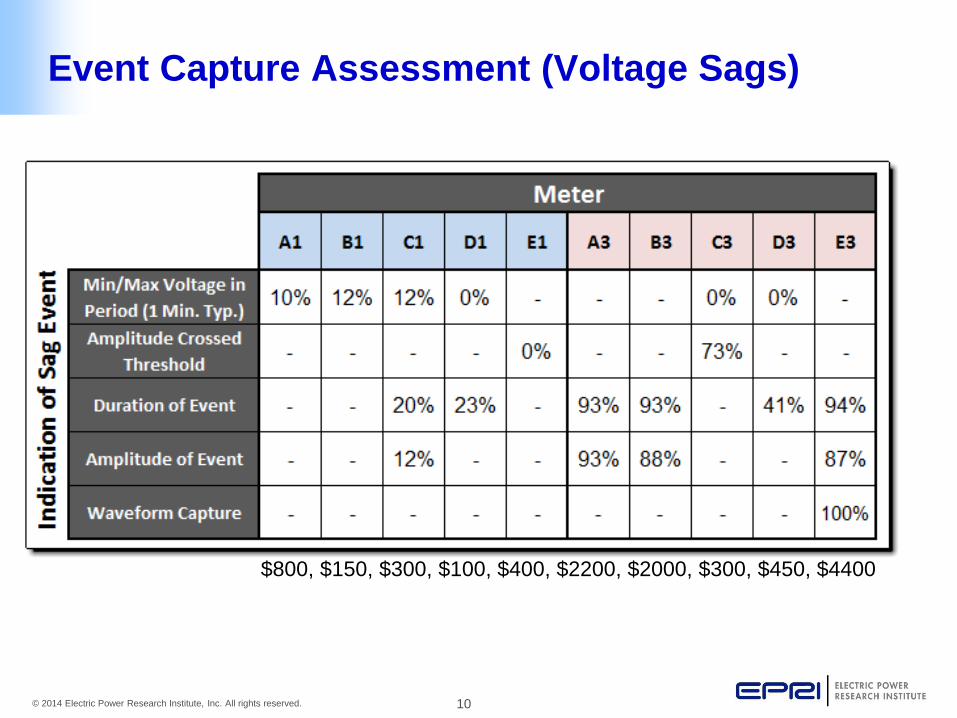
Event Capture Assessment (Voltage Sags)
$800, $150, $300, $100, $400, $2200, $2000, $300, $450, $4400

11 © 2014 Electric Power Research Institute, Inc. All rights reserved.
Single Phase Example Results
12 © 2014 Electric Power Research Institute, Inc. All rights reserved.
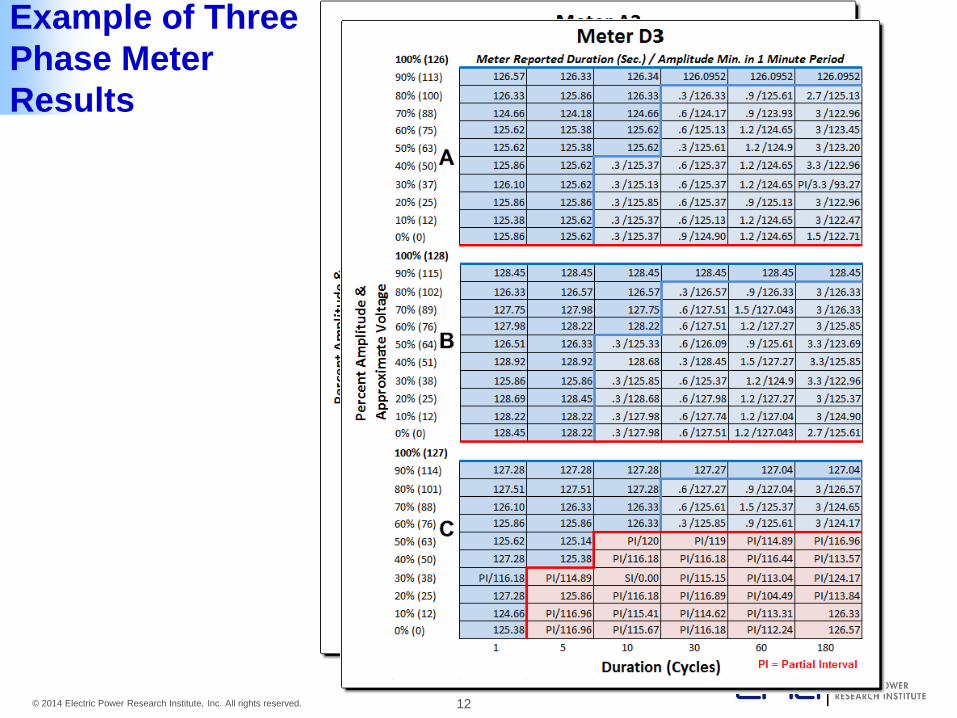
Example of Three
Phase Meter
Results
13 © 2014 Electric Power Research Institute, Inc. All rights reserved.
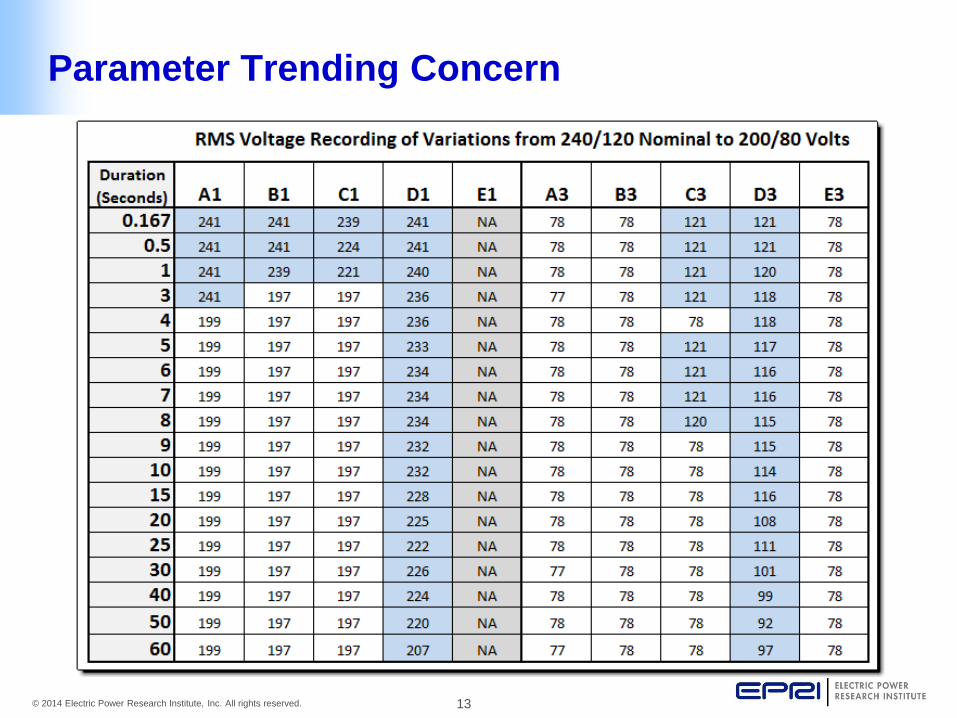
Parameter Trending Concern

14 © 2014 Electric Power Research Institute, Inc. All rights reserved.
Sustained Interruption Test (Outage / Restoration)
15 © 2014 Electric Power Research Institute, Inc. All rights reserved.
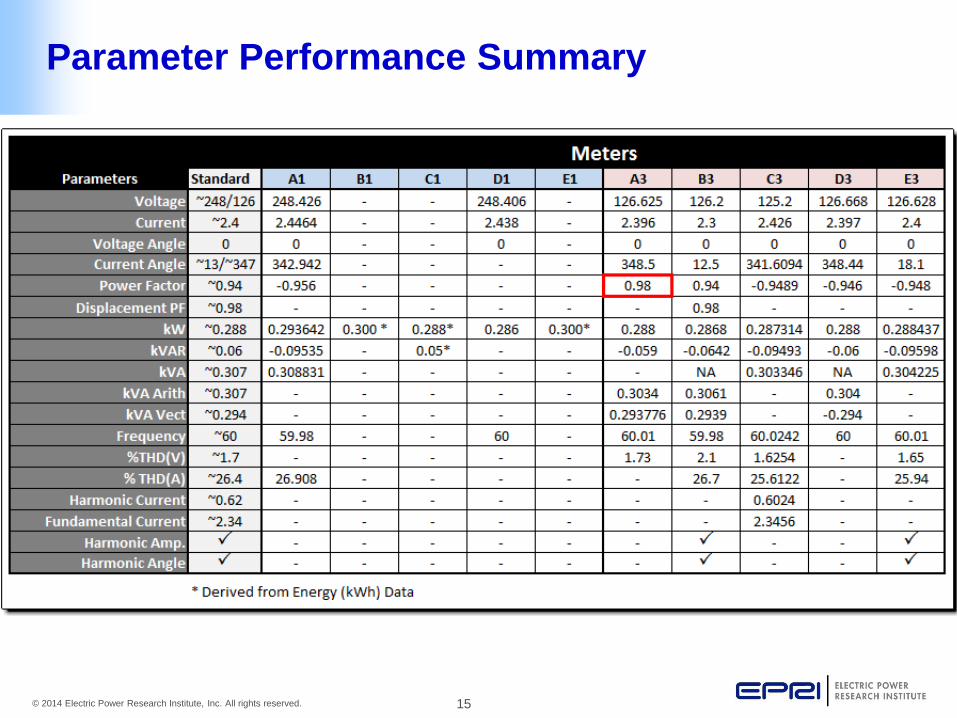
Parameter Performance Summary
16 © 2014 Electric Power Research Institute, Inc. All rights reserved.
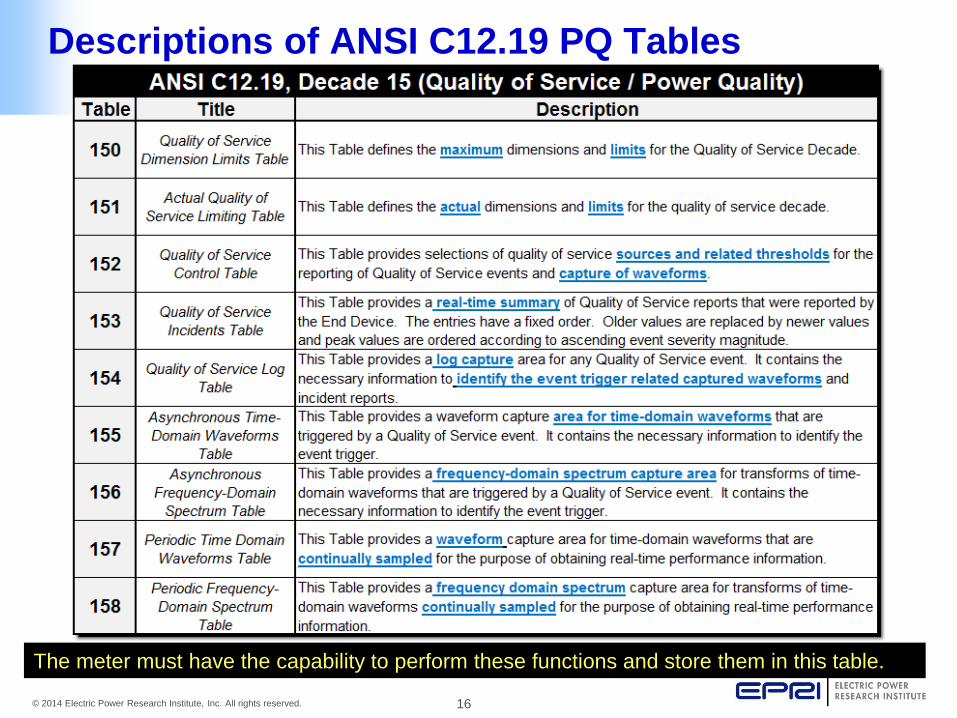
Descriptions of ANSI C12.19 PQ Tables
The meter must have the capability to perform these functions and store them in this table.

17 © 2014 Electric Power Research Institute, Inc. All rights reserved.
Conclusions from Testing
• Present PQ capabilities are limited in smart meters
– Need to adopt parts of PQ Standards (keep cost low)
– Parameter trends below three seconds (simple change?)
– Ride-through capability during events. (mitigation?)
• ANSI PQ data tables are not being fully utilized.
• Beware of Claims and Terminology
– “Measures Fundamental and Harmonic Frequencies”
– “Waveform Capture”
• Benefits
– Single-phase did well with Outage / Restoration
– Three-phase meters exceed single-phase with PQ capabilities —
especially from traditional PQ manufacturers.
– Strategic location of each (deliver max benefit for the cost)

18 © 2014 Electric Power Research Institute, Inc. All rights reserved.
Requirements of PQ Capabilities in Smart Revenue
Meters – Draft for Review
• Intended to give minimal measurement
requirements for each PQ phenomena
• Tier levels are designed to give meter
manufactures some flexibility in
choosing methods that may work with
existing meter infrastructure or budget.
• To be reviewed by industry experts,
electric service providers, and meter
manufacturers.
• Feedback to [email protected]
19 © 2014 Electric Power Research Institute, Inc. All rights reserved.
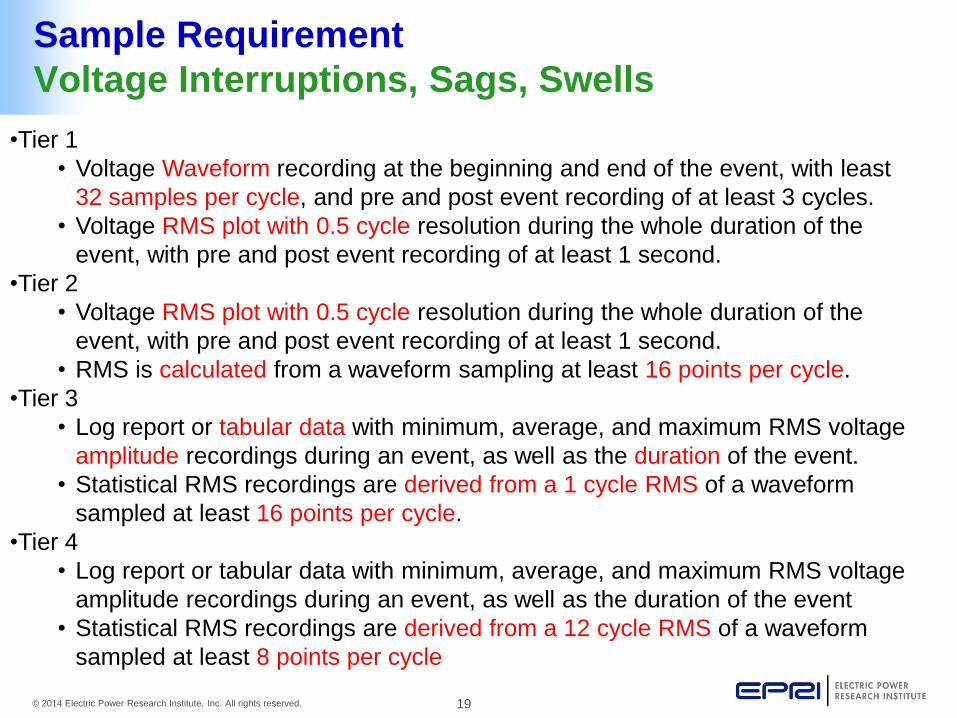
Sample Requirement
Voltage Interruptions, Sags, Swells
•Tier 1
• Voltage Waveform recording at the beginning and end of the event, with least
32 samples per cycle, and pre and post event recording of at least 3 cycles.
• Voltage RMS plot with 0.5 cycle resolution during the whole duration of the
event, with pre and post event recording of at least 1 second.
•Tier 2
• Voltage RMS plot with 0.5 cycle resolution during the whole duration of the
event, with pre and post event recording of at least 1 second.
• RMS is calculated from a waveform sampling at least 16 points per cycle.
•Tier 3
• Log report or tabular data with minimum, average, and maximum RMS voltage
amplitude recordings during an event, as well as the duration of the event.
• Statistical RMS recordings are derived from a 1 cycle RMS of a waveform
sampled at least 16 points per cycle.
•Tier 4
• Log report or tabular data with minimum, average, and maximum RMS voltage
amplitude recordings during an event, as well as the duration of the event
• Statistical RMS recordings are derived from a 12 cycle RMS of a waveform
sampled at least 8 points per cycle

20 © 2014 Electric Power Research Institute, Inc. All rights reserved.
Bandwidth and Storage: Event Reporting Format
2,000 - 20,000 bytes 36 bytes 17 bytes
21 © 2014 Electric Power Research Institute, Inc. All rights reserved.
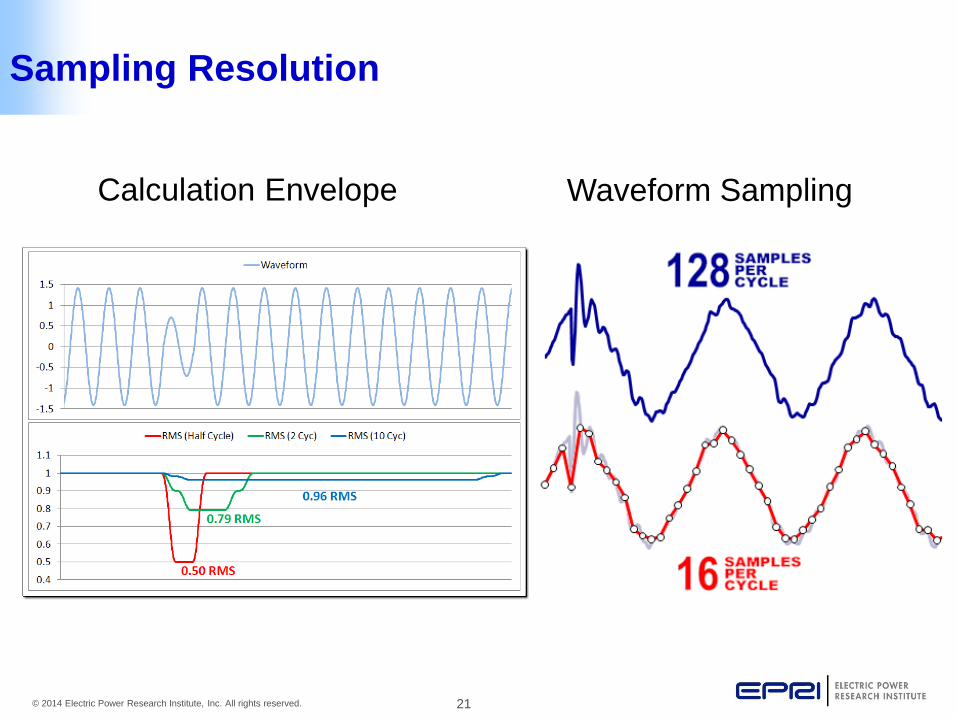
Sampling Resolution
Calculation Envelope Waveform Sampling
22 © 2014 Electric Power Research Institute, Inc. All rights reserved.
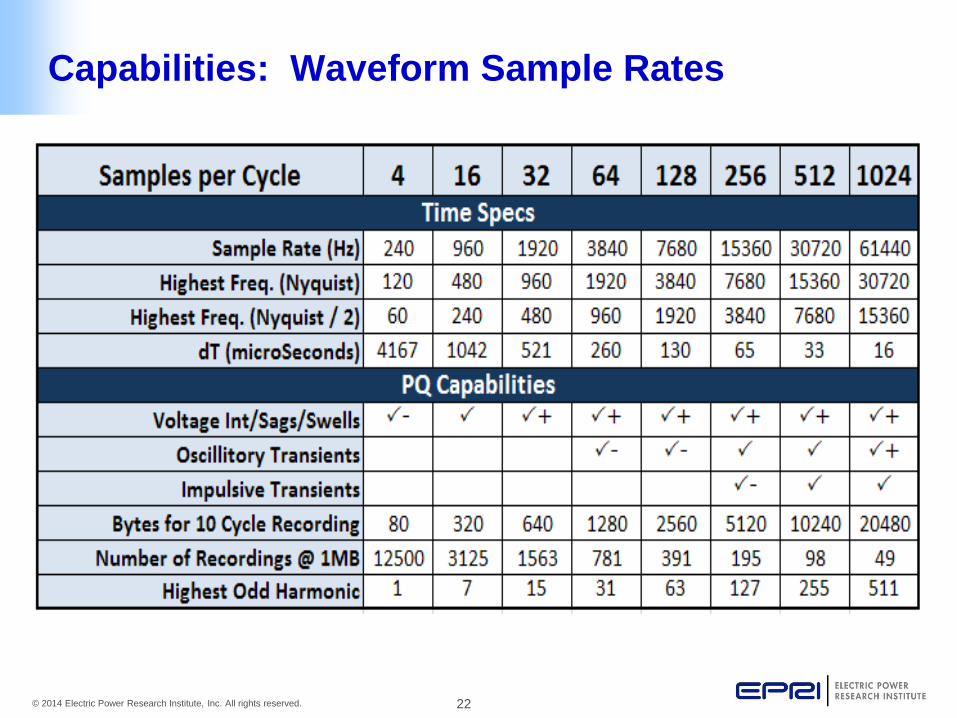
Capabilities: Waveform Sample Rates
23 © 2014 Electric Power Research Institute, Inc. All rights reserved.
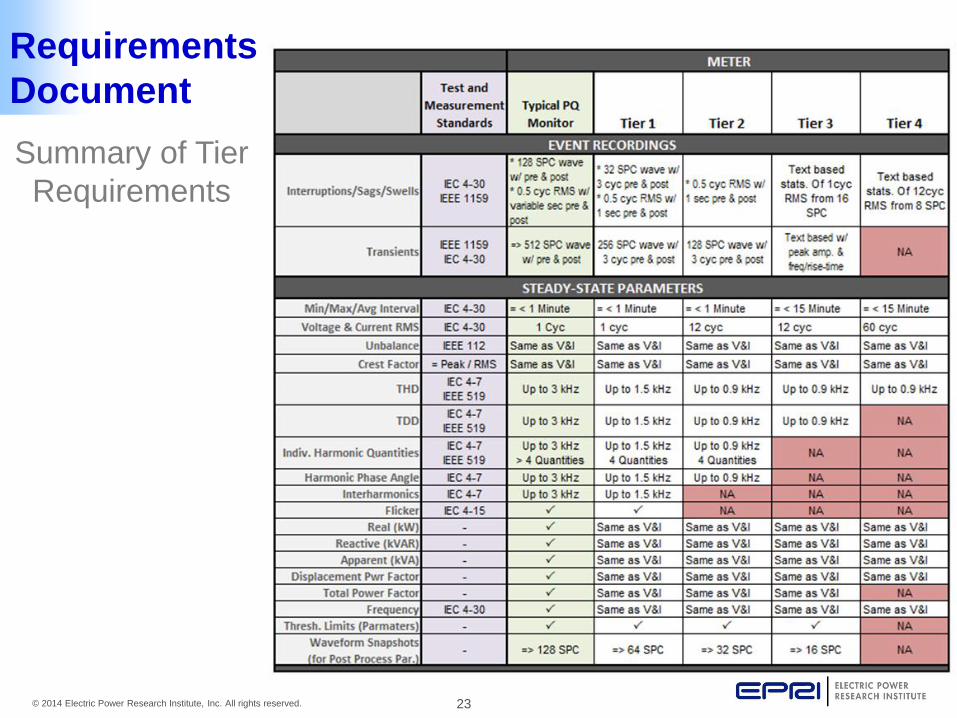
Requirements
Document
Summary of Tier
Requirements
24 © 2014 Electric Power Research Institute, Inc. All rights reserved.
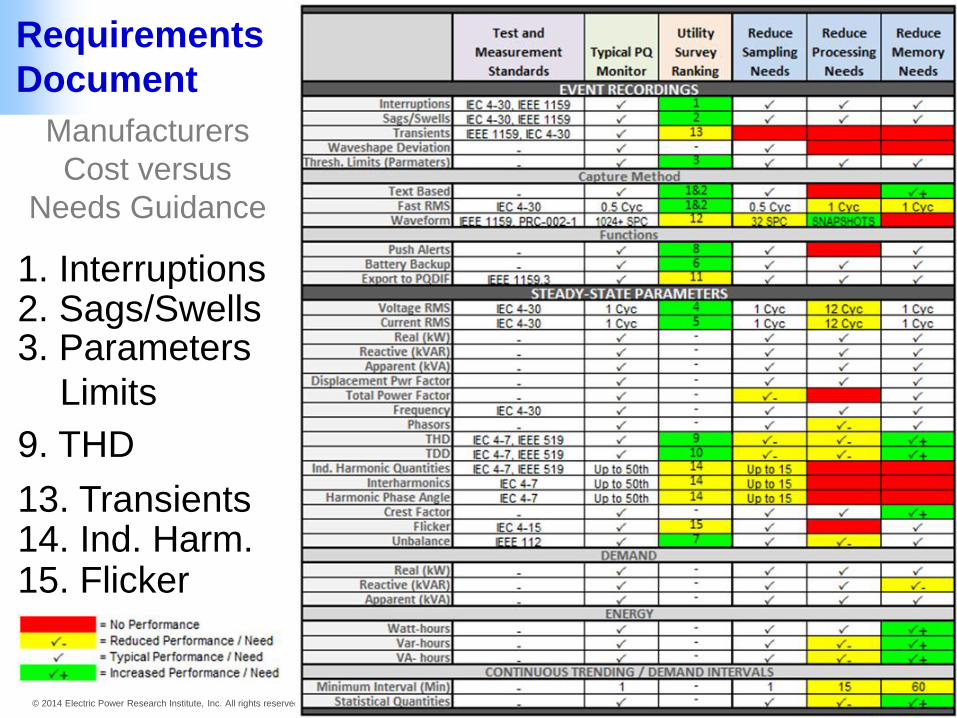
Requirements
Document
Manufacturers
Cost versus
Needs Guidance
1. Interruptions 2. Sags/Swells 3. Parameters
Limits
15. Flicker 14. Ind. Harm. 13. Transients
9. THD
25 © 2014 Electric Power Research Institute, Inc. All rights reserved.
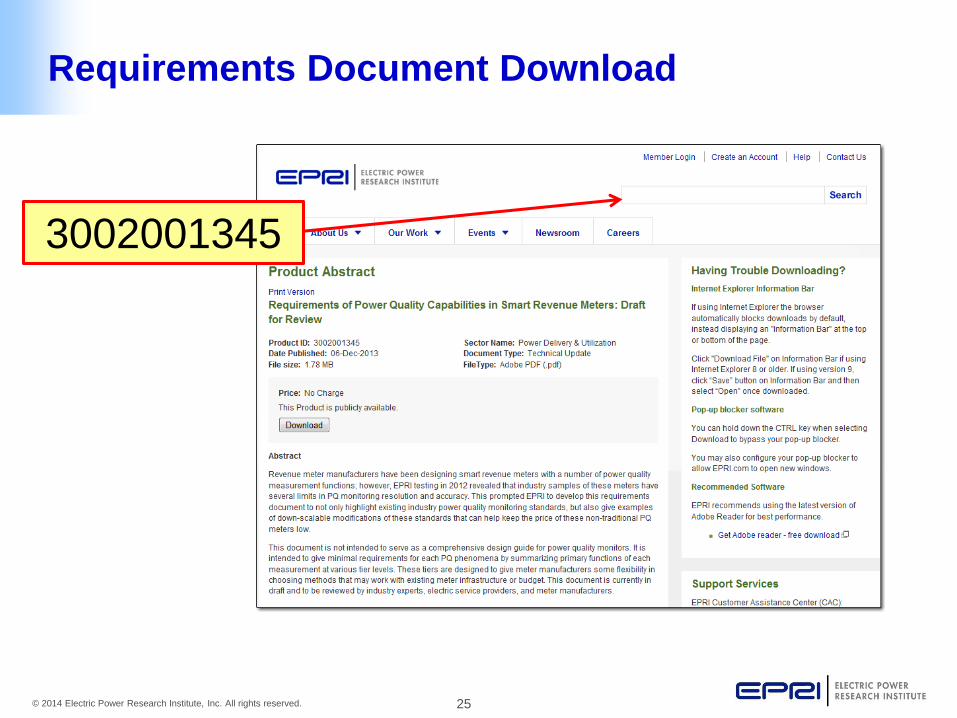
Requirements Document Download
3002001345

26 © 2014 Electric Power Research Institute, Inc. All rights reserved.
Together…Shaping the Future of Electricity