powerpoint presentation · pdf filecarillion is extending the main stand at liverpool football...
TRANSCRIPT

2016 Interim Results24 AUGUST 2016
Carillion is extending the main stand at Liverpool Football Club’s world famous Anfield
Stadium under a £75 million contract to increase the stand’s capacity by around 8,500
and the total capacity of the stadium to some 54,000, while keeping the main stand
fully operational for all matches - a project that is now nearing successful completion.

RICHARD HOWSONGROUP CHIEF EXECUTIVE
Introduction
2
Carillion acquired a majority interest in Ask Real Estate in December 2015 and a
Carillion/Ask/Tristan Capital Partners joint venture is developing the impressive £180 million
Greengate project in Manchester of new office accommodation that is also being built by Carillion.

Agenda
Introduction
Financial results
Strategy and prospects
Richard HowsonGroup Chief Executive
Richard AdamGroup Finance Director
Richard HowsonGroup Chief Executive
3

Robust first-half performance
• First-half performance in line with expectations
− led by strong revenue and margin growth in support services
− average net borrowing similar to 2015 full-year average, in line with expectations
− balance sheet remains robust with £1.4bn of committed funding
• Strong work winning performance
– £2.5bn(1)
of new first-half orders and probable orders
– total order book of £17.4bn at 30 June 2016
– record revenue visibility of 98% for 2016
− pipeline of contract opportunities increased to £41.5bn
• Interim dividend increased by 2% to 5.8p
• Expect to make further progress in 2016 – no changes to our full-year expectations
DRIVEN BY STRATEGY AND BUSINESS MODEL
4
(1) Net of £0.2 billion of orders removed as a result of selling Public Private Partnership equity investments.

‘Living our values’ every day in everything we do, is fundamental
to the success of our integrated business model.
RICHARD ADAMGROUP FINANCE DIRECTOR
Financial results
5

Financial highlights
• Strong revenue growth of 10% to £2,487.1m (2015: £2,258.6m)
− led by 8% growth in support services
• Underlying operating profit(1)
up 5% to £121.3m (2015: £115.3m)
– led by 30% growth in support services
• Underlying profit from operations(2)
up slightly to £112.7m (2015: £112.5m)
• Total Group underlying operating margin(3)
4.9% (2015: 5.1%)
− reflects expected lower contributions from PPP equity sales and from Middle East
construction services
• Underlying pre-tax profit(4)
unchanged at £84.5m (2015: £84.5m)
• Underlying earnings per share(5)(6)
up slightly to 16.0p (2015: 15.9p)
6
PERFORMANCE LED BY REVENUE AND MARGIN GROWTH IN SUPPORT SERVICES
(1) Before intangible amortisation of £6.8m (2015: £8.2m) and non-recurring operating items of £10.5m (2015: Nil)
(2) After Joint Ventures net financial expense and taxation charge of £6.9m and £1.7m (2015: £1.3m and £1.5m) respectively and before intangible amortisation and non-recurring operating items
(3) Before Joint Ventures net financial expense and taxation charge, intangible amortisation and non-recurring operating items
(4) After Joint Ventures taxation charge and before intangible amortisation, non-recurring operating items, non-operating items of Nil (2015: £1.5 million), a credit relating to fair value movements on derivative financial instruments of £9.9m (2015: charge of £7.3m ) and a credit arising from changes in the contingent consideration relating to acquisitions of £6.8m (2015: Nil)
(5) Before intangible amortisation, non-recurring operating items, non-operating items, fair value movements in derivative financial instruments and changes in the contingent consideration relating to acquisitions
(6) Based on weighted average number of shares of 430.2m (2015: 430.2m). Period end number of shares 430.3m (2015: 430.3m)
Financial highlights
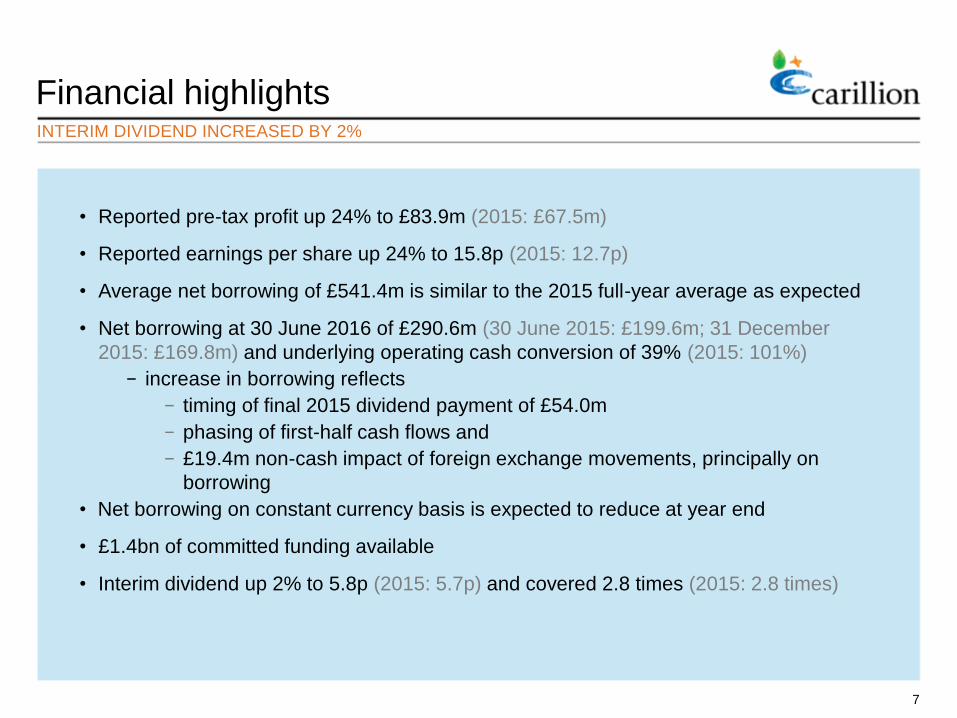
• Reported pre-tax profit up 24% to £83.9m (2015: £67.5m)
• Reported earnings per share up 24% to 15.8p (2015: 12.7p)
• Average net borrowing of £541.4m is similar to the 2015 full-year average as expected
• Net borrowing at 30 June 2016 of £290.6m (30 June 2015: £199.6m; 31 December
2015: £169.8m) and underlying operating cash conversion of 39% (2015: 101%)
− increase in borrowing reflects
− timing of final 2015 dividend payment of £54.0m
− phasing of first-half cash flows and
− £19.4m non-cash impact of foreign exchange movements, principally on
borrowing
• Net borrowing on constant currency basis is expected to reduce at year end
• £1.4bn of committed funding available
• Interim dividend up 2% to 5.8p (2015: 5.7p) and covered 2.8 times (2015: 2.8 times)
7
INTERIM DIVIDEND INCREASED BY 2%

Income StatementUNDERLYING PROFIT BEFORE TAXATION IN LINE WITH 2015
Underlying Group operating profit
Share of results of Joint Ventures
Underlying profit from operations(1)
Group net interest
Underlying profit before taxation(2)
Intangible amortisation and derivative movements
Non-recurring operating and non-operating items
Profit before taxation
Group taxation
Profit for the period
Non-controlling interests
Profit attributable to Carillion shareholders
Total Group underlying operating margin(3)
90.9
21.8
112.7
(28.2)
84.5
3.1
(3.7)
83.9
(12.2)
71.7
(3.9)
67.8
4.9%
98.4
14.1
112.5
(28.0)
84.5
(15.5)
(1.5)
67.5
(8.3)
59.2
(4.5)
54.7
5.1%
-
-
8
(1) After Joint Ventures net financial expense and taxation charge of £6.9m and £1.7m (2015: £1.3m and £1.5m) respectively and before intangible amortisation of £6.8m (2015: £8.2m) and non-recurring operating items of £10.5m (2015: Nil)
(2) After Joint Ventures taxation charge and before intangible amortisation, non-recurring operating items, non-operating items of Nil (2015: £1.5 million), a credit relating to fair value movements on derivative financial instruments of £9.9m (2015: charge of £7.3m ) and a credit arising from changes in the contingent consideration relating to acquisitions of £6.8m (2015: Nil)
(3) Before Joint Venture net financial expense and taxation charge, intangible amortisation and non-recurring operating items.
£m 2016 2015
+24%
+21%
+24%

Underlying Group operating profit
Depreciation and other non-cash items
Working capital(1)
Dividends received from Joint Ventures
Underlying cash flow from operations
Pension deficit contributions
Non-recurring operating items
Interest and taxation
Net capital expenditure
Other
Foreign exchange movements
Acquisitions and disposals
Dividends
Reduction in net borrowing
Net borrowing at 1 January
Net borrowing at 30 June
Underlying operating cash conversion
£m
98.4
(0.1)
6.1
8.7
113.1
(22.2)
(2.2)
(22.7)
(1.1)
(1.8)
63.1
2.3
(34.9)
(52.8)
(22.3)
(177.3)
(199.6)
101%
Cash flow AVERAGE NET BORROWING SIMILAR TO FULL-YEAR 2015
90.9
17.5
(70.5)
5.7
43.6
(22.3)
(5.9)
(24.2)
(14.8)
(4.5)
(28.1)
(19.4)
(18.1)
(55.2)
(120.8)
(169.8)
(290.6)
39%
2016 2015
(1) Including £35.4m (2015: £14.1 million) from the sale of Public Private Partnership Equity investments (excess of proceeds over profit)
9
Average net borrowing
2016
£541.4m £538.9m
FY 2015
• Net borrowing increased at the half year
due to timing of paying the £54.0m prior
year final dividend
• 2016 half year also impacted by
– working capital movement due to
phasing of cash flow items across
period end
– £19.4m FX movements
• Full-year expectations unchanged
– net borrowing on constant
currency basis to reduce by year
end
– full-year profit 100% cash-backed
• £1.4bn of committed funding to support
strategy for growth

10
Balance sheetROBUST BALANCE SHEET WITH £1.4 BILLION OF FUNDING TO SUPPORT STRATEGIC OBJECTIVES
148.9
1,646.6
160.5
1,956.0
(231.8)
(401.7)
(61.4)
1,261.1
(290.6)
970.5
(541.4)
140.5
1,628.1
166.1
1,934.7
(378.7)
(317.6)
(51.3)
1,187.1
(169.8)
1,017.3
(538.9)
June 2016
December2015
(1)
Property, plant and equipment
Intangible assets
Investments
Inventories, receivables and payables
Net retirement benefit liability (net of tax)
Other
Net operating assets
Net borrowing
Net assets
Average net borrowing
June2015
(1)
132.5
1,640.3
156.7
1,929.5
(352.0)
(355.9)
(87.6)
1,134.0
(199.6)
934.4
(486.5)
£m
• £1.4bn of available funding to support delivery of strategic objectives
(1) Restated for the retrospective adjustment provisional amounts recognised on the acquisition of the Outland Group in 2015.

11
PERFORMANCE LED BY STRONG GROWTH IN SUPPORT SERVICES
Segment results
• Directors’ valuation of PPP investment portfolio at a 9% discount rate decreased to £27m
(31 December 2015: £52m) due to the sale of £48m of equity at an average discount rate of just under 7%
Support services
Public Private Partnership (PPP) projects
Middle East construction services
Construction services (excluding Middle East)
Total
£m 2016 2015
1,336.0
143.8
320.3
687.0
2,487.1
1,238.5
82.5
326.5
611.1
2,258.6
+8%
+74%
-2%
+12%
+10%
REVENUE
Support services
Public Private Partnership (PPP) projects
Middle East construction services
Construction services (excluding Middle East)
Group costs and Joint Venture interest and tax
Underlying profit from operations
£m 2016
75.9
19.7
11.7
20.7
128.0
(15.3)
112.7
58.3
26.4
18.9
19.3
122.9
(10.4)
112.5
+30%
-25%
-38%
+7%
+4%
+47%
-
UNDERLYING OPERATING PROFIT(1)
2016 2015
5.7
13.7
3.7
3.0
4.9(2)
4.7
32.0
5.8
3.2
5.1(2)
OPERATING MARGIN %
2015
(1) Before intangible amortisation of £6.8m (2015: £8.2m) and non-recurring operating items of £10.5m (2015: Nil)
(2) After Group unallocated costs of £6.7m (2015: £7.6m)

• Strong organic revenue growth of 10% to £2,487.1m (2015: £2,258.6m)
• Underlying operating profit(1)
up 5% to £121.3m (2015: £115.3m)
• Underlying pre-tax profit(2)
unchanged at £84.5m (2015: £84.5m)
• Underlying earnings per share(3)
up slightly at 16.0p (2015: 15.9p)
• Reported earnings per share up 24% to 15.8p (2015: 12.7p)
• Average net borrowing broadly unchanged at £541.4m (31 December 2015: £538.9m)
Financial results summaryPERFORMANCE LED BY REVENUE AND MARGIN GROWTH IN SUPPORT SERVICES
(1) Before intangible amortisation of £6.8m (2015: £8.2m) and non-recurring operating items of £10.5m (2015: Nil)
(2) After Joint Ventures taxation charge of £1.7m (2015: £1.5m) and before intangible amortisation, non-recurring operating items, non-operating items of Nil (2015: £1.5 million), a credit relating to fair value movements on derivative financial instruments of £9.9m (2015: charge of £7.3m) and a credit arising from changes in the contingent consideration relating to acquisitions of £6.8m (2015: Nil)
(3) Before intangible amortisation, non-recurring operating items, non-operating items, changes in fair value movements in derivative financial instruments and changes in the contingent consideration relating to acquisitions
12

Strategy andprospectsRICHARD HOWSONGROUP CHIEF EXECUTIVE
13
Mobile technology plays a key role in enabling Carillion to deliver large,
complex support services contracts successfully and efficiently.

Good first-half performance
• Consistent delivery demonstrates robust strategy and integrated business model
• Continuing growth in support services
– contributed some 60% of operating profit in first half of 2016
• Work-winning remains strong
– £2.5bn(1)
of new and probable orders in first half versus £1.0bn in first half of 2015
– total value of orders plus probable orders at 30 June 2016 of £17.4bn
• Investments in Public Private Partnerships performing well
• Construction in UK, Middle East and Canada in line with expectations, supported by a
highly selective approach
• Expect Group to make further progress in 2016 with no changes to our full-year
expectations
DRIVEN BY ROBUST STRATEGY AND BUSINESS MODEL
14
(1) Net of £0.2 billion of orders removed as a result of selling Public Private Partnership equity investments.

Our integrated, scaleable business model
15
CONTINUES TO DRIVE PERFORMANCE AND ADD VALUE
Resources What we do
• Centralised operating
platform
• Strong risk
management
• First-class supply
chain management
• Embedding
sustainability into
everything we do
• Building long-term
partnerships with
customers, partners
and suppliers
• Living our Values
• High standards of
corporate governance
Key outputsHow we do it
• Growing a sustainable
business and creating
value for all our
stakeholders
• Financial strength
• Excellent people
• First-class expertise
• Leadership in Health &
Safety
• Leadership in
sustainability
Value created and shared with our stakeholders and also reinvested in our business

Delivering on our strategyGROWING SUPPORT SERVICES
16
Support Services
Public Private Partnership projects(2) (3)
Construction (including Middle East)
(2) Includes construction of PPP projects
Revenue
(1) 1999 UKGAAP; 2015 and 2016 IFRS
15% 80%
5%
£1.8bn(1)1999
2015
H1 2016
£4.6bn(1)
£2.5bn(1)
55% 41%4%
40%54%
6%
29% 60%
11%
£56.2m1999(2)
2015(2)
H1 2016(2)
£259.0m
£128.0m
57% 24%19%
25%60% 15%
Underlying operating profit(1)
Margin(4) 5.3%
(3) Includes construction of PPP projects
(2) 1999 UKGAAP; 2015 and 2016 IFRS
(1) Before intangible amortisation of £6.8m (2015: £8.2m) and non-recurring operating items of £10.5m (2015: Nil)
(4) Before Joint Ventures net financial expense and taxation charge, intangible amortisation and non-recurring operating items
Margin(4) 4.9%
Margin(4) 2.3%

2016 first-half revenue by geography TOTAL GROUP REVENUE £2.5 BN, UP 10%
17
646 1,077
UK(1)
£1,844m - 74%(2015: £1,600m - 71%)
22
199
Canada(2)
£262m - 11%(2015: £281m - 12%)
41
61
Middle East and North Africa
£381m - 15%(2015: £378m - 17%)
320
76%
8%
16%
16%
84%
121
Support services
Public Private Partnership
(PPP) projects
Construction services
Support services
Construction services
Support services
Public Private Partnership
(PPP) projects
Construction services
(1) Includes £10.8m (2015: £22.0m) of revenue generated outside the UK, Middle East and
North Africa and Canada
(2) Includes £3.4m (2015: £9.8m) of revenue generated in the Caribbean
35% 58%
7%

Order book and probable orders
18
REVENUE VISIBILITY OF 98% FOR 2016
• 80% of orders plus probable orders in support services
and PPP projects (31 December 2015: 80%)
• Order book of £15.0bn, plus probable orders of £2.4bn
totalling £17.4bn (31 December 2015: £17.4bn)
• Strong revenue visibility(2)
for 2016 of 98%
(31 December 2015: 84% for 2016)
• In addition, we have been awarded framework
agreements with a total potential value of over £2bn
Support services £13.0bn 75%(31 December 2015: £12.7bn: 73%)
Public Private Partnership(PPP) projects £0.9bn 5%(31 December 2015: £1.2bn: 7%)
Middle East construction services £0.6bn 3%(31 December 2015: £0.8bn: 5%)
Construction services (excludingthe Middle East) £2.9bn 17%(31 December 2015: £2.7bn: 15%)
£2.5bn(1)
(30 June 2015: £1.0bn)
Total orders plus probable orders
£17.4bn(31 December 2015: £17.4bn)
17% 75%
5%
3%
(1) Net of £0.2 billion of orders removed as a result of selling Public Private Partnership equity investments
(2) Based on expected revenue and secure and probable orders, which exclude variable work, frameworks and re-bids
New first-half orders and probable orders

£2.5bn of first-half orders and probable orders
19
Support services
• Petroleum Development Oman
– £240m 4.5 year extension
• Northern Ireland Housing Executive
– up to £366m over 10 years
• Canada support services
– power and oil sectors over £140m(1)
Public Private Partnership projects
• Financial close on Irish Schools Bundle 5(2)
- £4.5m of equity and construction,
services and concession revenue of
over £190m over 27 years
SIGNIFICANT SUCCESSES IN 2016
(1) Includes the Maritime Link power transmission project announced in July 2016
(2) Classified as a probable order at 31 December 2015 and became a secure order in July 2016

UK construction
£2.5bn of first-half orders and probable orders
20
SIGNIFICANT SUCCESSES IN 2016
Middle East construction
• Lambeth College - £167m
• Manchester Central - £158m
• Gateshead Quays - £168m
• Milburngate, Durham - £130m
• Embankment West, Salford - £120m
• Angel Gardens, Manchester - £85m
• Paradise Circus, Birmingham - £40m
(one phase of several prospective phases)
Al Futtaim Carillion
• Bee’ah, Dubai(1)
- £60m (Carillion’s share: £30m)
(1) Classified as a probable order at 31 December 2015 and became a secure order in H1 2016

Substantial high-quality pipeline SIGNIFICANT OPPORTUNITIES FOR FURTHER PROGRESS
21
Support services £12.1bn 29%(2015: £12.1bn: 29%)
Public Private Partnership
(PPP) projects £2.3bn 6%(2015: £2.4bn: 6%)
Middle East
construction services £16.0bn 38%(2015: £16.0bn: 39%)
Construction services (excluding
the Middle East) £11.1bn 27%(2015: £10.9bn: 26%)
Pipeline opportunities
£41.5bn(31 December 2015: £41.4bn)
41.5£bn
33.135.2
37.539.2
20132012 2014 2015 20162011
12.1
2.3
16.0
11.1
31 December 30 June
41.4

Growth market sectors
22
UK, CANADA, MIDDLE EAST
Support services Public Private Partnerships
£1.3bn2016 revenue
Constructionservices
£13.0bnOrder book
£12.1bnPipeline
£0.2bn2016 revenue
£0.9bnOrder book
£2.3bnPipeline
£1.0bn2016 revenue
£3.5bnOrder book
£27.1bnPipeline

Managing the potential impacts of Brexit
• Carried out extensive work to assess potential impact prior to Referendum
• Put robust plans in place to manage impacts of Brexit
• No significant operations in mainland Europe
• Sourcing of labour from EU countries
• Some sourcing of commodities and materials from EU countries
• Exchange rate impacts on prices
• Overall, well positioned to manage potential impacts
WELL POSITIONED WITH ROBUST PLANS IN PLACE
23

Well positioned to make further progress
24
LED BY GROWTH IN SUPPORT SERVICES
• Robust strategy and business model
• Performance led by revenue and margin
growth in support services
• Strong work-winning performance
• Substantial, high-quality order book &
probable orders worth £17.4bn
• Record full-year revenue visibility(1)
of 98%
• Increased pipeline of contract opportunities
of £41.5bn
• Well positioned to manage potential impacts
of Brexit
• Expect to make further progress in 2016 with
no changes to full-year expectations
(1) Based on expected revenue and secure and probable orders, which exclude variable work, frameworks and re-bids

Appendices
25
Carillion has a £91 million contract for Helical Bar to deliver Phase 1
of the Bart's Square mixed-use development in the City of London on
a site that includes the area formerly occupied by Barts Hospital.

Facts about Carillion
26
Support services
Public Private Partnership (PPP) projects
• Carillion has the skills and resources to provide all the services needed to manage and maintain property, road, rail and utility infrastructure networks
• We provide facilities management and other support services for thousands of public and private sector buildings
• We provide management and maintenance services for some 17,000 kilometres of road in the UK and Canada
• In the UK, we provide services for public utility networks, including the broadband network for Openreach for whom we are also a key delivery partner in the roll out of super-fast fibre access
• In Canada, we provide power transmission and distribution services and remote site accommodation services
• In the Middle East we provide facilities management services for property estates and highways maintenance services
• We have been a leader in PPP projects since the inception of the UK’s Private Finance Initiative in the early 1990’s
• Since then, we have financially closed 65 PPP contracts in the UK and Canada for hospitals, schools, prisons, military accommodation, roads and railways
• We have sold PPP equity investments generating proceeds of some £667 million and a pre-tax profit of around £256 million
• In the Middle East, we are developing opportunities for PPP projects to support customer investment programmes
Carillion is a leading integrated support services company employing some
46,000 people across the UK, in the Middle East and Canada

Facts about Carillion
27
Middle East construction services
Construction Services(excluding the Middle East)
• We have around 40 years experience of operating in the Middle East, where we have built an outstanding reputation for quality and reliability
• We operate in the UAE, Oman, Qatar, the Kingdom of Saudi Arabia and Egypt
• We have built many of the region’s iconic landmark projects, including Dubai Festival City, the Grand Mosque in Oman, the Yas Hotel, (centre piece of Abu Dhabi’s Formula 1 Grand Prix circuit) and the Royal Opera House in Oman
• Our history in construction spans almost two centuries, as Carillion brings together the heritage of Tarmac, Mowlem and Alfred McAlpine
• Carillion has continued to deliver outstanding projects, such as the new Government Communication Headquarters in Cheltenham, 17 major hospitals, some 160 new schools, several prisons and numerous motorway, trunk road and rail projects
• In Canada, where we have operated for around 50 years, we have also built a reputation for delivering high-quality projects, particularly Public Private Partnership projects, where we have financially closed nine major projects, notably in the healthcare sector.
Carillion is a leading integrated support services company employing some
46,000 people across the UK, in the Middle East and Canada

Revenue and profit summary
28
65.6 10.3 75.9
12.3 7.4
19.7
4.5 7.2
11.7
15.2 5.5
20.7
128.0
(6.7)
121.3
(6.9)
(1.7)
112.7
Support servicesGroupShare of joint venturesTotal
Public Private Partnership projectsGroupShare of joint venturesTotal
Middle East construction servicesGroupShare of joint venturesTotal
Construction services (excluding the Middle East)GroupShare of joint venturesTotal
Total revenue and operating profit
Group eliminations and unallocated items
Operating profit (before Joint Ventures net financial expense and taxation)
Share of Joint Ventures net financial expense
Share of Joint Ventures taxation
Underlying profit from operations
£m 20152016
+30%
-25%
-38%
+7%
+5%
-
2015
1,203.1 132.9
1,336.0
0.7143.1 143.8
200.1 120.2 320.3
682.7 4.3
687.0
2,487.1
2016
Underlying operating profit(1)Revenue
1,158.679.9
1,238.5
0.681.982.5
194.4132.1326.5
607.73.4
611.1
2,258.6
48.8 9.5
58.3
22.6 3.8
26.4
16.1 2.8
18.9
18.5 0.8
19.3
122.9
(7.6)
115.3
(1.3)
(1.5)
112.5
+8%
+74%
-2%
+12%
+10%
(1) Before intangible amortisation and non-recurring operating items

69 49
247
805
51
122
26
0
100
200
300
400
500
600
700
800
900
2016 2017 2018 2019 2020 2021 2022 2023 2024
£1.4bn of available fundingMATURITY PROFILE FOLLOWING RENEWAL OF UK BORROWING FACILITIES
29
£m
15

Total revenue by sector/geography
30
UK public sector
UK regulated sector
UK private sector
International
0.5
0.4
0.6
1.040%
24%
16%
20%
Total revenue first-half 2016
£2.5bn (2015: £2.3bn)

Risk management STRONG AND RESILIENT PROCESSES
31
Carillion plc Board
Board sub-committees
Business Integrity Committee
SustainabilityCommittee
Major Projects Committee
Audit Committee
Corporate Oversight and Direction
Group Chief Executive’s Leadership Team
OtherFunctional Heads
Group RiskManagement
Operations
Business UnitManaging Directors
Contract RiskManagers
Business UnitRisk Management
PeerReviews
Assurance
Internal Audit
External Audit
External Benchmarking

Market sectors
32
UK
Support services
Public Private Partnerships
£1.1bnH1 2016 revenue
Constructionservices
£0.6bnH1 2016 revenue
£0.1bnH1 2016 revenue
• Defence
• Roads
• Rail
• Airports
• Private sector ‘relationship customers’
• Mixed-use developments
• Increased Government spending especially on infrastructure
• Infrastructure services
– Rail and roads
– Power distribution
– Airports
• Property FM services
– Public sector
– Health
– Local Authorities
– Defence
– Ministry of Justice
– Private sector
• Targeting further projects
– Integrated solutions
– Healthcare/hospitals
– Schools/academies
– Highways
• £54m of equity still to be invested in 4 financially closed projects

Market sectors
33
CANADA
Support services
Public Private Partnerships (PPP)
£0.2bnH1 2016 revenue
Construction services
£41mH1 2016 revenue
£22mH1 2016 revenue
• PPP driven
• Key sectors
– Health
– Roads
– Rail
– Airports
– Power
• Further project opportunities
• Major programmes with total capital value of some $60bn
– Ontario
– British Columbia
– Alberta
– Saskatchewan
• £7m of equity still to be invested in 2 financially closed projects
• Highways maintenance
• Acquisition of Outland Group in 2015 broadens services offering to include remote site accommodation and associated services
• Power transmission & distribution
• FM
– Health (PPP projects)
– Defence
– Education
– Municipalities
• Oil & Gas/natural resource industries
• Medium-term growth from expansion into new Provinces

Market sectors
34
MIDDLE EAST
Construction services
Public Private Partnerships (PPP)
£0.3bnH1 2016 revenue
Support services
£61mH1 2016 revenue
£nilH1 2016 revenue
• Property FM
– Health
– Airports
– Commercial
• Infrastructure services
– roads and rail
• Energy services
• Oil & gas sector services
• Opportunities for growth over medium term
– Dubai
– Oman
– Qatar
• Medium term
– Abu Dhabi 2030 Plan
– Saudi Arabia
• UK Export Finance is a key differentiator for Carillion
• Increasing potential for PPP projects in Middle East and other international regions e.g.
– Oman
– Bahrain

Directors’ valuation of equity in financially closed Public Private Partnership projects
35
VALUATION REDUCED BY £19M AFTER £48M OF EQUITY SALES
Discount rate
0
20
40
60
80
5% 6% 7% 8% 9% 10% 11% 12%
Net
pre
sen
t valu
e (
£m
)
£44m(1)
£27m(2)
Net present value at 30 June 2016
£27m (31 December 2015: £46m)
(1) Average discount rate for disposals in 2016
(2) Directors’ valuation
• Potential for approximately £62m of further equity
investments

36
Financially closed PPP projects
Roads
A13
Aberdeen Western Peripheral
Health
Royal Ottawa Hospital, Canada
North Battleford Hospital, Canada
Stanton Hospital, Canada
Royal Liverpool Hospital
Midland Metropolitan Hospital
PPP projectFinancial
Close Date StatusConcession Period Years
EquityInvested
to date (£m)Equity
Share (%)
TotalCommittedEquity (£m)
Non-RecourseDebt (£m)
2000
2014
2004
2015
2015
2013
2015
Operational
In Construction
Operational
In Construction
In Construction
In Construction
In Construction
30
33
20
33
33
35
33
7.5
-
0.7
-
-
-
-
7.5
20.2
0.7
3.5
3.9
15.2
13.3
25
33
50
50
50
50
50
Continued
45.5
74.3
-
43.2
30.3
74.8
25.0
At 30 June 2016

37
Financially closed PPP projects
PPP projectFinancial
Close Date StatusConcession Period Years
EquityInvested
to date (£m)Equity
Share (%)
TotalCommittedEquity (£m)
Non-RecourseDebt (£m)
1995
2015
2007
2008
2009
2009
2010
2010
Operational
In Construction
Operational
Operational
Operational
Operational
Operational
Operational
30
28
25
25
25
25
25
25
-
-
0.4
0.4
0.5
1.0
0.5
0.8
11.8
-
5.6
0.4
0.4
0.5
1.0
0.5
0.8
73.5
100
42.5
4
8
8
8
8
8
-
10.0
2.0
4.2
3.6
9.4
4.7
3.2
330.2
At 30 June 2016
Education
University of Greenwich
Priority Schools Midlands
South Tyneside and
Gateshead Schools BSF
Nottingham Schools BSF
Durham Schools BSF
Tameside Schools BSF
Rochdale Schools BSF
Wolverhampton Schools BSF
TOTAL

Middle East construction servicesREVENUE BY COUNTRY
38
90
110
18
Dubai
Abu Dhabi
Oman
Egypt
Qatar & Saudi
32%
6%
34%
102
28%
2016 Revenue
£320m
2015 Revenue
£327m
68
127
30
31%
9%
39%
102
21%

Acquisitions and disposals
• Acquisition of the Outland Group is the second instalment of the consideration payable
• Investments income of £1.5m relates to the repayment of sub-debt invested in PPP joint ventures
39
Acquisition of the Outland Group
Acquisition of Ask Real Estate Limited
Investments
Acquisition of the Rokstad Corporation
Transaction costs
Other
£m 2016
(15.0)
(4.0)
1.5
-
(0.6)
-
(18.1)
(8.2)
-
(16.9)
(2.6)
(6.9)
(0.3)
(34.9)
2015

Non-underlying items
• Change in fair value of contingent consideration relates to a reduction in the amount payable on the acquisition of the Rokstad Corporation
• Construction Workers Compensation Scheme represents Carillion’s share of the compensation and associated costs that we expect to pay to workers who have been impacted by the use of the database vetting system operated by The Consulting Association
40
Fair value movement in derivatives
Intangible amortisation
2016
9.9
(6.8)
3.1
(7.3)
(8.2)
(15.5)
2015
20152016
Change in fair value of contingent consideration
Construction Workers Compensation Scheme
Acquisition costs
6.8
(10.5)
-
(3.7)
-
-
(1.5)
(1.5)
Intangible amortisation and derivative movements
Non-recurring operating and non-operating items
£m
£m

Cautionary Statement
This presentation may contain indications of likely future developments and other forward-
looking statements that are subject to risk factors associated with, among other things, the
economic and business circumstances occurring from time to time in the countries, sectors and
business segments in which the Group operates. These and other factors could adversely
affect the Group's results, strategy and prospects. Forward-looking statements involve risks,
uncertainties and assumptions. They relate to events and/or depend on circumstances in the
future which could cause actual results and outcomes to differ materially from those currently
anticipated. No obligation is assumed to update any forward-looking statements, whether as a
result of new information, future events or otherwise.

2016
Interim Results
42
‘Living’ our values shapes the way we do business – how we work
with each other, our customers, our suppliers, our partners and all
those with whom we interact when delivering our services.
In 2015, Carillion acquired the Outland Group, a leading provider of remote-
site accommodation services that operates across Canada to support a variety
of private and public sector customers who need to work remote locations.