powerpoint presentationiclgroupv2.s3.amazonaws.com/corporate/wp-content/uploads/sites/... ·...
TRANSCRIPT

Investor Presentation
July 2018

Safe Harbor
2
This Presentation (references to which and to any information contained herein shall be deemed to include information which has been or may be supplied in writing or orally in connection herewith or in connection with any further enquiries) is provided for the sole purpose of providing general information to assist the recipient in deciding whether it wishes to proceed with a further investigation for investing in Israel Chemicals Ltd. and/or its affiliates (hereinafter jointly referred to as the “Company” or “ICL”). This Presentation shall not form the basis of, or be relied upon in connection with, any contract or commitment whatsoever, and it does not purport to be comprehensive or to contain all the information that the recipient may need in order to evaluate the Company and/or its assets.
No representation, warranty or undertaking, express or implied, is given by ICL and/or any member of the ICL Group or their respective directors, officers, employees, agents, representatives and/or advisers as to or in relation to the accuracy, completeness or sufficiency of the information contained in this Presentation or as to the reasonableness of any assumption contained therein. To the maximum extent permitted by law , the Company and its respective directors, officers, employees, agents, representatives and/or advisers expressly disclaim any and all liability which may arise from this Presentation and any errors contained therein and/or omissions therefrom or from any use of this Presentation or its contents or otherwise in connection therewith.
No representation or warranty is given as to the achievement or reasonableness of, and no reliance should be placed on, any valuations, forecasts, estimates, opinions and projections contained in this Presentation. In all cases, recipients should conduct their own investigation of any analysis of the Company and/or its assets and the information contained in this Presentation. Nothing in this Presentation constitutes investment advice and any opinions or recommendations that may be contained herein have not been based upon a consideration of financial situation or particular needs of any specific recipient. Any prospective investor interested in buying Company’s securities or evaluating the Company and/or its assets is recommended to seek its own financial and other professional advice.
This Presentation and/or other oral or written statements made by ICL during its presentation or from time to time, may contain forward-looking statements within the meaning of the United States Private Securities Litigation Reform Act of 1995 and other applicable securities laws. Whenever words such as "believe," "expect," "anticipate," "intend," "plan," "estimate", “predict” or similar expressions are used, the Company is making forward-looking statements. Such forward-looking statements may include, but are not limited to, those that discuss strategies, goals, financial outlooks, corporate initiatives, existing or new products, existing or new markets, operating efficiencies, or other non-historical matters.
These forward-looking statements and projections are not guarantees of future performance and are subject to a number of assumptions, risks, projections and uncertainties, many of which are beyond the Company’s control, which could cause actual results, performance or achievements to differ materially from those described in or implied by such statements or projections. Because such statements deal with future events and are based on ICL’s current expectations, they could be impacted or be subject to various risks and uncertainties, including those discussed in the "Risk Factors" section and elsewhere in our Annual Report on Form 20-F for the year ended December 31, 2017, and in subsequent filings with the Tel Aviv Securities Exchange (TASE) and/or the U.S. Securities and Exchange Commission (SEC). Although the Company believes that the expectations reflected in such forward-looking statements are based on reasonable assumptions, it can provide no assurance that expectations will be achieved. Except as otherwise required by law, ICL disclaims any intention or obligation to update or revise any forward-looking statements, which speak only as of the date hereof, whether as a result of new information, future events or circumstances or otherwise. Readers, listeners and viewers are cautioned to consider these risks and uncertainties and to not place undue reliance on such information.
Certain market and/or industry data used in this Presentation were obtained from internal estimates and studies, where appropriate, as well as from market research and publicly available information. Such information may include data obtained from sources believed to be reliable, however ICL disclaims the accuracy and completeness of such information which is not guaranteed. Internal estimates and studies, which we believe to be reliable, have not been independently verified. We cannot assure that such data is accurate or complete.
Included in this presentation are certain non-GAAP financial measures, such as Adjusted Operating income and Adjusted Net income, designed to complement the financial information presented in accordance with GAAP because management believes such measures are useful to investors. These non-GAAP financial measures should be considered only as supplemental to, and not superior to, financial measures provided in accordance with GAAP. Please refer to our Annual Report on Form 20-F for the year ended December 31, 2017 filed with TASE and the SEC for a reconciliation of the non-GAAP financial measures included in this presentation to the most directly comparable financial measures prepared in accordance with GAAP.

Corporate Overview

Specialty Fertilizers
6%Potash &
Mg.31%
Advanced Additives
22%
Industrial Products
33%
Food Specialties
6%Specialty Fertilizers
13%
Potash & Mg.23%
Advanced Additives
15%
Industrial Products
22%
Food Specialties
11%
Our Business Segments
Financial Metrics Snapshot(2) Sales and Operating Income By Sub-Segments(2,3)
Essential Minerals
Potash & Magnesium
Specialty Fertilizers
Specialty Solutions
Industrial Products
Advanced Additives
Food Specialties
FY2017 Q1 2018
Sales(3) 5,418 1,404
($,mn)
Adj. Operating Income(4) 652 151
Adj. Net Income(4) 389 106
$5.9bn Market Cap
(02/07/2018)
2.3xLTM Net
Leverage(5)
Leading Global Fertilizer and Specialty Minerals Company
4
FY2017 Sales Mix
39%
Specialty Solutions Essential Minerals
61%48% 52%
FY2017 Operating Income(6)
BBB-
BBB-
Agriculture Industrial
1. A nontransferable Special State Share in ICL, with several rights and upon occurrence restrictions. 2. Includes Fire Safety and Oil Additives. Please refer to page 35. 3. External sales only, excludes intra company sales. 4. Excludes certain expenses and/or income that management believes are not indicative of ongoing operations. 5. Excludes EBITDA from the divested Fire Safety and Oil Additives business. 6. Excludes non-allocated and G&A expenses. 6. Calculated based on average Market Cap. For full year 2017.
(Stable)
(Stable)
YoY
8%
30%
56%
PhosphateCommodities
Phosphate Commodities
16%
Phosphate Commodities
2%
YoY
1%
12%
14%
3.3%Div. Yield (6)
(FY2017)

5
Diversified Company, Integrated Along the Value Chains
5

Unique Business Model, Integrated Along the Mineral Value Chains
6
ResourcesOur Specialty
MineralsOur
ExpertiseSegment Products End Markets
Essential Minerals
Specialty Solutions
Pure PhosphoricAcid
Green Phosphoric Acid
SSP, TSP, DAP, MAP
Potash Fertilizer
StraightsMAP,MPK,Pekacid
Liquid/Water Soluble Fertilizers
Compound NPK
Food Phosphate Additives
Dairy Proteins
Phosphate Acids
Industrial Phosphate Salts
P4 Derivatives
Clear Brine Fluids
Mercury Emission
Bromine Industrial Solutions
Flame Retardants
Polysulphate
Phosphate
Potash
Bromine
Magnesium
UK
China YPH
Negev Desert
Dead Sea
AgricultureMining and Extraction
Formulation
Marketing
R&D
Industrial
Potash
Spain
PolysulphateFertilizers
CRF and SRF
Phosphate

7
ICL Business Model
7
Food
Specialties
Advanced
Additives
Industrial
Products
Specialty
Fertilizers
Phosphate
Potash
Semi-
Specialty
Fertilizers
AGRICULTURE
INDUSTRIAL

EMPLOYEES WORLDWIDE
2017 SALES* BY BUSINESS LINE
53%OF ICL SALES IN 2017
Potash 4,773 K ton
Phosphate Rock 4,877 K ton
Phosphate Fertilizers 2,094 K ton
Potash 5,039 K ton
Phosphate Fertilizers 2,291 K ton
Polysulphate 292 K ton
$3.0Bn 2017 SALES*
$359M 2017 OPERATING INCOME**
2017 PRODUCTION
2017 SALES VOLUME
ICL Essential Minerals Profile
* Before setoffs and inter-segment eliminations. ** Before G&A expenses. Before setoffs and inter-segment eliminations.All numbers are rounded.
~ 7,600
44%
34%
22%
Potash & Magnesium PhosphateSpecialty Fertilizers
2017 FINANCIALS
8
53%47%
Essential Minerals
Specialty Solutions

ICL Specialty Solutions Profile
~ 3,700
2017 PHOSPHATE VALUE CHAIN SALES*
% SALES BY BUSINESS UNIT***
25%
$2.4B SALES*
$554MOPERATING INCOME**
Food Specialties
51%Industrial Products
24%Advanced Additives
EMPLOYEES WORLDWIDE
* Before setoffs and eliminations** Before G&A expenses*** Data excludes the divested Fire Safety and oil Additives businessesAll numbers are rounded
2017 MAIN FINANCIAL RESULTS
27%
40%
19%
14%
2017 IP SALES BREAKDOWN
Brominated FRs
Other Brominated Solutions
Phosphorus Compounds
Specialty Minerals
9
Phosphate Acids26%
Industrial Phosphates
17%
Phosphate Food
Additives 36%

Our Strategic Direction
10
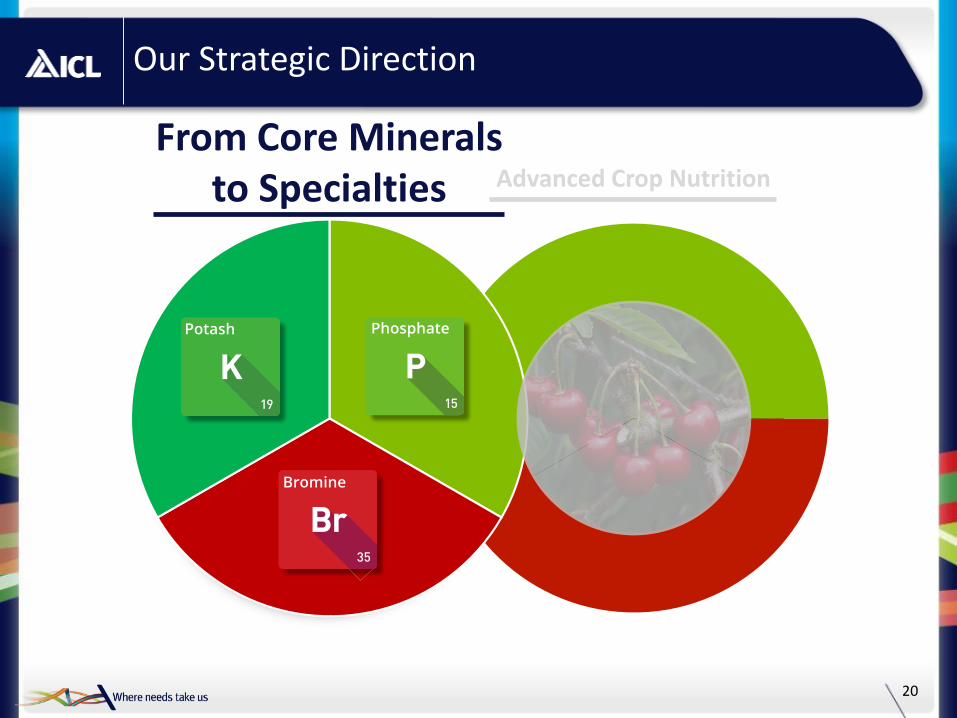
From Core Minerals to Specialties Advanced Crop Nutrition

Our Strategic Direction
11
From Core Minerals to Specialties
Advanced Crop Nutrition

Mineral Asset Base: Potash, Bromine, Phosphate and PolysulphateTM Sites
12
High quality and practically inexhaustible source of potash,
bromine & magnesium
▪ Low cost
▪ Near-infinite reserve life
▪ Logistical advantages: stockpiling ability, proximity to ports and to end markets
Facilitate favorable access to European Ag markets
▪ Logistical advantages: focus on domestic markets, close to ports, hub centre in Europe
▪ Synergies and optimization within production sites
▪ Vast resources of potash in Spain and Polysulphate in the UK
Backbone of our phosphate value chain
▪ Backward integration to Specialty Solutions
▪ Synergies and optimization within production sites
▪ YPH JV: shift to specialties to become the hub of ICL’s specialty businesses in Asia
Potash & Bromine
ICL Dead Sea
Potash & Polysulphate
ICL Iberia, ICL UK
Phosphates
ICL Rotem, YPH JV

Optimization of our Mineral Assets
13
▪ Production process improvement
▪ Early retirement plan
▪ Rock production optimization
▪ Energy efficiency
▪ Maintenance optimization
▪ ~ 50% reduction in workforce
▪ Targeting 1M tonnes by 2020
▪ Significant reduction in loss expected in 2018, profitability expected from 2020
▪ Building access ramp, expand capacity in Suria
▪ New port terminal
ICL Iberia – mine consolidation & logistics upgrade
Operational Excellence In the Dead Sea and Rotem
ICL UK – full shift to Polysulphate in progress
▪ Labor reduction
▪ Process improvement
▪ WPA capacity expansion
YPH JV – Cost efficiency & shift to specialties

Optimization Measures to Reduce Costs and Maintain Production
14
Optimization
~10-15%Reduction in potash cost per tonne over 5 Years
~5M TonneMaintain stable
Potash production
ShiftPhosphate and UK
to Specialty

Specialty
Semi Specialty
Commodity
15
The Evolution of Crop Nutrition
▪ CRF (Controlled Release Fertilizers)
▪ WSNPK (Water Soluble Fertilizers)
▪ Soluble (MAP/MKP)
▪ CN (Calcium Nitrate)▪ NOP (Potassium Nitrate)
NNitrogen
7
PPhosphorous
15
KPotassium
19
Added value
Higher prices
Smaller volumes
Selective distribution

Mineral Attributes
▪ Multi-nutrients
▪ Extended Availability
▪ Natural fertilizer
ICL’s Advantages
▪ Sole producer
▪ Existing infrastructure
▪ Market position
Polysulphate as the Backbone of Our Semi-Specialty Business
A PREMIUM NICHE FERTILIZER WITH UNIQUE BENEFITS
48%S
14%K
17%Ca
6%Mg
15%Other
0
1,000
2,000
3,000
2016 2017 2020 LT potential
K Tonnes
Market Demand Outlook
16

Semi-Specialty Growth Target
Growth
From ~$100M to ~$400MIncrease in Semi-Specialty sales within 5 years
17

Specialty Fertilizers: Building Leadership in Advanced Crop Nutrition Solutions
R&D InfrastructurePrecision
Ag Business
Development
18

Specialty Fertilizers Growth Targets
Growth through Leadership
in Advanced Crop Nutrition
Createbest-in-class
innovative platform
Over $1BNSales within 5 Years
ImproveOperating Margin
19
Our Strategic Direction
20
From Core Minerals to Specialties Advanced Crop Nutrition

280 280
120 120
170 165
77 62
7787
2017 2022
ICL Bromine Value Chain: Global Leadership
21
The Dead Sea provides the highest concentration of Bromine
The Largest Capacity (KMT)(2)
Global Bromine Capacity/producer
ALB (Dead Sea)
ICL (Dead Sea)
Other
USA (ALB & LXS)
China
724
Bromine Prices in China(1)
($/Mt)
714
(1) Source: Bloomberg (2) Source: ICL estimates, MarketsandMarkets
Aug 16 Nov 16 Mar 17 Jul -17 Nov 17 Mar 18Apr 16
▪ New product development including new applications and next generation flame retardants
▪ Value-based pricing approach
▪ Leverage on resource depletion in China and leading market position
▪ Advocacy - FR Standards, SAFR™, Merquel® in China/EU…
▪ Cost reduction initiatives
▪ Global leader in bromine capacity
▪ Backward integrated to the lowest-cost source of bromine
▪ Largest producer of brominated flame retardants, biocides and clear brine fluids
▪ Largest Iso-tank fleet
▪ Near infinite reserve life
Key advantages Growth and margin expansion through…

22
P2O5 Value Chain: Continued Quest For Global Opportunities in Specialty Phosphates
ICL
Innophos
PrayonChinese
Others
(1) Source: market size (acid/salts) via internal analysis, published data & other market reports. Includes Europe, NA and LatAm.(2) Proforma results adjusted for divestments of fire safety and P2S5 businesses. Before setoffs and inter-segment eliminations.
GLOBAL MARKET LEADERSHIPIN SPECIALTY PHOSPHATES(1)
Nth America
50%
Sth America13%
EMEA 28%
Asia/Pac9%
Advanced Additives
Nth America
28%
Sth America13%
EMEA 28%
Asia/Pac32%
Note: Sales and operating income according to Organizational Structure as of Q1 2017. All numbers are rounded.
• Full phosphate chain from rock to salts
• Largest global footprint in specialty phosphates
• Value based pricing approach
• Product Differentiation
• Geographic Expansion: increase footprint in growing emerging markets
• Expand portfolio through innovation based on global trends, tailored solutions
• Cost optimization: “Lean & Reliable”
• Support growth through opportunistic M&A
Food Specialties
GROWTH STRATEGY
KEY ADVANTAGES
Advanced Additives
Food Specialties
• Variety of single, multi blends and
agglomeration technology in food ingredients
• Supported by global trends
GLOBAL SALES FOOTPRINT (2)

Specialty Solutions Segment Long-Term Targets
23
Maintain strength.Provide stability.
Outgrowthe market
Expandmargins

Financial Overview
-
200
400
600
800
1,000
1,200
2018 2019 2020 2021 2022 2023 2024 2025 2026 2038
156195
17
210 407
120
490
0 46
600
331
104
70
404
600
Loans Securitization
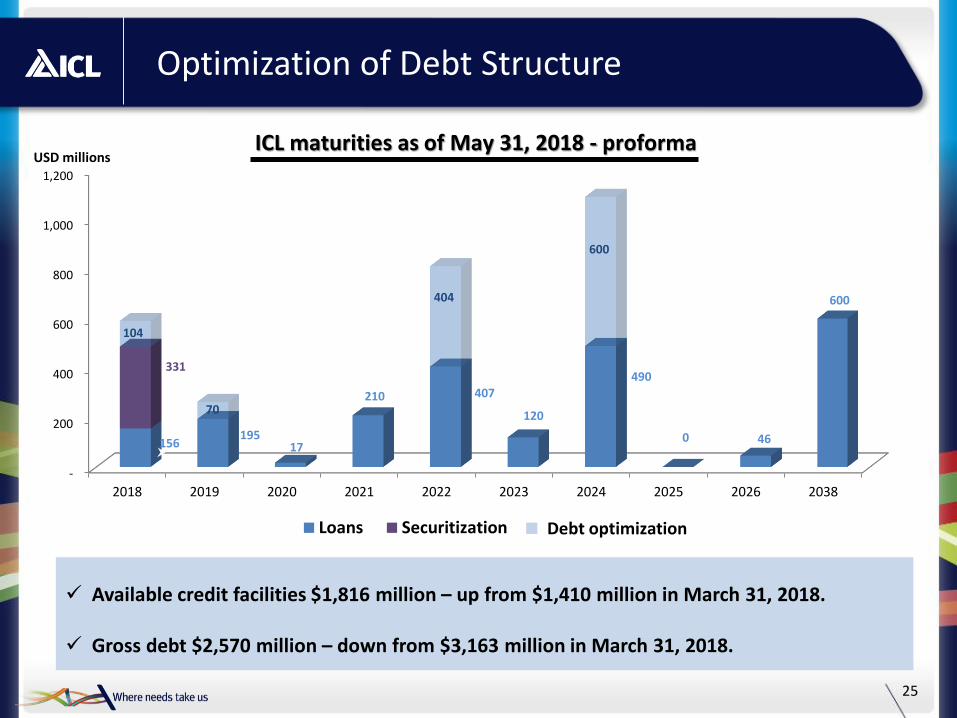
ICL maturities as of May 31, 2018 - proforma
Optimization of Debt Structure
25
✓ Available credit facilities $1,816 million – up from $1,410 million in March 31, 2018.
✓ Gross debt $2,570 million – down from $3,163 million in March 31, 2018.
USD millions
Debt optimization

Investing in Our Future and Creating Financial Flexibility
Net debt ($ million)
2016 2017 Q1 2018
Net Debt/EBITDA
$3,268$3,037
$2,269
3.12.9
2.3*
From Core
Minerals to
Specialties
Advanced
Crop
Nutrition
Support M&A and growth
Infrastructure development
and improvements
Capital allocation approach
Financial flexibility for future growth
From on-going operating cash flow generation
Maintain balance between LT value creation, investment grade rating
and shareholder’s return
26
* LTM EBITDA, excluding EBITDA contribution of divested businesses

Key Takeaways
Low Cost Dead Sea Production, Geographically
Advantaged Asset Base
Diversified Company, Integrated Along the Value
Chains
Prudent Capital Allocation Management
Focus on Core Minerals and Advanced Crop Nutrition
27

Thank You
Appendix

30
Our Businesses Are Positioned to Benefit from Growing Global Trends
Environmental Regulations & Sustainability
Ind
ust
rial
P
rod
uct
s
TrendRenewable
Energy & Energy storage
Electric / Smart Vehicles & Home
Automation
Growing Middle Class in Emerging
Markets
Ad
van
ced
A
dd
itiv
es
Foo
d
Spe
cial
tie
s
Limited Clean Water Supply
Food Security
Co
nve
nti
on
al
Fert
ilize
rs
Spe
cial
ty
Fert
ilize
rs

Effective Tax Rate
See Q1 2018 press release for a reconciliation of Adjusted operating income to operating income
31
$ million Q1 18 2017
Adjusted income before tax 137 528
Normalized tax rate (including resource tax) 23% 26%
Normalized tax expenses 32 136
Carryforward losses not recorded for tax purposes 3 19
35 151
26% 29%
Other items (mainly exchange rate impact) (2) 1
Adjusted income tax 33 156
Actual Effective tax rate 24% 30%
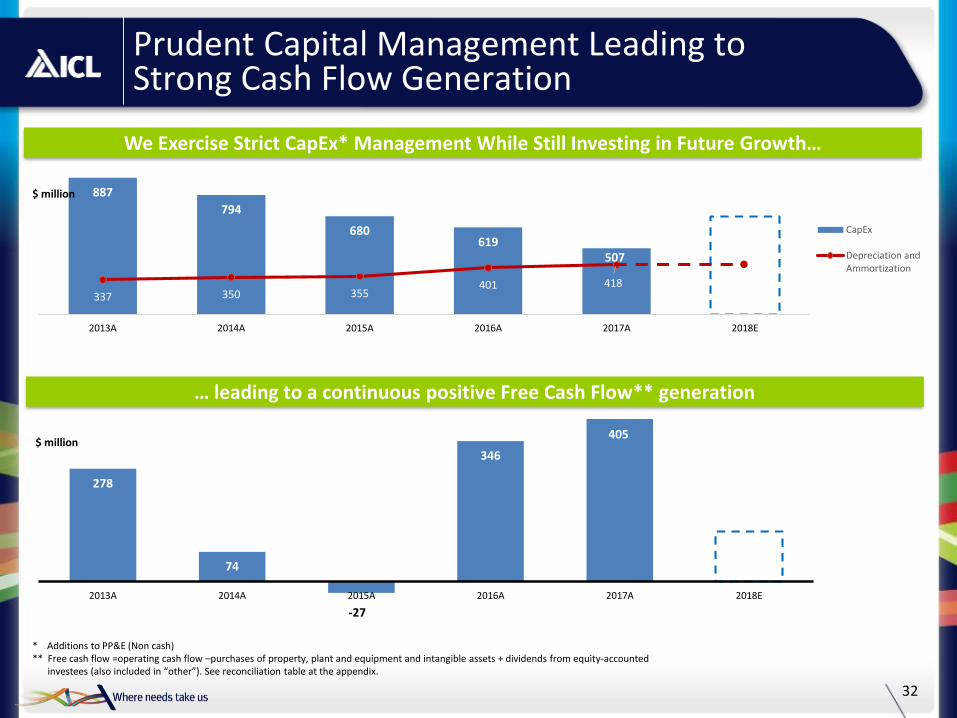
… leading to a continuous positive Free Cash Flow** generation
887
794
680619
507
337 350 355401 418
2013A 2014A 2015A 2016A 2017A 2018E
CapEx
Depreciation andAmmortization
Prudent Capital Management Leading to Strong Cash Flow Generation
We Exercise Strict CapEx* Management While Still Investing in Future Growth…
* Additions to PP&E (Non cash)** Free cash flow =operating cash flow –purchases of property, plant and equipment and intangible assets + dividends from equity-accounted
investees (also included in “other”). See reconciliation table at the appendix.
$ million
$ million
278
74
-27
346
2013A 2014A 2015A 2016A 2017A 2018E
405
32

405
150-200
~70
0-50
33
Strategic CAPEX Financed Through Operating Cash Flow
Investing in our future and creating financial flexibility to support growth
US$ million

Essential Minerals Segment

ICL Essential Minerals - Organizational Structure
35
Business Development
HR
Finance
Sales, Marketing& Logistics
Alon Gil
23 years in ICL
SpecialtyFertilizers
Eli Amon
26 years in ICL
Phosphate
Yakov Kahlon
22 years in ICL
Potash & Magnesium
Noam Goldstein
31 years in ICL
President, ICL Essential Minerals Segment
Ofer Lifshitz
21 years in ICL

ICL Essential Minerals Division
Agriculture
Potash PhosphateSpecialty Fertilizers
Commodity Semi-specialty Specialty
36

37
Growing
population
Dietary
shifts
Arable land
per capitaBiofuels
More grains
Increased yields
More fertilizers
More people want more…Demand for fertilizers is closely linked to the demand
for food and fuel crops
Global Fertilizer Demand
38
MeatConsumption
Population
Fertilizerconsumption
1.0
1.5
2.0
2.5
3.0
3.5
4.0
4.5
5.0
5.5
6.0
Ind
ex, r
elat
ive
to 1
96
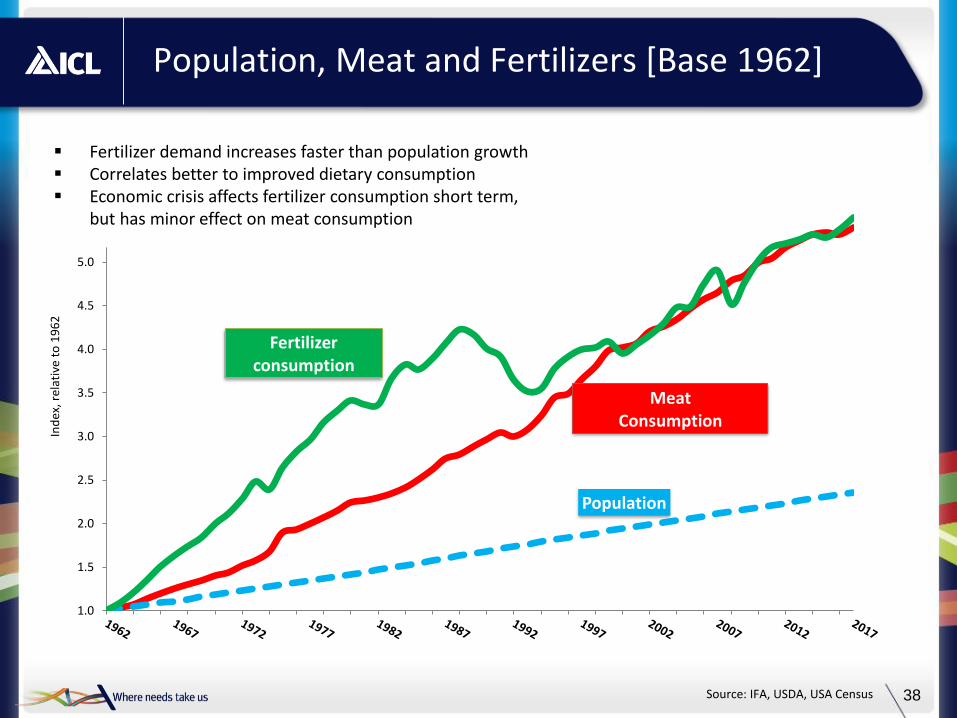
2Population, Meat and Fertilizers [Base 1962]
▪ Fertilizer demand increases faster than population growth ▪ Correlates better to improved dietary consumption▪ Economic crisis affects fertilizer consumption short term,
but has minor effect on meat consumption
Source: IFA, USDA, USA Census

39
Cereals 37%
Oilseeds 20%
Tot. Other43%
Wheat 6.2%
Rice 12.6%
Maize 14.9%
Other Cereals 3.7%
Soybean 9.0%Oil Palm
7.2%
Other Oilseeds 3.5%
Fibre Crops2.8%
Sugar Crops 7.7%
Roots/Tubers3.8%
Fruits6.6%
Vegetables10.0%
Oth Crops11.8%
Source: IFA- Assessment of Fertilizer Use by Crop at the Global Level
Total Fertilizer Use by Crop at Global Level
Cereals and OilseedsAccount for 62% ofFertilizer Consumption
40
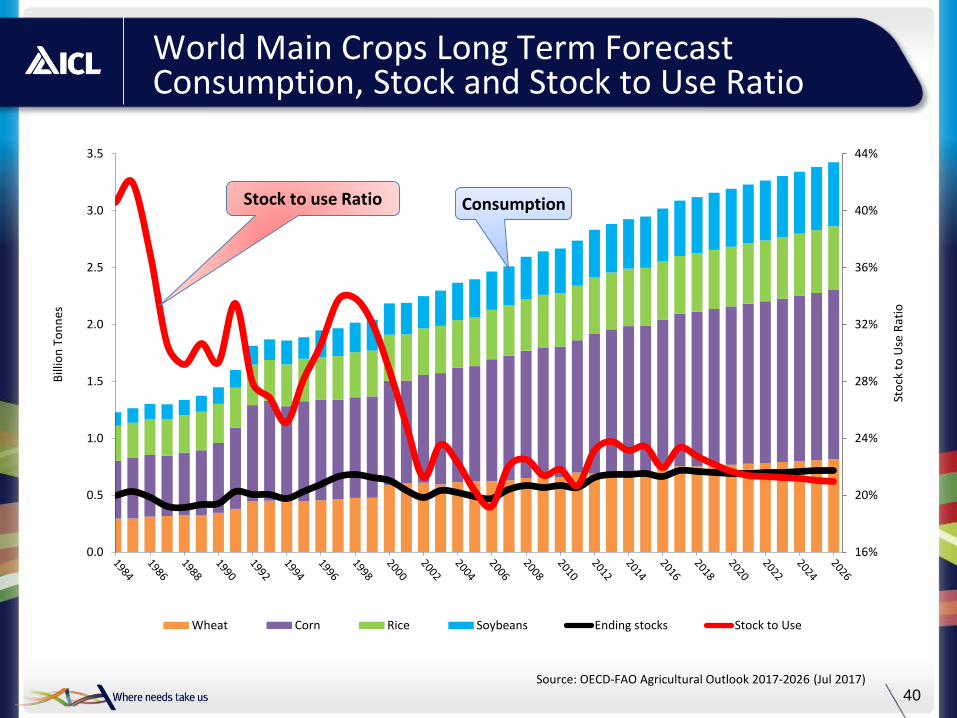
World Main Crops Long Term ForecastConsumption, Stock and Stock to Use Ratio
Source: OECD-FAO Agricultural Outlook 2017-2026 (Jul 2017)
16%
20%
24%
28%
32%
36%
40%
44%
0.0
0.5
1.0
1.5
2.0
2.5
3.0
3.5
Sto
ck t
o U
se R
atio
Bill
ion
To
nn
es
Wheat Corn Rice Soybeans Ending stocks Stock to Use
Stock to use Ratio Consumption

Global Fertilizer Consumption
4%
9%
Global market share
41
-
20
40
60
80
100
120
140
19
67/6
8
19
69/7
0
19
71/7
2
19
73/7
4
19
75/7
6
19
77/7
8
19
79/8
0
19
81/8
2
19
83/8
4
19
85/8
6
19
87/8
8
19
89/9
0
19
91/9
2
19
93/9
4
19
95/9
6
19
97/9
8
19
99/0
0
20
01/0
2
20
03/0
4
20
05/0
6
20
07/0
8
20
09/1
0
20
11/1
2
20
13/1
4
20
15/1
6
20
17/1
8
20
19/2
0
20
21/2
2
million m
tnutr
ient
Source: IFA – Medium Term Outlook for World Agriculture and Fertilizer Demand (May 2017)

35.7%
26.3%25.1%
31.6%
16.7%
19.8%
25.5%
22.6%
14%
16%
18%
20%
22%
24%
26%
28%
30%
32%
34%
36%
38%
0.5
0.6
0.7
0.8
0.9
1.0
1.1
1.2
1.3
1.4
1.5
1.6
1.7
1.8
1.9
2.0
2.1
2.2
2.3
2.4
2.5
2.6
2.7
19
60
/61
19
62
/63
19
64
/65
19
66
/67
19
68
/69
19
70
/71
19
72
/73
19
74
/75
19
76
/77
19
78
/79
19
80
/81
19
82
/83
19
84
/85
19
86
/87
19
88
/89
19
90
/91
19
92
/93
19
94
/95
19
96
/97
19
98
/99
20
00
/01
20
02
/03
20
04
/05
20
06
/07
20
08
/09
20
10
/11
20
12
/13
20
14
/15
20
16
/17
20
18
/19
ConsumptionProductionStockStock to Use
Sources: USDA, June 2018
World Grains Production & Consumption: Current Stock-to-use Ratio
42Grains and Pulses: Barley, Corn, Millet, Mixed Grain, Oats, Rice, Rye, Sorghum, Wheat
Billion Tonnes

43
Fertilizer Prices
Potash Prices
FOB Vancouver standard KCl
US$/t spotUS$/t spot
Average DAP FOB Tampa
Average GTSP, FOB North Africa
Phosphate Prices
* Source: Fertilizer Week
FOB NOLA granular KCl
0
100
200
300
400
500
600
700
200
250
300
350
400
450
500
550
600
650

23%
20%
12%
26%
18%
Canpotex Uralkali APC BPC ICL
26%
17%
22%
7%
12%
Russia Belarus Canada Jordan ICL
ICL’s Market Share in Fast Growing Markets
India Brazil China
3.8 Mt 8.8 Mt 6.8 Mt
Total Im
po
rt 20
16
29%
17%6%
22%
13%
Canpotex Uralkali SQM BPC ICL
44
4.5 Mt 9.2 Mt 7.5 Mt Total Im
po
rt 20
17
10%
25%
25%
16%
20%
4%
APC BPC Canpotex ICL Uralkali K+S
5%
20%
23%
9%
29%
14%
SQM BPC Uralkali K+S Canpotex ICL
20%
23%
31%
12%
9%5%
Uralkali BPC Canpotex ICL APC Others

Strategic Geographic AdvantageClear Service Advantage to Developed and Emerging Markets
Distance Destination (Days)
Country of Departure
Mine-to-Port (km) (1) China India Brazil
Israel ~200 23 11 22
UK ~30 34 22 20
Spain ~85 27 15 17
Germany ~350 34 23 20
Russia / Belarus ~600 39 27 25
Canada West Coast ~1,700 35 47 43
China
India
IL
Europe
Brazil
US
Short mine-to-port distances and proximity to emerging markets
1 Israel based on average from Dead Sea to Port of Eilat and Ashdod; Germany based on Werra to Port of Hamburg and Bremerhaven; Canada based on Saskatchewan to Port of Vancouver; Russia based on Starobin to Port of Klaipeda; Spain based on Cabanasas Mine to Port of Barcelona; UK based on Cleveland Potash, Saltburn-by-the-Sea to Teesport Commerce Park
2 Source: ICL estimates, Netpas
• Shorter mine-to-port distances and shorter shipping routes to emerging markets results in lower costs both for land and maritime transportation, as well as faster time to markets
45
46
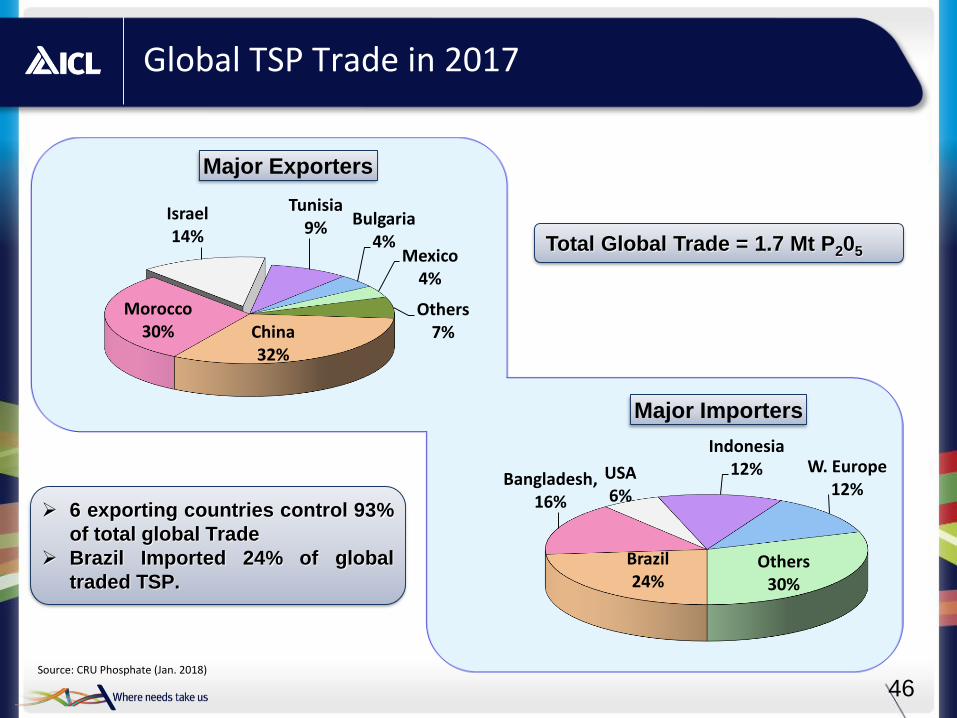
Global TSP Trade in 2017
China32%
Morocco30%
Israel14%
Tunisia9% Bulgaria
4%Mexico
4%
Others7%
Major Exporters
Brazil24%
Bangladesh, 16%
USA6%
Indonesia12% W. Europe
12%
Others30%
Major Importers
Total Global Trade = 1.7 Mt P205
Source: CRU Phosphate (Jan. 2018)
➢ 6 exporting countries control 93%
of total global Trade
➢ Brazil Imported 24% of global
traded TSP.

Phosphate Green Phosphoric Acid
SSP, TSP
Pure Phosphoric Acid
Food additives
Controlled & slow release fertilizers
Liquid & water soluble
fertilizers
Industrial phosphate Salts and acids
Phosphate - Operational Advantages
The operational advantages of Phosphate, starting
with the P2O5 value chain
Phosphate Specialty Fertilizers Specialty solutions47

Key Takeaways
P2O5 value chain in Israel and in China
Significant potash presence in emerging markets
Significant growth potential in semi-specialty and specialty fertilizers
Low production cost at the Dead Sea
Experienced management team
48
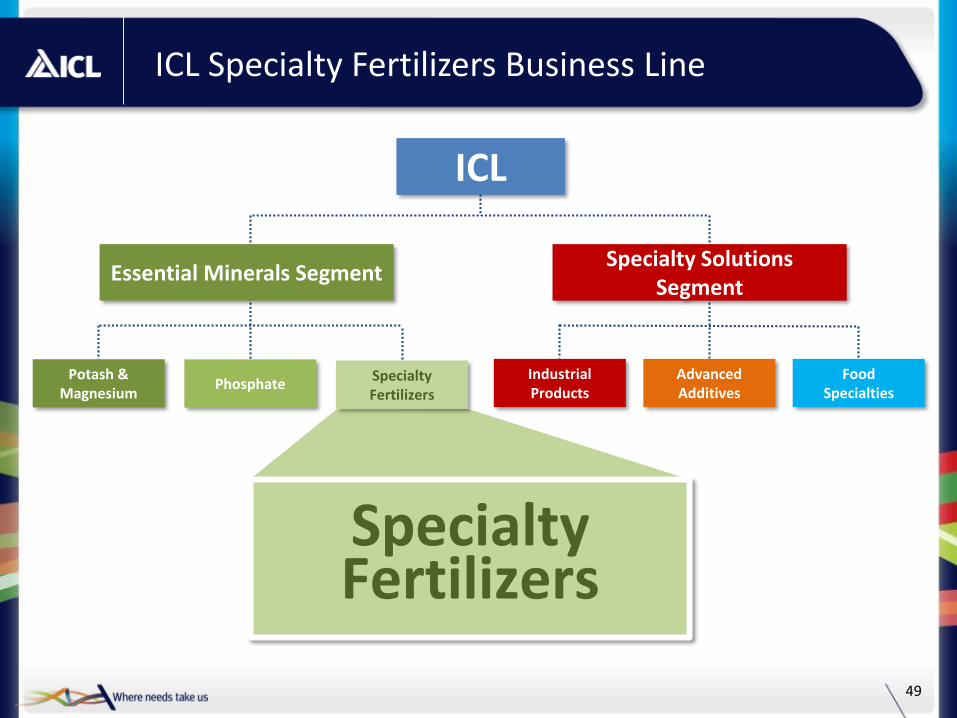
ICL Specialty Fertilizers Business Line
ICL
Essential Minerals SegmentSpecialty Solutions
Segment
Specialty Fertilizers
PhosphatePotash &
Magnesium Food
Specialties Advanced Additives
Industrial Products
Specialty Fertilizers
49

EMPLOYEES WORLDWIDE
~ 900
OPTIMAL PLANT NUTRITION: LESS IS MORE!
* FY2017** Before setoffs and eliminations.*** Before G&A expenses.
Foliar Fertilizer
Controlled Release Fertilizers
$692M$56M
SALES**
OPERATING INCOME***
FY2017 RESULTS
REVENUE BY MARKET SEGMENT*
Horticulture & Turf
28%
Chemicals & other
10%Specialty Ag.
62%
ICL Specialty Fertilizers Profile
50
47%
25%
17%
11%Europe
Americas
ASIAPAC
MEAI
REVENUE BY GEOGRAPHIES*
Fertigation/ Soluble Fertilizers
51
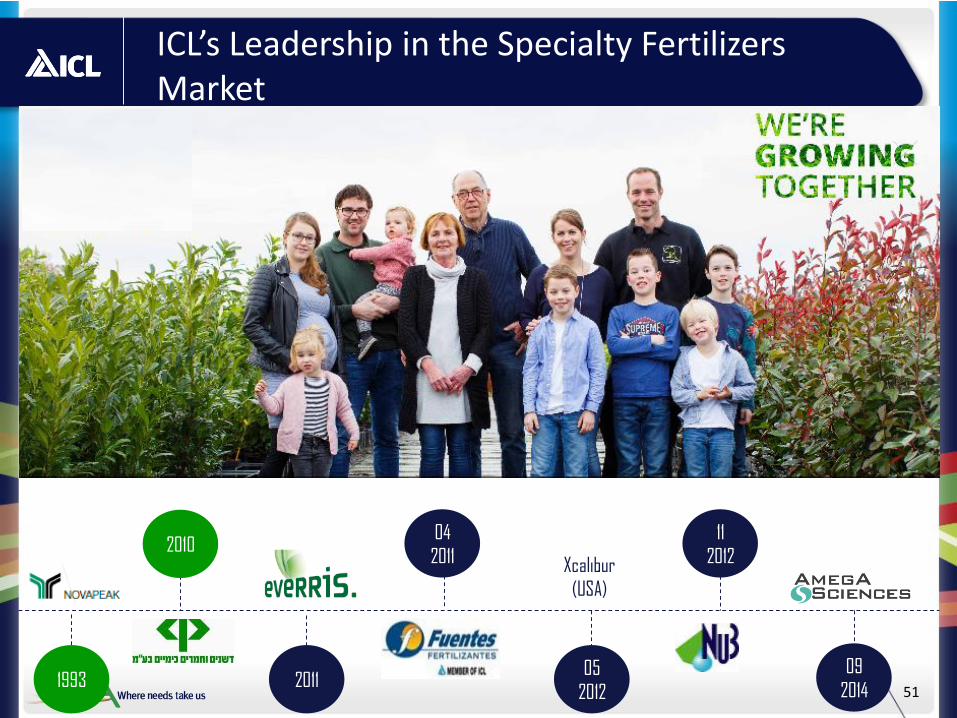
ICL’s Leadership in the Specialty Fertilizers Market
2010
2011
04
2011
05
2012
Xcalibur
(USA)
11
2012
09
20141993

52
Global Players by Product Categories
Coated Fertilizers Solubles / Straights Liquids
SRF CRFSoluble
NPK
MAP/
MKPSOP/CN NOP
Bulk
Liquids
Foliar
Liquids
ICL-SF ^ ^ ^ ^ ^ ^
Compo ^ ^ ^ ^
Haifa Chemicals ^ ^ ^ ^
YARA ^ ^ ^
SQM ^ ^ ^ ^
Kingenta ^ ^ ^ ^
Haifa SQM YARA KingentaCompoICL-SF

ICL Specialty Fertilizers: Our Strengths
▪ Leader in Key Markets
▪ Access to P and K resources, unique access to Polysulphate
▪ Wide Portfolio with well established brands & unique products
▪ Profound agronomic knowledge & strong professional sales force
▪ Advanced P and K chemistry
▪ Advanced and flexible manufacturing technologies
▪ Efficient Supply Chain
▪ Leveraging on supporting global trends
53
54
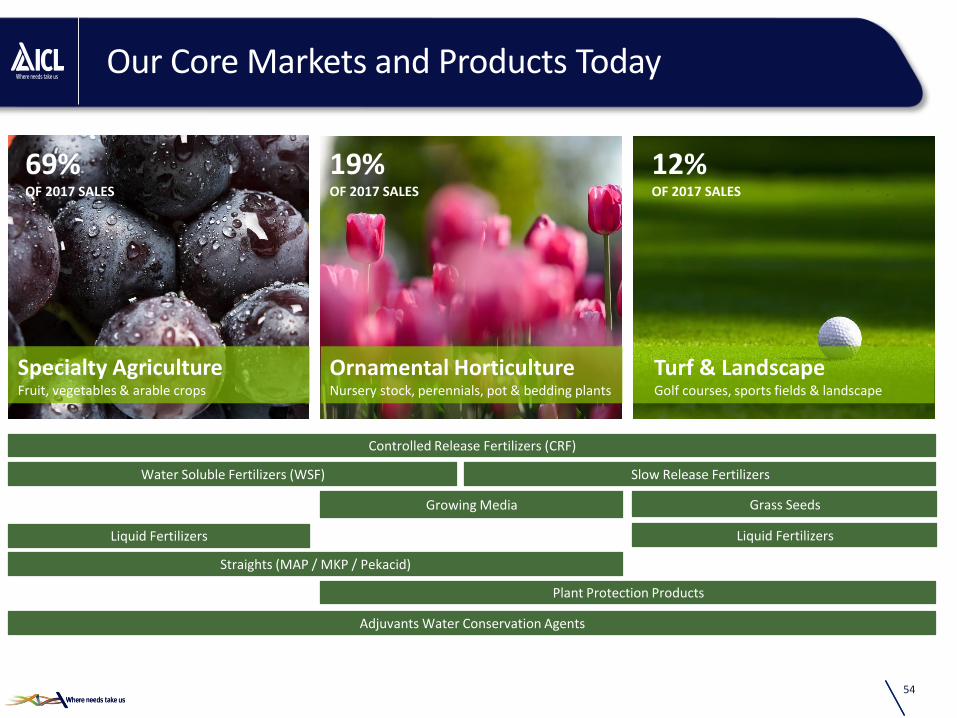
Our Core Markets and Products Today
Turf & LandscapeGolf courses, sports fields & landscape
Liquid Fertilizers
Growing Media Grass Seeds
Water Soluble Fertilizers (WSF)
Controlled Release Fertilizers (CRF)
Straights (MAP / MKP / Pekacid)
Plant Protection Products
Adjuvants Water Conservation Agents
Liquid Fertilizers
Slow Release Fertilizers
Specialty AgricultureFruit, vegetables & arable crops
Turf & LandscapeGolf courses, sports fields & landscape
Ornamental HorticultureNursery stock, perennials, pot & bedding plants
69%OF 2017 SALES
19%OF 2017 SALES
12%OF 2017 SALES

55
Our Core Markets and Products / Turf
Most stadiums of “La Liga” use ICL products (fertilizers& seeds)
Camp Nou

56
Our Core Markets and Products / Turf
Wimbledon
57
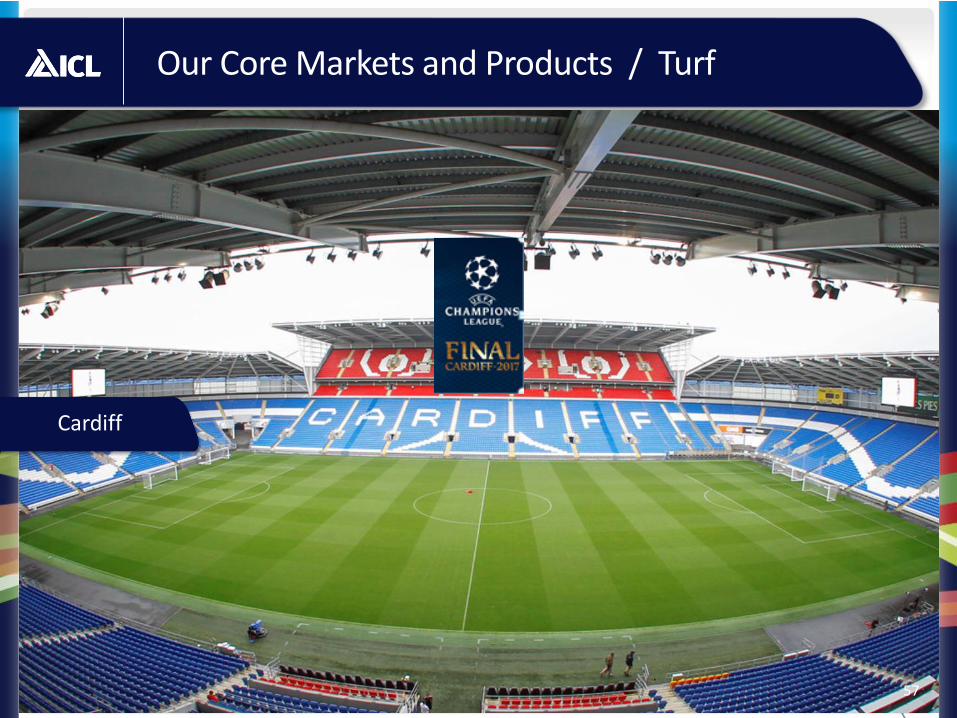
Our Core Markets and Products / Turf
Cardiff
57

58
Specialty Fertilizers and Bio Solutions Became An Important Part of the Ag Input market
Others, 32%
Traditional Fertilizers,63%
Specialty Fertilizers3.5%
~$150bn
Nontraditional application of nutrients (i.e. Soluble, Liquids and Coated)
Advanced bio solutions for plant nutrient and protection
Bio Solutions1.5%
Micro Nutrients1%
Nutrients consumed in small quantities2
N,P,K and Secondary
nutrients1
1 Calcium, Magnesium and Sulfate2 iron, cobalt, chromium, copper, iodine, manganese, selenium, zinc and molybdenum
Specialty Fertilizers market / ~$9bn

Global Trends Driving Shift Towards Specialty Fertilizers
Population growth, urbanization &
reduction in arable land per capita
Regulatory Pressure
ChangingFood Chain
Environmental Trends
New Grower Practices
59
60
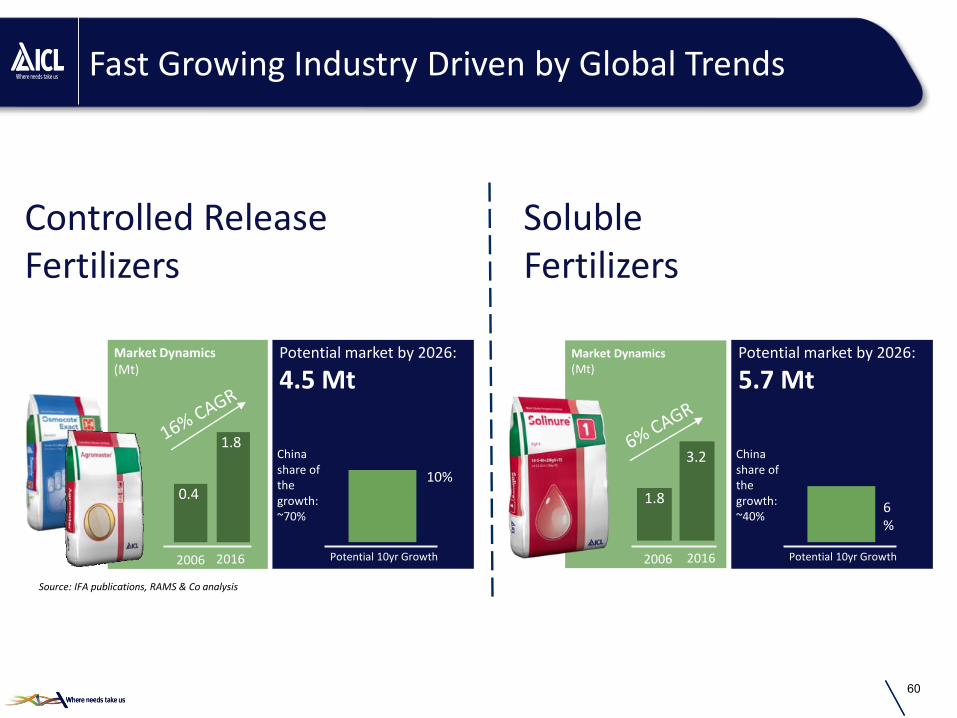
Fast Growing Industry Driven by Global Trends
Controlled Release Fertilizers
SolubleFertilizers
Market Dynamics(Mt)
1.8
3.2
Market Dynamics(Mt)
0.4
1.8
2006 2016 Potential 10yr Growth
Potential market by 2026:
4.5 Mt
10%
China share of the growth: ~70%
2006 2016 Potential 10yr Growth
Potential market by 2026:
5.7 Mt
6%
China share of the growth: ~40%
Source: IFA publications, RAMS & Co analysis

ICL’s Main Growth Drivers in Specialty Agriculture –
Reduce cost of production
Expand Product Portfolio
Establish production in attractive
markets
New cost efficient coating generation
New production plants with focus on emerging markets
Grow with R&D and new Strategic
Partners
61

Leveraging Precision Ag to Grow sales
Digitization of Farms -Sensing, Analytics and Connectivity
Solutions
Prediction Models:•Pest Out•Water Stress•Yield
Weather•Sensing•Prediction
Crop Soil Sensors•Moisture•pH•Temperature
Aerial Imagery•Drones•Satellites
Equipment•Autonomous•Task Assist or
Replacement
Software Platforms•ERP•Farm
Management•Agronomy
Digital Ag:Reduce
Inputs & Increase Yield
a
Big data insights
New productsNew customers
More sales
62

Digital Package to Enhance Sales
Mobile App
Remote sensing of nutrient deficiencies
Data analytics used to offer tailored
products
In-soil temperature
sensor
Integration of data to an
Ag platform
Prescription tool: what fertilizer to
apply when?
63

64
Key Takeaways
ICL Specialty FertilizersAn attractive investment opportunity
Fast Growing Industry Driven by Global
TrendsLeader in Key Markets
Well Positioned for Growth with Wide
Portfolio
Efficient Supply Chain,Strong Professional
Sales ForceEstablished Brands
End User Inspired Innovation, Leveraging
on Precision Ag

Specialty Solutions Segment
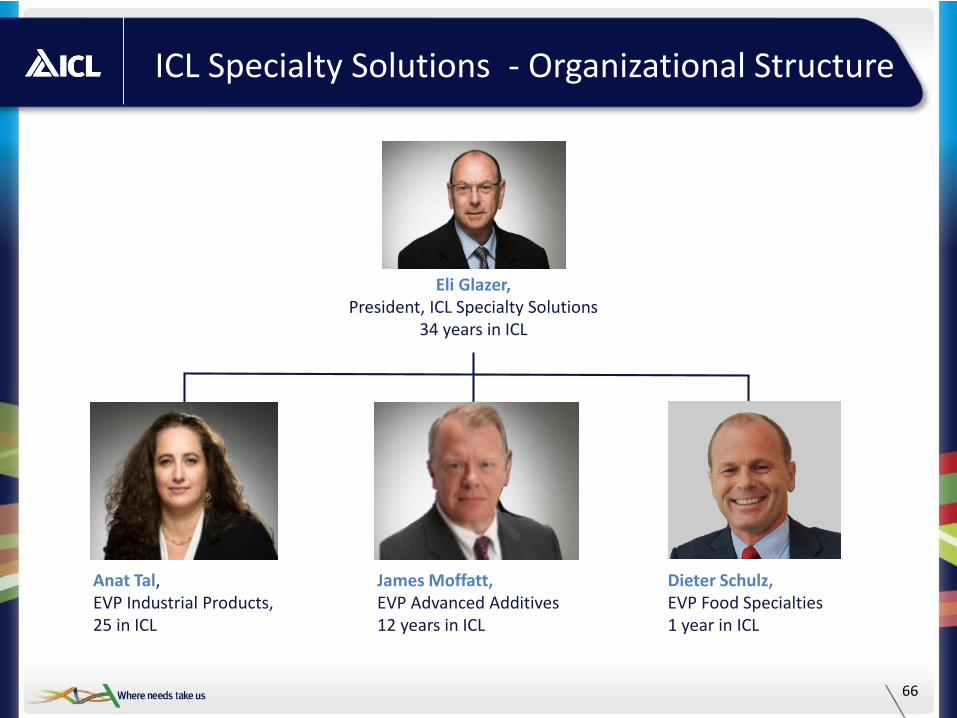
ICL Specialty Solutions - Organizational Structure
66
Anat Tal,EVP Industrial Products,25 in ICL
James Moffatt, EVP Advanced Additives12 years in ICL
Dieter Schulz, EVP Food Specialties1 year in ICL
Eli Glazer, President, ICL Specialty Solutions
34 years in ICL

1,2511,034 1,120 1,193
457555 553 568
526 613659 596
FY 2014 FY 2015 FY 2016 FY 2017
Industrial products Advanced additives Food specialties
Specialty Business Provide Balance
67
Specialty Solutions Sales*** ($M)
Segment Operating Income ($M)** & ***
Adjusted to organizational structure as of Q1 2017 * Total prior to elimination of inter-business lines’ sales**Excluding G&A, unallocated expenses and eliminations*** Proforma adjusted for divestment of fire safety and P2S5 businesses
2,202* 2,332*2,234* 2,357*
371
451
534 554
FY 2014 FY 2015 FY 2016 FY 2017

68
$1.2Bn 2017 SALES*
$303M 2017 OPERATING INCOME**
~1,600EMPLOYEES WORLDWIDE
Industrial Products: Impressive Performance Driven by Value Based Strategy and Cost Reduction
Note: Sales and operating income according to Organizational Structure as of Q1 2017. All numbers are rounded.* Before setoffs and inter-segment eliminations.** Before G&A expenses.
20% CAGR IN OPERATING INCOME
200 225286 303
16%
22%26% 25%
0%
5%
10%
15%
20%
25%
30%
50
100
150
200
250
300
350
2014 2015 2016 2017
Operating income Operating income margin
Flame Retardants
41%
Brominated organic
intermediates & Industrial
34%
Clear brine fluids
15%
Biocides7%
Mercury Control
4%
2017 BROMINE DEMAND BY INDUSTRYMARKET UTILIZATION RATES: 70-80%
FINANCIAL RESULTS

ICL-IP Product Supply Chains
69* RM sourced from 3rd parties
Specialty
Minerals
plants:Israel
France*
Bromine compounds plants:
IsraelNetherlands
China
Phosphorus compounds plants:
GermanyUSA
MgClSaltsKCl
Purchased
Customers
Produced
ICL-IP Market Leadership
in Flame Retardants
in Bromine capacity
in Bromine compounds plant
in Bromine Iso-tank fleet
in Brominated biocides
in Phosphorus FRs
in Clear Brine Fluids
in Self-extinguishing Hydraulic fluids
in Solid MgCl
in Magnesia for Nutraceutical market70

Global Trends and Major End Markets
PopulationRegulation & EnvironmentalStandard of living
FURNITURE & TEXTILETRANSPORTATION
WATER TREATMENT
CONSTRUCTION
INTERMEDIATES FOR FOOD,
PHARMA, AGRO and Other OIL & GAS
POWER PLANTS
ELECTRONICS
71

Regulation
New target 1-7Yet to
follow 1.3
Existing 1-30 30
Major Trends and ICL Solutions
72
Trends
Clean AirMercury Emissions Control
MERQUEL®
ICL’s Solutions
Comparison of Hg Emission limits (µgr/m3)

73
Renewable energy Energy storage
Electrolytes for Bromine Flow battery
Trends ICL’s Solutions
Major Trends and ICL Solutions

74
Trends ICL’s Solutions
Electric car/ Autonomous car
New generation polymeric FRs
Major Trends and ICL Solutions

75
Trends ICL’s Solutions
Major Trends and ICL Solutions
Home automation New generation polymeric FRs

76
Trends ICL’s Solutions
Water shortage and treatment
New Biocides
Major Trends and ICL Solutions

Live
77

Note: Sales and operating income according to Organizational Structure as of Q1 2017.All numbers are rounded.(1) Before G&A expenses.(2) Proforma results adjusted for divestments of fire safety and P2S5 businesses
SALES DISTRIBUTIONS 2017
78
$568M 2017 SALES(2)
$85M 2017 OPERATING INCOME(1)
~900
EMPLOYEES WORLDWIDE
KEY ADVANTAGES
• Full phosphate chain from rock
to salts
• Largest global footprint in
specialty phosphates
GROWTH STRATEGY
Advanced Additives Benefits from Vast Global Footprint and Backward Integration
Phosphate Acids59%
Industrial phosphates
38%
P44%
• Geographic Expansion
• Product Differentiation
• Cost optimization /
“Lean & Reliable”
• Support growth through opportunistic M&A
FINANCIAL RESULTS

We Have Built a World-Class Advanced Additives Portfolio
79
Phosphate Salts and Acids Paints and Coatings
Description • Technical Phosphates & Related Specialties; food and technical grade Phosphoric Acids
• Specialty phosphates and blends, selected organic chemistry
Key Applications • Metal treatment, water treatment, cleaners, oral care, cola drinks, asphalt modification, others
• Corrosion Inhibition, Flash Rust Inhibitors, Tannic Stain Inhibitors
Example Customers & Distributors
• P&G, Henkel, Colgate, Coca-Cola, Pepsi, Chemetall
• Univar, Brenntag
• Sherwin Williams, Behr Paint
• Specialty Distributors based on mutual exclusivity

• High-growth new applications in Meat and Dairy
• Expand portfolio through tailored solutions
• Increase footprint in growing emerging markets
• Support growth through opportunistic M&A
Food Specialties Growth Driven by Global and Portfolio Expansion, Supported by Market Trends
80
2017 BUSINESS LINE BREAKDOWN
$596M2017 SALES(1)
$51M2017 OPERATING INCOME(2)
~850EMPLOYEES WORLDWIDE
(1) Before setoffs and inter-segment eliminations.(2) Before G&A expenses.All numbers are rounded.
MARKET TRENDS
• Growing middle class in emerging markets
• Demand for longer shelf- life
• “On the go”
• Health and Nutrition(gluten free, reduced salt, etc)
GROWTH STRATEGY
GLOBAL SALES FOOTPRINT*
Spices
6%
Dairy Proteins
25%Food
Phosphates, Blends,
Multi-blends
69%

Description • $200M in 2016 sales
• Providing solutions for modifying texture and stability of food products, including meat substitutes
• $280M in 2016 sales
• Produces milk and whey proteins for food ingredients
• Provides integrated solutions based on dairy proteins and phosphate additives
• $180M in 2016 sales
• ICL leavening acids impact the appearance, texture and volume of bakery products
Key Applications • Continued development of applications for low-sodium salts (SALONA™) from the Dead Sea
• Development of new products based on milk proteins
• Novel product applications by exploiting synergies betweenfood phosphates, proteins, starches and fibers
Recent Acquisitions • In 2014, completed acquisition of the HagesudGroup, a German producer of premium spice blends and food additives for meat processing
• In 2015, completed acquisition of ProlactalGmbH, a leading European producer of dairy proteins
Key Customers
Vast Product Portfolio Serving a Variety of End Markets
81
Meat, Poultry and Seafood:
Dairy and Dairy Protein: Bakery and Other:
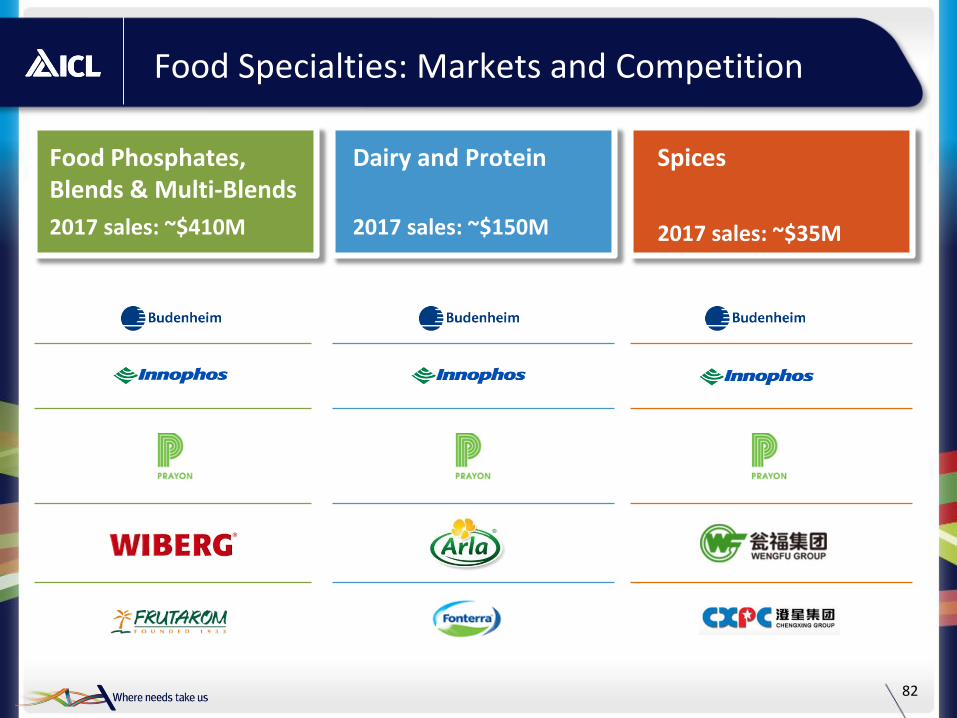
Food Specialties: Markets and Competition
82
Food Phosphates, Blends & Multi-Blends
2017 sales: ~$410M
Dairy and Protein
2017 sales: ~$150M
Spices
2017 sales: ~$35M

Main Takeaways for Specialty Solutions Division
83
Backward integration to Bromine and Phosphate
The only Global player with worldwide presence
Innovation capabilities
Growing sales and margins despite competitive market environment
Clear, proven, value based strategy

Thank You