ppl corporation 2020 eei-aga esg/sustainability report
TRANSCRIPT
PPL Corporation 2020 EEI-AGA ESG/Sustainability Report
PPL Corporation EEI-AGA ESG/Sustainability Report
2
Qualitative SectionPPL Corporation and the PPL family of companies power the lives and businesses of more than 2.5 million customers in the United States.
With fully regulated, high-performing utilities in constructive regulatory jurisdictions, the company is well positioned for continued success and earnings and dividend growth potential.
Our companies are addressing challenges head on, building a smarter, more reliable, more resilient grid and advancing a cleaner energy future.
The qualitative and quantitative data in this report primarily reflects the 2020 calendar year, with 2021 noted.
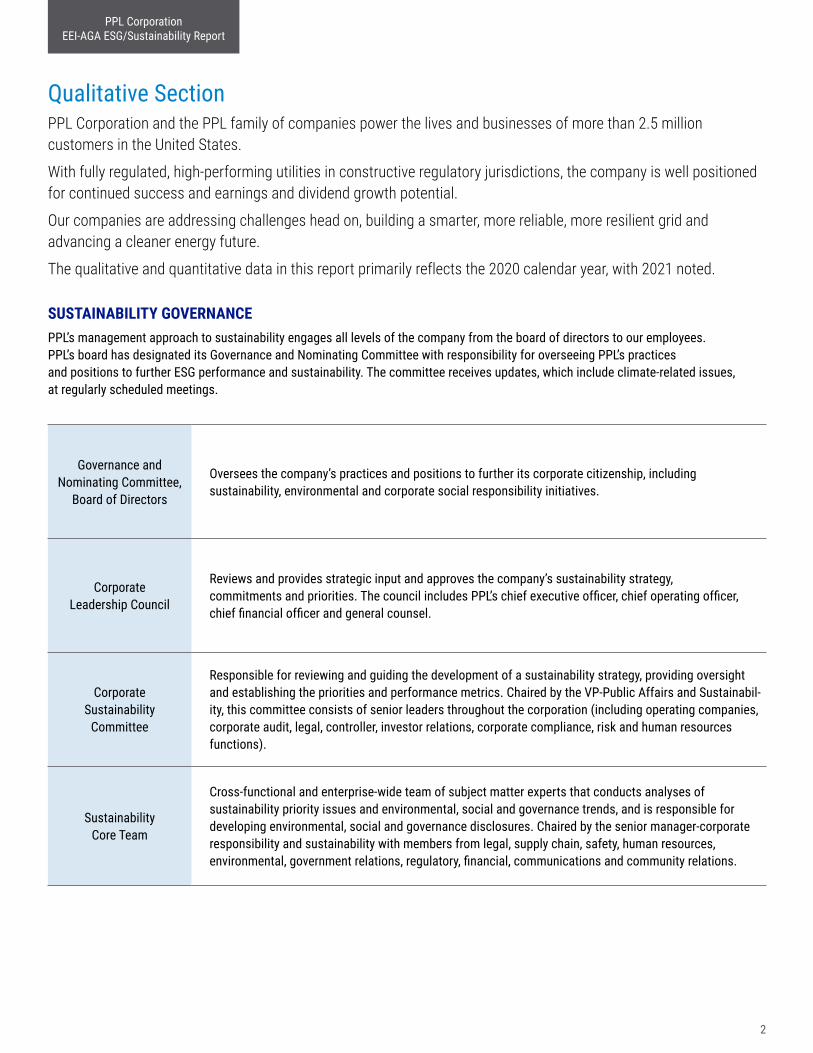
SUSTAINABILITY GOVERNANCE PPL’s management approach to sustainability engages all levels of the company from the board of directors to our employees. PPL’s board has designated its Governance and Nominating Committee with responsibility for overseeing PPL’s practices and positions to further ESG performance and sustainability. The committee receives updates, which include climate-related issues, at regularly scheduled meetings.
Governance and Nominating Committee,
Board of Directors
Oversees the company’s practices and positions to further its corporate citizenship, including sustainability, environmental and corporate social responsibility initiatives.
Corporate Leadership Council
Reviews and provides strategic input and approves the company’s sustainability strategy, commitments and priorities. The council includes PPL’s chief executive officer, chief operating officer, chief financial officer and general counsel.
Corporate Sustainability
Committee
Responsible for reviewing and guiding the development of a sustainability strategy, providing oversight and establishing the priorities and performance metrics. Chaired by the VP-Public Affairs and Sustainabil-ity, this committee consists of senior leaders throughout the corporation (including operating companies, corporate audit, legal, controller, investor relations, corporate compliance, risk and human resources functions).
Sustainability Core Team
Cross-functional and enterprise-wide team of subject matter experts that conducts analyses of sustainability priority issues and environmental, social and governance trends, and is responsible for developing environmental, social and governance disclosures. Chaired by the senior manager-corporate responsibility and sustainability with members from legal, supply chain, safety, human resources, environmental, government relations, regulatory, financial, communications and community relations.
PPL Corporation EEI-AGA ESG/Sustainability Report
SUSTAINABILITY STRATEGYOur sustainability commitments provide a framework for PPL to grow and innovate in a responsible, reliable way that benefits customers, shareowners, employees and society as a whole. We support investments in smarter, more resilient power grids and advancements in research and development for more sustainable generation.
PPL supports the clean energy transition and is investing in smarter, more resilient power grids and advancements in R&D for more sustainable generation.
Environment and Climate Action We are assessing our clean energy transition strategy to enhance the company’s long-term strategic roadmap and identify actions to advance clean energy opportunities that continue to deliver reliable and affordable energy. We are currently developing an integrated resource plan for our operating company in Kentucky as well as updating our enterprise-wide climate assessment plan, which will be issued in the fall of 2021.
As we transition to a cleaner energy future, our strategy includes:
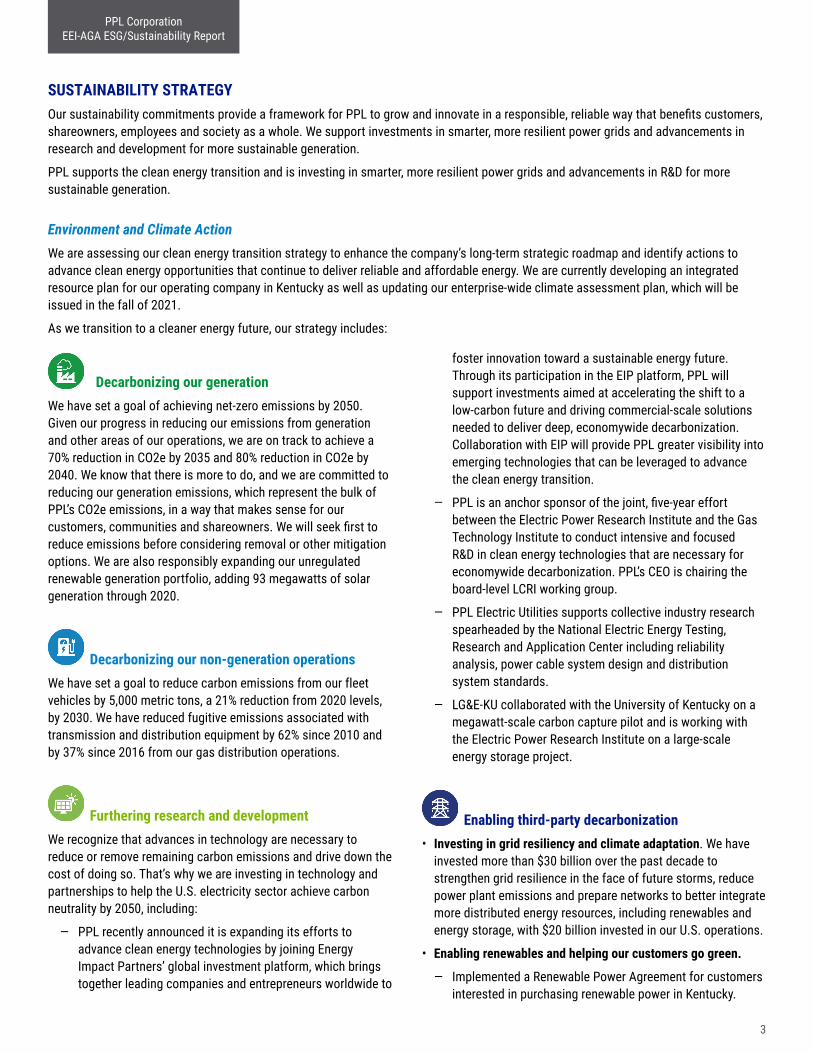
Decarbonizing our generationWe have set a goal of achieving net-zero emissions by 2050. Given our progress in reducing our emissions from generation and other areas of our operations, we are on track to achieve a 70% reduction in CO2e by 2035 and 80% reduction in CO2e by 2040. We know that there is more to do, and we are committed to reducing our generation emissions, which represent the bulk of PPL’s CO2e emissions, in a way that makes sense for our customers, communities and shareowners. We will seek first to reduce emissions before considering removal or other mitigation options. We are also responsibly expanding our unregulated renewable generation portfolio, adding 93 megawatts of solar generation through 2020.
Decarbonizing our non-generation operations
We have set a goal to reduce carbon emissions from our fleet vehicles by 5,000 metric tons, a 21% reduction from 2020 levels, by 2030. We have reduced fugitive emissions associated with transmission and distribution equipment by 62% since 2010 and by 37% since 2016 from our gas distribution operations.
Furthering research and development
We recognize that advances in technology are necessary to reduce or remove remaining carbon emissions and drive down the cost of doing so. That’s why we are investing in technology and partnerships to help the U.S. electricity sector achieve carbon neutrality by 2050, including:
— PPL recently announced it is expanding its efforts to advance clean energy technologies by joining Energy Impact Partners’ global investment platform, which brings together leading companies and entrepreneurs worldwide to
foster innovation toward a sustainable energy future. Through its participation in the EIP platform, PPL will support investments aimed at accelerating the shift to a low-carbon future and driving commercial-scale solutions needed to deliver deep, economywide decarbonization. Collaboration with EIP will provide PPL greater visibility into emerging technologies that can be leveraged to advance the clean energy transition.
— PPL is an anchor sponsor of the joint, five-year effort between the Electric Power Research Institute and the Gas Technology Institute to conduct intensive and focused R&D in clean energy technologies that are necessary for economywide decarbonization. PPL’s CEO is chairing the board-level LCRI working group.
— PPL Electric Utilities supports collective industry research spearheaded by the National Electric Energy Testing, Research and Application Center including reliability analysis, power cable system design and distribution system standards.
— LG&E-KU collaborated with the University of Kentucky on a megawatt-scale carbon capture pilot and is working with the Electric Power Research Institute on a large-scale energy storage project.
Enabling third-party decarbonization
• Investing in grid resiliency and climate adaptation. We have invested more than $30 billion over the past decade to strengthen grid resilience in the face of future storms, reduce power plant emissions and prepare networks to better integrate more distributed energy resources, including renewables and energy storage, with $20 billion invested in our U.S. operations.
• Enabling renewables and helping our customers go green.
— Implemented a Renewable Power Agreement for customers interested in purchasing renewable power in Kentucky.
3
PPL Corporation EEI-AGA ESG/Sustainability Report
Through the agreement, LG&E and KU partners with customers to build and provide renewable energy resources. Toyota Motor Manufacturing, which operates the world’s largest Toyota manufacturing facility in Kentucky, and Dow Silicones Corporation are the first companies to partner with LG&E and KU. Toyota and Dow have made a 20-year commitment to purchase solar power that will be procured by LG&E and KU from a planned 100-megawatt solar facility in the state. LG&E and KU have committed to purchasing all output from the planned facility for use in serving customers.
— Launched an innovative Distributed Energy Resource Management System in Pennsylvania to enable more distributed energy resources, like solar power and energy storage, to connect reliably to the grid.
— Made it easier for customers in Pennsylvania to apply to connect solar panels and other generation systems to the
grid through a user-friendly Renewable Energy Connection website. Through 2020, the website supported the connection of more than 235.5 megawatts of renewable energy to the grid.
— Invested in development of commercial-scale solar projects through Safari Energy. With projects generating approximately 618,942 megawatt hours of electricity, the company has helped clients avoid the equivalent of more than 438,000 metric tons of CO2, equal to nearly 484 million pounds of coal burned.1
— Provided $18.1 million in energy efficiency rebates to customers, collectively saving more than 307 million kilowatt-hours of electricity, the equivalent of more than 26,000 homes’ energy use for one year1, and reducing peak demand by more than 142 megawatts.
— Conduct community tree planting programs, which resulted in the sequestration of 690 metric tons of CO2.
41 EPA GHG Equivalencies Calculator
Social responsibilityPPL’s ESG commitments related to social responsibility include exceeding customer expectations, fostering an exceptional workplace and strengthening the communities we serve. Achievements in 2020 included:
• Supporting diverse businesses – those owned by minorities, women and veterans (covering tier 1 and 2 suppliers). In 2020, the company spent $274 million with diverse businesses. Additionally, 53% of goods and services are procured from locally based suppliers, providing economic development support to communities in our jurisdiction.
• Strengthening communities with charitable funding of more than $10 million in the U.S. and partnering with our communi-ties for economic development, disaster readiness and emergency preparedness.
• Keeping energy rates affordable for customers. PPL Electric customers’ costs are below the average of the mid-Atlantic region (18 companies in New Jersey, New York and Pennsylvania). LG&E and KU’s average electricity rates rank among the lowest in the U.S., according to the Energy Information Administration. The company’s goal is to continue to reduce operating and maintenance expenses to further benefit customers.
• Contributing more than $3 million to various customer assistance programs to help vulnerable residential customers pay their energy bills, including contributions for COVID-19 relief.
• Being recognized for outstanding 2020 performance in several areas including being ranked as one of the best places to work for people with disabilities on the Disability Equality Index and receiving a perfect score of 100 on the Human Rights Campaign Foundation’s Corporate Equality Index for its Pennsylvania operations.
Diversity, equity and inclusion
PPL is committed to providing vital energy services to the diverse communities we serve. We view diversity, equity and inclusion as a strategic imperative that enhances our customer insight and fuels innovation and growth. To ensure we can make a long-lasting impact in our workplaces and communities, we have developed five commitments to advance diversity, equity and inclusion:
• Attract, develop and retain a high-performing, diverse workforce.
• Increase diverse representation in leadership roles, with a focus on females and minorities.
• Maintain a workplace culture of equity and inclusion.
• Foster partnerships that support the growth and vitality of the diverse communities and customers we serve.
• Develop and sustain relationships with diverse suppliers, vendors and service providers.
Each operating company is committed to advancing these common commitments with embedded diversity, equity and inclusion managers overseeing the effort and monitoring progress.
PPL Corporation EEI-AGA ESG/Sustainability Report
5
Governance and management Enterprise risk management
PPL maintains a robust enterprise risk management process that provides a business portfolio view of material risks that may impact achievement of PPL’s business strategy. As part of the enterprise risk management process, representatives from PPL’s operating companies and service groups identify, assess, monitor and report on ongoing and emerging risks, including climate- related and broader environmental, social and governance risks. The company’s Risk Management group oversees this process and reports quarterly to the Audit Committee.
Cybersecurity PPL takes an enterprise-wide, risk-based approach to cybersecu-rity to address and mitigate today’s security threats, while remaining vigilant on emerging threats.
PPL continually invests in security strategies and practices from industry-accepted security control frameworks. Our cybersecurity strategy is aligned with and informed by the following:
• Current and emerging cybersecurity threats
• National Institute of Standards and Technology Cybersecurity Framework
• Industry threat intelligence sharing in multiple forums and groups, including:
— Electricity Information Sharing and Analysis Center
— Cybersecurity Risk Information Sharing Program
— Edison Electric Institute’s cybersecurity, physical security and resiliency efforts
— Electricity Sub-Sector Coordinating Council
• Federal Energy Regulatory Commission
• North American Electric Reliability Corporation, including mandatory industry standards such as NERC Critical Infrastructure Protection
The management of cybersecurity risks is integrated into our Enterprise Risk Management (ERM) process. The PPL Corporate Security Council, which includes senior leaders throughout the corporation (including PPL’s chief financial officer, chief human resources officer, general counsel, vice president-corporate audit, global chief compliance officer, operating company presidents and chief information officers), oversees and governs actions to ensure that PPL is effectively managing cybersecurity risks by conducting regular reviews of the overall enterprise cybersecurity strategy, posture and risks. The council is chaired by the vice president and chief information security officer. In addition, the full board of directors receives periodic updates of cyber-related matters.
For more details about how PPL ensures the physical and cyber security of the grid, please see page 17 of the 2020 Corporate Sustainability Report.
Public policy engagement
PPL actively encourages public policy that furthers our ability to safely provide reliable and affordable electricity to our customers and supports our growth and innovation in ways that benefit our company and our stakeholders. Our active participation in the public policy arena helps to ensure that public officials are kept informed of key issues that affect the interests of our stakeholders.
PPL’s Public Affairs department is in regular communication with executive leadership and provides an annual report to the board on key issues and advocacy positions. Additionally, on an annual basis, the board receives a report of corporate political contributions.
Details regarding PPL’s approach to public policy engagement, including compliance, trade association membership, political action committees and contributions to certain tax-exempt organizations, are available online on the company’s website.
The company’s transparent reporting has earned a trendsetter ranking by the CPA-Zicklin Index, which benchmarks the political disclosure and accountability policies and practices of leading U.S. public companies.
Management and Oversight of Natural Gas Operations
Louisville Gas & Electric (LG&E) is engaged in the distribution and sale of natural gas, serving more than 300,000 natural gas customers in Kentucky.
LG&E leadership has overall responsibility for the oversight of natural gas operations. The company’s Natural Gas Pipeline Safety Compliance Program Steering Committee provides enhanced oversight for compliance with state, local and federal gas operations and pipeline safety regulations. LG&E also has a Pipeline Safety Management Systems program, with the objective of implementing key practices recommended by the American Petroleum Institute. LG&E maintains integrity management plans, including those for transmission, distribution, and storage.
The system is made up of approximately 4,300 miles of natural gas distribution lines and nearly 400 miles of natural gas transmission lines; compressor stations that move the gas through the system to customers; and natural gas storage fields that enable LG&E to purchase gas when costs are low, store it for later use, and pass the savings to customers.
LG&E employs comprehensive natural gas safety and leak detection measures that include monitoring systems 24/7 by a central Gas Control Room; conducting leak surveys; operating a Pipeline Integrity Management Program that identifies and minimizes potential pipeline risks; and educating community
PPL Corporation EEI-AGA ESG/Sustainability Report
6
partners and the general public about natural gas safety. LG&E’s Lost and Unaccounted for Gas as reported on our Gas Distribution Annual Report filed with Pipeline and Hazardous Materials Safety Administration was 1.1% for the year ending June 30, 2020, an amount well within the industry average. The metric includes gas lost through leaks, theft and losses due to operations and maintenance functions when necessary. In addition to those ongoing efforts, the company’s plans for natural gas infrastructure updates include:
• Replacing approximately 45,000 steel customer service lines and removing of approximately 4,400 steel curbed services.
• Implementing a Transmission Pipeline Modernization program to replace approximately 15.5 miles of transmission pipeline.
• Upgrading to city gate stations and gas regulation facilities with new valves, piping, and modern regulation and measurement equipment.
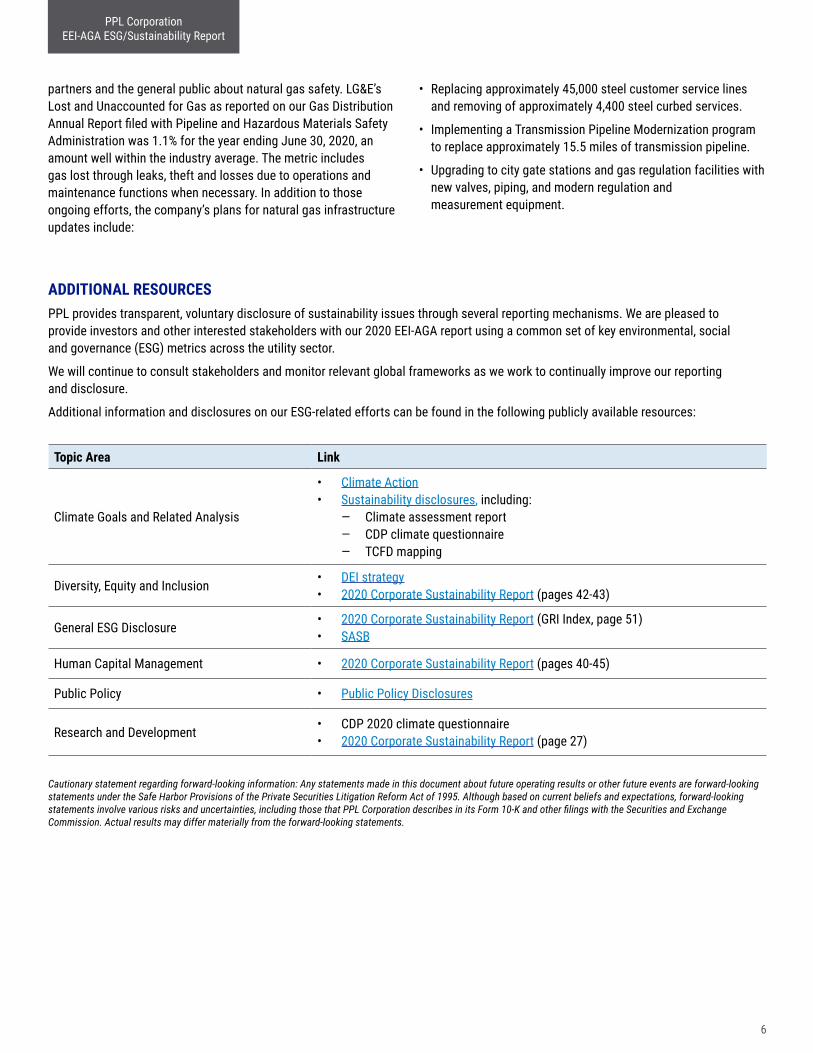
Topic Area Link
Climate Goals and Related Analysis
• Climate Action • Sustainability disclosures, including:
— Climate assessment report — CDP climate questionnaire — TCFD mapping
Diversity, Equity and Inclusion • DEI strategy • 2020 Corporate Sustainability Report (pages 42-43)
General ESG Disclosure • 2020 Corporate Sustainability Report (GRI Index, page 51)• SASB
Human Capital Management • 2020 Corporate Sustainability Report (pages 40-45)
Public Policy • Public Policy Disclosures
Research and Development • CDP 2020 climate questionnaire• 2020 Corporate Sustainability Report (page 27)
Cautionary statement regarding forward-looking information: Any statements made in this document about future operating results or other future events are forward-looking statements under the Safe Harbor Provisions of the Private Securities Litigation Reform Act of 1995. Although based on current beliefs and expectations, forward-looking statements involve various risks and uncertainties, including those that PPL Corporation describes in its Form 10-K and other filings with the Securities and Exchange Commission. Actual results may differ materially from the forward-looking statements.
ADDITIONAL RESOURCES PPL provides transparent, voluntary disclosure of sustainability issues through several reporting mechanisms. We are pleased to provide investors and other interested stakeholders with our 2020 EEI-AGA report using a common set of key environmental, social and governance (ESG) metrics across the utility sector.
We will continue to consult stakeholders and monitor relevant global frameworks as we work to continually improve our reporting and disclosure.
Additional information and disclosures on our ESG-related efforts can be found in the following publicly available resources:
PPL Corporation EEI-AGA ESG/Sustainability Report
7
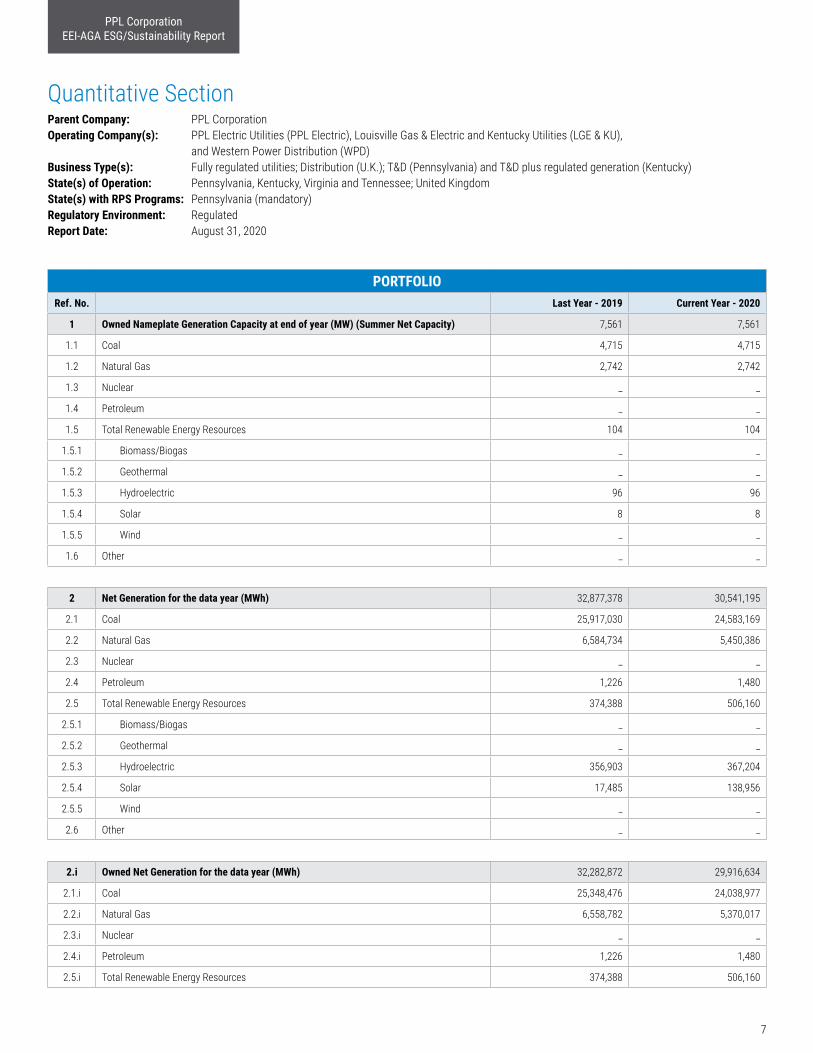
PORTFOLIORef. No. Last Year - 2019 Current Year - 2020
1 Owned Nameplate Generation Capacity at end of year (MW) (Summer Net Capacity) 7,561 7,561
1.1 Coal 4,715 4,715
1.2 Natural Gas 2,742 2,742
1.3 Nuclear _ _
1.4 Petroleum _ _
1.5 Total Renewable Energy Resources 104 104
1.5.1 Biomass/Biogas _ _
1.5.2 Geothermal _ _
1.5.3 Hydroelectric 96 96
1.5.4 Solar 8 8
1.5.5 Wind _ _
1.6 Other _ _
2 Net Generation for the data year (MWh) 32,877,378 30,541,195
2.1 Coal 25,917,030 24,583,169
2.2 Natural Gas 6,584,734 5,450,386
2.3 Nuclear _ _
2.4 Petroleum 1,226 1,480
2.5 Total Renewable Energy Resources 374,388 506,160
2.5.1 Biomass/Biogas _ _
2.5.2 Geothermal _ _
2.5.3 Hydroelectric 356,903 367,204
2.5.4 Solar 17,485 138,956
2.5.5 Wind _ _
2.6 Other _ _
2.i Owned Net Generation for the data year (MWh) 32,282,872 29,916,634
2.1.i Coal 25,348,476 24,038,977
2.2.i Natural Gas 6,558,782 5,370,017
2.3.i Nuclear _ _
2.4.i Petroleum 1,226 1,480
2.5.i Total Renewable Energy Resources 374,388 506,160
Quantitative Section Parent Company: PPL Corporation Operating Company(s): PPL Electric Utilities (PPL Electric), Louisville Gas & Electric and Kentucky Utilities (LGE & KU), and Western Power Distribution (WPD) Business Type(s): Fully regulated utilities; Distribution (U.K.); T&D (Pennsylvania) and T&D plus regulated generation (Kentucky)State(s) of Operation: Pennsylvania, Kentucky, Virginia and Tennessee; United Kingdom State(s) with RPS Programs: Pennsylvania (mandatory) Regulatory Environment: Regulated Report Date: August 31, 2020
PPL Corporation EEI-AGA ESG/Sustainability Report
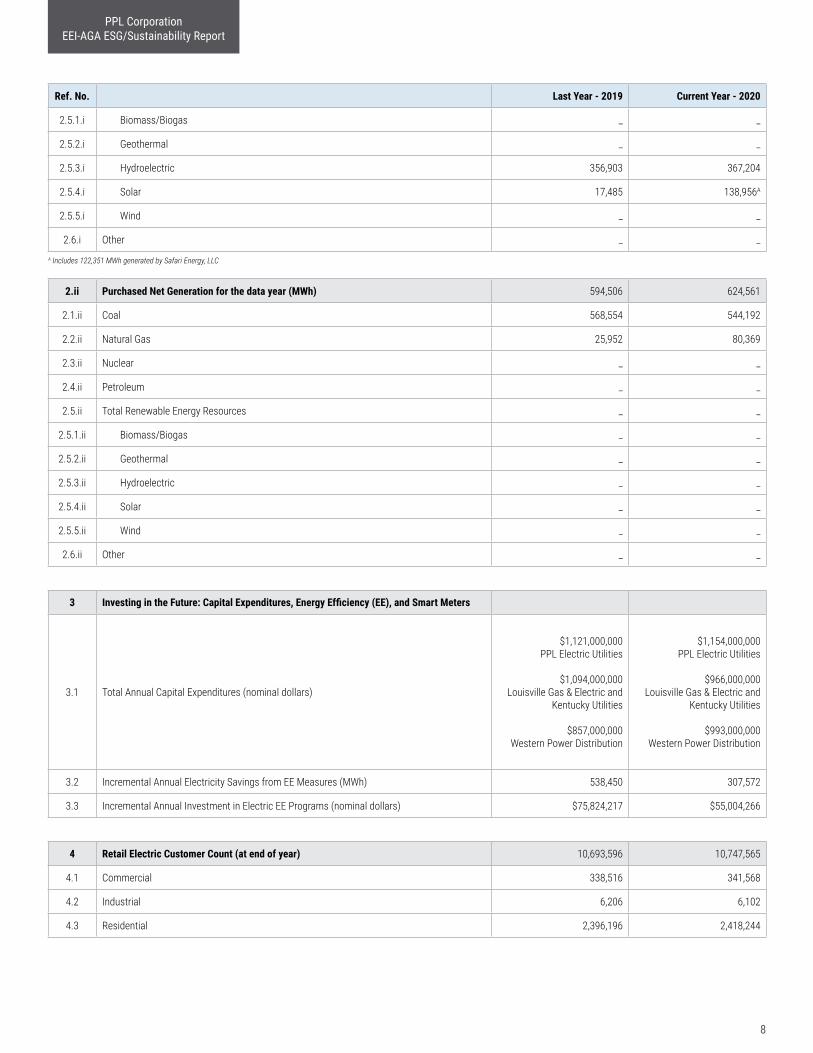
Ref. No. Last Year - 2019 Current Year - 2020
2.5.1.i Biomass/Biogas _ _
2.5.2.i Geothermal _ _
2.5.3.i Hydroelectric 356,903 367,204
2.5.4.i Solar 17,485 138,956A
2.5.5.i Wind _ _
2.6.i Other _ _A Includes 122,351 MWh generated by Safari Energy, LLC
2.ii Purchased Net Generation for the data year (MWh) 594,506 624,561
2.1.ii Coal 568,554 544,192
2.2.ii Natural Gas 25,952 80,369
2.3.ii Nuclear _ _
2.4.ii Petroleum _ _
2.5.ii Total Renewable Energy Resources _ _
2.5.1.ii Biomass/Biogas _ _
2.5.2.ii Geothermal _ _
2.5.3.ii Hydroelectric _ _
2.5.4.ii Solar _ _
2.5.5.ii Wind _ _
2.6.ii Other _ _
3 Investing in the Future: Capital Expenditures, Energy Efficiency (EE), and Smart Meters
3.1 Total Annual Capital Expenditures (nominal dollars)
$1,121,000,000 PPL Electric Utilities
$1,094,000,000
Louisville Gas & Electric and Kentucky Utilities
$857,000,000
Western Power Distribution
$1,154,000,000 PPL Electric Utilities
$966,000,000
Louisville Gas & Electric and Kentucky Utilities
$993,000,000
Western Power Distribution
3.2 Incremental Annual Electricity Savings from EE Measures (MWh) 538,450 307,572
3.3 Incremental Annual Investment in Electric EE Programs (nominal dollars) $75,824,217 $55,004,266
4 Retail Electric Customer Count (at end of year) 10,693,596 10,747,565
4.1 Commercial 338,516 341,568
4.2 Industrial 6,206 6,102
4.3 Residential 2,396,196 2,418,244
8
PPL Corporation EEI-AGA ESG/Sustainability Report
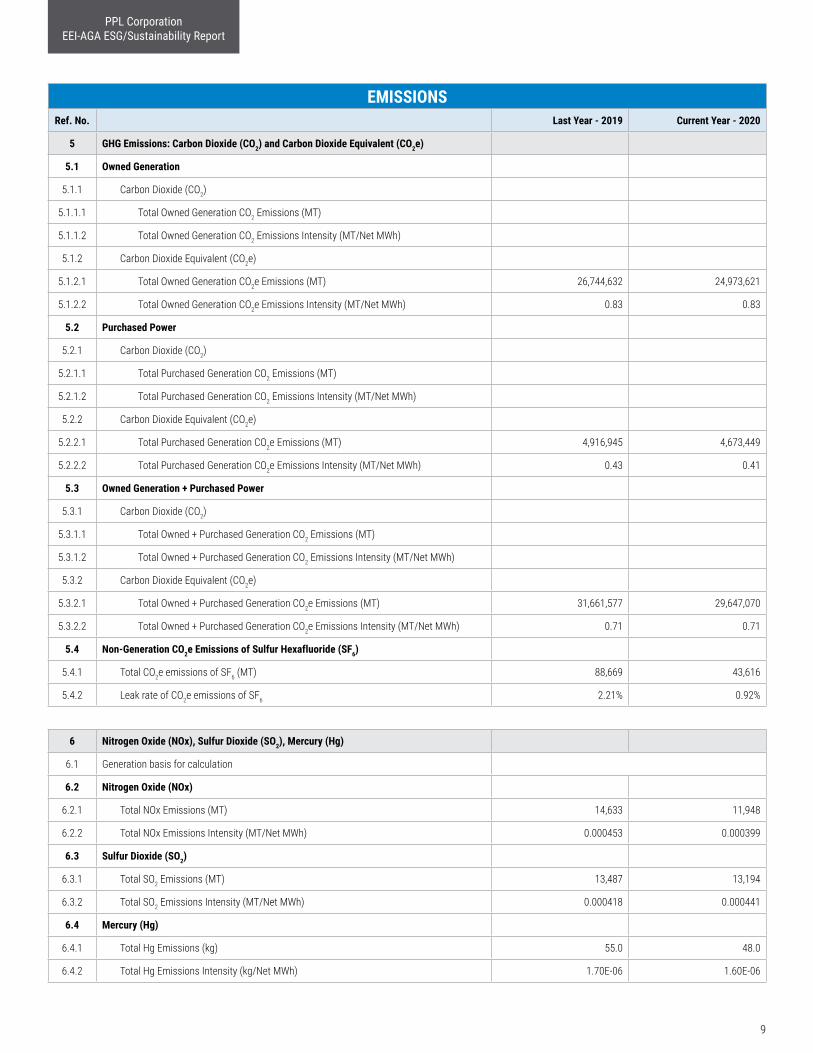
EMISSIONSRef. No. Last Year - 2019 Current Year - 2020
5 GHG Emissions: Carbon Dioxide (CO2) and Carbon Dioxide Equivalent (CO2e)
5.1 Owned Generation
5.1.1 Carbon Dioxide (CO2)
5.1.1.1 Total Owned Generation CO2 Emissions (MT)
5.1.1.2 Total Owned Generation CO2 Emissions Intensity (MT/Net MWh)
5.1.2 Carbon Dioxide Equivalent (CO2e)
5.1.2.1 Total Owned Generation CO2e Emissions (MT) 26,744,632 24,973,621
5.1.2.2 Total Owned Generation CO2e Emissions Intensity (MT/Net MWh) 0.83 0.83
5.2 Purchased Power
5.2.1 Carbon Dioxide (CO2)
5.2.1.1 Total Purchased Generation CO2 Emissions (MT)
5.2.1.2 Total Purchased Generation CO2 Emissions Intensity (MT/Net MWh)
5.2.2 Carbon Dioxide Equivalent (CO2e)
5.2.2.1 Total Purchased Generation CO2e Emissions (MT) 4,916,945 4,673,449
5.2.2.2 Total Purchased Generation CO2e Emissions Intensity (MT/Net MWh) 0.43 0.41
5.3 Owned Generation + Purchased Power
5.3.1 Carbon Dioxide (CO2)
5.3.1.1 Total Owned + Purchased Generation CO2 Emissions (MT)
5.3.1.2 Total Owned + Purchased Generation CO2 Emissions Intensity (MT/Net MWh)
5.3.2 Carbon Dioxide Equivalent (CO2e)
5.3.2.1 Total Owned + Purchased Generation CO2e Emissions (MT) 31,661,577 29,647,070
5.3.2.2 Total Owned + Purchased Generation CO2e Emissions Intensity (MT/Net MWh) 0.71 0.71
5.4 Non-Generation CO2e Emissions of Sulfur Hexafluoride (SF6)
5.4.1 Total CO2e emissions of SF6 (MT) 88,669 43,616
5.4.2 Leak rate of CO2e emissions of SF6 2.21% 0.92%
6 Nitrogen Oxide (NOx), Sulfur Dioxide (SO2), Mercury (Hg)
6.1 Generation basis for calculation
6.2 Nitrogen Oxide (NOx)
6.2.1 Total NOx Emissions (MT) 14,633 11,948
6.2.2 Total NOx Emissions Intensity (MT/Net MWh) 0.000453 0.000399
6.3 Sulfur Dioxide (SO2)
6.3.1 Total SO2 Emissions (MT) 13,487 13,194
6.3.2 Total SO2 Emissions Intensity (MT/Net MWh) 0.000418 0.000441
6.4 Mercury (Hg)
6.4.1 Total Hg Emissions (kg) 55.0 48.0
6.4.2 Total Hg Emissions Intensity (kg/Net MWh) 1.70E-06 1.60E-06
9
PPL Corporation EEI-AGA ESG/Sustainability Report
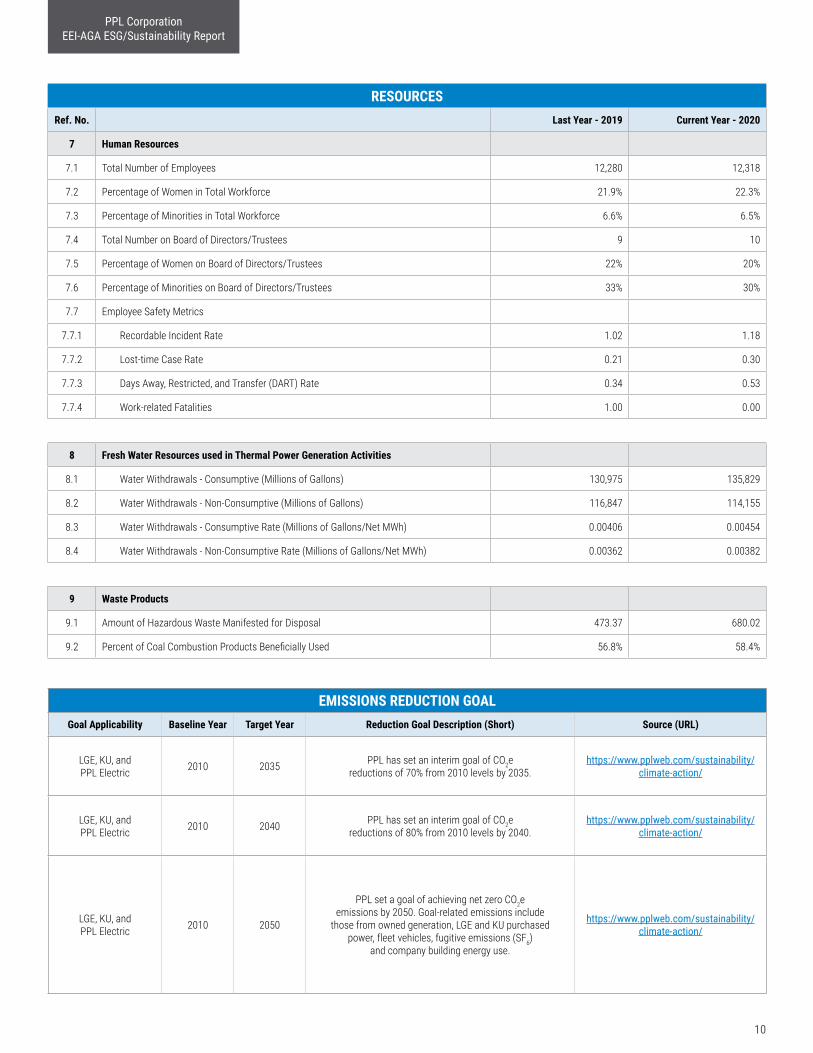
RESOURCESRef. No. Last Year - 2019 Current Year - 2020
7 Human Resources
7.1 Total Number of Employees 12,280 12,318
7.2 Percentage of Women in Total Workforce 21.9% 22.3%
7.3 Percentage of Minorities in Total Workforce 6.6% 6.5%
7.4 Total Number on Board of Directors/Trustees 9 10
7.5 Percentage of Women on Board of Directors/Trustees 22% 20%
7.6 Percentage of Minorities on Board of Directors/Trustees 33% 30%
7.7 Employee Safety Metrics
7.7.1 Recordable Incident Rate 1.02 1.18
7.7.2 Lost-time Case Rate 0.21 0.30
7.7.3 Days Away, Restricted, and Transfer (DART) Rate 0.34 0.53
7.7.4 Work-related Fatalities 1.00 0.00
8 Fresh Water Resources used in Thermal Power Generation Activities
8.1 Water Withdrawals - Consumptive (Millions of Gallons) 130,975 135,829
8.2 Water Withdrawals - Non-Consumptive (Millions of Gallons) 116,847 114,155
8.3 Water Withdrawals - Consumptive Rate (Millions of Gallons/Net MWh) 0.00406 0.00454
8.4 Water Withdrawals - Non-Consumptive Rate (Millions of Gallons/Net MWh) 0.00362 0.00382
9 Waste Products
9.1 Amount of Hazardous Waste Manifested for Disposal 473.37 680.02
9.2 Percent of Coal Combustion Products Beneficially Used 56.8% 58.4%
10
EMISSIONS REDUCTION GOALGoal Applicability Baseline Year Target Year Reduction Goal Description (Short) Source (URL)
LGE, KU, and PPL Electric 2010 2035 PPL has set an interim goal of CO2e
reductions of 70% from 2010 levels by 2035.https://www.pplweb.com/sustainability/
climate-action/
LGE, KU, and PPL Electric 2010 2040 PPL has set an interim goal of CO2e
reductions of 80% from 2010 levels by 2040.https://www.pplweb.com/sustainability/
climate-action/
LGE, KU, and PPL Electric 2010 2050
PPL set a goal of achieving net zero CO2e emissions by 2050. Goal-related emissions include
those from owned generation, LGE and KU purchased power, fleet vehicles, fugitive emissions (SF6)
and company building energy use.
https://www.pplweb.com/sustainability/climate-action/
PPL Corporation EEI-AGA ESG/Sustainability Report
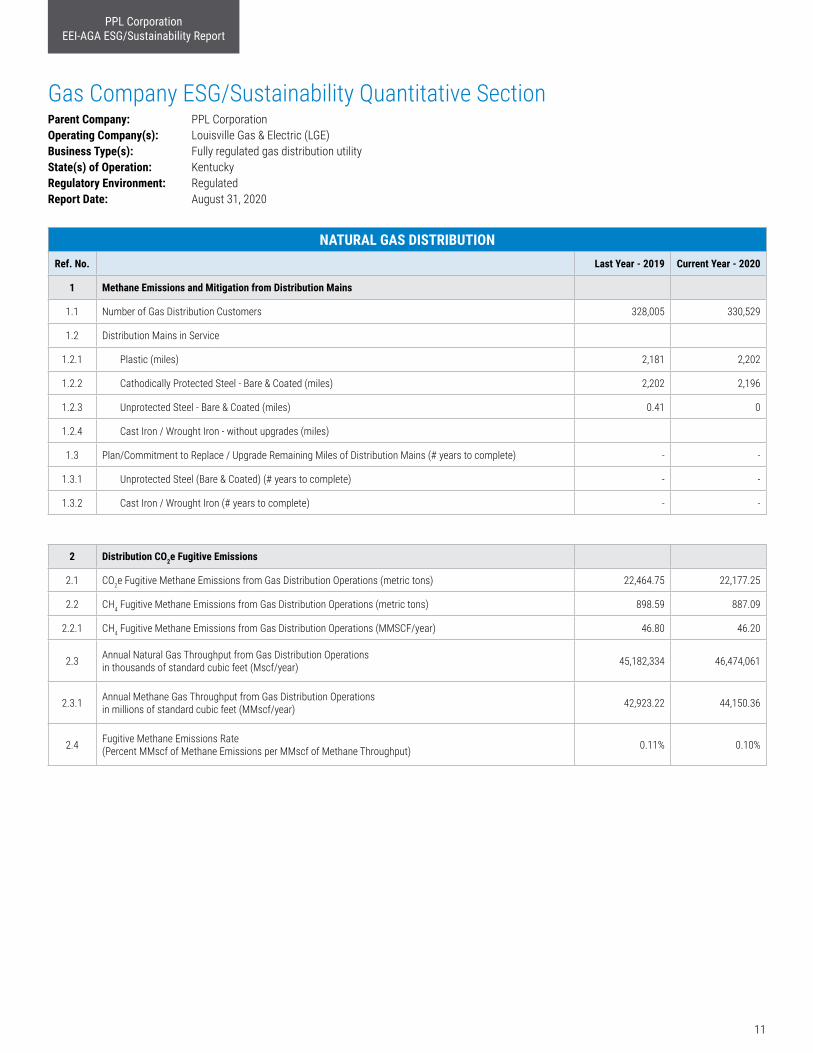
NATURAL GAS DISTRIBUTIONRef. No. Last Year - 2019 Current Year - 2020
1 Methane Emissions and Mitigation from Distribution Mains
1.1 Number of Gas Distribution Customers 328,005 330,529
1.2 Distribution Mains in Service
1.2.1 Plastic (miles) 2,181 2,202
1.2.2 Cathodically Protected Steel - Bare & Coated (miles) 2,202 2,196
1.2.3 Unprotected Steel - Bare & Coated (miles) 0.41 0
1.2.4 Cast Iron / Wrought Iron - without upgrades (miles)
1.3 Plan/Commitment to Replace / Upgrade Remaining Miles of Distribution Mains (# years to complete) - -
1.3.1 Unprotected Steel (Bare & Coated) (# years to complete) - -
1.3.2 Cast Iron / Wrought Iron (# years to complete) - -
2 Distribution CO2e Fugitive Emissions
2.1 CO2e Fugitive Methane Emissions from Gas Distribution Operations (metric tons) 22,464.75 22,177.25
2.2 CH4 Fugitive Methane Emissions from Gas Distribution Operations (metric tons) 898.59 887.09
2.2.1 CH4 Fugitive Methane Emissions from Gas Distribution Operations (MMSCF/year) 46.80 46.20
2.3 Annual Natural Gas Throughput from Gas Distribution Operations in thousands of standard cubic feet (Mscf/year) 45,182,334 46,474,061
2.3.1 Annual Methane Gas Throughput from Gas Distribution Operations in millions of standard cubic feet (MMscf/year) 42,923.22 44,150.36
2.4 Fugitive Methane Emissions Rate (Percent MMscf of Methane Emissions per MMscf of Methane Throughput) 0.11% 0.10%
Gas Company ESG/Sustainability Quantitative Section Parent Company: PPL Corporation Operating Company(s): Louisville Gas & Electric (LGE) Business Type(s): Fully regulated gas distribution utility State(s) of Operation: Kentucky Regulatory Environment: Regulated Report Date: August 31, 2020
11
PPL Corporation EEI-AGA ESG/Sustainability Report
12
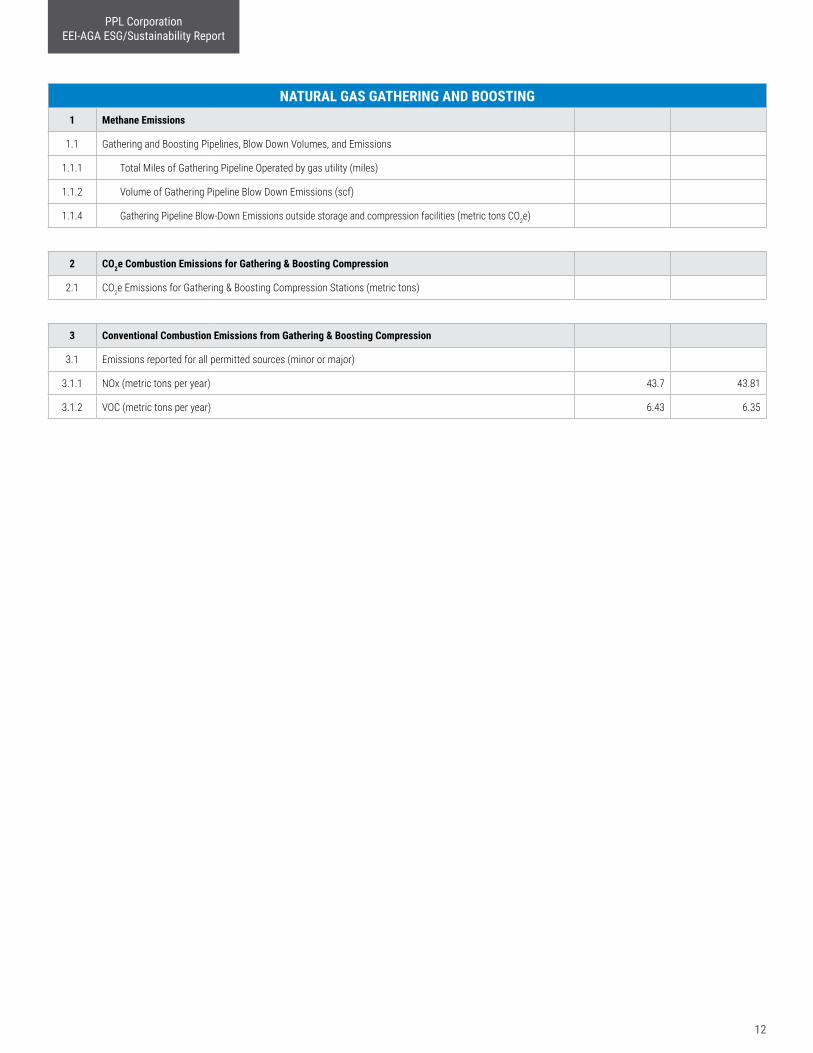
NATURAL GAS GATHERING AND BOOSTING1 Methane Emissions
1.1 Gathering and Boosting Pipelines, Blow Down Volumes, and Emissions
1.1.1 Total Miles of Gathering Pipeline Operated by gas utility (miles)
1.1.2 Volume of Gathering Pipeline Blow Down Emissions (scf)
1.1.4 Gathering Pipeline Blow-Down Emissions outside storage and compression facilities (metric tons CO2e)
2 CO2e Combustion Emissions for Gathering & Boosting Compression
2.1 CO2e Emissions for Gathering & Boosting Compression Stations (metric tons)
3 Conventional Combustion Emissions from Gathering & Boosting Compression
3.1 Emissions reported for all permitted sources (minor or major)
3.1.1 NOx (metric tons per year) 43.7 43.81
3.1.2 VOC (metric tons per year) 6.43 6.35