pr q2 2021 - signify.com
TRANSCRIPT
PressRelease
July23,2021
SignifyreportssecondquartersalesofEUR1.6billion,operationalprofitabilityof10.9%andafreecashflowofEUR104million
Secondquarter20211
• Signify'sinstalledbaseofconnectedlightpointsincreasedfrom83millioninQ121to862millioninQ221• SalesofEUR1,609million;9.6%nominalsalesgrowthandCSGof14.1%• LED-basedsalesrepresented82%oftotalsales(Q22020:80%)• Adj.EBITAmarginimprovedby190bpsto10.9%• NetincomeincreasedtoEUR82million(Q220:EUR81million)• FreecashflowofEUR104million(Q220:EUR158million)• Netdebt/EBITDAratioof1.7x(Q220:2.4x)
Eindhoven, the Netherlands – Signify (Euronext: LIGHT), the world leader in lighting, today announced thecompany’ssecondquarter2021results.
“Inthesecondquarterwesawanaccelerationofthepaceofrecoveryincomparisontothefirstthreemonthsoftheyear.We successfullyexecutedour strategyasdemand forour connected lightingoffers andourgrowthplatformsremainedstrong.Theconsumersegmenthelditsmomentumanddemandforconventionalproductsproved resilient. The professional lighting segment showed sequential improvements,while still impacted bybothextendedlockdownsandsupplyconstraints.Overall,wemanagedtoimprovetheoperatingmarginby190basispointsandgeneratedasolidfreecashflow.WeagainprogressedonourBrighterLives,BetterWorld2025program,wellontracktoachievingourfourkeyobjectives.Lookingbackatthefirsthalfyear,wearepleasedwith the pace of our recovery in a volatile and disrupted environment, achieving more than 8 percentcomparablesalesgrowthwithanoperatingmargin improvementof230basispointsandgeneratingEUR272millionoffreecashflow,”saidCEOEricRondolat.
“Whileweareseeing increasingCOVID-19cases,newvariants leadingtocontinued lockdowns inpartsof theworldandsupplyconstraintscontinuingtoimpactusintothesecondhalfoftheyear,weareconfidentthatthemeasureswehavetakenwillenableustocounterthosechallengesanddeliverourguidancefortheyear.”
¹Thispress releasecontainscertainnon-IFRS financialmeasuresandratios, suchascomparablesalesgrowth,EBITA,adjustedEBITAand freecash flow,andrelatedratios,whicharenotrecognizedmeasuresoffinancialperformanceorliquidityunderIFRS.Forareconciliationofthesenon-IFRSfinancialmeasurestothemostdirectlycomparableIFRSfinancialmeasures,seeappendixB,Reconciliationofnon-IFRSfinancialmeasures,ofthispressrelease.2Excludes2millionconnectedlightpointsforTelensa,asacquisitionclosedonJuly1,2021
BrighterLives,BetterWorld2025
In the second quarter of the year, Signify continued on the journey to achieving its ambitious goals for theBrighterLives,BetterWorld2025sustainabilityprogram,progressingonallfourcommitmentsthatcontributetodoublingitspositiveimpactonenvironmentandsociety:
• DoublethepaceoftheParisagreement:Cumulativecarbonreductionovervaluechainwas33milliontonnes,aheadoftrackforthe2025targetof340milliontonnes.This ismainlycausedbyanacceleratedshifttoenergyefficientandconnectedLEDlightinginthefirsttwoquartersof2021,decreasingourcarbonemissionsintheusephase.
• DoubleourCircularrevenuesto32%:Circular revenues increased to24%,compared to the2019baselineof16%.Weareon track for the2025targetof32%.Thisismainlyduetoourstrongportfolioofserviceableluminairesandthefurtherexpansionofour3Dprintingfootprint.
• DoubleourBrighterlivesrevenuesto32%:Brighter lives revenueswere25%,progressingwell towards the2025 targetof32%.Wehad severalcustomerwins that contribute to our Brighter lives revenues, including 'quality of light' EyeComfortproducts,horticulturelightingandUV-Cdisinfectionlighting.
• Doublethepercentageofwomeninleadershippositionsto34%:Thepercentageofwomeninleadershippositionswas25%,ontracktoreachthe2025targetof34%.This target is part of a broader program, where we focus our efforts on attracting, retaining anddevelopingdiversetalents,whileensuringequalopportunities,fairnessandimpartialityforall.
Inaddition,Signifyreceivedrecognitionforitsleadershipinsustainability,amongstwhichafirstplacerankinginourindustryandtop5%oftheESGRiskRatingsUniversefromSustainalytics.
Outlook
Signify continues to expect comparable sales growth of 3% to 6% for the full year 2021. In addition, SignifyexpectstoachieveanAdjustedEBITAmarginof11.5%to12.5%andfreecashflowtoexceed8%ofsalesforthefullyear2021.Aspreviouslystated,thecompanyreassessesitsmedium-termguidanceaftereachfinancialyear.
2

Financialreview
Secondquarter Sixmonths2020 2021 change inmillionsofEUR,exceptpercentages 2020 2021 change
14.1% Comparablesalesgrowth 8.4%-4.5% Effectsofcurrencymovements -5.5%0.0% Consolidationandotherchanges 8.0%
1,469 1,609 9.6% Sales 2,896 3,209 10.8% 567 638 12.5% Adjustedgrossmargin 1,112 1,275 14.7%
38.6% 39.7% Adj.grossmargin(as%ofsales) 38.4% 39.7%
-401 -423 Adj.SG&Aexpenses -794 -847 -67 -70 Adj.R&Dexpenses -134 -142 -468 -493 -5.4% Adj.indirectcosts -928 -989 -6.6%
31.9% 30.6% Adj.indirectcosts(as%ofsales) 32.0% 30.8%
133 175 32.0% AdjustedEBITA 245 347 41.8%9.0% 10.9% AdjustedEBITAmargin 8.5% 10.8%
-13 -39 Adjusteditems -55 -97 119 136 13.8% EBITA 189 251 32.3%
87 106 21.5% Incomefromoperations(EBIT) 130 191 46.7% -16 -7 Netfinancialincome/expense -26 -16 10 -17 Incometaxexpense 4 -32 81 82 0.8% Netincome 108 142 31.3%
158 104 Freecashflow 270 272 0.62 0.65 BasicEPS(€) 0.85 1.12 35,789 39,143 Employees(FTE) 35,789 39,143
*ForcomparabilitypurposespleasenotethatFY2020includesonly10monthsofCooperLightingperformance
SecondquarterSales increased by 9.6% to EUR 1,609 million, including 4.5% negative currency effects. Comparable salesincreased by 14.1%, driven by continued strong demand for connected lighting offers and traction on theconsumer side. Theadjustedgrossmargin increasedby110bps to39.7%,drivenbyboth carefullybalancingpricingdecisionsversuscostincreases,andafavorablemix.AdjustedindirectcostsincreasedbyEUR25million,mainly reflecting last year's positive effect of solidarity measures by our employees, and governmentcontributions.AdjustedEBITAamountedtoEUR175million,a32.0%increasecomparedtothesameperiodlastyear.TheAdjustedEBITAmarginimprovedby190bpsto10.9%,mainlydrivenbyagrossmarginimprovementandoperatingleverage.
Total restructuring costs were EUR 9 million, acquisition-related charges were EUR 13 million and otherincidental costs were EUR 16 million, mainly related to environmental provisions for inactive sites andtransformationcosts.Net income increased toEUR82million,ashigheroperationalprofitability in2021wasoffsetbytheimpactofasignificantone-timetaxbenefitinthesecondquarterof2020.FreecashflowwasEUR104million, reflecting a healthy balance between profitability and some reinvestment in continued top linerecovery.
3
DigitalSolutions
Secondquarter Sixmonths
2020 2021 change inmillionsofEUR,unlessotherwiseindicated 2020* 2021 change
12.6% Comparablesalesgrowth 5.1%
781 837 7.2% Sales 1,420 1,631 14.8% 75 89 19.2% AdjustedEBITA 118 161 36.5%
9.6% 10.7% AdjustedEBITAmargin 8.3% 9.9% 59 72 21.9% EBITA 77 120 55.6% 29 44 51.5% Incomefromoperations(EBIT) 23 65 184.8%
*Forcomparabilitypurposespleasenotethatfirstquarter2020includesonly1monthofCooperLightingperformance
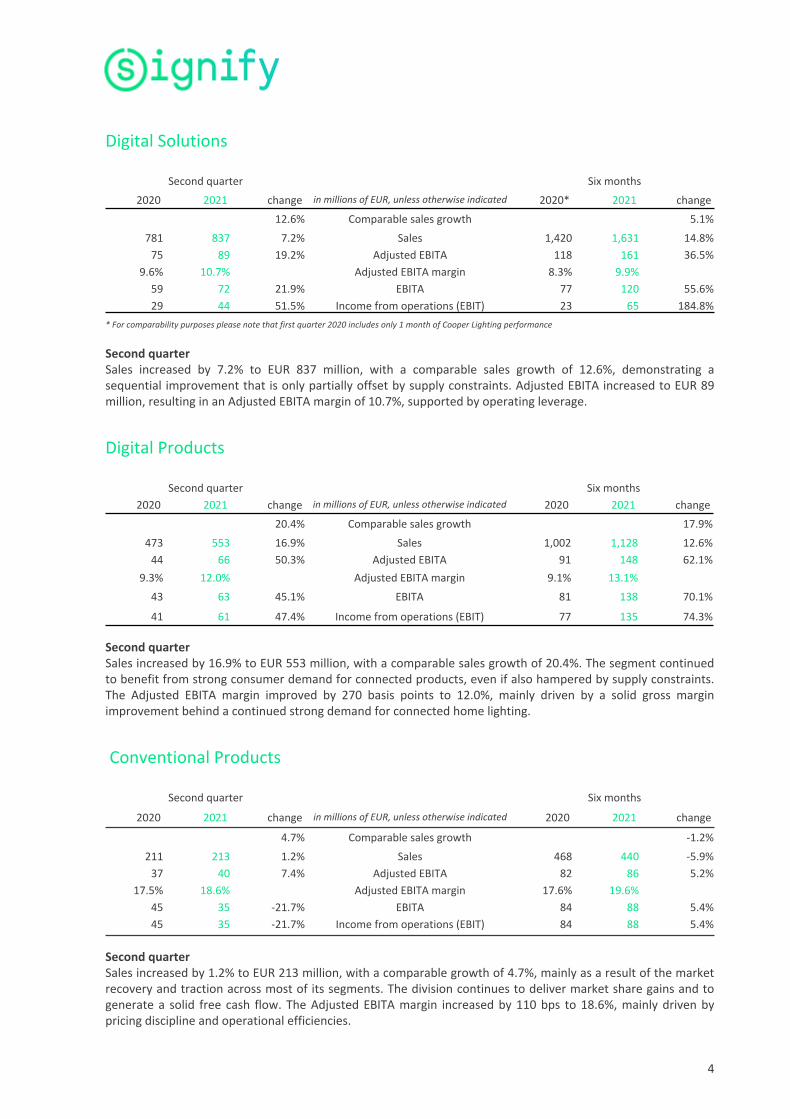
SecondquarterSales increased by 7.2% to EUR 837 million, with a comparable sales growth of 12.6%, demonstrating asequential improvementthatisonlypartiallyoffsetbysupplyconstraints.AdjustedEBITAincreasedtoEUR89million,resultinginanAdjustedEBITAmarginof10.7%,supportedbyoperatingleverage.
DigitalProducts
Secondquarter Sixmonths2020 2021 change inmillionsofEUR,unlessotherwiseindicated 2020 2021 change
20.4% Comparablesalesgrowth 17.9%
473 553 16.9% Sales 1,002 1,128 12.6% 44 66 50.3% AdjustedEBITA 91 148 62.1%
9.3% 12.0% AdjustedEBITAmargin 9.1% 13.1%
43 63 45.1% EBITA 81 138 70.1%
41 61 47.4% Incomefromoperations(EBIT) 77 135 74.3%
SecondquarterSalesincreasedby16.9%toEUR553million,withacomparablesalesgrowthof20.4%.Thesegmentcontinuedtobenefitfromstrongconsumerdemandforconnectedproducts,evenifalsohamperedbysupplyconstraints.The Adjusted EBITA margin improved by 270 basis points to 12.0%, mainly driven by a solid gross marginimprovementbehindacontinuedstrongdemandforconnectedhomelighting.
ConventionalProducts
Secondquarter Sixmonths
2020 2021 change inmillionsofEUR,unlessotherwiseindicated 2020 2021 change
4.7% Comparablesalesgrowth -1.2%
211 213 1.2% Sales 468 440 -5.9% 37 40 7.4% AdjustedEBITA 82 86 5.2%
17.5% 18.6% AdjustedEBITAmargin 17.6% 19.6% 45 35 -21.7% EBITA 84 88 5.4% 45 35 -21.7% Incomefromoperations(EBIT) 84 88 5.4%
SecondquarterSalesincreasedby1.2%toEUR213million,withacomparablegrowthof4.7%,mainlyasaresultofthemarketrecoveryandtractionacrossmostofitssegments.Thedivisioncontinuestodelivermarketsharegainsandtogeneratea solid free cash flow. TheAdjustedEBITAmargin increasedby110bps to18.6%,mainlydrivenbypricingdisciplineandoperationalefficiencies.
4

Other
Secondquarter'Other'representsamountsnotallocatedtotheoperatingsegmentsandincludescostsrelatedbothtocentralR&Dactivitiestodriveinnovation,andtogroupenablingfunctions.AdjustedEBITAamountedtoEUR-20million(Q220:EUR-23million).EBITAamountedtoEUR-34million(Q220:EUR-28million).RestructuringcostsandotherincidentalswereEUR14million(Q220:EUR4million)duringthequarter.
Salesbymarket
Secondquarter Sixmonths
2020 2021 Change CSG inmillionsofEUR,exceptpercentages 2020 2021 change CSG
406 477 17.5% 17.5% Europe 908 999 10.1% 11.2%
619 623 0.7% 9.4% Americas 1,104 1,211 9.7% 0.3%323 377 17.0% 20.8% Restoftheworld 647 747 15.4% 21.8%122 133 8.9% 8.1% Globalbusinesses 237 251 6.1% 5.0%
1,469 1,609 9.6% 14.1% Total 2,896 3,209 10.8% 8.4%
AmericasincludesCooperLightingfromMarch1,2020,andGlobalbusinessesincludesKliteWizConnectedisincludedinMarketGroupsEurope,AmericasandRestoftheworld(waspreviouslypartofGlobalbusinesses)
SecondquarterIn thesecondquartermostmarketsbenefited froma lowcomparisonbase,as the impactofCOVID-19cameinto fulleffectduring thesecondquarterof lastyear. In thesecondquarterof thisyear, comparablesales inEuropegrewby17.5%,asmostmarketsacceleratedtheirrecovery.IntheAmericas,comparablesalesgrewby9.4%.TheRestof theworldgrewby20.8%,as theunderlying recoverypath showed robustnessacrossmostgeographies.
Workingcapital
inmillionsofEUR,unlessotherwiseindicated 30Jun,2020 31Mar,2021 30Jun,2021
Inventories 1,032 946 1,120
Tradeandotherreceivables 1,096 1,074 1,056
Tradeandotherpayables -1,659 -1,784 -1,935
Otherworkingcapitalitems -17 -1 29
Workingcapital 452 236 269
As%ofLTM*sales 7.3% 3.5% 4.0%*LTM:LastTwelveMonths
6,614 6,336 6,275
SecondquarterWorkingcapitaldecreasedbyEUR183millionyearonyeartoEUR269million,mainlydrivenbyhigherpayables,partly offset byhigher inventories andotherworking capital items.As a percentageof sales,working capitalimprovedby330bpsto4.0%ofsales.Whenincludinglasttwelve-monthsalespro-formaCooperLightingandKlite,workingcapitalimprovedby230bps.
5

Cashflowanalysis
Secondquarter Sixmonths2020 2021 inmillionsofEUR 2020 2021
87 106 Incomefromoperations(EBIT) 130 191
86 81 Depreciationandamortization 164 158 24 29 Additionsto(releasesof)provisions 57 89 -47 -48 Utilizationsofprovisions -99 -98 22 -3 Changeinworkingcapital 74 27 -13 -28 Netinterestandfinancingcostspaid -23 -29 0 -10 Incometaxespaid -28 -31 -5 -30 Netcapex -21 -46 3 7 Other 16 10 158 104 Freecashflow 270 272
SecondquarterFreecashflowofEUR104millionwasEUR54millionlowerthanlastyear,reflectinganincreasedinvestmentingrowth, as higher income from operations was offset by higher net capex, financing costs, an outflow fromworkingcapitalandhighertaxespaid.FreecashflowincludedarestructuringpayoutofEUR20million(Q220:EUR12million).
Netdebtandtotalequity
inmillionsofEUR 30Jun,2020 31Mar,2021 30Jun,2021
Short-termdebt 113 433 427
Long-termdebt 2,619 1,899 1,893Grossdebt 2,732 2,332 2,320
Cashandcashequivalents 1,026 1,192 945
Netdebt 1,706 1,141 1,375Totalequity 2,341 2,469 2,149
SecondquarterOur cash position decreased by EUR 247 million to EUR 945 million compared to the end of March 2021,impacted by the dividend payments and the purchase of treasury shares in the second quarter. Net debtamounted to EUR 1,375million, an increase of EUR 234million comparedwith the end ofMarch 2021.Netleverageimprovedfrom2.4xattheendofJune2020to1.7xattheendofJune2021.TotalequitydecreasedtoEUR2,149millionattheendofthesecondquarter(Q121:EUR2,469million),withdividenddistributionandsharerepurchasestocoverobligationsarising fromlong-termemployeeshareplansoffsettingthe increase innetincome.
6

Otherinformation
AppendixA–SelectionoffinancialstatementsAppendixB–Reconciliationofnon-IFRSfinancialmeasuresAppendixC–FinancialGlossary
ConferencecallandaudiowebcastEric Rondolat (CEO) and Javier van Engelen (CFO) will host a conference call for analysts and institutionalinvestorsat9:00a.m.CETtodiscussthe2021secondquarterresults.AliveaudiowebcastoftheconferencecallwillbeavailableviatheInvestorRelationswebsite.
Financialcalendar2021October29,2021 Thirdquarterresults2021January28,2022 Fourthquarterandfullyearresults2021
Forfurtherinformation,pleasecontact:SignifyInvestorRelationsThelkeGerdesTel:+31618017131E-mail:[email protected]
SignifyCorporateCommunicationsElcovanGroningenTel:+31610865519E-mail:[email protected]
AboutSignifySignify (Euronext: LIGHT) is theworld leader in lighting for professionals and consumers and lighting for theInternetofThings.OurPhilipsproducts,Interactconnectedlightingsystemsanddata-enabledservices,deliverbusinessvalueandtransformlifeinhomes,buildingsandpublicspaces.With2020salesofEUR6.5billion,wehave approximately 39,000 employees and are present in over 70 countries. We unlock the extraordinarypotentialoflightforbrighterlivesandabetterworld.Weachievedcarbonneutralityin2020,havebeenintheDowJonesSustainabilityWorldIndexsinceourIPOforfourconsecutiveyearsandwerenamedIndustryLeaderin 2017, 2018 and 2019. News from Signify is located at the Newsroom, Twitter, LinkedIn and Instagram.InformationforinvestorscanbefoundontheInvestorRelationspage.
7

ImportantInformation
Forward-LookingStatementsandRisks&UncertaintiesThisdocumentandtherelatedoralpresentationcontain,andresponsestoquestionsfollowingthepresentationmay contain, forward-looking statements that reflect the intentions, beliefs or current expectations andprojections of Signify N.V. (the “Company”, and together with its subsidiaries, the “Group”), includingstatementsregardingstrategy,estimatesofsalesgrowthandfutureoperationalresults.
Bytheirnature,thesestatementsinvolverisksanduncertaintiesfacingtheCompanyanditsGroupcompanies,and a number of important factors could cause actual results or outcomes to differ materially from thoseexpressedinanyforward-lookingstatementasaresultofrisksanduncertainties.Suchrisks,uncertaintiesandother important factors include but are not limited to: adverse economic and political developments, theimpactsofCOVID-19, rapid technological change, competition in thegeneral lightingmarket,developmentoflighting systems and services, successful implementation of business transformation programs, impact ofacquisitions and other transactions, reputational and adverse effects on business due to activities inEnvironment, Health & Safety, compliance risks, ability to attract and retain talented personnel, adversecurrency effects, pension liabilities, and exposure to international tax laws. Please see “Risk Factors andRiskManagement”inChapter12oftheAnnualReport2020fordiscussionofmaterialrisks,uncertaintiesandotherimportant factorswhichmay have amaterial adverse effect on the business, results of operations, financialconditionandprospectsoftheGroup.Suchrisks,uncertaintiesandother important factorsshouldberead inconjunctionwiththeinformationincludedintheCompany’sAnnualReport2020.
Lookingaheadtothesecondhalfof2021,theGroup'skeyconcernsareaboutboththesupplychainconstraintsandshortageofcertaincomponents,andtheuncertaintiesrelatedtotheCOVID-19pandemicintheglobalanddomesticmarkets inwhich it operates. Themain challenge remains the visibility on howquickly the generallightingmarketmayrecoverto (pre-COVID-19)2019 levels.This is relevanttotheGroupasa largepartof itsbusiness relates to the professional market which has been, and continues to be, significantly impacted bygovernmentlockdowns.AdditionalriskscurrentlynotknowntotheGrouporthattheGrouphasnotconsideredmaterial asof thedateof thisdocument couldalsoprove tobe important andmayhaveamaterial adverseeffectonthebusiness,resultsofoperations,financialconditionandprospectsoftheGrouporcouldcausetheforward-lookingeventsdiscussedinthisdocumentnottooccur.TheGroupundertakesnodutytoandwillnotnecessarilyupdateanyoftheforward-lookingstatementsinlightofnewinformationorfutureevents,excepttotheextentrequiredbyapplicablelaw.
MarketandIndustryInformationAllreferencestomarketshare,marketdata,industrystatisticsandindustryforecastsinthisdocumentconsistofestimates compiled by industry professionals, competitors, organizations or analysts, of publicly availableinformation or of the Group’s own assessment of its sales andmarkets. Rankings are based on sales unlessotherwisestated.
Non-IFRSFinancialMeasuresCertainpartsofthisdocumentcontainnon-IFRSfinancialmeasuresandratios,suchascomparablesalesgrowth,adjusted gross margin, EBITA, adjusted EBITA, and free cash flow, and other related ratios, which are notrecognized measures of financial performance or liquidity under IFRS. The non-IFRS financial measurespresentedaremeasuresusedbymanagementtomonitortheunderlyingperformanceoftheGroup’sbusinessandoperationsand,accordingly,theyhavenotbeenauditedorreviewed.Notallcompaniescalculatenon-IFRSfinancialmeasures in the samemanner or on a consistent basis and thesemeasures and ratiosmay not becomparabletomeasuresusedbyothercompaniesunderthesameorsimilarnames.Areconciliationofthesenon-IFRS financial measures to the most directly comparable IFRS financial measures is contained in thisdocument.Forfurtherinformationonnon-IFRSfinancialmeasures,see“Chapter18Reconciliationofnon-IFRSmeasures”intheAnnualReport2020.
PresentationAllamountsareinmillionsofeurosunlessotherwisestated.Duetorounding,amountsmaynotadduptototalsprovided.Allreporteddataareunaudited.Unlessotherwiseindicated,financialinformationhasbeenpreparedinaccordancewiththeaccountingpoliciesasstatedintheAnnualReport2020andSemi-AnnualReport2021.
8

MarketAbuseRegulationThispressreleasecontainsinformationwithinthemeaningofArticle7(1)oftheEUMarketAbuseRegulation.
9
Unaudited condensedconsolidated interimfinancial statements
For the six-month period ended June 30, 2021
10

Index to the unaudited condensed consolidated interim financial statements
Introduction 12Management report 13
1. Condensed consolidated interim financial statements 151.1 Condensed consolidated statement of income 151.2 Condensed consolidated statement of comprehensive income 161.3 Condensed consolidated statement of financial position 171.4 Condensed consolidated statement of cash flows 181.5 Condensed consolidated statement of changes in equity 19
2. Notes to the condensed consolidated interim financial statements 202.1 Reporting entity 202.2 Basis of preparation 202.3 Notes 21
11
Semi-annual reportIntroductionThe semi-annual report for the six-month period ended June 30, 2021 of Signify N.V. (the ‘Company’) consists of the semi-annual condensed consolidated interim financial statements, the semi-annual management report and the responsibility statement by the Company’s Board of Management.
The main risks and uncertainties for the second half of 2021 are addressed in the first part of the press release - please refer to the section ‘Important Information’.
The information in this semi-annual report is unaudited. The semi-annual condensed consolidated interim financial statements do not include all the information and disclosures required in the annual financial statements and should be read in conjunction with the Company’s Consolidated financial statements for the year ended December 31, 2020.
Responsibility statementThe Board of Management of the Company hereby declares that, to the best of its knowledge, the semi-annual condensed consolidated interim financial statements for the six-month period ended June 30, 2021, which have been prepared in accordance with IAS 34, Interim Financial Reporting, as adopted by the European Union, gives a true and fair view of the assets, liabilities, financial position and profit or loss of the Company and the undertakings included in the consolidation taken as a whole, and the semi-annual management report for the six-month period ended June 30, 2021, gives a fair view of the information required pursuant to Section 5:25d(8)-(9) of the Dutch Financial Markets Supervision Act (Wet op het Financieel toezicht).
Eindhoven, July 23, 2021
Board of Management
Eric RondolatJavier van EngelenMaria Letizia Mariani
12

Management report
Business performance 1
Market environmentThe first half of 2021 showed early signs of an economic recovery as vaccination rollouts led to an easing of lockdowns in many parts of the world. The strongest market recovery was seen in China and across Europe, while the Americas region continued to be more strongly impacted by the pandemic.
Signify saw particularly strong consumer demand for connected lighting products, a resilient performance of conventional lighting, while professional demand continued to be impacted by government measures to curb the spread of the virus as well as supply constraints caused by component shortages and logistics challenges.
Financial performanceSales amounted to EUR 3,209 million, an increase of 10.8% on a nominal basis. Adjusted for a -5.5% currency effect and an 8.0% consolidation and other impact (mainly related to the acquisition of Cooper Lighting), comparable sales grew by 8.4%. LED-based sales accounted for 82% of total sales, including Cooper Lighting.
The gross margin increased by 130 basis points to 39.3%. The adjusted gross margin of 39.7% was 130 basis points higher than last year. Indirect costs as percentage of sales increased by 10 basis points to 33.7%, while the adjusted indirect costs as percentage of sales were 120 basis points lower at 30.8%. Income from operations amounted to EUR 191 million. EBITA amounted to EUR 251 million, which is an increase of 32.3% over last year. When adjusting for EUR 56 million of restructuring costs, partly related to the restructuring of the central organization, EUR 28 million of acquisition-related charges and EUR 12 million of incidental items, the Adjusted EBITA amounted to EUR 347 million, or 10.8% of sales. Net income was EUR 142 million compared with EUR 108 million last year, mainly driven by higher income from operations.
Compared with the end of June 2020, working capital as percentage of sales decreased by 330 basis points to 4.0% of sales, reflecting structural working capital improvement. Net cash from operating activities was EUR 318 million, an increase of EUR 27 million over last year, mainly driven by higher profitability.
Digital SolutionsSales amounted to EUR 1,631 million, reflecting a nominal sales increase of 14.8%, mainly as a result of the consolidation of Cooper Lighting. Comparable sales grew by 5.1%, gradually improving on the back of a stronger COVID-19 impact in 2020.
Income from operations amounted to EUR 65 million. EBITA of EUR 120 million included EUR 41 million of restructuring costs, acquisition-related charges and other incidental costs. Adjusted EBITA amounted to 161 million, resulting in an improvement in the Adjusted EBITA margin of 160 bps to 9.9% which was driven by continued gross margin management and operating leverage.
Digital ProductsSales amounted to EUR 1,128 million, an increase of 12.6% on a nominal basis and an increase of 17.9% on a comparable basis, driven by strong consumer demand.
Income from operations amounted to EUR 135 million. EBITA of EUR 138 million included EUR 10 million of restructuring and other incidental costs. Adjusted EBITA was EUR 148 million. The adjusted EBITA margin improved by 400 basis points to 13.1%, mainly driven by a solid gross margin improvement, benefiting from a strong consumer business.
Conventional ProductsSales amounted to EUR 440 million, a decline of 5.9% on a nominal and 1.2% on a comparable basis, which is estimated to be lower than the market decline and hence results in continued market share gains.
Income from operations and EBITA both increased by EUR 4 million to EUR 88 million. This includes EUR 2 million positive impact of restructuring and other incidental costs. The Adjusted EBITA margin improved by 200 basis points to 19.6%, mainly driven by pricing discipline and operational efficiencies.
OtherReported EBITA amounted to EUR -96 million. This represents amounts not allocated to the operating segments and includes certain costs related to group enabling functions as well as central R&D activities to drive innovation. Adjusted EBITA amounted to EUR -48 million, compared with EUR -46 million in the same period last year. Restructuring and other incidental costs were EUR 48 million, which were mainly related to the restructuring of the central organization.
1Thissectioncontainscertainnon-IFRSfinancialmeasuresandratios,suchascomparablesalesgrowth,EBITA,AdjustedEBITA,freecashflow,andrelatedratios,whicharenotrecognizedmeasuresoffinancialperformanceorliquidityunderIFRS.Forareconciliationofthesenon-IFRSfinancialmeasurestothemostdirectlycomparableIFRSmeasures,see“Reconciliationofnon-IFRSfinancialmeasures”.
13

OutlookSignify continues to expect comparable sales growth of 3% to 6% for the full year 2021. In addition, Signify expects to achieve an Adjusted EBITA margin of 11.5% to 12.5% and free cash flow to exceed 8% of sales for the full year 2021. The company reassesses its medium-term guidance for the period 2021-2023 after each financial year.
14

1 Condensed consolidated financial statements
1.1 Condensed consolidated statement of incomeIn millions of EUR unless otherwise stated
Note Second quarter January to June
2020 2021 2020 2021
Sales 1, 2 1,469 1,609 2,896 3,209
Cost of sales (901) (979) (1,795) (1,949)
Gross margin 568 631 1,101 1,260
Selling, general and administrative expenses (416) (455) (838) (938)
Research and development expenses (67) (71) (136) (143)
Impairment of goodwill — — — —
Other business income 3 4 3 6 16
Other business expenses 3 (1) (2) (3) (4)
Income from operations 87 106 130 191
Financial income 4 8 9 13
Financial expenses (20) (14) (35) (29)
Results relating to investments in associates — — — (1)
Income before taxes 71 99 104 174
Income tax expense 4 10 (17) 4 (32)
Net income 81 82 108 142
Attribution of net income for the period:
Net income (loss) attributable to shareholders of Signify N.V. 79 81 109 140
Net income (loss) attributable to non-controlling interests 2 1 (1) 2
Earnings per ordinary share attributable to shareholders
Weighted average number of ordinary shares outstanding used for calculation (in thousands):
Basic 126,715 124,668 126,646 124,945
Diluted 127,814 128,200 128,008 128,814
Net income attributable to shareholders per ordinary share in EUR:
Basic 0.62 0.65 0.86 1.12
Diluted 0.62 0.63 0.85 1.08
The accompanying notes are an integral part of these condensed consolidated financial statements.
15

1.2 Condensed consolidated statement of comprehensive incomeIn millions of EUR
Second quarter January to June
2020 2021 2020 2021
Net income (loss) 81 82 108 142
Pensions and other post-employment plans:
Remeasurements — — — —
Income tax effect on remeasurements — — — —
Total of items that will not be reclassified to profit or loss — — — —
Currency translation differences:
Net current period change, before tax (81) (34) (113) 113
Income tax effect — — — —
Net investment hedge
Net current period change, before tax 6 8 6 (11)
Income tax effect — — — —
Cash flow hedges:
Net current period change, before tax (9) 6 5 (12)
Income tax effect 2 (2) (1) 3
Total of items that are or may be reclassified to profit or loss (82) (21) (102) 92
Other comprehensive income (loss) (82) (21) (102) 92
Total comprehensive income (loss) (1) 61 6 234
Total comprehensive income (loss) attributable to:
Shareholders of Signify N.V. (1) 61 8 227
Non-controlling interests — — (3) 7
The accompanying notes are an integral part of these condensed consolidated financial statements.
16

1.3 Condensed consolidated statement of financial positionIn millions of EUR
Note December 31, 2020 June 30, 2021
Non-current assets
Property, plant and equipment 1 708 704
Goodwill 1 2,251 2,329
Intangible assets, other than goodwill 1 775 740
Investments in associates 12 12
Financial assets 8 55 43
Deferred tax assets 473 464
Other assets 60 71
Total non-current assets 4,334 4,363
Current assets
Inventories 885 1,120
Other assets 171 229
Derivative financial assets 8 104 63
Income tax receivable 39 35
Trade and other receivables 1,140 1,056
Cash and cash equivalents 8 1,033 945
Assets classified as held for sale 3 3
Total current assets 3,376 3,450
Total assets 7,710 7,814
Equity
Shareholders’ equity 5 2,196 2,018
Non-controlling interests 124 131
Total equity 2,321 2,149
Non-current liabilities
Debt 6 2,221 1,893
Post-employment benefits 390 389
Provisions 7 224 229
Deferred tax liabilities 22 22
Income tax payable 108 104
Other liabilities 159 170
Total non-current liabilities 3,123 2,807
Current liabilities
Debt, including bank overdrafts 6 86 427
Derivative financial liabilities 8 44 21
Income tax payable 20 12
Trade and other payables 1,731 1,935
Provisions 7 172 171
Other liabilities 213 290
Liabilities from assets classified as held for sale — —
Total current liabilities 2,266 2,857
Total liabilities and total equity 7,710 7,814
The accompanying notes are an integral part of these condensed consolidated financial statements.
17

1.4 Condensed consolidated statement of cash flowsIn millions of EUR
Note Second quarter January to June
2020 2021 2020 2021Cash flows from operating activitiesNet income (loss) 81 82 108 142 Adjustments to reconcile net income (loss) to net cash provided by operating activities: 120 139 254 295
• Depreciation, amortization and impairment of non-financial assets 86 81 164 158 • Impairment (reversal) of goodwill, other non-current financial assets and investments in associates — — — —
• Net gain on sale of assets 3 (1) — (1) (11)
• Net interest expense on debt, borrowings and other liabilities 7 7 14 14
• Income tax expense 4 (10) 17 (4) 32
• Additions to (releases of) provisions 7 18 24 47 80
• Additions to (releases of) post-employment benefits 5 5 11 9
• Other items 15 5 23 13
Decrease (increase) in working capital: 22 (3) 74 27
• Decrease (increase) in trade and other receivables 85 13 305 96
• Decrease (increase) in inventories (48) (176) (57) (211)
• Increase (decrease) in trade and other payables (17) 187 (202) 179
• Increase (decrease) in other current assets and liabilities 2 (26) 28 (37)
Increase (decrease) in other non-current assets and liabilities (1) 2 5 11
Utilizations of provisions 7 (39) (41) (82) (82)
Utilizations of post-employment benefits (8) (7) (17) (15)
Net interest and financing costs paid (13) (28) (23) (29)
Income taxes paid — (10) (28) (31)
Net cash provided by (used for) operating activities 163 134 291 318
Cash flows from investing activitiesNet capital expenditures: (5) (30) (21) (46)
• Additions of intangible assets (8) (8) (13) (16)
• Capital expenditures on property, plant and equipment (16) (23) (28) (44)
• Proceeds from disposal of property, plant and equipment 19 1 20 14
Net proceeds from (cash used for) derivatives and other financial assets (4) 23 7 18
Purchases of businesses, net of cash acquired (5) — (1,275) —
Proceeds from sale of businesses, net of cash disposed of 2 — 2 —
Net cash provided by (used for) investing activities (11) (7) (1,288) (28)
Cash flows from financing activitiesDividend paid 5 — (292) — (294)
Proceeds from issuance of debt 6 1,280 — 3,735 350
Repayment of debt 6 (1,311) (19) (2,529) (391)
Purchase of treasury shares 5 — (48) (6) (72)
Net cash provided by (used for) financing activities (31) (360) 1,201 (407) Net cash flows 121 (233) 205 (117) Effect of changes in exchange rates on cash and cash equivalents and bank overdrafts (24) (16) (29) 30 Cash and cash equivalents and bank overdrafts at the beginning of the period 1 919 1,191 840 1,030
Cash and cash equivalents and bank overdrafts at the end of the period 2 1,016 943 1,016 943
Non-cash investing and financing activities:Acquisition of fixed asset by means of leases 8 12 17 34
1 For Q2 2021 and Q2 2020, included bank overdrafts of EUR 1 million and EUR 5 million, respectively. For the first half of 2021 and 2020, included bank overdrafts of EUR 3 million and EUR 7 million, respectively.2 Included bank overdrafts of EUR 2 million and EUR 10 million as at June 30, 2021 and 2020, respectively.
The accompanying notes are an integral part of these condensed consolidated financial statements.
18

1.5 Condensed consolidated statements of changes in equityIn millions of EUR
Sharecapital
Sharepremium
Retained earnings
Currency translation
differencesCash flow
hedgesTreasury
shares
Total share-
holders' equity
Non-controlling
interests Equity
Balance as at January 1, 2020 1 2,195 53 7 (7) (68) 2,181 142 2,324
Net Income — — 109 — — — 109 (1) 108
Other comprehensive income (loss) — — — (105) 4 — (101) (2) (102)
Total comprehensive income (loss) — — 109 (105) 4 — 8 (3) 6
Movement in non-controlling interests — — — — — — — 1 1
Purchase of treasury shares — — — — — (6) (6) — (6)
Delivery of treasury shares — (29) (2) — — 31 — — —
Share-based compensation plans — 16 — — — — 16 — 16
Balance as at June 30, 2020 1 2,182 160 (98) (3) (42) 2,201 141 2,341
Balance as at January 1, 2021 1 2,201 387 (337) 17 (74) 2,196 124 2,321
Net Income — — 140 — — — 140 2 142
Other comprehensive income (loss) — — — 97 (10) — 88 5 92
Total comprehensive income (loss) — — 140 97 (10) — 227 7 234
Movement in non-controlling interests — — — — — — — — —
Dividend distributed — — (343) — — — (343) — (343)
Purchase of treasury shares — — 7 — — (83) (77) — (77)
Delivery of treasury shares — (57) 26 — — 30 — — —
Share-based compensation plans — 15 — — — — 15 — 15
Balance as at June 30, 2021 1 2,159 217 (239) 8 (127) 2,018 131 2,149
The accompanying notes are an integral part of these condensed consolidated financial statements.
19
2 Notes to the consolidated interim financial statements
All amounts are in millions of euros unless otherwise stated. Due to rounding, amounts may not add up to totals provided.
2.1 Reporting entitySignify N.V. is a public company with limited liability incorporated under the laws of the Netherlands and listed on Euronext Amsterdam under the symbol ‘LIGHT’.
As used herein, the term Signify is used for Signify N.V. (the 'Company’) and its subsidiaries within the meaning of Section 2:24b of the Dutch Civil Code.
The corporate seat of the Company is in Eindhoven, the Netherlands and its registered office is at High Tech Campus 48, 5656 AE Eindhoven. The Company is registered in the Commercial Register of the Chamber of Commerce under number 65220692.
2.2 Basis of preparationThe condensed consolidated interim financial statements have been prepared in accordance with IAS 34 ‘Interim Financial Reporting’ as adopted by the European Union. Several other amendments apply to the accounting standards for the first time in 2021, but do not have an impact on the condensed consolidated interim financial statements of Signify.
The income tax expense is recognized based on management’s estimate of the weighted average effective annual income tax rate expected for the full year.
The accounting policies applied in the condensed consolidated interim financial statements are consistent with those applied in chapter 14.6 of the Consolidated financial statements for the year ended December 31, 2020.
Impact of the COVID-19 pandemicThe COVID-19 pandemic has created an unprecedented situation globally. From the outset, Signify has taken considerable action focused on the health and safety of its employees, on customer engagement and supply chain continuity and on free cash flow generation and operating expenses optimization.
Signify continues to closely monitor the development of the COVID-19 outbreak by analyzing the risks which the pandemic imposes for its financial results, position and cash flows and implementing mitigating actions promptly.
In Signify's Consolidated financial statements for the year ended December 31, 2020, Signify included an analysis of the impact of COVID-19 on certain areas where the most significant judgments and estimates are made. During the six-month period ended June 30, 2021, no significant events and transactions were identified which resulted in an update of the previous views and observations disclosed.
Signify has not identified events during the six-month period ended June 30, 2021 that required an update of the goodwill impairment tests that were performed in the fourth quarter of 2020.
Critical accounting judgments and key sources of estimation uncertainty The preparation of the condensed consolidated interim financial statements requires management to make judgments, estimates and assumptions that affect the application of accounting policies and the reported amounts of assets, liabilities, income and expenses. Actual results may differ from the estimates.
The areas where the most significant judgments and estimates are made, were the same as those disclosed in Signify’s Consolidated financial statements for the year ended December 31, 2020.
20

2.3 Notes
1 Information by segment and main country
The following is an overview of Signify revenues and results by segment:
Second Quarter January to June
Digital Solutions5
Digital Products
Conventional
Products Other4
Intersegment
elimination SignifyDigital
Solutions5Digital
Products
Conventional
Products Other4
Intersegment
elimination Signify
2021
Sales to external customers
837 553 213 6 1,609 1,631 1,128 440 10 3,209
Sales including intersegment 838 605 215 6 (55) 1,609 1,632 1,231 444 11 (110) 3,209
Depreciation and amortization1 (20) (7) (4) (20) (51) (41) (14) (8) (35) (98)
EBITA2 72 63 35 (34) 136 120 138 88 (96) 251
EBITA as a % of sales 8.6% 11.3% 16.4% 8.4% 7.4% 12.3% 20.0% 7.8%
Amortization3 (30) (60)
Income from operations 44 61 35 (34) 106 65 135 88 (97) 191
Financial income and expenses (7) (16)
Results from investments in associates — (1)
Income before taxes 99 174
2020
Sales to external customers
781 473 211 4 1,469 1,420 1,002 468 6 2,896
Sales including intersegment 781 515 212 4 (44) 1,469 1,421 1,084 471 6 (87) 2,896
Depreciation and amortization1 (22) (7) (8) (17) (54) (37) (14) (18) (35) (105)
EBITA2 59 43 45 (28) 119 77 81 84 (53) 189
EBITA as a % of sales 7.6% 9.1% 21.2% 8.1% 5.4% 8.1% 17.9% 6.5%
Amortization3 (32) (59)
Income from operations 29 41 45 (28) 87 23 77 84 (53) 130
Financial income and expenses (16) (26)
Results from investments in associates — —
Income before taxes 71 104 1 Excluding amortization and impairments of acquisition related intangible assets and goodwill2 Income from operations excluding amortization and impairments of acquisition related intangible assets and goodwill ("EBITA")3 Amortization and impairments of acquisition related intangible assets and goodwill4 Considering the nature of Other, EBITA as a % of sales for Other is not meaningful5 Includes Cooper Lighting from March 1, 2020
Sales between the segments mainly relate to the supply of goods. The pricing of such transactions is determined on an ‘arm’s length basis’. Sales and tangible and intangible assets are reported based on the country of origin as follows:
SalesTangible and intangible
assets1
January to June 20202
January to June 2021
December 31, 2020
June 30, 2021
Netherlands 228 249 466 470
United States 923 1,010 2,261 2,283
China 258 256 291 306
Germany 179 184 14 13
France 104 123 13 12
Canada 90 112 44 50
India 91 112 31 36
Other countries 1,024 1,163 615 604
Total countries 2,896 3,209 3,734 3,773
1 Includes goodwill2 Includes Cooper Lighting from March 1, 2020
2 Disaggregated revenue information
Information on sales per segment is disclosed in note 1, Information by segment and main country. For the six-month period ended June 30, 2021, sales consisted primarily (96%) of sales of goods to customers (January to June 2020: 97%).Sales by market:
Second quarter2 January to June2
2020 2021 2020 2021
Europe 406 477 908 999
Americas 1 619 623 1,104 1,211
Rest of the world 323 377 647 747
Global businesses 122 133 237 251
Total 1,469 1,609 2,896 3,209
1 Includes Cooper Lighting from March 1, 20202 Wiz Connected is included in Market Groups Europe, Americas and Rest
of the world (was previously part of Global businesses)
21

3 Other business income and expenses
Other business income and expenses consists of the following:
January to June
2020 2021
Result on disposal of businesses:
• Income — —
• Expense — —
Result on disposal of fixed assets:
• Income 2 11
• Expense — —
Result on other remaining businesses:
• Income 4 5
• Expense (2) (4)
Other business income and expenses 3 12
Total other business income 6 16
Total other business expense (3) (4)
For the six-month period ended June 30, 2021, the result on disposal of fixed assets includes a EUR 10 million income related to a sale of real estate in Conventional Products, in India.
4 Income taxes
The income tax expense in the first six months of 2021 increased by EUR 36 million compared to the corresponding period of the previous year.
The effective tax rate for the six-month period ended June 30, 2021, was 18.5% compared to (3.6%) in 2020. The increase in the effective tax rate is mainly caused by one-time non cash tax benefits from changes in the organizational structure in the first six months of 2020.
5 Equity
Dividend distributionIn June 2021, the Company settled an extraordinary dividend of EUR 1.35 per ordinary share, representing a total value of EUR 169 million including costs. In addition, the Company also settled the regular dividend of EUR 1.40 per ordinary share, representing a total value of EUR 175 million including costs. An amount of EUR 292 million was paid in cash in June and the remaining dividend tax liability of EUR 49 million presented in Other liabilities as at June 30, 2021 was paid in July.
Share repurchasesBetween February and May 2021, the Company purchased shares to cover obligations arising from its long-term incentive performance share plans and other employee share plans. The total number of shares repurchased was 1,937,489 for a total consideration of EUR 83 million.
An adjustment to dividend withholding tax liability, in connection with the Company’s purchase of treasury shares for capital reduction purposes in 2018, is recorded in retained earnings.
Treasury sharesAs at June 30, 2021, the total number of treasury shares amounted to 3,512,890 which were purchased at an average price of EUR 36.23 per share.
6 Debt
In millions of EUR December
31, 2020June 30,
2021
Facility (EUR) 389 40
Facility (USD) 406 418
Eurobonds 1,262 1,263
Lease liabilities 233 234
Other Debt 15 363
Subtotal 2,305 2,318
Bank overdrafts 3 2
Gross debt 2,307 2,320
Cash and cash equivalents (1,033) (945)
Net debt (cash) 1,275 1,375
Total equity 2,321 2,149
Net debt and total equity 3,595 3,524
Net debt divided by net debt and total equity (in %) 35 % 39 %
Total equity divided by net debt and total equity (in %) 65 % 61 %
In March 2021, Signify refinanced EUR 350 million of its long-term facility with short-term loans maturing in December 2021, which are included in "Other Debt" in the table above.
As of June 2021, our long-term facilities consist of EUR 40 million and USD 275 million maturing in January 2023, and USD 225 million maturing in January 2025.
7 Provisions
Additions to restructuring provisions during the six-month period ended June 30, 2021 were mainly related to the restructuring of the central organization.
22

Provisions are summarized as follows:
In millions of EURRestructuring
provisionsEnvironmental
ProvisionsProduct
warrantyOther
provisions TotalBalance as at January 1, 2021 84 109 70 133 396 Additions 52 7 14 22 96
Utilizations (33) (11) (20) (19) (82)
Acquisitions — — — — —
Releases (12) — — (3) (15)
Changes in discount rate — — — — —
Accretion — — — — —
Translation differences and other movements 1 1 2 3 6
Balance as at June 30, 2021 92 107 66 136 400 Short-term 78 22 33 38 171
Long-term 14 84 32 98 229
8 Financial assets and liabilities
Financial risk managementThe Company’s financial risk management objectives and policies are consistent with those disclosed in the Consolidated financial statements for the year ended December 31, 2020.
Fair value hierarchyThe valuation techniques and inputs used to develop measurements for financial assets and liabilities are consistent with those disclosed in the Consolidated financial statements for the year ended December 31, 2020.
Carried at
Gross amount recognised
on the balance
sheet
Amounts not offset on the
balance sheet, but are subject
to master netting
arrangements Net amount
Fair value hierarchy
levelEstimated fair
value
Balance as at December 31, 2020
Non-current financial assets1 amortised cost 34 — 34 34
Unquoted equity shares fair value (FVOCI) 3 — 3 3 3
Trade and other receivables1 amortised cost 1,140 — 1,140 1,140
Derivative financial assets designated as hedging instruments fair value (FVTPL) 122 (41) 81 2 122
Derivative financial assets not designated as hedging instruments fair value (FVTPL) — — — 3 9
Cash and cash equivalents 1,033 — 1,033 1,033
Debt (Eurobonds) amortised cost (1,262) — (1,262) 1 (1,378)
Debt (excluding Eurobonds)1 amortised cost (1,046) — (1,046) 2 (1,046)
Derivative financial liabilities designated as hedging instruments fair value (FVTPL) (45) 41 (4) 2 (45)
Trade and other payables1 amortised cost (1,727) — (1,727) (1,727)
Contingent considerations fair value (FVTPL) (4) — (4) 3 (4)
Balance as at June 30, 2021
Non-current financial assets1 amortised cost 34 — 34 34
Unquoted equity shares fair value (FVOCI) 3 — 3 3 3
Trade and other receivables1 amortised cost 1,056 — 1,056 1,056
Derivative financial assets designated as hedging instruments fair value (FVTPL) 64 (21) 43 2 64 Derivative financial assets not designated as hedging instruments fair value (FVTPL) 6 — 6 3 14
Cash and cash equivalents 945 — 945 945
Debt (Eurobonds) amortised cost (1,263) — (1,263) 1 (1,375)
Debt (excluding Eurobonds)1 amortised cost (1,057) — (1,057) 2 (1,057)
Derivative financial liabilities designated as hedging instruments fair value (FVTPL) (22) 21 (1) 2 (22)
Trade and other payables1 amortised cost (1,933) — (1,933) (1,933)
Contingent considerations fair value (FVTPL) (2) — (2) 3 (2)
1 In view of the nature, maturity or the magnitude of the amounts, Signify considers that the fair value of non-current financial assets, trade and other receivables, debt (excluding Eurobonds), trade and other payables are not materially different from their carrying value.
23

9 Events after the balance sheet date
On July 1, 2021, Signify acquired Telensa Holdings Ltd, a UK-based expert in wireless monitoring and control systems for smart cities. Telensa is headquartered in Cambridge, UK, employs 58 people and had preliminary sales of GBP 11 million for the year ending March 2021. The acquisition supports Signify’s strategic priority to grow in professional systems and services.
24

Appendix B - Reconciliation of non-IFRS financial measures
Sales growth composition per business in %
Second quarter
Comparable growth Currency effects
Consolidation and other changes Nominal growth
2021 vs 2020
Digital Solutions 12.6 (5.4) 0.0 7.2
Digital Products 20.4 (3.5) 0.0 16.9
Conventional Products 4.7 (3.5) 0.0 1.2
Total 14.1 (4.5) 0.0 9.6
January to June
Comparable growth Currency effects
Consolidation and other changes Nominal growth
2021 vs 2020
Digital Solutions 5.1 (6.1) 15.9 14.8
Digital Products 17.9 (5.0) (0.3) 12.6
Conventional Products (1.2) (4.6) (0.1) (5.9)
Total 8.4 (5.5) 8.0 10.8
Sales growth composition per market in %
Second quarter
Comparable growth Currency effects
Consolidation and other changes Nominal growth
2021 vs 2020
Europe 17.5 0.0 0.1 17.5
Americas 9.4 (8.3) (0.4) 0.7
Rest of the world 20.8 (3.6) (0.2) 17.0
Global businesses 8.1 (1.6) 2.5 8.9
Total 14.1 (4.5) 0.0 9.6
January to June
Comparable growth Currency effects
Consolidation and other changes Nominal growth
2021 vs 2020
Europe 11.2 (0.9) (0.2) 10.1
Americas 0.3 (8.7) 18.1 9.7
Rest of the world 21.8 (6.6) 0.1 15.4
Global businesses 5.0 (2.2) 3.3 6.1
Total 8.4 (5.5) 8.0 10.8
Amounts may not add up due to rounding.
25

Adjusted EBITA to Income from operations (or EBIT) in millions of EUR
SignifyDigital
SolutionsDigital
ProductsConventional
Products Other
Second quarter 2021
Adjusted EBITA 175 89 66 40 (20)
Restructuring (9) — — 4 (13)
Acquisition-related charges (13) (13) — — —
Incidental items (16) (4) (4) (8) 0
EBITA 136 72 63 35 (34)
Amortization 1 (30) (28) (2) — —
Income from operations (or EBIT) 106 44 61 35 (34)
Second quarter 2020
Adjusted EBITA 133 75 44 37 (23)
Restructuring (2) (1) — 1 (2)
Acquisition-related charges (15) (14) — — —
Incidental items 4 — 0 7 (2)
EBITA 119 59 43 45 (28)
Amortization 1 (32) (30) (2) — —
Income from operations (or EBIT) 87 29 41 45 (28)
1 Amortization and impairments of acquisition related intangible assets and goodwill.
SignifyDigital
SolutionsDigital
ProductsConventional
Products Other
January to June 2021
Adjusted EBITA 347 161 148 86 (48)
Restructuring (56) (7) (3) 1 (47)
Acquisition-related charges (28) (27) — — —
Incidental items (12) (6) (6) — (1)
EBITA 251 120 138 88 (96)
Amortization 1 (60) (56) (3) — (1)
Income from operations (or EBIT) 191 65 135 88 (97)
January to June 2020
Adjusted EBITA 245 118 91 82 (46)
Restructuring (15) (5) (4) (2) (4)
Acquisition-related charges (33) (31) (2) — —
Incidental items (7) (4) (4) 3 (2)
EBITA 189 77 81 84 (53)
Amortization 1 (59) (55) (4) — (1)
Income from operations (or EBIT) 130 23 77 84 (53)
1 Amortization and impairments of acquisition related intangible assets and goodwill.
Amounts may not add up due to rounding.
26

Second quarter 2021 Income from operations to Adjusted EBITA in millions of EUR
Reported Restructuring
Acquisition related
chargesIncidental
items 1 Adjusted
Second quarter 2021
Sales 1,609 — — — 1,609
Cost of sales (979) (1) 2 7 (971)
Gross margin 631 (1) 2 7 638
Selling, general and administrative expenses (455) 10 13 8 (423)
Research and development expenses (71) 1 — — (70)
Indirect costs (526) 11 13 8 (493)
Impairment of goodwill — — — — —
Other business income 3 — (2) (1) 1
Other business expenses (2) — — 1 (1)
Income from operations 106 9 13 16 145
Amortization (30) — — — (30)
Income from operations excluding amortization (EBITA) 136 9 13 16 175
Second quarter 2020
Sales 1,469 — — — 1,469
Cost of sales (901) (1) 7 (7) (901)
Gross margin 568 (1) 7 (7) 567
Selling, general and administrative expenses (416) 3 8 4 (401)
Research and development expenses (67) — — — (67)
Indirect costs (483) 3 8 4 (468)
Impairment of goodwill — — — — —
Other business income 4 — — (1) 2
Other business expenses (1) — — — (1)
Income from operations 87 2 15 (4) 100
Amortization (32) — — — (32)
Income from operations excluding amortization (EBITA) 119 2 15 (4) 133
1 Incidental items are non-recurring by nature and relate to separation, transformation, net real estate gains, environmental provision for inactive sites and the effect of changes in discount rates on long-term provisions.
Amounts may not add up due to rounding.
27

January to June 2021 Income from operations to Adjusted EBITA in millions of EUR
Reported Restructuring
Acquisition related
chargesIncidental
items 1 Adjusted
January to June 2021
Sales 3,209 — — — 3,209
Cost of sales (1,949) 4 4 7 (1,933)
Gross margin 1,260 4 4 7 1,275
Selling, general and administrative expenses (938) 53 25 14 (847)
Research and development expenses (143) 0 — — (142)
Indirect costs (1,081) 52 25 14 (989)
Impairment of goodwill — — — — —
Other business income 16 — (2) (11) 4
Other business expenses (4) — 0 2 (2)
Income from operations 191 56 28 12 288
Amortization (60) — — — (60)
Income from operations excluding amortization (EBITA) 251 56 28 12 347
January to June 2020
Sales 2,896 — — — 2,896
Cost of sales (1,795) 3 13 (5) (1,784)
Gross margin 1,101 3 13 (5) 1,112
Selling, general and administrative expenses (838) 11 19 14 (794)
Research and development expenses (136) 1 — — (134)
Indirect costs (973) 12 19 14 (928)
Impairment of goodwill — — — — —
Other business income 6 — — (1) 4
Other business expenses (3) — — — (3)
Income from operations 130 15 33 7 186
Amortization (59) — — — (59)
Income from operations excluding amortization (EBITA) 189 15 33 7 245
1 Incidental items are non-recurring by nature and relate to separation, transformation, net real estate gains, environmental provision for inactive sites and the effect of changes in discount rates on long-term provisions.
Amounts may not add up due to rounding.
28

Composition of cash flows in millions of EUR
Second quarter January to June
2020 2021 2020 2021
Cash flows from operating activities 163 134 291 318
Cash flows from investing activities (11) (7) (1,288) (28)
Cash flows before financing activities 151 127 (996) 290
Cash flows from operating activities 163 134 291 318
Net capital expenditures: (5) (30) (21) (46)
• Additions of intangible assets (8) (8) (13) (16)
• Capital expenditures on property, plant and equipment (16) (23) (28) (44)
• Proceeds from disposal of property, plant and equipment 19 1 20 14
Free cash flows 158 104 270 272
Working capital to total assets in millions of EUR
June 30, 2020
December 31, 2020
June 30, 2021
Working capital 452 313 269
Eliminate liabilities comprised in WoCa:
• Trade and other payables 1,659 1,731 1,935
• Derivative financial liabilities 34 44 21
• Other current liabilities 1 223 213 242
Include assets not comprised in WoCa:
• Non-current assets 4,641 4,334 4,363
• Income tax receivable 59 39 35
• Cash and cash equivalents 1,026 1,033 945
• Assets classified as held for sale — 3 3
Total assets 8,094 7,710 7,814
1 Other current liabilities excluding EUR 49 million of dividend related payables as of June 30, 2021.
29

Appendix C – Financial glossaryAcquisition-related chargesCosts that are directly triggered by the acquisition of a company, such as transaction costs, purchase accounting related costs and integration-related expenses.
Adjusted EBITAEBITA excluding restructuring costs, acquisition-related charges and other incidental charges.
Adjusted EBITA marginAdjusted EBITA divided by sales to third parties (excluding intersegment).
Adjusted gross marginGross margin, excluding restructuring costs, acquisition-related charges and other incidental items attributable to cost of sales.
Adjusted indirect costsIndirect costs, excluding restructuring costs, acquisition-related charges and other incidental items attributable to indirect costs.
Adjusted R&D expensesResearch and development expenses, excluding restructuring costs, acquisition-related charges and other incidental items attributable to research and development expenses.
Adjusted SG&A expensesSelling, general and administrative expenses, excluding restructuring costs, acquisition-related charges and other incidental items attributable to selling, general and administrative expenses.
Changes in scopeConsolidation effects related to acquisitions (mainly Cooper Lighting).
Comparable sales growth (CSG)The period-on-period growth in sales excluding the effects of currency movements and changes in consolidation and other changes.
EBITIncome from operations.
EBITAIncome from operations excluding amortization and impairment of acquisition related intangible assets and goodwill.
EBITDAIncome from operations excluding depreciation, amortization and impairment of non-financial assets.
Effects of changes in consolidation and other changesIn the event a business is acquired (or divested), the impact of the consolidation (or de-consolidation) on the Group’s figures is included (or excluded) in the calculation of the comparable sales growth figures. Other changes include regulatory changes and changes originating from new accounting standards.
Effects of currency movementsCalculated by translating the foreign currency financials of the previous period and the current period into euros at the same average exchange rates.
EmployeesEmployees of Signify at period end expressed on a full-time equivalent (FTE) basis.
Free cash flowNet cash provided by operating activities minus net capital expenditures. Free cash flow includes interest paid and income taxes paid.
Gross marginSales minus cost of sales.
Incidental chargesAny item with an income statement impact (loss or gain) that is deemed to be both significant and not part of normal business activity. Other incidental items may extend over several quarters within the same financial year.
Indirect costsThe sum of selling, general and administrative expenses and R&D expenses.
Net capital expendituresAdditions of intangible assets, capital expenditures on property, plant and equipment and proceeds from disposal of property, plant and equipment.
Net debtShort-term debt, long-term debt minus cash and cash equivalents.
Net leverage ratioThe ratio of consolidated reported net debt to consolidated reported EBITDA for the purpose of calculating the financial covenant.
R&D expensesResearch and development expenses.
Restructuring costsThe estimated costs of initiated reorganizations, the most significant of which have been approved by the group, and which generally involve the
30

realignment of certain parts of the industrial and commercial organization.
SG&A expensesSelling, general and administrative expenses.
Working capitalThe sum of inventories, trade and other receivables, other current assets, derivative financial assets minus the sum of trade and other payables, derivative financial liabilities and other current liabilities (excluding dividend related payables).
31