practical test answer sheets - ijsoweb.org · signature: 14th ijso 2017, nijmegen, the netherlands...
TRANSCRIPT
Water and sustainability
Practical Test
Answer sheets
December, 9th 2017
Signature:
14th IJSO 2017, Nijmegen, The Netherlands ‒ Practical test ‒ Dec. 9th 2017 Biology - Paramecium – answer sheets page 2 of 28
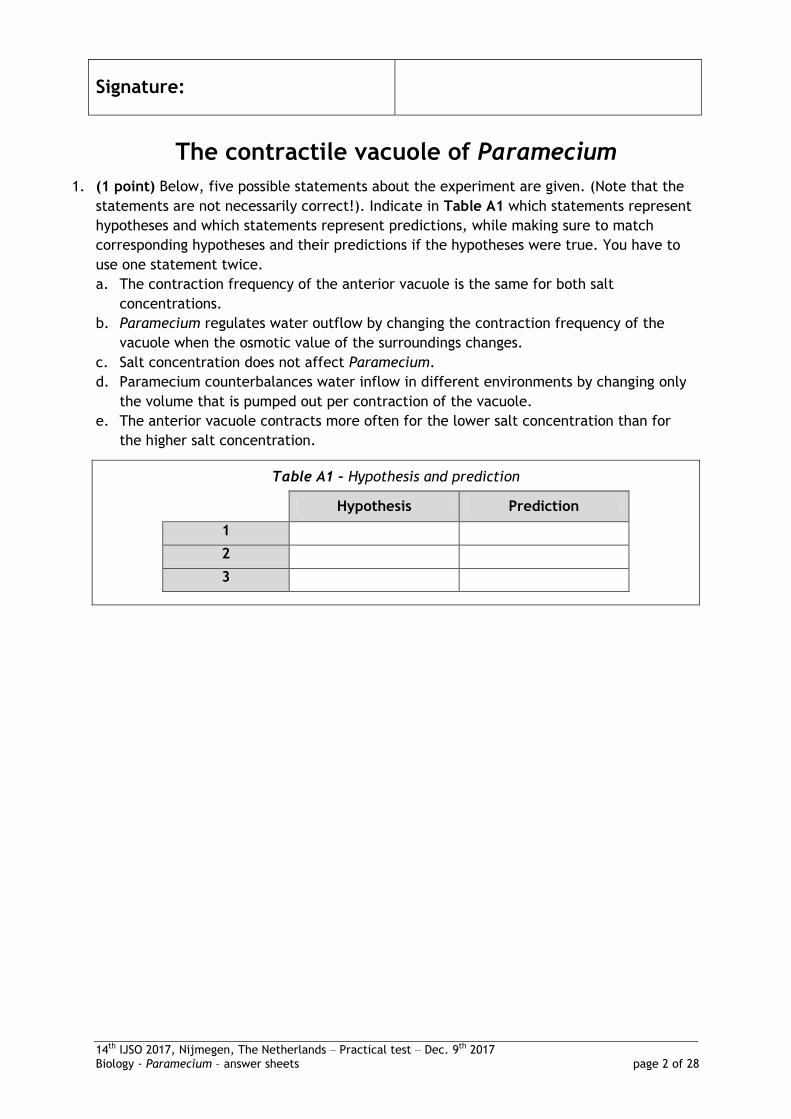
The contractile vacuole of Paramecium
1. (1 point) Below, five possible statements about the experiment are given. (Note that the
statements are not necessarily correct!). Indicate in Table A1 which statements represent
hypotheses and which statements represent predictions, while making sure to match
corresponding hypotheses and their predictions if the hypotheses were true. You have to
use one statement twice.
a. The contraction frequency of the anterior vacuole is the same for both salt
concentrations.
b. Paramecium regulates water outflow by changing the contraction frequency of the
vacuole when the osmotic value of the surroundings changes.
c. Salt concentration does not affect Paramecium.
d. Paramecium counterbalances water inflow in different environments by changing only
the volume that is pumped out per contraction of the vacuole.
e. The anterior vacuole contracts more often for the lower salt concentration than for
the higher salt concentration.
Table A1 – Hypothesis and prediction
Hypothesis Prediction
1
2
3
Signature:
14th IJSO 2017, Nijmegen, The Netherlands ‒ Practical test ‒ Dec. 9th 2017 Biology - Paramecium – answer sheets page 3 of 28
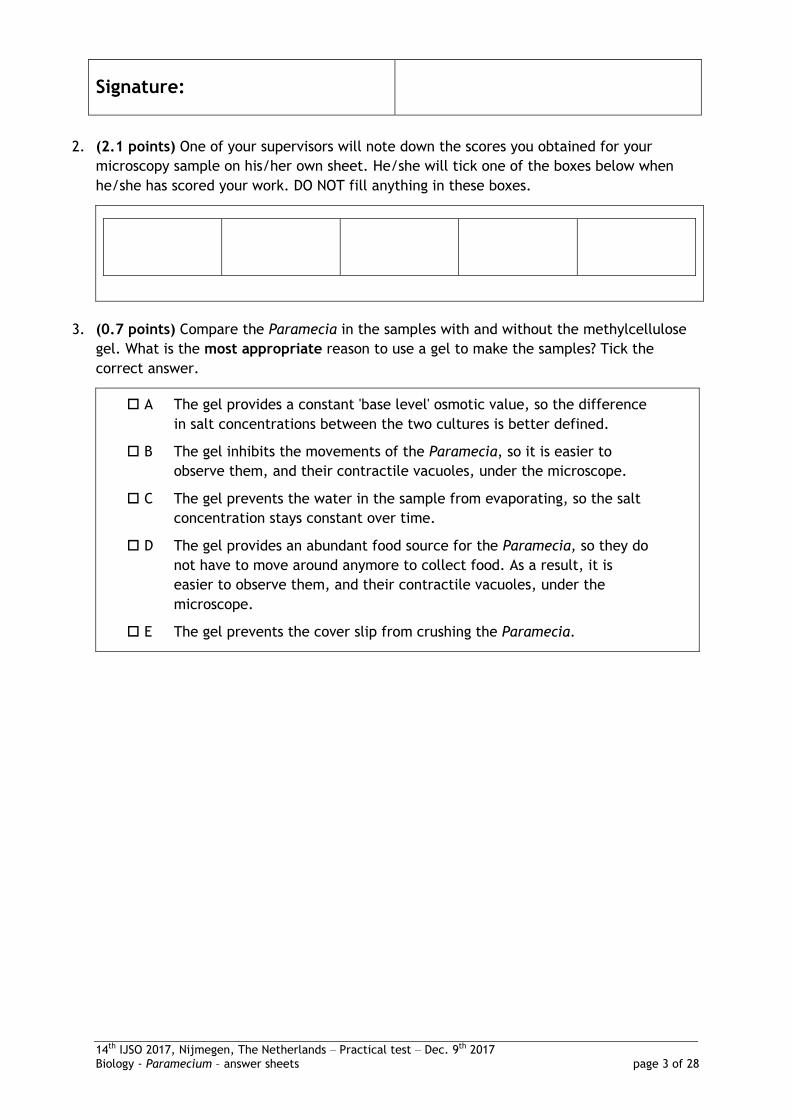
2. (2.1 points) One of your supervisors will note down the scores you obtained for your
microscopy sample on his/her own sheet. He/she will tick one of the boxes below when
he/she has scored your work. DO NOT fill anything in these boxes.
3. (0.7 points) Compare the Paramecia in the samples with and without the methylcellulose
gel. What is the most appropriate reason to use a gel to make the samples? Tick the
correct answer.
A The gel provides a constant 'base level' osmotic value, so the difference
in salt concentrations between the two cultures is better defined.
B The gel inhibits the movements of the Paramecia, so it is easier to
observe them, and their contractile vacuoles, under the microscope.
C The gel prevents the water in the sample from evaporating, so the salt
concentration stays constant over time.
D The gel provides an abundant food source for the Paramecia, so they do
not have to move around anymore to collect food. As a result, it is
easier to observe them, and their contractile vacuoles, under the
microscope.
E The gel prevents the cover slip from crushing the Paramecia.
Signature:
14th IJSO 2017, Nijmegen, The Netherlands ‒ Practical test ‒ Dec. 9th 2017 Biology - Paramecium – answer sheets page 4 of 28
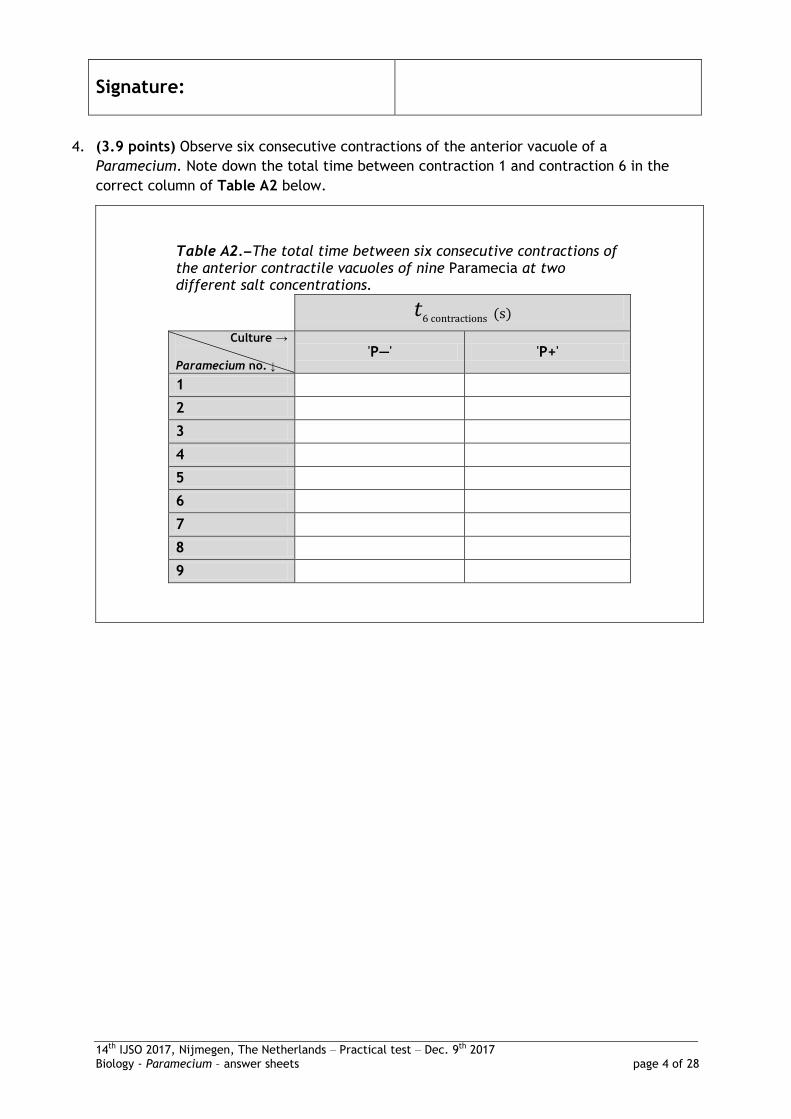
4. (3.9 points) Observe six consecutive contractions of the anterior vacuole of a
Paramecium. Note down the total time between contraction 1 and contraction 6 in the
correct column of Table A2 below.
Table A2. The total time between six consecutive contractions of the anterior contractile vacuoles of nine Paramecia at two different salt concentrations.
Culture →
Paramecium no. ↓
'P—' 'P+'
1
2
3
4
5
6
7
8
9
Signature:
14th IJSO 2017, Nijmegen, The Netherlands ‒ Practical test ‒ Dec. 9th 2017 Biology - Paramecium – answer sheets page 5 of 28
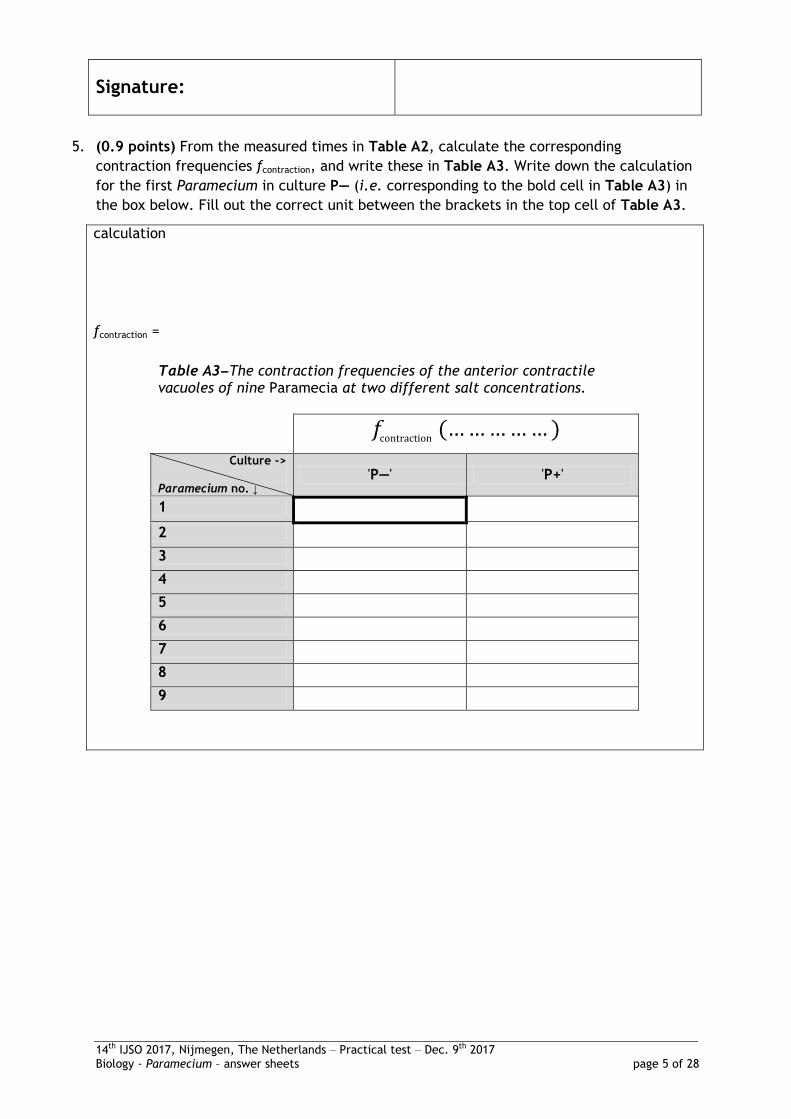
5. (0.9 points) From the measured times in Table A2, calculate the corresponding
contraction frequencies fcontraction, and write these in Table A3. Write down the calculation
for the first Paramecium in culture P— (i.e. corresponding to the bold cell in Table A3) in
the box below. Fill out the correct unit between the brackets in the top cell of Table A3.
calculation
fcontraction =
Table A3 The contraction frequencies of the anterior contractile vacuoles of nine Paramecia at two different salt concentrations.
Culture -> Paramecium no. ↓
'P—' 'P+'
1
2
3
4
5
6
7
8
9
Signature:
14th IJSO 2017, Nijmegen, The Netherlands ‒ Practical test ‒ Dec. 9th 2017 Biology - Paramecium – answer sheets page 6 of 28
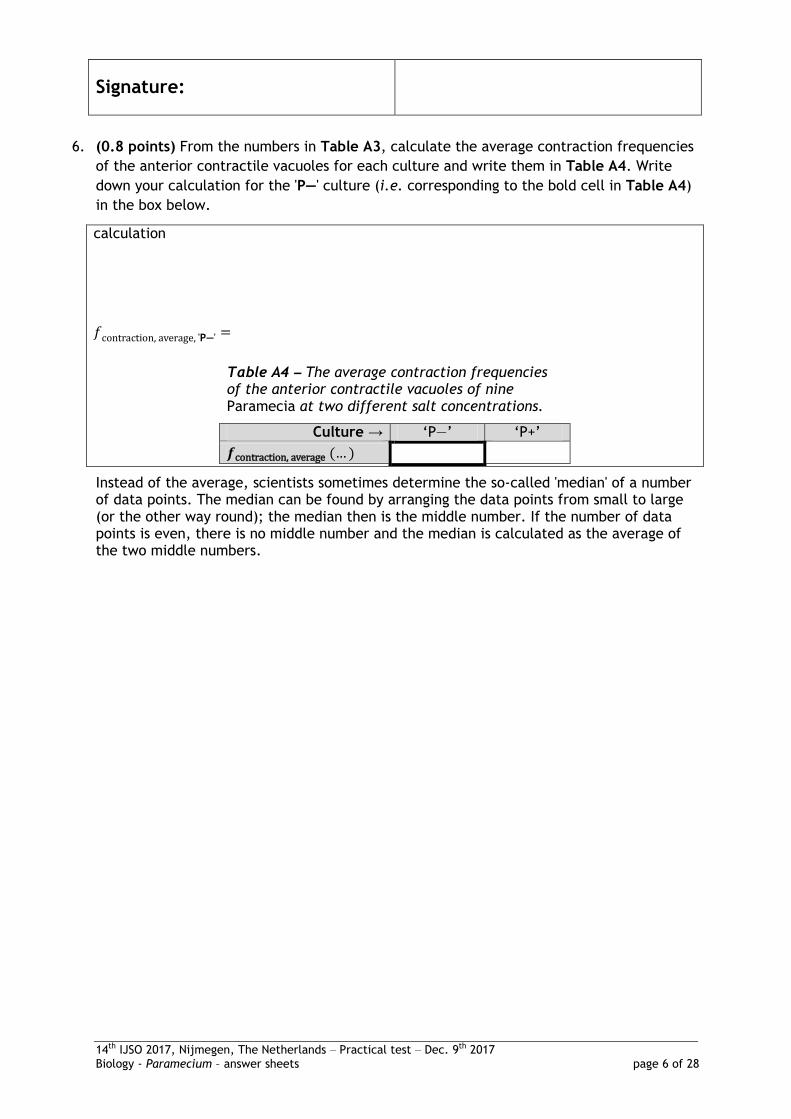
6. (0.8 points) From the numbers in Table A3, calculate the average contraction frequencies
of the anterior contractile vacuoles for each culture and write them in Table A4. Write
down your calculation for the 'P—' culture (i.e. corresponding to the bold cell in Table A4)
in the box below.
calculation
—
Table A4 The average contraction frequencies of the anterior contractile vacuoles of nine Paramecia at two different salt concentrations.
Culture → ‘P—’ ‘P+’
Instead of the average, scientists sometimes determine the so-called 'median' of a number of data points. The median can be found by arranging the data points from small to large (or the other way round); the median then is the middle number. If the number of data points is even, there is no middle number and the median is calculated as the average of the two middle numbers.
Signature:
14th IJSO 2017, Nijmegen, The Netherlands ‒ Practical test ‒ Dec. 9th 2017 Biology - Paramecium – answer sheets page 7 of 28
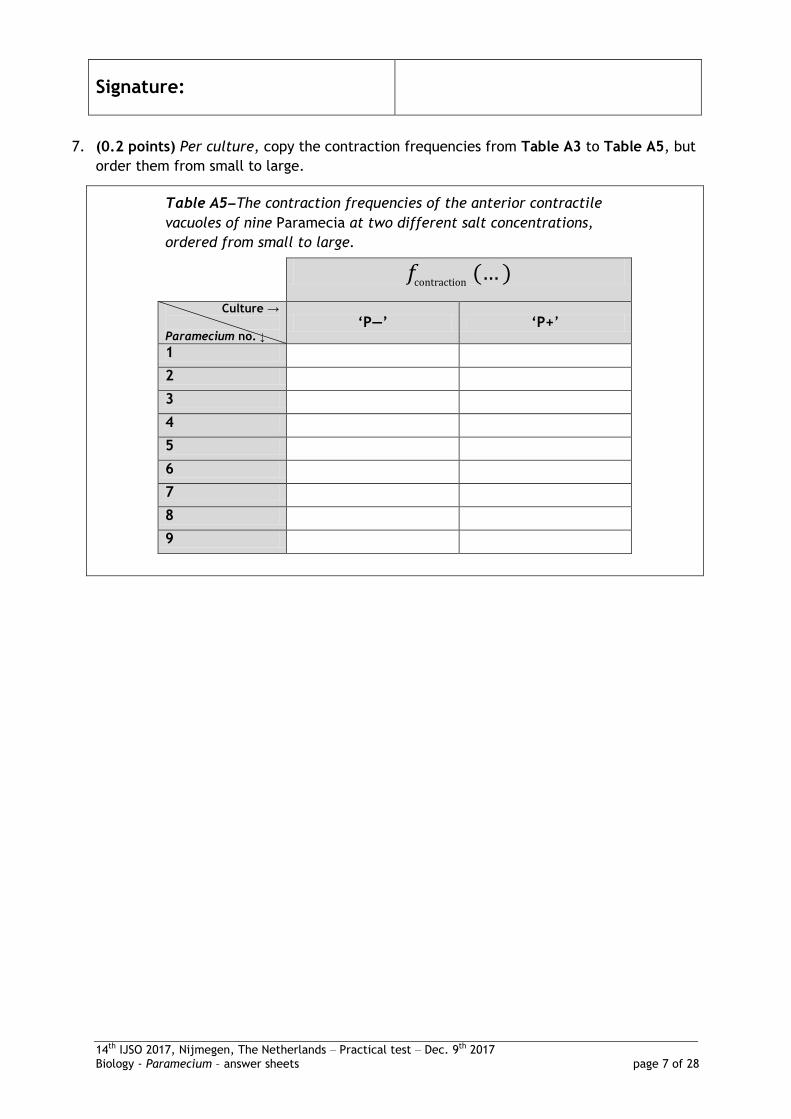
7. (0.2 points) Per culture, copy the contraction frequencies from Table A3 to Table A5, but
order them from small to large.
Table A5 The contraction frequencies of the anterior contractile
vacuoles of nine Paramecia at two different salt concentrations,
ordered from small to large.
Culture →
Paramecium no. ↓ ‘P—’ ‘P+’
1
2
3
4
5
6
7
8
9
Signature:
14th IJSO 2017, Nijmegen, The Netherlands ‒ Practical test ‒ Dec. 9th 2017 Biology - Paramecium – answer sheets page 8 of 28
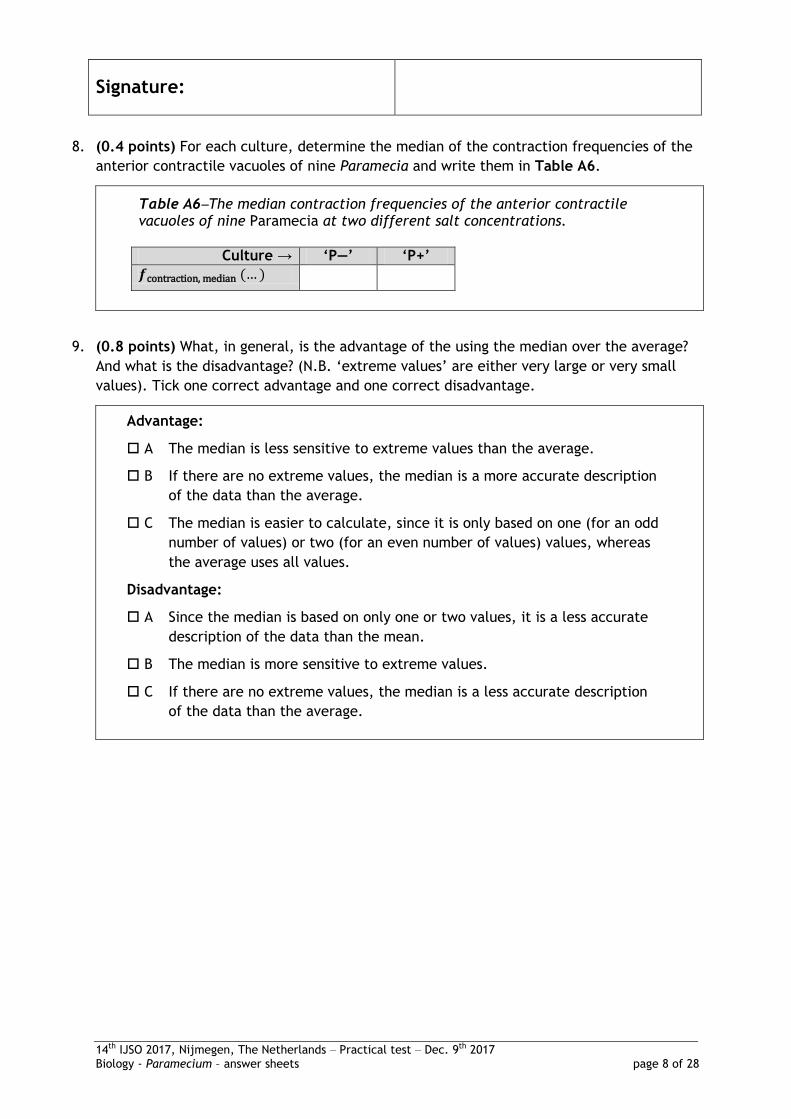
8. (0.4 points) For each culture, determine the median of the contraction frequencies of the
anterior contractile vacuoles of nine Paramecia and write them in Table A6.
Table A6 The median contraction frequencies of the anterior contractile vacuoles of nine Paramecia at two different salt concentrations.
Culture → ‘P—’ ‘P+’
9. (0.8 points) What, in general, is the advantage of the using the median over the average?
And what is the disadvantage? (N.B. ‘extreme values’ are either very large or very small
values). Tick one correct advantage and one correct disadvantage.
Advantage:
A The median is less sensitive to extreme values than the average.
B If there are no extreme values, the median is a more accurate description
of the data than the average.
C The median is easier to calculate, since it is only based on one (for an odd
number of values) or two (for an even number of values) values, whereas
the average uses all values.
Disadvantage:
A Since the median is based on only one or two values, it is a less accurate
description of the data than the mean.
B The median is more sensitive to extreme values.
C If there are no extreme values, the median is a less accurate description
of the data than the average.
Signature:
14th IJSO 2017, Nijmegen, The Netherlands ‒ Practical test ‒ Dec. 9th 2017 Biology - Paramecium – answer sheets page 9 of 28
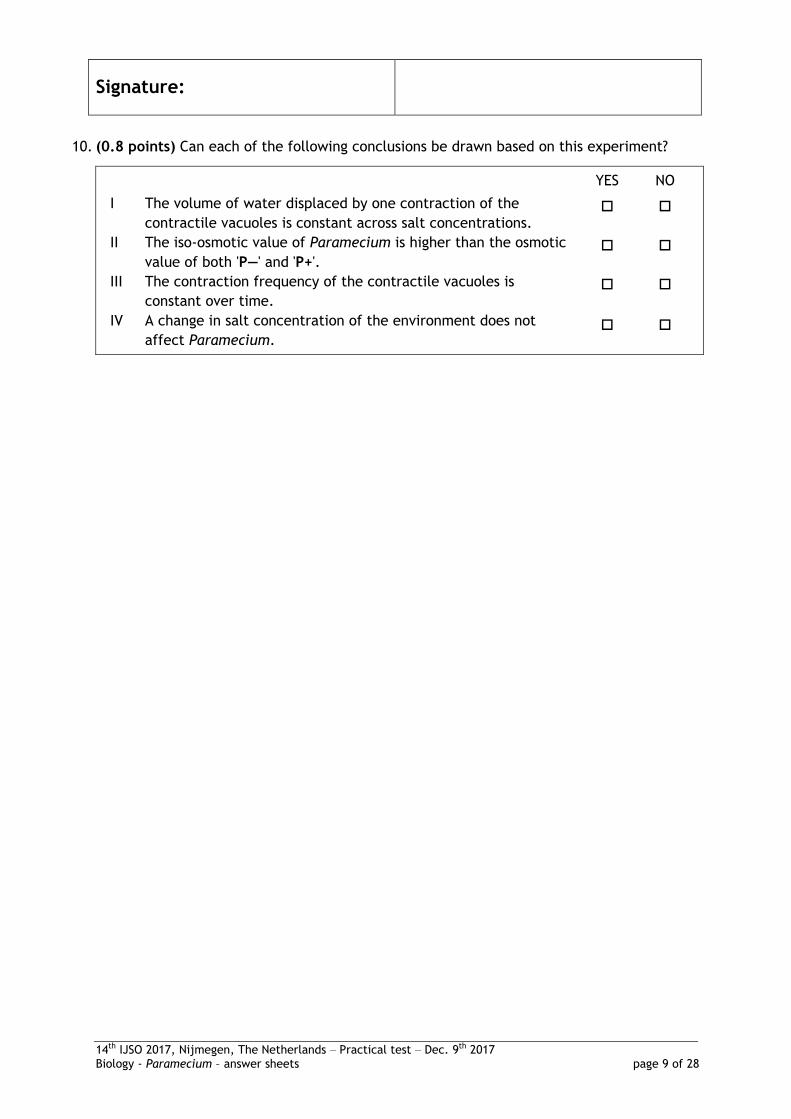
10. (0.8 points) Can each of the following conclusions be drawn based on this experiment?
YES NO
I The volume of water displaced by one contraction of the
contractile vacuoles is constant across salt concentrations.
II The iso-osmotic value of Paramecium is higher than the osmotic
value of both 'P—' and 'P+'.
III The contraction frequency of the contractile vacuoles is
constant over time.
IV A change in salt concentration of the environment does not
affect Paramecium.
Signature:
14th IJSO 2017, Nijmegen, The Netherlands ‒ Practical test ‒ Dec. 9th 2017 Biology - Paramecium – answer sheets page 10 of 28
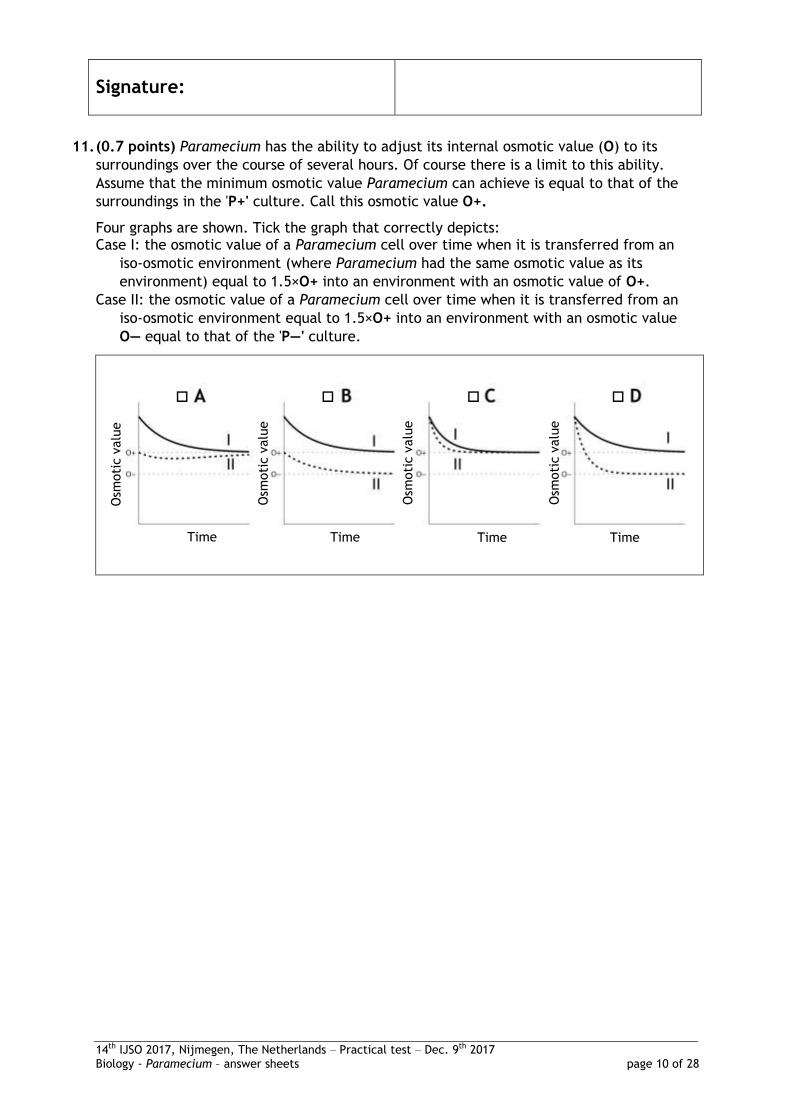
11. (0.7 points) Paramecium has the ability to adjust its internal osmotic value (O) to its
surroundings over the course of several hours. Of course there is a limit to this ability.
Assume that the minimum osmotic value Paramecium can achieve is equal to that of the
surroundings in the 'P+' culture. Call this osmotic value O+.
Four graphs are shown. Tick the graph that correctly depicts: Case I: the osmotic value of a Paramecium cell over time when it is transferred from an
iso-osmotic environment (where Paramecium had the same osmotic value as its
environment) equal to 1.5×O+ into an environment with an osmotic value of O+.
Case II: the osmotic value of a Paramecium cell over time when it is transferred from an
iso-osmotic environment equal to 1.5×O+ into an environment with an osmotic value
O— equal to that of the 'P—' culture.
Time Time Time
Time
Osm
oti
c v
alu
e
Osm
oti
c v
alu
e
Osm
oti
c v
alu
e
Osm
oti
c v
alu
e
Time
Signature:
14th IJSO 2017, Nijmegen, The Netherlands ‒ Practical test ‒ Dec. 9th 2017 Biology - Paramecium – answer sheets page 11 of 28
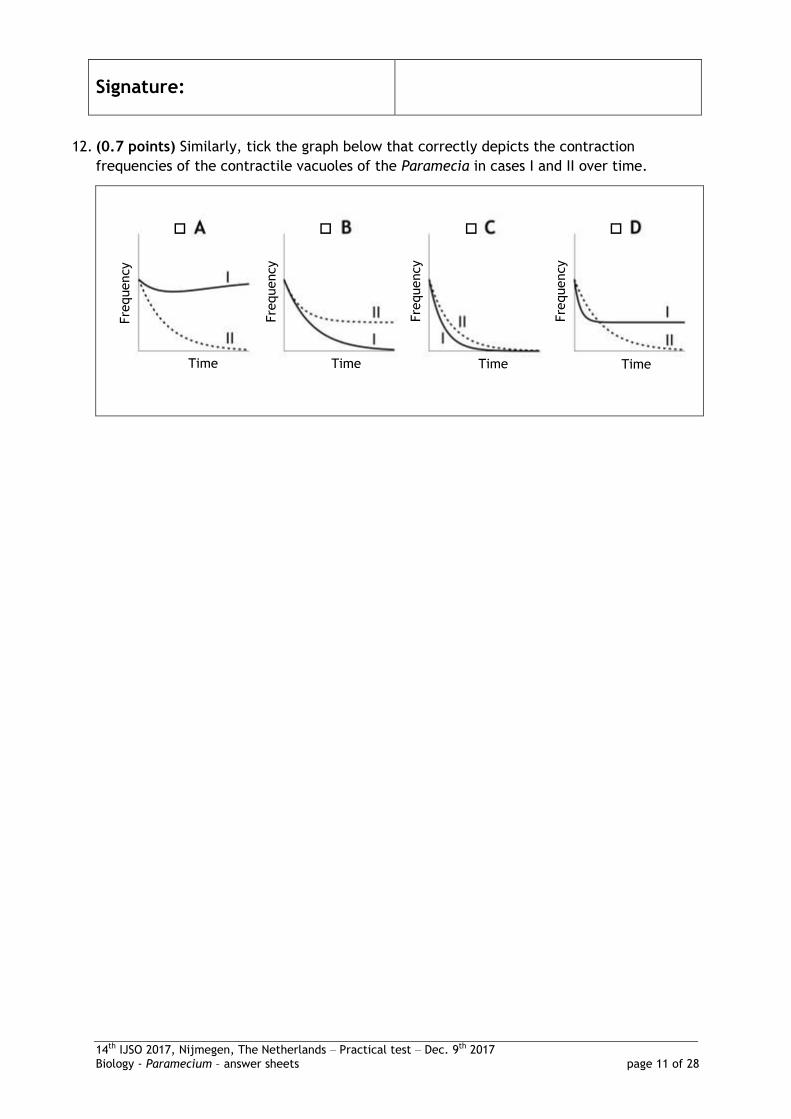
12. (0.7 points) Similarly, tick the graph below that correctly depicts the contraction
frequencies of the contractile vacuoles of the Paramecia in cases I and II over time.
Time Time Time Time
Fre
quency
Fre
quency
Fre
quency
Fre
quency
Signature:
14th IJSO 2017, Nijmegen, The Netherlands ‒ Practical test ‒ Dec. 9th 2017 Chemistry – Fajans titration – answer sheets page 12 of 28
Determining the chloride concentration of a
sodium chloride solution using the Fajans titration
A. Determining the densities of the solutions
1. (1.9 points – 0.6 points for the calculation and 1.3 points for accuracy of the result)
Calculate the density of the sodium chloride solution in g/mL. Only if you are unable to
get a result, use the arbitrary value of 1.12 g/mL for subsequent questions.
measurements
calculation
answer: g/mL
Signature:
14th IJSO 2017, Nijmegen, The Netherlands ‒ Practical test ‒ Dec. 9th 2017 Chemistry – Fajans titration – answer sheets page 13 of 28
2. (1.9 points – 0.6 points for the calculation and 1.3 points for accuracy of the result)
Calculate the density of the silver nitrate solution in g/mL. Only if you are unable to get a
result, use the arbitrary value of 1.05 g/mL for subsequent questions.
measurements
calculation
answer: g/mL
Signature:
14th IJSO 2017, Nijmegen, The Netherlands ‒ Practical test ‒ Dec. 9th 2017 Chemistry – Fajans titration – answer sheets page 14 of 28
B. Trial titration
Write the results of the trial titration in this box (you will get no marks for this).
C. Accurate titrations
3. (0.4 points) For every accurate titration, write down the initial (i) and final (f) masses of
the syringes containing the sodium chloride solution and the silver nitrate solution.
Titration 1
Titration 2
Titration 3
Signature:
14th IJSO 2017, Nijmegen, The Netherlands ‒ Practical test ‒ Dec. 9th 2017 Chemistry – Fajans titration – answer sheets page 15 of 28
4. (0.85 points) Calculate the volumes of sodium chloride solution that you titrated. Show
the calculation for titration 1 only. Complete the table.
calculation
Titration 1
Titration 2
Titration 3
5. (0.85 points) Calculate the volumes of silver nitrate solution that you used to titrate the
sodium chloride solution. Show the calculation for titration 1 only. Complete the table.
calculation
Titration 1
Titration 2
Titration 3
Signature:
14th IJSO 2017, Nijmegen, The Netherlands ‒ Practical test ‒ Dec. 9th 2017 Chemistry – Fajans titration – answer sheets page 16 of 28
6. (0.4 points) Calculate the molarity (i.e. the concentration in mol/L) of silver nitrate in
the solution. Only if you are unable to calculate the molarity, use the arbitrary value of
0.440 mol/L for subsequent calculations.
calculation
molarity: mol/L
7. (2.9 points – 0.9 points for calculation and 2.0 points for consistency of practical work)
Calculate the molarities of chloride in mol/L that follow from the three accurate
titrations. Show the calculation for titration 1 only.
calculation
(mol/L)
Titration 1
Titration 2
Titration 3
Signature:
14th IJSO 2017, Nijmegen, The Netherlands ‒ Practical test ‒ Dec. 9th 2017 Chemistry – Fajans titration – answer sheets page 17 of 28
8. (3.2 points – 0.2 points for calculation and 3.0 points for accuracy of practical work)
Calculate the average in mol/L of the three chloride concentrations that you
calculated in question 7.
calculation
answer: mol/L
9. (0.6 points) Calculate the sodium chloride concentration of the solution in g/L.
calculation
answer: g/L
Do not write in the box below
Penalty for using extra materials
Signature of lab assistant
Signature:
14th IJSO 2017, Nijmegen, The Netherlands ‒ Practical test ‒ Dec. 9th 2017 Physics – Blue energy – answer sheets page 18 of 28
Blue energy
A. Measuring potential differences using the concentration cell
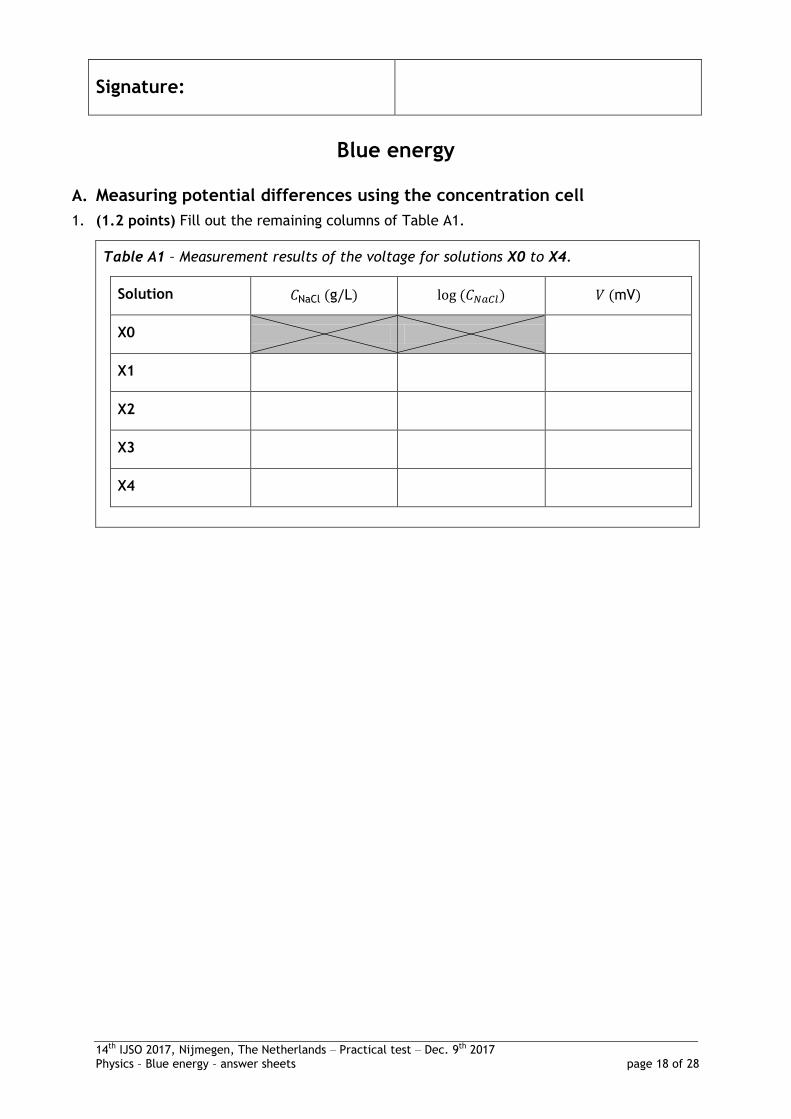
1. (1.2 points) Fill out the remaining columns of Table A1.
Table A1 – Measurement results of the voltage for solutions X0 to X4.
Solution
X0
X1
X2
X3
X4
Signature:
14th IJSO 2017, Nijmegen, The Netherlands ‒ Practical test ‒ Dec. 9th 2017 Physics – Blue energy – answer sheets page 19 of 28
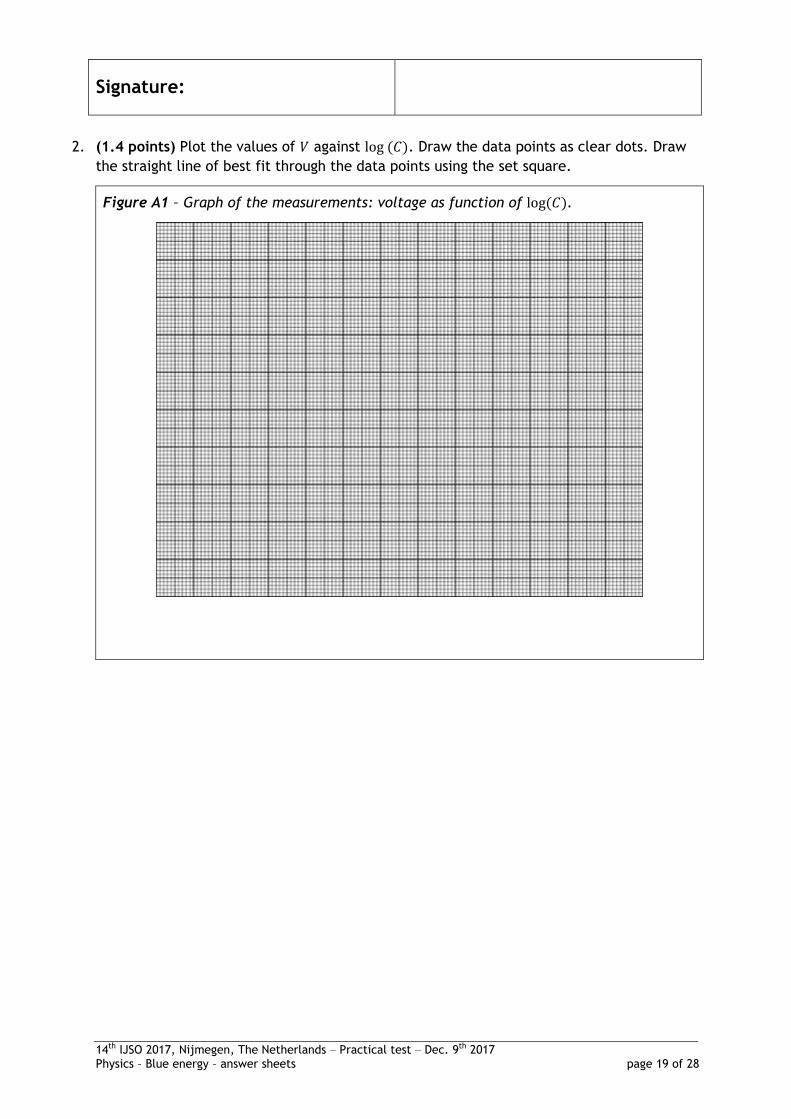
2. (1.4 points) Plot the values of against . Draw the data points as clear dots. Draw
the straight line of best fit through the data points using the set square.
Figure A1 – Graph of the measurements: voltage as function of .
Signature:
14th IJSO 2017, Nijmegen, The Netherlands ‒ Practical test ‒ Dec. 9th 2017 Physics – Blue energy – answer sheets page 20 of 28
3. (1.0 points) The relationship between and is linear and can be written as
. Determine from Figure A1 the values of and , without uncertainties.
4. (0.5 points) Indicate in Figure A1 clearly which point corresponds to the unknown solution
X0 and write down the coordinates below (without units).
coordinates corresponding to solution X0: horizontal:
vertical:
calculation
mV
mV
Signature:
14th IJSO 2017, Nijmegen, The Netherlands ‒ Practical test ‒ Dec. 9th 2017 Physics – Blue energy – answer sheets page 21 of 28
5. (0.9 points) Determine the concentration of solution X0.
B. Measuring the electrical conductance of the solutions
6. (0.4 points). Let the lab assistant check your electrical circuit.
You may not write in the next box.
calculation
answer: g/L
Correct circuit: Remarks: □ yes
□ no
Signature lab assistant:
Signature:
14th IJSO 2017, Nijmegen, The Netherlands ‒ Practical test ‒ Dec. 9th 2017 Physics – Blue energy – answer sheets page 22 of 28
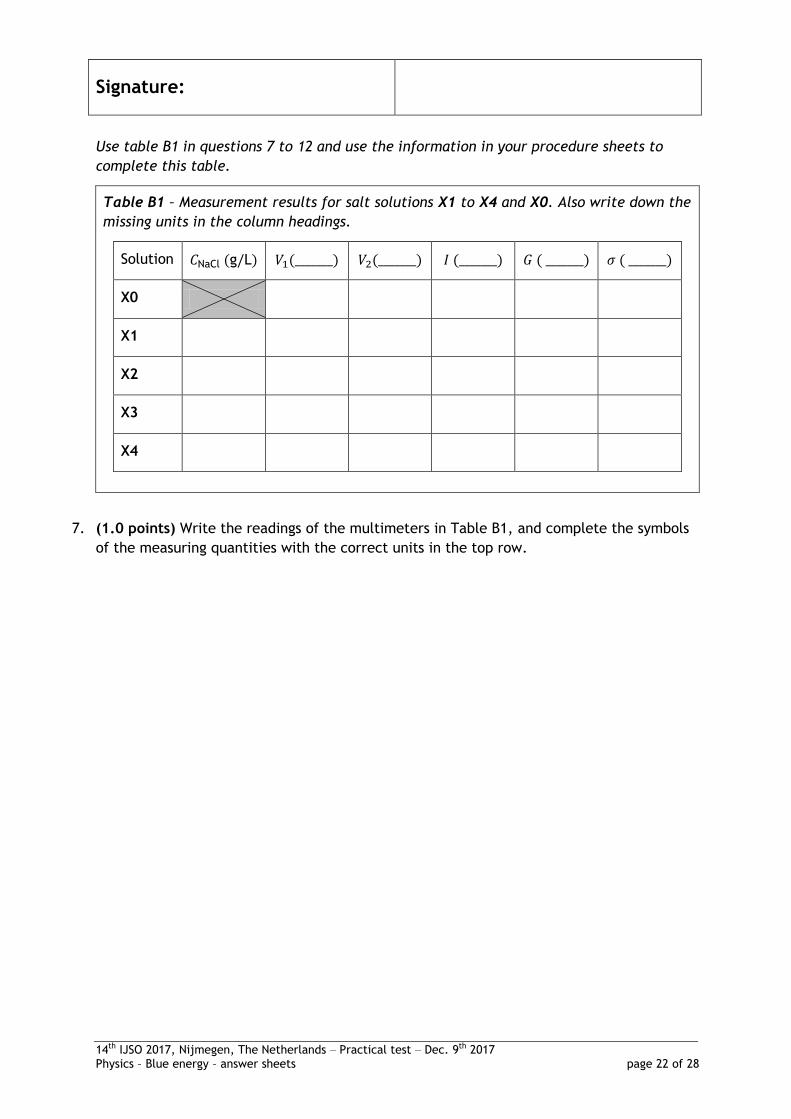
Use table B1 in questions 7 to 12 and use the information in your procedure sheets to
complete this table.
Table B1 – Measurement results for salt solutions X1 to X4 and X0. Also write down the
missing units in the column headings.
Solution
X0
X1
X2
X3
X4
7. (1.0 points) Write the readings of the multimeters in Table B1, and complete the symbols
of the measuring quantities with the correct units in the top row.
Signature:
14th IJSO 2017, Nijmegen, The Netherlands ‒ Practical test ‒ Dec. 9th 2017 Physics – Blue energy – answer sheets page 23 of 28
8. (0.8 points) Calculate from your measurements the current which went through the
setup, and calculate for each known salt concentration the conductance . Enter your
results in Table B1. Show in the box below the calculations for X1 only.
The conductance is the reverse of the resistance and has as unit S (which stands for
Siemens). See the equation sheet for more information, and enter the results in Table B1 .
calculation of the current for X1
calculation of the conductance for X1
Signature:
14th IJSO 2017, Nijmegen, The Netherlands ‒ Practical test ‒ Dec. 9th 2017 Physics – Blue energy – answer sheets page 24 of 28
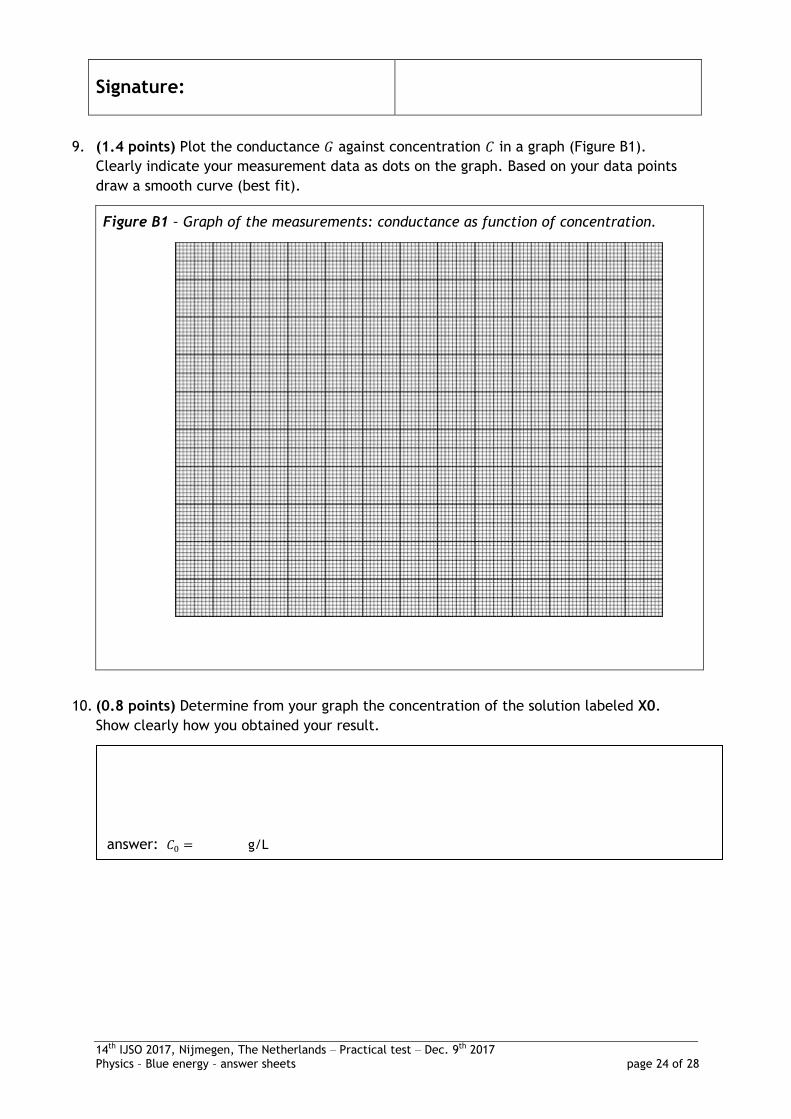
9. (1.4 points) Plot the conductance against concentration in a graph (Figure B1).
Clearly indicate your measurement data as dots on the graph. Based on your data points
draw a smooth curve (best fit).
Figure B1 – Graph of the measurements: conductance as function of concentration.
10. (0.8 points) Determine from your graph the concentration of the solution labeled X0.
Show clearly how you obtained your result.
answer: g/L
Signature:
14th IJSO 2017, Nijmegen, The Netherlands ‒ Practical test ‒ Dec. 9th 2017 Physics – Blue energy – answer sheets page 25 of 28
11. (0.8 points) Determine values for and of the pair of electrodes. Use SI units, so in m
and in m2.
12. (0.4 points) Calculate the specific conductivities of solutions X0 and X1 to X4 and write
down the results in Table B1. Show in the box below the calculation for X0 only.
calculation answers: m
m2
calculation
answer for X0: S/m
Signature:
14th IJSO 2017, Nijmegen, The Netherlands ‒ Practical test ‒ Dec. 9th 2017 Physics – Blue energy – answer sheets page 26 of 28
C. Calculating the theoretical maximum electrical power
13. Consider your graph in Figure A1 and answer the following questions.
a) (0.2 points) If you want to obtain the maximum voltage from the RED cell, which of
the solutions X0 to X4 should you use for the salt water?
b) (0.2 points) Which of the solutions X0 to X4 should you use for the fresh water?
c) (0.5 points) Read from Figure A1 how large the potential difference is across the
cell when using the solutions you chose in questions 13a and 13b.
solution to be used for the salt water:
solution to be used for the fresh water:
mV
Signature:
14th IJSO 2017, Nijmegen, The Netherlands ‒ Practical test ‒ Dec. 9th 2017 Physics – Blue energy – answer sheets page 27 of 28
14. (0.5 points) Calculate the conductance of the fresh water side and of the salt
water side of the RED cell. Use the specific conductivities from Table B1 on the answer
sheet.
ot : ou do ’t h v d ta for , use and for your
calculations.
15. (0.5 points) Calculate the internal resistance of the RED cell.
calculation
calculations
answers:
Signature:
14th IJSO 2017, Nijmegen, The Netherlands ‒ Practical test ‒ Dec. 9th 2017 Physics – Blue energy – answer sheets page 28 of 28
16. (0.8 points) Calculate the current through the external resistor. Use the potential
difference you found in question 13.
ot : ou do ’t h v v u o , use mV as a value for your calculation.
17. (0.4 points) Calculate the power this RED cell delivers to the external resistor.
18. (0.3 points) How many of these RED cells you need for a power plant to generate 1.0 MW?
answer:
calculation
W
calculation
A