pran & whitney - nuclear regulatory commission · pran & whitney 400 main street east...
TRANSCRIPT
Pran & Whitney 400 Main Street East Hartford, CT 06118 Mail SlOp 101·29
November 14, 2014
Ms. Elizabeth Ullrich US NRC Region 1 2100 Renaissance Blvd KingofPrussia, PA 19406
Subject: Pratt& Whitney Responses to East Hartford FSSP questions dated 11110/14
Dear Ms. Ullrich,
Please find the attached responses to your East Hartford FSSP questions dated November I 0, 2014. Based upon our response to question #2, both the Middletown and the East Hartford Final Status Survey Plans have been modified and arc included for your review and acceptance. If you have any questions, please contact Dave Alberghini at 860..565-4977 or via email at [email protected].
Renee Welsh
Docket No.: 040·00791 License No.: SMB·I S I
Enclosures: 1. Responses to questions dated November I o, 2014.
2. Final Status Survey Plan; Tennination of License SMB-151 at the Middletown, CT Facility, Revision 2
3. Final Status Survey Plan; Tennination of License SMB-1 5 I at the East Hartford, CT Facility, Revision I
~--·· .: '
r···-'·' I·~·"

WARNING --This document contains technical data the export of which is or may be restricted by the Export Administration Act and the Export Administration Regulations
(EAR), 15 C.F.R. parts 730-774. Diversion contrary to U.S. law is prohibited. The export, reexport, transfer or re-transfer of this technical data to any other company, entity,
person, or destination, or for any use or purpose other than that for which the technical data was originally provided by P&W, is prohibited without prior written approval from
P&W and authorization under applicable export control laws.
EAR Export Classification: ECCN EAR99
Final Status Survey Plan Revision 2
Pratt & Whitney A United Technologies Company
400 Main Street East Hartford, Connecticut
Termination of License SMB-151 at the Middletown, CT Facility
Prepared by:
Radiation Safety & Control Services 91 Portsmouth Avenue
Stratham, NH 03885-2468
•
RSCS Radiat10I"l Safety & Control Services

Pratt & Whitney Middletown Site Final Status Survey Plan
Table of Contents
1.0 INTRODUCTION ................................................................................................................ 4 2.0 SUMMARY OF THE FINAL STATUS SURVEY PROCESS ............................................. .4 3.0 MIDDLETOWN FACILITY HISTORICAL SITE ASSESSMENT ......................................... 6 4.0 SURVEY PLANNING ....................................................................................................... 11
4.1 Classification of Survey Areas and Units ...................................................................... 11 4.2 Reference Areas and Materials .................................................................................... 12 4.3 Area Preparation: Isolation and Control ...................................................................... 19 4.4 Selection of DCGLs ...................................................................................................... 19
5.0 FINAL STATUS SURVEY DESIGN ................................................................................. 20 5.1 Selecting the Number of Fixed Measurements and Locations ..................................... 21
5.1.1 Establishing Acceptable Decision Error Rates ...................................................... 21 5.1.2 Determining the Relative Shift ............................................................................... 22 5.1.3 Selecting the Required Number of Measurements for the Sign Test .................... 22 5.1.4 Determining Measurement Locations .................................................................... 23
5.2 Data Investigations ....................................................................................................... 23 5.2.1 Investigation Levels ............................................................................................... 23 5.2.2 Investigations ........................................................................................................ 24
5.3 Survey Implementation and Data Collection ................................................................ 24 5.3.1 Survey Methods .................................................................................................... 24
5.4 Survey lnstrumentation ................................................................................................. 26 5.4.1 Instrument Selection .............................................................................................. 26 5.4.2 Calibration and Maintenance ................................................................................. 27 5.4.3 Response Checks ................................................................................................. 27 5.4.4 MDC calculations .................................................................................................. 27
6.0 6.1 6.2 6.3 6.4
7.0 8.0 9.0
SURVEY DATA ASSESSMENT ...................................................................................... 30 Initial Evaluation ........................................................................................................... 30 Sign Test ...................................................................................................................... 30 Data Assessment Conclusions ..................................................................................... 31 A LARA Evaluations ...................................................................................................... 32
FINAL STATUS SURVEY REPORT ................................................................................ 32 QUALITY ASSURANCE AND QUALITY CONTROL MEASURES .................................. 33 REFERENCES ................................................................................................................. 33
List of Tables
Table 4-1 Survey Unit Surface Area Limits ................................................................................. 12 Table 4-2 Final Status Survey Units ........................................................................................... 12 Table 5-1 Investigation Levels .................................................................................................... 24 Table 5-2 Traditional Scanning Coverage Requirements ........................................................... 25 Table 5-3 Available Instruments and Associated MDCs ............................................................. 26 Table 6-1 Initial Evaluation of Survey Results ............................................................................ 30
Page 2 of 33 Subject to the export control restrictions on the title page of this document
Rev. 2
Pratt & Whitney Middletown Site Final Status Survey Plan
List of Figures
Figure 3-1 Middletown Site Map ................................................................................................. 10 Figure 4-1 Building 220 Survey Units ......................................................................................... 14 Figure 4-2 Building 410 Survey Units ......................................................................................... 15 Figure 4-3 Building 140 Survey Unit ........................................................................................... 16 Figure 4-4 Building 440 Survey Unit ........................................................................................... 17 Figure 4-5 Building 150 Survey Unit ........................................................................................... 18
Page 3 of 33 Subject to the export control restrictions on the title page of this document
Rev. 2

. '
Pratt & Whitney Middletown Site Final Status Survey Plan
1.0 INTRODUCTION
The purpose of the Final Status Survey Plan is to describe the methods to be used in planning, designing, conducting, and evaluating final status surveys at the Pratt & Whitney (P&W) Middletown, CT site that will be used to terminate their SMB-151 license (1) in accordance with 10 CFR 40.42. (2) A second plan will be written to terminate the same license at the East Hartford site. These surveys serve as key elements to demonstrate that the dose from residual radioactivity is less than the maximum annual dose criterion for license termination for unrestricted use specified in 10 CFR 20.1402 (3) and by Connecticut Remediation Standard regulations. (4) (5) The additional requirement of 10 CFR 20.1402 that all residual radioactivity at the site be reduced to levels that are as low as reasonable achievable (ALARA) will also be addressed. The Final Status Survey Plan was developed using the guidance of NUREG-1575, "The Multi-Agency Radiation Survey and Site Investigation Manual (MARSSIM)" (6) and NUREG-1757 Volume 2(7).
This plan is written to be both educational and informative. Each section provides the reader with sufficient information about each step of the final status survey process to understand that step and a statement as to the decision that will be applied to the P&W final status survey process.
2.0 SUMMARY OF THE FINAL STATUS SURVEY PROCESS
This section summarizes the final status survey process as described in MARSSIM. The final status survey process consists of four principal elements:
• planning, • design, • implementation, and • assessment.
Survey planning includes review of the Historical Site Assessment (HSA) and other pertinent characterization information to establish Data Quality Objectives (DQOs), survey unit classifications, and the radionuclides of concern. The HSA reviews historical use of the licensed material at the facility and the levels of potential activity entailed through personnel interviews and records review. The site buildings and areas are classified based upon contamination potential. Areas that have no reasonable potential for residual contamination are classified as non-impacted areas. These areas have no radiological impact from site operations. Areas with reasonable potential for residual contamination are classified as impacted areas. Impacted areas are divided into three classifications based upon the potential contamination levels and how the contamination is distributed. Areas with the same classification are broken into survey units. Survey units are fundamental elements for which final status surveys are designed and executed. The classification of a survey unit determines how large it can be in terms of surface area.
The DQO process is a series of planning steps for establishing criteria for data quality and developing survey designs. The DQO process consists of seven steps:
1. Statement of the problem; 2. Identification of the decision; 3. Identification of inputs to the decision; 4. Definition of the study boundaries;
Page 4 of 33 Subject to the export control restrictions on the title page of this document
Rev. 2

Pratt & Whitney Middletown Site Final Status Survey Plan
5. Development of a decision rule; 6. Specification of limits on decision errors; and 7. Optimization of the design for obtaining data.
Before the survey process can proceed to the design phase, concentration levels that represent the maximum annual dose criterion of 10 CFR 20.1402 (25 mrem/year) or Connecticut regulations (19 mrem/year) must be established. In general, these concentrations are established for either surface contamination (dpm/100 cm2
) or volumetric contamination (pCilg). They are used in the survey design process to establish the minimum sensitivities required for the available survey instruments and techniques, and in some cases, the spacing of fixed measurements or samples to be made within a survey unit. Surface or volumetric concentrations that correspond to the maximum annual dose criterion are referred to as Derived Concentration Guideline Levels, or DCGLs. A DCGL established for the average residual radioactivity in a survey unit is called a DCGLw. Values of the DCGLw may then be increased through the use of area factors to obtain a DCGL that represents the same dose to an individual for residual radioactivity over a smaller area within a survey unit. The scaled value is called the DCGLEMC. where EMC stands for elevated measurement comparison.
After the DCGLw is established, a survey design is developed and documented for each survey unit. The plan is documented as a Survey Package that selects the appropriate survey instruments and techniques to provide adequate coverage of the unit through a combination of scans, fixed measurements, and sampling. The Survey Package also implements the DQOs for that survey unit and provides instructions for carrying out the survey. The package documents the data assessment of results, the statistical basis used to determine if the survey unit passes or fails, and the review and approval of the package. If any of the radionuclides of concern are present in background at levels that impact the DCGLw, the planning effort may include establishing appropriate reference areas to be used to establish baseline concentrations for these radionuclides and their variability. Reference materials are specified for establishing background instrument responses for cases where gross activity measurements are to be made. A reference coordinate system may be used for documenting locations where measurements were made and to allow replication of survey efforts if necessary. This process ensures that data of sufficient quantity and quality are obtained to make decisions regarding the suitability of the survey design assumptions and whether the unit meets the release criterion. Approved site procedures will direct this process to ensure consistent implementation and adherence to applicable requirements.
Survey implementation is the process of carrying out the survey plan (package) for a given survey unit. This consists of scan measurements, fixed measurements, and collection and analysis of samples. Scan measurements will always be made, while fixed measurements and sampling may not be necessary. Data are collected and stored using a data management system.
Data assessment includes data verification and validation (V&V), review of survey design bases, and data analysis. For a given survey unit, the survey data are evaluated to determine if the residual activity levels in the unit meet the applicable release criterion and if any areas of elevated activity exist. In some cases, data evaluation will simply serve to show that all of the measurements made in a given survey unit were below the applicable DCGLw. If so, demonstrating compliance with the release criterion is a simple matter and requires little in the way of analysis. In other cases, residual radioactivity may exist where measurement results both above and below the DCGLware observed. In these cases, statistical tests must be performed to make a decision as to whether the unit meets the release criterion. The statistical
Page 5 of 33 Subject to the export control restrictions on the title page of this document
Rev.2

Pratt & Whitney Middletown Site Final Status Survey Plan
tests that might be required to make decisions regarding the residual activity levels in a survey unit relative to the applicable DCGLw must be considered in the survey design to ensure that a sufficient number of measurements are collected.
Quality assurance and control measures are employed throughout the final status survey process to ensure that all decisions are made on the basis of data of acceptable quality. Quality assurance and control measures are applied to ensure:
• the plan is correctly implemented as prescribed, • all data and samples are collected by individuals with the proper training following
approved procedures, • all instruments are properly calibrated, • all collected data are validated, recorded, and stored in accordance with approved
procedures, • all required documents are properly maintained, and, • if necessary, corrective actions are prescribed, implemented and followed up.
3.0 MIDDLETOWN FACILITY HISTORICAL SITE ASSESSMENT
The P&W Middletown, Connecticut site is located on 1,100 acres of land in Middlesex County on the west bank of the Connecticut River. Figure 3-1 presents the Middletown site map. United Technologies' Pratt & Whitney (P&W) is licensed by the U.S. Nuclear Regulatory Commission (NRC) to possess and use radioactive material at the 400 Aircraft Road, Middletown, Connecticut facility under NRC License SMB-151. (1) The SMB-151 license allows possession and use of 910 kilograms of solid Thorium oxide (natural Th-232) source material not exceeding 4% (by mass) dispersed in Nickel. This was commonly referred to as TO-Nickel or TD-Ni. This material was not alloyed by P&W but was provided as sheet metal stock by a vendor.
The SMB-151 license was obtained on March 31, 1961. Building 10 was constructed in 1968 and was used for the manufacture of jet engine heat shields and burn cups from TD-Ni. No smelting or alloying of the metal was done in Building 10. Also, no other kind of high temperature work was done on this metal, so no radioactive fumes or other finely divided particulate contamination was ever produced. Any fine particulate produced was generally associated with lapping compounds which remained wet, entailing very low airborne radioactivity release fractions (ARFs). Any contamination present was the result of stamping, forming, de-burring, tumbling, polishing or some other low velocity, low temperature operation. Standard housekeeping practices were employed at that time which included cleaning up each work station at the end of each shift. This fabrication work did not occur in any other building at the Middletown facility.
Licensed activities in Building 10 ceased in 2000 when the TD-Ni sheet metal stock and manufacturing equipment were moved to the East Hartford Facility. Building 10 was demolished between August 2004 and December 2004. The remaining concrete pad was surveyed for termination from the license in 2012. The surveys took place over a two-week period at the end of July through the beginning of August in 2012. The final report of the decommissioning surveys of the Building 10 concrete pad was submitted in February 2013 with a letter requesting release of the Building 10 concrete pad for unrestricted use and removal of the Middletown site from the license. (8) (9) In a letter to the NRC on June 19, 2013 Pratt and Whitney amended this request to limit the termination from the license of just the Building 10 concrete pad. (1 O)The
Page 6 of 33 Subject to the export control restrictions on the title page of this document
Rev. 2

,.
Pratt & Whitney Middletown Site Final Status Survey Plan
remaining concrete pad from Building 10 was released for unrestricted use by the NRC. (11) Therefore the pad is no longer on the license and is not included in this survey plan.
The Historical Site Assessment (HSA) commenced in the fall of 2013. Historical records were reviewed including surveys and relevant memos. Interviews with key long-time employees were also conducted.
Several key documents were reviewed and are listed below:
• NRC Inspection Report No. 030-90001/95-01. This report documented confirmatory measurements and assessments at the Middletown facility to determine whether radioactive contamination remained as a result of activities authorized and conducted under a different license; License No. 06-00550-03. The facility was designated the Connecticut Aircraft Nuclear Engine Laboratory (CANEL) and the Connecticut Advanced Nuclear Engineering Laboratory (also CANEL) at that time.
• Pratt & Whitney letter to the NRC dated February 18, 2013. This letter transmitted the "Building 10 Decommissioning and Final Status Survey Report", dated February 19, 2013, to the NRC. This report documented the final status survey of the Building 10 slab in an effort to remove that building from License No. SMB-151.
• Several Final Status Surveys at the East Hartford facility that were undertaken at the request of P&W upon cessation of TD-Ni activities.
RSA Final Radiological Status Report, Pratt & Whitney, East Hartford Facility (Portions) North Production Test, dated July 16, 2007 RSA Decommissioning, Pratt & Whitney North Experimental Test Building (North Test), dated 11/1/2010 RSA Final Radiological Status Report, Pratt & Whitney, East Hartford Facility (Portions), dated January 8, 2004 RSA Final Radiological Status Report, Welding/Blending Area, L-Building, Pratt & Whitney, East Hartford, Connecticut, dated September 17, 2008.
A summary of the relevant points identified in the above documents are listed below.
1. NRC Inspection Report No. 030-90001/95-01 (12)
"A portion of Building 140 housed the Nuclear Material Research and Development (NMRD) Lab, a laboratory area where radioactive material, primarily uranium, was used during contract and licensed operations. The portion of the building where the NMRD was located had been renovated and replaced with additional laboratory facilities. The area is currently being renovated again to remove the laboratory and replace the area with a machine shop. The other half of the building which apparently housed a machine shop that did not use radioactive material is now classrooms and a training shop. Surveys by the radiological contractor identified numerous areas where the exposure rate or direct radiation levels were in excess of background; however, in all cases these elevated readings were due to the presence of naturally occurring uranium and thorium (ZrO, welding rods, ceramic tile, and granite table-tops) or licensed material (thoriated nickel). The surveys did not identify contamination or elevated exposure rates in this building as a result of past operations."
"Surface and subsurface soil samples collected in 1993 for the EPA RCRA (Resource Conservation Recovery Act) Facility Investigation were analyzed by Pratt & Whitney's contractor for the presence of radioactive contamination by either gross alpha/gross beta
Page 7 of 33 Subject to the export control restrictions on the title page of this document
Rev. 2

.. Pratt & Whitney Middletown Site Final Status Survey Plan
analyses or by gamma spectrometry. Six of the approximately 1 ,800 soil samples analyzed by gamma spectrometry indicated detectable Cs-137 concentrations (maximum 1.6 pCi/g); however, none of those analyses indicated Cs-137 concentrations in excess of the NRC criteria for release for unrestricted use (8 pCilg)."
"During the current inspection, the inspectors returned to Building 450 and again identified elevated exposure rates of 40 - 50 !JR/hr at contact on a pallet of Zr02 plasma spray powder. The inspectors obtained a sample of this material for gamma spectrometry analysis. The results of the analysis show that the uranium and thorium concentration in the powder is less than 0.05 percent by weight; therefore, the material is exempt from licensing in accordance with 10 CFR 40.13, Unimportant Quantities of Source Material."
2. Building 10 Decommissioning and Final Status Survey Report
"A combined seeping survey/final radiological status survey was performed on the Middletown Building 10 slab. The slab was divided into ten survey units (SU). This survey was designed to meet all of the MARSSIM requirements as far as acceptable release guidelines, number of samples and measurements, etc. Based on the data collected and on the statistical analysis of that data, and based on visual inspection of the concrete floor and concrete surface samples, this survey and investigation shows that concentrations of licensed radioactive material remaining at the P&W Middletown site meet the requirements of the Nuclear Regulatory Commission and the state of Connecticut for unrestricted release."
3. Final Status Surveys performed at the East Hartford facility
Several final radiological status surveys were conducted at the East Hartford facility from 2003 to 2010 upon cessation of the use of the TD-Ni material. The surveys were performed in storage areas, test cells and a welding/blending area. All the surveys were conducted under the MARSSIM guidance. The DCGL for the surveys were either the NRC screening level of 6 dpm/1 00 cm2 or reduced to 5 dpm/1 00 cm2 to account for the 19 mrem Connecticut recommended limit. The conclusion in each of the survey reports is that no single measurement exceeded the NRC total contamination limit of 6 dpm/1 00 cm2 or the removable limit of 0.6 dpm/1 00 cm2.
Pratt & Whitney recently analyzed all the spray powders in use at the Middletown facility for radioactivity. A total of 7 powders are in use. A sample from each powder was collected and sent to an off-site laboratory for gamma spectrometry analysis. Only one powder contains natural uranium and thorium radioactivity. The results of the analysis are; U-238 at 6.28 pCi/g and Th-232 at 7. 78 pCi/g. These results equate to approximately 0.01% uranium and thorium by weight. Therefore, this spray powder is considered an unimportant quantity of source material in accordance with 10 CFR 40.13. Pratt & Whitney intends to continue using spray powders and other thoriated materials in the future.
Based upon the information collected and reviewed, the following conclusions have been drawn:
1. Although the NMRD laboratory in Building 140 may have stored and/or used TD-Ni material, it has been renovated twice since that time. The maximum direct measurement at the time of the inspection did not exceed the average or maximum contamination criteria (5,000 dpm/1 00 cm2 when averaged over a square meter and 15,000 dpm/1 00 cm2, respectively). A smear taken in this area indicated removable gross beta activity of 6 ± 3 dpm/1 00 cm2 and gross alpha activity of 3 ± 2 dpm/1 00 cm2, indicating that the
Page 8 of 33 Subject to the export control restrictions on the title page of this document
Rev. 2
,.
Pratt & Whitney Middletown Site Final Status Survey Plan
activity was fixed in the concrete floor. A sample of the contaminated concrete was removed for qualitative gamma spectrometry analysis. The results indicated U-238, Th-232 and their decay products. Therefore, since there is a potential for residual radioactivity in an area where SMB-151 TO-Ni was used subsequently, a final status survey of Building B-140 will be performed. A modified alpha OCGL will be used for Building 140 to account for any potential missed dose from beta/gamma emitting radionuclides in the residual radioactivity.
2. Based upon the large number of surface and subsurface samples taken at the site and a review of the results of samples taken around Building 10 that show normal environmental levels of natural radioactivity, no soil samples will be collected and analyzed for the final status survey.
3. The laboratory analyses of spray powders, both by the NRC and recently by Pratt & Whitney, show source material nuclides at concentrations exempted under 10CFR40.13(a). Spray powders were historically used in Buildings B-10 and B-440. Currently spray powders are only used in Buildings B-220 and B-150. Although these materials will continue to be used after license termination, two additional locations at which these unlicensed materials were used; B-440 and B-150, have been added to the plan.
4. Based upon the results of the final status survey of the remaining concrete pad of Building 10 and those at the East Hartford facility, residual contamination at the facilities is a very small fraction (<5%) of the site-specific building OCGL of 354 dpm/100 cm2
.
Therefore, the survey units for final status survey in Middletown will be designated as Class 3.
5. All manufacturing and refurbishment of the TO-Ni parts occurred in Building 10. Once the parts were manufactured, they went into storage in Building 220. The stored parts were then assembled into the engines in Building 220. The completed engines were then brought into Building 410 for testing. Therefore, based upon this information, the final status survey of the Middletown, CT facility will be performed in Buildings 220 and 410.
Page 9 of 33 Subject to the export control restrictions on the title page of this document
Rev. 2

.. . Pratt & Whitney East Hartford Site Final Status Survey Plan
collected in the center of the room/area at waist height. If other materials with high natural radioactivity are encountered in the survey unit and are part of the final status survey, we may take background measurements on similar non-impacted materials. The final method of which background will be used will be specified in the Final Status Survey Package for that survey unit.
Page 12 of 33
Figure 4-1 L Building Survey Units
~~-------------------, -• I
. L .Bidg-EH
@~~~~~--~~~~~~~--~~
¢ ~ ~ ~ ® ® ~ ® ® 0 o o D
Subject to the export control restrictions on the title page of this document
Rev. 1

, y 4. (
Pratt & Whitney East Hartford Site Final Status Survey Plan
Figure 4-2 J Building Survey Unit
F N
l.,_ ..1 ~ I"""" I
~ r ....... 1-- r·: n -
~ ·- ·- r- u }JIJ
~ :!..._ r- f
[1.-: l l u ---~
~I i! r+- .. 1 _ [] . J -I
OJ-~ I"""" r- I I ,~ ~ r-! ~ -• -;::::-:: L-; t!~hnl I [J ·g blc
-- u :..==: . . r-- ,.:J -
. · ,~ ~ . ~~ ... , ,--·r. l IIIII . ., I
I ~j I, I
r rr , . ~ ~ , <I (Jl ) =I ] _r -=t_ _J :ail '---- .... -
~r~ , [ ~~ Lr*' I T I ~ - - :! I I ll I ~ Htft i I f- • ~=;;;;;-- - 'B:
--I -- ~ 1= "--1 I ~~r~ ~~ '"- - I-- · r -r= f'"!
-lr_- I
Page 13 of 33
~ :I I II '---
• II "' tr I ~
II Lo_ -~, • - '"'"' - L I • I • I :n: ~- LL ":el IIJ , I I I f r 1 r- tt ~-
~
F N
Subject to the export control restrictions on the title page of this document
I I ll r- I l l ~ r- 1-
~
r----
h....i 1--'1
~ h Q
Rev. 1

. ( ,
Page 14 of 33
Pratt & Whitney East Hartford Site Final Status Survey Plan
Figure 4-3 M Building Survey Unit
S OOCU"'- ~..r CONTAIN$ NO CH~CAL OATASUIJECTTO TH WO.llt lf.Ait.
Subject to the export control restrictions on the title page of this document
Rev. 1
.. ~ ..
Page 15 of 33
Pratt & Whitney East Hartford Site Final Status Survey Plan
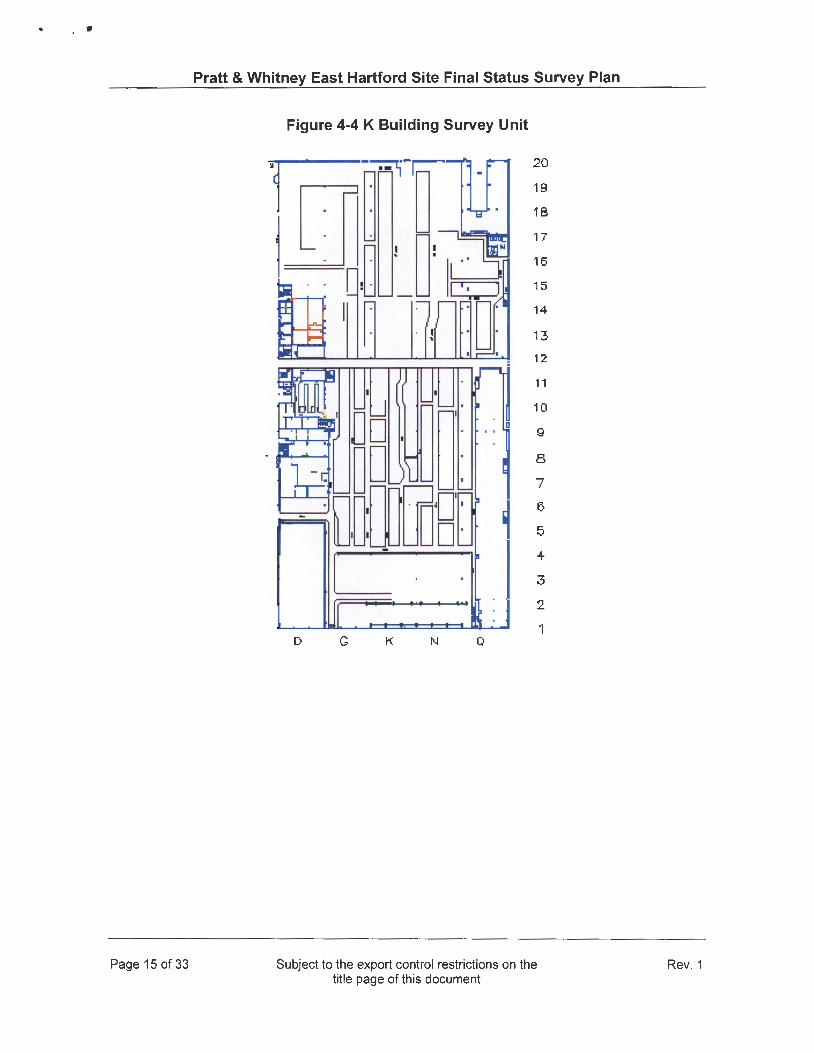
Figure 4-4 K Building Survey Unit
IJl1 Iii J _ r·
l · : D. - .. o
'"G ~DJ~ : ~ , -· ~nrnrnB: ~
lf_
D G
- '---
K N
i . ~ '
Q
20
19
18
17
16
15
14
13
12
11
10
g
8
7
5
5
+ 3
2
1
Subject to the export control restrictions on the title page of this document
Rev. 1
Page 16 of 33
Pratt & Whitney East Hartford Site Final Status Survey Plan
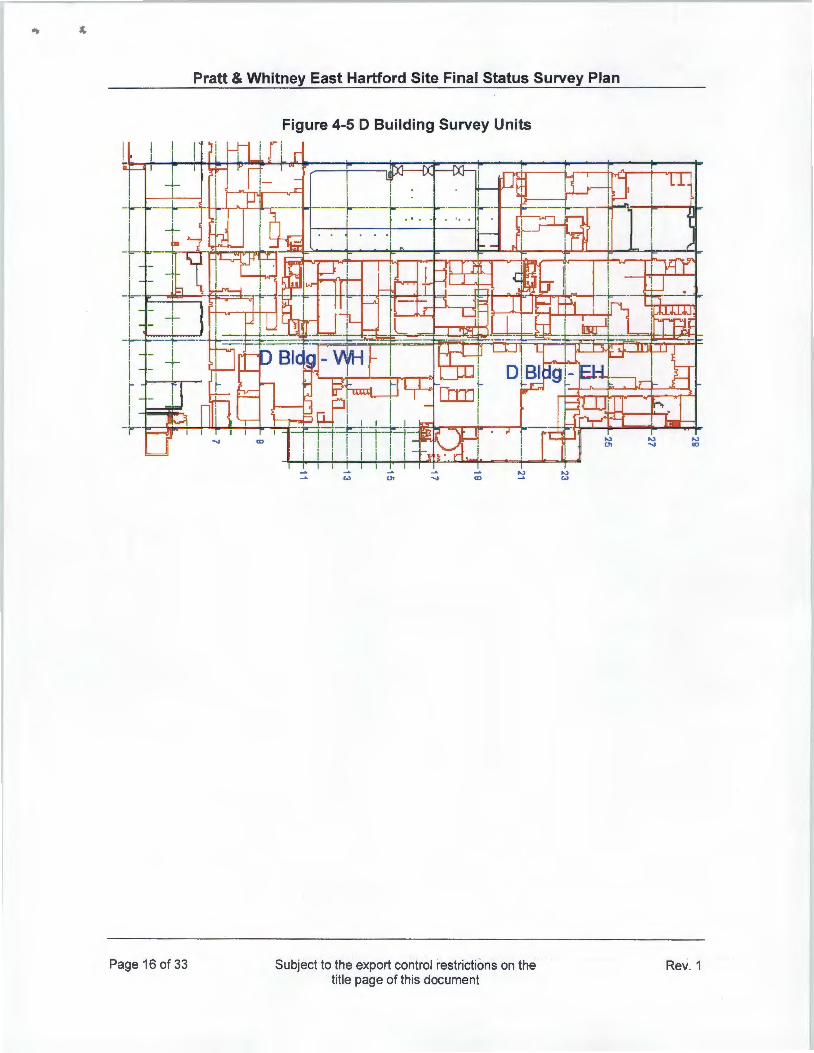
Figure 4-5 D Building Survey Units
Subject to the export control restrictions on the title page of this document
Rev. 1

I
Page 17 of 33
Pratt & Whitney East Hartford Site Final Status Survey Plan
Figure 4-6 Waste Storage Trailer Survey Unit
Subject to the export control restrictions on the title page of this document
Rev. 1

Page 18 of 33
Pratt & Whitney East Hartford Site Final Status Survey Plan
"W 5
Figure 4-7 E Building Survey Unit
~ ~~_,~--~~+-----~~~ 3
Subject to the export control restrictions on the title page of this document
Rev. 1

•
Pratt & Whitney East Hartford Site Final Status Survey Plan
4.3 Area Preparation: Isolation and Control
Before final status survey activities can begin in an area, a transition must occur where planned decommissioning activities are completed and the area is subsequently assessed to scope the required isolation and control measures. This includes establishing if the area is ready for final survey activities and identifying any work practice issues that must be addressed in survey planning and design.
Based upon the current radiological status of the facility, no isolation or controls are needed prior to implementing the final status survey.
4.4 Selection of DCGLs
Residual levels of radioactive material that correspond to allowable radiation dose standards are calculated by analysis of various pathways and scenarios (direct radiation, inhalation, ingestion, etc.) through which exposures could occur. These derived levels, known as derived concentration guideline levels (DCGLs), are presented in terms of surface or mass activity concentrations. DCGLs usually refer to average levels of radiation or radioactivity above appropriate background levels. DCGLs applicable to building or other structural surfaces are expressed in units of activity per surface area (typically Bq/m2 or dpm/1 00 cm2
). When applied to soil, sediments or structural materials where the radionuclides are distributed throughout the mass, DCGLs are expressed in units of activity per unit of mass (typically Bq/kg or pCi/g).
RESRAD-BUILD v3.5 was selected to perform site-specific dose modeling of impacted structural surfaces. RESRAD-BUILD is a computer code designed to evaluate the radiation doses from RESidual RADioactivity in BUILDings. The RESRAD-BUILD code was developed by Argonne National Laboratory (ANL) under sponsorship of the Department of Energy (DOE) and other federal agencies.
Since the end use scenario entails continued use of the buildings for industrial purposes, the Building Occupancy Scenario described in NUREG/CR-5512, Volume 1, (8) was selected to estimate potential radiation doses from radioactive material in buildings at the Middletown site. The average member of the critical group is defined as an adult individual engaging in work within the buildings following license termination. The person occupies and carries out light to moderate work activities inside the building for a full year of employment. The breathing rate applied in the sensitivity analysis was appropriate for light to moderate activity.
Results of the probabilistic sensitivity analysis and parameter selections for the RESRAD-BUILD code runs are presented in RSCS TSD 14-003 (13) which was previously submitted to the Commission and state of Connecticut for review and was subsequently approved for use by the NRC. Using a conservative methodology that included the radon pathway, a site-specific total surface activity TD-Ni concentration DCGLw of 354 dpm/1 00 cm2 was calculated for use at P&W. This DCGLw corresponds to the state of Connecticut release criterion of less than 19 mrem/year. (13) This DCGLw is extremely conservative for the following reasons:
1. It is based upon an extremely small room size relative to most rooms at the Middletown and East Hartford facilities which results in higher inhalation doses due to the smaller ratio of air volume to room surface area.
Page 19 of 33 Subject to the export control restrictions on the title page of this document
Rev. 1
Pratt & Whitney East Hartford Site Final Status Survey Plan
2. The inhalation pathway is the predominant dose contributor and the receptor is modeled at 1 meter above the floor.
3. NUREG/CR-6755 allows evaluation of Building Occupancy Scenario exposures with the radon pathway turned off, the DCGLw is based upon deterministic calculations with the radon pathway on.
4. Building Air Exchange parameter was the most sensitive parameter and air was set to the 25th percentile value of the distribution.
5. Source release times (RFO) were set at 10,000 days which corresponds to the 9th percentile of the distribution.
The removable contamination activity concentration will be set at 1 0% of the total activity DCGLw which is equal to 35 dpm/1 00 cm2
. Further explanation regarding the need for site specific DCGLs and their conservatism is provided in RSCS TSD 14-003. (13)
5.0 FINAL STATUS SURVEY DESIGN
The general approach prescribed by MARSSIM for final status surveys requires that at least some minimum number of measurements or samples be taken within a survey unit, so that the non-parametric statistical tests used for data assessment can be applied with adequate confidence or statistical power. Decisions regarding whether a given survey unit meets the applicable release criterion are made based on the results of these tests. Scanning measurements are used to check the design basis for the survey by evaluating if any small areas of elevated activity exist that would require reclassification, a tighter grid spacing for the fixed measurements, or both. However, MARSSIM also recognizes that alternatives to this general approach for final status surveys exist. Specifically, MARSSIM states that if the equipment and methodology used for scanning are capable of providing data of the same quality as fixed measurements (e.g., detection limit, location of measurements, ability to record and document results), then scanning may be used in place of fixed measurements, provided that results are documented for at least the number of locations that would have been necessary had fixed measurements been used.
Under MARSSIM, the level of survey effort required for a given survey unit is determined by the potential for contamination as indicated by its classification. Class 3 survey units receive judgmental scanning and randomly located measurements or samples. Class 2 survey units receive scanning over a portion of the survey unit based on the potential for contamination, combined with fixed measurements or sampling performed on a systematic grid. Class 1 survey units receive scanning over 100% of the survey unit combined with fixed measurements or sampling performed on a systematic grid. Depending on the sensitivity of the scanning method, the grid spacing may need to be adjusted to ensure that small areas of elevated activity are detected.
For combinations of fixed measurements and traditional scanning, the MARSSIM methodology is to select a requisite number of measurement locations to satisfy confidence limits for the nonparametric statistical test to be used for data evaluation and to account for sample losses or data anomalies. The purpose of scans is to confirm that the area was properly classified and that any small areas of elevated activity are within acceptable levels (i.e., are less than the applicable DCGLEMc). Depending on the sensitivity of the scanning method used, the number of fixed measurement locations may need to be increased so the spacing between measurements is reduced.
Page 20 of 33 Subject to the export control restrictions on the title page of this document
Rev. 1

.. Pratt & Whitney East Hartford Site Final Status Survey Plan
Since all survey units at the site are Class 3, judgmental scanning will be performed in each survey unit.
For fixed measurements, MARSSIM states that MDCs should be as far below the DCGLw as possible, with values less than 10% of the DCGLw being preferred, and up to 50% of the DCGLw being acceptable.
5.1 Selecting the Number of Fixed Measurements and Locations
The MARSSIM methodology for evaluating whether a survey unit meets its applicable release criterion using fixed measurements plus scans is based on using non-parametric statistical tests for data assessment. Specifically, the methods of MARSSIM are based on two non-parametric tests: the Wilcoxon Rank Sum (WRS) test and the Sign test. The WRS test is a two sample test, making it applicable in cases where data are being compared against background data from an appropriate reference area. The Sign test is a one sample test, making it appropriate for radionuclide-specific measurements where the contaminant of interest does not appear in background or for gross activity measurements where background has been subtracted or is negligible when compared to the DCGL.
Because the approved DCGL is much greater than the background, the Sign test will be used for evaluating survey data at the East Hartford site. Additional fixed measurements and samples beyond the minimum required at biased locations will be obtained to ensure the data has sufficient statistical power to assess if the survey unit passes or fails the statistical test.
5.1.1 Establishing Acceptable Decision Error Rates
One input to the process of selecting the required number of data points for a given survey, which does not depend on the statistical test applied, is the selection of the acceptable decision error rates. Decision errors refer to making false decisions by either rejecting a null hypothesis when it is true (a Type I error) or accepting a null hypothesis when it is false (a Type II error). If the null hypothesis is that the survey unit of interest contains residual contamination in excess of the applicable release criterion, a Type I error refers to concluding that an area meets the release criteria when in fact it does not. The probability of making a Type I error is referred to as alpha (a). Likewise, a Type II error refers to concluding a unit does not meet the release criteria when it actually does. The probability of making a Type II error is denoted beta(~). Selecting values of a or p that are too low will result in an excessive number of fixed measurements being required. Likewise, selecting a p value that is too large can result in excessive costs in that survey units that meet the release criterion could be subjected to superfluous remediation efforts.
For final status surveys, the null hypothesis is that the survey unit of interest contains residual contamination in excess of the applicable release criterion. Both the a and p decision error rates for final status surveys designed for the East Hartford site will be set at 0.05.
5.1.2 Determining the Relative Shift
Another input to the process of selecting the required number of measurements that is somewhat independent of the statistical test to be employed is the determination of what is called the relative shift. The relative shift is a parameter that quantifies the concentrations to be measured in a survey unit relative to the variability in these measurements. The relative shift is
Page 21 of 33 Subject to the export control restrictions on the title page of this document
Rev. 1
'.
Pratt & Whitney East Hartford Site Final Status Survey Plan
a function of the DCGLw, a parameter called the "lower bound of the gray region" (LBGR), and the expected standard deviation of the measurements to be made in the survey unit (cr).
The cr value is selected by using existing characterization or remediation support survey data or by making preliminary measurements. Since most of the survey data are non-detection MDA levels, the sigma value cannot be calculated. In accordance with MARSSIM, when preliminary data are not obtained, it may be reasonable to assume a coefficient of variation on the order of 30%, based on experience.
The relative shift (11/cr) is computed as the quotient of the difference between the DCGL and the LBGR (11 or shift) and the appropriate standard deviation value.
To compute the relative shift, the appropriate sigma value and an initial LBGR are selected. Per MARSSIM, the initial value for the LBGR will be set to one-half of the DCGLw. If the resulting relative shift is not between 1.0 and 3.0, the LBGR is adjusted until it is. If the relative shift is too low, the LBGR is decreased; and if the relative shift is too high, the LBGR is increased.
Assuming a cr value of 0.3, the value for the relative shift is calculated as:
Relative shift= (0.5 I 0.3) = 1.67.
The value for the relative shift used in the determination of the number of measurements for the final status surveys at the East Hartford site will be conservatively decreased to 1.5; the lower the number, the more the measurements or samples.
5.1.3 Selecting the Required Number of Measurements for the Sign Test
The minimum number of fixed measurements required when using the Sign test is computed by the following equation:
where: N = Z1-a. = Z1-~ = Sign p =
N = (z1-a + z1-fJ )z 4(Sign p-o.sy
the minimum number of measurements required; the percentile represented by the a decision error; the percentile represented by the~ decision error; and the probability that a random measurement from the survey unit will be less than the DCGLw when the survey unit median concentration is equal to the LBGR.
Values for N will be taken from Table 5-5 of MARSSIM. (6)
Using the relative shift value of 1.5, and the a and ~decision error rate values of 0.05, the minimum number of measurements for each survey unit from Table 5-5 of MARSSIM is equal to eighteen (18). Additional measurements at biased locations will be added to for each survey unit.
Page 22 of 33 Subject to the export control restrictions on the title page of this document
Rev. 1
Pratt & Whitney East Hartford Site Final Status Survey Plan
5.1.4 Determining Measurement Locations
For Class 1 and Class 2 survey units, fixed measurements will be performed over a systematic measurement pattern consisting of a grid having either a triangular or a square pitch. The pitch (grid spacing) will be determined based on the number of measurements required and whether the desired grid is triangular or square. Given that a triangular grid in general is more efficient than a square grid for detecting small areas of elevated activity, triangular grids should be employed for final status surveys involving fixed measurements in Class 1 and Class 2 survey units when practical. Systematic grids will not be used for surveys involving fixed measurements for Class 3 units. Instead, fixed measurement locations will be selected at random throughout the survey unit area.
All survey units at the East Hartford site are designated as Class 3; therefore, all measurement locations will be selected at random. In addition to randomly selected locations, additional biased sample locations will be added (e.g. near floor drains, TD-Ni historical storage and use areas). If the exact location of a randomly selected measurement location is inaccessible due to the current manufacturing use in the area, it will be noted in the Survey Package and the nearest accessible location will be surveyed preserving the random nature of the measurement location selection process.
5.2 Data Investigations
5.2.1 Investigation Levels
An important aspect of the final status survey is the selection and implementation of investigation levels. Investigation levels are levels of radioactivity used to indicate when additional investigations may be necessary. Investigation levels also serve as a quality control check to determine when a measurement process begins to deviate from expected norms. For example, a measurement that exceeds an investigation level may indicate a failing instrument or an improper measurement. However, in general, investigation levels are used to confirm that survey units have been properly classified.
When an investigation level is exceeded, the first step is to confirm that the initial measurement/sample actually exceeds the particular investigation level. Depending on the results of the investigation actions, the survey unit may subsequently require reclassification, remediation, and/or resurvey. Investigation levels are established for each class of survey unit. The investigation levels (criteria), to be employed for the East Hartford site final status survey effort, are given in Table 5-1.
Page 23 of 33 Subject to the export control restrictions on the title page of this document
Rev. 1

Pratt & Whitney East Hartford Site Final Status Survey Plan
Table 5-1 Investigation Levels
Survey Unit For fixed measurements or For scan measurements, perform Classification samples, perform investigation if: investigation if:
Class 1 > DCGLEMC or> DCGLw and a > DCGLEMC statistical outlier.
Class 2 > DCGLw > DCGLw or> MDCscan if MDCscan is greater than the DCGLw
Class 3 > 0.5 x DCGLw Detectable over background.
Because all survey units at East Hartford are designated as Class 3, a fixed measurement that is greater than 0.5 x DCGLw will be investigated. Any scan measurement that shows a positive indication over background will also be investigated.
5.2.2 Investigations
Locations where initial measurements give results that exceed an applicable investigation level will be identified for confirmatory measurements. If it is confirmed that residual activity exists in excess of the investigation level, additional measurements will be made to determine the extent of the area of elevated activity and to provide reasonable assurance that other areas of elevated activity do not exist. Potential sources of the elevated activity will be postulated and evaluated against the original classification of the survey unit. Documentation will be compiled containing the results from the investigation surveys and showing any areas where residual activity was confirmed to be in excess of the investigation level. If residual activity in excess of the applicable investigation level is confirmed, the documentation will also address the potential source(s) of the activity and the impact this has on the original classification assigned to the survey unit. A decision will then be made regarding re-classification of the unit in whole or in part. The NRC and the CT DEEP will be notified of any survey unit re-classifications and the size limits in Table 4-1 will be used.
5.3 Survey Implementation and Data Collection
The requirements and objectives outlined in this plan will be incorporated into a survey package for each survey unit, which addresses various elements of the survey, including, but not limited to:
• maps of the survey unit and measurement/wipe sample locations, as appropriate; • applicable DCGLs; • instrumentation to be used; • types and quantities of measurements (including backgrounds) and wipe samples to be
made or collected; • investigation criteria; • QA/QC requirements (e.g., response checks, etc.); • applicable health and safety procedures; and • applicable operating procedures.
5.3.1 Survey Methods
The survey methods to be employed in the final status surveys will consist of combinations of scanning, fixed measurements and wipes to meet the survey objectives. Note that in some
Page 24 of 33 Subject to the export control restrictions on the title page of this document
Rev. 1

Pratt & Whitney East Hartford Site Final Status Survey Plan
cases, the same instrument may be used for more than one type of survey. For instance, a zinc sulfide (ZnS) detector may be used in either a scanning mode or for fixed measurements.
5.3.1.1 Scanning
Scanning is the process by which the operator uses portable radiation detection instruments to detect the presence of radionuclides on a specific surface (i.e., ground, wall, floor, equipment). The term scanning survey is used to describe the process of moving portable radiation detectors across a surface with the intent of locating residual radioactivity. Investigation levels for scanning surveys are determined during survey planning to identify areas of elevated activity. Scanning surveys are performed to locate radiation anomalies indicating residual gross activity that may require further investigation or action.
No matter what survey approach is selected (combination of instrumentation and techniques), one of the most important elements of a survey is a priori scanning to confirm that the unit is properly classified and to identify any areas where residual activity levels are elevated relative to the DCGLw. The purpose of scanning is to detect areas of residual activity that may not be detected by other measurement methods. Thus, scanning should always be performed prior to any fixed measurements or sample collections in a survey unit.
Table 5-2, based upon guidance in MARSSIM, gives the areal coverage requirements when scanning is used with fixed measurements.
Table 5-2 Traditional Scanning Coverage Requirements
Survey Unit Classification Recommended Scanning Coverage Class 1 100%
Class 2 Outdoor areas, floors, or lower walls of buildings: 10% to 100%
Class 3 Judgmental
Because all survey units at East Hartford are Class 3, only judgmental scanning will be performed in each survey unit. A minimum of a 1 meter radius will be scanned around each direct measurement location. If any direct measurement results in an investigation, additional scanning locations and direct measurements, in the vicinity of the investigation location, will be selected and surveyed to determine the extent of the area of elevated activity and to provide reasonable assurance that other areas of elevated activity do not exist. Survey packages will instruct personnel performing scans to stop and investigate further upon any indication of activity above background.
5.3.1.2 Fixed Measurements
Fixed measurements are taken by placing the instrument at the appropriate distance above the surface, taking a discrete measurement for a pre-determined time interval, and recording the reading. Fixed measurements may be collected at random locations in a survey unit or may be collected at systematic locations and supplement scanning surveys for the identification of small areas of elevated activity. Fixed measurements may also be collected at locations identified by scanning surveys as part of an investigation to determine the source of the elevated instrument response. Professional judgment may also be used to identify locations for fixed measurements to further define the areal extent of contamination.
Page 25 of 33 Subject to the export control restrictions on the title page of this document
Rev. 1
...
Pratt & Whitney East Hartford Site Final Status Survey Plan
A minimum of eighteen (18) fixed measurements will be collected in each survey unit at the East Hartford site. An additional 3 to 5 biased fixed measurements will be performed in each survey unit.
5.4 Survey Instrumentation
5.4.1 Instrument Selection
The selection and proper use of appropriate instruments for both fixed measurements and laboratory analyses is one of the most important factors in assuring that a survey accurately determines the radiological status of a survey unit and meets the survey objectives. The particular capabilities of a radiation detector establish its potential for being used in conducting a specific type of survey.
The radiation detectors to be used for final survey activities can be divided into three general classes:
• gas-filled detectors, • scintillation detectors, and • solid-state detectors.
Gas-filled detectors include ionization chambers, proportional counters (both gas-flow and pressurized) and Geiger-Mueller (GM) detectors. Scintillation detectors include plastic scintillators, zinc-sulfide (ZnS) detectors and sodium-iodide (Nal) detectors. Solid-state detectors include both n-type and p-type intrinsic germanium detectors.
Instrument detection limits are typically quantified in terms of their minimum detectable concentration, or MDC. The MDC is the concentration that a given instrument and measurement technique can be expected to detect 95% of the time under actual conditions of use.
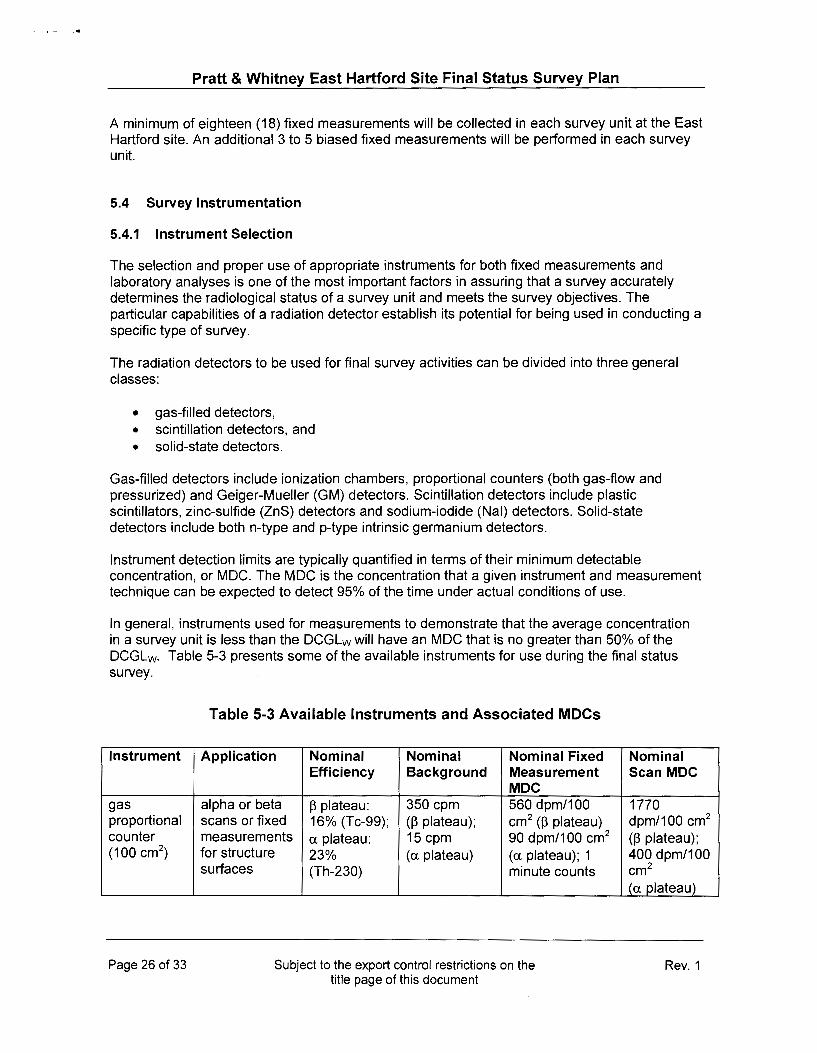
In general, instruments used for measurements to demonstrate that the average concentration in a survey unit is less than the DCGLw will have an MDC that is no greater than 50% of the DCGLw. Table 5-3 presents some of the available instruments for use during the final status survey.
Instrument
gas proportional counter (1 00 cm2
)
Page 26 of 33
Table 5-3 Available Instruments and Associated MDCs
Application Nominal Nominal Nominal Fixed Efficiency Background Measurement
MDC alpha or beta ~plateau: 350 cpm 560 dpm/100 scans or fixed 16% (Tc-99); (~ plateau); cm 2 (~ plateau) measurements a plateau: 15 cpm 90 dpm/1 00 cm2
for structure 23% (a plateau) (a plateau); 1 surfaces (Th-230) minute counts
Subject to the export control restrictions on the title page of this document
Nominal Scan MDC
1770 dpm/100 cm2
(~ plateau); 400 dpm/100 cm2
(a _plateau)_
Rev. 1

.. ...
Pratt & Whitney East Hartford Site Final Status Survey Plan
Instrument Application Nominal Nominal Nominal Fixed Nominal Efficiency Background Measurement Scan MDC
MDC dual- scans or fixed 20% (Tc-99) 300 cpm 420 dpm/100 1300 phosphor measurements 18% (13 mode); cm2 (13 mode); dpm/100 cm2
scintillator ; a. and 13, (Th-230) 6 cpm 80 dpm/1 00 cm2 (13 mode); (100 cm2
) independently (a. mode) (a. mode) 400 dpm/100 or cm2
simultaneously _(a. mode) ZnS alpha scans or 19% 2 cpm 50 dpm/1 00 em:< 400 dpm/100 scintillator fixed (Th-230) (1 minute count cm2
(100 cm2) measurements time)
on structure surfaces
5.4.2 Calibration and Maintenance
All instrumentation used for measurements to demonstrate compliance with the radiological criterion for license termination will be calibrated and maintained under approved procedures. Instruments will be calibrated for normal use under typical field conditions. Calibration standards will be traceable to the National Institute of Standards and Technology (NIST). If external vendors are used for instrument calibration or maintenance, these services must have a QA program.
Instruments used to measure gross beta surface activity will be calibrated to Tc-99 or Co-60. Th-230 will be used to calibrate instruments used to assess alpha surface activity. Instrument efficiencies may require modifications to account for surface conditions or coverings. Such modifications, if necessary, will be established using the information in Section 5 of NUREG-1507 (15) and pertinent site characterization data.
5.4.3 Response Checks
Instrumentation will be response checked in accordance with RSCS Final Status Survey procedures which require an instrument response check prior to and after each survey. If the instrument response does not fall within the established range, the instrument will be removed from use until the reason for the deviation can be resolved and acceptable response again demonstrated. If the instrument fails a post-survey source check, all data collected during that time period with the instrument will be carefully reviewed and possibly adjusted or discarded, depending on the cause of the failure.
5.4.4 MDC calculations
Before any measurements are performed, the instruments and techniques to be used must be shown to have sufficient detection capability relative to the applicable DCGLs. The detection capability of a given instrument and measurement technique is quantified by its MDC.
5.4.4.1 MDCs for Fixed Measurements
Per NUREG-1507 (15), MDCs for fixed measurements are computed as
Page 27 of 33 Subject to the export control restrictions on the title page of this document
Rev. 1

- \. . Pratt & Whitney East Hartford Site Final Status Survey Plan
MDC 3+4.65..jCa fixed Kt
Where: 3 and 4.65 =constants as described in NUREG-1507; C8 = background counts during the measurement time interval (t); t = measurement time; and K = a proportionality constant that relates the detector response to the activity level
in the sample being measured.
The proportionality constant K typically encompasses the detector efficiency, self-absorption factors and probe area corrections, as required.
5.4.4.2 MDCs for Beta-Gamma Scan Surveys for Structure Surfaces
MDCs for surface scans for structure surfaces for beta and gamma emitters will be computed via
Where: 1.38 8 p E;
Es A t
1.38-18 d 0 2 MDCstructure,scan = (~) pm/10 em
..jP&i& s 100 t
= sensitivity index; = number of background counts in time interval t; = surveyor efficiency; =instrument efficiency for the emitted radiation (cpm per dpm); = source efficiency (intensity) in emissions per disintegration; =sensitive area of the detector (cm2
); and = time interval of the observation while the probe passes over the source (minutes).
The value of 1.38 used for the sensitivity index corresponds to a 95% confidence level for detection of a concentration at the scanning MDC with a false positive rate of 60%. The numerator in the equation represents the minimum detectable count rate that the observer would "see" at the performance level represented by the sensitivity index. The surveyor efficiency (p) will be taken to be 0.5, as recommended by MARSSIM. The factor of 100 corrects for probe areas that are not 100 cm2
• In the case of a scan measurement, the counting interval is the time the probe is actually over the source of radioactivity. This time depends on scan speed, the size of the source, and the fraction of the detector's sensitive area that passes over the source; with the latter depending on the direction of probe travel. The source efficiency term (Es) in the equation may be adjusted to account for effects such as self-absorption, as appropriate.
5.4.4.3 MDCs for Alpha Scan Surveys for Structure Surfaces
In cases where alpha scan surveys may be required, MDCs must be quantified differently than those for beta-gamma surveys because the background count rate from a typical alpha survey instrument is nearly zero (1 to 3 counts per minute typically). Since the time that an area of alpha activity is under the probe varies and the background count rates of alpha survey
Page 28 of 33 Subject to the export control restrictions on the title page of this document
Rev. 1

.,.,
Pratt & Whitney East Hartford Site Final Status Survey Plan
instruments is so low, it is not practical to determine a fixed MDC for scanning. Instead, it is more useful to determine the probability of detecting an area of contamination at a predetermined DCGL for given scan rates.
For alpha survey instrumentation with a background around one to three counts per minute, a single count will give a surveyor sufficient cause to stop and investigate further. Thus, the probability of detecting given levels of alpha emitting radionuclides can be calculated by use of Poisson summation statistics. Doing so (see Section 6.7.2.2 and Appendix J of MARSSIM for details), one finds that the probability of detecting an area of alpha activity of 300 dpm/1 00cm2
at a scan rate of 3 em per second (roughly 1 inch per second) is 90% if the probe dimension in the direction of the scan is 10 em. If the probe dimension in the scan direction is halved to 5 em, the detection probability is still 70%. These values will be used to evaluate MDCs for alpha surveys of structure surfaces against the applicable DCGLs for the purposes of survey design. If for some reason lower MDCs are desired, then scan speeds can be adjusted, within practical limits, via the methods of Section 6.7.2.2 and Appendix J of the MARSSIM.
We currently are planning to perform alpha scans at a very slow speed; between 1 and 2 inches per second with a scintillation detector such as the Ludlum 43-89 moving in the 4 inch (1 0 em) width direction. Using Figure J.4 in MARSSIM, we estimate the probability of detecting 2 counts over a 1 00cm2 source equal to our site-specific DCGL to be between 70 and 90 percent.
5.4.4.4 MDCs for Wipe Samples
The following equation will be used to determine the wipe MDC:
Where: MDC = Minimum Detectable Concentration in dpm/1 00 cm2
k1 =one-sided confidence level factor for the chosen confidence level (95% =1.645) Rb = background count rate in cpm ts = sample count time in minutes tb = background count time in minutes E = detector efficiency in counts per disintegration N1 00 = accounts for the area of the wipe sample
The first term is normally rounded up from 2.7 to 3 as recommended by NUREG-1575, MARSSIM. The wipes may be counted on an automatic proportional counter such as a Protean WPC 9550. These counters have internal software to calculate the MDC or LLD. These calculations will use the same or a similar equation presented above. Ambient background levels, background and sample count times and efficiencies will be maintained to ensure the MDC does not exceed 50% of the DCGLw.
Page 29 of 33 Subject to the export control restrictions on the title page of this document
Rev. 1

Pratt & Whitney East Hartford Site Final Status Survey Plan
6.0 SURVEY DATA ASSESSMENT
6.1 Initial Evaluation
Prior to evaluating the data collected from a survey unit against the release criterion, the data are first confirmed to have been acquired in accordance with all applicable procedures and QA/QC requirements. Any discrepancies between the data quality or the data collection process and the applicable requirements are resolved and documented prior to proceeding with data analysis. Data assessment will be performed by trained personnel using approved site procedures.
The first step in the data assessment process is to convert all of the survey results to DCGL units. Next, the individual measurements and sample concentrations will be compared to DCGL levels for evidence of small areas of elevated activity or results that are statistical outliers relative to the rest of the measurements. Graphical analyses of survey data that depict the spatial correlation of the measurements are especially useful for such assessments and will be used, if necessary, to the extent practical. The results may indicate that additional data or additional remediation and resurvey may be necessary.
Interpreting the results from a survey is most straightforward when all measurements are higher or lower than the DCGLw. In such cases, the decision that a survey unit meets or exceeds the release criterion requires little in terms of data analysis. However, formal statistical tests provide a valuable tool when a survey unit's measurements are neither clearly above nor entirely below the DCGLw.
The first step in evaluating the data for a given survey unit is to draw simple comparisons between the measurement results and the release criterion. The result of these comparisons will be one of three conclusions: 1) the unit meets the release criterion; 2) the unit does not meet the release criterion; or 3) no conclusion can be drawn from simple comparisons and thus one of the non-parametric statistical tests must be applied.
For final status survey data collected at the East Hartford site, the initial data evaluation will be as described in Table 6-1.
Table 6-1 Initial Evaluation of Survey Results
Evaluation Result Conclusion All measured concentrations less than the
Survey unit meets the release criterion DCGLw Average concentration exceeds the Survey unit does not meet the release DCGLw criterion Individual measurement result(s) exceeds the DCGLw and the average concentration Conduct the Sign test is less than the DCGLw
6.2 Sign Test
Radionuclide specific measurements for which the radionuclide(s) of interest either does not exist in background or is present in a concentration that is a small fraction of the DCGLw can be evaluated using the Sign test. In addition, the Sign test may be used to evaluate gross activity
Page 30 of 33 Subject to the export control restrictions on the title page of this document
Rev. 1

...
Pratt & Whitney East Hartford Site Final Status Survey Plan
measurements from survey units containing multiple materials by subtracting the appropriate background from each measurement.
If any individual measurement result in a survey unit exceeds the DCGLw, then the Sign Test will be performed on the data in that survey unit.
The Sign test is applied as described in the following steps:
• For each survey unit measurement, subtract the measurement from the DCGLw and record the differences.
• Discard any difference that is exactly zero and reduce the total number of measurements (N) by the number of zero differences.
• Count the number of positive differences. This value is the test statistic S+. • Compare the number of positive difference (S+) to the critical values from Table 1.3 of
the MARSSIM for the appropriate values of N (total measurements) and a (decision error rate). (A positive difference corresponds to a measurement below the DCGLw and contributes evidence that the survey unit meets the release criterion.)
If S+ is greater than the critical value in Table 1.3, then the null hypothesis is rejected and the alternate accepted.
Though it is not anticipated, if any of the data collected from a final status survey are reported as "less than MDC" or as background, these data will be assigned a value of the MDC for the measurement technique employed for purposes of applying the Sign test.
6.3 Data Assessment Conclusions
The result of the data assessment is the decision to reject or not to reject the null hypothesis. A rejection of the null hypothesis leads to the decision that the survey unit meets the release criterion. If the data assessment concludes that the null hypothesis cannot be rejected, this may be due to one of two things: 1) the average residual concentration in the survey unit exceeds the DCGLw; or 2) the analysis did not have adequate statistical power. "Power" in this context refers to the probability that the null hypothesis is rejected when it is indeed false. Quantitatively, the power is 1 -~'where~ is the Type II error rate (the probability of accepting the null hypothesis when it is actually false). A retrospective power analysis can be used in the event that a survey unit is found not to meet the release criterion to determine if this is indeed due to excess residual activity or if it is due to an inadequate sample size.
Retrospective power analyses, if necessary, will be performed following the methods of MARSSIM Sections 1.9 for the Sign test. If the analysis finds that an inadequate number of samples were collected to support the data assessment for a given survey unit, additional samples may be collected and the analysis repeated. Increasing the number of samples (measurements) acquired within a given survey unit increases the probability of rejecting the null hypothesis when it is indeed false. Likewise, if the analysis with the additional samples still concludes that the residual concentration in the survey unit exceeds the DCGLw, then the unit must be remediated and resurveyed.
Page 31 of 33 Subject to the export control restrictions on the title page of this document
Rev. 1

Pratt & Whitney East Hartford Site Final Status Survey Plan
6.4 ALARA Evaluations
In order to terminate a license, a licensee must demonstrate that the dose criteria in Subpart E of 10 CRR Part 20 have been met and must demonstrate whether it is feasible to further reduce the levels of residual radioactivity to levels below those necessary to meet the dose criteria (i.e., to levels that are "as low as is reasonably achievable" (ALARA)). Appendix Din NUREG-1727 (16) describes methods acceptable to the Nuclear Regulatory Commission (NRC) staff for determining when it is feasible to further reduce the concentrations of residual radioactivity to below the concentrations necessary to meet the dose criteria.
"Reasonably achievable" is judged by considering the state of technology and the economics of improvements in relation to all the benefits from these improvements. However, a comprehensive consideration of risks and benefits will include risks from non-radiological hazards. An action taken to reduce radiation risks should not result in a significantly larger risk from other hazards.
Based upon the Historical Site Assessment, we believe the average residual radioactivity in each of the survey units to be a very small fraction (<5%) of the DCGLw. If the average residual radioactivity in any survey unit exceeds 50% of the DCGL (177 dpm/1 00 cm2
; equivalent to 9.5 mrem/y), an ALARA evaluation will be performed to determine if remediation of that survey unit is cost effective. A base value of $2000 per person-rem, increased for inflation at a rate of 3% per year, will be used in the evaluation.
7.0 FINAL STATUS SURVEY REPORT
A single final status survey report will be written for all survey units at the site. The documentation describing the final status survey should include:
• a physical description of the survey units;
• the classification of the survey units;
• a discussion of the survey design (combination of scans, fixed measurements and wipe samples used; number of measurements, etc.);
• tabular and if necessary, graphical depictions of survey results;
• discussions of data assessments including graphical depictions if necessary;
• calculation of the estimated dose from the average residual radioactivity in each survey unit; and
• a statement that the survey unit meets the applicable release criteria.
The final status survey report will be compiled after final status survey activities for all of the survey units are completed.
Page 32 of 33 Subject to the export control restrictions on the title page of this document
Rev. 1

Pratt & Whitney East Hartford Site Final Status Survey Plan
8.0 QUALITY ASSURANCE AND QUALITY CONTROL MEASURES
Standard Operating Procedures (SOPs) will govern the survey design process, survey performance and data assessment (decision making). The final status survey design will be carried out in accordance with the SOPs, resulting in the generation of raw data.
Quality assurance and quality control activities include: • surveys are performed by trained individuals; • surveys are performed with approved written procedures; • use of properly calibrated instruments; • QC checks will be performed as prescribed by the implementing procedures
9.0 REFERENCES
1. NRC Materials License SMB-151, United Technologies Corporation Pratt and Whitney, NRC Form 374 Amendment No. 18, August 9, 2010 Issued by NRC January 11, 2011. 2. 10 CFR 40.42 Expiration and termination of licenses and decommissioning of sites and separate buildings or outdoor areas. 3. 10 CFR 20 Standards for Protection Against Radiation, Subpart E-Radiological Criteria for License Termination. 4. Adoption of the 19 mrem per year total dose equivalent standard for remediation of sources of ionizing radiation within the State of Connecticut, Connecticut, State of, Office of the Attorney General Letter, From Robert D. Snook (Assistant Attorney Genera. 5. Remediation Standard Regulations,§ 22a-133k, Hartford, CT, January 30, 1996. 6. NUREG-1575, "Multi-Agency Radiation Survey and Site Investigation Manual (MARSSIM}," dated December 1997. 7. NUREG-1757 Vol. 2, Rev. 1 Consolidated Decommissioning Guidance, Characterization, Survey, and Determination of Radiological Criteria. September 2006 http://www. nrc. govlreading-rmldoc-col/ectionslnuregslstafflsr1757 I. 8. NUREG/CR-5512 Voi1,Residual Radioactive Contamination From DecommissioningTechnical Basis for Translating Contamination Levels to Annual Total Effective Dose Equivalent, October 1992. 9. RSCS TSD No. 14-003, "Site-Specific Pratt & Whitney Building Surface DCGL Using REARAD-BUILD. 10. NUREG-1507, "Minimum Detectable Concentrations with Typical Radiation Survey Instruments for Various Contaminants and Field Conditions,June 1998. 11. NUREG-1727, "NMSS Decommissioning Standard Review Plan", September 2000. 12. NRC IE Circular No. 81-07 and HPPOD 072, Control of Radioactively Contaminated Material, Office oflnspection and Enforcement, May 14, 1981 http://pbadupws. nrc.gov/docs/ML 1 034/ML 1 03420362.pdf 13. NRC Region 11nspection No. 030-90001195-001, dated Aug 2, 1995. 14. NRC Inspection Report No. 040-0079112012-002 July 22 2013. 15. United Technologies Corp. Amendment Request Ltr Dated February 18, 2013 ML 13063A520. 16. United Technologies Corp Letter to NRC Requesting Continuation of License Amendment to Remove Building 10 from SMB-151 Dated June 19, 2013. 17. NRC United Technologies Corporation, Pratt and Whitney, License Amendment, Control No. 581153, August 26, 2013.
Page 33 of 33 Subject to the export control restrictions on the title page of this document
Rev. 1

Page 10 of 33
Pratt & Whitney Middletown Site Final Status Survey Plan
COmlfUT
Figure 3-1 Middletown Site Map
PRATT & WHITNEY
MIDDLETOWN FACILITY
Subject to the export control restrictions on the title page of this document
1,.._.._........,..__.....cloto.....,._t,o_...,.._...,.I1M
~ --- PU11t I _.... ..
Rev.2

,.
Pratt & Whitney Middletown Site Final Status Survey Plan
4.0 SURVEY PLANNING
4.1 Classification of Survey Areas and Units
The adequacy of the final status survey process rests upon partitioning the site into properly classified survey units of appropriate physical area. The following definitions are taken from MARSSIM.
• Class 1 Areas: Areas that have, or had prior to remediation, a potential for radioactive contamination (based on site operating history) or known contamination (based on previous radiation surveys) above the DCGLw. Examples of Class 1 areas include: 1) site areas previously subjected to remedial actions, 2) locations where leaks or spills are known to have occurred, 3) former burial or disposal sites, 4) waste storage sites, and 5) areas with contaminants in discrete solid pieces of material and high specific activity.
• Class 2 Areas: Areas that have, or had prior to remediation, a potential for radioactive contamination or known contamination, but are not expected to exceed the DCGLw. To justify changing the classification from Class 1 to Class 2, there should be measurement data that provides a high degree of confidence that no individual measurement would exceed the DCGLw. Examples of areas that might be classified as Class 2 for the final status survey include: 1) locations where radioactive materials were present in an unsealed form, 2) potentially contaminated transport routes, 3) areas downwind from stack release points, 4) upper walls and ceilings of buildings or rooms subjected to airborne radioactivity, 5) areas handling low concentrations of radioactive materials, and 6) areas on the perimeter of former contamination control areas.
• Class 3 Areas: Any impacted areas that are not expected to contain any residual radioactivity, or are expected to contain levels of residual radioactivity at a small fraction of the DCGLw, based on site operating history and previous radiation surveys. Examples of areas that might be classified as Class 3 include buffer zones around Class 1 or Class 2 areas, and areas with very low potential for residual contamination but insufficient information to justify a non-impacted classification. Survey Units
Class 1 areas have the greatest potential for contamination and therefore receive the highest degree of survey effort for the final status survey using a graded approach, followed by Class 2, and then by Class 3. Non-impacted areas do not receive any level of survey coverage because they have no potential for residual contamination. Non-impacted areas are determined on a sitespecific basis. A survey unit can have only one classification.
Based upon the Historical Site Assessment, the impacted area is limited to Buildings 220 and 410 and all survey units in the P&W Middletown facility are designated as Class 3. Survey units are limited in size based on classification, exposure pathway modeling assumptions, and sitespecific conditions. The surface area limits shown in Table 4-1 are consistent with the guidance in MARSSIM.
Page 11 of 33 Subject to the export control restrictions on the title page of this document
Rev. 2

Pratt & Whitney Middletown Site Final Status Survey Plan
Table 4-1 Survey Unit Surface Area Limits
Survey Unit Description Surface Area Limit Classification
Class 1 Structures
::::100m2
(floor area) Land areas ::::2000 m2
Structures 1 00 m2
- 1 , 000 m2
Class 2 (floor area) Land areas 2,000 m2
- 10,000 m2
Structures no limit
Class 3 (floor area) Land areas no limit
Table 4-2 presents the survey units at the Middletown facility subject to final status survey.
Table 4-2 Final Status Survey Units
Surve_y Unit Description Class Survey Scope 1 220M East Half 3 Floor only 2 220M West Half 3 Floor only 3 220A Building Northeast Quadrant 3 Floor only 4 220A Building Northwest Quadrant 3 Floor only 5 220A Building Southeast Quadrant 3 Floor only 6 220A Building Southwest Quadrant 3 Floor only
7 Building 410 Engine Test Cells (8) 3 Walls and Exhaust Pipe only
8 Building 140 3 Floor only 9 Building 440 3 Floor only 10 Building 150 3 Floor only
Figure 4-1 presents the survey units in Building 220, Figure 4-2 presents the survey units in Building 410, Figure 4-3 presents the single survey unit Building 140, Figure 4-4 presents the single survey unit Building 440 and Figure 4-5 presents the single survey unit Building 150. If survey units are added or re-classified, the NRC and state will be notified and the size limits in Table 4-1 will be used.
4.2 Reference Areas and Materials
If any of the radionuclides of concern are present in background, establishing reference background concentrations may be necessary to identify and evaluate contributions attributable to site operations. Background concentrations can be determined via measurements made in one or more reference areas selected to represent the baseline radiological conditions for the site. In addition, measurements may be required to establish background levels for various construction materials to accommodate gross activity (non-radionuclide-specific) measurements.
Page 12 of 33 Subject to the export control restrictions on the title page of this document
Rev. 2

Pratt & Whitney Middletown Site Final Status Survey Plan
The material background levels are expected to be insignificant when compared to the DCGL. It is currently envisioned that a general area background measurement will be collected with each instrument prior to taking direct measurements and scanning. This measurement will be collected in the center of the room/area at waist height. If other materials with high natural radioactivity are encountered in the survey unit and are part of the final status survey, we may take background measurements on similar non-impacted materials. The final method of which background will be used will be specified in the Final Status Survey Package for that survey unit.
Page 13 of 33 Subject to the export control restrictions on the title page of this document
Rev. 2
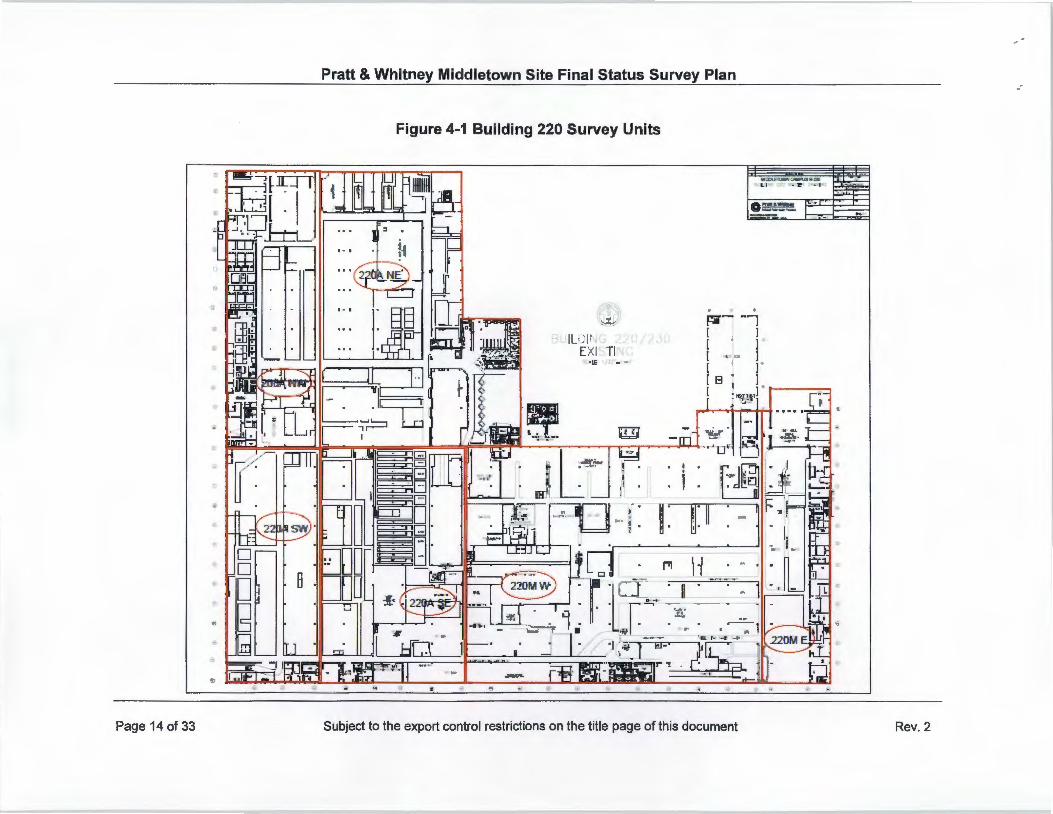
Page 14 of 33
Pratt & Whitney Middletown Site Final Status Survey Plan
Figure 4-1 Building 220 Survey Units
, %,
IL I __ E I Tl r->..
·IE •-
;. r r-1
~"ftfl4
\L.LI!Joot-.-.~•'DJ
• Ll "'· ~ · - 1
0 !!!!.!.!!!!!!!! ---
. ' ~~ -~
[ I I ' I t ,, "" 1 I . I [ 13 ; l [ : "'1!t'l
~ ~-
Subject to the export control restrictions on the title page of this document
.·
Rev.2

Pratt & Whitney Middletown Site Final Status Survey Plan
Figure 4-2 Building 410 Survey Units
- L 1 0
AilS Test Oel s are oonsidered as 1 Survey Unit
Page 15 of 33 Subject to the export control restrictions on the title page of this document Rev.2
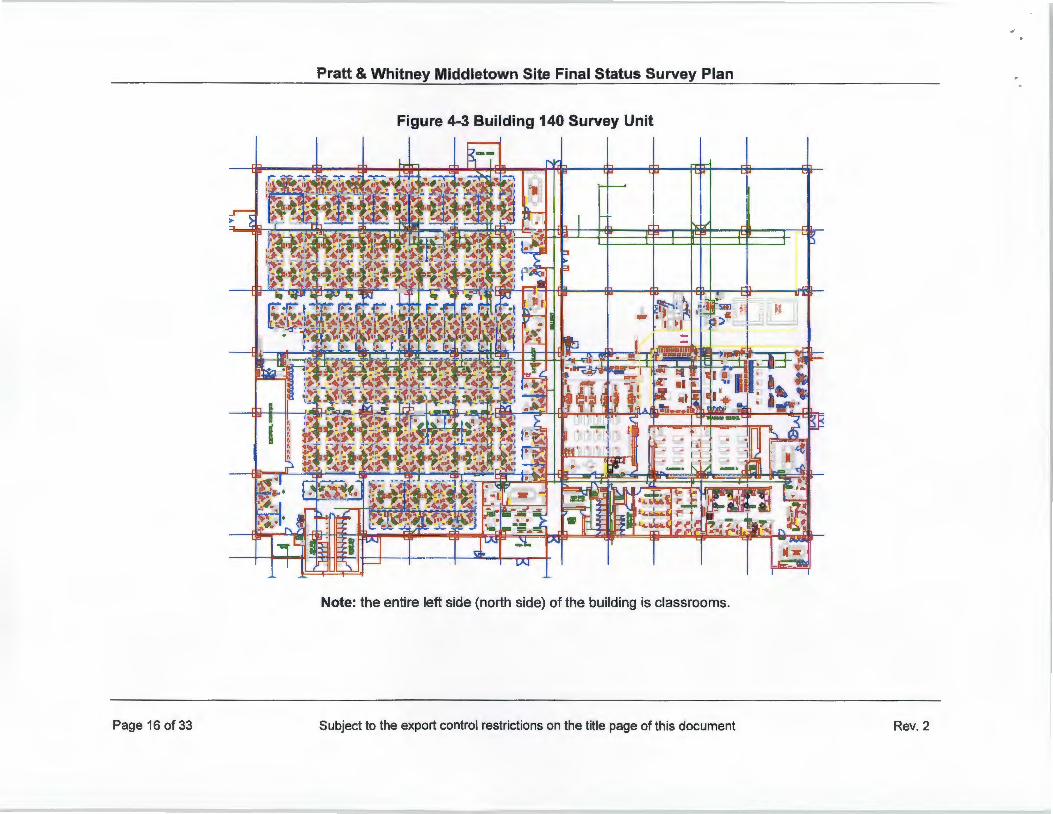
Pratt & Whitney Middletown Site Final Status Survey Plan
Figure 4-3 Building 140 Survey Unit
Note: the entire left side (north side) of the building is classrooms.
Page 16 of 33 Subject to the export control restrictions on the title page of this document Rev. 2

·3
Page 17 of 33
Pratt & Whitney Middletown Site Final Status Survey Plan
Figure 4-4 Building 440 Survey Unit
(!) "' 'r' lllio... ..........
{0 <•) . I ' (~ (•'
I i i
G I
e· BUILDLNG 440 IMM.liC S~P)
'lllia ........ nt .......... _....dlo ... .. _,.,. ">""11M or IT All
(;)
0
Subject to the export control restrictions on the title page of this document
~tr~'*7-;.u_ ~,1-'... .-... =,~~80 ~~ ~--~~~ ..... 0 ,..,....., 1..~•'-• -"...~I
.._::...-::.- I .. II:', .a· G'".;.i:.~~-
" .
"
Rev.2

. \
Page 18 of 33
Pratt & Whitney Middletown Site Final Status Survey Plan
Figure 4-5 Building 150 Survey Unit
Subject to the export control restrictions on the title page of this document
B- l50 ,.. T II
Rev. 2

Pratt & Whitney Middletown Site Final Status Survey Plan
4.3 Area Preparation: Isolation and Control
Before final status survey activities can begin in an area, a transition must occur where planned decommissioning activities are completed and the area is subsequently assessed to scope the required isolation and control measures. This includes establishing if the area is ready for final survey activities and identifying any work practice issues that must be addressed in survey planning and design.
Based upon the current radiological status of the facility, no isolation or controls are needed prior to implementing the final status survey.
4.4 Selection of DCGLs
Residual levels of radioactive material that correspond to allowable radiation dose standards are calculated by analysis of various pathways and scenarios (direct radiation, inhalation, ingestion, etc.) through which exposures could occur. These derived levels, known as derived concentration guideline levels (DCGLs), are presented in terms of surface or mass activity concentrations. DCGLs usually refer to average levels of radiation or radioactivity above appropriate background levels. DCGLs applicable to building or other structural surfaces are expressed in units of activity per surface area (typically Bq/m2 or dpm/1 00 cm2
). When applied to soil, sediments or structural materials where the radionuclides are distributed throughout, DCGLs are expressed in units of activity per unit of mass (typically Bq/kg or pCi/g).
RESRAD-BUILD v3.5 was selected to perform site-specific dose modeling of impacted structural surfaces. RESRAD-BUILD is a computer code designed to evaluate the radiation doses from RESidual RADioactivity in BUILDings. The RESRAD-BUILD code was developed by Argonne National Laboratory (ANL) under sponsorship of the Department of Energy (DOE) and other federal agencies.
Since the end use scenario entails continued use of the buildings for industrial purposes, the Building Occupancy Scenario described in NUREG/CR-5512, Volume 1, was selected to estimate potential radiation doses from radioactive material in buildings at the Middletown site. The average member of the critical group is defined as an adult individual engaging in work within the buildings following license termination. The person occupies and carries out light to moderate work activities inside the building for a full year of employment. The breathing rate applied in the sensitivity analysis was appropriate for light to moderate activity.
Results of the probabilistic sensitivity analysis and parameter selections for the RESRAD-BUILD code runs are presented in RSCS TSD 14-003 (13) which was previously submitted to the Commission and state of Connecticut for review. Using a conservative methodology that included the radon pathway, a site-specific total surface activity TD-Ni concentration DCGLw of 354 dpm/1 00 cm2 was calculated for use at P&W. This DCGLw corresponds to the state of Connecticut release criterion of less than 19 mrem/year. ( 13) This DCGLw is extremely conservative for the following reasons:
1. It is based upon an extremely small room size relative to most rooms at the Middletown and East Hartford facilities which results in higher inhalation doses due to the smaller ratio of air volume to room surface area.
Page 19 of 33 Subject to the export control restrictions on the title page of this document
Rev. 2

..
Pratt & Whitney Middletown Site Final Status Survey Plan
2. The inhalation pathway is the predominant dose contributor and the receptor is modeled at 1 meter above the floor.
3. NUREG/CR-6755 allows evaluation of Building Occupancy Scenario exposures with the radon pathway turned off, the DCGLw is based upon deterministic calculations with the radon pathway on.
4. Building Air Exchange parameter was the most sensitive parameter and air was set to the 25th percentile value of the distribution.
5. Source release times (RFO) were set at 10,000 days which corresponds to the 9th percentile of the distribution.
The removable contamination activity concentration will be set at 10% of the total activity DCGLw which is equal to 35 dpm/1 00 cm2
. Further explanation regarding the need for site specific DCGLs and their conservatism is provided in RSCS TSD 14-003. (13)
One modification will be made to the site-specific DCGLw. One survey unit, Building 140, was previously used to support CANEL operations. At the time of the previous license termination surveys, beta/gamma residual radioactivity was detected in the floor from those operations. At 5000 dpm/100 cm2 the maximum residual Cs-137 and Co-60 activity is approximately 21.4% of the site-specific DCGL assuming 5000 dpm/1 00 cm2 each of Cs-137 and Co-60 was present at the time of license termination in 1994 Therefore, for final status surveys in Building 140, the site-specific DCGL will be reduced to 278 dpm/1 00 cm2 to account for any residual beta/gamma radioactivity from the CANEL operations.
5.0 FINAL STATUS SURVEY DESIGN
The general approach prescribed by MARSSIM for final status surveys requires that at least some minimum number of measurements or samples be taken within a survey unit, so that the non-parametric statistical tests used for data assessment can be applied with adequate confidence or statistical power. Decisions regarding whether a given survey unit meets the applicable release criterion are made based on the results of these tests. Scanning measurements are used to check the design basis for the survey by evaluating if any small areas of elevated activity exist that would require reclassification, a tighter grid spacing for the fixed measurements, or both. However, MARSSIM also recognizes that alternatives to this general approach for final status surveys exist. Specifically, MARSSIM states that if the equipment and methodology used for scanning are capable of providing data of the same quality as fixed measurements (e.g., detection limit, location of measurements, ability to record and document results), then scanning may be used in place of fixed measurements, provided that results are documented for at least the number of locations that would have been necessary had fixed measurements been used.
Under MARSSIM, the level of survey effort required for a given survey unit is determined by the potential for contamination as indicated by its classification. Class 3 survey units receive judgmental scanning and randomly located measurements or samples. Class 2 survey units receive scanning over a portion of the survey unit based on the potential for contamination, combined with fixed measurements or sampling performed on a systematic grid. Class 1 survey units receive scanning over 100% of the survey unit combined with fixed measurements or sampling performed on a systematic grid. Depending on the sensitivity of the scanning method, the grid spacing may need to be adjusted to ensure that small areas of elevated activity are detected.
Page 20 of 33 Subject to the export control restrictions on the title page of this document
Rev. 2

Pratt & Whitney Middletown Site Final Status Survey Plan
For combinations of fixed measurements and traditional scanning, the MARSSIM methodology is to select a requisite number of measurement locations to satisfy confidence limits for the nonparametric statistical test to be used for data evaluation and to account for sample losses or data anomalies. The purpose of scans is to confirm that the area was properly classified and that any small areas of elevated activity are within acceptable levels (i.e., are less than the applicable DCGLEMc). Depending on the sensitivity of the scanning method used, the number of fixed measurement locations may need to be increased so the spacing between measurements is reduced.
Since all survey units at the site are Class 3, judgmental scanning will be performed in each survey unit.
For fixed measurements, MARSSIM states that MDCs should be as far below the DCGLw as possible, with values less than 10% of the DCGLw being preferred, and up to 50% of the DCGLw being acceptable.
5.1 Selecting the Number of Fixed Measurements and Locations
The MARSSIM methodology for evaluating whether a survey unit meets its applicable release criterion using fixed measurements plus scans is based on using non-parametric statistical tests for data assessment. Specifically, the methods of MARSSIM are based on two non-parametric tests: the Wilcoxon Rank Sum (WRS) test and the Sign test. The WRS test is a two sample test, making it applicable in cases where data are being compared against background data from an appropriate reference area. The Sign test is a one sample test, making it appropriate for radionuclide-specific measurements where the contaminant of interest does not appear in background or for gross activity measurements where background has been subtracted or is negligible when compared to the DCGL.
Because the proposed DCGL is much greater than the background, the Sign test will be used for evaluating survey data at the Middletown site. Additional fixed measurements and samples beyond the minimum required at biased locations will be obtained to ensure the data has sufficient statistical power to assess if the survey unit passes or fails the statistical test.
5.1.1 Establishing Acceptable Decision Error Rates
One input to the process of selecting the required number of data points for a given survey, which does not depend on the statistical test applied, is the selection of the acceptable decision error rates. Decision errors refer to making false decisions by either rejecting a null hypothesis when it is true (a Type I error) or accepting a null hypothesis when it is false (a Type II error). If the null hypothesis is that the survey unit of interest contains residual contamination in excess of the applicable release criterion, a Type I error refers to concluding that an area meets the release criteria when in fact it does not. The probability of making a Type I error is referred to as alpha (a). Likewise, a Type II error refers to concluding a unit does not meet the release criteria when it actually does. The probability of making a Type II error is denoted beta(~). Selecting values of a or ~ that are too low will result in an excessive number of fixed measurements being required. Likewise, selecting a ~value that is too large can result in excessive costs in that survey units that meet the release criterion could be subjected to superfluous remediation efforts.
Page 21 of 33 Subject to the export control restrictions on the title page of this document
Rev. 2

t
Pratt & Whitney Middletown Site Final Status Survey Plan
For final status surveys, the null hypothesis is that the survey unit of interest contains residual contamination in excess of the applicable release criterion. Both the a. and ~decision error rates for final status surveys designed for the Middletown site will be set at 0.05.
5.1.2 Determining the Relative Shift
Another input to the process of selecting the required number of measurements that is somewhat independent of the statistical test to be employed is the determination of what is called the relative shift. The relative shift is a parameter that quantifies the concentrations to be measured in a survey unit relative to the variability in these measurements. The relative shift is a function of the DCGLw, a parameter called the "lower bound of the gray region" (LBGR), and the expected standard deviation of the measurements to be made in the survey unit (a).
The a value is selected by using existing characterization or remediation support survey data or by making preliminary measurements. Since most of the survey data are non-detection MDA levels, the sigma value cannot be calculated. In accordance with MARSSIM, when preliminary data are not obtained, it may be reasonable to assume a coefficient of variation on the order of 30%, based on experience.
The relative shift (11/a) is computed as the quotient of the difference between the DCGL and the LBGR (!:::. or shift) and the appropriate standard deviation value.
To compute the relative shift, the appropriate sigma value and an initial LBGR are selected. Per MARSSIM, the initial value for the LBGR will be set to one-half of the DCGLw. If the resulting relative shift is not between 1.0 and 3.0, the LBGR is adjusted until it is. If the relative shift is too low, the LBGR is decreased; and if the relative shift is too high, the LBGR is increased.
Assuming a a value of 0.3, the value for the relative shift is calculated as:
Relative shift= (0.5 I 0.3) = 1.67.
The value for the relative shift used in the determination of the number of measurements for the final status surveys at the Middletown site will be conservatively decreased to 1.5; the lower the number, the more the measurements or samples.
5.1.3 Selecting the Required Number of Measurements for the Sign Test
The minimum number of fixed measurements required when using the Sign test is computed by the following equation: -
where: N = Z1-a = Z1-~ = Sign p =
Page 22 of 33
N = (z1-a + z1-f3 )2 4(Sign p-o.sy
the minimum number of measurements required; the percentile represented by the a. decision error; the percentile represented by the ~ decision error; and the probability that a random measurement from the survey unit will be less than the DCGLw when the survey unit median concentration is equal to the LBGR.
Subject to the export control restrictions on the title page of this document
Rev. 2

•
Pratt & Whitney Middletown Site Final Status Survey Plan
Values for N will be taken from Table 5-5 of MARSSIM. (6)
Using the relative shift value of 1.5, and the a and ~decision error rate values of 0.05, the minimum number of measurements for each survey unit from Table 5-5 of MARSSIM is equal to eighteen (18). Additional measurements at biased locations will be added to for each survey unit.
5.1.4 Determining Measurement Locations
For Class 1 and Class 2 survey units, fixed measurements will be performed over a systematic measurement pattern consisting of a grid having either a triangular or a square pitch. The pitch (grid spacing) will be determined based on the number of measurement required and whether the desired grid is triangular or square. Given that a triangular grid in general is more efficient than a square grid for detecting small areas of elevated activity, triangular grids should be employed for final status surveys involving fixed measurements in Class 1 and Class 2 survey units when practical. Systematic grids will not be used for surveys involving fixed measurements for Class 3 units. Instead, fixed measurement locations will be selected at random throughout the survey unit area.
All survey units at the Middletown site are designated as Class 3; therefore, all measurement locations will be selected at random. In addition to randomly selected locations, additional biased sample locations will be added (e.g. near floor drains, TD-Ni historical storage and use areas). If the exact location of a randomly selected measurement location is inaccessible due to the current manufacturing use in the area, it will be noted in the Survey Package and the nearest accessible location will be surveyed preserving the random nature of the measurement location selection process.
5.2 Data Investigations
5.2.1 Investigation Levels
An important aspect of the final status survey is the selection and implementation of investigation levels. Investigation levels are levels of radioactivity used to indicate when additional investigations may be necessary. Investigation levels also serve as a quality control check to determine when a measurement process begins to deviate from expected norms. For example, a measurement that exceeds an investigation level may indicate a failing instrument or an improper measurement. However, in general, investigation levels are used to confirm that survey units have been properly classified.
When an investigation level is exceeded, the first step is to confirm that the initial measurement/sample actually exceeds the particular investigation level. Depending on the results of the investigation actions, the survey unit may subsequently require reclassification, remediation, and/or resurvey. Investigation levels are established for each class of survey unit. The investigation levels (criteria), to be employed for the Middletown site final status survey effort, are given in Table 5-1.
Page 23 of 33 Subject to the export control restrictions on the title page of this document
Rev. 2

Pratt & Whitney Middletown Site Final Status Survey Plan
Table 5-1 Investigation Levels
Survey Unit For fixed measurements or For scan measurements, perform Classification samples, perform investigation if: investigation if:
Class 1 > DCGLEMC or> DCGLw and a > DCGLEMC statistical outlier.
Class 2 > DCGLw > DCGLw or> MDCscan if MDCscan is greater than the DCGLw
Class 3 > 0.5 x DCGLw Detectable over background.
Because all survey units at Middletown are designated as Class 3, a fixed measurement that is greater than 0.5 x DCGLw will be investigated. Any scan measurement that shows a positive indication over background will also be investigated.
5.2.2 Investigations
Locations where initial measurements give results that exceed an applicable investigation level will be identified for confirmatory measurements. If it is confirmed that residual activity exists in excess of the investigation level, additional measurements will be made to determine the extent of the area of elevated activity and to provide reasonable assurance that other areas of elevated activity do not exist. Potential sources of the elevated activity will be postulated and evaluated against the original classification of the survey unit. Documentation will be compiled containing the results from the investigation surveys and showing any areas where residual activity was confirmed to be in excess of the investigation level. If residual activity in excess of the applicable investigation level is confirmed, the documentation will also address the potential source(s) of the activity and the impact this has on the original classification assigned to the survey unit. A decision will then be made regarding re-classification of the unit in whole or in part. The NRC and the CT DEEP will be notified of any survey unit re-classifications and the size limits in Table 4-1 will be used ..
5.3 Survey Implementation and Data Collection
The requirements and objectives outlined in this plan will be incorporated into a survey package for each survey unit, which addresses various elements of the survey, including, but not limited to:
• maps of the survey unit and measurement/wipe sample locations, as appropriate; • applicable DCGLs; • instrumentation to be used; • types and quantities of measurements (including backgrounds) and wipe samples to be
made or collected; • investigation criteria; • QA/QC requirements (e.g., response checks, etc.); • applicable health and safety procedures; and • applicable operating procedures.
5.3.1 Survey Methods
The survey methods to be employed in the final status surveys will consist of combinations of scanning, fixed measurements and wipes to meet the survey objectives. Note that in some
Page 24 of 33 Subject to the export control restrictions on the title page of this document
Rev. 2
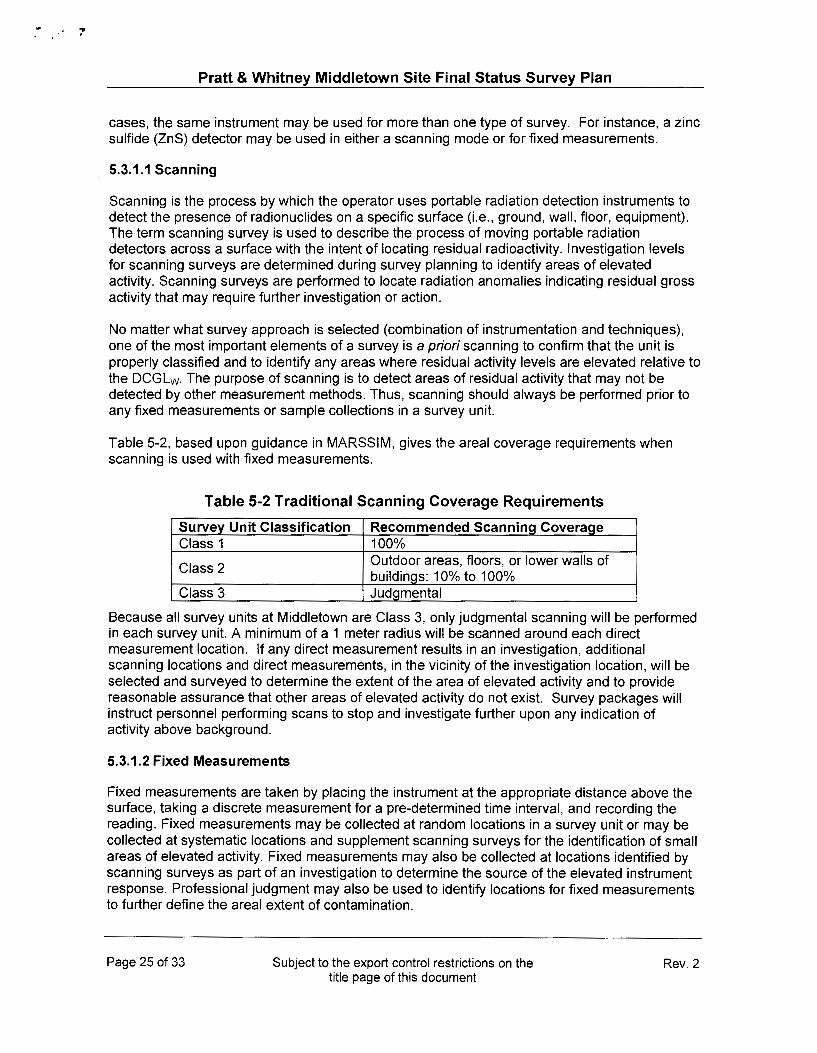
Pratt & Whitney Middletown Site Final Status Survey Plan
cases, the same instrument may be used for more than one type of survey. For instance, a zinc sulfide (ZnS) detector may be used in either a scanning mode or for fixed measurements.
5.3.1.1 Scanning
Scanning is the process by which the operator uses portable radiation detection instruments to detect the presence of radionuclides on a specific surface (i.e., ground, wall, floor, equipment). The term scanning survey is used to describe the process of moving portable radiation detectors across a surface with the intent of locating residual radioactivity. Investigation levels for scanning surveys are determined during survey planning to identify areas of elevated activity. Scanning surveys are performed to locate radiation anomalies indicating residual gross activity that may require further investigation or action.
No matter what survey approach is selected (combination of instrumentation and techniques), one of the most important elements of a survey is a priori scanning to confirm that the unit is properly classified and to identify any areas where residual activity levels are elevated relative to the DCGLw. The purpose of scanning is to detect areas of residual activity that may not be detected by other measurement methods. Thus, scanning should always be performed prior to any fixed measurements or sample collections in a survey unit.
Table 5-2, based upon guidance in MARSSIM, gives the areal coverage requirements when scanning is used with fixed measurements.
Table 5-2 Traditional Scanning Coverage Requirements
Survey Unit Classification Recommended Scanning Coverage Class 1 100%
Class 2 Outdoor areas, floors, or lower walls of buildings: 10% to 100%
Class 3 Judgmental
Because all survey units at Middletown are Class 3, only judgmental scanning will be performed in each survey unit. A minimum of a 1 meter radius will be scanned around each direct measurement location. If any direct measurement results in an investigation, additional scanning locations and direct measurements, in the vicinity of the investigation location, will be selected and surveyed to determine the extent of the area of elevated activity and to provide reasonable assurance that other areas of elevated activity do not exist. Survey packages will instruct personnel performing scans to stop and investigate further upon any indication of activity above background.
5.3.1.2 Fixed Measurements
Fixed measurements are taken by placing the instrument at the appropriate distance above the surface, taking a discrete measurement for a pre-determined time interval, and recording the reading. Fixed measurements may be collected at random locations in a survey unit or may be collected at systematic locations and supplement scanning surveys for the identification of small areas of elevated activity. Fixed measurements may also be collected at locations identified by scanning surveys as part of an investigation to determine the source of the elevated instrument response. Professional judgment may also be used to identify locations for fixed measurements to further define the areal extent of contamination.
Page 25 of 33 Subject to the export control restrictions on the title page of this document
Rev. 2

Pratt & Whitney Middletown Site Final Status Survey Plan
A minimum of eighteen (18) fixed measurements will be collected in each survey unit at the Middletown site. An additional 3 to 5 biased fixed measurements will be performed in each survey unit.
5.4 Survey Instrumentation
5.4.1 Instrument Selection
The selection and proper use of appropriate instruments for both fixed measurements and laboratory analyses is one of the most important factors in assuring that a survey accurately determines the radiological status of a survey unit and meets the survey objectives. The particular capabilities of a radiation detector establish its potential for being used in conducting a specific type of survey.
The radiation detectors to be used for final survey activities can be divided into three general classes:
• gas-filled detectors, • scintillation detectors, and • solid-state detectors.
Gas-filled detectors include ionization chambers, proportional counters (both gas-flow and pressurized) and Geiger-Mueller (GM) detectors. Scintillation detectors include plastic scintillators, zinc-sulfide (ZnS) detectors and sodium-iodide (Nal) detectors. Solid-state detectors include both n-type and p-type intrinsic germanium detectors.
Instrument detection limits are typically quantified in terms of their minimum detectable concentration, or MDC. The MDC is the concentration that a given instrument and measurement technique can be expected to detect 95% of the time under actual conditions of use.
In general, instruments used for measurements to demonstrate that the average concentration in a survey unit is less than the DCGLw will have an MDC that is no greater than 50% of the DCGLw. Table 5-3 presents some of the available instruments for use during the final status survey.
Instrument
gas proportional counter (100 cm2
)
Page 26 of 33
Table 5-3 Available Instruments and Associated MDCs
Application Nominal Nominal Nominal Fixed Efficiency Background Measurement
MDC alpha or beta ~plateau: 350 cpm 560 dpm/100 scans or fixed 16% (Tc-99); (~ plateau); cm2 (~ plateau) measurements a plateau: 15 cpm 90 dpm/1 00 cm2
for structure 23% (a plateau) (a plateau); 1 surfaces (Th-230) minute counts
Subject to the export control restrictions on the title page of this document
Nominal Scan MDC
1770 dpm/100 cm2
W plateau); 400 dpm/100 cm2
(a plateau)
Rev. 2

..
Pratt & Whitney Middletown Site Final Status Survey Plan
Instrument Application Nominal Nominal Nominal Fixed Nominal Efficiency Background Measurement Scan MDC
MDC dual- scans or fixed 20% (Tc-99) 300 cpm 420 dpm/100 1300 phosphor measurements 18% (p mode); cm2 (p mode); dpm/100 cm2
scintillator ; a. and p, (Th-230) 6 cpm 80 dpm/1 00 cm2 (p mode); (100 cm2
) independently (a. mode) (a. mode) 400 dpm/100 or cm 2
simultaneously (a. mode) ZnS alpha scans or 19% 2 cpm 50 dpm/1 00 cm2 400 dpm/100 scintillator fixed (Th-230) (1 minute count cm2
(100 cm2) measurements time)
on structure surfaces
5.4.2 Calibration and Maintenance
All instrumentation used for measurements to demonstrate compliance with the radiological criterion for license termination will be calibrated and maintained under approved procedures. Instruments will be calibrated for normal use under typical field conditions. Calibration standards will be traceable to the National Institute of Standards and Technology (NIST). If external vendors are used for instrument calibration or maintenance, these services must have a QA program.
Instruments used to measure gross beta surface activity will be calibrated to Tc-99 or Co-60. Th-230 will be used to calibrate instruments used to assess alpha surface activity. Instrument efficiencies may require modifications to account for surface conditions or coverings. Such modifications, if necessary, will be established using the information in Section 5 of NUREG-1507 (15) and pertinent site characterization data.
5.4.3 Response Checks
Instrumentation will be response checked in accordance with RSCS Final Status Survey procedures which require an instrument response check prior to and after each survey. If the instrument response does not fall within the established range, the instrument will be removed from use until the reason for the deviation can be resolved and acceptable response again demonstrated. If the instrument fails a post-survey source check, all data collected during that time period with the instrument will be carefully reviewed and possibly adjusted or discarded, depending on the cause of the failure.
5.4.4 MDC calculations
Before any measurements are performed, the instruments and techniques to be used must be shown to have sufficient detection capability relative to the applicable DCGLs. The detection capability of a given instrument and measurement technique is quantified by its MDC.
5.4.4.1 MDCs for Fixed Measurements
Per NUREG-1507 (15), MDCs for fixed measurements are computed as
Page 27 of 33 Subject to the export control restrictions on the title page of this document
Rev. 2
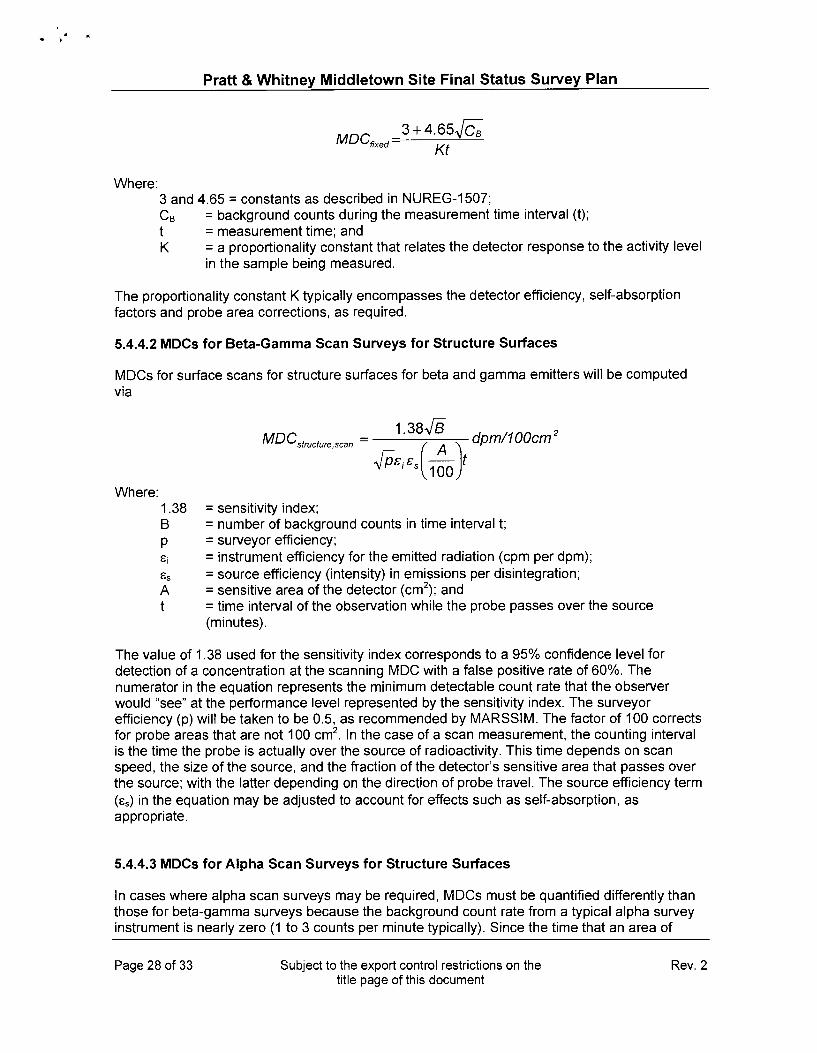
" . '
Pratt & Whitney Middletown Site Final Status Survey Plan
3+4.65..jCa MDCfixed Kt
Where: 3 and 4.65 =constants as described in NUREG-1507; C8 = background counts during the measurement time interval (t); t =measurement time; and K = a proportionality constant that relates the detector response to the activity level
in the sample being measured.
The proportionality constant K typically encompasses the detector efficiency, self-absorption factors and probe area corrections, as required.
5.4.4.2 MDCs for Beta-Gamma Scan Surveys for Structure Surfaces
MDCs for surface scans for structure surfaces for beta and gamma emitters will be computed via
Where: 1.38 B p E;
Es A t
1.38-JB 2
MDCstructure.scan = (~) dpm/100cm
.jp&;&s 100 f
= sensitivity index; = number of background counts in time interval t; = surveyor efficiency; =instrument efficiency for the emitted radiation (cpm per dpm); = source efficiency (intensity) in emissions per disintegration; =sensitive area of the detector (cm2
); and = time interval of the observation while the probe passes over the source (minutes).
The value of 1.38 used for the sensitivity index corresponds to a 95% confidence level for detection of a concentration at the scanning MDC with a false positive rate of 60%. The numerator in the equation represents the minimum detectable count rate that the observer would "see" at the performance level represented by the sensitivity index. The surveyor efficiency (p) will be taken to be 0.5, as recommended by MARSSIM. The factor of 100 corrects for probe areas that are not 100 cm2
. In the case of a scan measurement, the counting interval is the time the probe is actually over the source of radioactivity. This time depends on scan speed, the size of the source, and the fraction of the detector's sensitive area that passes over the source; with the latter depending on the direction of probe travel. The source efficiency term (Es) in the equation may be adjusted to account for effects such as self-absorption, as appropriate.
5.4.4.3 MDCs for Alpha Scan Surveys for Structure Surfaces
In cases where alpha scan surveys may be required, MDCs must be quantified differently than those for beta-gamma surveys because the background count rate from a typical alpha survey instrument is nearly zero (1 to 3 counts per minute typically). Since the time that an area of
Page 28 of 33 Subject to the export control restrictions on the title page of this document
Rev.2

' .. ' I
Pratt & Whitney Middletown Site Final Status Survey Plan
alpha activity is under the probe varies and the background count rates of alpha survey instruments is so low, it is not practical to determine a fixed MDC for scanning. Instead, it is more useful to determine the probability of detecting an area of contamination at a predetermined DCGL for given scan rates.
For alpha survey instrumentation with a background around one to three counts per minute, a single count will give a surveyor sufficient cause to stop and investigate further. Thus, the probability of detecting given levels of alpha emitting radionuclides can be calculated by use of Poisson summation statistics. Doing so (see Section 6.7.2.2 and Appendix J of MARSSIM for details), one finds that the probability of detecting an area of alpha activity of 300 dpm/1 00cm2
at a scan rate of 3 em per second (roughly 1 inch per second) is 90% if the probe dimension in the direction of the scan is 10 em. If the probe dimension in the scan direction is halved to 5 em, the detection probability is still 70%. These values will be used to evaluate MDCs for alpha surveys of structure surfaces against the applicable DCGLs for the purposes of survey design. If for some reason lower MDCs are desired, then scan speeds can be adjusted, within practical limits, via the methods of Section 6.7.2.2 and Appendix J of the MARSSIM.
We currently are planning to perform alpha scans at a very slow speed; between 1 and 2 inches per second with a scintillation detector such as the Ludlum 43-89 moving in the 4 inch (1 0 em) width direction. Using Figure J.4 in MARSSIM, we estimate the probability of detecting 2 counts over a 1 00cm2 source equal to our site-specific DCGL to be between 70 and 90 percent.
5.4.4.4 MDCs for Wipe Samples
The following equation will be used to determine the wipe MDC:
Where: MDC = Minimum Detectable Concentration in dpm/1 00 cm2
k1 =one-sided confidence level factor for the chosen confidence level (95% =1.645) Rb = background count rate in cpm ts = sample count time in minutes tb = background count time in minutes E = detector efficiency in counts per disintegration A/1 00 = accounts for the area of the wipe sample
The first term is normally rounded up from 2.7 to 3 as recommended by NUREG-1575, MARSSIM. The wipes may be counted on an automatic proportional counter such as a Protean WPC 9550. These counters have internal software to calculate the MDC or LLD. These calculations will use the same or a similar equation presented above. Ambient background levels, background and sample count times and efficiencies will be maintained to ensure the MDC does not exceed 50% of the DCGLw.
Page 29 of 33 Subject to the export control restrictions on the title page of this document
Rev. 2

. . / ..
Pratt & Whitney Middletown Site Final Status Survey Plan
6.0 SURVEY DATA ASSESSMENT
6.1 Initial Evaluation
Prior to evaluating the data collected from a survey unit against the release criterion, the data are first confirmed to have been acquired in accordance with all applicable procedures and QAIQC requirements. Any discrepancies between the data quality or the data collection process and the applicable requirements are resolved and documented prior to proceeding with data analysis. Data assessment will be performed by trained personnel using approved site procedures.
The first step in the data assessment process is to convert all of the survey results to DCGL units. Next, the individual measurements and sample concentrations will be compared to DCGL levels for evidence of small areas of elevated activity or results that are statistical outliers relative to the rest of the measurements. Graphical analyses of survey data that depict the spatial correlation of the measurements are especially useful for such assessments and will be used, if necessary, to the extent practical. The results may indicate that additional data or additional remediation and resurvey may be necessary.
Interpreting the results from a survey is most straightforward when all measurements are higher or lower than the DCGLw. In such cases, the decision that a survey unit meets or exceeds the release criterion requires little in terms of data analysis. However, formal statistical tests provide a valuable tool when a survey unit's measurements are neither clearly above nor entirely below the DCGLw.
The first step in evaluating the data for a given survey unit is to draw simple comparisons between the measurement results and the release criterion. The result of these comparisons will be one of three conclusions: 1) the unit meets the release criterion; 2) the unit does not meet the release criterion; or 3) no conclusion can be drawn from simple comparisons and thus one of the non-parametric statistical tests must be applied.
For final status survey data collected at the Middletown site, the initial data evaluation will be as described in Table 6-1.
Table 6-1 Initial Evaluation of Survey Results
Evaluation Result Conclusion All measured concentrations less than the
Survey unit meets the release criterion DCGLw Average concentration exceeds the Survey unit does not meet the release DCGLw criterion Individual measurement result(s) exceeds the DCGLw and the average concentration Conduct the Sign test is less than the DCGLw
6.2 Sign Test
Radionuclide specific measurements for which the radionuclide(s) of interest either does not exist in background or is present in a concentration that is a small fraction of the DCGLw can be evaluated using the Sign test. In addition, the Sign test may be used to evaluate gross activity
Page 30 of 33 Subject to the export control restrictions on the title page of this document
Rev. 2

Pratt & Whitney Middletown Site Final Status Survey Plan
measurements from survey units containing multiple materials by subtracting the appropriate background from each measurement.
If any individual measurement result in a survey unit exceeds the DCGLw, then the Sign Test will be performed on the data in that survey unit.
The Sign test is applied as described in the following steps:
• For each survey unit measurement, subtract the measurement from the DCGLw and record the differences.
• Discard any difference that is exactly zero and reduce the total number of measurements (N) by the number of zero differences.
• Count the number of positive differences. This value is the test statisticS+. • Compare the number of positive difference (S+) to the critical values from Table 1.3 of
the MARSSIM for the appropriate values of N (total measurements) and a (decision error rate). (A positive difference corresponds to a measurement below the DCGLw and contributes evidence that the survey unit meets the release criterion.)
If S+ is greater than the critical value in Table 1.3, then the null hypothesis is rejected and the alternate accepted.
Though it is not anticipated, if any of the data collected from a final status survey are reported as "less than MDC" or as background, these data will be assigned a value of the MDC for the measurement technique employed for purposes of applying the Sign test.
6.3 Data Assessment Conclusions
The result of the data assessment is the decision to reject or not to reject the null hypothesis. A rejection of the null hypothesis leads to the decision that the survey unit meets the release criterion. If the data assessment concludes that the null hypothesis cannot be rejected, this may be due to one of two things: 1) the average residual concentration in the survey unit exceeds the DCGLw; or 2) the analysis did not have adequate statistical power. "Power" in this context refers to the probability that the null hypothesis is rejected when it is indeed false. Quantitatively, the power is 1 -~'where~ is the Type II error rate (the probability of accepting the null hypothesis when it is actually false). A retrospective power analysis can be used in the event that a survey unit is found not to meet the release criterion to determine if this is indeed due to excess residual activity or if it is due to an inadequate sample size.
Retrospective power analyses, if necessary, will be performed following the methods of MARSSIM Sections 1.9 for the Sign test. If the analysis finds that an inadequate number of samples were collected to support the data assessment for a given survey unit, additional samples may be collected and the analysis repeated. Increasing the number of samples (measurements) acquired within a given survey unit increases the probability of rejecting the null hypothesis when it is indeed false. Likewise, if the analysis with the additional samples still concludes that the residual concentration in the survey unit exceeds the DCGLw, then the unit must be remediated and resurveyed.
Page 31 of 33 Subject to the export control restrictions on the title page of this document
Rev. 2

.., ...
Pratt & Whitney Middletown Site Final Status Survey Plan
6.4 ALARA Evaluations
In order to terminate a license, a licensee must demonstrate that the dose criteria in Subpart E of 10 CRR Part 20 have been met and must demonstrate whether it is feasible to further reduce the levels of residual radioactivity to levels below those necessary to meet the dose criteria (i.e., to levels that are "as low as is reasonably achievable" (ALARA)). Appendix Din NUREG-1727 (16) describes methods acceptable to the Nuclear Regulatory Commission (NRC) staff for determining when it is feasible to further reduce the concentrations of residual radioactivity to below the concentrations necessary to meet the dose criteria.
"Reasonably achievable" is judged by considering the state of technology and the economics of improvements in relation to all the benefits from these improvements. However, a comprehensive consideration of risks and benefits will include risks from non-radiological hazards. An action taken to reduce radiation risks should not result in a significantly larger risk from other hazards.
Based upon the Historical Site Assessment, we believe the average residual radioactivity in each of the survey units to be a very small fraction (<5%) of the DCGLw. If the average residual radioactivity in any survey unit exceeds 50% of the DCGL (177 dpm/1 00 cm2
; equivalent to 9.5 mrem/y), an ALARA evaluation will be performed to determine if remediation of that survey unit is cost effective. A base value of $2000 per person-rem, increased for inflation at a rate of 3% per year, will be used in the evaluation.
7.0 FINAL STATUS SURVEY REPORT
A single final status survey report will be written for all survey units at the site. The documentation describing the final status survey should include:
• a physical description of the survey units;
• the classification of the survey units;
• a discussion of the survey design (combination of scans, fixed measurements and wipe samples used; number of measurements, etc.);
• tabular and if necessary, graphical depictions of survey results;
• discussions of data assessments including graphical depictions if necessary;
• calculation of the estimated dose from the average residual radioactivity in each survey unit; and
• a statement that the survey unit meets the applicable release criteria.
The final status survey report will be compiled after final status survey activities for all of the survey units are completed.
Page 32 of 33 Subject to the export control restrictions on the title page of this document
Rev. 2
..
Pratt & Whitney Middletown Site Final Status Survey Plan
8.0 QUALITY ASSURANCE AND QUALITY CONTROL MEASURES
Standard Operating Procedures (SOPs) will govern the survey design process, survey performance and data assessment (decision making). The final status survey design will be carried out in accordance with the SOPs, resulting in the generation of raw data.
Quality assurance and quality control activities include: • surveys are performed by trained individuals; • surveys are performed with approved written procedures; • use of properly calibrated instruments; • QC checks will be performed as prescribed by the implementing procedures
9.0 REFERENCES
1. NRC Materials License SMB-151, United Technologies Corporation Pratt and Whitney, NRC Form 374 Amendment No. 18, August 9, 2010 Issued by NRC January 11, 2011. 2. 10 CFR 40.42 Expiration and termination of licenses and decommissioning of sites and separate buildings or outdoor areas. 3. 10 CFR 20 Standards for Protection Against Radiation, Subpart E-Radiological Criteria for License Termination. 4. Adoption of the 19 mrem per year total dose equivalent standard for remediation of sources of ionizing radiation within the State of Connecticut, Connecticut, State of, Office of the Attorney General Letter, From Robert D. Snook (Assistant Attorney Genera. 5. Remediation Standard Regulations,§ 22a-133k, Hartford, CT, January 30, 1996. 6. NUREG-1575, "Multi-Agency Radiation Survey and Site Investigation Manual (MARSSIM)," dated December 1997. 7. NUREG-1757 Vol. 2, Rev. 1 Consolidated Decommissioning Guidance, Characterization, Survey, and Determination of Radiological Criteria. September 2006 http://www. nrc. govlreading-rmldoc-col/ectionslnuregs/stafflsr17 57 I. 8. United Technologies Corp. Amendment Request Ltr Dated February 18, 2013 ML 13063A520. 9. NRC Inspection Report No. 040-0079112012-002 July 22 2013. 10. United Technologies Corp Letter to NRC Requesting Continuation of License Amendment to Remove Building 10 from SMB-151 Dated June 19, 2013. 11. NRC United Technologies Corporation, Pratt and Whitney, License Amendment, Control No. 581153, August 26, 2013. 12. NRC Region 1 Inspection No. 030-90001195-001, dated Aug 2, 1995. 13. RSCS TSD No. 14-003, "Site-Specific Pratt & Whitney Building Surface DCGL Using REARAD-BUILD. 14. NRC IE Circular No. 81-07 and HPPOD 072, Control of Radioactively Contaminated Material, Office of Inspection and Enforcement, May 14, 1981 http://pbadupws. nrc. govldocs/ML 1 034/ML 1 03420362.pdf 15. NUREG-1507, "Minimum Detectable Concentrations with Typical Radiation Survey Instruments for Various Contaminants and Field Conditions,June 1998. 16. NUREG-1727, "NMSS Decommissioning Standard Review Plan", September 2000.
Page 33 of 33 Subject to the export control restrictions on the title page of this document
Rev. 2

Pratt & Whitney Responses to NRC East Hartford FSSP Questions dated 11/10/14
WARNING --This document contains technical data the export of which is or may be restricted by the Export Administration Act and the Export Administration Regulations (EAR), 15 C.F.R. parts 730-774.
Diversion contrary to U.S. law is prohibited. The export, reexport, transfer or re-transfer of this technical data to any other company, entity, person, or destination, or for any use or purpose other than that for which the technical data was originally provided by P&W, is prohibited without prior
written approval from P&W and authorization under applicable export control laws.
EAR Export Classification: ECCN EAR99
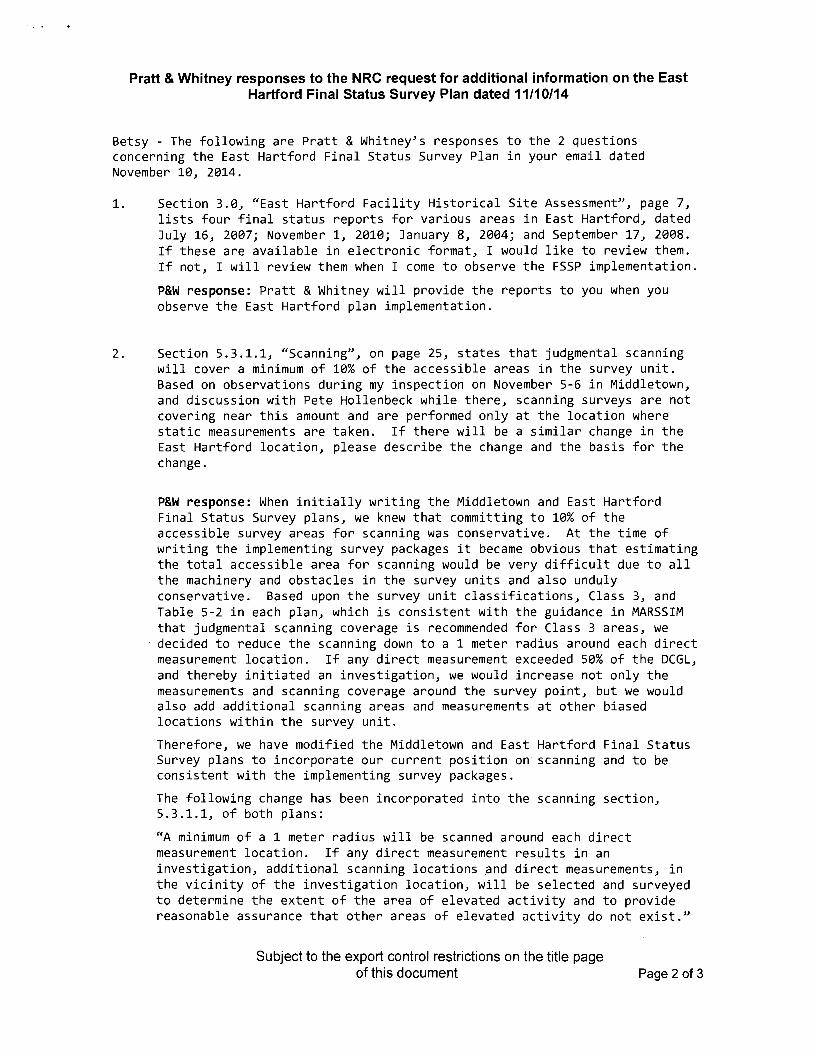
Pratt & Whitney responses to the NRC request for additional information on the East Hartford Final Status Survey Plan dated 11/10/14
Betsy - The following are Pratt & Whitney's responses to the 2 questions concerning the East Hartford Final Status Survey Plan in your email dated November 18, 2814.
1. Section 3.8, "East Hartford Facility Historical Site Assessment", page 7, lists four final status reports for various areas in East Hartford, dated July 16, 2887; November 1, 2818; January 8, 2884; and September 17, 2888. If these are available in electronic format, I would like to review them. If not, I will review them when I come to observe the FSSP implementation.
P&W response: Pratt & Whitney will provide the reports to you when you observe the East Hartford plan implementation.
2. Section 5.3.1.1, "Scanning", on page 25, states that judgmental scanning will cover a minimum of 18% of the accessible areas in the survey unit. Based on observations during my inspection on November 5-6 in Middletown, and discussion with Pete Hollenbeck while there, scanning surveys are not covering near this amount and are performed only at the location where static measurements are taken. If there will be a similar change in the East Hartford location, please describe the change and the basis for the change.
P&W response: When initially writing the Middletown and East Hartford Final Status Survey plans, we knew that committing to 18% of the accessible survey areas for scanning was conservative. At the time of writing the implementing survey packages it became obvious that estimating the total accessible area for scanning would be very difficult due to all the machinery and obstacles in the survey units and also unduly conservative. Based upon the survey unit classifications, Class 3, and Table 5-2 in each plan, which is consistent with the guidance in MARSSIM that judgmental scanning coverage is recommended for Class 3 areas, we decided to reduce the scanning down to a 1 meter radius around each direct measurement location. If any direct measurement exceeded 58% of the DCGL, and thereby initiated an investigation, we would increase not only the measurements and scanning coverage around the survey point, but we would also add additional scanning areas and measurements at other biased locations within the survey unit.
Therefore, we have modified the Middletown and East Hartford Final Status Survey plans to incorporate our current position on scanning and to be consistent with the implementing survey packages.
The following change has been incorporated into the scanning section, 5.3.1.1, of both plans:
"A minimum of a 1 meter radius will be scanned around each direct measurement location. If any direct measurement results in an investigation, additional scanning locations and direct measurements, in the vicinity of the investigation location, will be selected and surveyed to determine the extent of the area of elevated activity and to provide reasonable assurance that other areas of elevated activity do not exist."
Subject to the export control restrictions on the title page of this document Page 2 of 3

Pratt & Whitney responses to the NRC request for additional information on the East Hartford Final Status Survey Plan dated 11/10/14
We have attached the latest revision of the Middletown plan, now rev1s1on 2, and the East Hartford plan, now revision 1, for your review and acceptance.
Subject to the export control restrictions on the title page of this document Page 3 of 3
... .
WARNING --This document contains technical data the export of which is or may be restricted by the Export Administration Act and the Export Administration Regulations
(EAR), 15 C.F.R. parts 730-774. Diversion contrary to U.S. law is prohibited. The export, reexport, transfer or re-transfer of this technical data to any other company, entity,
person, or destination, or for any use or purpose other than that for which the technical data was originally provided by P&W, is prohibited without prior written approval from
P&W and authorization under applicable export control laws.
EAR Export Classification: ECCN EAR99
Final Status Survey Plan Revision 1
Pratt & Whitney A United Technologies Company
400 Main Street East Hartford, Connecticut
Termination of License SMB-151 at the East Hartford, CT Facility
Prepared by:
Radiation Safety & Control Services 91 Portsmouth Avenue
Stratham, NH 03885-2468
•
RSCS Radiatton Safety & Control Serv1ces

• ' ' I"
Pratt & Whitney East Hartford Site Final Status Survey Plan
Table of Contents
1.0 INTRODUCTION ................................................................................................................ 4 2.0 SUMMARY OF THE FINAL STATUS SURVEY PROCESS .............................................. 4 3.0 MIDDLETOWN FACILITY HISTORICAL SITE ASSESSMENT ......................................... 6 4.0 SURVEY PLANNING ....................................................................................................... 1 0
4.1 Classification of Survey Areas and Units ...................................................................... 10 4.2 Reference Areas and Materials .................................................................................... 11 4.3 Area Preparation: Isolation and Control ...................................................................... 19 4.4 Selection of DCGLs ...................................................................................................... 19
5.0 FINAL STATUS SURVEY DESIGN ................................................................................. 20 5.1 Selecting the Number of Fixed Measurements and Locations ..................................... 21
5.1.1 Establishing Acceptable Decision Error Rates ...................................................... 21 5.1.2 Determining the Relative Shift ............................................................................... 21 5.1.3 Selecting the Required Number of Measurements for the Sign Test .................... 22 5.1.4 Determining Measurement Locations .................................................................... 23
5.2 Data Investigations ....................................................................................................... 23 5.2.1 Investigation Levels ............................................................................................... 23 5.2.2 Investigations ........................................................................................................ 24
5.3 Survey Implementation and Data Collection ................................................................ 24 5.3.1 Survey Methods .................................................................................................... 24
5.4 Survey lnstrumentation ................................................................................................. 26 5.4.1 Instrument Selection .............................................................................................. 26 5.4.2 Calibration and Maintenance ................................................................................. 27 5.4.3 Response Checks ................................................................................................. 27 5.4.4 MDC calculations .................................................................................................. 27
6.0 6.1 6.2 6.3 6.4
7.0 8.0 9.0
SURVEY DATA ASSESSMENT ...................................................................................... 30 Initial Evaluation ........................................................................................................... 30 Sign Test ...................................................................................................................... 30 Data Assessment Conclusions ..................................................................................... 31 ALARA Evaluations ...................................................................................................... 32
FINAL STATUS SURVEY REPORT ................................................................................ 32 QUALITY ASSURANCE AND QUALITY CONTROL MEASURES .................................. 33 REFERENCES ................................................................................................................. 33
List of Tables
Table 4-1 Survey Unit Surface Area Limits ................................................................................. 11 Table 4-2 Final Status Survey Units ........................................................................................... 11 Table 5-1 Investigation Levels .................................................................................................... 24 Table 5-2 Traditional Scanning Coverage Requirements ........................................................... 25 Table 5-3 Available Instruments and Associated MDCs ............................................................. 26 Table 6-1 Initial Evaluation of Survey Results ............................................................................ 30
Page 2 of 33 Subject to the export control restrictions on the title page of this document
Rev. 1

Pratt & Whitney East Hartford Site Final Status Survey Plan
List of Figures
Figure 3-1 East Hartford Site Map ................................................................................................ 9 Figure 4-1 L Building Survey Units ............................................................................................. 12 Figure 4-2 J Building Survey Unit ............................................................................................... 13 Figure 4-3 M Building Survey Unit .............................................................................................. 14 Figure 4-4 K Building Survey Unit ............................................................................................... 15 Figure 4-5 D Building Survey Units ............................................................................................. 16 Figure 4-6 Waste Storage Trailer Survey Unit ............................................................................ 17 Figure 4-7 E Building Survey Unit ............................................................................................... 18
Page 3 of 33 Subject to the export control restrictions on the title page of this document
Rev. 1

"" f ( (
Pratt & Whitney East Hartford Site Final Status Survey Plan
1.0 INTRODUCTION
The purpose of the Final Status Survey Plan is to describe the methods to be used in planning, designing, conducting, and evaluating final status surveys at the Pratt & Whitney (P&W) East Hartford, CT site. The plan will be used to terminate the Pratt & Whitney SMB-151 license (1) in accordance with 10 CFR 40.42. (2) These surveys serve as key elements to demonstrate that the dose from residual radioactivity is less than the maximum annual dose criterion for license termination for unrestricted use specified in 10 CFR 20.1402 (3) and by Connecticut Remediation Standard regulations. (4) (5) The additional requirement of 10 CFR 20.1402 that all residual radioactivity at the site be reduced to levels that are as low as reasonably achievable (ALARA) will also be addressed. The Final Status Survey Plan was developed using the guidance of NUREG-1575, "The Multi-Agency Radiation Survey and Site Investigation Manual (MARSSIM)" (6) and NUREG-1757 Volume 2(7).
This plan is written to be both educational and informative. Each section provides the reader with sufficient information about each step of the final status survey process to understand that step. The plan also contains a statement as to the decision that will be applied to the P&W final status survey process.
2.0 SUMMARY OF THE FINAL STATUS SURVEY PROCESS
This section summarizes the final status survey process as described in MARSSIM. (6) The final status survey process consists of four principal elements:
• planning, • design, • implementation, and • assessment.
Survey planning includes review of the Historical Site Assessment (HSA) and other pertinent characterization information to establish Data Quality Objectives (DQOs), survey unit classifications, and the radionuclides of concern. The HSA reviews historical use of licensed material at the facility and the levels of potential activity entailed through personnel interviews and records review. The site buildings and areas are classified based upon contamination potential. Areas that have no reasonable potential for residual contamination are classified as non-impacted areas. These areas have no radiological impact from site operations. Areas with reasonable potential for residual contamination are classified as impacted areas. Impacted areas are divided into three classifications based upon the potential contamination levels and how the contamination is distributed. Areas with the same classification are broken into survey units. Survey units are fundamental elements for which final status surveys are designed and executed. The classification of a survey unit determines how large it can be in terms of surface area.
The DQO process is a series of planning steps for establishing criteria for data quality and developing survey designs. The DQO process consists of seven steps:
1. Statement of the problem; 2. Identification of the decision; 3. Identification of inputs to the decision; 4. Definition of the study boundaries; 5. Development of a decision rule;
Page 4 of 33 Subject to the export control restrictions on the title page of this document
Rev. 1

• t .. I
Pratt & Whitney East Hartford Site Final Status Survey Plan
6. Specification of limits on decision errors; and 7. Optimization of the design for obtaining data.
Before the survey process can proceed to the design phase, concentration levels that represent the maximum annual dose criterion of 10 CFR 20.1402 (25 mrem/year) or Connecticut regulations (19 mrem/year) must be established. In general, these concentrations are established for either surface contamination (dpm/1 00 cm2
) or volumetric contamination (pCilg). They are used in the survey design process to establish the minimum sensitivities required for the available survey instruments and techniques, and in some cases, the spacing of fixed measurements or samples to be made within a survey unit. Surface or volumetric concentrations that correspond to the maximum annual dose criterion are referred to as Derived Concentration Guideline Levels, or DCGLs. A DCGL established for the average residual radioactivity in a survey unit is called a DCGLw. Values of the DCGLw may then be increased through the use of area factors to obtain a DCGL that represents the same dose to an individual for residual radioactivity over a smaller area within a survey unit. The scaled value is called the DCGLEMc. where EMC stands for elevated measurement comparison.
After the DCGLw is established, a survey design is developed and documented for each survey unit. The plan is documented as a Survey Package that selects the appropriate survey instruments and techniques to provide adequate coverage of the unit through a combination of scans, fixed measurements, and sampling. The Survey Package also implements the DQOs for that survey unit and provides instructions for carrying out the survey. The package documents the data assessment of results, the statistical basis used to determine if the survey unit passes or fails, and the review and approval of the package. If any of the radionuclides of concern are present in background at levels that impact the DCGLw, the planning effort may include establishing appropriate reference areas to be used to establish baseline concentrations for these radionuclides and their variability. Reference materials are specified for establishing background instrument responses for cases where gross activity measurements are to be made. A reference coordinate system may be used for documenting locations where measurements were made and to allow replication of survey efforts if necessary. This process ensures that data of sufficient quantity and quality are obtained to make decisions regarding the suitability of the survey design assumptions and whether the unit meets the release criterion. Approved site procedures will direct this process to ensure consistent implementation and adherence to applicable requirements.
Survey implementation is the process of carrying out the survey plan (package) for a given survey unit. This consists of scan measurements, fixed measurements, and collection and analysis of samples. Scan measurements will always be made, while fixed measurements and sampling may not be necessary. Data are collected and stored using a data management system.
Data assessment includes data verification and validation (V&V), review of survey design bases, and data analysis. For a given survey unit, the survey data are evaluated to determine if the residual activity levels in the unit meet the applicable release criterion and if any areas of elevated activity exist. In some cases, data evaluation will simply serve to show that all of the measurements made in a given survey unit were below the applicable DCGLw. If so, demonstrating compliance with the release criterion is a simple matter and requires little in the way of analysis. In other cases, residual radioactivity may exist where measurement results both above and below the DCGLware observed. In these cases, statistical tests must be performed to make a decision as to whether the unit meets the release criterion. The statistical tests that might be required to make decisions regarding the residual activity levels in a survey
Page 5 of 33 Subject to the export control restrictions on the title page of this document
Rev. 1
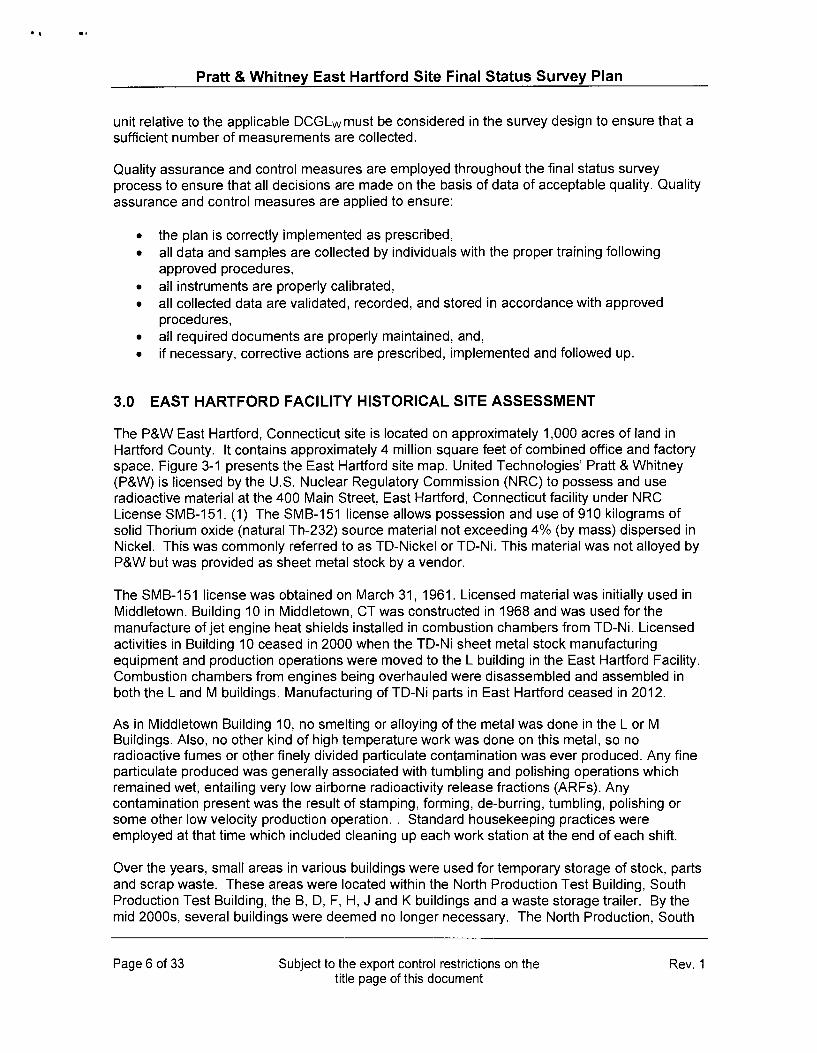
.. Pratt & Whitney East Hartford Site Final Status Survey Plan
unit relative to the applicable OCGLw must be considered in the survey design to ensure that a sufficient number of measurements are collected.
Quality assurance and control measures are employed throughout the final status survey process to ensure that all decisions are made on the basis of data of acceptable quality. Quality assurance and control measures are applied to ensure:
• the plan is correctly implemented as prescribed, • all data and samples are collected by individuals with the proper training following
approved procedures, • all instruments are properly calibrated, • all collected data are validated, recorded, and stored in accordance with approved
procedures, • all required documents are properly maintained, and, • if necessary, corrective actions are prescribed, implemented and followed up.
3.0 EAST HARTFORD FACILITY HISTORICAL SITE ASSESSMENT
The P&W East Hartford, Connecticut site is located on approximately 1,000 acres of land in Hartford County. It contains approximately 4 million square feet of combined office and factory space. Figure 3-1 presents the East Hartford site map. United Technologies' Pratt & Whitney (P&W) is licensed by the U.S. Nuclear Regulatory Commission (NRC) to possess and use radioactive material at the 400 Main Street, East Hartford, Connecticut facility under NRC License SMB-151. (1) The SMB-151 license allows possession and use of910 kilograms of solid Thorium oxide (natural Th-232) source material not exceeding 4% (by mass) dispersed in Nickel. This was commonly referred to as TO-Nickel or TO-Ni. This material was not alloyed by P&W but was provided as sheet metal stock by a vendor.
The SMB-151 license was obtained on March 31, 1961. Licensed material was initially used in Middletown. Building 10 in Middletown, CT was constructed in 1968 and was used for the manufacture of jet engine heat shields installed in combustion chambers from TO-Ni. Licensed activities in Building 10 ceased in 2000 when the TO-Ni sheet metal stock manufacturing equipment and production operations were moved to the L building in the East Hartford Facility. Combustion chambers from engines being overhauled were disassembled and assembled in both the Land M buildings. Manufacturing of TO-Ni parts in East Hartford ceased in 2012.
As in Middletown Building 10, no smelting or alloying of the metal was done in the L or M Buildings. Also, no other kind of high temperature work was done on this metal, so no radioactive fumes or other finely divided particulate contamination was ever produced. Any fine particulate produced was generally associated with tumbling and polishing operations which remained wet, entailing very low airborne radioactivity release fractions (ARFs). Any contamination present was the result of stamping, forming, de-burring, tumbling, polishing or some other low velocity production operation .. Standard housekeeping practices were employed at that time which included cleaning up each work station at the end of each shift.
Over the years, small areas in various buildings were used for temporary storage of stock, parts and scrap waste. These areas were located within the North Production Test Building, South Production Test Building, the B, 0, F, H, J and K buildings and a waste storage trailer. By the mid 2000s, several buildings were deemed no longer necessary. The North Production, South
Page 6 of 33 Subject to the export control restrictions on the title page of this document
Rev. 1

Pratt & Whitney East Hartford Site Final Status Survey Plan
Production and F buildings were surveyed, free released, and then demolished in whole. A major portion of the H building was also demolished.
The Historical Site Assessment (HSA) commenced in the fall of 2013. Historical records were reviewed including surveys and relevant memos. Interviews with key long-time employees were also conducted.
Several key documents were reviewed and are listed below:
• Several Final Status Surveys at the East Hartford facility that were undertaken at the request of P&W upon cessation of TD-Ni activities.
RSA Final Radiological Status Report, Pratt & Whitney, East Hartford Facility (Portions) North Production Test, dated July 16, 2007 RSA Decommissioning, Pratt & Whitney North Experimental Test Building (North Test), dated 11/1/2010 RSA Final Radiological Status Report, Pratt & Whitney, East Hartford Facility (Portions), dated January 8, 2004 RSA Final Radiological Status Report, Welding/Blending Area, L-Building, Pratt & Whitney, East Hartford, Connecticut, dated September 17, 2008.
• Annual radiation surveys from 2001 through 2011.
A summary of the relevant points identified in the above documents are listed below.
1. Final Status Surveys performed at the East Hartford facility
Several final radiological status surveys were conducted at the East Hartford facility from 2003 to 2010 upon cessation of the use of the TD-Ni material in those areas. The surveys were performed in storage areas, test cells and a welding/blending area. All the surveys were conducted under the MARSSIM guidance. The DCGL for the surveys were either the NRC screening level of 6 dpm/1 00 cm2 or reduced to 5 dpm/1 00 cm2 to account for the 19 mrem Connecticut recommended limit. The conclusion in each of the survey reports is that no single measurement exceeded the NRC total contamination limit of 6 dpm/1 00 cm2 or the removable limit of 0.6 dpm/1 00 cm2
.
2. Annual radiation surveys
The annual radiation surveys from 2001 through 2011 were reviewed. They included one or more air samples and a wipe survey of areas where thoriated material was used. The conclusion in every report what the no activity distinguishable from background was detected for alpha.
Based upon the information collected and reviewed, the following conclusions have been drawn:
1. Based upon the results of the previous final status surveys at the East Hartford facility, residual contamination at the East Hartford facility is a very small fraction (<5%) of the site-specific building DCGL of 354 dpm/1 00 cm2
. Therefore, the survey units for final status survey in East Hartford will be designated as Class 3.
2. All manufacturing and refurbishment of the TD-Ni parts occurred in the L and M Buildings. The J and K Buildings were used for engine assembly. Small temporary storage areas were established in the B and D Buildings. Scrap waste was moved from the point of generation to the Waste Storage Trailer. Therefore, based upon this
Page 7 of 33 Subject to the export control restrictions on the title page of this document
Rev. 1

Pratt & Whitney East Hartford Site Final Status Survey Plan
information, the final status survey of the East Hartford facility will be performed in the L, M, J and K Buildings, as well as the Waste Storage Trailer. The B Building is contiguous within the D Building. Both buildings are generally referred to as the D Building. The one small storage area in the B Building and one small storage area in the D Building will be included as part of the final status survey identified in Item #3 below.
3. Spray powders have been and will continue to be used in the East Hartford facility. Spray powders have been used in all the buildings scheduled for final status survey plus in the D and E Buildings. Based upon concerns expressed by the NRC about spray powder use in the Middletown facility, the D and E Buildings have been added to the final status survey.
Page 8 of 33 Subject to the export control restrictions on the title page of this document
Rev. 1
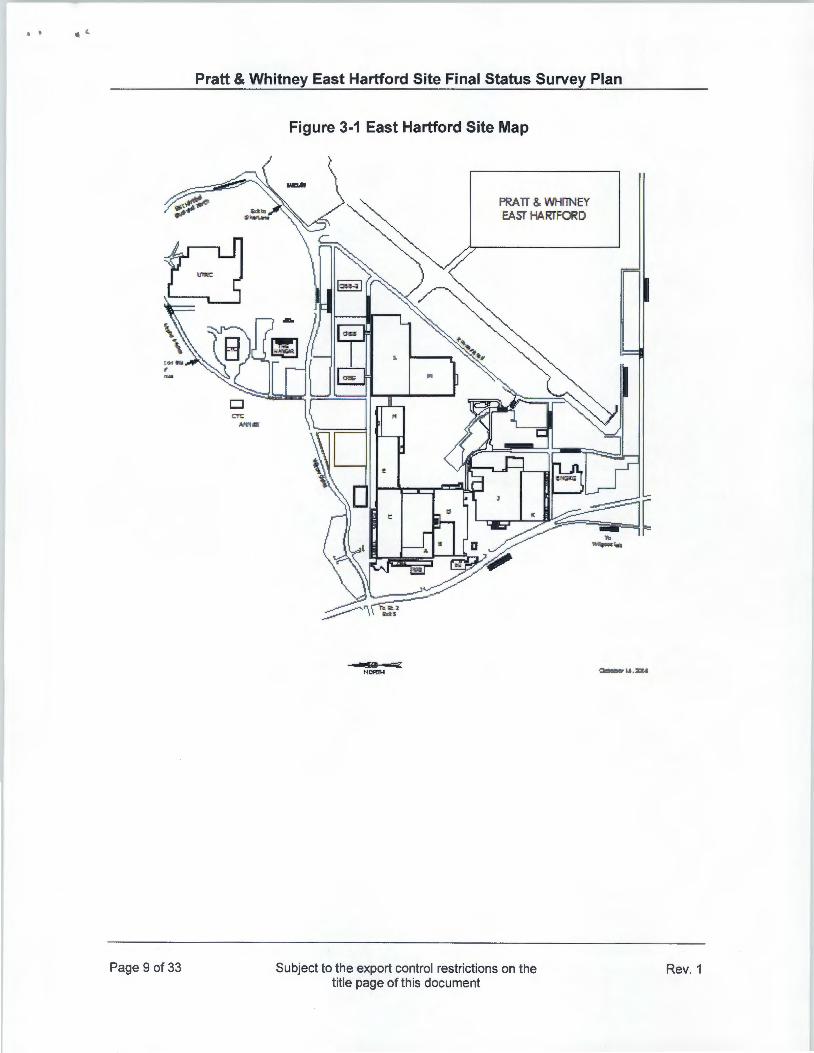
.. ' . (..
Page 9 of 33
Pratt & Whitney East Hartford Site Final Status Survey Plan
D
Figure 3-1 East Hartford Site Map
PRATT & WHIINEY EAST HARTFORD
Subject to the export control restrictions on the title page of this document
Rev. 1

..
Pratt & Whitney East Hartford Site Final Status Survey Plan
4.0 SURVEY PLANNING
4.1 Classification of Survey Areas and Units
The adequacy of the final status survey process rests upon partitioning the site into properly classified survey units of appropriate physical area. The following definitions are taken from MARSSIM.
• Class 1 Areas: Areas that have, or had prior to remediation, a potential for radioactive contamination (based on site operating history) or known contamination (based on previous radiation surveys) above the DCGLw. Examples of Class 1 areas include: 1) site areas previously subjected to remedial actions, 2) locations where leaks or spills are known to have occurred, 3) former burial or disposal sites, 4) waste storage sites, and 5) areas with contaminants in discrete solid pieces of material and high specific activity.
• Class 2 Areas: Areas that have, or had prior to remediation, a potential for radioactive contamination or known contamination, but are not expected to exceed the DCGLw. To justify changing the classification from Class 1 to Class 2, there should be measurement data that provides a high degree of confidence that no individual measurement would exceed the DCGLw. Examples of areas that might be classified as Class 2 for the final status survey include: 1) locations where radioactive materials were present in an unsealed form, 2) potentially contaminated transport routes, 3) areas downwind from stack release points, 4) upper walls and ceilings of buildings or rooms subjected to airborne radioactivity, 5) areas handling low concentrations of radioactive materials, and 6) areas on the perimeter of former contamination control areas.
• Class 3 Areas: Any impacted areas that are not expected to contain any residual radioactivity, or are expected to contain levels of residual radioactivity at a small fraction of the DCGLw, based on site operating history and previous radiation surveys. Examples of areas that might be classified as Class 3 include buffer zones around Class 1 or Class 2 areas, and areas with very low potential for residual contamination but insufficient information to justify a non-impacted classification. Survey Units
Class 1 areas have the greatest potential for contamination and therefore receive the highest degree of survey effort for the final status survey using a graded approach, followed by Class 2, and then by Class 3. Non-impacted areas do not receive any level of survey coverage because they have no potential for residual contamination. Non-impacted areas are determined on a sitespecific basis. A survey unit can have only one classification.
Based upon the Historical Site Assessment, all survey units in the P&W East Hartford facility are designated as Class 3. Survey units are limited in size based on classification, exposure pathway modeling assumptions, and site-specific conditions. The surface area limits shown in Table 4-1 are consistent with the guidance in MARSSIM.
Page 10 of 33 Subject to the export control restrictions on the title page of this document
Rev. 1

. .. .. . Pratt & Whitney East Hartford Site Final Status Survey Plan
Table 4-1 Survey Unit Surface Area Limits
Survey Unit Description Surface Area Limit Classification
Class 1 Structures
~100m2
(floor area) Land areas ~2000 m2
Structures 100 m2 - 1 ,000 m2
Class 2 (floor area) Land areas 2,000 m2
- 10,000 m2
Structures no limit
Class 3 (floor area) Land areas no limit
Table 4-2 presents the survey units at the East Hartford facility subject to final status survey.
Table 4-2 Final Status Survey Units
Survey Unit Description Class Survey Sco_1>_e 1 L Bldg - East Half 3 Floor only 2 L Bldg - West Half 3 Floor only 3 J Building 3 Floor only 4 M Building 3 Floor only 5 K Building 3 Floor only 6 D Building - East Half 3 Floor only 7 D Building -West Half (with B Bldg includecll 3 Floor only 8 Waste Storage Trailer 3 Floor only 9 E Building 3 Floor only
Figure 4-1 presents the survey units in L Building, Figure 4-2 presents the J Building survey unit, Figure 4-3 presents the M Building survey unit, Figure 4-4 presents the K Building survey unit, Figure 4-5 presents the D Building survey units, Figure 4-6 presents the Waste Storage Trailer survey unit and Figure 4-7 presents the E Building survey unit. If survey units are added or re-classified, the NRC and state will be notified and the size limits in Table 4-1 will be used.
4.2 Reference Areas and Materials
If any of the radionuclides of concern are present in background, establishing reference background concentrations may be necessary to identify and evaluate contributions attributable to site operations. Background concentrations can be determined via measurements made in one or more reference areas selected to represent the baseline radiological conditions for the site. In addition, measurements may be required to establish background levels for various construction materials to accommodate gross activity (non-radionuclide-specific) measurements.
The material background levels are expected to be insignificant when compared to the DCGL. It is currently envisioned that a general area background measurement will be collected with each instrument prior to taking direct measurements and scanning. This measurement will be
Page 11 of 33 Subject to the export control restrictions on the title page of this document
Rev. 1