prdnationwide geelong property watch q2 l 2012
DESCRIPTION
PRDnationwide Geelong Property Watch Q2 l 2012TRANSCRIPT
www.prdresearch.com.au Your home of property knowledge
Second Quarter │2012
GEELONG/LARA AREA Property Watch®
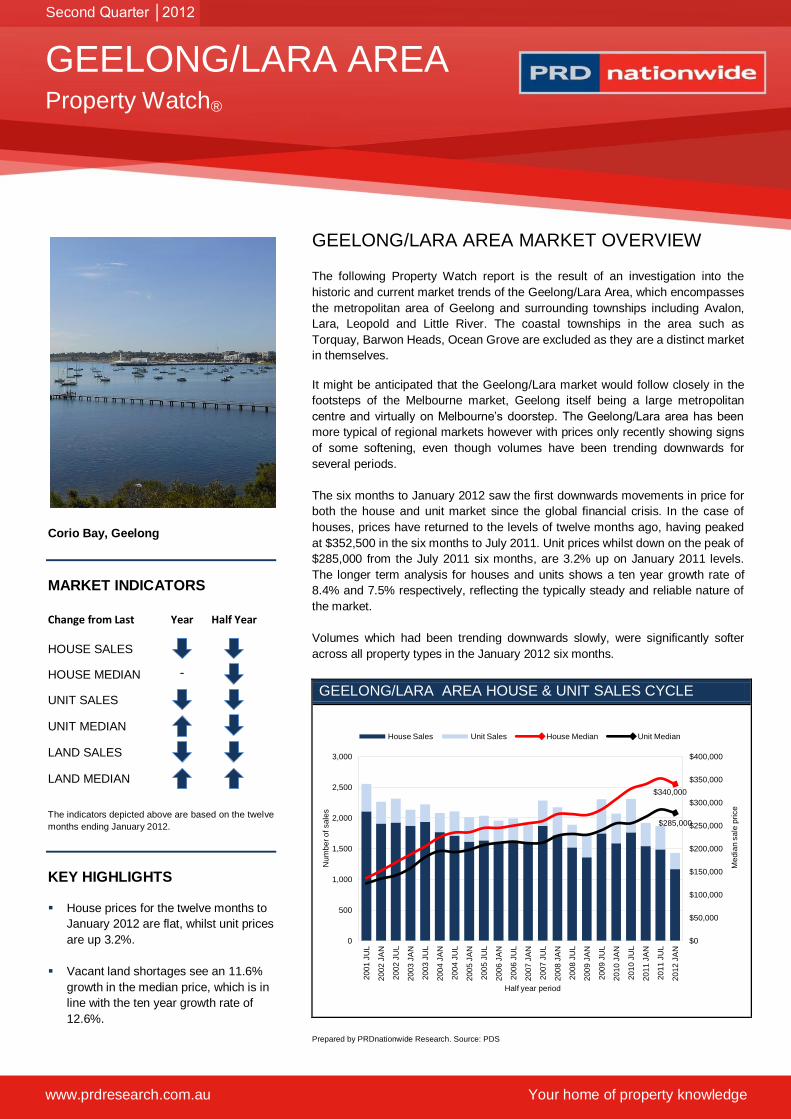
Corio Bay, Geelong
MARKET INDICATORS
Change from Last Year Half Year
HOUSE SALES
HOUSE MEDIAN -
UNIT SALES
UNIT MEDIAN
LAND SALES
LAND MEDIAN
The indicators depicted above are based on the twelve
months ending January 2012.
KEY HIGHLIGHTS
House prices for the twelve months to
January 2012 are flat, whilst unit prices
are up 3.2%.
Vacant land shortages see an 11.6%
growth in the median price, which is in
line with the ten year growth rate of
12.6%.
GEELONG/LARA AREA MARKET OVERVIEW
The following Property Watch report is the result of an investigation into the
historic and current market trends of the Geelong/Lara Area, which encompasses
the metropolitan area of Geelong and surrounding townships including Avalon,
Lara, Leopold and Little River. The coastal townships in the area such as
Torquay, Barwon Heads, Ocean Grove are excluded as they are a distinct market
in themselves.
It might be anticipated that the Geelong/Lara market would follow closely in the
footsteps of the Melbourne market, Geelong itself being a large metropolitan
centre and virtually on Melbourne’s doorstep. The Geelong/Lara area has been
more typical of regional markets however with prices only recently showing signs
of some softening, even though volumes have been trending downwards for
several periods.
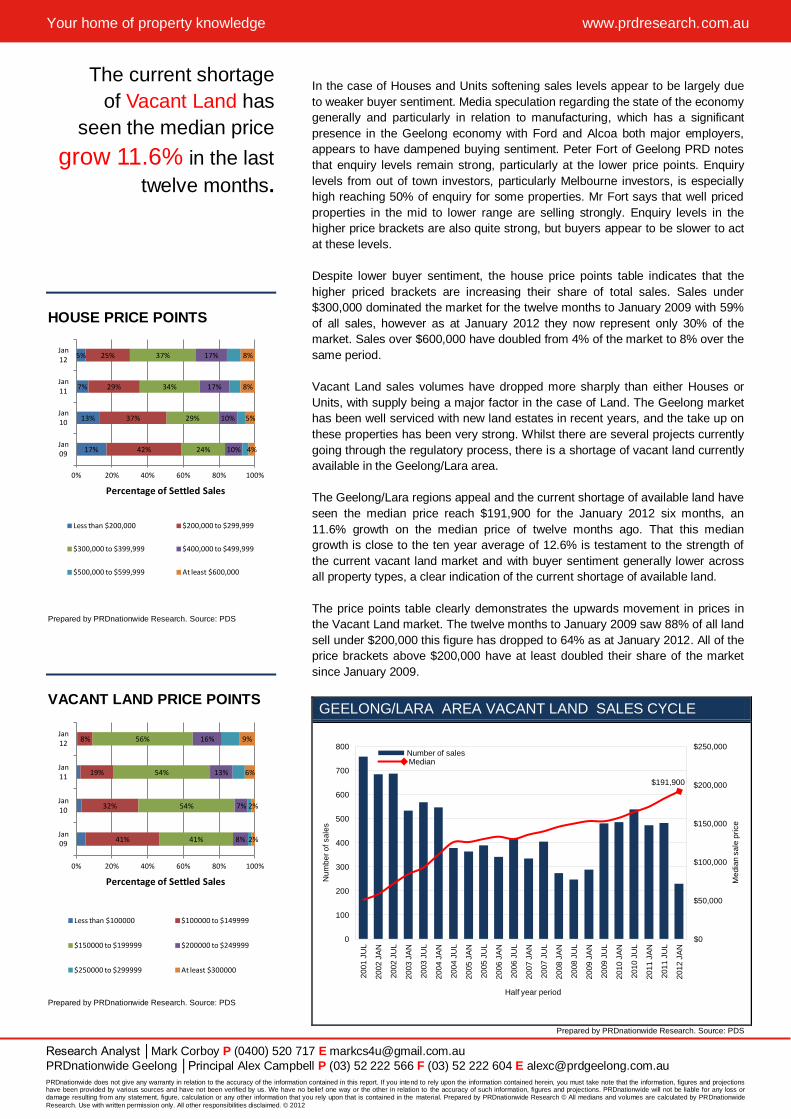
The six months to January 2012 saw the first downwards movements in price for
both the house and unit market since the global financial crisis. In the case of
houses, prices have returned to the levels of twelve months ago, having peaked
at $352,500 in the six months to July 2011. Unit prices whilst down on the peak of
$285,000 from the July 2011 six months, are 3.2% up on January 2011 levels.
The longer term analysis for houses and units shows a ten year growth rate of
8.4% and 7.5% respectively, reflecting the typically steady and reliable nature of
the market.
Volumes which had been trending downwards slowly, were significantly softer
across all property types in the January 2012 six months.
GEELONG/LARA AREA HOUSE & UNIT SALES CYCLE
Prepared by PRDnationwide Research. Source: PDS
$340,000
$285,000
$0
$50,000
$100,000
$150,000
$200,000
$250,000
$300,000
$350,000
$400,000
0
500
1,000
1,500
2,000
2,500
3,000
20
01
JU
L
20
02
JA
N
20
02
JU
L
20
03
JA
N
20
03
JU
L
20
04
JA
N
20
04
JU
L
20
05
JA
N
20
05
JU
L
20
06
JA
N
20
06
JU
L
20
07
JA
N
20
07
JU
L
20
08
JA
N
20
08
JU
L
20
09
JA
N
20
09
JU
L
20
10
JA
N
20
10
JU
L
20
11
JA
N
20
11
JU
L
20
12
JA
N
Me
dia
n s
ale
pri
ce
Num
be
r o
f sa
les
Half year period
House Sales Unit Sales House Median Unit Median
PRDnationwide does not give any warranty in relation to the accuracy of the information contained in this report. If you intend to rely upon the information contained herein, you must take note that the information, figures and projections have been provided by various sources and have not been verified by us. We have no belief one way or the other in relation to the accuracy of such information, figures and projections. PRDnationwide will not be liable for any loss or damage resulting from any statement, figure, calculation or any other information that you rely upon that is contained in the material. Prepared by PRDnationwide Research © All medians and volumes are calculated by PRDnationwide
Research. Use with written permission only. All other responsibilities disclaimed. © 2012
Your home of property knowledge www.prdresearch.com.au
Research Analyst │Mark Corboy P (0400) 520 717 E [email protected]
PRDnationwide Geelong │Principal Alex Campbell P (03) 52 222 566 F (03) 52 222 604 E [email protected]
The current shortage
of Vacant Land has
seen the median price
grow 11.6% in the last
twelve months.
HOUSE PRICE POINTS
Prepared by PRDnationwide Research. Source: PDS
VACANT LAND PRICE POINTS
Prepared by PRDnationwide Research. Source: PDS
In the case of Houses and Units softening sales levels appear to be largely due
to weaker buyer sentiment. Media speculation regarding the state of the economy
generally and particularly in relation to manufacturing, which has a significant
presence in the Geelong economy with Ford and Alcoa both major employers,
appears to have dampened buying sentiment. Peter Fort of Geelong PRD notes
that enquiry levels remain strong, particularly at the lower price points. Enquiry
levels from out of town investors, particularly Melbourne investors, is especially
high reaching 50% of enquiry for some properties. Mr Fort says that well priced
properties in the mid to lower range are selling strongly. Enquiry levels in the
higher price brackets are also quite strong, but buyers appear to be slower to act
at these levels.
Despite lower buyer sentiment, the house price points table indicates that the
higher priced brackets are increasing their share of total sales. Sales under
$300,000 dominated the market for the twelve months to January 2009 with 59%
of all sales, however as at January 2012 they now represent only 30% of the
market. Sales over $600,000 have doubled from 4% of the market to 8% over the
same period.
Vacant Land sales volumes have dropped more sharply than either Houses or
Units, with supply being a major factor in the case of Land. The Geelong market
has been well serviced with new land estates in recent years, and the take up on
these properties has been very strong. Whilst there are several projects currently
going through the regulatory process, there is a shortage of vacant land currently
available in the Geelong/Lara area.
The Geelong/Lara regions appeal and the current shortage of available land have
seen the median price reach $191,900 for the January 2012 six months, an
11.6% growth on the median price of twelve months ago. That this median
growth is close to the ten year average of 12.6% is testament to the strength of
the current vacant land market and with buyer sentiment generally lower across
all property types, a clear indication of the current shortage of available land.
The price points table clearly demonstrates the upwards movement in prices in
the Vacant Land market. The twelve months to January 2009 saw 88% of all land
sell under $200,000 this figure has dropped to 64% as at January 2012. All of the
price brackets above $200,000 have at least doubled their share of the market
since January 2009.
GEELONG/LARA AREA VACANT LAND SALES CYCLE
Prepared by PRDnationwide Research. Source: PDS
17%
13%
7%
5%
42%
37%
29%
25%
24%
29%
34%
37%
10%
10%
17%
17%
4%
5%
8%
8%
0% 20% 40% 60% 80% 100%
Jan 09
Jan 10
Jan 11
Jan 12
Percentage of Settled Sales
Less than $200,000 $200,000 to $299,999
$300,000 to $399,999 $400,000 to $499,999
$500,000 to $599,999 At least $600,000
41%
32%
19%
8%
41%
54%
54%
56%
8%
7%
13%
16%
2%
2%
6%
9%
0% 20% 40% 60% 80% 100%
Jan 09
Jan 10
Jan 11
Jan 12
Percentage of Settled Sales
Less than $100000 $100000 to $149999
$150000 to $199999 $200000 to $249999
$250000 to $299999 At least $300000
$191,900
$0
$50,000
$100,000
$150,000
$200,000
$250,000
0
100
200
300
400
500
600
700
800
20
01
JU
L
20
02
JA
N
20
02
JU
L
20
03
JA
N
20
03
JU
L
20
04
JA
N
20
04
JU
L
20
05
JA
N
20
05
JU
L
20
06
JA
N
20
06
JU
L
20
07
JA
N
20
07
JU
L
20
08
JA
N
20
08
JU
L
20
09
JA
N
20
09
JU
L
20
10
JA
N
20
10
JU
L
20
11
JA
N
20
11
JU
L
20
12
JA
N
Me
dia
n s
ale
pri
ce
Nu
mb
er
of
sa
les
Half year period
Number of sales Median