pre-harvest glyphosate timing in oats and final oat
TRANSCRIPT

PRE-HARVEST GLYPHOSATE TIMING IN OATS AND FINAL OAT QUALITY
A Thesis
Submitted to the Graduate Faculty
of the
North Dakota State University
of Agriculture and Applied Science
By
Bethany Rose Stebbins
In Partial Fulfillment of the Requirements
for the Degree of
MASTER OF SCIENCE
Major Program:
Cereal Science
March 2018
Fargo, North Dakota
North Dakota State University
Graduate School
Title
Pre-Harvest Glyphosate Timing in Oats and Final Oat Quality
By
Bethany R. Stebbins
The Supervisory Committee certifies that this disquisition complies with North Dakota
State University’s regulations and meets the accepted standards for the degree of
MASTER OF SCIENCE
SUPERVISORY COMMITTEE:
Dr. Senay Simsek
Chair
Dr. Michael McMullen
Dr. Steven Meinhardt
Approved:
3/12/2018 Dr. Richard Horsley
Date Department Chair

iii
ABSTRACT
Pre-harvest glyphosate is often applied to cereal crops, such as oats, to insure uniform
grain ripeness at harvest. However, some buyers have claimed that this practice negatively
affects oat end product quality. Oat samples were grown in two different growing locations for
each of two crop years, and glyphosate was applied at the soft dough, physiological maturity, or
not applied. Groat quality and starch quality parameters were analyzed, and rolled oats were
produced to analyze end product quality. Groat hardness, groat percentage, and percent plump
groats were significantly (P<0.05) affected by glyphosate application at the soft dough stage.
However, application of glyphosate at physiological maturity did not appear to detrimentally
affect groat starch or end product quality. Therefore, pre-harvest glyphosate application is
appropriate for oats providing it occurs after plants reach physiological maturity.

iv
ACKNOWLEDGEMENTS
I would like to thank my advisor, Dr. Senay Simsek, for the opportunity to continue my
studies by pursuing a master’s degree, and for her guidance throughout my research.
I would also like to thank Dr. Michael McMullen and Dr. Steven Meinhardt for serving
on my thesis committee.
Thank you to Dr. Jae-Bom Ohm for helping with statistical analysis, and for always being
willing to answer my questions. Thank you to DeLane Olson, Kristin Whitney, and Dr. Simsek’s
technicians for guidance and assistance in performing experiments.
I would also like to thank my parents, Bruce and Mary, for their unwavering support
throughout my education, and my sister for always being there to listen.
Lastly, I would like to thank Melissa for giving me the encouragement I needed to take
the leap into graduate school.
I am surrounded by so many people who love and support me, and for that I am thankful
every day.

v
TABLE OF CONTENTS
ABSTRACT ................................................................................................................................... iii
ACKNOWLEDGEMENTS ........................................................................................................... iv
LIST OF TABLES ....................................................................................................................... viii
LIST OF FIGURES ........................................................................................................................ x
LIST OF ABBREVIATIONS ........................................................................................................ xi
LIST OF APPENDIX TABLES ................................................................................................... xii
INTRODUCTION .......................................................................................................................... 1
Glyphosate ................................................................................................................................... 1
Oats .............................................................................................................................................. 1
LITERATURE REVIEW ............................................................................................................... 3
Glyphosate ................................................................................................................................... 3
Mechanism .............................................................................................................................. 3
Usage ....................................................................................................................................... 4
Environmental Toxicity ........................................................................................................... 6
Human Toxicity ....................................................................................................................... 7
Oats .............................................................................................................................................. 7
Human Consumption of Oats .................................................................................................. 9
Oat Quality Traits .................................................................................................................. 10
Oat Starch .............................................................................................................................. 12
Oat Processing ........................................................................................................................... 13
Grading and Dehulling .......................................................................................................... 13
Heat Treatment ...................................................................................................................... 14
Steel Cut Oats ........................................................................................................................ 15
Production of Rolled and Quick Cooking Oats ..................................................................... 15

vi
Justification, Objective, and Hypothesis ................................................................................... 16
Justification............................................................................................................................ 16
Objectives .............................................................................................................................. 16
Hypothesis ............................................................................................................................. 16
MATERIALS AND METHODS .................................................................................................. 17
Materials .................................................................................................................................... 17
2015 Sample Set .................................................................................................................... 17
2016 Sample Set .................................................................................................................... 18
Sample Preparation ................................................................................................................... 20
Groat Analysis ........................................................................................................................... 21
Electron Microscopy ............................................................................................................. 21
Proximate Analysis ................................................................................................................ 22
Starch and Viscosity Analysis ............................................................................................... 22
Rolled Oat Preparation .............................................................................................................. 22
Heat Treatment ...................................................................................................................... 22
Rolling ................................................................................................................................... 23
Rolled Oat Quality Measures .................................................................................................... 24
Thickness ............................................................................................................................... 24
Absorption ............................................................................................................................. 25
Granulation ............................................................................................................................ 26
Statistical Analysis .................................................................................................................... 26
RESULTS AND DISCUSSION ................................................................................................... 28
Groat Quality Measures ............................................................................................................ 28
Overall Results ...................................................................................................................... 28
Results by Location and Cultivar .......................................................................................... 31

vii
Single Kernel Characterization System ..................................................................................... 36
Overall Results ...................................................................................................................... 36
Results by Location and Cultivar .......................................................................................... 38
Analysis of Oat Samples with Rapid Visco Analyzer ............................................................... 41
Overall Results ...................................................................................................................... 42
Results by Location and Cultivar .......................................................................................... 44
Rolled Quality Parameters ........................................................................................................ 49
Overall Results ...................................................................................................................... 49
Results by Location and Cultivar .......................................................................................... 51
Rolled Oat Granulation ............................................................................................................. 54
Overall Results ...................................................................................................................... 54
Results by Location and Cultivar .......................................................................................... 55
Scanning Electron Microscopy Studies ..................................................................................... 58
CONCLUSIONS........................................................................................................................... 59
REFERENCES ............................................................................................................................. 60
APPENDIX ................................................................................................................................... 65

viii
LIST OF TABLES
Table Page
1: Weather Data for Crop Year 2015 in Prosper, ND ................................................................... 18
2: Weather Data for Crop Year 2015 in Minot, ND ..................................................................... 18
3: Weather Data for Crop Year 2016 in Prosper, ND ................................................................... 19
4: Weather Data for Crop Year 2016 in Crookston, MN .............................................................. 20
5: 2015 Groat Quality Parameters ................................................................................................. 29
6: 2016 Groat Quality Parameters ................................................................................................. 31
7: 2015 Groat Quality Parameters by Location and Cultivar ....................................................... 33
8: 2016 Groat Quality Parameters by Location and Cultivar ....................................................... 35
9: 2015 SKCS Results ................................................................................................................... 37
10: 2016 SKCS Results ................................................................................................................. 38
11: 2015 SKCS Results by Location and Cultivar........................................................................ 39
12: 2016 SKCS Results by Location and Cultivar........................................................................ 41
13: 2015 Rapid Visco Analyzer (RVA) Results ........................................................................... 43
14: 2016 Rapid Visco Analyzer (RVA) Results ........................................................................... 44
15: 2015 Rapid Visco Analyzer (RVA) Parameters by Location and Cultivar ............................ 46
16: 2016 Rapid Visco Analyzer (RVA) Parameters by Location and Cultivar ............................ 48
17: Rolled Oat Quality Parameters for 2015 Sample Set ............................................................. 50
18: Rolled Oat Quality Parameters for 2016 Sample Set ............................................................. 50
19: Rolled Oat Quality Parameters for 2015 Sample Set by Location and Cultivar .................... 52
20: Rolled Oat Quality Parameters for 2016 Sample Set by Location and Cultivar .................... 53
21: Granulation of 2015 Sample Set Rolled Oats ......................................................................... 55
22: Granulation of 2016 Sample Set Rolled Oats ......................................................................... 55

ix
23: Granulation of 2015 Sample Set Rolled Oats by Cultivar and Location ................................ 56
24: Granulation of 2016 Sample Set Rolled Oats by Cultivar and Location ................................ 57

x
LIST OF FIGURES
Figure Page
1: Chemical Structure of Glyphosate .............................................................................................. 3
2: A Longitudinal Section of an Oat Kernel ................................................................................... 8
3: Flowchart of Oat Processing Steps ........................................................................................... 14
4: Summary of Crop Year 2015 Sample Set ................................................................................. 17
5: Summary of Crop Year 2016 Sample Set ................................................................................. 19
6: Codema Laboratory Oat Dehuller............................................................................................. 21
7: Oat Groat Heat Treatment......................................................................................................... 23
8: Lab Oat Roller .......................................................................................................................... 24
9: Thickness Gauge with Oat Flake .............................................................................................. 25
10: Rolled Oat Absorption Test .................................................................................................... 26
11: Sample Remaining on Ro-Tap Sieves .................................................................................... 26
12: An Rapid visco analyzer (RVA) Profile Showing Recorded Parameters ............................... 42
13: Cross Sections of Heat Treated Groats ................................................................................... 58

xi
LIST OF ABBREVIATIONS
AMPA ........................................ Aminomethylphosphonic Acid
DV .............................................. Daily Value
EPA ............................................ Environmental Protection Agency
EPSPS ........................................ 5-Enolpyuvyl-Shikimate-3-Phosphate Synthase
LSD ............................................ Least Significant Difference
NIR ............................................. Near-Infrared
RVA ........................................... Rapid Visco Analyzer
SAS ............................................ Statistical Analysis Software
SKCS.......................................... Single Kernel Characterization System

xii
LIST OF APPENDIX TABLES
Table Page
A1: Analysis of Variance for 2015 Groat Quality Parameters ..................................................... 65
A2: Analysis of Variance for 2016 Groat Quality Parameters ..................................................... 66
A3: Analysis of Variance for 2015 Starch Parameters ................................................................. 67
A4: Analysis of Variance for 2016 Starch Parameters ................................................................. 67
A5: Analysis of 2015 SKCS ......................................................................................................... 68
A6: Analysis of 2016 SKCS ......................................................................................................... 69
A7: Analysis of Variance for 2015 RVA Parameters ................................................................... 70
A8: Analysis of Variance for 2016 RVA Parameters ................................................................... 72
A9: Analysis of Variance for 2015 Rolled Oat Quality Parameters ............................................. 74
A10: Analysis of Variance for 2016 Rolled Oat Quality Parameters ........................................... 75
A11: Analysis of Variance for 2015 Rolled Oat Granulation ....................................................... 76
A12: Analysis of Variance for 2016 Rolled Oat Granulation ....................................................... 77

1
INTRODUCTION
Glyphosate
Glyphosate is the most frequently used herbicide in the world (Benbrook, 2016). In the
year 2014, 113.4 million kilograms of glyphosate were applied to crops. Its usage has been
increased 15-fold since 1996, when glyphosate-tolerant crops were introduced (Benbrook, 2016).
Glyphosate is considered a broad spectrum herbicide, and thus is effective against a wide
variety of weeds (Duke and Powles, 2008). Glyphosate inactivates the enzyme 5-enolpyruvyl-
shikimate-3-phosphate synthase, which is utilized in the shikimate pathway of plants.
Inactivation of this enzyme inhibits the production of aromatic amino acids, which leads to the
death of the plant. Since the shikimate pathway is not present in animals, glyphosate is
considered non-toxic: the LD50 for rats is greater than 5 g kg-1. However, some studies suggest
that glyphosate usage may contribute to environmental toxicity and may act as endocrine
disruptors in humans (Annett, Habibi, et al., 2014, García-Pérez, Alarcón-Gutiérrez, et al., 2014,
Gasnier, Dumont, et al., 2009).
In addition to its use as an herbicide, glyphosate is used as a pre-harvest desiccant on
cereal crops such as oats and wheat. This practice kills the plant and allows for uniform drying
before harvest. However, there is some debate on whether this practice causes a decrease in
quality in crops. Some companies, such as Grain Millers Inc, no longer will purchase oats treated
with pre-harvest glyphosate (Cross, 2016).
Oats
64 million bushels of oats were produced in the United States in 2016 (United States
Department of Agriculture, 2017). Although the majority of oats produced are used for animal

2
feed, rolled oat flakes continue to be a popular breakfast choice due to reported health benefits,
such as a cholesterol lowering effect (Whitehead, Beck, et al., 2014).
To many consumers, the most recognizable form of oats is the rolled oat flake, which is a
popular hot cereal breakfast choice. To produce rolled oat flakes, oat kernels harvested from the
field are first cleaned to remove foreign material (Decker, Rose, et al., 2014). Next, the tough,
indigestible outer hull is removed, leaving the edible groat behind. Since the groat contains 6-8%
fat, compared to the 2-3% found in most other grains, and high levels of lipases, the oats must
next be steamed and kiln dried in order to inactivate enzymes and prevent spoilage (Stewart and
McDougall, 2014). Additionally, this step results in Maillard browning of the groat, which
produces desirable flavors. Depending on the size of rolled oats desired, the oats can then be cut
two to four times to produce quick cooking or instant oats or left intact for production of rolled
oats. Finally, whole groats or groat pieces are flaked by first steaming the groats to prevent
crushing, and then passing them through rollers to produce a flat flake.

3
LITERATURE REVIEW
Glyphosate
Glyphosate [N-(phosphonomethyl)glycine] is a phosphonate derivative of glycine. It is
the most commonly used pesticide in the United States and likely, globally (Benbrook, 2016).
The volume of glyphosate being used is increasing, mostly due to the development of
glyphosate-resistant crops.
Glyphosate was originally synthesized in 1950 by the Swiss chemist Dr. Henri Martin,
who was performing pharmaceutical research (Dill, Sammons, et al., 2010). However, its
herbicidal activity remained undiscovered and the compound was never developed for
commercial use. In the 1960s, the biotechnology company Monsanto synthesized AMPA
analogues, which are related to glyphosate, to test as potential water softening agents. The
compounds were also tested for herbicidal activity, which was found in low unit activity in two
of the compounds. Dr. John Franz began working on synthesizing analogues and derivatives, and
in 1970, first synthesized glyphosate. After field testing, glyphosate was introduced to the market
under the name Roundup in 1974.
Figure 1: Chemical Structure of Glyphosate
Mechanism
Glyphosate acts on the plant enzyme 5-enolpyuvyl-shikimate-3-phosphate synthase
(EPSPS) of the shikimate pathway found in plants (Duke and Powles, 2008). Glyphosate is a
transition state analog of the EPSPS substrate phosphoenolpyruvate and thus can bind to EPSPS,

4
acting as a competitive inhibitor. Inhibition of EPSPS prevents the catalysis of shikimate-3-
phosphate and phosphoenolpyruvate to 5-enolpyruvyl shikimate-3-phosphate, which is
detrimental to the plant in two ways. First, disruption of the shikimate pathway leads to the
inability to synthesize the compound chorismate, which is a precursor necessary to produce the
three aromatic amino acids Without chorismate, these amino acids cannot be produced. In
addition, glyphosate application is shown to reduce carbon fixation in plants (Servaites, Tucci, et
al., 1987). This is likely due to an absence of feedback inhibition caused by the decreased
synthesis of chorismate, though the exact mechanism of feedback inhibition in the shikimate
pathway in plants has not yet been determined. Because the shikimate pathway is conserved in
all plants, glyphosate is a non-selective herbicide. However, the shikimate pathway is not found
in humans or other animals, so glyphosate is considered non-toxic in normal doses.
Since glyphosate is taken up through the leaves, it can only be used on already growing
plants, making it useful for pre-harvest weed management applications (Duke and Powles,
2008). To assist in its uptake by weeds, glyphosate is usually mixed with a surfactant to assist
with translocation across the cuticle via diffusion. The rate of translocation varies across plant
species. From the leaves, glyphosate is transported to via the phloem to other plant tissues,
causing death in any actively growing tissue.
Usage
In the 30 years following its market introduction in 1974, 1.6 billion kilograms of
glyphosate active ingredient have been applied to fields in the United states, (Benbrook, 2016).
In its first year on the market, 0.36 kilograms of glyphosate were used, which increased steadily
to 12.5 million kilograms in 1995, making it the seventh most applied pesticide that year.
However, beginning around 1996, genetically engineered crops began gaining market share with

5
Monsanto’s introduction of the Roundup Ready® soybean. Roundup Ready® crops are
genetically engineered to be resistant to glyphosate, which allows farmers to apply glyphosate
liberally to fields without harming crops. Because of this, usage of glyphosate increased to 36
million kilograms in 2000 and continued to increase to a present yearly usage of 113.4 million
kilograms (as of 2014). This represents a 300-fold increase in usage since its introduction.
Glyphosate as a Harvest Aid
In addition to its use as an herbicide, glyphosate is commonly applied pre-harvest to act
as a desiccant. Typically, glyphosate is applied when a crop reaches physiological maturity
(Griffin, Boudreaux, et al., 2010). This practice will not only kill any weeds present in the field,
but also kills the crop, which dries out the foliage. Pre-harvest desiccation provides several
advantages to the farmer. For instance, it has been shown to reduce the moisture in the harvested
crop. Additionally, pre-harvest desiccation can allow for an earlier harvest (Boudreaux and
Griffin, 2008). This is advantageous to farmers, as delaying harvest can be associated with lower
yields (Philbrook, 1989).
However, pre-harvest glyphosate treatment is not without drawbacks. Seedlings planted
after treatment with glyphosate have been shown to have decreased rates of germination and root
growth (Piotrowicz-Cieslak, Adomas, et al., 2010). Wheat treated with pre-harvest glyphosate
has been found to contain elevated levels of shikimic acid (Bresnahan, Manthey, et al., 2003).
This results in production of flour containing an elevated amount of phenolic acids, which is
associated with development of a weaker dough. Application of glyphosate to wheat at the soft
dough stage can reduce test weight, kernel size, and kernel weight (Manthey, Chakraborty, et al.,
2004). When made into dough, flour produced from wheat treated with pre-harvest glyphosate at

6
the soft dough stage requires longer mix times versus untreated wheat, which is undesirable for
bread making.
Environmental Toxicity
After application, the route of glyphosate degradation differs in glyphosate-susceptible
and glyphosate-resistant farming systems. In soil, there are two main routes of degradation
(Duke, 2011). The first route is via a C-P lyase, which leads to the formation of inorganic
phosphate and sarcosine. Glyphosate can also be broken down via breakage of the C-N bond by
the enzyme glyphosate oxoreductase, leading to the formation of glyoxylate and
aminomethylphosphonic acid (AMPA). AMPA is considered the major metabolite of glyphosate
breakdown.
Glyphosate is considered a low dermal and oral toxicity by the Environmental Protection
Agency (EPA), and is only considered slightly toxic to wildlife (Environmental Protection
Agency, 1993). Despite this, its use remains controversial among some of the general public.
Glyphosate and AMPA are non-volatile and will linger in the soil. Half-lives of these compounds
have been found to be up to 151 days for glyphosate and 98 days for AMPA (Bai and Ogbourne,
2016). However, these numbers may vary wildly depending on soil type. Studies have drawn
mixed conclusions on the effect of glyphosate on the environment. Application of glyphosate in
coffee plantations can have detrimental effects on earthworms (García-Pérez, Alarcón-Gutiérrez,
et al., 2014). However, contradictory findings show that earthworms appear to be unaffected by
glyphosate (Pereira, Antunes, et al., 2009).
Because glyphosate binds tightly to soil, contamination of aquatic environments via
runoff, concerns about contamination of aquatic environments are limited (Annett, Habibi, et al.,
7
2014). Additionally, this characteristic minimized the risk of groundwater contamination via
runoff. However, AMPA shows lower binding activity in soil which may result in leaching.
Human Toxicity
The target of glyphosate, the shikimate pathway, is not found in humans. Because of this,
glyphosate is not considered harmful to humans. With regard to animal consumption, the EPA
places glyphosate in the “least toxic” category, category IV (Williams, Kroes, et al., 2000).
However, shifts in public opinion and recent research have led many to be skeptical of this
classification. Glyphosate has been found to induce breast cancer in human cells in vitro via
estrogenic activity (Thongprakaisang, Thiantanawat, et al., 2013). Additionally, glyphosate and
its metabolites can cause hemolysis and hemoglobin oxidation in human erythrocytes in vitro
(Kwiatkowska, Huras, et al., 2014). However, the concentration required for these changes to
occur would only be present in a poisoning situation and not through incidental exposure via
consumption of food treated with glyphosate. Glyphosate has also been found to be an endocrine
disrupter in human cell lines (Gasnier, Dumont, et al., 2009). Interestingly, cytotoxic effects
generally varied by the type of formulation (for example, surfactant type), and not by
concentration of glyphosate.
Oats
Oat (Avena sativa) is a cereal crop that is grown around the world for both human and
livestock consumption. An oat grain consists of an outer husk, which accounts for about 25-36%
of the weight of the grain and covers the caryopsis, which is known as a groat. The groat is the
only part of the oat that can be digested by humans and contains the majority of the nutrients.
The groat consists of about 59% carbohydrates. 15-20% protein, 7% lipids, and 10% fiber
(Gulvady, Brown, et al., 2013).

8
The groat consists of three major components: bran, germ, and endosperm. The bran
makes up 40% of the groat by weight and is the outer layer of the groat. Oat bran is the major
source of vitamins and minerals. The endosperm is the largest fraction, making up 57% of the
groat’s weight (Gulvady, Brown, et al., 2013). The endosperm serves as storage for protein and
starch, and also contains 90% of the lipid present in the groat. The germ layer, or embryo, is the
minor component, making up 3% of the groat’s weight. It contains high levels of protein and
lipid.
Figure 2: A Longitudinal Section of an Oat Kernel
©GoodMills Innovation GmbH
Oats are grown around the world, but the majority of the crop is grown in Europe and the
Americas (Marshall, Cowan, et al., 2013). Russia is the global leader in oat production, with 200
million bushels produced in 2010. The United States produced 89.5 million bushels of oats in
2015, with Wisconsin as its largest producer (United States Department of Agriculture, 2016).
North Dakota is the 4th largest producer of oats in the US, with 10.3 million bushels produced in
2015.

9
Human Consumption of Oats
In the United States, annual human consumption of oats per capita sits at about 4.5
pounds (Strychar, 2011). This is down from a peak of 6.5 pounds in 1990. Since they lack
gluten, oats are not suitable for use as a bread flour. Instead, they are most often consumed as
oatmeal in hot cereal, as oat flour in ready to eat cereal, or as an addition to wheat bread.
Carbohydrates are the primary nutrient found in oats, at 59 g per 100 g of oats (Gulvady,
Brown, et al., 2013). This is followed by protein at 17 g per 100 g of oats, fiber at 11 g per 100 g,
and lipid at 7 g per 100 g. In comparison, wheat provides protein at 17 g per 100 g and lipid at 3
g per 100g. Additionally, oats are rich in B vitamins. A 100g serving of oats also provides 51%
of the USDA recommended daily value (DV) of thiamin, 14% of the DV of folate, and 9% of the
DV of riboflavin. Oats are also rich in the minerals phosphorus (52% DV in 100g serving) and
potassium (12% DV in 100g serving).
Oats have been found to have many health benefits and are a good addition to the human
diet. For instance, oats are high in the polysaccharide -glucan, which is found in the endosperm
and aleurone cell walls at a rate of 2.3-8.5% (Gulvady, Brown, et al., 2013). The -glucan found
in oats has been shown to control blood glucose and cardiovascular disease. Additionally,
consumption of oat -glucan has also been shown to improve cholesterol levels (Butt, Tahir-
Nadeem, et al., 2008). The exact mechanism by which cholesterol is lowered is still unresolved,
but it is proposed that -glucan mediates the formation of a viscous layer in the small intestine,
which inhibits the uptake of dietary cholesterol and reabsorption of bile (Othman, Moghadasian,
et al., 2011). Since bile is not reabsorbed, the synthesis of bile acids from cholesterol is
increased, which lowers the circulating LDL cholesterol levels.
10
Oat Quality Traits
Relevant quality parameters of oats depend on the step in processing being considered.
For example, grain yield may be a very important parameter to growers, but food producers are
likely more interested in nutrition content and grain uniformity. Therefore, numerous parameters
must be analyzed to determine overall oat quality.
Physical Quality
Physical oat quality parameters are of great interest to oat breeders, growers, and millers.
This includes groat percentage, which is a measure of the percentage of the weight of a sample of
whole oat grain that is attributed to the groat (Ames, Fregeau-Reid, et al., 2014). Groat
percentage is calculated by weighing a sample of whole oat grain, dehulling the sample, and then
weighing the groats that have been separated from the hulls. A high groat percentage is desired,
as hulls are inedible by humans and considered a low-value product. A typical groat percentage
is 70-75%, but can vary by cultivar, year, and growing location.
Groat size is another important physical quality parameter. Uniform size is desired for
dehulling, as different kernel sizes require different rotor speeds (Doehlert and Wiessenborn,
2007). Larger groats are desired, as large groats are associated with better milling yields and also
allow for the production of larger size oat flakes (Ames, Fregeau-Reid, et al., 2014). Oat size can
be divided into “plumps” and “thins.” Plump oats are defined as kernels that remain on the top of
a 5.5/64” x 0.75” sieve, while thin oats are defined as those that pass through a 5/64” x 0.75”
sieve.
Test weight is a measure of the specific volume of a quantity of oats, and is expressed in
lb/bu (Ames, Fregeau-Reid, et al., 2014). It is determined by measuring the weight of a fixed
volume of oat kernels, and then converting to lb/bu. A high test weight is desired for oats, and is
11
correlated with kernel size and shape, as well as groat density. Starch content is inversely
correlated with test weight, as a high starch content reduces density (Doehlert and McMullen,
2000). The minimum test weight for grade No. 1 oats is 36 lb/bu (United States Department of
Agriculture, 1988).
Nutritional Quality
Protein content in groats ranges from 12-16%, which is among the highest in cereals
(Ames, Fregeau-Reid, et al., 2014). Cultivar, growing location, and weather can contribute to
variations in protein content. Protein is an important quality factor in order to meet nutrition
claims. Protein content is measured by combusting a sample and measuring the nitrogen
released, which can then be used to deduce protein content by using a conversion factor.
The starch content of groats ranges from 40-65% (Ames, Fregeau-Reid, et al., 2014).
Starch content is a relevant quality parameter, as starch can affect end product quality. The starch
content desired will vary depending on the end product. Oat starch content can be quantified by
enzymatic assays, while starch quality can by analyzed by measuring pasting properties. Oat
starch is discussed in detail below.
Oat Flake Quality
Oat flake quality is influenced by both the quality of groats used for processing and the
processing conditions. For instance, kilning is primarily performed to inactivate peroxidase in
flakes to lengthen shelf life. However, kilning groats has been found to increase the specific
weight of oat flakes (Gates, Sontag-Strohm, et al., 2008). Tempering groats is necessary before
rolling to prevent crushing of the groats, but interestingly, extended tempering times can actually
increase the number of fines in oat flakes. Oat flake quality can be assessed using multiple
parameters, including flake thickness, flake granulation, and water absorption (Ames and
12
Rhymer, 2003). Flake thickness and granulation are relevant to meet specifications for whatever
product is being produced-for example, instant oats required a thinner flake and smaller
granulation than old fashioned rolled oats. Water absorption is dependent on both flake thickness
and absorption by the macromolecular components (such starch and β-glucan), and is an
indicator of the texture of oat products (Gates, Sontag-Strohm, et al., 2008).
Oat Starch
Starch is the primary component of the groat, accounting for 40-65% of its weight
(Kasturi and Bordenave, 2013). Like other plant starches, oat starch is made up of two polymers
of glucose: amylose and amylopectin. The proportion of amylopectin to amylose varies among
oat varieties, ranging from 20-34% amylose. The amylose found in oat starch is similar in size to
that in other cereals, while the amylopectin tends to be of lower molecular weight in comparison.
For instance, the average weight of high molecular weight amylopectin for oats is 8.9x10⁴ Da,
compared to wheat which is 5.6x10⁵ Da. The starch forms discrete, irregularly shaped granules,
which range from 2-12µm in diameter (Zhou, Robards, et al., 1998). Unlike the starches of other
plants, such as wheat, oat starch granules do not have distinct size distributions (such as the A&B
distribution in wheat). The granules tend to cluster, forming compound granules that are around
60 µm in diameter.
Since starch is responsible for much of the texture of cooked oats, it is a key factor in oat
quality. It has a gelatinization temperature of 57-62ºC, but can very between cultivars (Kasturi
and Bordenave, 2013). Starch solubility shows a heightened increase at 90-95ºC, and at 95ºC
most of the granules are disintegrated. Oat starch is more sensitive to shearing than other cereals,
and its cooled gels are clearer, more elastic, and less susceptible to retrogradation. When cooled,
the amylopectin forms a dense network, causing a rapid increase in viscosity at about 70-80ºC.

13
Oat starch also has a higher proportion of lipids than wheat or maize starch, which contributes to
the mentioned pasting properties.
Impact of Processing on Oat Starch
As discussed earlier, oats are rich in lipids, especially compared to other cereals. Oats are
also rich in hydrolytic enzymes, such as lipase and lipoxygenase (Hu, Xing, et al., 2010). Thus,
over time, degradation of lipids by these enzymes will result in a rancid taste. To combat this,
groats are usually heat treated in order to inactivate the enzymes. However, this heat treatment
also affects the behavior of oat starch. Steaming and toasting of oat flour results in a reduction in
starch damage compared to flour that is not heat treated, likely due to the inactivation of the
enzyme amylase, which hydrolyzes starch (Ovando-Martínez, Whitney, et al., 2013). Steaming
and toasting also causes an increase in viscosity when cooked at 64˚C for 10 minutes or longer.
This treatment also decreases the number of large starch granules, in addition to decreasing the
weight averaged molecular weight of amylose, and high and low molecular weight amylopectin.
Oat Processing
To be converted to an edible food for humans, oats must go through several processing
steps. Processing specifications may vary due to proprietary methods, but the general steps of oat
processing are summarized in Figure 3.
Grading and Dehulling
The first step of oat processing is grading. To operate equipment efficiently, oats must be
graded based on size. They are sorted by width, which leads to fractions with similar densities
(Decker, Rose, et al., 2014). Sorting is accomplished by passing the oats through a series of
perforated cylinders which contain holes of decreasing diameter. After sorting, the inedible outer
hull must be removed using a dehuller, which consists of a spinning disk that throws the oats into

14
impact rings, separating the hull from the groat. Once about 85% of the oats are dehulled, the
oats are separated from the hulls and the oats with intact hulls are put back into the dehuller
(Decker, Rose, et al., 2014). This minimizes breakage, as excess dehulling will cause the groats
to break.
Figure 3: Flowchart of Oat Processing Steps
(Decker, Rose, et al., 2014)
Heat Treatment
In comparison to other cereals, oats are higher in lipids and contain elevated levels of
lipid-digesting enzymes. To prevent the breakdown of lipids and the resulting unpleasant taste,
the groat lipases must be inactivated. This is done by first passing the oats through long vertical
columns and injecting steam to increase the temperature of the groats (Decker, Rose, et al.,
2014). After steaming, the groats are exposed to dry heat to decrease the moisture to about 10%
to improve conditions for storage. Dry heating also causes the groats to undergo Maillard

15
reactions, which improves the final flavor of the oats. Additionally, the steaming and kiln drying
process also acts as a method of decreasing microbial hazards in the groats.
Steel Cut Oats
To produce edible oats, the groats must first be processed into ‘steel cut’ oats via a rotary
granulator. This consists of a rotating drum which feeds the groats into a series of knives
resulting in the groat being cut two to four times. Steel cut oats can be used for hot cereal but
require a longer a cooking time than rolled oats due to their large size and minimal processing.
However, steel cut oats are desirable to consumers due to having a low glycemic index, a nuttier
flavor, and appealing texture (Ames, Fregeau-Reid, et al., 2014).
Production of Rolled and Quick Cooking Oats
Further processed oat products are produced by rolling either whole groats, for rolled
oats, or steel cut oats, for quick cooking or instant oats. The first step in this process is to temper
the oats with steam, as the kiln drying process make the oats brittle and prone to crushing
(Decker, Rose, et al., 2014). Steaming adds about 3-5% moisture back to the oats. Next, the oats
are passed through rollers to produce flakes of the desired thickness: 0.36-0.46 mm for quick
cooking oats and 0.51-1.2 mm for rolled oats. After rolling, the flakes are passed through an air
stream to bring the moisture back down to 10%. The flaking process (steaming and rolling) pre-
gelatinizes the starch in the oats, allowing for rapid water absorption during cooking, which
reduces cooking time. Additionally, the properties of flakes can be assessed to determine product
quality. Larger and thicker flakes tend to have more positive sensory properties and are also
more durable with regards to packaging and transit (Ames, Fregeau-Reid, et al., 2014).
16
Justification, Objective, and Hypothesis
Justification
Consumer scrutiny in food is growing, especially about the use of pesticides on foods. In
2015, the Canadian firm Grain Millers Inc announced that they would no longer purchase oats
treated with pre-harvest glyphosate, citing performance issues comparable to an early freeze.
Since the use of pre-harvest glyphosate allows for a more convenient harvest, it is worth
examining whether this practice does, in fact, cause a decrease in oat quality. However, no
research has yet been performed on the effect of glyphosate on final oat quality.
Objectives
• To determine the effects of pre-harvest glyphosate application on whole groats
• To examine differences in quality in rolled oats produced from glyphosate treated and
untreated groats
• To determine whether the timing of glyphosate application results in quality
differences in whole groats and rolled oats
Hypothesis
Application of pre-harvest glyphosate will negatively affect the quality of both whole
groats and rolled oats. Earlier application of glyphosate will be associated with a greater decrease
in quality.
17
MATERIALS AND METHODS
Materials
2015 Sample Set
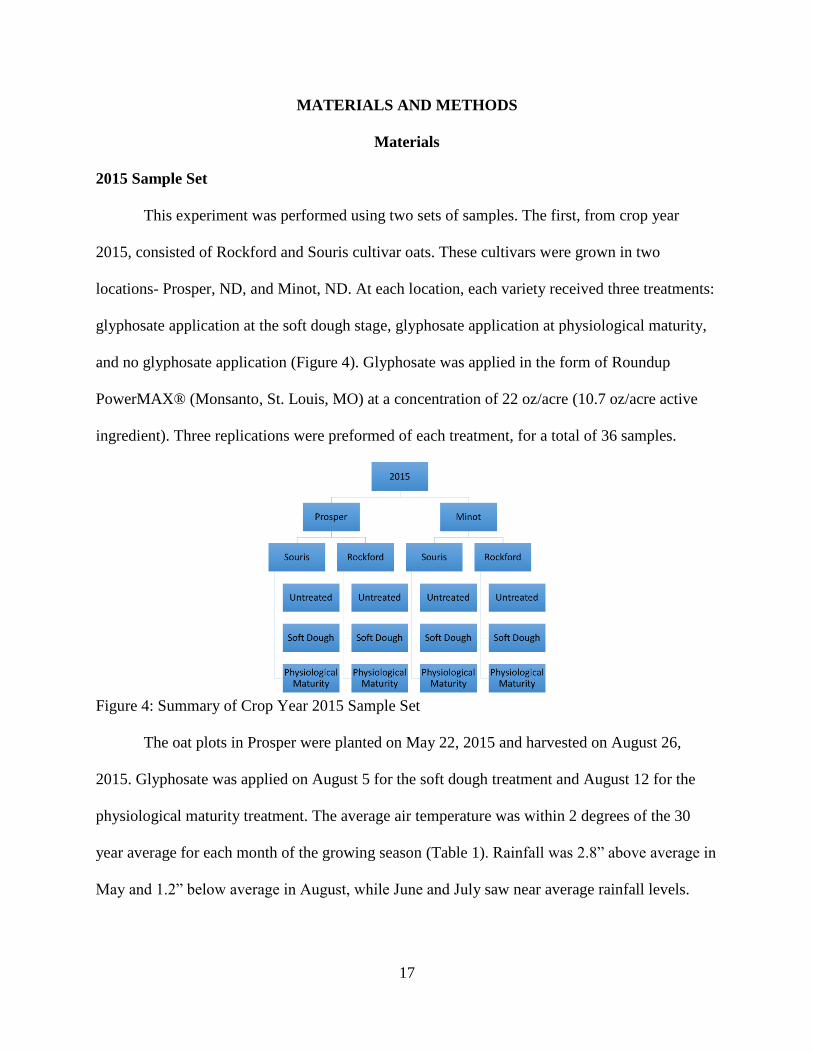
This experiment was performed using two sets of samples. The first, from crop year
2015, consisted of Rockford and Souris cultivar oats. These cultivars were grown in two
locations- Prosper, ND, and Minot, ND. At each location, each variety received three treatments:
glyphosate application at the soft dough stage, glyphosate application at physiological maturity,
and no glyphosate application (Figure 4). Glyphosate was applied in the form of Roundup
PowerMAX® (Monsanto, St. Louis, MO) at a concentration of 22 oz/acre (10.7 oz/acre active
ingredient). Three replications were preformed of each treatment, for a total of 36 samples.
Figure 4: Summary of Crop Year 2015 Sample Set
The oat plots in Prosper were planted on May 22, 2015 and harvested on August 26,
2015. Glyphosate was applied on August 5 for the soft dough treatment and August 12 for the
physiological maturity treatment. The average air temperature was within 2 degrees of the 30
year average for each month of the growing season (Table 1). Rainfall was 2.8” above average in
May and 1.2” below average in August, while June and July saw near average rainfall levels.

18
Table 1: Weather Data for Crop Year 2015 in Prosper, ND
Month
Actual Air
Temperature
(˚F)
30 Year Average
Air Temperature
(˚F)
Actual Rainfall
(inches)
30 Year Average
Rainfall (inches)
May 54 56 5.85 3.05
June 67 66 4.32 3.95
July 70 70 3.48 1.43
August 67 69 1.43 2.62
(North Dakota Agricultural Weather Network, 2018)
The oat plots in Minot were planted on May 1, 2015 and harvested on August 19, 2015.
Glyphosate was applied on July 31 for the soft dough treatment and August 5 for the
physiological maturity treatment. The average air temperature was within 2 degrees of the 30
year average for each month of the growing season (Table 2). Rainfall was within 1” of the 30
year average for all months of the growing season, except for June which saw a rainfall of 2.6”
above average.
Table 2: Weather Data for Crop Year 2015 in Minot, ND
Month
Actual Air
Temperature
(˚F)
30 Year Average
Air Temperature
(˚F)
Actual Rainfall
(inches)
30 Year Average
Rainfall (inches)
May 53 54 3.12 2.57
June 65 63 6.10 3.49
July 70 69 1.82 2.55
August 68 67 1.09 2.00
(North Dakota Agricultural Weather Network, 2018)
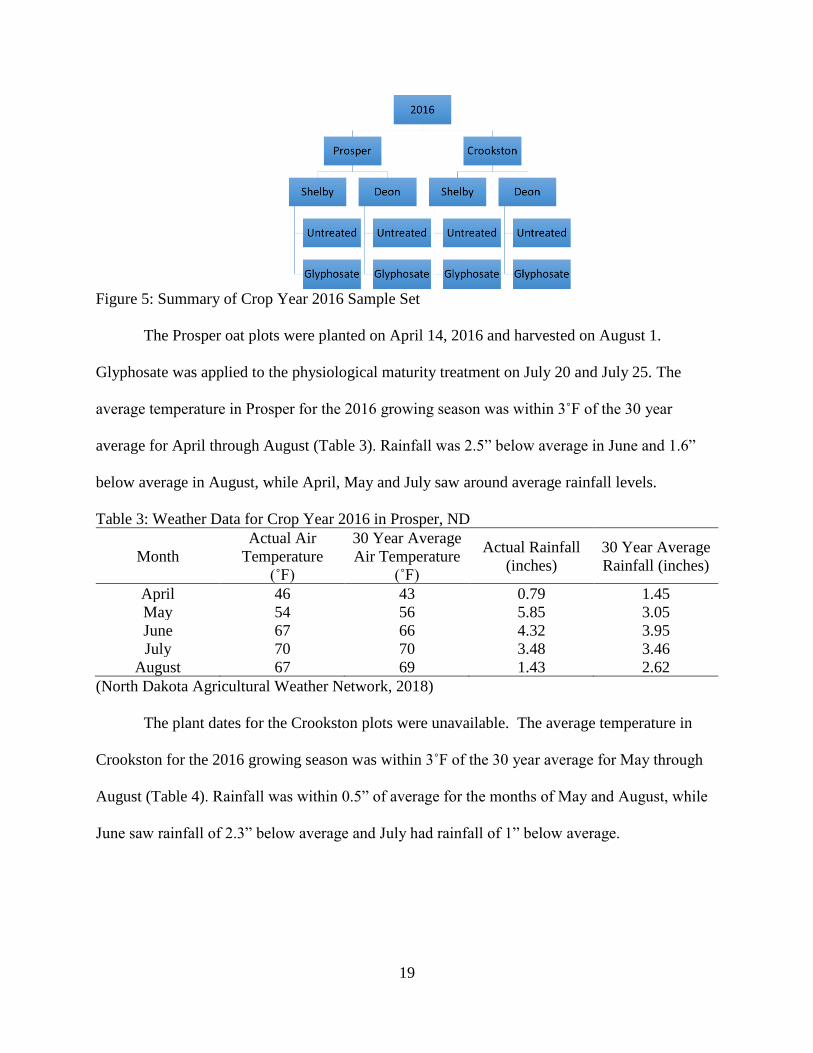
2016 Sample Set
The second sample set, from crop year 2016, consisted of Shelby and Deon varieties,
which were grown in Prosper, ND and Crookston, MN (Figure 5). At each location, each variety
either received glyphosate application at physiological maturity or was left untreated. Glyphosate
was applied in the form of Roundup PowerMAX® (Monsanto, St. Louis, MO) at a concentration
of 22 oz/acre (10.7 oz/acre active ingredient). At each location, there were four replications of
each variety and treatment combination, for a total of 32 samples.
19
Figure 5: Summary of Crop Year 2016 Sample Set
The Prosper oat plots were planted on April 14, 2016 and harvested on August 1.
Glyphosate was applied to the physiological maturity treatment on July 20 and July 25. The
average temperature in Prosper for the 2016 growing season was within 3˚F of the 30 year
average for April through August (Table 3). Rainfall was 2.5” below average in June and 1.6”
below average in August, while April, May and July saw around average rainfall levels.
Table 3: Weather Data for Crop Year 2016 in Prosper, ND
Month
Actual Air
Temperature
(˚F)
30 Year Average
Air Temperature
(˚F)
Actual Rainfall
(inches)
30 Year Average
Rainfall (inches)
April 46 43 0.79 1.45
May 54 56 5.85 3.05
June 67 66 4.32 3.95
July 70 70 3.48 3.46
August 67 69 1.43 2.62
(North Dakota Agricultural Weather Network, 2018)
The plant dates for the Crookston plots were unavailable. The average temperature in
Crookston for the 2016 growing season was within 3˚F of the 30 year average for May through
August (Table 4). Rainfall was within 0.5” of average for the months of May and August, while
June saw rainfall of 2.3” below average and July had rainfall of 1” below average.

20
Table 4: Weather Data for Crop Year 2016 in Crookston, MN
Month
Actual Air
Temperature
(˚F)
30 Year Average
Air Temperature
(˚F)
Actual Rainfall
(inches)
30 Year Average
Rainfall (inches)
April 45 42 0.49 1.01
May 54 55 3.70 2.36
June 65 64 2.36 3.48
July 70 69 3.21 3.15
August 68 67 2.50 2.88
(National Weather Service, 2018, Weather Underground, 2018)
Sample Preparation
Upon receipt, samples were cleaned on a Carter Day dockage tester (Carter Day
International, Minneapolis, MN). The settings for cleaning were as follows:
• #6 Riddle: foreign material
• #4 Oblong sieve: thick/plump kernels
• #6 Triangle sieve: thin kernels
• Blank: foreign material
• Air flow: setting #4
• Feed rate: setting #5
Test weight was determined using a Dickey-John GAC 2100b analyzer (Dickey-John,
Auburn, IL), and moisture was determined by Near-Infrared (NIR). The groats were then
separated from the hulls using a Codema Laboratory Oat Huller (Codema, Maple Grove, MN)
(Figure 6). Whole groats were analyzed for kernel diameter, hardness, and weight using a Single
Kernel Characterization System (Perten Instruments, Hägersten, Sweden). For tests necessitating
oat flour, whole groats were ground using a udy mill.

21
Figure 6: Codema Laboratory Oat Dehuller
Groat Analysis
Electron Microscopy
Electron microscopy was performed at the NDSU electron microscopy center. Groats
were cut in half transversely with a razor blade and attached to aluminum mounts with high-
purity silver paint (SPI Products, West Chester PA, USA). Mounted samples were sputter-
coated with a conductive layer of gold (Cressington 108auto, Ted Pella Inc., Redding CA, USA)
and then images were obtained immediately using a JEOL JSM-6490LV scanning electron
microscope (JEOL USA, Inc., Peabody MA, USA) operating at an accelerating voltage of 15 kV.
This material is based upon work supported by the National Science Foundation under
Grant No. 0619098. Any opinions, findings, and conclusions or recommendations expressed in

22
this material are those of the author(s) and do not necessarily reflect the views of the National
Science Foundation.
Proximate Analysis
Moisture content was measured using AACCI approved method 44-15.02 (AACC
International, 1999a). Protein content was analyzed using AACCI approved method 46-30.01
(AACC International, 1999b).
Starch and Viscosity Analysis
Total starch and starch damage were analyzed using AACCI approved methods 76-13.01
and 76-31.01, respectively (AACC International, 1999c and 1999d). Rapid Visco Analysis
(RVA) was performed on heat treated groats (process below) using AACCI approved method
76-21.01, standard profile 1 (AACC International, 1999e).
Rolled Oat Preparation
Heat Treatment
To prepare for rolling, whole groats were first heat treated. 100 gram samples of the
groats first placed in mesh baskets (Figure 7). Then, samples were steamed at 100% humidity,
100º C for 40 minutes using an Adcraft full size food cooker/warmer 1500W (Admiral Craft,
Westbury, NY). Temperature was monitored using a probe thermometer. This was followed by 1
hour of dry heat in a Baxter OV310E mini rotating rack convection oven (Baxter, Orting, WA) at
100º C, stirring the samples every 15 minutes. The groats were removed from the oven and left
out to dry overnight to allow the moisture to equilibrate.

23
Figure 7: Oat Groat Heat Treatment
Groats were steamed (a), toasted (b), and left at room temperature overnight to equilibrate (c)
Rolling
Before rolling, the groats were tempered by steaming for 10 minutes at 100% humidity,
100º C, using an Adcraft full size food cooker/warmer 1500W (Admiral Craft, Westbury, NY).
Temperature was monitored using a probe thermometer. After tempering, groats were rolled
using a Roskamp Model K roller mill (Roskamp Champion, Waterloo, IA) (Figure 8). The roll
gap was set to 0.381 mm using a gap measuring tool. To ensure constant feed rate, a feeder from
a Perten LM 3100 mill (Perten Instruments, Hägersten, Sweden) was attached to the roller
opening. After rolling, the oats were collected and placed back into a mesh basket. The rolled
oats were left out to dry overnight to allow the moisture to equilibrate.

24
Figure 8: Lab Oat Roller
Rolled Oat Quality Measures
Thickness
Average oat thickness was determined using a Mitutoyo 2416F thickness gauge
(Mitutoyo, Aurora, IL). Measurements were taken at the thickest point of 20 individual rolled
oats, and averages and standard deviations were calculated for each sample (Figure 9).

25
Figure 9: Thickness Gauge with Oat Flake
Absorption
Rolled oat absorption was performed using AACC method 56-40.01, modified to a ratio
of 25g oats to 100g water, as described in Ames and Rhymer 2003 (AACC International, 1999f,
Ames and Rhymer, 2003). 25g of each sample was weighed out into a beaker, to which 100 mL
of DI water was added (Figure 10). After 5 minutes, the water and rolled oats were poured out
onto a US no. 20 standard sieve and drained for 5 minutes. The weight of the wet oats and sieve
was then recorded, and absorption was calculated using the formula:
water absorption (g/25g oats) = weight of sieve and wet oats – (25 + dry sieve weight)

26
Figure 10: Rolled Oat Absorption Test
25g of rolled oats were placed into a beaker, and 100 mL of water was added (a). After 5
minutes, the contents were poured out onto a sieve and allowed to drain (b).
Granulation
Granulation was measured on 50g of flaked oats using US standard sieves numbers 4, 7,
and 10 on a Ro-Tap shaker (W.S. Tyler, Mentor, OH). Samples were shaken for 2 minutes, after
which the weight of the sample remaining in each sieve was recorded (Figure 11). The
percentage of sample remaining in each sieve from the total sample amount was then calculated.
Figure 11: Sample Remaining on Ro-Tap Sieves
From left: US standard sieves # 4, 7, and 10, bottom pan.
Statistical Analysis
This experiment was designed using a split layout, with location as the main plot and
cultivar and glyphosate application as sub-plots. The replications were considered as nested in

27
location. Statistical analysis was performed using Statistical Analysis Software (SAS for
Windows 9.4, SAS Institute, Cary, NC).

28
RESULTS AND DISCUSSION
In the 2015 crop year sample set, oats were grown in Minot, ND and Prosper, ND. At
each location, Rockford and Souris cultivars were grown. For each location/cultivar combination
there were three treatments: application of glyphosate at the soft dough stage, application of
glyphosate at physiological maturity, or no glyphosate application.
In the 2016 crop year sample set, oats were grown in Crookston, MN, and Prosper, ND.
At each location, Shelby and Deon cultivars were grown. For each location/cultivar combination
there were two treatments: application of glyphosate at physiological maturity, or no glyphosate
application.
Groat Quality Measures
Groat quality testing can be performed to predict end product characteristics. For
instance, plump oats are indicative of a higher test weight and therefore better yield. Groat
percentage indicates the percentage of the weight of a sample remaining after dehulling-thus a
high groat percentage indicates more useable grain. Protein content is essential to monitor in
order to meet nutrition needs, and total starch and starch damage can give indication of product
quality after processing. Test weight is a measure of the mass of oats that can be contained
within a standard volume.
Overall Results
For the 2015 crop year, plump percentages ranged from 90.56-92.68%. Significant
(P<0.05) differences were observed between glyphosate treatments (Table 5). Treatment at the
soft dough stage resulted in a significantly (P<0.05) lower percentage of plump groats compared
to treatment at physiological maturity or untreated samples. This is likely because the samples
treated at the soft dough stage did not have as long to develop, resulting in smaller groats.

29
Application of glyphosate leads to an inability to down regulate the shikimate acid pathway,
which results in an increased demand for carbon in that pathway. Thus, this may lead to less
carbon being available for grain filling, leading to smaller groats. Groat percentage among the
samples ranged from 68.90-70.00%. Groat percentage was significantly (P<0.05) lower in the
soft dough treatment group versus the other treatment groups. Again, groats treated at the soft
dough stage did not have as long to develop as the other two treatment groups, due to the early
glyphosate application. This likely led to a lower groat percentage as groat was smaller, which
resulted in the hull representing a greater proportion of the kernel weight.
A high degree of starch damage is undesirable in grain, as it increases water absorption,
and can affect the swelling and gelatinization properties of starch (Tester and Karkalas, 1996).
Starch damage contents of the three treatments ranged from 58.75-60.31% (Table 5) Starch
damage was significantly (P<0.05) lower in untreated samples versus samples treated at the soft
dough stage or physiological maturity. Test weight, protein content, and total starch did not
differ significantly (P>0.05) between the three treatments. Test weight for the three treatments
ranged from 36.24-36.90 lb/bu. The minimum test weight for the various classes of oats ranges
between 27.0-36.0 lb/bu (United States Department of Agriculture, 1988).
Table 5: 2015 Groat Quality Parameters
Glyphosate
Treatment Plump (%)
Groat
percentage
(%)
Test
Weight
(lb/bu)
Protein*
(%)
Total
Starch*
(%)
Starch
Damage*
(%)
Untreated 92.32a 70.28a 36.24a 14.80a 58.75a 0.43b
Soft Dough 90.56b 68.90b 36.90a 14.77a 59.68a 0.52a
Physiological
Maturity 92.68a 70.00a 36.61a 14.46a 60.31a 0.49a
Values are averages of all locations/cultivars. Values with the same superscript level are not
significantly different (P>0.05) Least significant difference was used for mean separation. lb/bu:
pounds/bushel. *dry weight basis.

30
The lack of significant difference in test weight between the treatments is curious,
especially considering there was a significant difference in groat plumpness, which is correlated
with test weight (Ames, Fregeau-Reid, et al., 2014). Additionally, significant differences in test
weight in wheat have been observed when glyphosate is applied at the soft dough stage
(Manthey, Chakraborty, et al., 2004). The lack of significant difference in protein content,
however, is less surprising, as wheat protein also appears to be unaffected by preharvest
glyphosate (Darwent, Kirkland, et al., 1994, Manthey, Chakraborty, et al., 2004). This is likely
because glyphosate is a slow acting pesticide, so storage protein synthesis (as a percentage of
groat weight) likely plateaued before the oat plants were killed by the glyphosate (Peterson and
Smith, 1976).
For the 2016 crop year samples, plump groat percentages were 99.45% and 99.38% for
untreated oats and oats treated with glyphosate at physiological maturity, respectively (Table 6).
These values were not significantly (P>0.05) different. Groat percentage were 72.29% and
71.88% for untreated and glyphosate treated oats, respectively. These values were not
significantly (P>0.05) different. Test weight values were 38.83 lb/bu and 38.48 lb/bu for
untreated and glyphosate treated oats, respectively. These values were not significantly (P>0.05)
different. Protein content was 16.26% for untreated oats and 16.63% for glyphosate treated oats.
These values were not significantly (P>0.05) different. Total starch values were 57.66% and
57.53% for untreated and glyphosate treated oats, respectively. These values were not
significantly (P>0.05) different. Damaged starch content was 0.68% for glyphosate treated oats
and 0.65% for untreated oats. These values were not significantly (P>0.05) different.

31
Table 6: 2016 Groat Quality Parameters
Glyphosate
Treatment Plump (%)
Groat
percentage
(%)
Test
Weight
(lb/bu)
Protein*
(%)
Total
Starch*
(%)
Starch
Damage*
(%)
Untreated 99.45a 72.29a 38.83a 16.26a 57.66a 0.68a
Physiological
Maturity 99.38a 71.88a 38.48a 16.63a 57.53a 0.65a
Values are averages of all locations/cultivars. Values with the same superscript level are not
significantly different (P>0.05) Least significant difference was used for mean separation. lb/bu:
pounds/bushel. *dry weight basis
.
Since no significant differences were observed between treatments, it is likely that the oat
kernels were fully developed before the glyphosate killed the oat plant. This trend was also seen
in the 2015 sample set-no significant differences were observed between the untreated samples
and the samples treated at physiological maturity. Conversely, application of glyphosate at the
soft dough stage showed significant differences in groat percentage and plump groats, when
compared to the untreated samples. Thus, the timing of glyphosate has an impact on groat quality
parameters.
Results by Location and Cultivar
When broken down by location and cultivar, more trends can be seen in the 2015 groat
quality measurement (Table 7). Plump oat percentage ranged from 96.88%-98.12% for Minot-
grown oats, while Prosper-grown oats ranged from 81.18%-88.44%. With regard to plump oats,
Rockford cultivar oats grown in Prosper showed the largest effect from glyphosate treatment at
the soft dough stage: untreated oats had 87.28% plump, while oats treated at the soft dough stage
had only 81.18% plump-a difference that was statistically significant (P<0.05). Groat percentage
of Prosper-grown Rockford oats also seemed to be detrimentally affected by treatment at the soft
dough stage. While groat percentage for untreated oats was 68.38%, groat percentage for soft
dough treated samples was significantly (P<0.05) less, at 64.72%. Protein content appeared to
vary greatly by location-protein content for Minot-grown samples ranged from 13.36%-14.69%,

32
while Prosper-grown samples ranged from 14.39%-16.12%. However, within each location x
variety interaction, there were no significant (P>0.05) differences between glyphosate
treatments. For three of the four location x cultivar interactions, the untreated oats had the lowest
percentage of total starch of the three treatments. However, none were significantly (P>0.05)
different from the other two treatments. Likewise, the damaged starch content for all four
location x cultivar interactions was lower in the untreated samples versus the soft dough and
physiological maturity treatments. Again, however, these results were not significantly (P>0.05)
lower.

33
Table 7: 2015 Groat Quality Parameters by Location and Cultivar
Location Cultivar
Glyphosate
Treatment
Plump
(%)
Groat
percentage
(%)
Test
Weight
(lb/bu)
Protein*
(%)
Total
Starch*
(%)
Starch
Damage*
(%)
Minot Rockford Untreated 97.26 72.54 41.10 14.30 62.49 0.39
Soft Dough 96.88 71.78 41.70 14.69 59.92 0.43
Physiological
Maturity 97.29 71.54 41.30 13.36 63.01 0.44
Souris Untreated 97.85 71.27 40.90 14.31 58.94 0.45
Soft Dough 97.58 70.27 40.77 13.88 60.11 0.52
Physiological
Maturity 98.12 70.80 41.50 14.26 60.50 0.49
Prosper Rockford Untreated 87.27 68.38 31.67 16.12 55.79 0.39
Soft Dough 81.18 64.72 32.63 15.76 56.57 0.54
Physiological
Maturity 86.85 68.28 32.13 15.82 56.52 0.50
Souris Untreated 86.92 68.93 31.30 14.48 57.79 0.48
Soft Dough 86.62 68.84 32.50 14.75 62.12 0.58
Physiological
Maturity 88.44 69.36 31.50 14.39 61.20 0.54
LSD
within
location
1.09 1.64 1.40 2.17 5.59 0.12
LSD
between
locations
1.24 1.54 1.51 1.99 5.74 0.12
lb/bu: pounds/bushel. *dry weight basis.

34
As Table 7 shows, the difference in percentages of plump oats is greatest in for the
Rockford-cultivar oats grown in Prosper. Since this trend wasn’t seen for the Rockford cultivar
in Minot, it is possible that a combination of the glyphosate application, weather, variety, or
other location factors all contributed to this observation. For instance, Prosper received below
average rainfall in August, which may have compounded with the glyphosate application and
other factors unique to the Rockford cultivar to result in a reduced percentage of plump groats.
Likewise, these factors may have also contributed to the reduced test weight in those samples.
When broken down by location and cultivar, the 2016 sample set showed very consistent
results for plump oats between treatments (Table 8). For every location x cultivar interaction,
untreated and glyphosate treated oats showed no significant (P>0.05) differences. Groat
percentage appeared to be impacted by location, as groat percentage for Crookston-grown
samples ranged from 72.13%-74.64% while Prosper-grown samples ranged from 69.32%-
71.52%. However, within each location x cultivar interaction, no significant (P>0.05) differences
were observed. Test weight was similarly impacted by location: Crookston-grown samples
ranged from 38.43-41.50 lb/bu, while Prosper samples ranged from 36.05-38.30 lb/bu. Of the
location x cultivar interactions, only Crookston x Deon showed a significant (P<0.05) difference
between treatments-untreated samples averaged 39.45 lb/bu, while glyphosate treated samples
averaged 38.43 lb/bu.

35
Table 8: 2016 Groat Quality Parameters by Location and Cultivar
Location Cultivar
Glyphosate
Treatment
Plump
(%)
Groat
percentage
(%)
Test
Weight
(lb/bu)
Protein*
(%)
Total
Starch*
(%)
Starch
Damage*
(%)
Crookston Deon Untreated 99.41 72.49 39.45 15.54 58.30 0.76
Physiological
Maturity 99.25 72.13 38.43 15.73 58.43 0.77
Shelby Untreated 99.39 74.26 41.50 16.49 57.50 0.52
Physiological
Maturity 99.26 74.64 41.10 17.76 56.75 0.58
Prosper Deon Untreated 99.51 70.89 36.05 16.32 57.48 0.72
Physiological
Maturity 99.47 69.32 36.23 15.65 59.73 0.73
Shelby Untreated 99.48 71.52 38.30 16.66 57.36 0.73
Physiological
Maturity 99.54 71.44 38.18 17.38 55.20 0.53
LSD
within
location
0.27 1.17 0.83 0.98 3.85 0.17
LSD
between
locations
0.26 1.58 0.90 0.89 3.62 0.19
lb/bu: pounds/bushel. *dry weight basis

36
Again, application of glyphosate at physiological maturity of oat plants appears to have
no effect on groat quality parameters. As shown in, Table 8, oat cultivar and growing location
have a much larger impact. This is likely due to the fact that application at physiological maturity
is too late in groat development to have any measurable effects.
Overall, glyphosate application at the soft dough stage may have a detrimental effect on
oat plumpness. This could possibly due be to the glyphosate application causing an inability to
down regulate the shikimate acid pathway, leading to an increased carbon flow to that pathway
and leaving less available for grain filling. This effect seems to disappear when glyphosate is
applied later, at physiological maturity. Groat percentage was similarly impacted by glyphosate
application at the soft dough stage. This is especially evident in the Prosper x Rockford samples
(Table 7). However, test weight did not appear to be affected by glyphosate application,
regardless of timing. Likewise, groat protein seemed to be more dependent on growing location
than glyphosate application. Total starch did not seem to be affected by glyphosate application
regardless of timing. However, application of glyphosate at the soft dough stage did result in a
greater percentage of damaged starch (Table 5,Table 7)
Single Kernel Characterization System
Single kernel characterization system (SKCS) testing can be used to measure
characteristics that are related to final oat quality. For instance, groat hardness may be related to
groat breakage (Doehlert and McMullen, 2000). In this study, groat hardness, weight, and
diameter were analyzed via SKCS.
Overall Results
The 2015 sample set showed some differences in SKCS results due to glyphosate
treatment (Table 9). Hardness index for the three treatments ranged from -45.34- -42.32. These

37
values are consistent with reported values of groat hardness, though this characteristic is
influenced by cultivar and growing location (Doehlert and McMullen, 2000). Oat treated at the
soft dough stage had a significantly (P<0.05) lower hardness index than either untreated oat or
oat treated at physiological maturity, indicating that soft dough-treated groats were the least hard.
Since ripening of the kernel occurs between the soft dough stage and physiological maturity, it is
possible that the glyphosate application interfered with this process, resulting in softer kernels.
Or, it is possible that the glyphosate application killed the plant before the ripening process could
finish.
Table 9: 2015 SKCS Results
Glyphosate
Treatment Hardness Index Weight (mg) Diameter (mm)
Untreated -43.11a 26.09a 2.12a
Soft Dough -45.34b 25.57a 2.08b
Physiological
Maturity -42.32a 25.66a 2.10ab
Values are averages of all locations/cultivars. Values in same column with the same superscript
letter are not significantly different (P>0.05). Least significant difference was used for mean
separation.
Groat weight for the three treatments ranged from 25.66-26.09 mg/groat (Table 9). This
measurement is higher than reported by other studies, which report groat weights of around 15-
20 mg/groat (Doehlert and McMullen, 2000). No significant (P>0.05) differences were observed
between the average weights of the three treatments. Since the maximum kernel weight is
reached between the soft dough stage and physiological maturity, this suggests that the groats
were able to continue maturing for some time after glyphosate application (Bowden, Edwards, et
al., 2007). Groat diameter ranged from 2.08-2.12 mm. Groats treated at the soft dough stage had
a significantly (P<0.05) smaller diameter compared to untreated groats. However, the difference
between these diameters was only 0.04mm, so while statistically significant, the difference may

38
not be practically significant. Groats treated at physiological maturity did not exhibit significant
(P>0.05) differences in diameter compared to untreated or soft dough treated groats.
In the 2016 sample set, average groat hardness index was -44.51 for untreated groats and
-45.04 for glyphosate treated groats (Table 10). This indicates that untreated groats were
somewhat harder than glyphosate treated groats. However, this result was not statistically
significant (P>0.05). Untreated groats also were slightly heavier than glyphosate treated groats,
at 27.26 mg versus 26.97 mg. However, again, this result was not statistically significant. The
average diameter for untreated groats and glyphosate treated groats was nearly identical, at 2.13
mm and 2.12 mm, respectively. These results follow the trend observed in the 2015 sample set,
in that application at physiological maturity does not affect hardness, weight, or diameter. This
was unsurprising, as the groat is fully developed at physiological maturity, so glyphosate
application will not affect development.
Table 10: 2016 SKCS Results
Glyphosate
Treatment Hardness Index Weight (mg) Diameter (mm)
Untreated -44.51a 27.26a 2.13a
Physiological
Maturity -45.04a 26.97a 2.12a
Values are averages of all locations/cultivars. Values in same column with the same superscript
letter are not significantly different (P>0.05). Least significant difference was used for mean
separation.
Results by Location and Cultivar
When broken down by location and cultivar, it appears that glyphosate treatment has a
greater effect in some conditions (Table 11). For Minot-grown samples, glyphosate application at
either soft dough stage or physiological maturity does not appear to have significant (P>0.05)
effects on groat hardness for either Rockford or Souris cultivars. However, Prosper-grown groats
appear to have been more strongly influenced by glyphosate application. For both Rockford and

39
Souris cultivars, groats treated at the soft dough stage had a significantly (P<0.05) lower
hardness index compared to untreated groats, indicating that untreated groats were harder.
Within each location x cultivar interaction, no significant (P>0.05) differences were observed in
groat weight between the three treatments. However, untreated groats did have the heaviest groat
weight for three of the four location x cultivar interactions. For groat diameter, the only location
x cultivar interaction that showed a significant difference was Prosper x Rockford. For this
grouping, untreated groats had a significantly (P<0.05) greater diameter than groats treated at the
soft dough stage.
Table 11: 2015 SKCS Results by Location and Cultivar
Location Cultivar
Glyphosate
Treatment
Hardness
Index
Weight
(mg)
Diameter
(mm)
Minot Rockford Untreated -50.67 28.47 2.19
Soft Dough -48.31 27.25 2.17
Physiological
Maturity -47.87 27.20 2.15
Souris Untreated -46.08 25.39 2.11
Soft Dough -44.78 24.54 2.08
Physiological
Maturity -43.22 25.07 2.12
Prosper Rockford Untreated -40.44 25.65 2.09
Soft Dough -45.73 24.98 2.02
Physiological
Maturity -39.47 24.66 2.06
Souris Untreated -35.26 24.86 2.06
Soft Dough -42.53 25.52 2.06
Physiological
Maturity -38.72 25.72 2.08
LSD
within
location
4.06 1.28 0.04
LSD
between
locations
3.79 1.23 0.04
In Table 11, we continue to see the trend that glyphosate application does not affect groat
hardness, weight, or diameter. However, treatment with glyphosate at the soft dough stage only
40
significantly affected oats grown in Prosper. Prosper received below average rainfall in August,
while Minot received average rainfall, so perhaps the differences in weather caused this
pronounced effect. In fact, glyphosate activity is diminished when rainfall occurs soon after
application (Molin and Hirase, 2005). Likewise, other differences in growing conditions between
the two locations, such as soil quality, could have contributed to this difference.
In the 2016 sample set, no significant (P>0.05) differences between treatments. were
observed even after breaking down the SKCS data by location and cultivar (Table 12). However,
the location x cultivar interaction had a significant (P<0.05) effect on groat hardness for Prosper
x Shelby compared to the other 3 pairs. Prosper x Shelby had a hardness index of -37.84 for
untreated oats and -38.95 for glyphosate treated oats, while the next hardest pair, Prosper x
Deon, measured at -45.05 and -47.17 for untreated and glyphosate treated oat, respectively.
Although no significant differences between treatments for each location x variety interaction for
observed for groat weight, it is worth noting that for each interaction, untreated samples had a
greater average weight than glyphosate treated samples. Average groat diameters were nearly
identical for all locations, cultivars, and treatments, with only 0.05 mm between the largest and
smallest averages.

41
Table 12: 2016 SKCS Results by Location and Cultivar
Location Cultivar
Glyphosate
Treatment
Hardness
Index
Weight
(mg)
Diameter
(mm)
Crookston Deon Untreated -46.02 28.14 2.12
Physiological
Maturity -46.44 27.98 2.11
Shelby Untreated -49.12 26.55 2.15
Physiological
Maturity -47.60 26.24 2.15
Prosper Deon Untreated -45.05 28.56 2.12
Physiological
Maturity -47.17 28.32 2.10
Shelby Untreated -37.84 25.81 2.12
Physiological
Maturity -38.95 25.33 2.11
LSD
within
location
6.22 1.34 0.03
LSD
between
locations
6.39 1.33 0.04
Overall, glyphosate application at the soft dough stage appears to result in softer oat
groats, though this impact varied by location. This was likely due to the fact that the groat is not
fully hardened during the soft dough stage, so the glyphosate killed the plant before the groats
were fully hardened. Since this was not consistent between locations, other factors such as
rainfall may contribute to this effect. Glyphosate application at physiological maturity did not
have an effect on oat hardness, as the groat was likely fully hardened before the glyphosate
affected the plant. Neither application timing showed a significant (P>0.05) effect on groat
weight. Groat diameter was not affected by glyphosate application, regardless of timing.
Analysis of Oat Samples with Rapid Visco Analyzer
The rapid visco analyzer (RVA) is a test that measures the pasting properties of a slurry.
Figure 12 shows an example RVA profile indicating the parameters that are measured over the
course of a test. Peak viscosity is the greatest viscosity reached during heating and is achieved

42
when an equilibrium is reached between starch granule swelling and polymer leaching and is an
indicator of water binding capacity. Peak time is the time at which peak viscosity is reached.
Holding strength is the minimum viscosity measured after peak viscosity is reached and is an
indicator of amylose leaching. Breakdown is the difference between the peak viscosity and the
holding strength. Final viscosity is the viscosity of the slurry at the end of the cooling cycle of
the test, and indicates the degree of reassociation of starch molecules, which is associated with
gel formation. Setback is the difference between the final viscosity and the holding strength and
is associated with end product starch texture.
Figure 12: An Rapid visco analyzer (RVA) Profile Showing Recorded Parameters
(Saunders, Izydorczyk, et al., 2011)
Overall Results
Slurries of oat flour from each sample were analyzed for pasting properties via RVA. In
the 2015 sample set, no significant (P>0.05) differences were observed in the RVA parameters
of the untreated controls in comparison to the samples treated with glyphosate at physiological
maturity (Table 13). However, significant (P<0.05) differences were observed in the pasting
properties of the untreated oats and the oats treated with glyphosate at the soft dough stage. Peak

43
viscosity was significantly (P<0.05) higher in the untreated sample, at 4939 cP versus 4745 cP
for the soft dough sample. This implies that the untreated samples would have a thicker texture
than the soft dough treated samples when cooked. However, no significant (P>0.05) differences
were observed between the untreated control and the soft dough treated samples in the holding
strength or breakdown measurements. The final viscosity of the untreated control was
significantly (P<0.05) greater than that of the soft dough treated samples, at 7186 cP versus 6847
cP, respectively. This indicates that if the samples were cooked and cooled, the untreated
samples would have a thicker consistency than the samples treated with glyphosate at the soft
dough stage. The untreated samples also showed a significantly (P<0.05) greater setback than the
samples treated with glyphosate at soft dough stage. No significant (P>0.05) differences were
observed in the peak times of the three treatments.
Table 13: 2015 Rapid Visco Analyzer (RVA) Results
Glyphosate
Treatment
Peak
Viscosity
(cP)
Holding
Strength
(cP)
Breakdown
(cP)
Final
Viscosity
(cP)
Setback
(cP)
Peak Time
(min)
Untreated 4939a 3027a 1911a 7186a 4159a 7.8a
Soft Dough 4745b 2902a 1843a 6847b 3945b 7.9a
Physiological
Maturity 4992a 3019a 1972a 7095a 4076ab 7.7a
Values are averages of all locations/cultivars. Values in same column with the same superscript
letter are not significantly different (P>0.05). Least significant difference was used for mean
separation. cP: centipoise
Since the amount of starch present was not significantly (P>0.05) different between the
untreated and soft dough treatment samples (Table 5) the differences in RVA parameters must be
caused by differences in starch quality or other parameters. For instance, application of
glyphosate may interfere with grain filling that occurs in the soft dough stage, resulting in a
lower viscosity starch. Additionally, non-starch components such as β-glucan have an effect on

44
oat viscosity (Anttila, Sontag-Strohm, et al., 2004). It is possible that glyphosate application had
an effect on β-glucan concentration, which was not measured in this study.
The pasting properties for the two treatments in the 2016 sample set were very similar.
No significant (P>0.05) differences were observed in parameters, with the exception of peak
time. The untreated samples showed a significantly (P<0.05) later peak time of 8.9 minutes,
versus 8.7 minutes for the glyphosate treated samples. This indicates that the untreated samples
would have to be cooked longer than the glyphosate treated samples to achieve the desired
texture. However, such a small difference (12 seconds), while statistically significant, may not be
practically significant.
Table 14: 2016 Rapid Visco Analyzer (RVA) Results
Glyphosate
Treatment
Peak
Viscosity
(cP)
Holding
Strength
(cP)
Breakdown
(cP)
Final
Viscosity
(cP)
Setback
(cP)
Peak Time
(min)
Untreated 4327a 2113a 2214a 6427a 4314a 8.9a
Physiological
Maturity 4288a 2136a 2152a 6413a 4277a 8.7b
Values are averages of all locations/cultivars. Values in same column with the same superscript
letter are not significantly different (P>0.05). Least significant difference was used for mean
separation. cP: centipoise
The 2016 results summarized in Table 14 show a similar trend as the 2015 results
summarized in Table 13-application of glyphosate at physiological maturity does not have a
significant (P>0.05) effect on oat flour viscosity. Presumably, application at this stage is late
enough in the kernel development that the glyphosate will not interfere with grain filling or other
development that may affect viscosity.
Results by Location and Cultivar
Glyphosate application at the soft dough stage had significant (P<0.05) effects on the
Prosper-grown Rockford cultivar oats, in comparison to the untreated sample (Table 15). For this
interaction, peak viscosity for the untreated oat was significantly (P<0.05) greater than that of the

45
oats treated with glyphosate at the soft dough stage. Holding strength was also significantly
(P<0.05) greater for the untreated oats, while the peak time was significantly (P<0.05) earlier.
The largest difference was observed in final viscosity, which was significantly (P<0.05) greater
in the untreated sample at 8298 cP, while the oats treated with glyphosate at the soft dough stage
measured 7258 cP. However, for this interaction no significant (P<0.05) differences were
observed between the untreated oats and the oats treated with glyphosate at physiological
maturity.
For the Prosper-grown Souris samples, no significant (P<0.05) differences were observed
between the untreated oats and the oats treated with glyphosate at the soft dough stage (Table
15). However, some effects were observed when comparing the untreated oats to the oats treated
at physiological maturity. Both peak viscosity and breakdown were significantly (P<0.05)
greater for the oat treated at physiological maturity than the untreated oat. No significant
(P<0.05) differences between the untreated oats and the glyphosate treated oats were observed
for either cultivar when grown in Minot.

46
Table 15: 2015 Rapid Visco Analyzer (RVA) Parameters by Location and Cultivar
Location Cultivar
Glyphosate
Treatment
Peak
Viscosity
(cP)
Holding
Strength
(cP)
Breakdown
(cP)
Final
Viscosity
(cP)
Setback
(cP)
Peak
Time
(min)
Minot Rockford Untreated 5057 3254 1803 6854 3601 7.8
Soft Dough 5161 3447 1714 6892 3445 7.7
Physiological
Maturity 5066 3362 1704 6599 3237 7.6
Souris Untreated 4465 2444 2021 6213 3769 8.4
Soft Dough 4487 2671 1816 6181 3510 8.1
Physiological
Maturity 4598 2744 1855 6388 3644 8.1
Prosper Rockford Untreated 5276 3028 2249 8298 5270 7.8
Soft Dough 4519 2206 2313 7258 5052 8.4
Physiological
Maturity 5067 2718 2349 7973 5255 8.1
Souris Untreated 4956 3384 1573 7378 3994 7.4
Soft Dough 4813 3284 1529 7058 3774 7.4
Physiological
Maturity 5235 3254 1981 7420 4166 7.0
LSD
within
location
266.90 443.00 379.54 357.93 380.08 0.53
LSD
between
locations
435.47 434.78 374.76 431.68 361.39 0.54
cP: centipoise
47
The results summarized in Table 15 do not show any clear trends, unfortunately. Prosper
x Rockford samples show significantly (P<0.05) lower peak and final viscosities in soft dough
treated versus untreated samples, while the other three location/cultivar combinations do not
show significant differences between these two treatments. Clearly, the results shown cannot be
explained by glyphosate alone, and are likely due to a combination of factors, such as cultivar,
growing location, and weather.
The 2016 sample set showed very similar pasting profiles between glyphosate treated and
untreated oats (Table 16). The only significant (P<0.05) difference observed between treatments
was that the peak time was significantly later for untreated oats versus glyphosate treated oat for
the Deon cultivar grown in Prosper. However, some variance was observed between locations
and cultivars. These results reaffirm that application of glyphosate at physiological maturity is
too late to have an effect on groat development, and thus produce flours with similar properties.

48
Table 16: 2016 Rapid Visco Analyzer (RVA) Parameters by Location and Cultivar
Location Cultivar
Glyphosate
Treatment
Peak
Viscosity
(cP)
Holding
Strength
(cP)
Breakdown
(cP)
Final
Viscosity
(cP)
Setback
(cP)
Peak
Time
(min)
Crookston Deon Untreated 3894 2367 1527 5789 3423 8.3
Physiological
Maturity 3778 2450 1328 5751 3301 8.1
Shelby Untreated 4437 2165 2272 6054 3889 8.5
Physiological
Maturity 4433 2155 2278 6049 3894 8.5
Prosper Deon Untreated 4363 2149 2214 6757 4608 9.4
Physiological
Maturity 4174 2125 2049 6593 4468 9.1
Shelby Untreated 4614 1773 2842 7109 5337 9.4
Physiological
Maturity 4769 1815 2954 7260 5445 9.2
LSD
within
location
311 233 258 403 324 0.3
LSD
between
locations
280 221 248 369 286 0.3
cP: centipoise
49
Overall, oats treated with glyphosate at the soft dough stage had lower peak and final
viscosities compared to untreated oat, or oat treated at physiological maturity. However, this
effect seemed to also be dependent on other factors, such as cultivar and growing location.
Because there are no clear trends, it is unclear whether this effect was caused by glyphosate or by
chance. Potentially, glyphosate has an effect which can only be seen under certain conditions-for
example, the Rockford cultivar may be more susceptible to glyphosate in dry conditions than the
Souris cultivar, which would explain the results seen in the 2015 crop year. The 2016 sample set
results also show that there are no significant (P>0.05) differences in peak or final viscosity
between untreated oat samples and oat samples treated with glyphosate at physiological maturity.
Low peak viscosity of oat slurries is correlated with unacceptability to consumers (Liu, Bailey, et
al., 2010). It is inconclusive whether glyphosate application at the soft dough stage causes lower
peak viscosities in oat samples, but producers should ensure to apply only at physiological
maturity to minimize the chance of producing a lower quality crop.
Rolled Quality Parameters
Overall Results
The rolled oat thicknesses for the 2015 sample set were nearly identical for all three
treatments and ranged from 0.85-0.86 mm (Table 17). This falls within the wide range of
industry standard of 0.4-1.2 mm, which varies based on the end product application (Decker,
Rose, et al., 2014). Likewise, the standard deviation of the rolled oat thicknesses was nearly
identical across all three treatments, indicating that a similar range of thicknesses was achieved
for each treatment. Consistent thickness is important in rolled oats to ensure even cooking when
prepared. No significant (P>0.05) differences were observed in rolled oat water absorption.
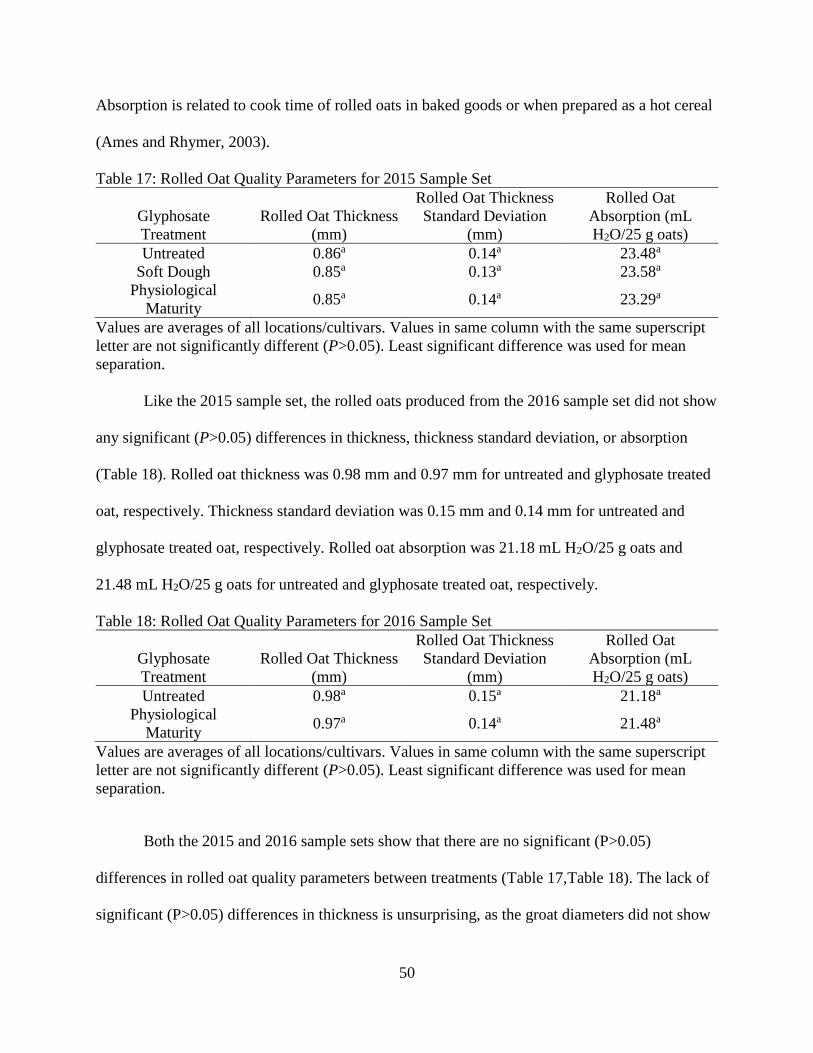
50
Absorption is related to cook time of rolled oats in baked goods or when prepared as a hot cereal
(Ames and Rhymer, 2003).
Table 17: Rolled Oat Quality Parameters for 2015 Sample Set
Glyphosate
Treatment
Rolled Oat Thickness
(mm)
Rolled Oat Thickness
Standard Deviation
(mm)
Rolled Oat
Absorption (mL
H2O/25 g oats)
Untreated 0.86a 0.14a 23.48a
Soft Dough 0.85a 0.13a 23.58a
Physiological
Maturity 0.85a 0.14a 23.29a
Values are averages of all locations/cultivars. Values in same column with the same superscript
letter are not significantly different (P>0.05). Least significant difference was used for mean
separation.
Like the 2015 sample set, the rolled oats produced from the 2016 sample set did not show
any significant (P>0.05) differences in thickness, thickness standard deviation, or absorption
(Table 18). Rolled oat thickness was 0.98 mm and 0.97 mm for untreated and glyphosate treated
oat, respectively. Thickness standard deviation was 0.15 mm and 0.14 mm for untreated and
glyphosate treated oat, respectively. Rolled oat absorption was 21.18 mL H2O/25 g oats and
21.48 mL H2O/25 g oats for untreated and glyphosate treated oat, respectively.
Table 18: Rolled Oat Quality Parameters for 2016 Sample Set
Glyphosate
Treatment
Rolled Oat Thickness
(mm)
Rolled Oat Thickness
Standard Deviation
(mm)
Rolled Oat
Absorption (mL
H2O/25 g oats)
Untreated 0.98a 0.15a 21.18a
Physiological
Maturity 0.97a 0.14a 21.48a
Values are averages of all locations/cultivars. Values in same column with the same superscript
letter are not significantly different (P>0.05). Least significant difference was used for mean
separation.
Both the 2015 and 2016 sample sets show that there are no significant (P>0.05)
differences in rolled oat quality parameters between treatments (Table 17,Table 18). The lack of
significant (P>0.05) differences in thickness is unsurprising, as the groat diameters did not show

51
large variations between treatments (Table 9,Table 10). The lack of significant (P>0.05)
differences in water absorption suggests that there were no major changes to the hydration of
macromolecular components of the oat flakes caused by the glyphosate, which contributes (along
with thickness) to absorption.
Results by Location and Cultivar
When examined by location and cultivar, no significant (P>0.05) differences were
observed between treatments for the rolled oat parameters in the 2015 sampled set (Table 19).
However, significant (P<0.05) differences were observed between locations. For instance,
Prosper-grown rolled oats, which ranged from 0.94 mm-0.98 mm were significantly (P<0.05)
thicker than Minot-grown rolled oats, which ranged from 0.72 mm-0.79 mm, for all glyphosate
treatments. Conversely, Minot-grown rolled oats had significantly (P<0.05) higher water
absorption than Prosper-grown rolled oats.

52
Table 19: Rolled Oat Quality Parameters for 2015 Sample Set by Location and Cultivar
Location Cultivar
Glyphosate
Treatment
Rolled
Oat
Thickness
(mm)
Rolled
Oat
Thickness
Standard
Deviation
(mm)
Rolled Oat
Absorption
(mL
H2O/25 g
oats)
Minot Rockford Untreated 0.76 0.16 26.67
Soft Dough 0.73 0.14 27.97
Physiological
Maturity 0.73 0.14 27.07
Souris Untreated 0.78 0.14 29.43
Soft Dough 0.72 0.12 27.17
Physiological
Maturity 0.79 0.14 27.39
Prosper Rockford Untreated 0.94 0.13 17.83
Soft Dough 0.98 0.13 20.10
Physiological
Maturity 0.95 0.14 18.77
Souris Untreated 0.94 0.12 19.97
Soft Dough 0.97 0.12 19.07
Physiological
Maturity 0.96 0.13 19.93
LSD
within
location
0.08 N/A 2.88
LSD
between
locations
0.08 N/A 2.78
When the 2016 examined by location and cultivar, no significant (P>0.05) differences
between treatments were observed in rolled oat thickness standard deviation or rolled oat
absorption (Table 20). However, for Deon cultivar oat grown in Prosper, untreated rolled oats
were significantly (P<0.05) thicker than glyphosate treated rolled oats. For the Shelby cultivar,
samples grown in Crookston were significantly (P<0.05) thicker than samples grown in Prosper

53
for both treatments. No significant (P>0.05) differences were observed between cultivars and
growing locations for rolled oat absorption.
Table 20: Rolled Oat Quality Parameters for 2016 Sample Set by Location and Cultivar
Location Cultivar
Glyphosate
Treatment
Rolled
Oat
Thickness
(mm)
Rolled
Oat
Thickness
Standard
Deviation
(mm)
Rolled Oat
Absorption
(mL
H2O/25 g
oats)
Crookston Deon Untreated 1.01 0.16 21.58
Physiological
Maturity 1.03 0.13 21.50
Shelby Untreated 0.99 0.15 22.05
Physiological
Maturity 1.00 0.18 21.75
Prosper Deon Untreated 0.99 0.14 20.18
Physiological
Maturity 0.95 0.14 20.90
Shelby Untreated 0.94 0.15 20.90
Physiological
Maturity 0.92 0.12 21.78
LSD
within
location
0.04 N/A 1.89
LSD
between
locations
0.04 N/A 1.86
The data summarized in Table 19 and Table 20 indicate that treatment with glyphosate at
either soft dough stage or physiological maturity does not have a significant (P>0.05) effect on
rolled oat quality parameters. On the other hand, quality parameters show significant (P>0.05)
differences due to factors such as growing location and cultivar. These data indicate that
glyphosate application will not influence oat flake thickness or water absorption.
54
Rolled Oat Granulation
Overall Results
Oat flake granulation is an important parameter to measure product consistency.
Additionally, different granulation targets may be necessary depending on the product being
produced (e.g. quick cooking versus rolled oats). Significant (P<0.05) differences were observed
in the rolled oat granulation for the 2015 sample set (Table 21). The untreated rolled oats had the
largest percentage of rolled oats remaining in the largest (4750 µm) sieve, at 27.20%. This was
significantly (P<0.05) greater than the amount remaining for the oat treated at physiological
maturity, which had 23.46% remaining. The sample treated at soft dough stage had 24.70%
remaining, which was not significantly (P>0.05) different from the other two treatments. For the
2800 µm sieve, the oat treated at soft dough stage had the largest amount retained, at 63.18%.
This was significantly (P<0.05) greater than the untreated oat, which had 61.37% retained. The
untreated oat had the least amount of sample retained in the 2000 µm sieve, at 4.03%. This was
significantly (P<0.05) less than both the oat treated with glyphosate and soft dough stage and
physiological maturity, which had 4.68% and 4.86% retained, respectively. The oats treated at
physiological maturity had the greatest percentage of breakage, or material that passed through
all the sieves, and 9.35%. This was significantly (P<0.05) greater than the untreated oat or the
oat treated with glyphosate at the soft dough stage, which had breakages of 7.39% and 7.44%,
respectively.

55
Table 21: Granulation of 2015 Sample Set Rolled Oats
Glyphosate
Treatment
4750*
(%)
2800*
(%)
2000*
(%)
Breakage†
(%)
Untreated 27.20a 61.37a 4.03a 7.39a
Soft Dough 24.70ab 63.18b 4.68b 7.44a
Physiological
Maturity 23.46b 62.33ab 4.86b 9.35b
Values are averages of all locations/cultivars. Values in same column with the same superscript
letter are not significantly different (P>0.05). Least significant difference was used for mean
separation. *sieve opening size (µm), † material that passed through 2000 µm sieve
No significant (P>0.05) differences in granulation were observed between treatments for
the 2016 sampled set rolled oats (Table 22). However, like the 2015 sample set rolled oats,
untreated rolled oats did have a larger proportion of the largest size of rolled oats.
Table 22: Granulation of 2016 Sample Set Rolled Oats
Glyphosate
Treatment
4750*
(%)
2800*
(%)
2000*
(%)
Breakage†
(%)
Untreated 23.86a 72.98a 1.75a 1.46a
Physiological
Maturity 21.87a 75.17a 1.69a 1.34a
Values are averages of all locations/cultivars. Values in same column with the same superscript
letter are not significantly different (P>0.05). Least significant difference was used for mean
separation. *sieve opening size (µm), † material that passed through 2000 µm sieve
Results by Location and Cultivar
When divided by growing location and cultivar, similar trends were seen for both
cultivars of oats grown in Prosper (Table 23). There were no significant (P>0.05) differences in
the proportions of flakes remaining in the two largest sieves, or the breakage. However, for both
the Rockford and Souris cultivars, the samples treated at the soft dough stage had a significantly
(P<0.05) greater proportion of the smallest size oat flakes (2000 µm).
For the oats grown in Minot, no significant (P>0.05) differences were observed between
the untreated control and either glyphosate treatment (Table 23). For the Rockford cultivar, no
significant (P>0.05) differences were observed between the untreated control and the samples
treated with glyphosate at the soft dough stage. However, significant (P<0.05) differences were

56
observed between the control and the samples treated at physiological maturity for every
granulation size. The untreated sample had a significantly (P<0.05) larger proportion of the
largest size of rolled oats, which were retained in the 4750 µm sieve. However, the samples
treated with glyphosate at physiological maturity had significantly (P<0.05) larger proportions of
the other granulation sizes: 2800 µm, 2000 µm, and less than 2000 µm.
Table 23: Granulation of 2015 Sample Set Rolled Oats by Cultivar and Location
Location Cultivar
Glyphosate
Treatment
4750*
(%)
2800*
(%)
2000*
(%)
Breakage†
(%)
Minot Rockford Untreated 59.07 26.96 3.95 10.02
Soft Dough 54.60 30.22 4.27 10.91
Physiological
Maturity 47.64 31.21 5.41 15.74
Souris Untreated 32.37 44.16 6.83 16.63
Soft Dough 30.69 46.46 6.91 15.94
Physiological
Maturity 28.75 44.76 7.62 18.86
Prosper Rockford Untreated 6.35 89.68 2.84 1.13
Soft Dough 4.41 90.03 4.24 1.32
Physiological
Maturity 5.23 89.80 3.85 1.13
Souris Untreated 11.02 84.68 2.50 1.79
Soft Dough 9.09 86.01 3.31 1.59
Physiological
Maturity 12.24 83.53 2.57 1.66
LSD
within
location
5.51 3.45 1.14 2.73
LSD
between
locations
5.39 4.46 1.17 2.69
*sieve opening size (µm), † material that passed through 2000 µm sieve
The 2016 sample set showed a significant (P<0.05) difference in breakage between
treatments for the Shelby cultivar oat grown in Crookston (Table 24). The untreated rolled oats
had a higher percentage of breakage, at 1.96%, versus 1.31% for the glyphosate treated rolled
oats. However, no other significant differences between treatments were observed. However,
significant (P<0.05) differences were observed between interactions, especially in the larger
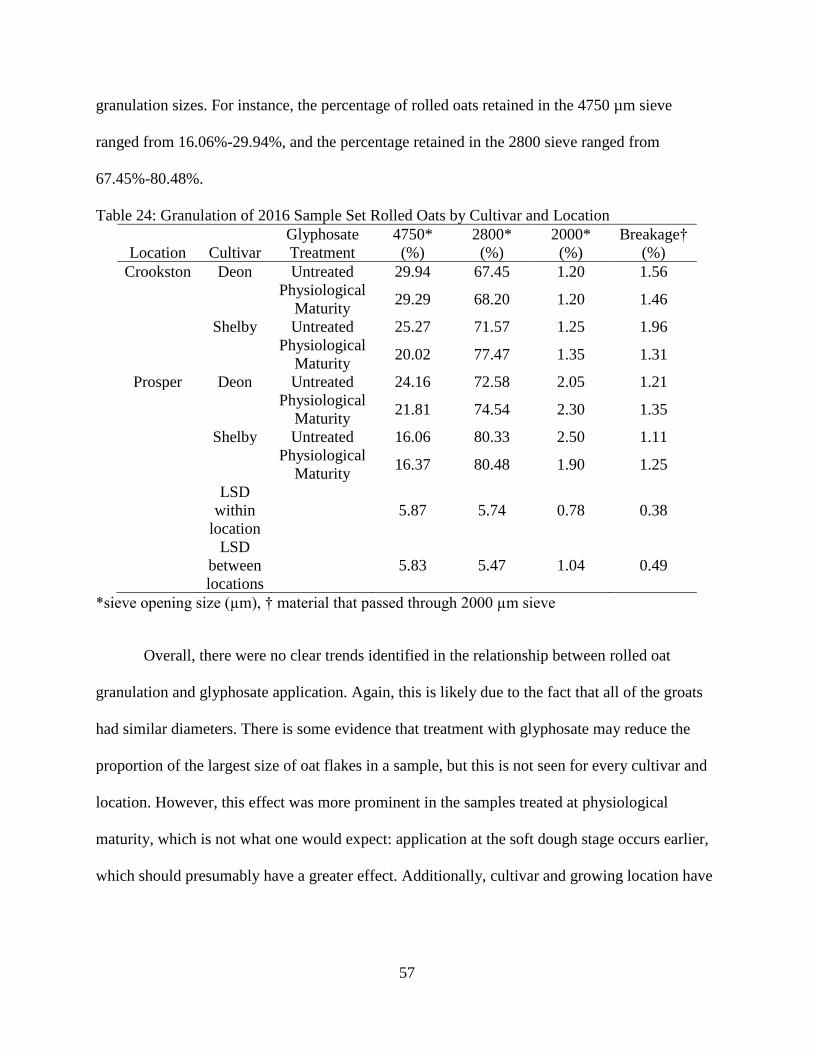
57
granulation sizes. For instance, the percentage of rolled oats retained in the 4750 µm sieve
ranged from 16.06%-29.94%, and the percentage retained in the 2800 sieve ranged from
67.45%-80.48%.
Table 24: Granulation of 2016 Sample Set Rolled Oats by Cultivar and Location
Location Cultivar
Glyphosate
Treatment
4750*
(%)
2800*
(%)
2000*
(%)
Breakage†
(%)
Crookston Deon Untreated 29.94 67.45 1.20 1.56
Physiological
Maturity 29.29 68.20 1.20 1.46
Shelby Untreated 25.27 71.57 1.25 1.96
Physiological
Maturity 20.02 77.47 1.35 1.31
Prosper Deon Untreated 24.16 72.58 2.05 1.21
Physiological
Maturity 21.81 74.54 2.30 1.35
Shelby Untreated 16.06 80.33 2.50 1.11
Physiological
Maturity 16.37 80.48 1.90 1.25
LSD
within
location
5.87 5.74 0.78 0.38
LSD
between
locations
5.83 5.47 1.04 0.49
*sieve opening size (µm), † material that passed through 2000 µm sieve
Overall, there were no clear trends identified in the relationship between rolled oat
granulation and glyphosate application. Again, this is likely due to the fact that all of the groats
had similar diameters. There is some evidence that treatment with glyphosate may reduce the
proportion of the largest size of oat flakes in a sample, but this is not seen for every cultivar and
location. However, this effect was more prominent in the samples treated at physiological
maturity, which is not what one would expect: application at the soft dough stage occurs earlier,
which should presumably have a greater effect. Additionally, cultivar and growing location have

58
much larger effects on oat granulation. Thus, it is inconclusive whether glyphosate application
has an effect on rolled oat granulation.
Scanning Electron Microscopy Studies
Oat starch exists in compound granule clusters that are around 60 µm in diameter (Sayar
and White, 2011). The granules can exist in wide variety of shapes, and can be polyhedral,
ovoid, or hemispherical. Variations in oat starch granule morphology have been observed in oats
that have undergone different heat treatments (Ovando-Martínez, Whitney, et al., 2013). For
instance, oats that were autoclaved showed a greater number of clusters of small starch granules,
compared to untreated controls.
Scanning electron microscopy was performed on cross sections of untreated groats,
groats treated with glyphosate at the soft dough stage, and groats treated with glyphosate at
physiological maturity (Figure 13). Both large and small granule clusters can be seen in all three
treatments. However, no major differences in the structures of the starch granules were observed
in the images. Differences in starch granule morphology could potentially be seen if starch was
extracted in from oat flour and visualized. Or possibly, differences in starch caused by
glyphosate may only be apparent at the molecular level and not the granular level.
Figure 13: Cross Sections of Heat Treated Groats
A: Untreated B: Treated with glyphosate at soft dough stage. C: Treated with glyphosate at
physiological maturity.

59
CONCLUSIONS
Application of glyphosate to oat during the soft dough stage had a detrimental effect on
groat quality. Compared to untreated controls, glyphosate application at the soft dough stage
resulted in a lower percentage of plump groats, a lower groat percentage, and higher percentage
of damaged starch. Additionally, groats treated at this stage were also less hard than untreated
groats, which may not necessarily be detrimental, depending on the final use of the oat.
Treatment at the soft dough stage also resulted in a lower viscosity slurry upon heating, which is
less preferred by consumers. Although application at the soft dough stage did not impact rolled
oat thickness or rolled oat water absorption, glyphosate application had an inconclusive effect on
rolled oat size, which could be detrimental depending on the desired end product.
However, application of glyphosate at physiological maturity did not have the profound
effect that was seen at application at the soft dough stage. This is supported by both the results of
the 2015 and 2016 sample sets. The only noticeable effect produced by treatment at
physiological maturity was a change in the size distribution of rolled oats.
In conclusion, preharvest glyphosate application is not detrimental to final oat quality as
long as care is taken not to apply glyphosate too early. However, it may be worthwhile for
farmers to develop an alternative to preharvest glyphosate, as the practice is falling out of favor
with buyers and consumers. Further research can be performed to determine the cause of the
differences observed in oat treated with glyphosate at the soft dough stage, and to investigate
whether glyphosate application affects other oat macromolecules, such as β-glucan.

60
REFERENCES
AACC International. Approved Methods of Analysis, 11th Ed. Method 44-15.02. Moisture-Air
Oven Methods. Approved November 3, 1999a. AACC International St. Paul, MN.
http://dx.doi.org/10.1094/AACCIntMethod-44-15.02
AACC International. Approved Methods of Analysis, 11th Ed. Method 46-30.01. Crude Protein-
Combustion Method. Approved November 3, 1999b. AACC International: St. Paul, MN.
http://dx.doi.org/10.1094/AACCIntMethod-46-30.01
AACC International. Approved Methods of Analysis, 11th Ed. Method 76-13.01. Total Starch
Assay Procedure (Megazyme Amyloglucosidase/alpha-Amylase Method). Approved
November 3, 1999c. AACC International: St. Paul, MN.
http://dx.doi.org/10.1094/AACCIntMethod-76-13.01
AACC International. Approved Methods of Analysis, 11th Ed. Method 76-31.01. Determination
of Damaged Starch--Spectrophotometric Method. Approved November 3, 1999d. AACC
International: St. Paul, MN. http:///dx.doi.org/10.1094/AACCIntMethod-76-31.01
AACC International. Approved Methods of Analysis, 11th Ed. Method 76-21.01. General
Pasting Method for Wheat or Rye Flour or Starch Using the Rapid Visco Analyser.
Approved November 3, 1999e. AACC International: St. Paul, MN.
http://dx.doi.org/10.1094/AACCIntMethod-76-21.01
AACC International. Approved Methods of Analysis, 11th Ed. Method 56-40.01. Water
Hydration (Absorption) of Rolled Oats. Approved November 3, 1999f. AACC
International: http://dx.doi.org/10.1094/AACCIntMethod-56-40.01
Ames, N.P., Fregeau-Reid, J. and Storsley, J. 2014. Food Oat Quality Throughout the Value
Chain. Pages 33-60 in: Oats: Nutrition and Technology. Y. Chu, ed. Wiley-Blackwell:
Hoboken, NJ.
Ames, N.P. and Rhymer, C.R. 2003. Development of a laboratory-scale flaking machine for oat
end product testing. Cereal Chemistry 80:699-702.
Annett, R., Habibi, H.R. and Hontela, A. 2014. Impact of glyphosate and glyphosate-based
herbicides on the freshwater environment. J Appl Toxicol 34:458-479.
Anttila, H., Sontag-Strohm, T. and Salovaara, H. 2004. Viscosity of beta-glucan in oat products.
Agricultural and Food Science 13:80-87.

61
Bai, S.H. and Ogbourne, S.M. 2016. Glyphosate: environmental contamination, toxicity and
potential risks to human health via food contamination. Environmental Science and
Pollution Research 23:18988-19001.
Benbrook, C.M. 2016. Trends in glyphosate herbicide use in the United States and globally.
Environmental sciences Europe. 28:1.
Boudreaux, J.E. and Griffin, J.L. 2008. Harvest aids in indeterminate and determinate soybeans –
application timing and value. Louisiana Agriculture 51:26-27.
Bowden, P., Edwards, J., Ferguson, N., McNee, T., Mannings, B., Roberts, K., et al. 2007.
Wheat Growth and Development. NSW Department of Primary Industries, Orange,
NSW, Australia.
Bresnahan, G.A., Manthey, F.A., Howatt, K.A. and Chakraborty, M. 2003. Glyphosate aplied
peharvest iduces shikimic aid acumulation in hard red spring wheat (Triticum aestivum).
Journal of Agricultural and Food Chemistry 51:4004-4007.
Butt, M.S., Tahir-Nadeem, M., Khan, M.K.I. and Shabir, R. 2008. Oat: unique among the
cereals. European Journal of Nutrition 47:68-79.
Cross, B. 2016. Grain Millers Inc firm on glyphosate-treated oats ban.
https://www.producer.com/2016/01/grain-millers-inc-firm-on-glyphosate-treated-oats-
ban/ (Accessed 1/12/2018).
Darwent, A.L., Kirkland, K.J., Townley-Smith, L., Harker, K.N., Cessna, A.J., Lukow, O.M., et
al. 1994. Effect of preharvest applications of glyphosate on the drying, yield and quality
of wheat. Canadian Journal of Plant Science 74:221-230.
Decker, E.A., Rose, D.J. and Stewart, D. 2014. Processing of oats and the impact of processing
operations on nutrition and health benefits. British Journal of Nutrition 112:S58-S64.
Dill, G.M., Sammons, R.D., Feng, P.C.C., Kohn, F., Kretzmer, K., Mehrsheikh, A., et al. 2010.
Glyphosate: Discovery, Development, Applications, and Properties. Pages 1-33 in:
Glyphosate Resistance in Crops and Weeds. John Wiley & Sons, Inc.:
Doehlert, D.C. and McMullen, M.S. 2000. Genotypic and environmental effects on oat milling
characteristics and groat hardness. Cereal Chemistry 77:148-154.
Doehlert, D.C. and Wiessenborn, D.P. 2007. Influence of physical grain characteristics on
optimal rotor speed during impact dehulling of oats. Cereal Chemistry 84:294-300.

62
Duke, S.O. 2011. Glyphosate degradation in glyphosate-resistant and -susceptible crops and
weeds. J Agric Food Chem 59:5835-5841.
Duke, S.O. and Powles, S.B. 2008. Glyphosate: a once‐in‐a‐century herbicide. Pest management
science. 64:319-325.
Environmental Protection Agency. 1993. Reregistration Eligibility Decision (RED) Glyphosate.
García-Pérez, J.A., Alarcón-Gutiérrez, E., Perroni, Y. and Barois, I. 2014. Earthworm
communities and soil properties in shaded coffee plantations with and without application
of glyphosate. Applied Soil Ecology 83:230-237.
Gasnier, C., Dumont, C., Benachoura, N., Claira, E., Chagnon, M.-C. and Seralini, G.-E. 2009.
Glyphosate-based herbicides are toxic and endocrine disruptors in human cell lines
Toxicology 262:184-191.
Gates, F.K., Sontag-Strohm, T., Stoddard, F.L., Dobraszczyk, B.J. and Salovaara, H. 2008.
Interaction of heat–moisture conditions and physical properties in oat processing: II.
Flake quality. Journal of Cereal Science 48:288-293.
Griffin, J.L., Boudreaux, J.M. and Miller, D.K. 2010. Herbicides as harvest aids. Weed Science
58:355-358.
Gulvady, A., Brown, R. and Bell, J. 2013. Nutritional Comparison of Oats and Other Commonly
Consumed Whole Grains. Pages 73-93 in: Oats: Nutrition and Technology. Y. Chu, ed.
Wiley-Blackwell: Hoboken, NJ.
Hu, X., Xing, X. and Ren, C. 2010. The effects of steaming and roasting treatments on beta-
glucan, lipid and starch in the kernels of naked oat (Avena nuda). J Sci Food Agric
90:690-695.
Kasturi, P. and Bordenave, N. 2013. Oat Starch. Pages 95-121 in: Oats: Nutrition and
Technology. Y. Chu, ed. Wiley-Blackwell: Hoboken, NJ.
Kwiatkowska, M., Huras, B. and Bukowska, B. 2014. The effect of metabolites and impurities of
glyphosate on human erythrocytes (in vitro). Pestic Biochem Physiol 109:34-43.
Liu, Y., Bailey, T.B. and White, P.J. 2010. Individual and interactional effects of beta-glucan,
starch, and protein on pasting properties of oat flours. J Agric Food Chem 58:9198-9203.
Manthey, F.A., Chakraborty, M., Peel, M.D. and Pederson, J.D. 2004. Effect of preharvest
applied herbicides on breadmaking quality of hard red spring wheat. Journal of the
Science of Food and Agriculture 84:441-446.
63
Marshall, A., Cowan, S., Edwards, S., Griffiths, I., Howarth, C., Langdon, T., et al. 2013. Crops
that feed the world 9. oats- a cereal crop for human and livestock feed with industrial
applications. Food Security 5:13-33.
Molin, W.T. and Hirase, K. 2005. Effects of surfactants and simulated rainfall on the efficacy of
the Engame formulation of glyphosate in johnsongrass, prickly sida and yellow nutsedge.
Weed Biology and Management 5:123-127.
National Weather Service. 2018. NOAA Online Weather Data.
http://w2.weather.gov/climate/xmacis.php?wfo=fgf (Accessed January 24, 2018).
North Dakota Agricultural Weather Network. 2018. Monthly Weather Data.
https://ndawn.ndsu.nodak.edu/ (Accessed January 23, 2018).
Othman, R.A., Moghadasian, M.H. and Jones, P.J. 2011. Cholesterol-lowering effects of oat
beta-glucan. Nutr Rev 69:299-309.
Ovando-Martínez, M., Whitney, K., Reuhs, B.L., Doehlert, D.C. and Simsek, S. 2013. Effect of
hydrothermal treatment on physicochemical and digestibility properties of oat starch.
Food Research International 52:17-25.
Pereira, J.L., Antunes, S.C., Castro, B.B., Marques, C.R., Goncalves, A.M., Goncalves, F., et al.
2009. Toxicity evaluation of three pesticides on non-target aquatic and soil organisms:
commercial formulation versus active ingredient. Ecotoxicology 18:455-463.
Peterson, D.M. and Smith, D. 1976. Changes in nitrogen and carbohydrate fractions in
developing oat groats. Crop Science 16:67-71.
Philbrook, B.D., and E. S. Oplinger. 1989. Soybean field losses as influenced by harvest delays.
Agronomy Journal 81:251-258.
Piotrowicz-Cieslak, A.I., Adomas, B. and Michalczyk, D.J. 2010. Different glyphosate
phytotoxicity of seeds and seedlings of selected plant species. Polish Journal of
Environmental Studies 19:123-129.
Saunders, J., Izydorczyk, M. and Levin, D.B. 2011. Economic Effects of Biofuel Production.
Pages 5.6 in: Effects of Biofuel Production. M. A. D. S. Bernardes, ed. Intech: London,
UK.
Sayar, S. and White, P.J. 2011. Oat Starch: Physiochemical Properties and Function. Pages 109-
122 in: Oats: Chemistry and Technology. F. H. Webster and P. J. Wood, eds. AACC
International: St. Paul, MN.
64
Servaites, J.C., Tucci, M.A. and Geiger, D.R. 1987. Glyphosate effects on carbon assimilation,
ribulose bisphosphate carboxylase activity, and metabolite levels in sugar beet leaves.
Plant Physiology 85:370-374.
Stewart, D. and McDougall, G. 2014. Oat agriculture, cultivation and breeding targets:
implications for human nutrition and health. Br J Nutr 112 Suppl 2:S50-57.
Strychar, R. 2011. World Oat Production, Trade, and Usage. Pages 1-10 in: Oats: Chemistry and
Technology. F. H. Webster and P. J. Wood, eds. AACC International: St. Paul, MN.
Tester, R.F. and Karkalas, J. 1996. Swelling and gelatinization of oat starches. Cereal Chemistry
73:271-277.
Thongprakaisang, S., Thiantanawat, A., Rangkadilok, N., Suriyo, T. and Satayavivad, J. 2013.
Glyphosate induces human breast cancer cells growth via estrogen receptors. Food Chem
Toxicol 59:129-136.
United States Department of Agriculture. 1988. Subpart G-United States Standards for Oats.
United States Department of Agriculture. 2016. Crop Production: 2015 Summary.
United States Department of Agriculture. 2017. Crop Production (September 2017).
Weather Underground. 2018. Weather History for KCKN.
https://www.wunderground.com/history/airport/KCKN/2016/5/24/MonthlyHistory.html?
req_city=&req_state=&req_statename=&reqdb.zip=&reqdb.magic=&reqdb.wmo=
(Accessed January 24, 2018).
Whitehead, A., Beck, E.J., Tosh, S. and Wolever, T.M. 2014. Cholesterol-lowering effects of oat
beta-glucan: a meta-analysis of randomized controlled trials. Am J Clin Nutr 100:1413-
1421.
Williams, G.M., Kroes, R. and Munro, I.C. 2000. Safety evaluation and risk assessment of the
herbicide Roundup and its active ingredient, glyphosate, for humans. Regul Toxicol
Pharmacol 31:117-165.
Zhou, M., Robards, K., Glennie-Holmes, M. and Helliwell, S. 1998. Structure and pasting
properties of oat starch. Cereal Chemistry 75:273-281.

65
APPENDIX
Table A1: Analysis of Variance for 2015 Groat Quality Parameters
Source DF
Mean
Square F Value Pr>F
Plump Location 1 1145.54 1022.41 <.0001
Cultivar 1 19.32 47.34 <.0001
Treatment 2 15.37 37.66 <.0001
Location*Cultivar 1 5.19 12.73 0.0019
Cultivar*Treatment 2 6.66 16.31 <.0001
Location*Treatment 2 9.51 23.31 <.0001
Location*Cultivar*Treatment 2 6.36 15.57 <.0001
Error 20 0.41 - -
Groat Location 1 96.93 276.55 <.0001
Percentage Cultivar 1 1.26 1.36 0.2566
Treatment 2 6.35 6.87 0.0054
Location*Cultivar 1 21.51 23.24 0.0001
Cultivar*Treatment 2 2.16 2.33 0.1230
Location*Treatment 2 2.68 2.89 0.0788
Location*Cultivar*Treatment 2 3.61 3.9 0.0372
Error 20 0.93 - -
Test Location 1 770.99 557.45 <.0001
Weight Cultivar 1 1.07 1.58 0.2226
Treatment 2 1.31 1.94 0.1701
Location*Cultivar 1 0.01 0.01 0.9042
Cultivar*Treatment 2 0.08 0.12 0.884
Location*Treatment 2 0.78 1.16 0.3328
Location*Cultivar*Treatment 2 0.51 0.75 0.4848
Error 20 0.67 - -
Protein Location 1 10.69 89.36 0.0007
Content Cultivar 1 4.00 2.47 0.1315
Treatment 2 0.44 0.27 0.7651
Location*Cultivar 1 4.36 2.69 0.1164
Cultivar*Treatment 2 0.36 0.23 0.8002
Location*Treatment 2 0.10 0.06 0.9404
Location*Cultivar*Treatment 2 0.89 0.55 0.5841
Error 20 1.62 - -

66
Table A2: Analysis of Variance for 2016 Groat Quality Parameters
Source DF
Mean
Square F Value Pr>F
Plump Location 1 0.2321 7.79 0.0315
Cultivar 1 0.0002 0.01 0.9428
Treatment 1 0.0396 1.19 0.2893
Location*Cultivar 1 0.0010 0.03 0.8670
Cultivar*Treatment 1 0.0086 0.26 0.6165
Location*Treatment 1 0.0508 1.53 0.2318
Location*Cultivar*Treatment 1 0.0033 0.10 0.7560
Error 18 0.0332 - -
Groat Location 1 53.43 21.03 0.0037
Percentage Cultivar 1 24.66 39.88 <.0001
Treatment 1 1.33 2.15 0.1594
Location*Cultivar 1 1.15 1.86 0.1892
Cultivar*Treatment 1 2.48 4.01 0.0605
Location*Treatment 1 1.38 2.23 0.1523
Location*Cultivar*Treatment 1 0.27 0.44 0.5156
Error 18 0.62 - -
Test Location 1 68.74 119.22 <.0001
Weight Cultivar 1 39.83 126.59 <.0001
Treatment 1 0.95 3.00 0.1001
Location*Cultivar 1 0.14 0.44 0.5165
Cultivar*Treatment 1 0.05 0.17 0.6869
Location*Treatment 1 1.09 3.46 0.0794
Location*Cultivar*Treatment 1 0.43 1.36 0.2588
Error 18 0.31 - -
Protein Location 1 0.117 0.68 0.4406
Content Cultivar 1 12.752 29.60 <.0001
Treatment 1 1.108 2.57 0.1262
Location*Cultivar 1 0.408 0.95 0.3431
Cultivar*Treatment 1 3.039 7.06 0.0161
Location*Treatment 1 1.003 2.33 0.1444
Location*Cultivar*Treatment 1 0.049 0.11 0.7399
Error 18 0.431 - -

67
Table A3: Analysis of Variance for 2015 Starch Parameters
Source DF
Mean
Square F Value Pr>F
Total Location 1 56.13 3.63 0.13
Starch Cultivar 1 10.15 0.94 0.34
Treatment 2 7.31 0.68 0.52
Location*Cultivar 1 81.95 7.6 0.01
Cultivar*Treatment 2 9.99 0.93 0.41
Location*Treatment 2 8.32 0.77 0.48
Location*Cultivar*Treatment 2 0.76 0.07 0.93
Error 20 10.78 - -
Starch Location 1 0.026 7.73 0.05
Damage Cultivar 1 0.035 6.68 0.02
Treatment 2 0.026 5.04 0.02
Location*Cultivar 1 0.000 0.03 0.87
Cultivar*Treatment 2 0.001 0.17 0.85
Location*Treatment 2 0.003 0.63 0.54
Location*Cultivar*Treatment 2 0.001 0.23 0.80
Error 20 0.005 - -
Table A4: Analysis of Variance for 2016 Starch Parameters
Source DF
Mean
Square F Value Pr>F
Total Location 1 0.71 0.17 0.70
Starch Cultivar 1 25.40 3.78 0.07
Treatment 1 0.14 0.02 0.89
Location*Cultivar 1 2.33 0.35 0.56
Cultivar*Treatment 1 13.95 2.07 0.17
Location*Treatment 1 0.25 0.04 0.85
Location*Cultivar*Treatment 1 6.20 0.92 0.35
Error 18 6.73 - -
Starch Location 1 0.003 0.13 0.726
Damage Cultivar 1 0.201 14.99 0.001
Treatment 1 0.006 0.47 0.502
Location*Cultivar 1 0.029 2.19 0.156
Cultivar*Treatment 1 0.012 0.88 0.362
Location*Treatment 1 0.035 2.60 0.124
Location*Cultivar*Treatment 1 0.030 2.25 0.151
Error 18 .013 - -

68
Table A5: Analysis of 2015 SKCS
Source DF
Mean
Square F Value Pr>F
Hardness Location 1 375.93 266.10 <.0001
Index Cultivar 1 119.81 21.09 0.0002
Treatment 2 29.41 5.18 0.0154
Location*Cultivar 1 3.32 0.58 0.4533
Cultivar*Treatment 2 3.76 0.66 0.5270
Location*Treatment 2 49.31 8.68 0.0019
Location*Cultivar*Treatment 2 4.21 0.74 0.4889
Error 20 5.68 - -
Weight Location 1 10.67 31.310 0.0050
Cultivar 1 12.66 22.310 0.0001
Treatment 2 0.93 1.640 0.2185
Location*Cultivar 1 19.07 33.590 <.0001
Cultivar*Treatment 2 1.48 2.610 0.0985
Location*Treatment 2 0.84 1.480 0.2508
Location*Cultivar*Treatment 2 0.22 0.390 0.6831
Error 20 0.57 - -
Diameter Location 1 0.0500 123.46 0.0004
Cultivar 1 0.0080 12.37 0.0022
Treatment 2 0.0035 5.43 0.0131
Location*Cultivar 1 0.0140 21.76 0.0001
Cultivar*Treatment 2 0.0022 3.40 0.0534
Location*Treatment 2 0.0001 0.22 0.8007
Location*Cultivar*Treatment 2 0.0013 2.04 0.1568
Error 20 0.0006 - -

69
Table A6: Analysis of 2016 SKCS
Source DF
Mean
Square F Value Pr>F
Hardness Location 1 203.48 8.58 0.03
Index Cultivar 1 62.42 3.56 0.08
Treatment 1 2.28 0.13 0.72
Location*Cultivar 1 193.84 11.06 0.00
Cultivar*Treatment 1 4.36 0.25 0.62
Location*Treatment 1 9.37 0.53 0.47
Location*Cultivar*Treatment 1 0.42 0.02 0.88
Error 18 17.53 - -
Weight Location 1 0.389 0.45 0.5265
Cultivar 1 41.080 50.43 <.0001
Treatment 1 0.705 0.87 0.3646
Location*Cultivar 1 2.900 3.56 0.0754
Cultivar*Treatment 1 0.069 0.08 0.7745
Location*Treatment 1 0.032 0.04 0.8447
Location*Cultivar*Treatment 1 0.004 0.01 0.9430
Error 18 0.815 - -
Diameter Location 1 0.0033 1.92 0.216
Cultivar 1 0.0024 4.69 0.044
Treatment 1 0.0013 2.52 0.130
Location*Cultivar 1 0.0013 2.53 0.129
Cultivar*Treatment 1 0.0002 0.34 0.567
Location*Treatment 1 0.0002 0.36 0.555
Location*Cultivar*Treatment 1 9.99x10⁻⁷ 0.00 0.965
Error 18 .0005 - -
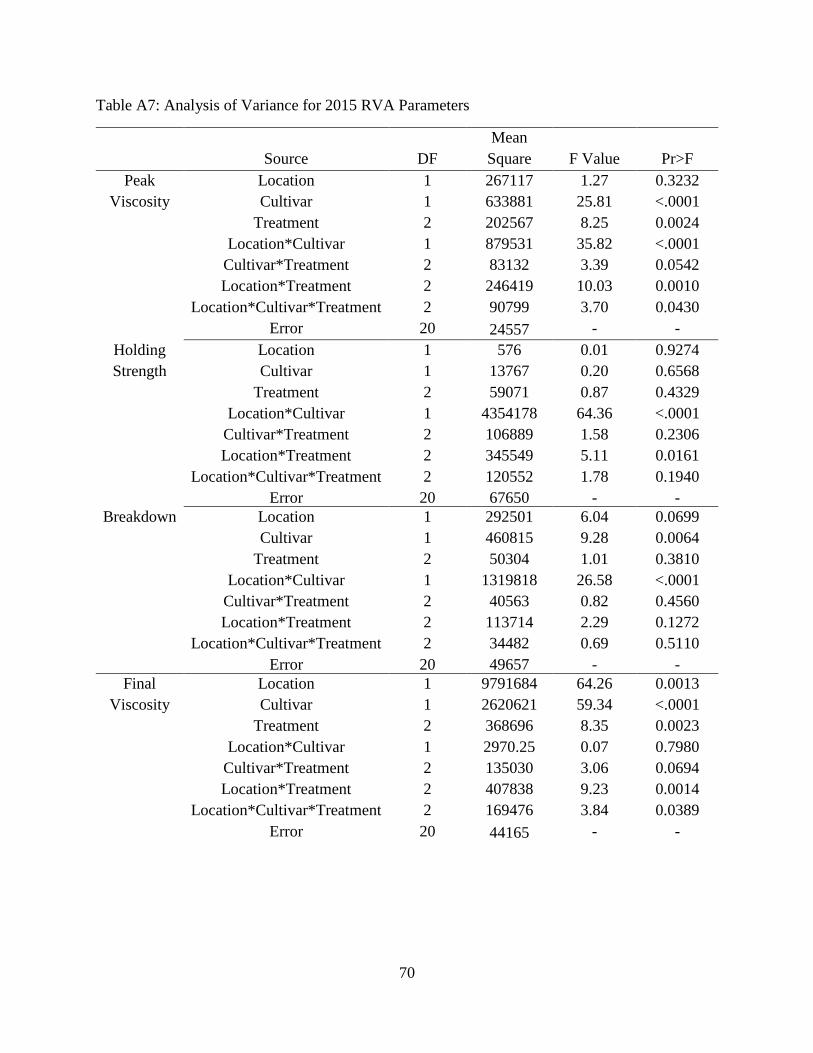
70
Table A7: Analysis of Variance for 2015 RVA Parameters
Source DF
Mean
Square F Value Pr>F
Peak Location 1 267117 1.27 0.3232
Viscosity Cultivar 1 633881 25.81 <.0001
Treatment 2 202567 8.25 0.0024
Location*Cultivar 1 879531 35.82 <.0001
Cultivar*Treatment 2 83132 3.39 0.0542
Location*Treatment 2 246419 10.03 0.0010
Location*Cultivar*Treatment 2 90799 3.70 0.0430
Error 20 24557 - -
Holding Location 1 576 0.01 0.9274
Strength Cultivar 1 13767 0.20 0.6568
Treatment 2 59071 0.87 0.4329
Location*Cultivar 1 4354178 64.36 <.0001
Cultivar*Treatment 2 106889 1.58 0.2306
Location*Treatment 2 345549 5.11 0.0161
Location*Cultivar*Treatment 2 120552 1.78 0.1940
Error 20 67650 - -
Breakdown Location 1 292501 6.04 0.0699
Cultivar 1 460815 9.28 0.0064
Treatment 2 50304 1.01 0.3810
Location*Cultivar 1 1319818 26.58 <.0001
Cultivar*Treatment 2 40563 0.82 0.4560
Location*Treatment 2 113714 2.29 0.1272
Location*Cultivar*Treatment 2 34482 0.69 0.5110
Error 20 49657 - -
Final Location 1 9791684 64.26 0.0013
Viscosity Cultivar 1 2620621 59.34 <.0001
Treatment 2 368696 8.35 0.0023
Location*Cultivar 1 2970.25 0.07 0.7980
Cultivar*Treatment 2 135030 3.06 0.0694
Location*Treatment 2 407838 9.23 0.0014
Location*Cultivar*Treatment 2 169476 3.84 0.0389
Error 20 44165 - -

71
Table A7: Analysis of Variance for 2015 RVA Parameters (continued)
Source DF
Mean
Square F Value Pr>F
Setback Location 1 9942460 387.27 <.0001
Cultivar 1 2254502 45.27 <.0001
Treatment 2 138821 2.79 0.0855
Location*Cultivar 1 4584595 92.06 <.0001
Cultivar*Treatment 2 59441 1.19 0.3238
Location*Treatment 2 107801 2.16 0.1409
Location*Cultivar*Treatment 2 4543 0.09 0.9132
Error 20 49800 - -
Peak Location 1 0.55 4.05 0.1144
Time Cultivar 1 0.30 3.06 0.0954
Treatment 2 0.10 1.08 0.3585
Location*Cultivar 1 3.87 39.96 <.0001
Cultivar*Treatment 2 0.14 1.43 0.2622
Location*Treatment 2 0.22 2.28 0.1280
Location*Cultivar*Treatment 2 0.07 0.76 0.4800
Error 20 .10 - -

72
Table A8: Analysis of Variance for 2016 RVA Parameters
Source DF
Mean
Square F Value Pr>F
Peak Location 1 947720 71.91 0.0001
Viscosity Cultivar 1 2089479 47.55 <.0001
Treatment 1 11743 0.27 0.6115
Location*Cultivar 1 61688 1.40 0.2515
Cultivar*Treatment 1 103854 2.36 0.1416
Location*Treatment 1 3549 0.08 0.7795
Location*Cultivar*Treatment 1 26738 0.61 0.4455
Error 18 43945 - -
Holding Location 1 813450 47.82 0.0005
Strength Cultivar 1 699745 28.34 <.0001
Treatment 1 4232 0.17 0.6838
Location*Cultivar 1 18050 0.73 0.4038
Cultivar*Treatment 1 378 0.02 0.9029
Location*Treatment 1 1513 0.06 0.8073
Location*Cultivar*Treatment 1 12720 0.52 0.4821
Error 18 24691 - -
Breakdown Location 1 3517215 140.16 <.0001
Cultivar 1 5207571 173.07 <.0001
Treatment 1 30074 1.00 0.3307
Location*Cultivar 1 13001 0.43 0.5193
Cultivar*Treatment 1 116765 3.88 0.0644
Location*Treatment 1 9695 0.32 0.5773
Location*Cultivar*Treatment 1 2574 0.09 0.7733
Error 18 30090 - -
Final Location 1 8306888 264.92 <.0001
Viscosity Cultivar 1 1252945 16.99 0.0006
Treatment 1 1653.125 0.02 0.8827
Location*Cultivar 1 103968 1.41 0.2506
Cultivar*Treatment 1 60726 0.82 0.3762
Location*Treatment 1 435.125 0.01 0.9396
Location*Cultivar*Treatment 1 39621 0.54 0.4731
Error 18 73764 - -

73
Table A8: Analysis of Variance for 2016 RVA Parameters (continued)
Source DF
Mean
Square F Value Pr>F
Setback Location 1 14319276 2037.13 <.0001
Cultivar 1 3825378 80.37 <.0001
Treatment 1 11175 0.23 0.6338
Location*Cultivar 1 208658 4.38 0.0507
Cultivar*Treatment 1 70688 1.49 0.2387
Location*Treatment 1 3570 0.08 0.7873
Location*Cultivar*Treatment 1 7442 0.16 0.6972
Error 18 47596 - -
Peak Location 1 7.2835 95.52 <.0001
Time Cultivar 1 0.2113 5.75 0.0276
Treatment 1 0.1701 4.63 0.0452
Location*Cultivar 1 0.1701 4.63 0.0452
Cultivar*Treatment 1 0.0401 1.09 0.3098
Location*Treatment 1 0.0235 0.64 0.4346
Location*Cultivar*Treatment 1 0.0001 0.00 0.9517
Error 18 0.0367 - -

74
Table A9: Analysis of Variance for 2015 Rolled Oat Quality Parameters
Source DF
Mean
Square F Value Pr>F
Thickness Location 1 0.3886 143.91 0.0003
Cultivar 1 0.0011 0.47 0.5029
Treatment 2 0.0001 0.02 0.9776
Location*Cultivar 1 0.0012 0.51 0.4814
Cultivar*Treatment 2 0.0016 0.67 0.5219
Location*Treatment 2 0.0049 2.12 0.1458
Location*Cultivar*Treatment 2 0.0006 0.26 0.7758
Error 20 0.0023 - -
Thickness Location 1 0.0008 1.44 0.2960
Standard Cultivar 1 0.0011 1.12 0.3029
Deviation Treatment 2 0.0005 0.44 0.6476
Location*Cultivar 1 0.0001 0.07 0.7997
Cultivar*Treatment 2 0.0001 0.07 0.9289
Location*Treatment 2 0.0004 0.40 0.6760
Location*Cultivar*Treatment 2 0.0002 0.23 0.7932
Error 20 0.0010 - -
Absorption Location 1 625.5835 308.31 <.0001
Cultivar 1 5.1908 1.82 0.1924
Treatment 2 0.2525 0.09 0.9156
Location*Cultivar 1 0.0001 0.00 0.9946
Cultivar*Treatment 2 8.5013 2.98 0.0736
Location*Treatment 2 1.4946 0.52 0.6000
Location*Cultivar*Treatment 2 0.4375 0.15 0.8588
Error 20 2.8517 - -

75
Table A10: Analysis of Variance for 2016 Rolled Oat Quality Parameters
Source DF
Mean
Square F Value Pr>F
Thickness Location 1 0.0236 51.38 0.0004
Cultivar 1 0.0086 9.86 0.0057
Treatment 1 0.0005 0.60 0.4470
Location*Cultivar 1 0.0010 1.11 0.3068
Cultivar*Treatment 1 0.0001 0.09 0.7640
Location*Treatment 1 0.0044 5.09 0.0368
Location*Cultivar*Treatment 1 0.0002 0.25 0.6211
Error 18 0.0009 - -
Thickness Location 1 0.0018 2.22 0.1865
Standard Cultivar 1 0.0004 0.41 0.5303
Deviation Treatment 1 0.0003 0.26 0.6138
Location*Cultivar 1 0.0011 1.06 0.3176
Cultivar*Treatment 1 0.0001 0.05 0.825
Location*Treatment 1 0.0002 0.23 0.6343
Location*Cultivar*Treatment 1 0.0040 3.77 0.0678
Error 18 0.0011 - -
Absorption Location 1 4.891 2.94 0.1373
Cultivar 1 2.697 1.67 0.2127
Treatment 1 0.747 0.46 0.5051
Location*Cultivar 1 0.385 0.24 0.6314
Cultivar*Treatment 1 0.003 0.00 0.9683
Location*Treatment 1 1.955 1.21 0.2858
Location*Cultivar*Treatment 1 0.069 0.04 0.8382
Error 18 1.616 - -

76
Table A11: Analysis of Variance for 2015 Rolled Oat Granulation
Source DF
Mean
Square F Value Pr>F
4750 Location 1 10485.00 1174.86 <.0001
Cultivar 1 705.85 67.51 <.0001
Treatment 2 43.58 4.17 0.0307
Location*Cultivar 1 1842.75 176.24 <.0001
Cultivar*Treatment 2 20.57 1.97 0.1660
Location*Treatment 2 49.94 4.78 0.0201
Location*Cultivar*Treatment 2 5.59 0.53 0.5942
Error 20 10.46 - -
2800 Location 1 22494.00 1218.52 <.0001
Cultivar 1 251.48 61.28 <.0001
Treatment 2 9.85 2.40 0.1164
Location*Cultivar 1 969.73 236.32 <.0001
Cultivar*Treatment 2 6.04 1.47 0.2532
Location*Treatment 2 6.70 1.63 0.2205
Location*Cultivar*Treatment 2 1.19 0.29 0.7507
Error 20 4.10 - -
2000 Location 1 61.44 94.72 0.0006
Cultivar 1 6.73 15.04 0.0009
Treatment 2 2.29 5.11 0.0161
Location*Cultivar 1 26.42 59.01 <.0001
Cultivar*Treatment 2 0.49 1.09 0.3561
Location*Treatment 2 1.70 3.79 0.0403
Location*Cultivar*Treatment 2 0.02 0.06 0.9460
Error 20 0.45 - -
Breakage Location 1 1579.71 652.06 <.0001
Cultivar 1 65.85 25.69 <.0001
Treatment 2 14.89 5.81 0.0103
Location*Cultivar 1 44.18 17.24 0.0005
Cultivar*Treatment 2 2.46 0.96 0.3994
Location*Treatment 2 15.92 6.21 0.0080
Location*Cultivar*Treatment 2 2.17 0.85 0.4441
Error 20 2.56 - -
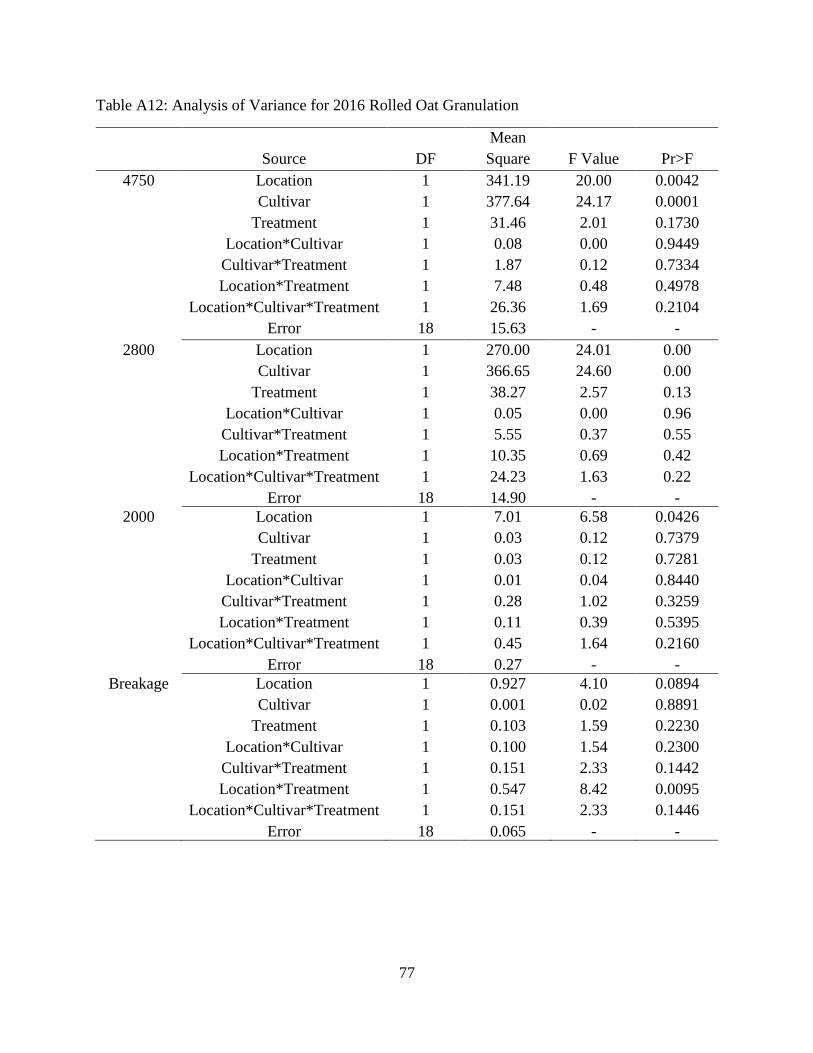
77
Table A12: Analysis of Variance for 2016 Rolled Oat Granulation
Source DF
Mean
Square F Value Pr>F
4750 Location 1 341.19 20.00 0.0042
Cultivar 1 377.64 24.17 0.0001
Treatment 1 31.46 2.01 0.1730
Location*Cultivar 1 0.08 0.00 0.9449
Cultivar*Treatment 1 1.87 0.12 0.7334
Location*Treatment 1 7.48 0.48 0.4978
Location*Cultivar*Treatment 1 26.36 1.69 0.2104
Error 18 15.63 - -
2800 Location 1 270.00 24.01 0.00
Cultivar 1 366.65 24.60 0.00
Treatment 1 38.27 2.57 0.13
Location*Cultivar 1 0.05 0.00 0.96
Cultivar*Treatment 1 5.55 0.37 0.55
Location*Treatment 1 10.35 0.69 0.42
Location*Cultivar*Treatment 1 24.23 1.63 0.22
Error 18 14.90 - -
2000 Location 1 7.01 6.58 0.0426
Cultivar 1 0.03 0.12 0.7379
Treatment 1 0.03 0.12 0.7281
Location*Cultivar 1 0.01 0.04 0.8440
Cultivar*Treatment 1 0.28 1.02 0.3259
Location*Treatment 1 0.11 0.39 0.5395
Location*Cultivar*Treatment 1 0.45 1.64 0.2160
Error 18 0.27 - -
Breakage Location 1 0.927 4.10 0.0894
Cultivar 1 0.001 0.02 0.8891
Treatment 1 0.103 1.59 0.2230
Location*Cultivar 1 0.100 1.54 0.2300
Cultivar*Treatment 1 0.151 2.33 0.1442
Location*Treatment 1 0.547 8.42 0.0095
Location*Cultivar*Treatment 1 0.151 2.33 0.1446
Error 18 0.065 - -