predicting time-dependent behaviour of high-strength · pdf filepredicting time-dependent...
TRANSCRIPT

PREDICTING TIME-DEPENDENT BEHAVIOUR OF HIGH-STRENGTH CONCRETE
M Mazloom Shahid Rajaee University Iran
29th Conference on OUR WORLD IN CONCRETE amp STRUCTURES 25 - 26 August 2004
Singapore
Article Online Id 100029046
The online version of this article can be found at
httpcipremiercom100029046
This article is brought to you with the support of
Singapore Concrete Institute
wwwscinstorgsg
All Rights reserved for CI‐Premier PTE LTD
You are not Allowed to re‐distribute or re‐sale the article in any format without written approval of
CI‐Premier PTE LTD
Visit Our Website for more information
wwwcipremiercom
29th Conference on OUR WORLD IN CONCRETE ampSTRUCTURES 25 - 26 August 2004 Singapore
PREDICTING TIME-DEPENDENT BEHAVIOUR OF HIGH-STRENGTH CONCRETE
M Mazloom Shahid Rajaee University Iran
Abstract
This paper presents two mathematical models for predicting the time dependent behaviour of high-strength concrete The first and second equations can be used for estimating creep and shrinkage respectively In fact according to the experimental work on high-strength concrete the error coefftcients of the ACI and CEB prediction models which were developed for ordinary concrete were high Therefore these mathematical models are obtained from the experimental results to improve the creep and shrinkage estimation of highshystrength concrete The experimental results of this research indicate that the percentages of silica fume replacement did not have a significant influence on total shrinkage however the autogenous shrinkage of concrete increased as the amount of silica fume increased Moreover the basic creep of concrete decreased at higher silica fume replacement levels Drying creep (total creep - basic creep) was negligible in this investigation
Keywords high-strength concrete modeling compressive strength elastic modulus creep and shrinkage
1 Introduction In high-strength concrete which contains high quality and expensive materials cracking provides the
greatest concerns for the designers because harmful materials can penetrate from them to the concrete easily and start to destroy it and also corrode reinforcement Some of these cracks are related to time-dependent behaviour of concrete Therefore to improve the durability 0 f high-strength concrete its creep and shrinkage should be addressed and necessary work should be implemented to control these deformations It is worth noting that structural engineers recognize the importance of creep and shrinkage in the design of many structures and provision for taking them into account has been introduced into a number of codes The importance of creep and shrinkage is significant in that each depending upon the concrete maturity at loading can be two to four times larger than the elastic strain However the problem of exact predicting the long-term magnitude of these deformations in high-strength concrete still remains Reliable estimation according to the existing models is not possible because they are developed for ordinary concrete Also it should be mentioned that relatively simple prediction equations are required for design when the only factors known to the design engineer are specified concrete strength age of loading probable ambient humidity and the volume to surface ratio of the member
It should be noted that in large members there is a moisture and a temperature gradient between the surfaces and the interior of them This early-age micro curing regime will cause the concrete properties including strength and creep to be different through the depth of the member Therefore unless calculations are performed from the surface taking account of diffusion of moisture due to stress or ambient relative humidity any calculations of deformations will be approximate only Finally surface carbonation will reduce moisture movement from the surface and reduce both long-term creep and shrinkage for large members [I] To study and estimate the long-term d eforrnation 0 f these members the creep and shrinkage 0 f some sealed specimens are investigated in this research
Clearly the accuracy of the prediction of creep and shrinkage depends upon the form of the time function used Neville et al [2] have reviewed the various types of equations generally used which are power expression logarithmic expression exponential expression and hyperbolic expression However a combined power and hyperbolic form suggested by Branson et al [3]is also of interest According to this suggestion the present paper introduces some improved prediction expressions derived from experimental results obtained by the author
365
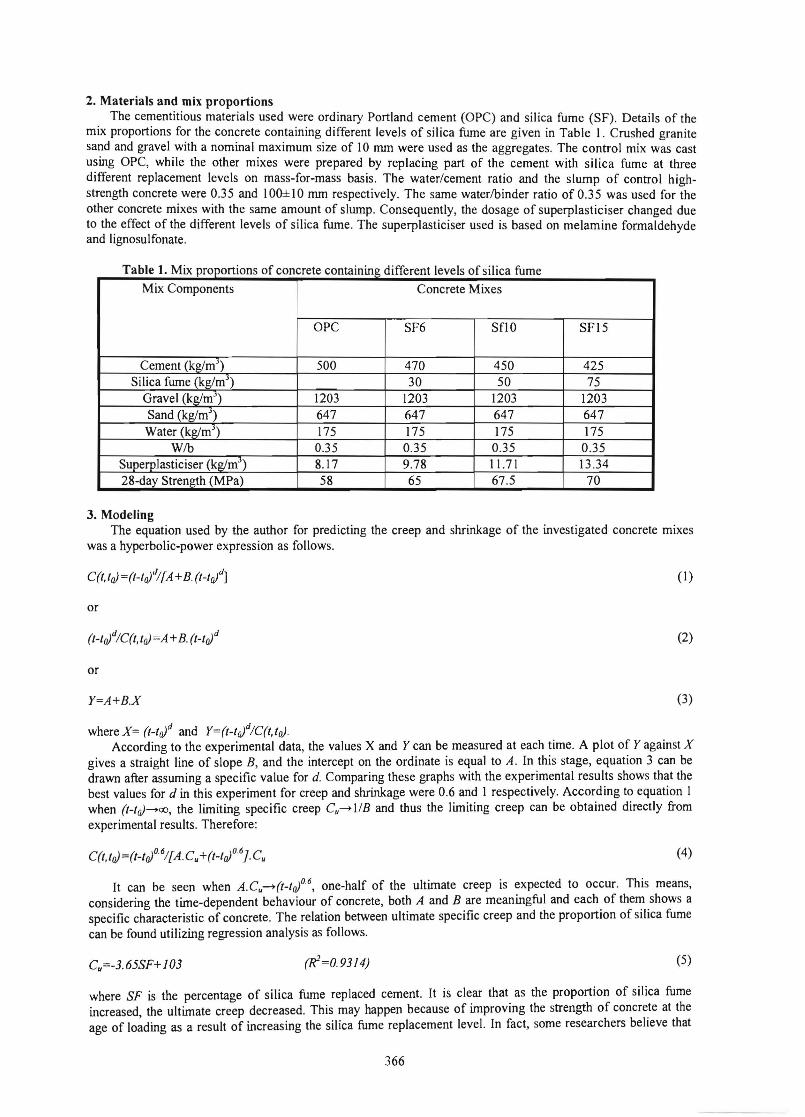
2 Materials and mix proportions The cementitious materials used were ordinary Portland cement (OPC) and silica fume (SF) Details of the
mix proportions for the concrete containing different levels of silica fume are given in Table I Crushed granite sand and gravel with a nominal maximum size of 10 nun were used as the aggregates The control mix was cast using OPC while the other mixes were prepared by replacing part of the cement with silica fume at three different replacement levels on mass-for-mass basis The watercement ratio and the slump of control highshystrength concrete were 035 and IOOplusmn IO nun respectively The same waterlbinder ratio of 035 was used for the other concrete mixes with the same amount of slump Consequently the dosage of superplasticiser changed due to the effect of the different levels of silica fume The superplasticiser used is based on melamine formaldehyde and lignosulfonate
Table 1 MIX proportIOns 0 f concrete containing different levels of silica fume
Mix Components Concrete Mixes
OPC SF6 SflO SFI5
Cement (kgmJ ) 500 470 450 425
Silica fume (kgmJ ) 30 50 75
Gravel (kgmJ ) 1203 1203 1203 1203
Sand (kgmJ ) 647 647 647 647
Water (kgmJ ) 175 175 175 175
WIb 035 035 035 035 Superplasticiser (kgmJ
) 8 17 978 1I71 13 34 28-day Strength (MPa) 58 65 675 70
3 Modeling The equation used by the author for predicting the creep and shrinkage of the investigated concrete mixes
was a hyperbolic-power expression as follows
C(tta) = (t-toI[A +B (t-ta)d] (I)
or
(HOIC(t ta) =A +B (t-ta)d (2)
or
Y=A+Bx (3)
where X= (t-ta)d and Y=(t-toIC(tto) According to the experimental data the values X and Y can be measured at each time A plot of Y against X
gives a straight line of slope B and the intercept on the ordinate is equal to A In this stage equation 3 can be drawn after assuming a specific value for d Comparing these graphs with the experimental results shows that the best values for d in this experiment for creep and shrinkage were 06 and 1 respectively According to equation I when (t-ta)-oo the limiting specific creep Cu- liB and thus the limiting creep can be obtained directly from experimental results Therefore
(4)
It can be seen when ACu-(t-tof 6 one-half of the ultimate creep is expected to occur This means
considering the time-dependent behaviour of concrete both A and B are meaningful and each of them shows a specific characteristic of concrete The relation between ultimate specific creep and the proportion of silica fume can be found utilizing regression analysis as follows
(5)Cu=-3 65SF +J03 (K=09314)
where SF is the percentage of silica fume replaced cement It is clear that as the proportion of silica fume increased the ultimate creep decreased This may happen because of improving the strength of concrete at the age of loading as a result of increasing the silica fume replacement level In fact some researchers believe that
366
specimens having higher compressive strength show lower creep [456] Also the relation between ACu and the proportion of silica fume can be obtained in a similar manner as follows
ACu=265-SF (6)
The age or fraction developed concrete strength at which the concrete is loaded is known to influence the magnitude of the creep strains In this research the ratio of the ultimate specific creep of the specimens loaded at the age of 7 days to the ones loaded at the age of 28 days (CultCd are between 075 and 078 with the average value and standard deviation of 076 and 0012 respectively Consequently equation 4 should be multiplied by a correction coefficient which is I and 076 for theloading ages of7 and 28 days respectively For the other aging loads the coefficient above may be estimated by the following equation
y= l08-0ll 4to (7)
where to is loading age By substituting (5) and (6) into (4) and considering (7) the specific creep (CreepMPa)
equation becomes
(8)
It is worth noting that creep is considered to have two components basic creep obtained from sealed samples and drying creep which is calculated by subtracting the basic creep and the shrinkage strain from the total deformation of loaded unsealed samples stored at the required relative humidity The dimensions of the specimen and also the relative humidity are not considered in equation 8 because the creep of sealed and drying specimens of high-strength concrete investigated here were the same It is clear that the creep strain of a specimen subjected to a sustained compressive stress of a (MPa) is equal to a Crt toJ Some researchers use creep coefficient which is the ratio of creep at any age t after application of load at time to to the elastic strain at the age of applying the load to so that
(9)
As explained earlier the assumed shrinkage equation is quite similar to the one used for creep It means
eurosh(t1raquo)= (t-1raquo)[A+B(t-1raquo)] (10)
or
(I I)
It should be mentioned that silica fume replacement level did not have any significant influence on ultimate shrinkage Its average value was 515 microstrain with the standard deviation of 1424 The relation between AEshu and the percentage of silica fume can be estimated using regression analysis as follows
(12)Aeuroshu=O3SF+ 126
Therefore the shrinkage equation is
eurosh(t1raquo)=(t1raquo)[(O3SF+ I2 6)+(t-1raquo)]5 I6x I0-6 (13)
It should be noted that in large members and also the members having carbonated surfaces the moisture movement from them to the atmosphere reduces as a result the long-term shrinkage of them always decrease To investigate the minimum long-term shrinkage of some sealed specimens are studied in this research The effects of these specimens and also the dimensions of the other specimens on ultimate shrinkage are calculated
using regression analysis as follows
Y=O014SF+O39 (for sealed specimens) (14)
367
and
y= 114-0 007(VIS) ~ O014SF+039 (for drying specimens) (15)
where VIS is the volume to surface ratio of the specimen It is clear that according to equation 15 the Y coefficient in very large members and sealed specimens are equal As a result the ultimate shape of the shrinkage model is
(t -t ) E (t to) = 0 516 Y I 0-6 (16)
sh (0 3FS + 126) + (t -to)
4 Goodness of fit In this part of the work the experimental results of creep and shrinkage are used to check equations 8 and 16
Also the results are compared with the ACI [7] and CEB [8] prediction methods which were developed for ordinary concrete
41 Creep model Figures 1 and 2 show the results of specific creep ie creep per unit stress for cylindrical specimens of
80270 mm height which were loaded at the ages of 7 and 28 days respectively Specimens were subjected to a sustained compressive stress of 10 MPa during all the creep tests and the stressstrength ratios were less than 03 The basic creep of sealed specimens can be compared to the total creep of drying specimens It can be observed that the difference in creep of unsealed and sealed specimens is small in the control concrete and almost zero in specimens containing silica fume This implies that there is no interaction between creep and shrinkage and also factors affecting the rate of drying which are specimen size and the relative humidity of atmosphere had no influence on the creep of the high-strength concrete specimens investigated here
To compare these models numerically the error coefficient method is used According to Neville et al [2] the error coefficient M for creep at any age t for concrete subjected to load at an earlier age to is defined as
M= 1 ICav(ttaJ I[Co(t taJ-Cp(ttaJf In5 (17)
where CittaJ is observed creep ClttaJ is predicted creep and Cav(ttaJ is mean observed creep for a number of observations n In fact the accuracy of different prediction methods can be assessed in terms of error coefficient and a value of 15 can be assumed acceptable [2]
As shown in figures 1 and 2 equation 8 presents the creep of concrete containing different levels of silica fume much better than the ACI and CEB models Tables 2 and 3 compare the fmal measured creep of specimens loaded at the ages of 7 and 28 days with the predicted creep The error coefficients of Eq 8 ACI [7] and CEB [8] prediction methods for specimens loaded at the age of 7 days were 6 366 and 52 6 and also for specimens loaded at the age of28 days were 89 272 and 478 respectively
42 shrinkage model Figures 3 and 4 demonstrate the improvements in prediction of shrinkage using equation 16 compared with
those by the ACI and CEB methods Tables 4 and 5 compare the final measured shrinkage of 80270 mm and 150300 mm high specimens with the results of different prediction methods As shown in these tables the error coefficients of equation 16 are much less than those of the ACI and CEB prediction methods
Also Figures I and 2 show that silica fume did not have considerable influence on drying specimens (total shrinkage) The average amount of total shrinkage after 587 days of drying for the 80270 mm and 150300 mm specimens was 524 and 450 microstrain respectively with corresponding standard deviations of 75 and 142 respectively It should be noted that Bissonnette et al [9] disagree with this fmding and believe the ultimate deformation does not differ much from one specimen size to the other and only the rate of drying is affected by the size of the specimen Figures 1 and 2 also show silica fume to considerably affect the shrinkage of sealed specimens It is clear that the general effect of increasing the silica fume inclusion is to increase autogenous shrinkage This is in agreement with the results of other researchers [l0-14]
368
OPC SF6
80------------- Co Co Q)
~ 50~~~~==~~ 50 t-~--=---~~__lCJ CJbull Drying bull Drying
CJ 40 +It-----o~-----+---___1~ 40~~~------~ I( Sealed ( Sealed(3
Q) 20~----------~ 2 20 -----------~ Co Co tn tn 0 +-____----_____-1o ~-----------~
o 250 500 o 250 500
Time (days) Time (days)
SF15 SF10
80 ------------- Co Q)
~ 50r-__~~~~--I () bull Drying
bull Drying ICJ 40 +-r--e~~iI1( ( Sealed (3( Sealed Q) 20~------------I Co tn o f------------------lto +-----------~
o 250 500o 250 500
Time (days) Time (days)
Figure 1 Specific creep of specimens loaded at the age of7 days (microstrainIMPa)
OPc SF6
80 -------------- 80 --------------- Co Co
60r---~=_-=--~ 60r---FF~----~ ---CI CJCJ bull Drying bull Drying CJ 40 +-Ir-----=~=__]_~
I ( Sealed ( Sealed(3 Q) Co tn o -------------lt o ~---------I
o 250 500 o 250 500
Time (days) Time (days)
SF10 SF15
80 ------------ 80 --------------- CoCo
60+---~~r---~ 50 +-----------c=-=-=~--~ CJCJ bull Dryingbull Drying
CJ 40 -t--b-~_________~ ACI
I ( Sealed( Sealed(3 Q) 20 __~--------~ Co tn o F-------------~o +--------~
o 250 500 o 250 500
Time (days) Time (days)
20 +JIo~-------~
Figure 2 Specific creep of specimens loaded at the age of28 days (microstrainIMPa)
369
OPC SF6
800 800 IV IV CI 600 CI ICI g)ICI ~ ~400c c or 200 or CI) CI)sealed)
0
ACI 600
400
200
0 500 1000 0 500 1000
Time (days) Time (days)
SF10 SF15
800 800 ACI
IV 600IV 600 CI
ICI CI
ICI ~~ 400400 cc oror CI) 200
0
CI) 200
0
0 500 1000 0 500 1000
Time laquodays) Time (days)
Figure 3 Shrinkage of 80270 nun height specimens (microstrain)
OPC SF6
800 800 IV IV CI 600 CI 600 ICI ICI
~ 400~ 400 cc or 200
CI) or 200
CI)
0
0 500 1000 0 500 1000 0
Time (days) Time (days)
SF10 SF15
800800 IVCl600~ 600 ICIICI ~ 400~ 400c ~ 200or 200 CI)CI)
00 0 500 10000 500 1000
Time (days) Time (days)
Figure 4 Shrinkage of 150300 nun height specimens (microstrain)
370
~dYing)C B
(sealed
Table 2 Specific creep of specimens loaded at the age of7 days after 396 days of loading (microstrainlMPa)
Concrete mixes Measured value Predicted value Equation 8 ACI CEB
OPC 59 5 59 5 68 9 811 SF6 51 518 65 8 74 5 SFIO 45 9 45 7 64 8 721 SF15 417 366 642 699
Error coefficient () --shy 60 366 526
Table 3 Specific creep of specimens loaded at the age of 28 days after 376 days of loading (microstrainlMPa)
Concrete mixes Measured value Predicted value Equation 8 ACI CEB
OPC 413 446 515 624 SF6 40 7 389 48 7 568 SFIO 381 344 47 8 55 SFI5 328 276 46 9 534
Error coefficient () --shy 89 27 2 47 8
Table 4 I elgl t specimens a fter 5 7 days of drying (microstrain) Shrnkage 0 f80270 mm h h 8
Concrete mixes Measured value Predicted value Equation 16 ACI CEB
OPC 532 505 604 452
SF6 528 504 604 412 SFIO 523 503 604 397 SFl5 512 501 604 382
Error coefficient () --shy 40 154 225
fd ( )Table 5 Shrinkage 0 f150300 mm helght specunens a fter 406 d ays 0 1rymg mlcrostram
Concrete mixes Measured value Predicted value Equation 16 ACI CEB
oPC 468 445 554 409 SF6 462 443 554 373 SFIO 446 442 554 359 SFl5 435 44] 554 346
Error coefficient () --shy 31 233 182
5 Conclusions
From the results presented in this paper the main conclusions are I In high-strength concrete the proposed equations for predicting creep and shrinkage are more exact
than the ones suggested by the ACI and CEB 2 The total creep of high-strength concrete specimens investigated here decreased as the level of silica
fume replacement increased 3 Drying creep (total creep-basic creep) was negligible in this research therefore the specimen size and
the relative humidity of the atmosphere were not considered in the proposed creep model 4 Silica fume did not affect the total shrinkage but as the proportion of silica fume increased the
autogenous shrinkage of high-strength concrete increased
371
References
[I] Gardner NJ and Zhao 1W Creep and shrinkage revisited AC1 Materials Journal 90 3 May-June 1993 236-245 [2] Neville AM Dilger WH and Brooks J1 Creep ofplain and structural concrete Construction Press London and New York 1983 [3] Branson DE Meyers BL and Kripanarayanan KM Time dependent defonnation of non-composite and composite sand-lightweight prestressed concrete structures Lowa Highway Commission research report No 69-1 Project No HR-13 7 Phase 1 report Lowa City University of Lowa 1969 [4] Shah SP and Ahmad SH High performance concrete and applications Edvard Arnold London 1994 [5] Neville AM Properties ofconcrete Longman Edinburgh 1995 [6] Khan AA Cook WD Mitchell D Creep shrinkage and thennal strains in nonnal medium and highshystrength concretes during hydration AC1 Materials Journal 94 2 March-April 1997 156-163 [7] ACI Committee 209 Prediction of creep shrinkage and temperature effects in concrete structures AC1 Manual ofconcrete practice Part I 1997 209R 1-92 [8] CEB-FIP Model Code for Concrete Structures 1990 Evaluation of the time dependent behavior of concrete Bulletin dlnformation No 199 Comie European du BetonFederation 1nternationale de la Precontrainte Lausarme 199 I
[9] Bissormette B Pierre P and Pigeon M Influence of key parameters on drying shrinkage ofcementitious materials Cement and Concrete Research 29 1999 1655-1662 [10] De Larrard F Ithurralde G Acker P and Chauvel D High perfonnance concrete for a nuclear containment Proceedings Second International Symposium on Utilization of High-Strength Concrete Berkley ACI SP 1990 121-127 [II] Persson BSM Shrinkage of high perfonnance concrete Proceedings International Workshop on Autogenous Shrinkage of Concrete Japan Concrete Institute Hiroshima June 1998 10 1-118 [12] Le Roy R and De Larrard F Creep and shrinkage of high-perfonnance concrete the LCPC experience The Fifth International RILEM Symposium on Creep and Shrinkage of Concrete E amp FN Spon London 1993 499-504 [13] Jensen OM and Hansen PF Influence of temperature on autogenous defonnation and relative humidity change in hardening cement paste Cement and Concrete Research 29 1999 567-575 [14] Mak SL Ritchie DTaylor A and Diggins R Temperature effects on early age autogenous shrinkage in high performance concretes Proceedings International Workshop on Autogenous Shrinkage of Concrete Japan Concrete Institute Hiroshima June 1998 153-162
372

29th Conference on OUR WORLD IN CONCRETE ampSTRUCTURES 25 - 26 August 2004 Singapore
PREDICTING TIME-DEPENDENT BEHAVIOUR OF HIGH-STRENGTH CONCRETE
M Mazloom Shahid Rajaee University Iran
Abstract
This paper presents two mathematical models for predicting the time dependent behaviour of high-strength concrete The first and second equations can be used for estimating creep and shrinkage respectively In fact according to the experimental work on high-strength concrete the error coefftcients of the ACI and CEB prediction models which were developed for ordinary concrete were high Therefore these mathematical models are obtained from the experimental results to improve the creep and shrinkage estimation of highshystrength concrete The experimental results of this research indicate that the percentages of silica fume replacement did not have a significant influence on total shrinkage however the autogenous shrinkage of concrete increased as the amount of silica fume increased Moreover the basic creep of concrete decreased at higher silica fume replacement levels Drying creep (total creep - basic creep) was negligible in this investigation
Keywords high-strength concrete modeling compressive strength elastic modulus creep and shrinkage
1 Introduction In high-strength concrete which contains high quality and expensive materials cracking provides the
greatest concerns for the designers because harmful materials can penetrate from them to the concrete easily and start to destroy it and also corrode reinforcement Some of these cracks are related to time-dependent behaviour of concrete Therefore to improve the durability 0 f high-strength concrete its creep and shrinkage should be addressed and necessary work should be implemented to control these deformations It is worth noting that structural engineers recognize the importance of creep and shrinkage in the design of many structures and provision for taking them into account has been introduced into a number of codes The importance of creep and shrinkage is significant in that each depending upon the concrete maturity at loading can be two to four times larger than the elastic strain However the problem of exact predicting the long-term magnitude of these deformations in high-strength concrete still remains Reliable estimation according to the existing models is not possible because they are developed for ordinary concrete Also it should be mentioned that relatively simple prediction equations are required for design when the only factors known to the design engineer are specified concrete strength age of loading probable ambient humidity and the volume to surface ratio of the member
It should be noted that in large members there is a moisture and a temperature gradient between the surfaces and the interior of them This early-age micro curing regime will cause the concrete properties including strength and creep to be different through the depth of the member Therefore unless calculations are performed from the surface taking account of diffusion of moisture due to stress or ambient relative humidity any calculations of deformations will be approximate only Finally surface carbonation will reduce moisture movement from the surface and reduce both long-term creep and shrinkage for large members [I] To study and estimate the long-term d eforrnation 0 f these members the creep and shrinkage 0 f some sealed specimens are investigated in this research
Clearly the accuracy of the prediction of creep and shrinkage depends upon the form of the time function used Neville et al [2] have reviewed the various types of equations generally used which are power expression logarithmic expression exponential expression and hyperbolic expression However a combined power and hyperbolic form suggested by Branson et al [3]is also of interest According to this suggestion the present paper introduces some improved prediction expressions derived from experimental results obtained by the author
365
2 Materials and mix proportions The cementitious materials used were ordinary Portland cement (OPC) and silica fume (SF) Details of the
mix proportions for the concrete containing different levels of silica fume are given in Table I Crushed granite sand and gravel with a nominal maximum size of 10 nun were used as the aggregates The control mix was cast using OPC while the other mixes were prepared by replacing part of the cement with silica fume at three different replacement levels on mass-for-mass basis The watercement ratio and the slump of control highshystrength concrete were 035 and IOOplusmn IO nun respectively The same waterlbinder ratio of 035 was used for the other concrete mixes with the same amount of slump Consequently the dosage of superplasticiser changed due to the effect of the different levels of silica fume The superplasticiser used is based on melamine formaldehyde and lignosulfonate
Table 1 MIX proportIOns 0 f concrete containing different levels of silica fume
Mix Components Concrete Mixes
OPC SF6 SflO SFI5
Cement (kgmJ ) 500 470 450 425
Silica fume (kgmJ ) 30 50 75
Gravel (kgmJ ) 1203 1203 1203 1203
Sand (kgmJ ) 647 647 647 647
Water (kgmJ ) 175 175 175 175
WIb 035 035 035 035 Superplasticiser (kgmJ
) 8 17 978 1I71 13 34 28-day Strength (MPa) 58 65 675 70
3 Modeling The equation used by the author for predicting the creep and shrinkage of the investigated concrete mixes
was a hyperbolic-power expression as follows
C(tta) = (t-toI[A +B (t-ta)d] (I)
or
(HOIC(t ta) =A +B (t-ta)d (2)
or
Y=A+Bx (3)
where X= (t-ta)d and Y=(t-toIC(tto) According to the experimental data the values X and Y can be measured at each time A plot of Y against X
gives a straight line of slope B and the intercept on the ordinate is equal to A In this stage equation 3 can be drawn after assuming a specific value for d Comparing these graphs with the experimental results shows that the best values for d in this experiment for creep and shrinkage were 06 and 1 respectively According to equation I when (t-ta)-oo the limiting specific creep Cu- liB and thus the limiting creep can be obtained directly from experimental results Therefore
(4)
It can be seen when ACu-(t-tof 6 one-half of the ultimate creep is expected to occur This means
considering the time-dependent behaviour of concrete both A and B are meaningful and each of them shows a specific characteristic of concrete The relation between ultimate specific creep and the proportion of silica fume can be found utilizing regression analysis as follows
(5)Cu=-3 65SF +J03 (K=09314)
where SF is the percentage of silica fume replaced cement It is clear that as the proportion of silica fume increased the ultimate creep decreased This may happen because of improving the strength of concrete at the age of loading as a result of increasing the silica fume replacement level In fact some researchers believe that
366
specimens having higher compressive strength show lower creep [456] Also the relation between ACu and the proportion of silica fume can be obtained in a similar manner as follows
ACu=265-SF (6)
The age or fraction developed concrete strength at which the concrete is loaded is known to influence the magnitude of the creep strains In this research the ratio of the ultimate specific creep of the specimens loaded at the age of 7 days to the ones loaded at the age of 28 days (CultCd are between 075 and 078 with the average value and standard deviation of 076 and 0012 respectively Consequently equation 4 should be multiplied by a correction coefficient which is I and 076 for theloading ages of7 and 28 days respectively For the other aging loads the coefficient above may be estimated by the following equation
y= l08-0ll 4to (7)
where to is loading age By substituting (5) and (6) into (4) and considering (7) the specific creep (CreepMPa)
equation becomes
(8)
It is worth noting that creep is considered to have two components basic creep obtained from sealed samples and drying creep which is calculated by subtracting the basic creep and the shrinkage strain from the total deformation of loaded unsealed samples stored at the required relative humidity The dimensions of the specimen and also the relative humidity are not considered in equation 8 because the creep of sealed and drying specimens of high-strength concrete investigated here were the same It is clear that the creep strain of a specimen subjected to a sustained compressive stress of a (MPa) is equal to a Crt toJ Some researchers use creep coefficient which is the ratio of creep at any age t after application of load at time to to the elastic strain at the age of applying the load to so that
(9)
As explained earlier the assumed shrinkage equation is quite similar to the one used for creep It means
eurosh(t1raquo)= (t-1raquo)[A+B(t-1raquo)] (10)
or
(I I)
It should be mentioned that silica fume replacement level did not have any significant influence on ultimate shrinkage Its average value was 515 microstrain with the standard deviation of 1424 The relation between AEshu and the percentage of silica fume can be estimated using regression analysis as follows
(12)Aeuroshu=O3SF+ 126
Therefore the shrinkage equation is
eurosh(t1raquo)=(t1raquo)[(O3SF+ I2 6)+(t-1raquo)]5 I6x I0-6 (13)
It should be noted that in large members and also the members having carbonated surfaces the moisture movement from them to the atmosphere reduces as a result the long-term shrinkage of them always decrease To investigate the minimum long-term shrinkage of some sealed specimens are studied in this research The effects of these specimens and also the dimensions of the other specimens on ultimate shrinkage are calculated
using regression analysis as follows
Y=O014SF+O39 (for sealed specimens) (14)
367
and
y= 114-0 007(VIS) ~ O014SF+039 (for drying specimens) (15)
where VIS is the volume to surface ratio of the specimen It is clear that according to equation 15 the Y coefficient in very large members and sealed specimens are equal As a result the ultimate shape of the shrinkage model is
(t -t ) E (t to) = 0 516 Y I 0-6 (16)
sh (0 3FS + 126) + (t -to)
4 Goodness of fit In this part of the work the experimental results of creep and shrinkage are used to check equations 8 and 16
Also the results are compared with the ACI [7] and CEB [8] prediction methods which were developed for ordinary concrete
41 Creep model Figures 1 and 2 show the results of specific creep ie creep per unit stress for cylindrical specimens of
80270 mm height which were loaded at the ages of 7 and 28 days respectively Specimens were subjected to a sustained compressive stress of 10 MPa during all the creep tests and the stressstrength ratios were less than 03 The basic creep of sealed specimens can be compared to the total creep of drying specimens It can be observed that the difference in creep of unsealed and sealed specimens is small in the control concrete and almost zero in specimens containing silica fume This implies that there is no interaction between creep and shrinkage and also factors affecting the rate of drying which are specimen size and the relative humidity of atmosphere had no influence on the creep of the high-strength concrete specimens investigated here
To compare these models numerically the error coefficient method is used According to Neville et al [2] the error coefficient M for creep at any age t for concrete subjected to load at an earlier age to is defined as
M= 1 ICav(ttaJ I[Co(t taJ-Cp(ttaJf In5 (17)
where CittaJ is observed creep ClttaJ is predicted creep and Cav(ttaJ is mean observed creep for a number of observations n In fact the accuracy of different prediction methods can be assessed in terms of error coefficient and a value of 15 can be assumed acceptable [2]
As shown in figures 1 and 2 equation 8 presents the creep of concrete containing different levels of silica fume much better than the ACI and CEB models Tables 2 and 3 compare the fmal measured creep of specimens loaded at the ages of 7 and 28 days with the predicted creep The error coefficients of Eq 8 ACI [7] and CEB [8] prediction methods for specimens loaded at the age of 7 days were 6 366 and 52 6 and also for specimens loaded at the age of28 days were 89 272 and 478 respectively
42 shrinkage model Figures 3 and 4 demonstrate the improvements in prediction of shrinkage using equation 16 compared with
those by the ACI and CEB methods Tables 4 and 5 compare the final measured shrinkage of 80270 mm and 150300 mm high specimens with the results of different prediction methods As shown in these tables the error coefficients of equation 16 are much less than those of the ACI and CEB prediction methods
Also Figures I and 2 show that silica fume did not have considerable influence on drying specimens (total shrinkage) The average amount of total shrinkage after 587 days of drying for the 80270 mm and 150300 mm specimens was 524 and 450 microstrain respectively with corresponding standard deviations of 75 and 142 respectively It should be noted that Bissonnette et al [9] disagree with this fmding and believe the ultimate deformation does not differ much from one specimen size to the other and only the rate of drying is affected by the size of the specimen Figures 1 and 2 also show silica fume to considerably affect the shrinkage of sealed specimens It is clear that the general effect of increasing the silica fume inclusion is to increase autogenous shrinkage This is in agreement with the results of other researchers [l0-14]
368
OPC SF6
80------------- Co Co Q)
~ 50~~~~==~~ 50 t-~--=---~~__lCJ CJbull Drying bull Drying
CJ 40 +It-----o~-----+---___1~ 40~~~------~ I( Sealed ( Sealed(3
Q) 20~----------~ 2 20 -----------~ Co Co tn tn 0 +-____----_____-1o ~-----------~
o 250 500 o 250 500
Time (days) Time (days)
SF15 SF10
80 ------------- Co Q)
~ 50r-__~~~~--I () bull Drying
bull Drying ICJ 40 +-r--e~~iI1( ( Sealed (3( Sealed Q) 20~------------I Co tn o f------------------lto +-----------~
o 250 500o 250 500
Time (days) Time (days)
Figure 1 Specific creep of specimens loaded at the age of7 days (microstrainIMPa)
OPc SF6
80 -------------- 80 --------------- Co Co
60r---~=_-=--~ 60r---FF~----~ ---CI CJCJ bull Drying bull Drying CJ 40 +-Ir-----=~=__]_~
I ( Sealed ( Sealed(3 Q) Co tn o -------------lt o ~---------I
o 250 500 o 250 500
Time (days) Time (days)
SF10 SF15
80 ------------ 80 --------------- CoCo
60+---~~r---~ 50 +-----------c=-=-=~--~ CJCJ bull Dryingbull Drying
CJ 40 -t--b-~_________~ ACI
I ( Sealed( Sealed(3 Q) 20 __~--------~ Co tn o F-------------~o +--------~
o 250 500 o 250 500
Time (days) Time (days)
20 +JIo~-------~
Figure 2 Specific creep of specimens loaded at the age of28 days (microstrainIMPa)
369
OPC SF6
800 800 IV IV CI 600 CI ICI g)ICI ~ ~400c c or 200 or CI) CI)sealed)
0
ACI 600
400
200
0 500 1000 0 500 1000
Time (days) Time (days)
SF10 SF15
800 800 ACI
IV 600IV 600 CI
ICI CI
ICI ~~ 400400 cc oror CI) 200
0
CI) 200
0
0 500 1000 0 500 1000
Time laquodays) Time (days)
Figure 3 Shrinkage of 80270 nun height specimens (microstrain)
OPC SF6
800 800 IV IV CI 600 CI 600 ICI ICI
~ 400~ 400 cc or 200
CI) or 200
CI)
0
0 500 1000 0 500 1000 0
Time (days) Time (days)
SF10 SF15
800800 IVCl600~ 600 ICIICI ~ 400~ 400c ~ 200or 200 CI)CI)
00 0 500 10000 500 1000
Time (days) Time (days)
Figure 4 Shrinkage of 150300 nun height specimens (microstrain)
370
~dYing)C B
(sealed
Table 2 Specific creep of specimens loaded at the age of7 days after 396 days of loading (microstrainlMPa)
Concrete mixes Measured value Predicted value Equation 8 ACI CEB
OPC 59 5 59 5 68 9 811 SF6 51 518 65 8 74 5 SFIO 45 9 45 7 64 8 721 SF15 417 366 642 699
Error coefficient () --shy 60 366 526
Table 3 Specific creep of specimens loaded at the age of 28 days after 376 days of loading (microstrainlMPa)
Concrete mixes Measured value Predicted value Equation 8 ACI CEB
OPC 413 446 515 624 SF6 40 7 389 48 7 568 SFIO 381 344 47 8 55 SFI5 328 276 46 9 534
Error coefficient () --shy 89 27 2 47 8
Table 4 I elgl t specimens a fter 5 7 days of drying (microstrain) Shrnkage 0 f80270 mm h h 8
Concrete mixes Measured value Predicted value Equation 16 ACI CEB
OPC 532 505 604 452
SF6 528 504 604 412 SFIO 523 503 604 397 SFl5 512 501 604 382
Error coefficient () --shy 40 154 225
fd ( )Table 5 Shrinkage 0 f150300 mm helght specunens a fter 406 d ays 0 1rymg mlcrostram
Concrete mixes Measured value Predicted value Equation 16 ACI CEB
oPC 468 445 554 409 SF6 462 443 554 373 SFIO 446 442 554 359 SFl5 435 44] 554 346
Error coefficient () --shy 31 233 182
5 Conclusions
From the results presented in this paper the main conclusions are I In high-strength concrete the proposed equations for predicting creep and shrinkage are more exact
than the ones suggested by the ACI and CEB 2 The total creep of high-strength concrete specimens investigated here decreased as the level of silica
fume replacement increased 3 Drying creep (total creep-basic creep) was negligible in this research therefore the specimen size and
the relative humidity of the atmosphere were not considered in the proposed creep model 4 Silica fume did not affect the total shrinkage but as the proportion of silica fume increased the
autogenous shrinkage of high-strength concrete increased
371
References
[I] Gardner NJ and Zhao 1W Creep and shrinkage revisited AC1 Materials Journal 90 3 May-June 1993 236-245 [2] Neville AM Dilger WH and Brooks J1 Creep ofplain and structural concrete Construction Press London and New York 1983 [3] Branson DE Meyers BL and Kripanarayanan KM Time dependent defonnation of non-composite and composite sand-lightweight prestressed concrete structures Lowa Highway Commission research report No 69-1 Project No HR-13 7 Phase 1 report Lowa City University of Lowa 1969 [4] Shah SP and Ahmad SH High performance concrete and applications Edvard Arnold London 1994 [5] Neville AM Properties ofconcrete Longman Edinburgh 1995 [6] Khan AA Cook WD Mitchell D Creep shrinkage and thennal strains in nonnal medium and highshystrength concretes during hydration AC1 Materials Journal 94 2 March-April 1997 156-163 [7] ACI Committee 209 Prediction of creep shrinkage and temperature effects in concrete structures AC1 Manual ofconcrete practice Part I 1997 209R 1-92 [8] CEB-FIP Model Code for Concrete Structures 1990 Evaluation of the time dependent behavior of concrete Bulletin dlnformation No 199 Comie European du BetonFederation 1nternationale de la Precontrainte Lausarme 199 I
[9] Bissormette B Pierre P and Pigeon M Influence of key parameters on drying shrinkage ofcementitious materials Cement and Concrete Research 29 1999 1655-1662 [10] De Larrard F Ithurralde G Acker P and Chauvel D High perfonnance concrete for a nuclear containment Proceedings Second International Symposium on Utilization of High-Strength Concrete Berkley ACI SP 1990 121-127 [II] Persson BSM Shrinkage of high perfonnance concrete Proceedings International Workshop on Autogenous Shrinkage of Concrete Japan Concrete Institute Hiroshima June 1998 10 1-118 [12] Le Roy R and De Larrard F Creep and shrinkage of high-perfonnance concrete the LCPC experience The Fifth International RILEM Symposium on Creep and Shrinkage of Concrete E amp FN Spon London 1993 499-504 [13] Jensen OM and Hansen PF Influence of temperature on autogenous defonnation and relative humidity change in hardening cement paste Cement and Concrete Research 29 1999 567-575 [14] Mak SL Ritchie DTaylor A and Diggins R Temperature effects on early age autogenous shrinkage in high performance concretes Proceedings International Workshop on Autogenous Shrinkage of Concrete Japan Concrete Institute Hiroshima June 1998 153-162
372

OPC SF6
800 800 IV IV CI 600 CI ICI g)ICI ~ ~400c c or 200 or CI) CI)sealed)
0
ACI 600
400
200
0 500 1000 0 500 1000
Time (days) Time (days)
SF10 SF15
800 800 ACI
IV 600IV 600 CI
ICI CI
ICI ~~ 400400 cc oror CI) 200
0
CI) 200
0
0 500 1000 0 500 1000
Time laquodays) Time (days)
Figure 3 Shrinkage of 80270 nun height specimens (microstrain)
OPC SF6
800 800 IV IV CI 600 CI 600 ICI ICI
~ 400~ 400 cc or 200
CI) or 200
CI)
0
0 500 1000 0 500 1000 0
Time (days) Time (days)
SF10 SF15
800800 IVCl600~ 600 ICIICI ~ 400~ 400c ~ 200or 200 CI)CI)
00 0 500 10000 500 1000
Time (days) Time (days)
Figure 4 Shrinkage of 150300 nun height specimens (microstrain)
370
~dYing)C B
(sealed
Table 2 Specific creep of specimens loaded at the age of7 days after 396 days of loading (microstrainlMPa)
Concrete mixes Measured value Predicted value Equation 8 ACI CEB
OPC 59 5 59 5 68 9 811 SF6 51 518 65 8 74 5 SFIO 45 9 45 7 64 8 721 SF15 417 366 642 699
Error coefficient () --shy 60 366 526
Table 3 Specific creep of specimens loaded at the age of 28 days after 376 days of loading (microstrainlMPa)
Concrete mixes Measured value Predicted value Equation 8 ACI CEB
OPC 413 446 515 624 SF6 40 7 389 48 7 568 SFIO 381 344 47 8 55 SFI5 328 276 46 9 534
Error coefficient () --shy 89 27 2 47 8
Table 4 I elgl t specimens a fter 5 7 days of drying (microstrain) Shrnkage 0 f80270 mm h h 8
Concrete mixes Measured value Predicted value Equation 16 ACI CEB
OPC 532 505 604 452
SF6 528 504 604 412 SFIO 523 503 604 397 SFl5 512 501 604 382
Error coefficient () --shy 40 154 225
fd ( )Table 5 Shrinkage 0 f150300 mm helght specunens a fter 406 d ays 0 1rymg mlcrostram
Concrete mixes Measured value Predicted value Equation 16 ACI CEB
oPC 468 445 554 409 SF6 462 443 554 373 SFIO 446 442 554 359 SFl5 435 44] 554 346
Error coefficient () --shy 31 233 182
5 Conclusions
From the results presented in this paper the main conclusions are I In high-strength concrete the proposed equations for predicting creep and shrinkage are more exact
than the ones suggested by the ACI and CEB 2 The total creep of high-strength concrete specimens investigated here decreased as the level of silica
fume replacement increased 3 Drying creep (total creep-basic creep) was negligible in this research therefore the specimen size and
the relative humidity of the atmosphere were not considered in the proposed creep model 4 Silica fume did not affect the total shrinkage but as the proportion of silica fume increased the
autogenous shrinkage of high-strength concrete increased
371
References
[I] Gardner NJ and Zhao 1W Creep and shrinkage revisited AC1 Materials Journal 90 3 May-June 1993 236-245 [2] Neville AM Dilger WH and Brooks J1 Creep ofplain and structural concrete Construction Press London and New York 1983 [3] Branson DE Meyers BL and Kripanarayanan KM Time dependent defonnation of non-composite and composite sand-lightweight prestressed concrete structures Lowa Highway Commission research report No 69-1 Project No HR-13 7 Phase 1 report Lowa City University of Lowa 1969 [4] Shah SP and Ahmad SH High performance concrete and applications Edvard Arnold London 1994 [5] Neville AM Properties ofconcrete Longman Edinburgh 1995 [6] Khan AA Cook WD Mitchell D Creep shrinkage and thennal strains in nonnal medium and highshystrength concretes during hydration AC1 Materials Journal 94 2 March-April 1997 156-163 [7] ACI Committee 209 Prediction of creep shrinkage and temperature effects in concrete structures AC1 Manual ofconcrete practice Part I 1997 209R 1-92 [8] CEB-FIP Model Code for Concrete Structures 1990 Evaluation of the time dependent behavior of concrete Bulletin dlnformation No 199 Comie European du BetonFederation 1nternationale de la Precontrainte Lausarme 199 I
[9] Bissormette B Pierre P and Pigeon M Influence of key parameters on drying shrinkage ofcementitious materials Cement and Concrete Research 29 1999 1655-1662 [10] De Larrard F Ithurralde G Acker P and Chauvel D High perfonnance concrete for a nuclear containment Proceedings Second International Symposium on Utilization of High-Strength Concrete Berkley ACI SP 1990 121-127 [II] Persson BSM Shrinkage of high perfonnance concrete Proceedings International Workshop on Autogenous Shrinkage of Concrete Japan Concrete Institute Hiroshima June 1998 10 1-118 [12] Le Roy R and De Larrard F Creep and shrinkage of high-perfonnance concrete the LCPC experience The Fifth International RILEM Symposium on Creep and Shrinkage of Concrete E amp FN Spon London 1993 499-504 [13] Jensen OM and Hansen PF Influence of temperature on autogenous defonnation and relative humidity change in hardening cement paste Cement and Concrete Research 29 1999 567-575 [14] Mak SL Ritchie DTaylor A and Diggins R Temperature effects on early age autogenous shrinkage in high performance concretes Proceedings International Workshop on Autogenous Shrinkage of Concrete Japan Concrete Institute Hiroshima June 1998 153-162
372