theoretical investigation of the time-dependent behaviour of rockfill
TRANSCRIPT

Oldecop, L. A. & Alonso, E. E. (2007). Geotechnique 57, No. 3, 289–301
289
Theoretical investigation of the time-dependent behaviour of rockfill
L. A. OLDECOP�
and E. E. ALONSOy
Long-term strain records obtained in large-diameteroedometer tests on compacted gravels demonstrated thatstrains could be linearly related with the logarithm oftime. Delayed compressibility coefficients were found pro-portional to the conventional stress-induced compressibil-ity coefficients. A framework rooted on the phenomenonof crack propagation in rock particles induced by stresscorrosion mechanisms is adopted to explain macroscopicobservations. A model of crack propagation in loadeddisc-shaped particles has been developed in order toexplain the nature of particle breakage and its relation-ship with time, macroscopic stress and total suction.Experimental observations such as the existence ofthreshold stresses that mark the onset of delayed defor-mations are explained by the model. It was also foundthat the main features of the delayed deformation ofrockfill could be physically explained within the devel-oped framework. In particular, a simple closed-formrelationship between the coefficient of delayed deforma-tion, the compressibility coefficient and a parameterdescribing the rate of crack propagation could be found.It was found to be consistent with experimental observa-tions.
KEYWORDS: creep; gravels; particle crushing/crushability;suction; time dependence
Grace aux enregistrements long-termes des contraintesobtenus dans des essais a l’oedometre de large diametresur des graviers compactes, on a montre que les contra-intes pouvaient etre reliees au logarithme du temps demaniere lineaire. On a aussi trouve que les coefficients decompressibilite retardee etaient proportionnels aux coeffi-cients de compressibilite conventionnelle (ou la compres-sibilite est induite par une contrainte). Pour expliquer lesobservations macroscopiques, on a adopte un cadre basesur le phenomene de propagation des fissures dans lesparticules rocheuses, induit par des mecanismes de corro-sion sous contrainte. On a developpe un modele depropagation des fissures dans les particules discoıdescomprimees pour expliquer la nature de la rupture desparticules et sa relation avec le temps, la contraintemacroscopique et l’aspiration totale. Le modele expliqueles observations experimentales telles que l’existence decontraintes de seuil marquant le debut des deformationsretardees. On a aussi trouve qu’au sein du cadre devel-oppe on pouvait expliquer physiquement les caracteris-tiques principales de la deformation retardee del’enrochement. En particulier, on a trouve une relationde forme fermee simple entre le coefficient de deforma-tion retarde, le coefficient de compressibilite et un para-metre decrivant le taux de propagation des fissures. Ceresultat correspondait a nos observations experimentales.
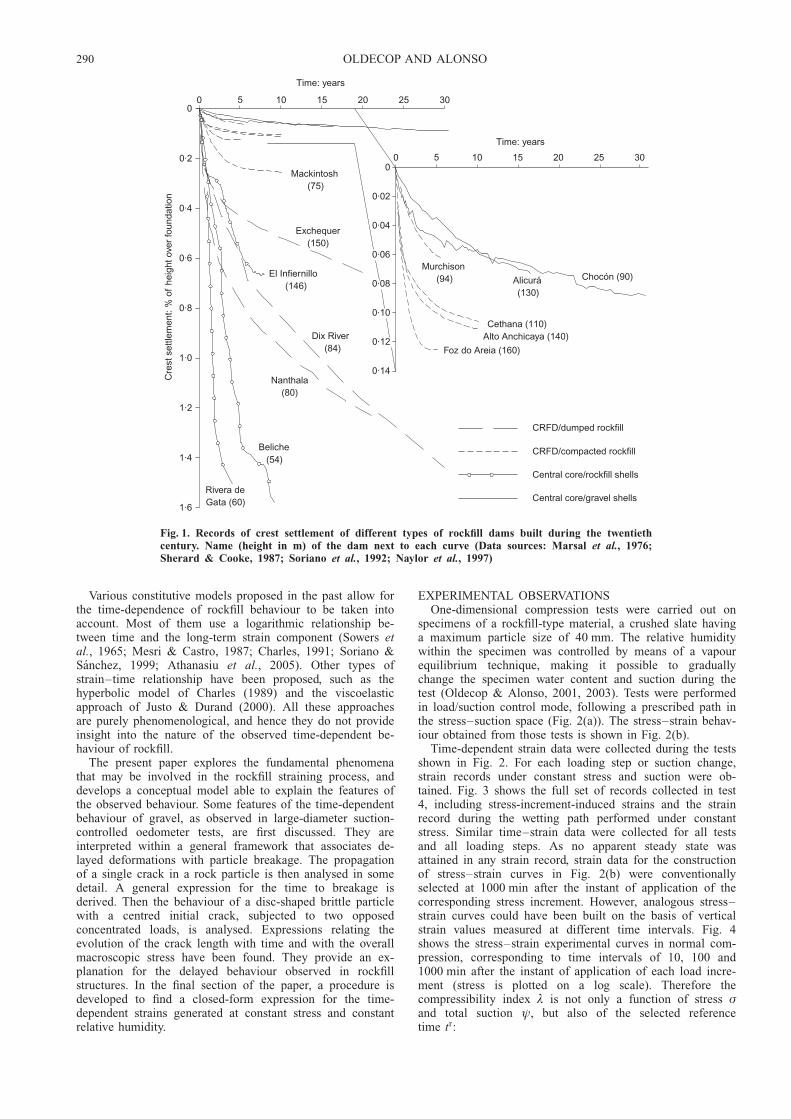
INTRODUCTIONRockfill shows a significant time-dependent behaviour. Con-tinuous settlements have been recorded in rockfill dams aftertheir construction, and for many decades (Sowers et al.,1965; Marsal, 1976; Sherard & Cooke, 1987). The crestsettlement records of some dams built during the twentiethcentury are shown in Fig. 1.
Dams are classified in four groups. Old concrete-facedrockfill dams (CFRD) made of dumped rockfill withoutcompaction usually undergo large amounts of settlement,exceeding 1% of the height. In turn, modern CFRDs show anoticeable effect of compaction, and the magnitude of post-construction settlements is reduced. The typical behaviour ofcentral clay core dams with rockfill shells involves theoccurrence of sudden settlement episodes during the firstfilling of the reservoir. This is related to the flooding of therockfill in the upstream shell, a situation that is avoided inconcrete-faced dams. This phenomenon is called ‘collapse’deformation. Finally, dams with gravelly shells typicallyshow very small post-construction settlements. This is attrib-uted to the good gradation of the grain sizes and the
rounded shape of the gravel particles, preventing particlebreakage and leading to a less compressible material.
The common factor in all these records is that thedeformation process continues for many years. Data shownin Fig. 1 suggest that in most dams the deformation processis still active after 10, 20 or 30 years of operation. In fact,most of the settlement records approach a linear logarithmicrelationship between strain and time, and this would meanthat the involved straining process is endless, although therate of deformation continuously decreases with time.
Post-construction deformations of rockfill structures maybe more or less relevant for their performance and safety,depending on the purpose of the structure and its nature.Post-construction settlements in rockfill dams usually do notpose a real threat for the structure or present problems forits operability. Pathological cases, such as the Ataturk Damin Turkey (Cetin et al., 2000), which had lost almost all ofits projected freeboard in the first five years after reservoirfilling, are rare in dam engineering.
On the other hand, the operability and safety of railwaysimpose tight limits for post-construction settlements of thesupporting embankments (particularly those supporting high-speed railways). In any case, an understanding of the natureof the time-dependent deformations should be helpful ininterpreting the behaviour of real rockfill structures andmonitoring records. Time-dependent strains are commonlysuperposed on other sources of deformation driven by ex-ternal actions, such as rainfall, flooding, repeated loading,and earthquakes. It is, indeed, by means of a thoroughknowledge of the physical and chemical processes takingplace within the structure that safety monitoring records canbe interpreted, avoiding misleading conclusions.
Manuscript received 23 December 2005; revised manuscriptaccepted 9 January 2007.Discussion on this paper closes on 1 September 2007, for furtherdetails see p. ii.�
Earthquake Engineering Institute (IDIA), Universidad Nacional deSan Juan, Argentina.y Department of Geotechnical Engineering and Geosciences, Uni-versitat Politecnica de Catalunya, Barcelona, Spain.
Various constitutive models proposed in the past allow forthe time-dependence of rockfill behaviour to be taken intoaccount. Most of them use a logarithmic relationship be-tween time and the long-term strain component (Sowers etal., 1965; Mesri & Castro, 1987; Charles, 1991; Soriano &Sanchez, 1999; Athanasiu et al., 2005). Other types ofstrain–time relationship have been proposed, such as thehyperbolic model of Charles (1989) and the viscoelasticapproach of Justo & Durand (2000). All these approachesare purely phenomenological, and hence they do not provideinsight into the nature of the observed time-dependent be-haviour of rockfill.
The present paper explores the fundamental phenomenathat may be involved in the rockfill straining process, anddevelops a conceptual model able to explain the features ofthe observed behaviour. Some features of the time-dependentbehaviour of gravel, as observed in large-diameter suction-controlled oedometer tests, are first discussed. They areinterpreted within a general framework that associates de-layed deformations with particle breakage. The propagationof a single crack in a rock particle is then analysed in somedetail. A general expression for the time to breakage isderived. Then the behaviour of a disc-shaped brittle particlewith a centred initial crack, subjected to two opposedconcentrated loads, is analysed. Expressions relating theevolution of the crack length with time and with the overallmacroscopic stress have been found. They provide an ex-planation for the delayed behaviour observed in rockfillstructures. In the final section of the paper, a procedure isdeveloped to find a closed-form expression for the time-dependent strains generated at constant stress and constantrelative humidity.
EXPERIMENTAL OBSERVATIONSOne-dimensional compression tests were carried out on
specimens of a rockfill-type material, a crushed slate havinga maximum particle size of 40 mm. The relative humiditywithin the specimen was controlled by means of a vapourequilibrium technique, making it possible to graduallychange the specimen water content and suction during thetest (Oldecop & Alonso, 2001, 2003). Tests were performedin load/suction control mode, following a prescribed path inthe stress–suction space (Fig. 2(a)). The stress–strain behav-iour obtained from those tests is shown in Fig. 2(b).
Time-dependent strain data were collected during the testsshown in Fig. 2. For each loading step or suction change,strain records under constant stress and suction were ob-tained. Fig. 3 shows the full set of records collected in test4, including stress-increment-induced strains and the strainrecord during the wetting path performed under constantstress. Similar time–strain data were collected for all testsand all loading steps. As no apparent steady state wasattained in any strain record, strain data for the constructionof stress–strain curves in Fig. 2(b) were conventionallyselected at 1000 min after the instant of application of thecorresponding stress increment. However, analogous stress–strain curves could have been built on the basis of verticalstrain values measured at different time intervals. Fig. 4shows the stress–strain experimental curves in normal com-pression, corresponding to time intervals of 10, 100 and1000 min after the instant of application of each load incre-ment (stress is plotted on a log scale). Therefore thecompressibility index º is not only a function of stress �and total suction ł, but also of the selected referencetime tr:
30
30
Mackintosh(75)
Exchequer(150)
El Infiernillo(146)
Dix River(84)
Nanthala(80)
Beliche(54)
Rivera deGata (60)
Chocón (90)
Time: years
Alicurá(130)
Murchison(94)
Cethana (110)Alto Anchicaya (140)
Foz do Areia (160)
Cre
st s
ettle
men
t: %
of
heig
ht o
ver
foun
datio
n
CRFD/dumped rockfill
0
20
20
5
5
10
10
Time: years
15
15
25
25
00
0·2
0·4
0·6
0·8
1·0
1·2
1·4
1·6
0
0·02
0·04
0·06
0·08
0·10
0·12
0·14
CRFD/compacted rockfill
Central core/rockfill shells
Central core/gravel shells
Fig. 1. Records of crest settlement of different types of rockfill dams built during the twentiethcentury. Name (height in m) of the dam next to each curve (Data sources: Marsal et al., 1976;Sherard & Cooke, 1987; Soriano et al., 1992; Naylor et al., 1997)
290 OLDECOP AND ALONSO

º � , ł, trð Þ ¼ d�(ł, tr¼constant)
d ln�ð Þ (1)
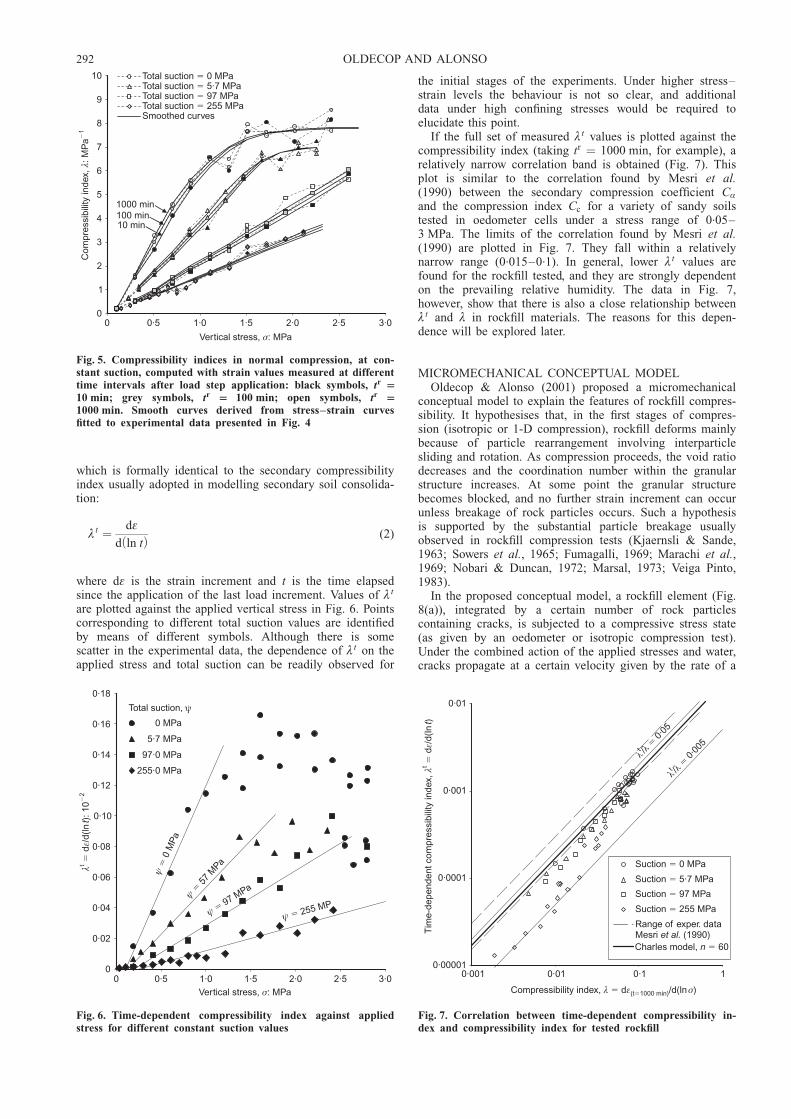
Values of the compressibility index along the normal com-pression curves were derived from the datasets shown in Fig.4. These values are plotted in Fig. 5 against the appliedvertical stress. The derivative operation applied to the ex-perimental data leads to the irregularities shown in thefigure. However, if smooth curves are fitted to the experi-mental data in Fig. 4 the resulting compressibility curvesshow the regular shape also indicated in Fig. 5.
It is seen in Fig. 5 that, during the first stage, thecompressibility index increases almost linearly with theapplied stress, which means a linear stress–strain behaviour.In the second stage, the compressibility index tends to aconstant value (that is, a linear strain-log stress normalcompression line is approached). Analogous behaviour canbe observed in the experimental data presented by Nakata etal. (2001), obtained from oedometer tests on three differentnatural sands with various formation void ratios. Moreover,the data in Fig. 5 show that the compressibility index alsodepends on total suction and, in a not so marked manner, onthe reference time. It is also noted that, for increasingsuction values, a narrower variation of the compressibilityindex with the reference time is obtained.
In the strain–time records of Fig. 3 it can be seen that,after a relatively short transient period (in most cases shorter
than 10 min), every strain record approaches a linear strain–log time relationship. A logarithmic function was fitted tothe long-term part (t . 100 min) of these records. In thisway, a time-dependent compressibility index was computed,
(a)
(b)
0·01
0·1
1
10
100
1000
Vertical stress, : MPaσ
Tota
l suc
tion
atm
. pre
ss.:
MP
a�
�1
0
1
2
3
4
5
6
7
8
9
10
11
12
13
Ver
tical
str
ain,
: %ε
Test 1
Test 2
Test 3
Test 4
3
1
0
0
0·5
0·5
1·0
1·0
1·5
1·5
2·0
2·0
2·5
2·5
3·0
3·0
Fig. 2. One-dimensional compression tests with relative humid-ity control: (a) test paths in stress–suction space; (b) stress–strain curves with strain values measured at 1000 min afterapplication of each load increment (Oldecop & Alonso, 2003)
0·01 0·1 1 10 100 1000 10000 100000
2·42 MPa
Applied vertical stress 0·19 MPa�
0·27 MPa
0·41 MPa
0·60 MPa
0·80 MPa
0·98 MPa
1·18 MPa
1·37 MPa
1·57 MPa
1·77 MPa
1·96 MPa
2·16 MPa
2·35 MPa2·42 MPa
2·55 MPa
2·79 MPa
0
1
2
3
4
5
6
7
8
9
10
11
12
13
Time: min
Ver
tical
str
ain,
: %εWetting under
constant stress
5·7 0 MPaψ� →
Loadingunder
constantsuction
5·7 MPa
ψ �
Loading under constant
suction, 0 MPaψ �
Fig. 3. Strain records obtained in each load step (underconstant stress) of oedometer test 4
0·1 1 100
1
2
3
4
5
6
7
8
9
10
11
12
13
Vertical stress: MPa
Ver
tical
str
ain:
%
0·0 MPa
5·7 MPa
97·0 MPa
255·0 MPa
Fitted curves
Experimentaldata
Total suction
Fig. 4. Strain–stress curves measured at different time intervalsafter each load step application: black symbols, tr 10 min;grey symbols, tr 100 min; open symbols, tr 1000 min
THEORETICAL INVESTIGATION OF THE TIME-DEPENDENT BEHAVIOUR OF ROCKFILL 291
which is formally identical to the secondary compressibilityindex usually adopted in modelling secondary soil consolida-tion:
º t ¼ d�
d ln tð Þ (2)
where d� is the strain increment and t is the time elapsedsince the application of the last load increment. Values of º t
are plotted against the applied vertical stress in Fig. 6. Pointscorresponding to different total suction values are identifiedby means of different symbols. Although there is somescatter in the experimental data, the dependence of º t on theapplied stress and total suction can be readily observed for
the initial stages of the experiments. Under higher stress–strain levels the behaviour is not so clear, and additionaldata under high confining stresses would be required toelucidate this point.
If the full set of measured º t values is plotted against thecompressibility index (taking tr ¼ 1000 min, for example), arelatively narrow correlation band is obtained (Fig. 7). Thisplot is similar to the correlation found by Mesri et al.(1990) between the secondary compression coefficient CÆ
and the compression index Cc for a variety of sandy soilstested in oedometer cells under a stress range of 0.05–3 MPa. The limits of the correlation found by Mesri et al.(1990) are plotted in Fig. 7. They fall within a relativelynarrow range (0.015–0.1). In general, lower º t values arefound for the rockfill tested, and they are strongly dependenton the prevailing relative humidity. The data in Fig. 7,however, show that there is also a close relationship betweenº t and º in rockfill materials. The reasons for this depen-dence will be explored later.
MICROMECHANICAL CONCEPTUAL MODELOldecop & Alonso (2001) proposed a micromechanical
conceptual model to explain the features of rockfill compres-sibility. It hypothesises that, in the first stages of compres-sion (isotropic or 1-D compression), rockfill deforms mainlybecause of particle rearrangement involving interparticlesliding and rotation. As compression proceeds, the void ratiodecreases and the coordination number within the granularstructure increases. At some point the granular structurebecomes blocked, and no further strain increment can occurunless breakage of rock particles occurs. Such a hypothesisis supported by the substantial particle breakage usuallyobserved in rockfill compression tests (Kjaernsli & Sande,1963; Sowers et al., 1965; Fumagalli, 1969; Marachi et al.,1969; Nobari & Duncan, 1972; Marsal, 1973; Veiga Pinto,1983).
In the proposed conceptual model, a rockfill element (Fig.8(a)), integrated by a certain number of rock particlescontaining cracks, is subjected to a compressive stress state(as given by an oedometer or isotropic compression test).Under the combined action of the applied stresses and water,cracks propagate at a certain velocity given by the rate of a
Vertical stress, : MPaσ
0
1
2
3
4
5
6
7
8
9
10C
ompr
essi
bilit
y in
dex,
: MP
aλ
�1
Total suction 0 MPa�Total suction 5·7 MPa�Total suction 97 MPa�Total suction 255 MPa�Smoothed curves
1000 min100 min10 min
0 0·5 1·0 1·5 2·0 2·5 3·0
Fig. 5. Compressibility indices in normal compression, at con-stant suction, computed with strain values measured at differenttime intervals after load step application: black symbols, tr
10 min; grey symbols, tr 100 min; open symbols, tr
1000 min. Smooth curves derived from stress–strain curvesfitted to experimental data presented in Fig. 4
0
λε
t2
d/d
(ln):
10
�t
�
ψ0
MP
a
�
ψ�
57M
Pa
.
ψ �97 MPa
ψ � 255 MP
0·02
0·04
0·06
0·08
0·10
0·12
0·14
0·16
0·18
Vertical stress, : MPaσ
0 MPa
5·7 MPa
97·0 MPa
255·0 MPa
Total suction, ψ
0 0·5 1·0 1·5 2·0 2·5 3·0
Fig. 6. Time-dependent compressibility index against appliedstress for different constant suction values
0·001 0·01 0·1 1
λλt /
0·05
�
λλt /
0·00
5
�
0·00001
0·0001
0·001
0·01
Compressibility index, d /d(ln )λ ε σ� (t 1000 min)�
Tim
e-de
pend
ent c
ompr
essi
bilit
y in
dex,
d/d
(ln)
λε
t�
t
Suction 0 MPa�
Suction 5·7 MPa�
Suction 97 MPa�
Suction 255 MPa�
Range of exper. dataMesri (1990)et al.Charles model, 60n �
Fig. 7. Correlation between time-dependent compressibility in-dex and compressibility index for tested rockfill
292 OLDECOP AND ALONSO

chemical reaction at the crack tip, known as stress corrosion(Wiederhorn et al., 1980; Freiman, 1984). Crack propagationeventually leads to the breakage of rock particles and to theconsequent rearrangement of the granular structure in orderto reach a new equilibrium configuration. Each of theserearrangements involves a macroscopic strain increment.Hence, upon blockage of the granular structure, the strainingprocess of rockfill becomes controlled by the stress corrosionphenomenon. As stress corrosion causes the cracks to propa-gate at a finite velocity, and its value depends on the waterenergy, a dependence of rockfill deformations on time andrelative humidity is expected.
In stress corrosion, the stress state at the crack tipenhances the corrosion reaction between the rock speciesand the water filling the crack. The stress state in thevicinity of the crack tip is characterised by the stressintensity factor, which in linear elastic fracture mechanics(Broek, 1986) is defined as
Ki ¼ �i��i
ffiffiffiffiffiffiffi�ai
p(3)
where ai is the half-length of crack i; �i is a non-dimen-sional factor that embodies the geometry of the particle, theposition of the crack, the direction and point of applicationof loads, and the relative size of the crack in relation to theparticle size; and ��i is the stress that would act across theplane of crack i if the particle was not cracked (Fig. 8(b)).
The stress ��i in equation (3) will depend on the macro-scopic stress � and on the current configuration of thegranular structure. It would be expected that increasing themacroscopic stress � would also increase the local stress ��ion most of the cracks contained in the rockfill element.Therefore the stress intensity factor in most cracks wouldtend to increase with increasing applied load. This view issupported by the load chain mechanisms of stress transmis-sion within granular materials (Cundall & Strack, 1979).Particles located in a force transmission path will be essen-tially loaded by two large opposed forces (and other smallerstabilising forces). The idealised loading scheme of Fig. 8(b)is perhaps a reasonable hypothesis for a representativeloaded rock particle within a granular aggregate.
The availability of water to produce the stress corrosionreaction is usually measured by means of the relativehumidity in the air surrounding the specimen. Within asystem in thermodynamic equilibrium, the relative humidityis biunivocally related to total suction ł by the psychro-metric relationship (Coussy, 1995). Therefore total suction isalso a suitable variable for measuring the action of water oncrack propagation.
Data obtained from stress corrosion experiments areusually plotted as crack velocity V against stress intensityfactor K under constant RH (or constant ł). The typicalshape of such stress corrosion curves is schematically shownin Fig. 9(a). Two singular values of K can be identified. KC
is known as the fracture toughness, and with some limit-ations can be considered as a material property (Broek,1986). As the stress intensity factor K exceeds KC the crackpropagates in a catastrophic manner: that is, the piececontaining the crack suddenly breaks off. K0 is known as thestress corrosion limit. For values of K smaller than K0 thecorrosion reaction arrests, and cracks do not propagate atall. Cracks falling in the interval K0 , K , KC will propa-gate with a finite velocity V. Atkinson (1984) published anextensive compilation of stress corrosion experimental datafor various minerals and rocks (Fig. 9(b)).
Charles (1958) proposed a simple expression for fittingstress corrosion experimental data, used here in a modifiedform, to make it dimensionally correct:
V ¼ V0
K
KC
� �n
(4)
This equation has no physico-chemical fundamentals, foundin later and more elaborated models (Wiederhorn et al.,1980, 1982). It is a pure phenomenological model. V0 and nare the parameters of the Charles equation, usually obtainedby fitting experimental data. It is usual practice in fracturemechanics to consider V0 and n as material properties. Equa-tion (4) fits the experimental data well, at least in the so-called zone 1 of crack propagation (see Fig. 9(a)), and thisis shown in Fig. 9(b), where a set of curves for variousvalues of n is plotted against experimental data collected inzone 1 of the crack velocity diagram. In zone 1, crackpropagation occurs as a result of the stress corrosion reac-tion referred to above. Other zones (2 and 3) are identifiedin some experimental datasets (Freiman, 1984). In zone 2the propagation velocity becomes nearly constant, whichsuggests that the controlling mechanism is diffusion of thecorrosive species (water vapour) along the crack length. Inzone 3 water cannot reach the tip of the crack, becausepropagation occurs too rapidly, and hence the V(K) curvedoes not display any dependence on the RH. Experimentaldata, such as those shown in Fig. 9(b), suggest that stresscorrosion curves under different RH values are nearly paral-lel (Wiederhorn et al., 1980): that is, the parameter n doesnot depend on the RH for a usual range of values (say RH
σ
σ
σ σh ~ σ σh ~
P
(a)
P
(b)
σi
σi
Fig. 8. (a) Rockfill element formed by rock particles containingmacro- and microcracks and flaws; (b) rock particle subjectedto contact loads
THEORETICAL INVESTIGATION OF THE TIME-DEPENDENT BEHAVIOUR OF ROCKFILL 293
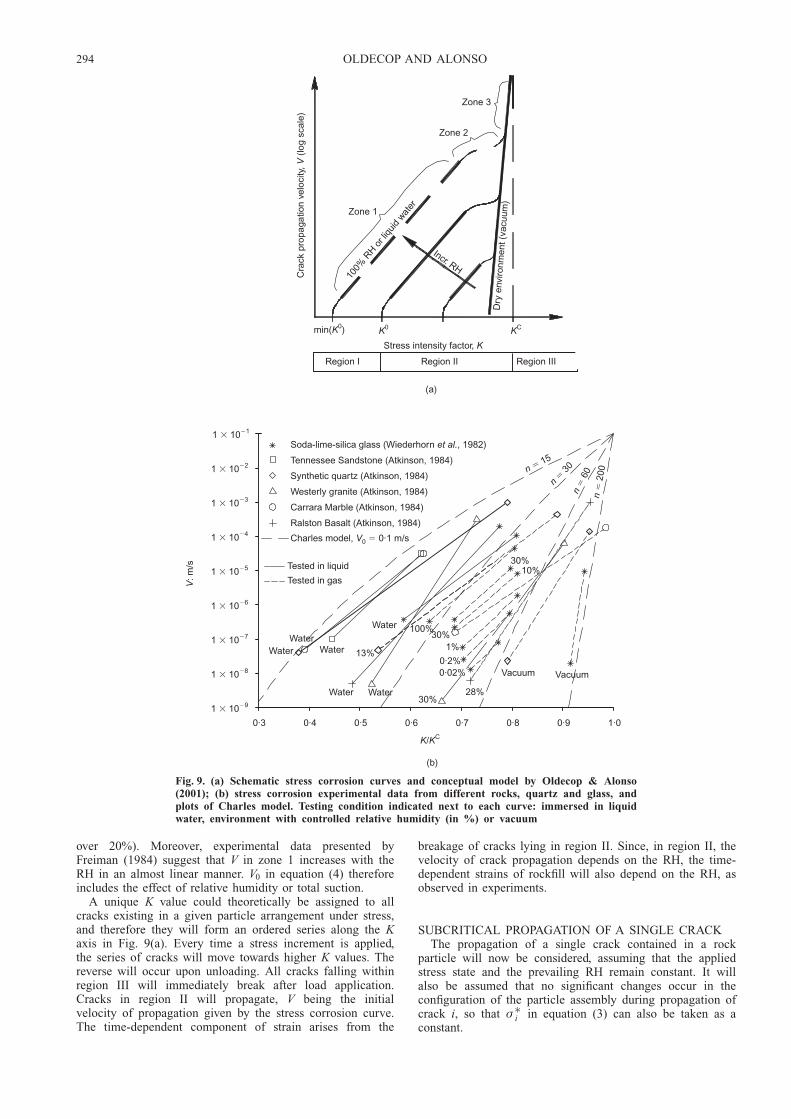
over 20%). Moreover, experimental data presented byFreiman (1984) suggest that V in zone 1 increases with theRH in an almost linear manner. V0 in equation (4) thereforeincludes the effect of relative humidity or total suction.
A unique K value could theoretically be assigned to allcracks existing in a given particle arrangement under stress,and therefore they will form an ordered series along the Kaxis in Fig. 9(a). Every time a stress increment is applied,the series of cracks will move towards higher K values. Thereverse will occur upon unloading. All cracks falling withinregion III will immediately break after load application.Cracks in region II will propagate, V being the initialvelocity of propagation given by the stress corrosion curve.The time-dependent component of strain arises from the
breakage of cracks lying in region II. Since, in region II, thevelocity of crack propagation depends on the RH, the time-dependent strains of rockfill will also depend on the RH, asobserved in experiments.
SUBCRITICAL PROPAGATION OF A SINGLE CRACKThe propagation of a single crack contained in a rock
particle will now be considered, assuming that the appliedstress state and the prevailing RH remain constant. It willalso be assumed that no significant changes occur in theconfiguration of the particle assembly during propagation ofcrack i, so that ��i in equation (3) can also be taken as aconstant.
KC
Region III
(b)
(a)
13%
30%
30%28%
Vacuum Vacuum
Water
Water
WaterWater
Water
Water
K K/ C
1 10� �9
1 10�8�
1 10�7�
1 10�6�
1 10�5�
1 10�4�
1 10�3�
1 10�2�
1 10�1�
V: m
/s
n15
�
n30
�
n60
�
n20
0�
Tennessee Sandstone (Atkinson, 1984)
Synthetic quartz (Atkinson, 1984)
Westerly granite (Atkinson, 1984)
Carrara Marble (Atkinson, 1984)
Ralston Basalt (Atkinson, 1984)
Soda-lime-silica glass (Wiederhorn , 1982)et al.
Charles model, 0·1 m/sV0 �
100%
30%10%
1%
0·2%0·02%
Tested in liquid
Tested in gas
K0
Region IIRegion I
Cra
ck p
ropa
gatio
n ve
loci
ty,
(log
scal
e)V
Stress intensity factor, K10
0%RH
orliq
uid
water
Dry
envi
ronm
ent (
vacu
um)
min( )K0
Incr. RH
Zone 1
Zone 2
Zone 3
0·3 0·4 0·5 0·6 0·7 0·8 0·9 1·0
Fig. 9. (a) Schematic stress corrosion curves and conceptual model by Oldecop & Alonso(2001); (b) stress corrosion experimental data from different rocks, quartz and glass, andplots of Charles model. Testing condition indicated next to each curve: immersed in liquidwater, environment with controlled relative humidity (in %) or vacuum
294 OLDECOP AND ALONSO

Replacing equation (3) in equation (4), the followingexpression for the propagation velocity of crack i as afunction of crack length is obtained.
Vi ¼dai
dt¼ Aia
n=2i (5)
where Ai ¼ V0(�i��iffiffiffi�
p=KC)n. As will be shown later, it is
reasonable to assume that the factor �i remains nearlyconstant during most of the propagation time of crack i.Only when the breakage of the particle is approached does�i increase rapidly. Hence Ai also remains nearly constant.Inverting equation (5) and integrating, the following relation-ship between time and crack length is obtained (see Appen-dix).
t ¼ 1
Ai
2
n � 2a�( (n=2)�1)0i � a
�( (n=2)�1)i
� �(6)
where a0 i is the initial crack half-length, that is, the cracklength at the time of load application. The crack half-lengthai increases during crack growth. As common values of n,obtained from experiments, are large (between 15 and 200:see Fig. 9(b)), as the breakage of the crack i is approached,the second term within the parentheses becomes negligible ifcompared with the first term, and t ! tb
i , where tbi is the
time elapsed between the instant of load application and thebreakage of the considered crack. Hence
tbi ¼
1
Ai
2
n � 2a�( (n=2)�1)0i ¼ 2
n � 2
a0i
V0i
(7)
where
V0i ¼ V0 �i� i
ffiffiffiffiffiffiffiffiffi�a0i
p=KC
� �n(8)
is the propagation velocity of a crack of half-length a0 i.Equation (7) states that a one-to-one relationship exists
between the time to breakage for a single crack and itsinitial length. It could be a surprising fact that, as seems tofollow from equation (7), the time to breakage does notdepend on the size of the body containing the crack (that is,the rock particle). In other words, equation (7) does notaccount for the length of the path to be followed by thecrack until the edges of the rock particle are reached. Inorder to investigate this result, and to gain some insight intothe features of the propagation process for a small crackcontained in a particle, the following example was devel-oped.
A SIMPLE PARTICLE MODELConsider a disc of diameter D and thickness B, made of a
perfectly elastic-brittle material, containing a central crackgoing through the thickness of the disc (Fig. 10). The disc isloaded by two concentrated forces P, diametrically opposed.The crack is oriented in the same loading direction, and ithas a length of 2ai. The stress intensity factor characterisingthe stress state at the crack tips is given by equation (3),where �i is approximated by (Tada et al., 1985)
�i ¼1
1 � Æ(1 � 0:4964Æþ 1:5582Æ2 � 3:1818Æ3
þ 10:0962Æ4 � 20:7782Æ5 þ 20:1342Æ6 � 7:5067Æ7Þ(9)
where Æ ¼ 2ai/D. The stress ��i , across the crack plane, canbe computed from (ISRM, 1978)
��i ¼ 0:636P
DB(10)
The vertical ‘macroscopic’ stress equivalent to the concen-trated load P is given by
� ¼ P
DB¼ ��i
0:636(11)
Using this simple model, the propagation of cracks ofdifferent initial lengths can be analysed. Given a discdiameter D, the applied stress �, and the initial value for thecrack length ai(t ¼ 0), the corresponding instant values of�, K and V can be computed from equations (9), (3) and (4)respectively. Carrying out numerically the integration of
dai ¼ V Kið Þ dt (12)
the evolution of the crack length in time can be obtained.Fig. 11(a) shows the results obtained with such a model, fora disc 40 mm in diameter, loaded with �* ¼ 5 MPa (P ¼2 kN, � ¼ 7.87 MPa) and initial crack half-lengths a0 i ¼ 4,
P
PB
D2α
Fig. 10. Disc model for rock particle having central crack oflength 2ai
(a)
(b)
�
1 10 1001 10 100 1000
0
2
4
6
8
10
12
14
16
18
20
Time: minutes
Cra
ck h
alf-
leng
th,
: m
ma
1·0
0·9
0·8
0·7
0·6
0·5
0·4 1·0
1·1
1·2
1·3
1·4
1·5
Str
ess
inte
nsity
fact
or,
: MP
a.m
K1/
2
Dim
ensi
onle
ss fa
ctor
,�
� constant� variable
K, constant�K, variable�
days years
0·01 1 100 10000 1 10� 6 1 10� 8 1 10� 10
Fig. 11. Disc model with �* 5 MPa, results for different initialcrack lengths 4, 5, 6 and 7 mm: (a) evolution of crack length;(b) evolution of stress intensity factor and �
THEORETICAL INVESTIGATION OF THE TIME-DEPENDENT BEHAVIOUR OF ROCKFILL 295
5, 6 and 7 mm. Values for the parameters of the Charles lawV0 ¼ 0.1 m/s, n ¼ 60, were chosen, being well within therange of the experimental data shown in Fig. 9(b). Afracture toughness KC ¼ 1 MPa.m0:5 was selected fromvalues reported in the literature for sedimentary rocks(Atkinson, 1984).
The selected ‘macroscopic’ stress, � ¼ 7.87 MPa, in theprevious example is somewhat higher than the stress rangeapplied in the rockfill tests presented in Figs 2 and 4. Thisis justified by taking into account the unequal distribution ofcontact forces within a granular structure due to the stresstransmission by particle chains (Cundall & Strack, 1979).Particles pertaining to such load chains may bear forces (andstresses) significantly larger than the mean stress, applied onthe specimen boundaries. Nakata et al. (2001) compared theso-called ‘yield stress’ of sands compressed up to high stresslevels in oedometer tests with the crushing strength ofindividual particles compressed between two parallel platens.Nakata et al.’s yield stress is defined by the point of bendingof the virgin compression curve in an oedometer test, whenplotted with the stress axis in logarithmic scale and thestrain axis in natural scale. Although in the experimentaldata presented in Fig. 4 such bending occurs for a widerange of stress, the yield stress can be conventionallycomputed as the intersection of two tangent lines fitted tothe initial and final parts of the virgin compression curve.The test results obtained by Nakata et al. show that thecrushing strength of individual particles are between 2 and15 times the yield strength, for five sands with differentparticle sizes and different initial void ratios. On the basis ofthese observations, it seems likely that the stress levelselected for the disc model is representative of the actualstresses carried by the rockfill particles within the oedometertests presented in Figs 2 and 4.
The propagation process (Fig. 11) occurs in two stages.During the first stage, when the crack length is small com-pared with the particle diameter, the crack propagates slowlyand at a nearly constant rate. In the second stage thepropagation velocity suddenly increases, leading to crackbreakage in a very short period (always bearing in mind thatthe timescale is logarithmic in Fig. 11). Moreover, the factor� remains nearly constant for most of the propagationprocess, that is, during the slow stage (Fig. 11(b)) (exceptfor large cracks, having very short life). This was the mainassumption made in order to derive equation (11). Assumingthat � is constant during the whole breakage process leadsto an overestimation of the time to breakage tb
i , as can alsobe seen in Fig. 11(a). In the whole range of times in Fig.11, and certainly covering all periods of time of interest incivil engineering works, overestimation of the time to break-age made by applying equation (7) ranges from 68% (forthe 7 mm initial half-length crack) to 24% (for the 4 mminitial half-length crack). This means that the true time tobreakage can be obtained from equation (7) by applying acorrection factor � ¼ 0.6–0.81. For the sake of rigour thiscorrection factor will be included in the following deriva-tions, although it will be soon demonstrated that, given itsrange of values, it has no practical consequences in thegeneral formulation of the proposed model.
The evolution of crack propagation shown in Fig. 11explains why the time to breakage is essentially independentof the distance between the crack tip and the edges of therock particle, as explained by equation (7). In fact, once therate of crack propagation increases rapidly, the actual dimen-sions of the rock body are irrelevant in controlling the timeto breakage. The time to breakage is essentially controlledby the initial size of the crack (for a given tensile stressacting on the plane of the crack). It is also interesting tonote in Fig. 11 that a very wide range of values of time to
breakage is obtained under a constant applied stress for arelatively narrow range of initial crack lengths.
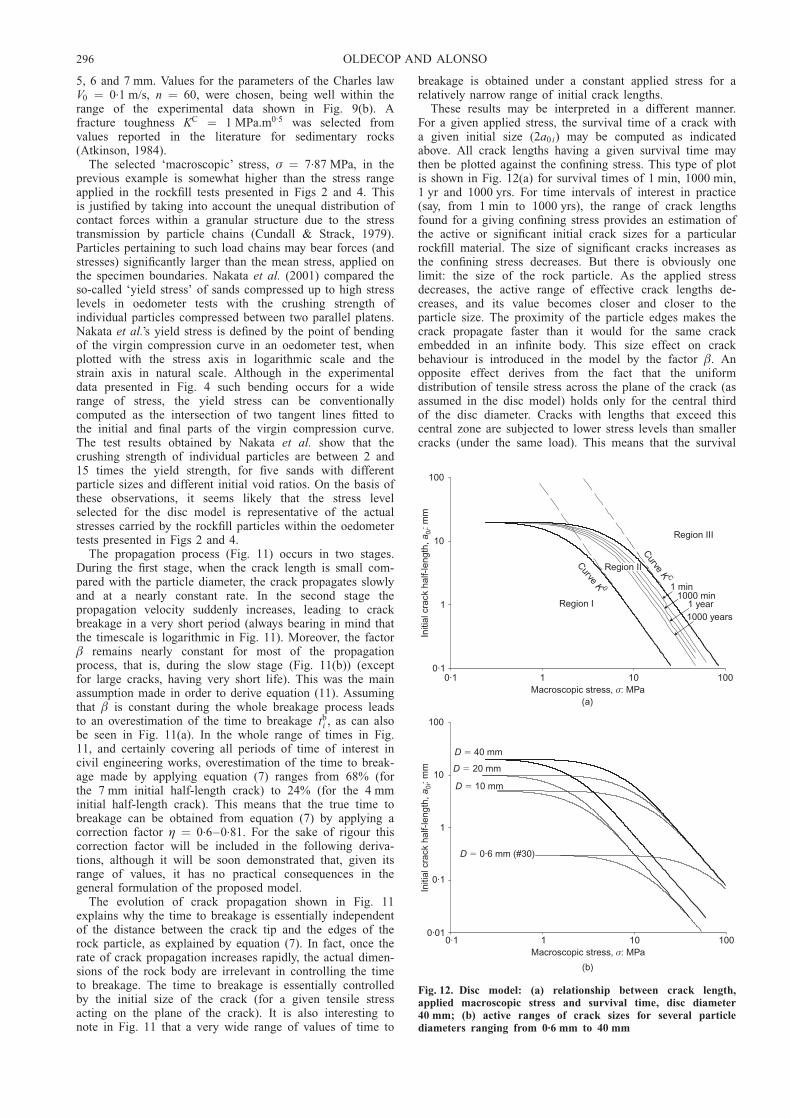
These results may be interpreted in a different manner.For a given applied stress, the survival time of a crack witha given initial size (2a0 i) may be computed as indicatedabove. All crack lengths having a given survival time maythen be plotted against the confining stress. This type of plotis shown in Fig. 12(a) for survival times of 1 min, 1000 min,1 yr and 1000 yrs. For time intervals of interest in practice(say, from 1 min to 1000 yrs), the range of crack lengthsfound for a giving confining stress provides an estimation ofthe active or significant initial crack sizes for a particularrockfill material. The size of significant cracks increases asthe confining stress decreases. But there is obviously onelimit: the size of the rock particle. As the applied stressdecreases, the active range of effective crack lengths de-creases, and its value becomes closer and closer to theparticle size. The proximity of the particle edges makes thecrack propagate faster than it would for the same crackembedded in an infinite body. This size effect on crackbehaviour is introduced in the model by the factor �. Anopposite effect derives from the fact that the uniformdistribution of tensile stress across the plane of the crack (asassumed in the disc model) holds only for the central thirdof the disc diameter. Cracks with lengths that exceed thiscentral zone are subjected to lower stress levels than smallercracks (under the same load). This means that the survival
0·1
0·1
1
1
10
10
100
100
(a)
(b)
Curve
K C
CurveK 0
0·1
1
10
100
Macroscopic stress, : MPaσ
Macroscopic stress, : MPaσ
Initi
al c
rack
hal
f-le
ngth
,: m
ma 0
iIn
itial
cra
ck h
alf-
leng
th,
: mm
a 0i
1000 years
1 min1000 min
Region III
Region II
Region I 1 year
0·01
0·1
1
10
100
D 40 mm�
D 20 mm�
D 10 mm�
D 0·6 mm (#30)�
Fig. 12. Disc model: (a) relationship between crack length,applied macroscopic stress and survival time, disc diameter40 mm; (b) active ranges of crack sizes for several particlediameters ranging from 0.6 mm to 40 mm
296 OLDECOP AND ALONSO

time of large cracks (larger than one third of the particlediameter) would be somewhat longer than predicted by themodel proposed here. Hence points pertaining to the curvedpart of the isochrones shown in Fig. 12 would lie somewhatto the right of the plotted curves. However, this effect doesnot invalidate the reasoning and conclusions regarding themodel results presented in Fig. 12.
On the other hand, the time to breakage for cracks withinthe active range (say with a0 i ¼ 1 to 8 mm in the examplesolved) may range from zero (instantaneous breakage) tomillions of years. This singular feature can be intuitivelyrelated with the observed fact that most rockfill dams displayan apparently indefinite process of settlement accumulationin time.
Two other curves have been plotted in Fig. 12(a). The KC
curve is given by the (a,�) values defining a stress intensityfactor (equation (3)) equal to KC (assuming KC ¼1 MPa.m1=2). The K0 curve corresponds to a stress intensityfactor equal to the stress corrosion limit K0. The stresscorrosion limit is assumed to be K0 ¼ 0.3KC on the basis oftheoretical considerations by Atkinson & Meredith (1987).
Three regions, which have the same meaning as in Fig.9(a), are defined by the curves plotted in Fig. 12(a). RegionII, between the K0 and KC curves, defines, for a givenapplied stress, the active range of crack lengths, that is, thecracks currently being propagated. The limits of region IIcan be more precisely established as the region limited bytwo limiting times (small and very large) to reach the crackfailure. As mentioned before, region II of active cracks tendsto vanish as the confining stress decreases. This means that,under low stresses, region II may not exist: that is, rockfillmay display a time-independent behaviour. This is indeedthe behaviour observed in load-controlled oedometer testscarried out by Oldecop & Alonso (2001). They defined a‘threshold stress’ that marks the onset of time-dependent andwater-dependent behaviour. For stress states below such athreshold, no particle breakage was detected, as follows fromFig. 12(a), and hence all the measured strain was induced byparticle rearrangement.
If the active range is computed for different ‘particlesizes’ (that is, disc diameters), it can be shown that thethreshold stress increases as the particle size decreases (Fig.12(b)). This means that the straining process of rockfill isaffected by a size effect. This is also an experimental fact. Itis well known that the breakage of rockfill occurs readilyunder relatively low stress levels. On the other hand, sandsmust be compressed under very high stresses in order toinduce particle breakage (Yamamuro & Lade, 1996).
RELATIONSHIP BETWEEN TIME TO BREAKAGE ANDSTRESS INTENSITY FACTOR
From equations (3), (7) and (8) the following relationshipcan be derived between the initial stress intensity factor K0 i,which characterises crack i at t ¼ 0, and the time tobreakage of the same crack.
K0i ¼2 a0i
n � 2ð ÞV0� tbi
� 1=n
KC (13)
If the simple disc model is assumed to be representative ofthe general nature of particle breakage phenomena occurringwithin the rockfill granular structure, Fig. 12(a) indicatesthat, for a given applied stress, the possible variation of thecrack length a0 i within the active range (region II) isrelatively narrow. Moreover, a0 i in equation (13) is affectedby a very small exponent (¼ 1/n, n being in the range 15–200: see Fig. 9(b)). Therefore, if a single reference length a0
is defined for an arbitrary time to breakage, tbi ¼ 1000 min,
it can be shown that the active crack sizes in Fig. 12(a) fulfilthe following condition along the whole range of stressesdisplayed.
a0i
a0
� �1=n
¼ 0:992–1:004 for a0 ¼ a(tbi ¼ 1000 min),
a0 i ¼ a(tbi ¼ 1 min to 1000 years), with n ¼ 60
Therefore the a0 i value in equation (13) may substitutedwith a small error by a single reference crack size a0. Inaddition, owing to the small values of the exponent 1/n, theactual influence of the correction factor � (¼ 0.6–0.81) inequation (13) can be neglected. Hence equation (13) be-comes
K ffi 2a0
n � 2ð ÞV0 t
� 1=n
KC (14)
In this relationship t is the time elapsed since the start ofthe applied load and the failure of the considered crack, andK is the initial stress intensity factor for that crack. As a0,V0, n and KC are constants, the time to breakage of a crackand its initial stress intensity factor are related by a uniquerelationship.
As a result, a new interpretation can be given to Fig. 9(a).The plot can be seen as the relationship between the initialvelocity of propagation of each crack contained in the rock-fill element, at the instant when such conditions of stressand suction are just applied, and the initial stress intensityfactor at the same crack under the newly applied conditions.As the time to breakage is univocally related to the initialvelocity of propagation, it can be stated that, once a certaintime tr has elapsed since the application of the current loadconditions, all cracks that had an initial stress intensityfactor larger than Kr, given by equation (14), are nowalready broken. The ‘crack r’ itself is at impending break-age, and the rest of the cracks are either still propagating (inregion II) or not propagating (region I). This interpretationleads to a model for the development of strains in time,described in the following section.
A MODEL FOR THE DEVELOPMENT OF TIME-DEPENDENT STRAIN UNDER CONSTANT STRESSAND SUCTION
At a given stage of deformation, the granular assemblyforming the rockfill element of Fig. 8(a) can be viewed as aunique body with a particular geometry. Then the tensilestress �i within a stressed particle will be proportional to theapplied macroscopic stress:
��i ¼ �i� (15)
where � is the applied (controlled) macroscopic stress, and�i is a proportionality constant. Replacing equation (15) inequation (3),
Ki ¼ ��i �ffiffiffiffiffiffiffi�ai
pwith ��i ¼ �i�i (16)
Of course, the factor �i will vary (and therefore also ��i )with the configuration of the particle assembly, and hence itwill change each time a particle breaks and a rearrangementof the granular structure occurs. However, as creep strainincrements during a single load step are relatively small, itseems reasonable to assume that the propagation and break-age of each crack occurs with no interaction with othercracks in the rockfill assembly. This means that the propaga-tion and breakage of crack i will not have any effect on thefactors �i and �* for the rest of the cracks.
THEORETICAL INVESTIGATION OF THE TIME-DEPENDENT BEHAVIOUR OF ROCKFILL 297
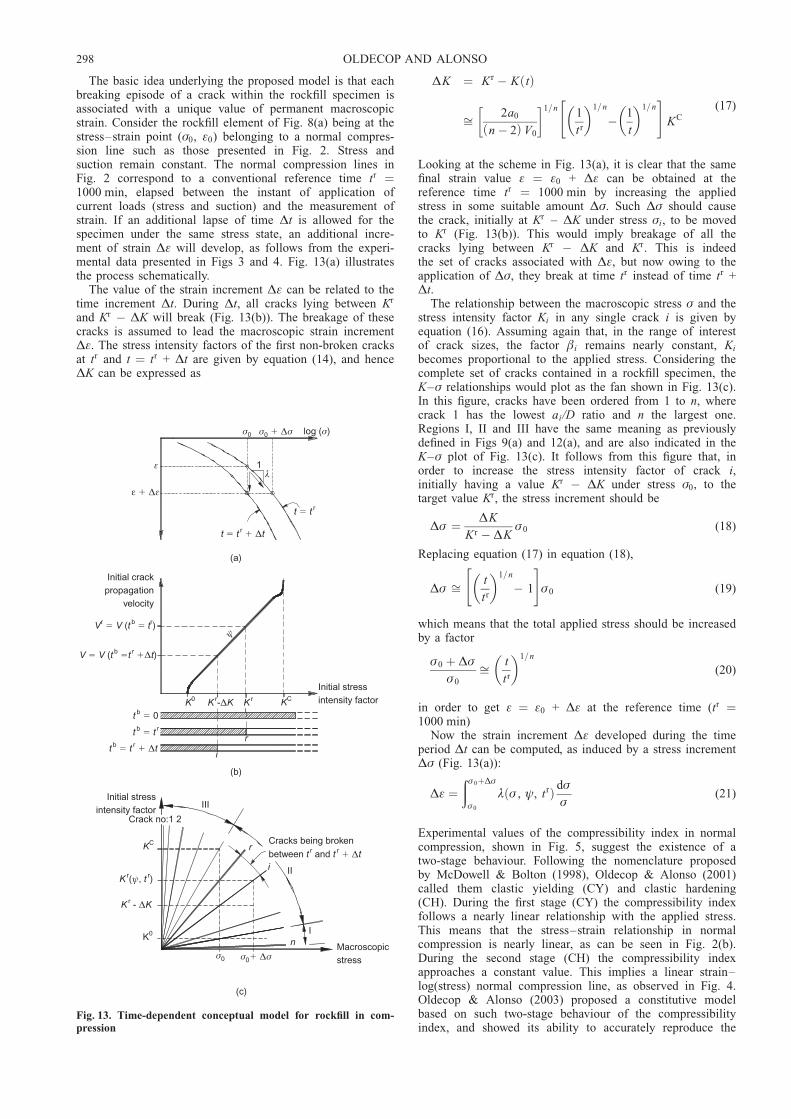
The basic idea underlying the proposed model is that eachbreaking episode of a crack within the rockfill specimen isassociated with a unique value of permanent macroscopicstrain. Consider the rockfill element of Fig. 8(a) being at thestress–strain point (�0, �0) belonging to a normal compres-sion line such as those presented in Fig. 2. Stress andsuction remain constant. The normal compression lines inFig. 2 correspond to a conventional reference time tr ¼1000 min, elapsed between the instant of application ofcurrent loads (stress and suction) and the measurement ofstrain. If an additional lapse of time ˜t is allowed for thespecimen under the same stress state, an additional incre-ment of strain ˜� will develop, as follows from the experi-mental data presented in Figs 3 and 4. Fig. 13(a) illustratesthe process schematically.
The value of the strain increment ˜� can be related to thetime increment ˜t. During ˜t, all cracks lying between Kr
and Kr � ˜K will break (Fig. 13(b)). The breakage of thesecracks is assumed to lead the macroscopic strain increment˜�. The stress intensity factors of the first non-broken cracksat tr and t ¼ tr + ˜t are given by equation (14), and hence˜K can be expressed as
˜K ¼ K r � K tð Þ
ffi 2a0
n � 2ð Þ V0
� 1=n1
tr
� �1=n
� 1
t
� �1=n" #
KC
(17)
Looking at the scheme in Fig. 13(a), it is clear that the samefinal strain value � ¼ �0 + ˜� can be obtained at thereference time tr ¼ 1000 min by increasing the appliedstress in some suitable amount ˜�. Such ˜� should causethe crack, initially at Kr – ˜K under stress �i, to be movedto Kr (Fig. 13(b)). This would imply breakage of all thecracks lying between Kr � ˜K and Kr. This is indeedthe set of cracks associated with ˜�, but now owing to theapplication of ˜�, they break at time tr instead of time tr +˜t.
The relationship between the macroscopic stress � and thestress intensity factor Ki in any single crack i is given byequation (16). Assuming again that, in the range of interestof crack sizes, the factor �i remains nearly constant, Ki
becomes proportional to the applied stress. Considering thecomplete set of cracks contained in a rockfill specimen, theK–� relationships would plot as the fan shown in Fig. 13(c).In this figure, cracks have been ordered from 1 to n, wherecrack 1 has the lowest ai/D ratio and n the largest one.Regions I, II and III have the same meaning as previouslydefined in Figs 9(a) and 12(a), and are also indicated in theK–� plot of Fig. 13(c). It follows from this figure that, inorder to increase the stress intensity factor of crack i,initially having a value Kr � ˜K under stress �0, to thetarget value Kr, the stress increment should be
˜� ¼ ˜K
K r � ˜K�0 (18)
Replacing equation (17) in equation (18),
˜� ffi t
tr
� �1=n
� 1
" #�0 (19)
which means that the total applied stress should be increasedby a factor
�0 þ ˜�
�0
ffi t
tr
� �1=n
(20)
in order to get � ¼ �0 + ˜� at the reference time (tr ¼1000 min)
Now the strain increment ˜� developed during the timeperiod ˜t can be computed, as induced by a stress increment˜� (Fig. 13(a)):
˜� ¼ð� 0þ˜�
� 0
º � , ł, trð Þ d�
�(21)
Experimental values of the compressibility index in normalcompression, shown in Fig. 5, suggest the existence of atwo-stage behaviour. Following the nomenclature proposedby McDowell & Bolton (1998), Oldecop & Alonso (2001)called them clastic yielding (CY) and clastic hardening(CH). During the first stage (CY) the compressibility indexfollows a nearly linear relationship with the applied stress.This means that the stress–strain relationship in normalcompression is nearly linear, as can be seen in Fig. 2(b).During the second stage (CH) the compressibility indexapproaches a constant value. This implies a linear strain–log(stress) normal compression line, as observed in Fig. 4.Oldecop & Alonso (2003) proposed a constitutive modelbased on such two-stage behaviour of the compressibilityindex, and showed its ability to accurately reproduce the
λ
KC
(a)
(b)
rKC
(c)
Crack no:1 2
I
II
III
K0
K tr r( , )ψ
n
i
σ0
Macroscopicstressσ σ0 ∆�
Cracks being broken
between andt tr r � ∆t
K Kr - ∆
Initial stressintensity factor
V V t tr b r( )� �
K0 K r
Initial crackpropagation
velocity
ψ
Initial stressintensity factorK Kr-∆
t b 0�
r
i
t tb r�
t t tb r� � ∆
V V t t t( )� � �b r ∆
σ0 log ( )σ
ε
ε ∆ε�
σ σ0 � ∆
1
t t t� �r ∆
t t� r
Fig. 13. Time-dependent conceptual model for rockfill in com-pression
298 OLDECOP AND ALONSO
experiments. Assuming a linear increase of the compressi-bility index with the applied stress during CY, and aconstant value during CH, the integral in equation (21) issolved, and results in
During CY:
˜� ffi º˜�
�0
(22)
During CH:
˜� ffi º ln�0 þ ˜�
�0
(23)
Replacing equations (19) and (20) in equations (22) and (23)respectively, expressions for the development of strain intime under constant stress conditions are obtained.
During CY:
� ffi ºt
tr
� �1=n
� 1
" #þ �0 (24)
During CH:
� ffi º
nln
t
trþ �0 (25)
Comparing equations (24) and (25), it can be seen that att ¼ tr both lead to the same value of strain, �0. The slope ofequation (24) (that is, the time-dependent compressibilityindex) is
During CY:
d�
dt¼ º
ntr
t
tr
� �(1=n)�1
¼ º
nt
t
tr
� �1=n
(26)
Hence at t ¼ tr, equations (24) and (25) have the sameslope, d�/dt ¼ º/(nt ). As the Charles law parameter n hasrelatively large values (20–200) (Atkinson, 1984; Swanson,1984), equation (26) becomes
During CY:
d�
dtffi º
nt(27)
a value that also holds for the CH stage. Recalling thedefinition of the time-dependent compressibility index (equa-tion (2)), it can be concluded that, in both the CY and CHstages,
º t
ºffi 1
n(28)
It is shown therefore that the time-dependent compressibility,based on a logarithmic law, can be expressed in terms of theconventional compressibility coefficient and a parameter thatdescribes the velocity of crack propagation associated with astress corrosion effect. Equation (28) provides a justificationfor the relationship observed between º t and º. Lines for º t/º ¼ 0.05 (n ¼ 20) and º t/º ¼ 0.005 (n ¼ 200), whichreflect the possible range of values for n from publishedexperimental data for a wide range of rocks (Atkinson,1984), have been plotted in Fig. 7. The resulting bandincludes all the experimental data reported in this work. Theline n ¼ 60 defines reasonably well the relationship betweenº t and º for low to medium suction values. For really drystates (suction ¼ 255 MPa) water probably no longer has asignificant effect, and subcritical crack propagation velocitydecreases substantially, as shown by the large value of the nparameter of the Charles law, which fits the recorded com-pressibility indices for the tested shale. In fact, subcritical
crack growth curves in zone 3 are much steeper than in zone1, and have n values typically larger than 150 (Wiederhorn,1982; Atkinson, 1984).
CONCLUSIONSCreep behaviour of rockfill, under various moisture condi-
tions imposed in suction-controlled oedometer tests on com-pacted gravel of a quartzitic slate, was analysed on the basisof the strain records obtained for every loading step. Theexperimental data support the existence of a unique relation-ship between strain, stress, total suction and time for long-term creep behaviour. Such a relationship is best approachedby a linear strain–log(time) function, a feature that is alsosupported by settlement records of rockfill dams. It was alsoshown that the coefficient of creep deformation (ºt ) and thecompressibility coefficient (º) follow similar relationshipswith applied stress and suction. In fact, the ratio º t/º tendsto be a constant close to 0.02 for most of the testsperformed, except for very dry states, characterised by alower ratio (0.005).
The delayed deformation of rockfill is explained by theprogressive breakage of stressed particles. The conceptualmodel proposed here relies on the subcritical propagation ofcracks existing in loaded rock particles. The velocity ofcrack propagation is a function of the local stress intensityfactor and the prevailing relative humidity. A simple rela-tionship for this function (Charles law) has been adoptedhere to gain a deeper insight into the deformation mechan-isms of rockfill and to provide a physical explanation for theexperimental observations mentioned before.
Adopting simplified geometry and loading conditions forthe rock particles (cracked discs under a diametricallyopposed concentrated loading), it was found that, in a firststage, the crack propagates slowly. At some critical time thevelocity of propagation increases rapidly, and a suddenbreakage takes place. The time to breakage may change bymany orders of magnitude for relatively small changes inthe initial crack length. This result provides an explanationfor the apparently never-ending process of settlement accu-mulation observed in rockfill structures.
Results given by the crack propagation in discs have beeninterpreted from a different perspective when initial sizes ofpropagating cracks are plotted against the confining stressand the expected survival time. For a given time interval ofinterest in practice the size of active cracks could be found.Active cracks increase in size as the confining stress de-creases, but the range of possible values decreases rapidly asthe particle size is approached by the initial crack length.This phenomenon explains why delayed effects disappear forlow confining stresses, which is an observation made inlarge-scale experiments.
An additional consequence of the model is that a one-to-one relationship can be established between the initial stressintensity factor and the time to particle breakage. As stressintensity factors and macroscopic stresses are approximatelyrelated in a linear manner, an expression for the develop-ment of deformations in time could eventually be foundbetween strain, time, and the compressibility coefficient. Themodel predicts a linear increase of strain with the logarithmof time, as observed in the reported tests. It was found thatthe common coefficient of creep could be expressed in avery simple manner in terms of the compressibility coeffi-cient and a parameter describing the rate of crack propaga-tion (the parameter n of the Charles law for stresscorrosion). This relationship is supported by experimentalobservations, and provides a physical explanation for thevalues adopted in practice by the ratio º t/º.
The clue to the theoretical work presented here is recogni-
THEORETICAL INVESTIGATION OF THE TIME-DEPENDENT BEHAVIOUR OF ROCKFILL 299
tion of the fact that subcritical propagation of cracks inrocks is a two-stage process. This singular feature makes itpossible to establish a one-to-one relationship between theinitial stress intensity factor and the time to particle break-age. Moreover, because of the same feature, this relationshipholds no matter what the actual dimensions of the particleor the position of the crack within the particle. This meansthat the proposed model would apply not only for particlesundergoing splitting but also for other deformation mechan-isms involving the growth of cracks. In particular, localisedcrushing in the vicinity of interparticle contacts has longbeen recognised as an important source of deformation inrockfill (Kjaernsli & Sande, 1963; Sowers et al., 1965;Clements, 1981). Although the mechanism of contact crush-ing is complex, and not yet fully understood, some type ofcracking is involved at contacts. Hence it seems reasonableto think that the conclusions of this work may also apply togranular materials deforming by contact crushing.
ACKNOWLEDGEMENTSSome of the dam monitoring data presented in this work
were kindly provided by Hidroelectrica Chocon S.A. andHidroelectrica Alicura S.A. The authors gratefully acknowl-edge the financial support given to the first author by theMinisterio de Educacion y Ciencia from Spain and theUniversidad Nacional de San Juan (Argentina) during theresearch work reported in this paper.
APPENDIX. DERIVATION OF EQUATION (6)Inverting equation (5) and integrating, a relationship between time
and crack length is obtained:
dt ¼ 1
Ai
a�n=2i dai (29)
t ffi � 1
Ai
1
n=2 � 1a� n=2�1ð Þi þ C (30)
where C is the integration constant. At the instant t ¼ 0, when thenew load conditions (stress and suction) are just applied, theconsidered crack has a certain initial length a0 i, and hence constantC becomes
C ¼ 1
Ai
2
n � 2a� (n=2)�1ð Þ0i (31)
Replacing equation (31) in equation (30),
t ¼ 1
Ai
2
n � 2a� (n=2)�1ð Þ0i � a
�( (n=2)�1)i
� �(32)
NOTATIONAi constant factora half-length of a crack
a0 initial (t ¼ 0) length of crack with tbi ¼ tr ¼ 1000 min
a0 i initial (t ¼ 0) length of crack iB disc thicknessC integration constantD disc diameterK stress intensity factor
K0 stress corrosion limitK0 i initial (t ¼ 0) stress intensity factor of crack iKC fracture toughness
t time since load applicationtbi time between of load application and breakage of crack itr reference time for stress–strain relationshipV crack propagation velocity
V0, n parameters of Charles lawV0 i initial (t ¼ 0) crack propagation velocity of crack iÆ ¼ 2a/D� non-dimensional factor� oedometer vertical strain
�0 strain attained after tr has elapsed since instant of applicationof stress �0
� correction factor for time to breakageº compressibility indexº t time-dependent compressibility index� oedometer vertical stress or macroscopic stress
��i stress that would act across plane of crack i if particle wasnon-cracked
�i proportionality factor between ��i and �ł total suction
REFERENCESAthanasiu, C., Simonsen, A. S., Soereide, O. K. & Tistel, J. (2005).
Elastic and creep settlements of rock fills. Proc. 16th Int. Conf.Soil Mech. Geotech. Engng, Osaka, 1837–1843.
Atkinson, B. K. (1984). Subcritical crack growth in geologicalmaterials. J. Geophys. Res. 89, No. B6, 4077–4114.
Atkinson, B. K. & Meredith, P. G. (1987). The theory of subcriticalcrack growth with applications to minerals and rocks. In Frac-ture mechanics of rock (ed. B. K. Atkinson), pp. 111–166.London: Academic Press.
Broek, D. (1986). Elementary engineering fracture mechanics.Dordrecht: Martinus Nijhoff.
Cetin, H., Laman, M. & Ertunc, A. (2000). Settlement and slakingproblems in the world’s fourth largest rock-fill dam, the AtaturkDam in Turkey. Engng Geol. 56, No. 3, 225–242.
Clements, R. P. (1981). The deformation of rockfill: inter-particlebehaviour, bulk properties and behaviour in dams. PhD thesis,Faculty of Engineering, King’s College, University of London.
Charles, J. A. (1989). Geotechnical properties of coarse grainedsoils. Proc. of 12th Int. Conf. Soil Mech. Found. Engng, Rio deJaneiro, General Report, Discussion Session 8, 2495–2519.
Charles, J. A. (1991). Laboratory compression tests and the defor-mation of rockfill structures. In Advances in Rockfill Structures.NATO ASI Series E, Vol. 200, pp. 73–95.
Charles, R. J. (1958). Static fatigue of glass. J. Appl. Phys. 29, No.11, 1549–1560.
Coussy, O. (1995). Mechanics of porous continua. Chichester: JohnWiley & Sons.
Cundall, P. A. & Strack, O. D. L. (1979). A discrete numericalmodel for granular assemblies. Geotechnique 29, No. 1, 47–65.
Freiman, S. W. (1984). Effects of chemical environments on slowcrack growth in glasses and ceramics. J. Geophys. Res. 89, No.B6, 4072–4076.
Fumagalli, E. (1969). Tests on cohesionless materials for rockfilldams. J. Soil Mech. Found. Engng ASCE 95, No. SM1, 313–330.
ISRM (1978). Suggested methods for determining tensile strengthof rock materials. Int. J. Rock Mech. Min. Sci. Geomech. Abstr.15, No. 3, 99–103.
Justo, J. L. & Durand, P. (2000). Settlement–time behaviour ofgranular embankments. Int. J. Numer. Anal. Methods Geomech.24, No. 3, 281–303.
Kjaernsli, B. & Sande, A. (1963). Compressibility of some coarse-grained materials. Proc. Eur. Conf. Soil Mech. Found. Engng,Wiesbaden, 1, 245–251.
Marachi, N. D., Chan, C. K., Seed, H. B. & Duncan, J. M. (1969).Strength and deformation characteristics of rockfill materials,Report No. TE-69-5. Department of Civil Engineering, Univer-sity of California.
Marsal, R. J. (1973). Mechanical properties of rockfill. In Embank-ment dam engineering. Casagrande Volume I (eds R. C. Hirsch-feld and S. J. Poulos). New York: John Wiley & Sons, 110–200.
Marsal, R. J., Arellano, L. R., Guzman, M. A. & Adame, H.(1976). El Infiernillo. In Behavior of dams built in Mexico.UNAM, Mexico: Instituto de Ingenierıa, 239–312.
McDowell, G. R. & Bolton M. D. (1998). On the micromechanicsof crushable aggregates. Geotechnique 48, No. 5, 667–679.
Mesri, G. & Castro, A. (1987). CÆ=Cc concept and K0 duringsecondary compression. J. Geotech. Engng, ASCE 113, No. 3,230–247.
Mesri, G., Feng, T. W. & Benak, J. M. (1990). Postdensificationpenetration resistance of clean sands. J. Geotech. Engng ASCE116, No. 7, 1095–1115.
300 OLDECOP AND ALONSO
Nakata, Y., Kato, Y., Hyodo, M., Hyde, A. & Murata, H. (2001).One-dimensional compression behaviour of uniformly gradedsand related to single particle crushing strength. Soils Found.41, No. 2, 39–51.
Naylor, D. J., Maranha, J. R., Maranha das Neves, E. & VeigaPinto, A. A (1997). A back-analysis of Beliche Dam. Geotechni-que 47, No. 2, 221–233.
Nobari, E. S. & Duncan, J. M. (1972). Effect of reservoir filling onstresses and movements in earth and rockfill dams, Report No.TE-72-1. Department of Civil Engineering, University of Cali-fornia.
Oldecop, L. A. & Alonso, E. E. (2001). A model for rockfillcompressibility. Geotechnique 51, No. 2, 127–139.
Oldecop, L. A. & Alonso, E. E. (2003). Suction effects on rockfillcompressibility. Geotechnique 53, No. 2, 289–292.
Sherard, J. L. & Cooke, J. B. (1987). Concrete-face rockfill dam:I. Assessment. J. Geotech. Engng ASCE 113, No. 10, 1096–1112.
Soriano, A. & Sanchez, F. J. (1999) Settlements of railroad highembankments. Proc. 12th Eur. Conf. Soil Mech. Geotech. EngngAmsterdam, 1885–1890.
Soriano, A., Sanchez, F. & Macıas, J. M. (1992). Presa Rivera de la
Gata: primer llenado. Revista de Obras Publicas 139, No. 3309,169–184.
Sowers, G. F., Williams, R. C. & Wallace, T. S. (1965). Compressi-bility of broken rock and settlement of rockfills. Proc. 6th Int.Conf. Soil Mech. Found. Engng, Montreal 2, 561–565.
Swanson, P. L. (1984). Subcritical crack growth and other time- andenvironment- dependent behaviour in crustal rocks. J. Geophys.Res. 89, No. B6, 4137–4152.
Tada, H., Paris, P. C. & Irwin, G. R. (1985). The stress analysis ofcracks handbook, 2nd edn. St Louis, MO: Paris Productions.
Veiga Pinto, A. A. (1983). Previsao do comportamento estruturalde barragens de enrocamento. PhD thesis, Laboratorio Nacionalde Engenharia Civil, Lisbon.
Wiederhorn, S. M., Fuller, E. R. & Thomson, R. (1980). Micro-mechanisms of crack growth in ceramics and glasses in corro-sive environments. Met. Sci. 14, Aug.–Sept., 450–458.
Wiederhorn, S. M., Freiman, S. W., Fuller, E. R. & Simmons, C. J.(1982). Effects of water and other dielectrics on crack growth.J. Mater. Sci. 17, No. 12, 3460–3478.
Yamamuro J. A. & Lade, P. V. (1996). Drained sand behavior inaxisymmetric tests at high pressures. J. Geotech. Engng ASCE122, No. 2, 109–119.
THEORETICAL INVESTIGATION OF THE TIME-DEPENDENT BEHAVIOUR OF ROCKFILL 301