prediction of cyclic behavior of wuf-w connections...
TRANSCRIPT

www.springer.com/journal/13296
International Journal of Steel Structures 16(4): 1197-1208 (2016)
DOI 10.1007/s13296-016-0057-0
ISSN 1598-2351 (Print)
ISSN 2093-6311 (Online)
Prediction of Cyclic Behavior of WUF-W Connections with
Various Weld Access Hole Configurations Using Nonlinear FEA
Sang Whan Han*, Nam Hun Kim, and Soon Wook Cho
Department of Architectural Engineering, Hanyang University, Seoul 133-1791, Korea
Abstract
The welded unreinforced flange-welded web (WUF-W) moment connection is one of seven prequalified connections for thespecial moment frames (SMF) specified in AISC 358-10. Previous studies reported that some WUF-W connections with a steepaccess hole slope failed before completing a loading cycle of 4% drift ratio. For investigating in detail the effect of access holegeometry including access hole slopes on the connection behavior, experimental tests require excessive costs and effortsbecause there are the large number of combinations of configuration parameters for access hole geometry. In this study, thecyclic behavior of WUF-W connections is evaluated using three-dimensional nonlinear finite element (FE) analyses with anadequate solid element and failure index. Based on the results of FEA, the effect of configuration parameters on the connectionbehavior is investigated.
Keywords: cyclic behavior, moment connection, finite element analysis, access hole, failure index, special moment frame
1. Introduction
In AISC 358-10 (2010), seven prequalified connections
are specified for special moment frames (SMF). The
welded unreinforced flange-welded web (WUF-W) moment
connection is one of the permitted SMF connections,
which is an all-welded moment connection as shown Fig
1. According to the commentary of AISC 358-10, the
prequalification of the WUF-W moment connection is
based on the results of two major research programs
conducted at Leigh University and the University of
Minnesota. These experimental research program (Ricles
et al., 2000, 2002; Lee et al., 2005a, b) reported that
WUF-W connections had deformation capacities significantly
larger than 4% drift ratio, satisfying the requirements for
SMF connections specified in AISC 341-10 (2010). Finite
element studies were also conducted for developing the
special seismic weld access hole and the details of the
web connection (Lu et al., 2000; Mao et al., 2001; El-
Tawil et al., 1998).
Recently, Han et al. (2014) also conducted experimental
tests for WUF-W connections. It was reported that some
WUF-W connections with a beam depth of 890 mm
experienced brittle failure and did not satisfy the requirements
forSMF connections even though the connections were
designed and detailed according to AISC 341-10 and
AISC 358-10. It was suspected that the main cause of
premature failure in WUF-W connections was the access
hole slope. Steep access hole slopes was used in Han et
al. (2014), which was 21º. AWS D1.8/D1.8M (2009)
specifies that the angle of access hole slope should be less
than 25º.
For investigating the effect access hole geometry on the
cyclic behavior of WUF-W connections, it is difficult to
conduct experimental tests due to excessive costs and
efforts. Instead, finite element analyses can be used, which
provide detailed stress and strain information at critical
regions in WUF-W connections. In this study a three-
dimensional (3D) nonlinear finite element analyses (FEA)
are conducted to simulate the cyclic curves of WUF-W
connections with various access hole geometries. Based
on FEA results, this study evaluates the effect of the
configuration parameter of access holes on connection
behavior. For this purpose, a proper solid element is
proposed considering computation stability, accuracy and
convergence. In order to predict the incidence of connection
fracture, this study also proposes a proper failure index.
Received January 30, 2016; accepted June 28, 2016;published online December 31, 2016© KSSC and Springer 2016
*Corresponding authorTel: +82-2-2220-1715, Fax: +82-2-2291-1716E-mail: [email protected]

1198 Sang Whan Han et al. / International Journal of Steel Structures, 16(4), 1197-1208, 2016
2. Comparison between Cyclic Curves of WUF-W Connections with Different Access Hole Geometries
In order to compare the cyclic behaviors of WUF-W
connections specimens with different access hole geometries,
this study considers two code-compliant WUF-W connection
specimens, T5 and D900-S, which were tested by Ricles
et al. (2002) and Han et al. (2014).
Figure 2(a) shows the cyclic curve for specimen T5
with a strong panel zone. The beam and column for
specimen T5 were A572 Grade 50 W36×150 (a depth of
beam=920 mm) and W14x311 sections, respectively, and
the moment strength ratio of panel zone to beam (Mpz/Mp)
was 1.55. This specimen exhibited stable cyclic behavior
and sustained cyclic 3loading until a drift ratio was 6%.
For specimen D900-S with a beam depth of 890 mm,
cyclic curves are presented in Fig. 2(b). The details for
specimen D900-S is shown in Fig. 1(a). Specimen D900-
S failed before completing one loading cycle at 4% drift
ratio, which did not satisfy the requirement for SMF
connections. It is noted that the main difference between
specimens T5 and D900-S was access geometry. Particularly,
the access hole slopes of those specimens are 13º and 21º,
respectively. Table 1 summarizes five configuration para-
meters for access hole geometry and corresponding
values for specimens T5 and D900-S.
Figure 1. WUF-W connection details.
Figure 2. Cyclic curves for specimens T1 and D900-S.

Prediction of Cyclic Behavior of WUF-W Connections with Various Weld Access Hole Configurations Using Nonlinear FEA 1199
3. Three Dimensional Finite Element Analyses
For investigating the effect of access hole geometry on
the cyclic behavior of WUF-W connections, this study
simulates the cyclic behavior of WUF-W connections via
3D nonlinear FEA with a proper FE model. Since it is
complex to predict the incidence of connection fracture
using FE model alone, a proper index is proposed.
In order to simulatethe cyclic responses in plastic ranges
with FEA, a proper FE software should be chosen. The
plasticity models included in software ABAQUS (Hibbitt
et al., 2011) are incremental theories in which the
mechanical strain rate is decomposed into an elastic part
and a plastic (inelastic) part, which are considered to be
sufficient for the analysis of WUF-W connections.
Incremental plasticity models are usually formulated in
terms of following three rules: (1) A yield surface, which
generalizes the concept of “yield load” into a test function
that can be used to determine if the material responds
purely elastically at a particular state of stress, (2) A flow
rule, which defines the inelastic deformation that occurs
if the material point is no longer responding purely elastically,
and (3) Evolution laws that define the hardening-theway
in which the yield and flow definitions change as inelastic
deformation occurs. Since such functions provided in the
software are considered to be sufficient for simulating the
cyclic behavior of WUF-W connections, this study uses
software ABAQUS. This software provides various solid
brick elements for nonlinear 3D FEA. In order to obtain
accurate FEA results, an accurate element should be used.
3.1. Selection of a proper brick solid element
In ABAQUS, many brick elements are available: the
regular brick element with standard integration (C3D8,
C3D20), the brick element with an incompatible deformation
mode (C3D8I, C3D20I), and the brick element with
reduced integration (C3D8R, C3D20R). Element C3D8 is
the first order fully integrated element, which overestimates
stiffness significantly due to shear lockingproblem in this
element. The first order integrated element C3D8I with
incompatible modes was developed to reduce the problem
arisen by using element C3D8,but shear locking could not
be removed completely. Element C3D8R is the first-order
reduced-integration element that eliminates shear locking
so that this element can be used for modeling a member
dominated by flexure. Since element C3D8R requires
reduced integration, this element requires less computation
than elements C3D8 and C3D8I. Elements C3D20 and
C3D20R second order full and reduced solid elements.
Since these elements use more integration points than
first order solid elements, the results of FEAare more
accurate than those with the first order elements. However,
the second order elements require large computational
efforts, which become more excessive with increasing the
number of meshes.
In order to select a proper element for WUF-W
connections, specimen D900-S is used for FE models. A
lower portion of the connection is tested as shown in Fig.
3. The support conditions for all boundaries are assumed
to be fixed. The tensile force is applied to the beam
flange. The components of the connection are divided
into four different layers of elements through their
thickness (Fig. 3).
Figure 4(a) shows computing time required in FEA
with each type of element normalized by that required in
FEA with element C3D20 and six layers of elements
through the thickness of components. As expected,
element C3D20 requires the most computing time among
the elements whereas the computing time required using
element C3D8R is the least. In Fig. 4(b), the distribution
Table 1. Configuration parameters for weld access holesfor specimens T5 and D900-S
(a) T5 (b) D900-S
Specimen T (mm) R (mm) S (o) H (mm) L (mm)
T5 79 10 13 19.1 25.4
D900-S 69 10 21 23 23
Figure 3. FE model for lower portion of WUF-W connections.

1200 Sang Whan Han et al. / International Journal of Steel Structures, 16(4), 1197-1208, 2016
of von Mises stress is plotted within the region of stress
larger than 85% of the maximum stress for element
C3D20. It is noted that the maximum stresses obtained
using different elements are similar irrespective of element
types. This study assumes that the stress distribution obtained
using element C3D20 is accurate. As shown in Fig. 4(b),
element C3D8R produces a stress distribution that best
matches the stress distribution obtained using element
C3D20. Thus, considering the computational efficiency
and accuracy, this study uses element C3D8R for modeling
WUF-W connections.
3.2. Minimum layers of elements for accurate results
It is important to determine the optimal number of layers
of elements for FEA because computing time increases
with increasing the number of layers. FEA are repeatedly
conducted with increasing the number of layers until
convergence is achieved. Figure 5 shows the von Mises
stress normalized by the maximum stress obtained with
single layer of elements (Fig. 3(a)). Figure 5(b) shows the
trend of error (%) associated with the stress obtained with
different element layers. The error is defined as the
difference between stresses obtained using multi-layers of
elements (σn) and single layer of element (σ1) normalized
by σ1[=(σn−σ1)/σ1×100]. It is observed that the stress
distribution obtained with four layers of elements is close
to that obtained with six layers of elements. The error
associated with four layers of elements is only 6.5%,
indicating that the FEA results converges when the number
of layers equal to or greater than 4. Thus, this study
divides the thickness of components into four layers as
shown in Fig. 3(c).
4. Simulating Cyclic Curves Using Finite Element Analyses for WUF-W Connections
The cyclic behavior of WUF-W connections with different
access holes are simulated via 3D nonlinear FEA with
element C3D8R. Specimens D900-S and T5 are considered
in this study. Figure 6 shows the test setup and FE model
for specimens D900-S and T5. The loading histories,
support conditions and locations of lateral supports used
in FE models are kept the same as those used in the tests.
It is observed that the lateral loading was applied at the
end of the upper column for specimen T5 whereas the
lateral load for specimen D900-S was applied at the end
of beam. The same displacement controlled cyclic
loadings are applied to the specimens as used in the tests.
4.1. Material models
In order to simulate the cyclic behavior of WUF-W
connections via FEA, cyclic coupon tests results are
required. Since previous studies did not provide cyclic
Figure 4. Computing time and distribution of von Mises stress according to different types of elements.
Figure 5. Distribution of von Mises stress according to the layers of elements.

Prediction of Cyclic Behavior of WUF-W Connections with Various Weld Access Hole Configurations Using Nonlinear FEA 1201
coupon test results, this study adopts cyclic coupon test
results for steel grades A36 and A572-GR50 conducted
by Kauffman et al. (1999). Steel grades SS400 (Fy=245
MPa and Fu=400 MPa) and SM490 (Fy=325 MPa and
Fu=490 MPa) used for beams and columns of specimen
D900-S have similar mechanical properties with steel
grades A36 and A572-GR50 (Fy=345 MPa and Fu=450
MPa), respectively. Thus, cyclic coupon test results for
A36 and SM 490 conducted by Kauffman et al. (1999)
are used to define the cyclic material properties for
specimen D900-S, which are shown in Fig. 7.
In order to define the cyclic stress-strain relationship (f
and ε),the modified Ramberg-Osgood equation is used
[Eq. (1)]. Coefficients A, B, and C for the equation are
determined using a trial-and-error procedure. Coefficients
A, B, and C for A36 (SS400) are 0.0001, 220 and 2.4,
respectively, whereas for A572-GR50 (SM 490), they are
0.0001, 270 and 2.4, respectively.
(1)
where E is the elastic modulus and Fu is the ultimate
stress. In Fig. 7, the stress-strain curve for the 1st half
cycle is calculated using Eq. (1) and plotted with thick
dotted lines, which is only required for FE modelingin
software ABAQUS. It is observed that the dotted lines
accurately match the 1st half cycle of the cyclic curves.
The stress strain curve obtained from uniaxial coupon
tests for steel grades SS400 and SM 490 is also plotted
with thin dotted lines, which matches the uniaxial stress-
strain curves for steel grades A36 and A572GR50,
respectively.
4.2. Consideration of shear tabs in FE models
To investigate the effect of shear tab modeling on the
results of FEA, specimen D900-S is modeled with and
without considering shear tabs. Figure 8 shows the FE
model used for WUF-W connections with and without
shear tabs. Figure 9 shows the cyclic curves simulated via
FEA with and without considering shear tabs. In this figure,
cyclic curves obtained from the test are also included. It
is observed that the cyclic curves simulated using FE
f Eε A1 A–
1 Bε( )C+{ }1 C⁄
----------------------------------+= fu≤
Figure 6. FE models for specimens T5 and D900-S.

1202 Sang Whan Han et al. / International Journal of Steel Structures, 16(4), 1197-1208, 2016
models match the actual cyclic curve irrespective of shear
tab modeling. The initial stiffness and maximum forces of
the specimen are summarized in Table 2. Comparing the
results between test and analysis results, the FE model
without considering shear tabs produced less accurate
results than the FE model with considering shear tables,
but the difference between theresults is small. The cumulative
dissipated energy is also calculated from the cyclic curves
and plotted in Fig. 10. The similar observation is made
for cumulative dissipated energy. In order to conduct
FEA with more computational efficiency, this study
Figure 7. Cyclic stress-strain curves (Kaufmann et al., 1999) for A36 steel and calculated stress-strain curve.
Figure 9. Cyclic curves obtained using FE models with and without shear tabs.
Table 2. Initial stiffness and maximum shear forces
Test resultsFEA without
considering shear tabsFEA with
considering shear tabs FEA
Initial Stiffness (kN/mm) 27.74 27.46 29.03
Maximum shear force (kN) 1220.4 1151.5 1087.2
Figure 8. FE model with shear tabs.
Figure 10. Cumulative dissipated energies obtained fromtests and analyses.

Prediction of Cyclic Behavior of WUF-W Connections with Various Weld Access Hole Configurations Using Nonlinear FEA 1203
constructs FE models for WUF-W connections without
considering shear tabs.
4.3. Cyclic curves simulated using FEA
To verify the accuracy of the FE model used in this
study, cyclic curves obtained from FEA are compared
with those obtained from tests. For this purpose, tested
WUF-W connection specimens are collected, which are
summarized in Table 3.
Figure 11 shows the actual and simulated cyclic curves
for collected specimens. The cyclic curves simulated with
FEA match those obtained from experimental tests. In
Fig. 12, cumulative energies dissipated byspecimens T1
and T5 are also plotted according to drift ratios. It is
observed that cumulative dissipated energies calculated
using FEA results agrees well with those using test
results.
This study also compares the distributions of strain for
specimens D900-S and D700-S obtained from FEA with
those obtained viastrain gauges during the test. Figure 13
shows the strain distribution. The locations of gauges are
also shown in Fig. 13(a). It is observed that FEA produces
accurate strain distributions for WUF-W connections.
5. Determination of Proper Failure Index for Predicting Connection Fracture
The incidence of fracture in members can be accurately
predicted using comprehensive fracture mechanics. However,
it is complex to construct an explicit model for predicting
the incidence of fracture using fracture mechanics, particularly
for members with complex configurations such as WUF-
W connections. In this study, cracks are not explicitly
modeled to predict the behavior and strengthof solids
having crack propagation using fracture mechanics. To
evaluate and compare WUF-W connections with various
access hole configurations for ductile fracture potential,
several indices were considered and computed near access
holes in WUF-W connections such as PEEQ index, von
Mises stress index, triaxiality ratio, and rupture index.
Then, the most proper index is chosen and used for
predicting the incidence of connection fracture. Equations
for above mentioned indices are briefly addressed as
follows.
Von Mises Stress Index (MSI) is defined as the ratio of
Von Mises stress (σeff) to the yield stress (σy) [Eq, (2)].
MSI=σeff/σy (2)
(3)
S ij=σ ij+σmδ ij
where S ij is the deviatoric stress components of global
coordinates, (i, j) and δ ij is the Kronecker delta.
PEEQ Index (PI) is calculated with effective plastic
strain (PEEQ) and yield strain (εy) using Eq. (4). The
local ductility can be accurately predicted using PI.
PEEQ Index=PEEQ/εy (4)
(5)
where is the plastic strain of global coordinates, (i, j).
Rupture Index (RI) is defined as the ratio of PEEQ
index to ductile fracture strain ε f multiplied by the
material constant α as follows.
Rupture Index (RI)= = (6)
σeff
2
3---SijSij=
PEEQ2
3---εij
pεijp
=
εijp
aPEEQ εy⁄
εf
----------------------PEEQ εy⁄
exp 1.5σm
σeff
--------–⎝ ⎠⎛ ⎞
---------------------------------
Table 3. Collected WUF-W connection specimens
Reference Specimen Connection typeColumn size, (Fy · Fu) MPa
Mpz/Mp
+ l/d++
Beam size, (Fy · Fu) MPa
Han et al.(2014)
D900-SWUF-WExterior
H458×417×30×50, (364.2,534.7)1.56 7.75
H890×299×15×23, (340.1,481.5)
D900-BWUF-WExterior
H458×417×30×50, (364.5,537)1.56 7.75
H890×299×15×23, (334.6,481.2)
D700-SWUF-WExterior
H428×407×20×35, (344.4,535.2)1.64 9.97
H692×300×13×20, (344.8,506.3)
D700-BWUF-WExterior
H428×407×20×35, (310.6,540.5)1.64 9.97
H692×300×13×20, (340.2,499.3)
Ricles et al. (2000)
T1WUF-WExterior
W14×311, (372.1,489.2)1.09 9.84
W36×150, (385.8,502.9)
T5WUF-WExterior
W14×311, (372.1,489.2)1.55 9.84
W36×150, (385.8,502.9)
+Mpz/Mp: the ratio of moment strength of panel zone to that of beam, ++l/d: span-to-depth ratio of beam

1204 Sang Whan Han et al. / International Journal of Steel Structures, 16(4), 1197-1208, 2016
Figure 11. Comparison between Cyclic curves obtained from tests and FEA.
Figure 12. Cumulative dissipated energies for specimens T1 and T5.
Figure 13. Distribution of strains from tests and FEA.

Prediction of Cyclic Behavior of WUF-W Connections with Various Weld Access Hole Configurations Using Nonlinear FEA 1205
(7)
(8)
(9)
where σm is the hydrostatic stress.
Triaxiality Ratio (TR) can be calculated using Eq. (10).
TR=σm/σeff (10)
Using the above equations, indices for fractured connection
specimens (Table 1) are estimated with FEA results from
the first to the last loading cycles. Since all fractured
specimens experienced beam flange fracture within aregion
ranging from access hole toe to column face, indices are
calculated in this region. Figure 14 shows the calculated
values foreach index according to drift ratios. It is noted
that RI and PI becomes larger with an increase in drift
ratio whereas TR and MSI increase according to a drift
ratio, approximately up to 1%, but after 1% drift ratio,
they are almost constant irrespective of drift ratios.
Table 4 summarizes the values of indices corresponding
to connection fracture. The coefficient of variations of
MSI, PI, RI, and TR for fractured WUF-W connection
specimens are 0.136, 0.227, 0.058 and 0.312, respectively.
It is noted that the variation of RI corresponding to
connection fracture is the smallest among the indices.
Thus, RI can be used to predict the incidence of connection
fracture with little variability. In this study, it is assumed
that a limiting value of RI is assumed as 1179, which is
the mean value of RI. Thus, when cyclic curves are
simulated using FEA for WUF-W connections, analyses
are conducted until RI becomes 1179.
6. Evaluation of Access hole Geometry on Connection Behavior
Since accurate FE model and failure index are esta-
blished, the cyclic behavior of WUF-W connections with
various access hole configurations can be accurately predicted.
As summarized in Table 3, there are five configuration
parameters: thelength of the flat portion (L), radius of
access hole (R), access hole height (H), access hole slope
(S) and overall length (T). This study assumes that R is
assumed to be 10 mm, for simplicity. Since L and T are
dependent parameters, only L is considered as a variable.
Thus, this study considers T, L and S as variables. In
AWS D1.8/D1.8M, permissible ranges for T and L are
specified as 64-80 mm and 17.3-34.5 mm, respectively,
whereas for assess hole slopes, only the maximum value
is specified as 25o.
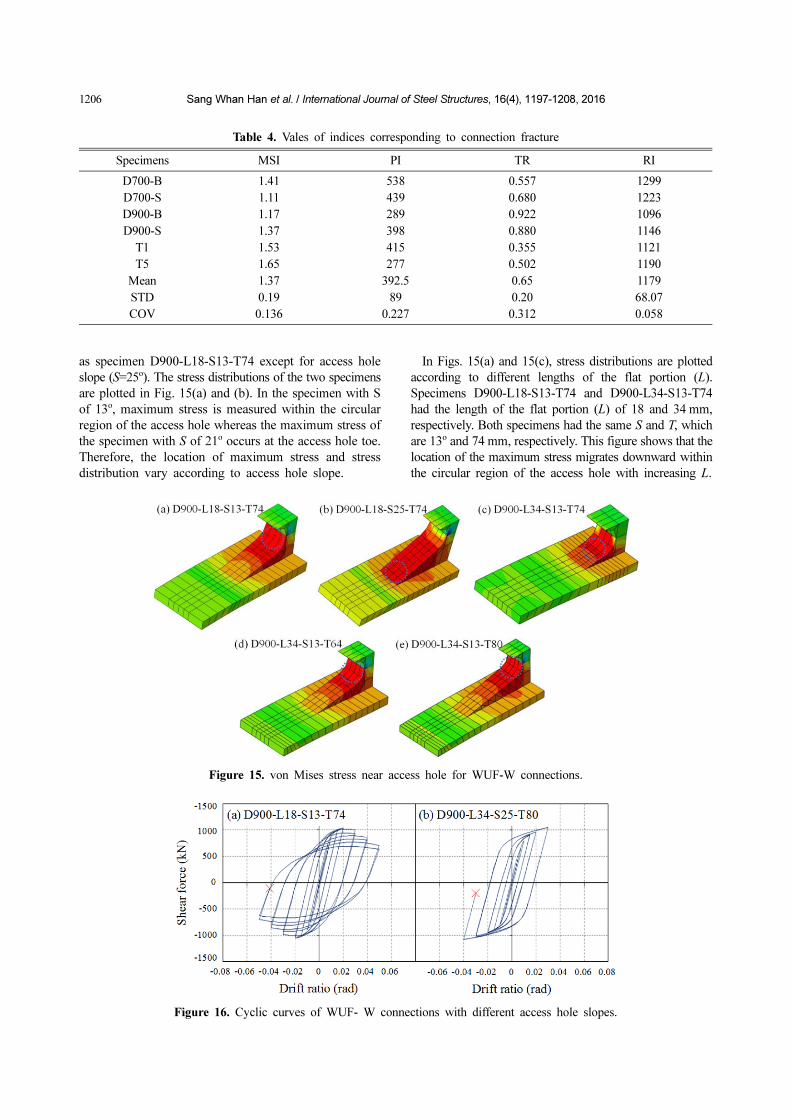
Figure 15 shows the von Mises stress of five WUF-W
connections at a drift ratio of 3%. These specimens are
identical with specimen D900-S except for the access
hole geometry. This figure shows that von Mises stress
near access holes varies according to access hole geometry.
Specimen D900-L18-S13-T74 had an access hole with
L of 18 mm, S of 13o and T of 74 mm whereas specimen
D900-L18-S25-T74 had the same access hole geometry
εf aexp 1.5σm
σeff
--------–⎝ ⎠⎛ ⎞=
σm
1
3---trace σij( )–=
σeff
2
3---SijSij=
Figure 14. Failure indices for WUF-W connections
1206 Sang Whan Han et al. / International Journal of Steel Structures, 16(4), 1197-1208, 2016
as specimen D900-L18-S13-T74 except for access hole
slope (S=25o). The stress distributions of the two specimens
are plotted in Fig. 15(a) and (b). In the specimen with S
of 13o, maximum stress is measured within the circular
region of the access hole whereas the maximum stress of
the specimen with S of 21o occurs at the access hole toe.
Therefore, the location of maximum stress and stress
distribution vary according to access hole slope.
In Figs. 15(a) and 15(c), stress distributions are plotted
according to different lengths of the flat portion (L).
Specimens D900-L18-S13-T74 and D900-L34-S13-T74
had the length of the flat portion (L) of 18 and 34 mm,
respectively. Both specimens had the same S and T, which
are 13o and 74 mm, respectively. This figure shows that the
location of the maximum stress migrates downward within
the circular region of the access hole with increasing L.
Table 4. Vales of indices corresponding to connection fracture
Specimens MSI PI TR RI
D700-B 1.41 538 0.557 1299
D700-S 1.11 439 0.680 1223
D900-B 1.17 289 0.922 1096
D900-S 1.37 398 0.880 1146
T1 1.53 415 0.355 1121
T5 1.65 277 0.502 1190
Mean 1.37 392.5 0.65 1179
STD 0.19 89 0.20 68.07
COV 0.136 0.227 0.312 0.058
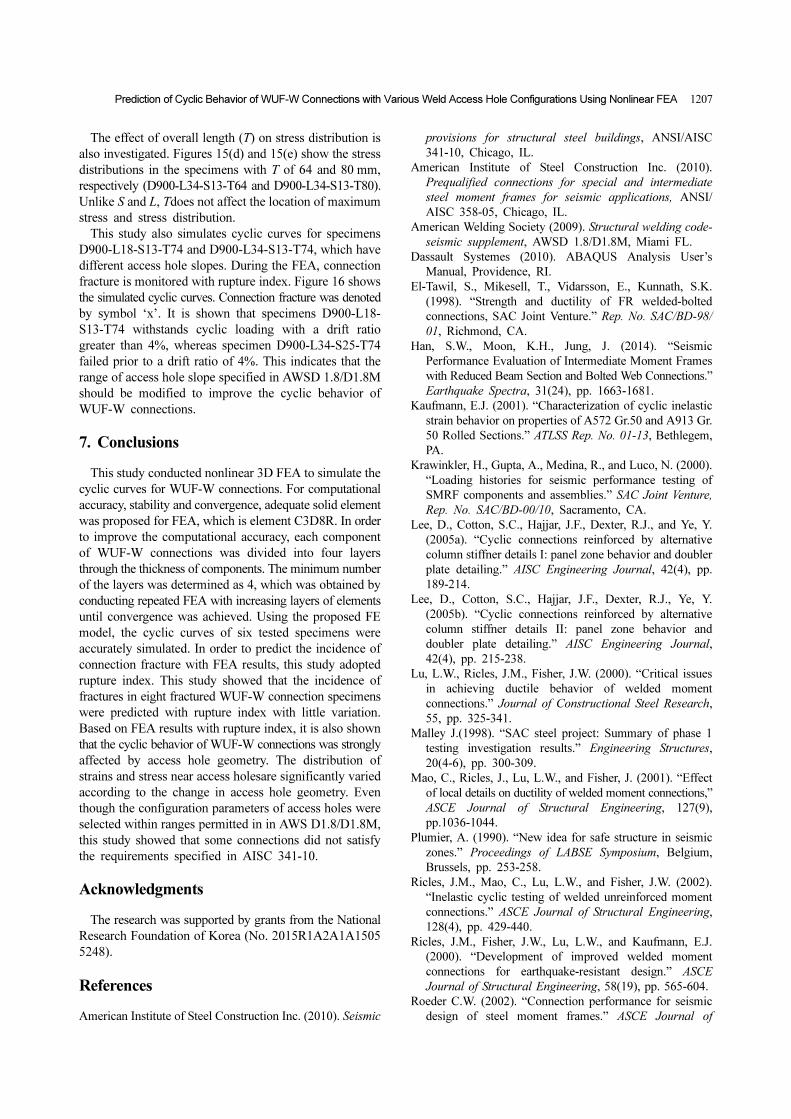
Figure 16. Cyclic curves of WUF- W connections with different access hole slopes.
Figure 15. von Mises stress near access hole for WUF-W connections.
Prediction of Cyclic Behavior of WUF-W Connections with Various Weld Access Hole Configurations Using Nonlinear FEA 1207
The effect of overall length (T) on stress distribution is
also investigated. Figures 15(d) and 15(e) show the stress
distributions in the specimens with T of 64 and 80 mm,
respectively (D900-L34-S13-T64 and D900-L34-S13-T80).
Unlike S and L, Tdoes not affect the location of maximum
stress and stress distribution.
This study also simulates cyclic curves for specimens
D900-L18-S13-T74 and D900-L34-S13-T74, which have
different access hole slopes. During the FEA, connection
fracture is monitored with rupture index. Figure 16 shows
the simulated cyclic curves. Connection fracture was denoted
by symbol ‘x’. It is shown that specimens D900-L18-
S13-T74 withstands cyclic loading with a drift ratio
greater than 4%, whereas specimen D900-L34-S25-T74
failed prior to a drift ratio of 4%. This indicates that the
range of access hole slope specified in AWSD 1.8/D1.8M
should be modified to improve the cyclic behavior of
WUF-W connections.
7. Conclusions
This study conducted nonlinear 3D FEA to simulate the
cyclic curves for WUF-W connections. For computational
accuracy, stability and convergence, adequate solid element
was proposed for FEA, which is element C3D8R. In order
to improve the computational accuracy, each component
of WUF-W connections was divided into four layers
through the thickness of components. The minimum number
of the layers was determined as 4, which was obtained by
conducting repeated FEA with increasing layers of elements
until convergence was achieved. Using the proposed FE
model, the cyclic curves of six tested specimens were
accurately simulated. In order to predict the incidence of
connection fracture with FEA results, this study adopted
rupture index. This study showed that the incidence of
fractures in eight fractured WUF-W connection specimens
were predicted with rupture index with little variation.
Based on FEA results with rupture index, it is also shown
that the cyclic behavior of WUF-W connections was strongly
affected by access hole geometry. The distribution of
strains and stress near access holesare significantly varied
according to the change in access hole geometry. Even
though the configuration parameters of access holes were
selected within ranges permitted in in AWS D1.8/D1.8M,
this study showed that some connections did not satisfy
the requirements specified in AISC 341-10.
Acknowledgments
The research was supported by grants from the National
Research Foundation of Korea (No. 2015R1A2A1A1505
5248).
References
American Institute of Steel Construction Inc. (2010). Seismic
provisions for structural steel buildings, ANSI/AISC
341-10, Chicago, IL.
American Institute of Steel Construction Inc. (2010).
Prequalified connections for special and intermediate
steel moment frames for seismic applications, ANSI/
AISC 358-05, Chicago, IL.
American Welding Society (2009). Structural welding code-
seismic supplement, AWSD 1.8/D1.8M, Miami FL.
Dassault Systemes (2010). ABAQUS Analysis User’s
Manual, Providence, RI.
El-Tawil, S., Mikesell, T., Vidarsson, E., Kunnath, S.K.
(1998). “Strength and ductility of FR welded-bolted
connections, SAC Joint Venture.” Rep. No. SAC/BD-98/
01, Richmond, CA.
Han, S.W., Moon, K.H., Jung, J. (2014). “Seismic
Performance Evaluation of Intermediate Moment Frames
with Reduced Beam Section and Bolted Web Connections.”
Earthquake Spectra, 31(24), pp. 1663-1681.
Kaufmann, E.J. (2001). “Characterization of cyclic inelastic
strain behavior on properties of A572 Gr.50 and A913 Gr.
50 Rolled Sections.” ATLSS Rep. No. 01-13, Bethlegem,
PA.
Krawinkler, H., Gupta, A., Medina, R., and Luco, N. (2000).
“Loading histories for seismic performance testing of
SMRF components and assemblies.” SAC Joint Venture,
Rep. No. SAC/BD-00/10, Sacramento, CA.
Lee, D., Cotton, S.C., Hajjar, J.F., Dexter, R.J., and Ye, Y.
(2005a). “Cyclic connections reinforced by alternative
column stiffner details I: panel zone behavior and doubler
plate detailing.” AISC Engineering Journal, 42(4), pp.
189-214.
Lee, D., Cotton, S.C., Hajjar, J.F., Dexter, R.J., Ye, Y.
(2005b). “Cyclic connections reinforced by alternative
column stiffner details II: panel zone behavior and
doubler plate detailing.” AISC Engineering Journal,
42(4), pp. 215-238.
Lu, L.W., Ricles, J.M., Fisher, J.W. (2000). “Critical issues
in achieving ductile behavior of welded moment
connections.” Journal of Constructional Steel Research,
55, pp. 325-341.
Malley J.(1998). “SAC steel project: Summary of phase 1
testing investigation results.” Engineering Structures,
20(4-6), pp. 300-309.
Mao, C., Ricles, J., Lu, L.W., and Fisher, J. (2001). “Effect
of local details on ductility of welded moment connections,”
ASCE Journal of Structural Engineering, 127(9),
pp.1036-1044.
Plumier, A. (1990). “New idea for safe structure in seismic
zones.” Proceedings of LABSE Symposium, Belgium,
Brussels, pp. 253-258.
Ricles, J.M., Mao, C., Lu, L.W., and Fisher, J.W. (2002).
“Inelastic cyclic testing of welded unreinforced moment
connections.” ASCE Journal of Structural Engineering,
128(4), pp. 429-440.
Ricles, J.M., Fisher, J.W., Lu, L.W., and Kaufmann, E.J.
(2000). “Development of improved welded moment
connections for earthquake-resistant design.” ASCE
Journal of Structural Engineering, 58(19), pp. 565-604.
Roeder C.W. (2002). “Connection performance for seismic
design of steel moment frames.” ASCE Journal of
1208 Sang Whan Han et al. / International Journal of Steel Structures, 16(4), 1197-1208, 2016
Structural Engineering, 128(4), pp. 300-309.
Richmond. (2000). Recommended seismic design criteria for
new steel moment frame buildings, FEMA 350, CA.
Youssef, N.F.G., Bonowitz, D, and Gross, J.L. (1995). “A
survey of steel moment resisting frame buildings affected
by the 1994 Northridge earthquake.” National Institute of
Standard and Technology, Rep. No. NISTIR-5625.