prediction research - cecilejanssens.org · 3 methodology ... this manual provides an introduction...
TRANSCRIPT

Prediction Research An introduction
A. Cecile J.W. Janssens, MA, MSc, PhD Forike K. Martens, MSc
Emory University, Rollins School of Public Health, department of Epidemiology, Atlanta GA, USA VU University Medical Center, Department of Clinical Genetics/EMGO Institute for Health and
Care Research, Amsterdam, The Netherlands
Version 2.1 (May 2018)
This work is licensed under a Creative Commons Attribution-NonCommercial-NoDerivatives 4.0 International License.


1
Preface This manual is an introduction to the main topics of prediction research. The manual briefly discusses each topic and its relevance to the detail that is needed for understanding empirical articles. After reading the manual, readers should have a good understanding of the key methodological and analytical considerations in prediction research, and be able to read scientific articles on prediction studies critically. The manual is work in progress and will be updated regularly. If you find any errors or have suggestions for topics, revisions, and literature updates, we would appreciate hearing from you: [email protected]. Under the creative commons license the manual can be used for personal or class use, but not for commercial purposes. The writing of the manual was financially supported by a European Starting Grant (#310884) of the European Research Council. The authors thank Lidewij Henneman, Annelies Kers, Ilse Tonk and Suman Kundu for their valuable suggestions on earlier drafts of the manual. Cecile Janssens Forike Martens Atlanta, May 2018

2

3
Contents
PREFACE ........................................................................................................................... 1
1 INTRODUCTION .......................................................................................................... 4
1.1 PREDICTION AND PERSONALIZED MEDICINE............................................................................. 4 1.2 PREDICTION RESEARCH AND ETIOLOGICAL RESEARCH ................................................................ 5 1.3 PREDICTION MODELS IN HEALTH CARE ................................................................................... 5 1.4 HOW TO READ THE MANUAL ............................................................................................... 6 1.5 TERMINOLOGY ................................................................................................................. 6
2 BACKGROUND OF A PREDICTION STUDY .................................................................... 8
2.1 INTENDED USE OF THE PREDICTION MODEL: THE HEALTH CARE SCENARIO ...................................... 8 2.2 SCIENTIFIC BACKGROUND .................................................................................................... 9 2.3 OBJECTIVE OF THE PREDICTION STUDY ................................................................................... 9
3 METHODOLOGY ....................................................................................................... 10
3.1 STUDY POPULATION ......................................................................................................... 10 3.2 STUDY DESIGN ................................................................................................................ 10 3.3 SETTING, LOCATION, DATES AND SELECTION METHODS ........................................................... 12 3.4 STATISTICAL POWER......................................................................................................... 12 3.5 OUTCOME AND RISK PERIOD .............................................................................................. 13 3.6 PREDICTORS ................................................................................................................... 14 3.7 MODEL CONSTRUCTION ................................................................................................... 15 3.8 PREPARING VARIABLES FOR THE MODELING .......................................................................... 15 3.9 VARIABLE REDUCTION ...................................................................................................... 17
4 ASSESSMENT OF PREDICTION MODELS ..................................................................... 20
4.1 MODEL FIT .................................................................................................................... 20 4.2 MODEL PERFORMANCE .................................................................................................... 21
5 VALIDATION OF PREDICTION MODELS ...................................................................... 27
5.1 INTERNAL VALIDATION ..................................................................................................... 27 5.2 EXTERNAL VALIDATION ..................................................................................................... 27
6 ASSESSMENT OF CLINICAL UTILITY ............................................................................ 28
6.1 CHOOSING RISK THRESHOLD(S) .......................................................................................... 28 6.2 RECLASSIFICATION ........................................................................................................... 28
7 CONCLUDING REMARKS ........................................................................................... 30
7.1 UNFORTUNATE CHOICES IN PREDICTION STUDIES ................................................................... 30 7.2 THE CONTINUUM OF TRANSLATIONAL RESEARCH ................................................................... 31
OVERVIEW OF KEY QUESTIONS IN PREDICTION RESEARCH .............................................. 32
FURTHER READING ......................................................................................................... 33
REFERENCES ................................................................................................................... 35
4
1 Introduction
1.1 Prediction and personalized medicine
Prediction is the act of forecasting what will happen in the future. Prediction is central to medicine as preventive and therapeutic interventions are prescribed or recommended on implicit or explicit expectations about future health outcomes. Prediction models aim to quantify the probability of these future health outcomes based on a set of predictors. Prediction models are developed, validated and updated in prediction studies. The field of prediction research is gaining importance because of the increasing interest in personalized medicine. Personalized medicine is a medical model in which interventions are targeted to the individual or to risk groups rather than given to populations at large. Prerequisites for personalized medicine are that there is a test or prediction model that can divide a population into subgroups and that there are alternative interventions available to assign to each of the subgroups. Personalized medicine and prediction of outcomes is warranted when an intervention cannot be given to the target population at large because health care budgets are scarce or because the intervention is not beneficial for all individuals from the target population. Examples of the latter are:
- individuals might not respond to treatment;
- individuals might experience harm, either physical or emotional;
- individuals who receive negative screening results do not need expensive/invasive diagnostic workup.
When medical interventions do not work for all patients or when their use may be accompanied by adverse side effects, treatment decisions may be based on a prediction of the (expected) treatment response or adverse side effects. Interventions may be given to individuals who have the highest predicted probability of treatment response or the lowest risk of adverse side
effects. Which threshold should be used to make these decisions follows from a cost-effectiveness analysis, in which the expected benefits are evaluated against the expected harms or costs. Decisions about which harms and benefits should be considered in the evaluation is subjective but often consensus-based. Because of their intended use in health care, prediction models need to be:
- usable, which means designed such that they can be used at large scale. The criterion of usability not only requires relevant and clear definition of the predictors, target population and outcome, but also that the assessment of predictors is affordable, reliable and feasible;
- useful, which means produce information of value, e.g., to enable or improve decisions about treatment or surgery.
Understandably, these requirements have implications for the design and conduct of prediction studies.

5
1.2 Prediction research and etiological research
Prediction research shares many similarities in the design and conduct with etiological studies. Both may assess the relationship between a set of variables and an outcome of interest; use the same statistical model to quantify the association for each of the variables; and use the same metrics to describe how well the model fits the data. There are however several notable differences. Prediction research is not aimed at understanding the disease process, but at investigating the use of risk prediction in health care for informing individuals and for assisting decision making. This intended health care use has implications for the choice of variables (predictors), outcome and study population. Also, the assessment includes additional measures that quantify the predictive ability and clinical utility of the model. Clinical or public health relevance and feasibility are evaluation criteria that influence prediction studies but play a lesser role in etiological studies.
1.3 Prediction models in health care
Prediction models are used in health care to assist doctors in making medical decisions and to inform about risk of disease or prognosis. Examples of prediction models are:
- Framingham 10-year Risk of General Cardiovascular Disease, for the prevention of cardiovascular disease;1,2
- APGAR score, to quickly assess the health of newborn babies;3
- APACHE II Scoring System, a severity of disease classification for emergency care;4
- Glasgow Coma Scale, to assess the level of consciousness after acute trauma.5 Since a few years, there is an increasing availability of health risk assessments via the internet and mobile apps. Examples of online prediction models:
- Diabetes Risk Test from the American Diabetes Organization, which calculates a risk score for diabetes;
- My Health Advisor from the American Diabetes Organization, which gives risk estimates of diabetes and heart attack;
- Swine Flu Risk Calculator by MDIndia, which gives a verbal risk statement for possibility of having contracted swine flu;
- One-Minute Osteoporosis Risk Test by International Osteoporosis Foundation, which calculates the risk of osteoporosis;
- Teen Suicide Risk Calculator by University of Maryland Medical Systems, calculates the relative risk (percentage more or less likely) of teen suicide;
- Alcohol Screening Test by AlcoholScreening.org, a partnership of The Partnership at Drugfree.org and Boston University, which calculates the percentage of the population that drink more than you.
The scientific basis of prediction models is highly variable. Many clinical models are well-designed, thoroughly validated, with demonstrated utility and cost-effectiveness, but many online risk models have never even been investigated.

6
1.4 How to read the manual
This manual provides an introduction to the main topics of prediction research. After reading the manual, readers should have a good understanding of the key methodological and analytical considerations in prediction research, and be able to read scientific articles on prediction studies critically. The manual follows the structure and contents of scientific papers. It addresses the main topics and considerations that are—or should be—seen in empirical studies and mentions advanced topics and concepts at the end of each section. For example, the manual discusses logistic and Cox Proportional Hazards regression analysis, which are used in the vast majority of prediction studies as the statistical model, but does not address other models and algorithms, such as support vector machine learning and neural networking. The manual briefly discusses each topic and its relevance to the detail that is needed for understanding empirical articles, but it does not explain methods and measures completely or in detail. For further reading, virtually on all topics addressed in this manual, recommended textbooks on prediction and regression modeling are:
- Harrell FE. Regression modeling strategies: with applications to linear models, logistic regression, and survival analysis. New York, NY: Springer; 2002.
- Kleinbaum DG, Klein M. Logistic Regression: A Self-Learning Text (Statistics for Biology and Health). New York, NY: Springer; 2002.
- Steyerberg EW. Clinical prediction models: a practical approach to development, validation, and updating. New York, NY: Springer; 2009.
A longer list of background literature cited throughout the manual is provided in the end.
1.5 Terminology
Many topics and concepts in prediction research are used under different names, either with the same or a slightly different meaning. Many differences are related to whether the study predicts disease in unaffected individuals or prognosis or treatment outcome in patients. Below a list of terms that are—or can be—used to describe similar concepts:
- Risk factors, prognostic factors, predictive factors, predictors, and variables. The term ‘risk factors’ is generally used to describe factors that are causally related to getting the disease, ‘prognostic factors’ refer to factors that affect prognosis of disease, and ‘predictive factors’ to factors that relate to treatment outcome. Predictors are the variables in the prediction model irrespective of whether they are causally related or what outcome they predict. Predictors may be causally related to the outcome, but not necessarily.
- Prediction model, prediction model, and prognostic model. A prediction model is a model that aims to predict the outcome; its variables may be causally related to the outcome or not. Risk and prognostic models may also refer to etiologic models that aim to explain risk and prognosis. The statistical handling of all models is the same, but the population, variable and outcome selection might differ.
- Patients/nonpatients, cases/controls, people who will/will not develop disease, events/non-events. Most prediction models aim to estimate disease risk in individuals who do not have the disease. While such models formally distinguish between people

7
who will develop the disease and those who will not, researchers often write that they distinguish between patients and nonpatients or between cases and controls. When prognostic outcomes are predicted, authors typically write about events and non-events.
For readability, all examples in this manual refer to the prediction of disease in a population that did not have the disease at baseline. The prediction models include predictors or variables, patients refers to people who developed the disease over time and nonpatients to those who did not.
8
2 Background of a prediction study
KEY QUESTIONS
• What is the intended use of the prediction model?
• What needs to be predicted, in whom, how and for what purpose (why)?
• What prediction model is currently used in practice?
• What is known about the predictors?
• Is the study a development or validation study, or both? The background of the study, described in the background section of a scientific article, informs about what is already known on the topic, and what the gaps in knowledge are that justify the study. For prediction studies in health care, the background should at least address two major topics: the intended use of the model and the scientific background of the model and its predictors.
2.1 Intended use of the prediction model: the health care scenario
The intended use of the model refers to the health care scenario in which the use of the prediction model is foreseen: what is the model going to be used for? The health care scenario specifies what needs to be predicted, in whom, how and for what purpose (see Table 1). The outcome that is predicted, the target population and the prediction model determine the predictive ability, while the purpose of the model indicates when the predictive ability is high enough to be useful in health care.
Table 1 What is predicted, in whom, how, for what purpose?
Health care scenario Implications for research Examples
What is predicted, Selection of outcome 10-year risk of type 2 diabetes
in whom, Selection of population Young adults
how, Selection of predictors and model
Age, sex, and 37 genetic susceptibility variants, in logistic regression model
for what purpose? Specification of aim Stratify prevention with supervised exercise program for the high-risk group
Specification of the health care scenario is important because: (1) The predictive ability of a prediction model varies between populations. A prediction model that accurately predicts disease in individuals with early symptoms or certain age groups might not predict disease with similar accuracy in the general population. (2) Whether the predictive ability is high enough depends on the purpose of testing. Prediction models in health care are used to:
- identify at-risk groups for preventive interventions;
- assist and support doctors in making medical decisions about procedures, treatments, medications, and other interventions;
- inform individuals about their risks or progression of the disease to allow them making plans for the future.

9
A description of the health care scenario should also acknowledge prediction models that are being used in practice, if pertinent. These models provide a point of reference for the interpretation of the predictive ability and utility for the model under study. The comparison with earlier studies on existing models can also inform whether the study investigate a representative population and a relevant outcome and follow-up time.
2.2 Scientific background
A summary of the scientific basis of the predictors should inform how ‘established’ the predictors are. Is the prediction model based on common sense risk factors that have been frequently replicated, or based on predictors that are identified in the study itself from a larger set of candidates? When predictors were discovered in earlier studies, the prediction study can be considered as a confirmation of their association with re-estimation of their effects. When predictors are selected in the study itself, subsequent validation of the prediction model is key, because it is less certain that the association of the predictors replicates in independent data. If the study validates or updates an existing prediction model, the summary should also include essential study and population characteristics of the prediction studies in which the original model was developed, including quantitative assessments of the model performance (see Chapter 4) to justify validation efforts. This summary should be extended to prediction models that are being used in practice, if pertinent, to inform what level of predictive ability needs to be achieved in order for the new prediction model to outperform existing ones.
2.3 Objective of the prediction study
Prediction studies address the development of a prediction model, the validation of a prediction model or both. A development study selects predictors, estimates relative weights and assesses the model performance. A validation study re-applies a prediction model in another population using the same relative weights to reassess the model performance. This other population can be an entirely different population (for example from another hospital) or the same population (for example when the population is split in half for the development and validation, respectively). Chapter 5 discusses the validation of prediction models.
A prediction study? While their difference seems clear, it may be hard to distinguish prediction studies from etiological studies in practice because the methodology and analysis largely overlap. Also, etiological studies tend to use words like ‘predict’ interchangeably with ‘associate’ no particular interest in the predictive ability of the multivariable model. In case of doubt, the rationale for the study and the analysis might inform whether the article is about prediction or multivariable association. The rationale for etiological studies is about understanding the etiology of the disease with less interest in the potential benefits for health care. Also, the metrics used to assess the multivariable effects are more often measures of explained variance than decision analytic measures such as the area under the ROC curve and reclassification measures (see Chapter 4 and 6).

10
3 Methodology
KEY QUESTIONS
• Is the study conducted in a sample of the target population?
• Is the study design representative for the health care scenario?
• Are the setting, location and dates relevant?
• Is the sample size and statistical power sufficient for the aim of the study?
• Are the outcome and risk period clinically relevant?
• Are all relevant predictors available?
• Does the statistical model fit the data?
• How are missing data and outliers handled? Are variables (re)coded in a meaningful way?
• What method is used for reducing the number of variables in the model?
3.1 Study population
In prediction research, the study population needs to be representative of the population in which the model will be used, the target population. The target (or source) population, from which the participants are selected, is always a selection of the general population, namely a subgroup defined by, e.g., age, gender, or the presence of certain risk factors. For example, prenatal screening tests are, evidently, only used in pregnant women, and risk tests for Alzheimer’s disease typically target older but not young people. In these subgroups, the risk of disease is higher than in the rest of the population, to a degree that warrants further investigation for targeted intervention.
Eligibility criteria Eligibility criteria specify who can participate in the study and who not. Inclusion criteria describe the characteristics of the target population and exclusion criteria list the exceptions, often practical reasons why some participants who do meet the inclusion criteria cannot join the study. Participants may be excluded if they don’t master the language in which the study is conducted; if they cannot be reached after calling three times for a telephone interview; or if they are unable to visit the recruitment center.
A clear description of the study population is essential to judge the validity and generalizability of the study and interpret the model performance in the appropriate context. If the prediction model is investigated in a population that is not representative of the target population, it cannot be assumed that the predictive ability of the model will be similar in the target population. In that case, the model still needs (external) validation in the target population.
3.2 Study design
Prediction models are mostly used to predict future disease, but not only. They can also be useful as a screening test to select individuals for further diagnostic workup, e.g., in situations where diagnostic tests are invasive, expensive or have serious side effects. The study design should reflect this time horizon. Prediction studies are conducted preferably in

11
cohort studies, but case-control designs are also seen. Importantly, participants need to be unselected for the predictors in the prediction model and for the disease status.
Cohort study In cohort studies, a group of individuals is followed over a period during which the occurrence of disease is observed. The cohort is typically a selection of the general population, based on certain characteristics such as gender or age. Different types of cohort studies are distinguished, such as:
- Prospective cohort study, which prospectively measure risk factors and disease status over time. In this prospective study design, variables are defined before the collection of data;
- Retrospective cohort study, which involves the use of historical data. In retrospective study design, variables are defined after their collection;
- Cross-sectional cohort study, in which the collection of predictors and disease status takes place at the same moment in time.
Case-control study In case-control studies, participants are selected based on the presence or absence of disease. These studies compare two groups, patients (cases) and nonpatients (controls), typically to identify risk factors of disease. For prediction studies, this study design is not preferred because absolute risks of disease cannot be calculated due to the mode of participant selection. For example, if an equal number of cases and controls are selected, the ‘absolute risk of disease’ in this study would be 50%. The design can be used to assess the discriminative accuracy (Chapter 4) when the cases and controls are random samples of all patients and nonpatients, rather than comparing severe cases with healthy controls. A major concern about the study design is whether the design is representative for the health care scenario. When health care needs a prediction model that predicts, say, 10-year risk of disease, cross-sectional or case-control studies are not the most optimal study designs. They cannot tell whether the predictors preceded the onset of the disease, and lead to overestimations of the predictive ability if prospective association is erroneously assumed. Retrospective cohort studies are not optimal if essential predictors were not measured or measured in a suboptimal way. The latter might easily occur due to technological developments.
Is the study design really prospective? Empirical studies on prediction often use data that were collected earlier for other purposes, for example in large population-based follow-up studies as the Framingham study, Rotterdam study, and the Women´s Health Initiative. These studies are prospective follow-up studies, but prediction models developed in these populations do not necessarily benefit from the prospective design. Large-scale population studies are not designed with a specific research question in mind, and variables that are essential for the prediction of a specific outcome may not have been measured in the most optimal way, if at all. Genetic predictors are a fortunate exception, provided that blood samples were available from all individuals who participated in the baseline measurements.

12
3.3 Setting, location, dates and selection methods
The study setting tells where study participants are recruited from. For example, individuals from the general population can be selected from certain neighborhoods, through the workplace or via general practitioners. The location refers to countries, regions and cities where participants are recruited, and the dates refer to the time points of data collection. Data can be collected de novo, specifically for the purpose of the study, or be re-used from other studies. Methods of participant selection refer to the way participants are selected to take part in the study. For example, participants can be randomly invited to attend the study, be referred or self-selected.
Knowing the study setting, location, dates and selection methods helps placing the study results in a historical, technical and societal context. This information is essential to judge whether the predictive ability of a prediction model will be the same when, e.g., diagnostic criteria, health care protocols or medical technology have changed since the collection of data. New technological developments and inventions may have improved the predictive ability of prediction models that include, e.g., imaging variables. Also, changes in the demographic composition and health status of the population, in particular the sharp increase in obesity prevalence, may have altered the relative impact of risk factors on the development of many common diseases. Finally, study setting might impact the predictive ability, because not all hospitals or clinics have the same case-mix of patients, and the predictive ability of a prediction model might vary between countries when health outcomes are influenced by the level of care that differs between countries or even regions.
3.4 Statistical power
In prediction studies, statistical power is needed to obtain effect estimates and predictions that are sufficiently reliable and precise. Yet, a priori specifying the required sample size of a prediction study is challenging as formal power and sample size calculations do not exist. As a rule of thumb, a study should have at least 10 events per variable for the development and 100 per variable for validation of the prediction model (see 6, page 50 for references). In practice, most prediction studies are conducted using previously collected data, which implies that the sample size is fixed and not necessarily large enough for the prediction study. The problem of small sample size is that the coefficients of the prediction model become unstable. The estimates for the coefficients will fit too well to the data (overfitting). As a consequence, the predictive performance is expected to be higher in the development data, but substantially lower upon independent validation (see Chapter 5).
Is the sample size really that large? ‘Influence of personal characteristics of individual women on sensitivity and specificity of mammography in the Million Women Study’ (2) suggest that the analysis was conducted in a million women. Yet, the actual analysis for sensitivity was conducted in 724 women and the specificity in over 120,000. This is an extreme example of the difference between total and effective sample size, which is relevant particularly in population-based cohort studies.

13
3.5 Outcome and risk period
The outcome and risk period specify what is predicted by the prediction model, for example, the 10-year risk of type 2 diabetes or the 30-day mortality after hip surgery. In prediction studies, the vast majority of outcomes are binary variables and occasionally categorical outcomes (three or more categories) are seen. This manual focuses on the development of disease, but other examples of outcomes are mortality, disease stages (adverse prognostic outcomes), recurrence of events and adverse drug reactions. Binary variables can also be constructed from continuous variables by using threshold values. Examples include blood pressure and hypertension, and glucose level and diabetes. An important difference between outcome definitions in etiological and prediction research is that outcomes in prediction research need to be clinically relevant. In etiological research, where the aim is to understand the cause of disease, the outcome can be an intermediate state of the disease or a proxy. The intended application of the prediction model dictates the definition of the outcome. The specification of the outcome is often straightforward, but it can involve making arbitrary decisions. For example, a prediction model can be constructed for Alzheimer’s disease, but also for dementia which includes other forms as well. The choice between the two depends, among other factors, on the purpose of the model. When the prediction model is intended to select individuals for a preventive treatment that works for Alzheimer’s disease but not for other types of dementia, the outcome needs to be Alzheimer’s disease. Yet, when an intervention is relevant for all forms of dementia, e.g. regular monitoring of cognitive symptoms, the outcome should be dementia. The risk period refers to the time period during which the occurrence of disease is observed. The length of the period is determined by clinical relevance: short risk periods (say, several months or <1 year) may be relevant for post-surgical outcomes and adverse treatment effects, while long risk periods (say, >5 or >10 years) are generally more relevant for the risk of disease. The length of the risk period depends on many factors, including the age (and remaining life expectancy) of the target population. It needs to be chosen such that there is variation in risk so that some can be at higher and others at lower risk. For example, 5-year risks of dementia might be very relevant for elderly people, but not for young adults.
An important criterion for outcome variables in prediction research is that they are of interest and relevant to the users of the prediction model. What is the most appropriate outcome may vary whether the model is to be used by health care professionals, patients, funders or policy makers. Also, the outcome that can be predicted with highest predictive ability may not be the one that is most relevant. Short-term risks of disease are typically predicted with higher accuracy than long-term risks, but these may not be relevant when most people develop the disease after that. Therefore, the challenge is not to construct a model with the highest predictive ability, but with the highest health care relevance. In practice, this will ultimately be a trade-off.
Also, as prediction studies are generally conducted using available data, the risk period is usually a given and not necessarily relevant from a health care perspective.

14
Are the outcome and risk period really useful? Many prediction studies are being conducted without a specific application in mind. This may not hamper the validity of the analysis, but is an extra reason to evaluate the relevance of the study critically. A recent study developed and validated a test based on a set of ten lipids from peripheral blood that could predict Alzheimer’s disease with over 90% accuracy. Closer reading of the paper learned that the definition of the outcome also included amnestic mild cognitive impairment and that the risk period was 2–3 years.7 Evidently, a risk period of 2-3 years has limited value for people at risk and for health care professionals.
3.6 Predictors
The selection of predictors refers to the selection of candidate variables for inclusion in the prediction model. Types of predictors include demographics (such as age, sex, ethnicity), type/severity of disease (for example symptoms, tumor profiles), history characteristics (for example risk factors, duration), comorbidity, physical functional status (for example scores), subjective health status (for example quality of life), and genetic predisposition.8 Predictors are primarily selected on the basis of their association with the development of disease, but with the future application of the model in mind, other considerations are relevant as well. These include the financial costs to retrieve the data, the burden for the individual being tested, availability of data for the user, and the reliability of the variable assessment (biological variability, observer variability). These considerations ensure that the application of the prediction model is feasible in the health care scenario for which it is foreseen. For example, a prediction model that is intended to be used by general practitioners should not include imaging variables as these data may not be available at large scale. Predictors can be causal risk factors, but do not need to be. Any variable that is robustly associated with the disease can be used as a predictor. Robust association means that the relationship between the predictor and disease does not vary with minor differences in the constitution of study populations or by the definition and assessment of variables. Robust association is important to ensure that the prediction model has similar predictive performance when it is assessed in independent populations (see Chapter 5). The predictors should preferably be identified based on knowledge (scientific literature), rather than simply be selected from available data. In the latter scenario, it is likely that these new predictors are highly predictive in the specific dataset, as that is why they were selected, but that their predictive ability will be lower in an independent dataset. Validation of the prediction model is essential as the generalizability is not evident. A disadvantage, and reason for caution, of using available data is that important predictors may be missing or be assessed by proxy variables. This reduces the relevance of the study.

15
3.7 Model construction
Selection of the statistical model A statistical model is used to express the relation between the predictors (variables) and the disease. The most commonly used statistical models in empirical prediction studies are logistic regression and Cox proportional hazards regression. Both models address binary outcome variables and can examine the effect of multiple continuous, categorical or binary predictors. Their main difference is the assumption about follow-up time. Logistic regression is used when studies have no or fixed follow-up time for all participants, such as case-control and cross-sectional studies or prospective studies with a fixed follow-up period. Cox proportional hazards regression is used when studies include participants with varying follow-up time. The latter is the case for many large-scale prospective cohort studies where participants were included over a period of several years and participate until they die, move or are lost to follow-up. In many ways, the results from logistic regression are easier to interpret than those of Cox proportional hazards regression, which makes it tempting to apply logistic regression even when it is not the most appropriate analytic model.
3.8 Preparing variables for the modeling
Before data are analyzed, missing data and outliers need to be inspected and handled, and variables may need to be recoded before they can be included in the model.
It is important to investigate, understand and specify the handling of data as choices may impact the predictive performance of the model. The nature and quantity of missing data, the origin of outliers, the non-normal distributions of continuous variables, the reasons for recoding and the explanation of interactions should be documented and transparently reported. This is especially relevant when a prediction model has promising predictive performance but the validation of the model is not examined in the same study. After all, decisions about data handling should be based on what makes sense and not on what yields the best prediction model.
Missing data Missing data means that data are not available for one or more variables for one or more individuals. In prediction studies, as in other studies that use multivariable regression analysis, the amount of missing data typically ‘adds up’: while each variable may have only a limited number of missing data, the total number of participants with missing data for at least one variable of the prediction model, often cannot be ignored. How the problem of missing data is best solved, depends on the randomness and amount of the missing data. Missing data can be completely at random, at random, or not at random (see Table 2).9 Data is missing completely at random if no observed or unobserved variables can predict whether data will be missing. Missing at random means that other observed variables, but not unobserved variables, can predict missingness and missing not at random occurs when one or more unobserved variables predict the missingness of data.

16
Missing data is common in observational studies and is seldom completely random. Missing data can be solved either by removing participants that have missing data, if the sample size is large enough relative to the amount of missing data, or by ‘filling in’ the missing data using imputation methods. Several imputation methods exist, from simply imputing by the mean value to model-based imputation methods. The best method depends on the type and amount of missing data.
Table 2 Mechanisms of missing data9
Mechanism Description of the mechanism Example
Missing completely at random
Probability of missingness does not depend on values of other observed and unobserved variables nor on the variable itself
Accidentally flipping two pages in the questionnaire, dropping test tubes, data entry errors on Friday afternoon
Missing at random
Probability of missingness depends on values of other observed variables, but not on unobserved variables or variable itself
Men are more likely to skip questions about emotions than women; older people may less likely come to the assessment center
Missing not at random
Probability of missingness depends on unobserved variables or variable itself
Questions about income may be more often missing among participants with higher income (variable itself) or among depressed people (unmeasured variable)
Outliers Outliers are observations with extreme values compared to the average values for the variable in the dataset. Outliers can be true and biologically plausible values of the variable, or be data entry errors. Outliers are a problem when they lead to biased estimates of averages and standard deviations (SD), which occurs predominantly when sample size is small. The most common method to detect outliers is the box plot, and common solutions to deal with them is removing the outliers or truncation. Truncation means that extreme high and low values are recoded to the highest and lowest reasonable values, to reduce their influence on the regression coefficients and prevent biased estimation of regression coefficients. Evidently, when extreme values are data entry errors, they are corrected without truncation.
Transformation and coding of variables Transformation of continuous variables refers to altering their distribution, and coding of variables refers to reducing the number of values. Continuous variables may need to be transformed or categorized if the distribution of their values is problematically skewed. Categorization can also be considered when there are many plausible outliers. Transformation and recoding are done to prevent biased estimation of regression coefficients. Categorical variables can be recoded into fewer categories if the number of values is too large or when some values have low frequencies. Recoding will reduce the number of (dummy) variables in the model, which is beneficial for more reliable predictions.

17
Is the coding of variables logical? While there is guidance on when to transform continuous variables into categorical variables, there is no general way on how to do that. Continuous variables can be recoded into binary variables or in variables with a limited number of categories, but how many categories and which threshold values to use is largely a subjective decision. When there is much flexibility in choices, as is for continuous variables, it is important to review critically whether the coding is intuitive. For example, body mass index (BMI) is generally recoded into <18, 18-25, 25-30, >30, following the definitions of underweight, normal weight, overweight and obesity. Coding BMI into <23, 23-24, 25-29, >3010 or <22.3, 22.3-25.1, >25.111 is unusual and this alternative coding should be motivated.
Interaction effects An interaction between two predictors means that the effect of one variable depends on the value of the other. When interaction between two predictors is anticipated, an interaction effect can be included in the prediction model. Table 3 gives examples of possible interactions that can be considered in prediction models. When a variable, say gender, interacts with several predictors in the model, it should be considered whether making separate prediction models for men and women is warranted.
Table 3 Examples of interactions to consider in prediction models (Adapted from 6,8)
Interaction Effect
Severity of disease x treatment Less benefit with less severe disease Center x treatment Benefit varies by treatment center Calendar time x predictors Increasing or decreasing impact of predictors over the years Age x predictors Older subjects less affected by risk factors; or more affected by certain types of disease Follow-up time x predictors Non-proportionality of survival effects, often a decreasing effect over time Season x predictors Seasonal effect of predictors
3.9 Variable reduction
The construction of a prediction model generally involves variable reduction in which a selection of predictors is made from a larger pool of candidate predictors. There are several reasons why reduction of variables is considered:
- when the list of candidate predictors is long relative to the sample size of the study. The number of variables that can be included in a model is restricted by the number of events that occur in the population (see 3.4).
- when predictors are strongly correlated, so that the inclusion of one variable might be enough to capture the impact of both. When the correlation between two predictors is extremely high (multicollinearity), the exclusion of one of the predictors is needed to prevent that the model estimates become unstable.
- when a small number of predictors is preferred. The principle of parsimony implies that the model with the least number of predictors is preferred among alternative models with the same predictive ability. A small number of predictors may also be preferred if the collection of data requires the allocation of money and time, technology or personnel. In such instances, the preferred model may not be the model with the highest

18
predictive ability, but the model for which the inclusion of additional predictors was not worth given the expected increment in predictive ability.
Variable reduction methods Several approaches are available for the reduction of variables. The selection can be made manually, based on expertise and prior knowledge, or be automated. In the latter case, the statistical program will select variables based on a set of selection criteria, which specify when variables should be entered in the model and when should they be excluded or not considered. These might be the effect sizes of the variables, their statistical significance or some other criterion. The main approaches for the selection are:
- forward selection: starts with no variables in the model, selects candidate variables one by one based on the chosen selection criterion, fits the model in every step until adding variables does not further improve the model, i.e., no other variable meets the selection criterion given all variables already in the model;
- backward selection: starts with a full model that includes all candidate variables, fits the model and eliminates variables one by one based on the chosen selection criterion until no further improvement is observed;
- stepwise selection, combines the two previous methods: starts with no variables in the model, selects a variable based on the chosen selection criteria, fits the model and adds or removes variables based on the chosen selection criteria until no further improvement is observed.
Candidate predictors can be considered eligible for selection all at the same time, or in blocks. In the latter case, the selection starts with a first block of variables, using one of the approaches, until no further improvement is observed. Then, the next block is considered, and so on. This hierarchical approach is preferred when easily obtainable variables should be considered before variables that are obtained from expensive or burdensome testing, such as the results of an MRI or a cardiac stress test. For example, a hierarchical selection procedure could separately consider demographic predictors, self-report variables, simple tests and expensive tests such as imaging. This hierarchical approach prevents that expensive variables enter the model first by allowing them only in the model when they add information to the other variables. Automated approaches are a simple strategy to reduce the number of variables in a prediction model, but they have their disadvantages. The selection of variables might be unstable when variables differ only minimally on the inclusion or exclusion criteria. Forward selection is claimed to avoid overfitting, but cannot adequately handle interaction effects. The latter variables are more likely to stay in a model with a backward selection approach, but that again is criticized for being strongly data-driven, leading to overfitting of the model. The best strategy is to monitor the decisions that are made by these automated methods and intervene if necessary.

19
Inclusion of predictors for face validity When predictors are entered simultaneously in a prediction model, it is common that the contribution of some is no longer statistically significant. These predictors are removed from the model. An exception might be when prominent risk factors are no longer significant. Such variables are often kept in the model to retain the model’s face validity: a model might not be trusted when prominent risk factors are not included. For example, gender might not be a significant predictor in a prediction model for coronary heart disease (CHD) when blood pressure and cholesterol level are simultaneously considered, when the higher risk of CHD in men is already taken into account through the effects of higher blood pressure and higher cholesterol level.

20
4 Assessment of prediction models
KEY QUESTIONS
• How well does the model fit the data?
• What is the predictive ability of the model?
• What is the discriminative accuracy of the model?
4.1 Model fit
The goodness of fit of a model describes how well the model fits the data. Measures of model fit assess the discrepancy between observed and estimated values, which for prediction models means the discrepancy between observed and predicted risks. Model fit of prediction models is assessed by calibration measures.
4.1.1 Calibration Calibration refers to how well the predicted risks from the prediction model match the actual observed risks. This is graphically displayed in a calibration plot with the predicted risks (x-axis) against the observed risks (y-axis) for groups defined by e.g., deciles of predicted risks (Figure 1). When a prediction model is well calibrated, the calibration curve follows a 45-degree line (slope = 1). Deviations from that reference line indicate over- or underestimation of the predicted risks by the prediction model. The right graph in Figure 1 illustrates predicted risks that are higher than observed risks.
Figure 1 Calibration plot
Calibration in the large and Hosmer-Lemeshow test Two measures of calibration are seen in prediction studies: calibration in the large and the Hosmer-Lemeshow test. Calibration in the large measures the difference between the average of all predicted risks and the average risk of disease in the population. The Hosmer-Lemeshow test is a statistical test for goodness of fit, a quantification of the calibration plot that compares observed and expected outcomes within deciles. A disadvantage of the Hosmer-Lemeshow test is that it is not able to detect substantial miscalibration in small samples and oversensitive to minor miscalibration in large samples. Inspection of the calibration plot is essential. Assessing calibration is essential in the evaluation of a prediction model, but it is often not reported. Yet, estimations of risk are based on a prediction model that is fitted on a dataset,

21
and it cannot be assumed that this fit is evidently good. Assessment of calibration is particularly relevant in the validation of the model, when the model is applied to a dataset in which it was not developed and may not fit adequately. A model that does not fit yields incorrect risk estimates.
4.2 Model performance
Model performance refers to how well the prediction model estimates risks. Model performance is indicated by the predictive ability and discriminative accuracy.
4.2.1 Predictive ability Predictive ability refers to the variation in predicted risks and is indicated by the distribution of predicted risks and by the positive predictive value (PPV) and negative predictive value (NPV) at (possible) risk thresholds.
Risk distribution A risk distribution refers to the frequencies of all possible risk values in the population. Higher predictive ability requires more variation in predicted risk. Risk distributions can be presented as a histogram (bar chart), density plot (Figure 2), or in a table.
Figure 2 Risk distributions and positive/negative predictive value (PPV/NPV)
Positive and negative predictive value The PPV and NPV indicate the risks of disease for risk groups that are defined by a certain risk threshold (Figure 2). The PPV is the percentage of patients, or the risk of disease, among persons with predicted risks higher than the threshold value. The NPV is the percentage of nonpatients, or one minus the risk of disease, among those with predicted risks lower than the threshold.

22
4.2.2 Discriminative accuracy The discriminative accuracy indicates how well a prediction model can distinguish between patients and nonpatients. The discriminative accuracy is indicated by the area under the receiver operating characteristic curve (ROC curve; AUC) and by the sensitivity and specificity for specific risk thresholds. Measures of discrimination are best understood when the risk distribution is presented separately for patients and nonpatients (Figure 3).
Figure 3 Risk distributions in total population (left) and for patients and nonpatients separately (right)
Sensitivity and specificity Sensitivity is the percentage of patients that are identified by predicted risks higher than the threshold value, and specificity is the percentage of nonpatients that are identified by predicted risks lower than the threshold (Figure 3). Lowering the risk threshold, i.e., moving the risk threshold to the left in the figure, typically increases sensitivity and decreases specificity. Sensitivity and specificity are different from but related to the positive and negative predictive value. Figure 4a shows a 2 by 2 contingency table from which all measures can be calculated. Figure 4b shows how the same percentages are calculated from the separate risk distributions of patients and nonpatients. There is no general level for what sensitivity and specificity is good or excellent. That evaluation largely depends on what the prediction model is going to be used for. Some applications ask for prediction model with a risk threshold that has high specificity with acceptable sensitivity, others (such as screening tests) require high sensitivity with acceptable specificity, and for again other applications (such as selection for invasive, irreversible procedures) both sensitivity and specificity need to be very high.

23
Figure 4 From risk distributions to a contingency table for a certain risk threshold (T)
Area under the ROC curve The AUC (also seen as AUROC or c-statistic) is a measure of discriminative ability for continuous predictors such as prediction models. The ROC curve is drawn in a ROC plot that presents sensitivity against 1-specificity (Figure 5). The curve connects the combinations of sensitivity and specificity for all possible risk thresholds. AUC is the magnitude of the area under this curve.
Figure 5 ROC curve
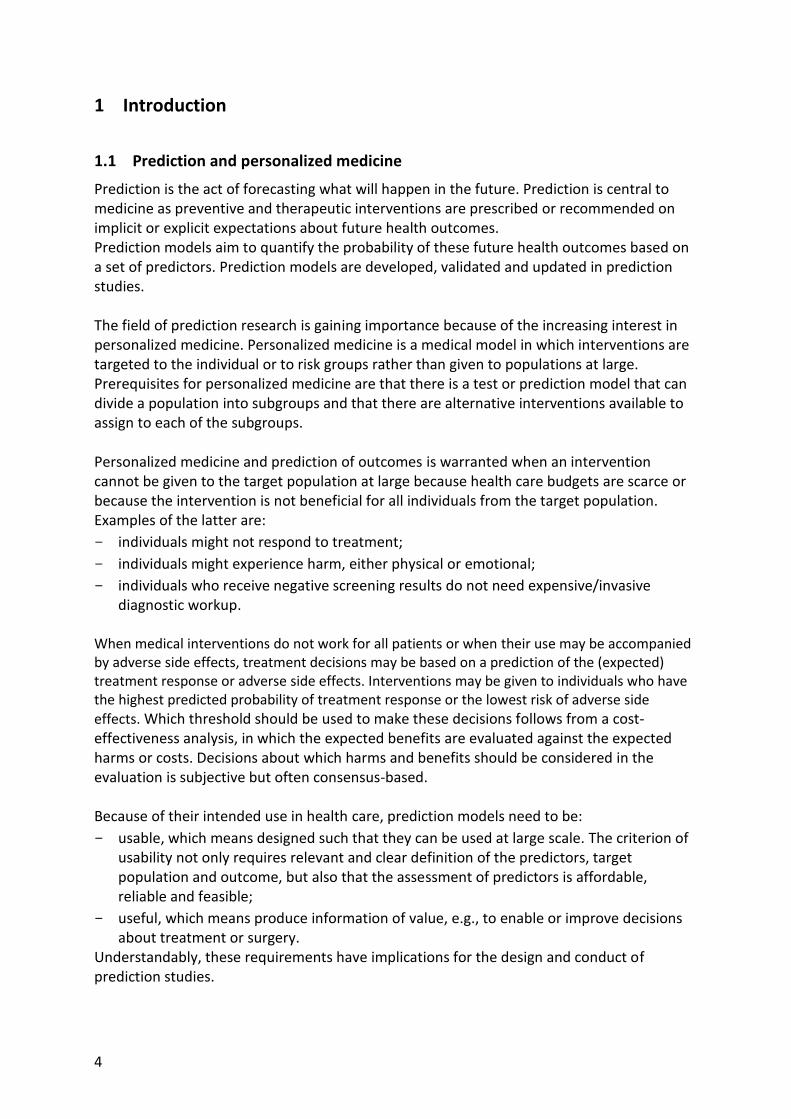
AUC is explained as the probability that a randomly chosen patient has a higher predicted risk than a randomly chosen nonpatient. When the risk distributions of patients and nonpatients are entirely separated, all patients have higher risks than all nonpatients and AUC = 1 (or 100%; Figure 6). When the risk distributions completely overlap, the probability that a random patient has a higher risk than a random nonpatient is 50/50 or 0.50. This explanation illustrates that AUC is a measure of the degree of overlap between the risk distributions of patients and nonpatients, and independent of disease risk. AUC is used to assess the discriminative accuracy of a prediction model as well as to quantify the improvement when predictors are added to the model.
Predicted
risk Patients Nonpatients Total
≥ T True positive (TP)
False positive (FP)
TP + FP
< T False negative (FN)
True negative (TN)
FN + TN
Total TP+FN FP+TN 100 %
A B

24
AUC has been criticized for being insensitive to the addition of strong predictors and for lacking an intuitive interpretation.12 The insensitivity and interpretation are best understood by knowing that AUC essentially is a rank order test, ranking the predicted risks of patients and nonpatients. Improving AUC requires that the rank order of patients and nonpatients is changed. Changing the rank order is easier when the two risk distributions overlap, but needs a very strong predictor when they are more separated (Figure 6). Like for sensitivity and specificity, there is no general threshold level that is considered a ‘good’ AUC. The level of AUC that is needed depends on the intended use of the prediction model. Higher AUC is needed when a prediction model is used to decide on expensive or invasive interventions compared to when it is used to stratify population screening programs or recommend interventions that are inexpensive with little harm, such as diet and exercise. Also the interpretation of the improvement in AUC has not uniform labeling. The interpretation should be based on the absolute value of the improvement and not on the statistical significance. When the absolute value of the improvement is not large, the prediction will not be much better, despite statistical significance. Similarly, interpretation of AUC should be claimed only for changes in the first or second decimal, not in the third decimal, and be considered in light of the (lack of) validation efforts and with the future application of the prediction model in mind. The improvement in AUC should also be evaluated in light of the extra efforts it costs to assess the additional predictors: a larger improvement is needed to justify imaging scans than to add a self-report question.
Does the addition of predictors really improve the discriminative accuracy? AUC is commonly used as a measure to indicate the predictive ability of a prediction model, but there is no ‘gold standard’ for the interpretation of the value or of the improvement in AUC when updating a risk model. As a result, an enormous variation in interpretations are seen, including many overinterpretations. A 2008 (much has improved since) paper on the prediction of type 2 diabetes interpreted an AUC increase from 0.900 to 0.901 as ‘slightly better prediction’.13 Another paper on the prediction of colorectal cancer concluded that the discriminatory ability of 14 genetic variants “for individual risk prediction [was] poor (AUC = 0.58), [but] they may allow subgroups of the population at different CRC risks to be distinguished”.14 The latter is unlikely useful when the AUC is that low.
25
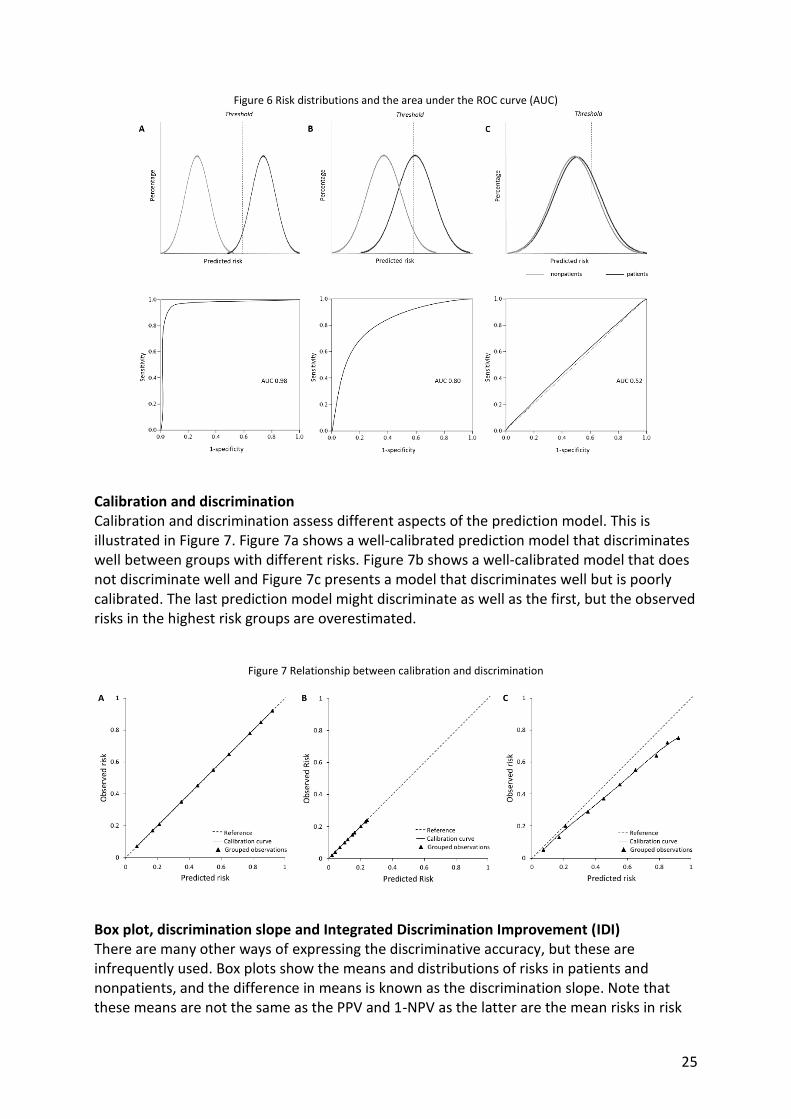
Figure 6 Risk distributions and the area under the ROC curve (AUC)
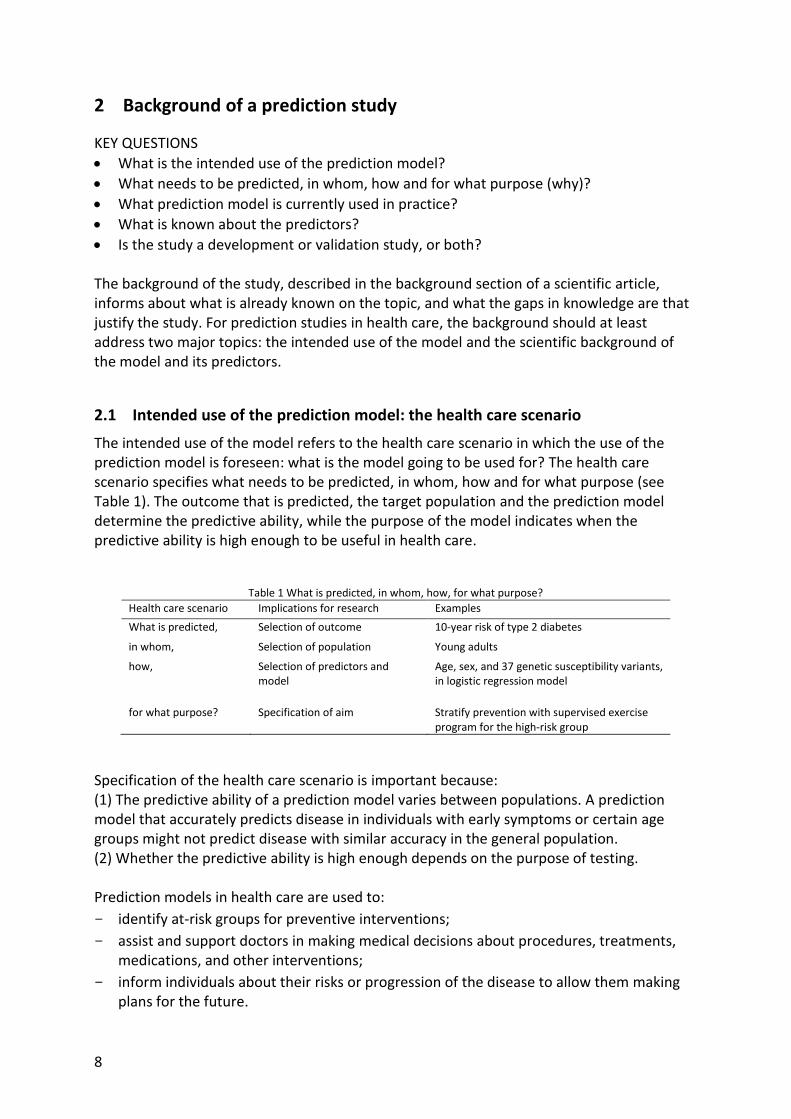
Calibration and discrimination Calibration and discrimination assess different aspects of the prediction model. This is illustrated in Figure 7. Figure 7a shows a well-calibrated prediction model that discriminates well between groups with different risks. Figure 7b shows a well-calibrated model that does not discriminate well and Figure 7c presents a model that discriminates well but is poorly calibrated. The last prediction model might discriminate as well as the first, but the observed risks in the highest risk groups are overestimated.
Figure 7 Relationship between calibration and discrimination
Box plot, discrimination slope and Integrated Discrimination Improvement (IDI) There are many other ways of expressing the discriminative accuracy, but these are infrequently used. Box plots show the means and distributions of risks in patients and nonpatients, and the difference in means is known as the discrimination slope. Note that these means are not the same as the PPV and 1-NPV as the latter are the mean risks in risk

26
groups split by a risk threshold, whereas box plots and discrimination slope present and compare mean risks between patients and nonpatients. When a prediction model is extended by adding predictors, the integrated discrimination improvement (IDI) assesses the improvement in the discrimination slope. IDI is the difference of the risk difference between patients and nonpatients for the initial and extended models.15

27
5 Validation of prediction models
KEY QUESTIONS
• How is the prediction model validated?
• What is the model fit and performance in the validation study? The model fit and performance are always highest in the population that was used to develop the prediction model. Validation of a prediction model refers to the re-assessment of the prediction model in other data. Validation can be done within the same population (internal validation) or in an independent population (external validation).
5.1 Internal validation
Internal validation uses a subset of the same population that was used for the development of the prediction model. There are several methods for internal validation (see6, p 301 for an extensive list). Examples include:
- A split-sample method, which randomly divides the dataset in two groups. One group is used for the development of the model and the other for the independent evaluation of the model performance.
- A bootstrap sample method, which samples one or more new datasets of the same size from the dataset that was used for developing the model. Because sampling is done with replacement, the new dataset(s) differs from the original one.
Internal validation is a good first step to preventing overoptimistic interpretations about the predictive ability, but it is not sufficient. Internal validation still tends to give an optimistic predictive accuracy because the data in the development and validation study come from the same population, collected by the same methods and researchers, using the same variable definitions.
5.2 External validation
External validation is done to investigate the generalizability of the prediction model by evaluating its performance in a different, but similar population. When a prediction model is constructed, its regression coefficients are estimated in such that the model best fits the data. External validation evaluates whether the model is robust to changes in the population and measurement of variables. Even with the same inclusion criteria for the study population and the same definition and measurement of variables, differences occur when other researchers collect the data at a different location. It is generally seen that the predictive ability and discriminative accuracy are lower when assessed in an independent population. External validation may concern:
- Temporal validation, which assesses the prediction model in newer collected data within the same setting, e.g., among more recently included participants in the study;
- Geographical validation, which assesses the prediction model in a same population but in a different place than where the prediction model was developed, for example in another region or a different care center;

28
- Independent validation, in which the prediction model is validated in a completely new population or setting, which is similar to the original population, but not the same.
6 Assessment of clinical utility
KEY QUESTIONS
• How are risk thresholds chosen?
• Does the use of the prediction model change medical decision making? The clinical utility of a prediction model provides information about the usefulness of the prediction model in health care. A prediction model is considered useful if it leads to useful distinction of risk categories or improves medical decision making.
6.1 Choosing risk threshold(s)
Risk estimates theoretically range from 0 to 100%, but the number of available alternative interventions is usually limited. Typically, there are only two options: treat or not treat, but sometimes three or more options are available. For example, the Framingham risk score for the prevention of cardiovascular disease is used to decide who needs no intervention, lifestyle recommendations or medication.16 Assigning people to different interventions, therefore, requires the specification of risk thresholds. Ideally the risk threshold is such that all people who will develop the disease will receive the intervention and all who will not develop the disease will not, but this is only possible when the prediction model has perfect predictive ability. Choosing risk thresholds always is a trade-off between accepting more false-positives or more false-negatives. The decision for risk threshold(s) is based on weighing the benefits and costs of false-positives and false-negatives. Examples of these costs are the burden of the disease, the side effects and financial costs of treatment, which is unnecessary treatment in false-positives.
6.2 Reclassification
When a prediction model is updated, individuals might be classified in different risk categories depending on whether the initial or updated model is used. This is called reclassification of individuals. Individuals might ‘move up’ to categories of higher risk or ‘move down’ to categories of lower risk. Ideally, when a prediction model improves, patients move to higher categories and nonpatients to categories of lower risk, but in practice it is often seen that both patients and nonpatients move in both directions.
6.2.1 Measures of reclassification The rationale for the use of reclassification statistics is that updating a prediction model by adding new predictors is only warranted when people change between risk categories. When updating a prediction model changes predicted risks but people will still be classified in the same risk category, the new model does not lead to different decisions about treatment. There are several different measures of reclassification that quantify how many

29
people change between risk categories. These measures are calculated from a reclassification table (Table 4).
Total reclassification Total reclassification calculates the percentage of individuals who change risk category, in any direction.12 This measure does not take into account whether individuals move in the ‘right’ direction.
Net reclassification improvement The net reclassification improvement (NRI) does consider whether people move in the right direction.15 For patients and nonpatients separately, it counts the ‘net’ good moves (good moves – bad moves), meaning that more people move in the right than wrong direction (see Figure 7). Good moves mean that patients move to a higher risk category and nonpatients to a lower; bad moves are vice versa. NRI is the sum of the percentage of net good moves in patients and nonpatients. Because the bases for these percentages are different when the number of patients and nonpatients not equal, the measure is generally not easy to interpret.
Continuous NRI Because not all prediction models have established risk thresholds, an alternative reclassification measure was proposed.17 Continuous NRI does not rely on risk categories, but considers the change in risk only: patients should have higher risks (‘move up’) with the updated model and nonpatients lower risks (‘move down’). Continuous NRI calculates the sum of the percentage of net good moves in patients and nonpatients, in a similar way as NRI.
Table 4 Reclassification table (Adapted from 18)
Prediction model
Updated prediction model Reclassified Net correctly reclassified
(%) < 10% 10-35% >35% Move up Move down
Nonpatients (n= 8013)
<5% 2187 459 0 816
1520
8.8 10-35% 1225 2913 357
≥35% 15 280 577
Patients (n=1987)
<5% 53 34 0 360
170
9.6 10-35% 93 919 326
≥35% 1 76 458
Net reclassification improvement 18.4
Where do the risk thresholds come from? Measures of risk classification have been eagerly adopted in prediction research, presumably because they show improvement of prediction when the AUC does not. Yet, this sensitivity to minimal changes in prediction is also mentioned as a shortcoming (the measures even fluctuate with how many decimals are considered to specify risk). Reclassification measures are known to vary with the values of the risk thresholds and number of thresholds.19,20 Therefore, these measures should only be calculated when risk thresholds are ‘established’. Many studies however are using risk thresholds that are arbitrarily chosen. It is important to remind that they could have chosen other thresholds, or fewer, which would show entirely different values of reclassification.

30
7 Concluding remarks
7.1 Methodological shortcomings of prediction studies
The design, analysis and interpretation of prediction studies is guided by rules and metrics, but at the same time a very subjective process. In virtually every step of the study, decisions have to be made, and while these are standard questions, the best choice for each decision varies across studies because it depends on what needs to be predicted, in whom, how and for what purpose. Yet, some choices are better than others. Here is a list of suboptimal methodological and analytical choices that are commonly seen in prediction research.
Study population not representative The study population is not representative for the target population in which the application of the prediction model is foreseen. Interpretation of the model performance is only meaningful when the intended purpose of the prediction model is known. Prediction models that are based on risk factors always have some predictive ability (assuming that the risk factors are associated with the disease), but whether it has sufficient predictive ability depends on what is going to be done with the risk estimates. The predictive ability might be high enough for some applications, but not for others.
Study population too small The study population is too small for the robust estimation of the prediction model. Fitting a model with too many variables in a population that is too small leads to overfitting of the prediction model, which increases the likelihood that the model does not validate.
Short (and irrelevant) follow-up time The follow-up time of the study is not relevant. Like weather forecasts, predicting outcomes in the near future is always easier than predicting the far future. A recent study predicted mild cognitive impairment or Alzheimer Disease 2 years ahead with 90% accuracy.7 While this might be useful for some applications, it might not be informative for elderly people who wish to know whether they will develop Alzheimer: the test can only predict 2 years ahead, and not, say, 10 years. Also, prediction models are also frequently investigated in cross-sectional data, which is not relevant either.
No assessment of calibration The model is not calibrated, which means that it is unknown whether the absolute risks are well estimated.
No assessment of internal validation The prediction model is not internally validated. A survey of genetic prediction studies found that only one third of the prediction studies had conducted internal validation.21 When internal validation is not reported, a simple solution is to subtract 0.05 from the AUC value and then interpret the predictive ability.

31
No external validation The prediction model is not validated in an independent population. Only very limited number of prediction studies are externally validated.22 This percentage is likely biased, because not all prediction models need validation. Validation is only warranted when the development of the prediction model was methodologically sound and its AUC was promising.
Fitting too many models The best model is selected after fitting too many alternative models. This data-driven approach is not necessarily wrong, but it requires a reserved interpretation in the discussion. When the best model is selected seemingly without solid hypothesis about which variables need to be included, it is more likely that the fit of the model and its predictive ability will be much lower in an independent validation.
Inappropriate interpretation of model performance The interpretation of the model performance relies more on reclassification statistics than on AUC. Because AUC is rather insensitive to change, especially at higher levels of baseline AUC, it is often seen that the interpretation focusses on the statistically significant reclassification statistics. Yet, when there is no improvement in AUC, reclassification may be observed, but the NRI is often limited too, even when statistically significant.19
7.2 The continuum of translational research
Prediction studies investigate the predictive ability and expected clinical utility of a prediction model. This is an important, but only of the phases in the continuum of translational research.23 Prediction research is preceded by association studies from which the candidate predictors are (generally), and followed by several other types of studies that together should prepare the successful and responsible implementation and use of the model in health care. Examples of such studies are:
- risk communication research, which investigates whether people understand the risk estimates and how they can be best presented to ensure adequate comprehension. This is especially relevant if the risk estimates are going to be used by the public, rather than by health care professionals;
- behavioral and psychological research, which investigates behavioral and psychological responses to the risk estimates;
- implementation studies, which investigate how the model can best be introduced in practice and what conditions need to facilitate the adoption of the model in practice;
- cost-effectiveness studies, which investigate whether the reduction in morbidity or mortality by using the model justifies the collection of data that is needed to estimate the risks.

32
Overview of key questions in prediction research Background of a prediction study and state of science
• What is the intended use of the prediction model?
• What needs to be predicted, in whom, how and for what purpose (why)?
• What prediction model is currently used in practice?
• What is known about the predictors?
• Is the study a development or validation study, or both? Methodology
• Is the study conducted in a sample of the target population?
• Is the study design representative for the health care scenario?
• Are the setting, location and dates (still) relevant?
• Is the sample size / statistical power sufficient for the aim of the study?
• Are the outcome and risk period clinically relevant?
• Are all relevant predictors available?
• Does the statistical model fit the data?
• How are missing data and outliers handled? Are variables (re)coded in a meaningful way?
• What method is used for reducing the number of variables in the model?
Assessment of prediction models
• How well does the model fit the data?
• What is the predictive ability of the model?
• What is the discriminative accuracy of the model? Validation of prediction models
• How is the prediction model validated?
• What is the model fit and performance in the validation study? Assessment of clinical utility
• How are risk thresholds chosen?
• Does the use of the prediction model change medical decision making?

33
Further reading
Books
- Harrell FE. Regression modeling strategies: with applications to linear models, logistic regression, and survival analysis. New York, NY: Springer; 2002.
- Kleinbaum DG, Klein M. Logistic Regression: A Self-Learning Text (Statistics for Biology and Health). New York, NY: Springer; 2002.
- Steyerberg EW. Clinical prediction models: a practical approach to development, validation, and updating. New York, NY: Springer; 2009.
Methodological papers PROGRESS series
- Altman DG, Vergouwe Y, Royston P, Moons KG. Prognosis and prognostic research: validating a prognostic model. BMJ. 2009. (PMID: 19477892)
- Hemingway H, Croft P, Perel P, et al. Prognosis research strategy (PROGRESS) 1: a framework for researching clinical outcomes. BMJ. 2013. (PMID: 23386360)
- Hingorani AD, Windt DA, Riley RD, et al. Prognosis research strategy (PROGRESS) 4: stratified medicine research. BMJ. 2013. (PMID: 23386361)
- Moons KG, Altman DG, Vergouwe Y, Royston P. Prognosis and prognostic research: application and impact of prognostic models in clinical practice. BMJ. 2009. (PMID: 19502216)
- Moons KG, Kengne AP, Grobbee DE, et al. Risk prediction models: II. External validation, model updating, and impact assessment. Heart. 2012. (PMID: 22397946)
- Moons KG, Kengne AP, Woodward M, et al. Risk prediction models: I. Development, internal validation, and assessing the incremental value of a new (bio)marker. Heart. 2012. (PMID: 22397945)
- Moons KG, Royston P, Vergouwe Y, Grobbee DE, Altman DG. Prognosis and prognostic research: what, why, and how? BMJ. 2009. (PMID: 19237405)
- Riley RD, Hayden JA, Steyerberg EW, et al. Prognosis Research Strategy (PROGRESS) 2: prognostic factor research. PLoS Med. 2013. (PMID: 23393429)
- Royston P, Moons KG, Altman DG, Vergouwe Y. Prognosis and prognostic research: Developing a prognostic model. BMJ. 2009. (PMID: 19336487)
- Steyerberg EW, Moons KG, van der Windt DA, et al. Prognosis Research Strategy (PROGRESS) 3: prognostic model research. PLoS Med. 2013. (PMID: 23393430)
Guideline papers
- Moons KG, Altman DG, Reitsma JB, Ioannidis JP, Macaskill P, Steyerberg EW, Vickers AJ, Ransohoff DF, Collins GS. Transparent Reporting of a multivariable prediction model for Individual Prognosis Or Diagnosis (TRIPOD): Explanation and Elaboration. Ann Intern Med 2015. (PMID: 25560730)
- Collins GS, Reitsma JB, Altman DG, Moons KG. Transparent Reporting of a multivariable prediction model for Individual Prognosis Or Diagnosis (TRIPOD): The TRIPOD Statement. Ann Intern Med 2015. (PMID: 25560714)

34
- Altman DG, McShane LM, Sauerbrei W, Taube SE. Reporting Recommendations for Tumor Marker Prognostic Studies (REMARK): explanation and elaboration. PLoS Med. 2012. (PMID: 22675273)
- Janssens AC, Ioannidis JP, Bedrosian S, et al. Strengthening the reporting of Genetic RIsk Prediction Studies (GRIPS): explanation and elaboration. J Clin Epidemiol. Aug 2011. (PMID: 21414753)

35
References 1. D'Agostino RB, Sr., Vasan RS, Pencina MJ, et al. General cardiovascular risk profile for
use in primary care: the Framingham Heart Study. Circulation. Feb 12 2008;117(6):743-753.
2. D'Agostino SRB, Grundy S, Sullivan LM, Wilson P, for the CHDRPG. Validation of the Framingham Coronary Heart Disease Prediction Scores. JAMA. 2001;286(2):180.
3. Apgar V. A proposal for a new method of evaluation of the newborn infant. Current researches in anesthesia & analgesia. Jul-Aug 1953;32(4):260-267.
4. Knaus WA, Draper EA, Wagner DP, Zimmerman JE. APACHE II: a severity of disease classification system. Crit. Care Med. Oct 1985;13(10):818-829.
5. Teasdale G, Jennett B. Assessment of coma and impaired consciousness. A practical scale. Lancet. Jul 13 1974;2(7872):81-84.
6. Steyerberg EW. Clinical prediction models : a practical approach to development, validation, and updating. New York, NY: Springer; 2009.
7. Mapstone M, Cheema AK, Fiandaca MS, et al. Plasma phospholipids identify antecedent memory impairment in older adults. Nat. Med. Apr 2014;20(4):415-418.
8. Harrell FE. Regression modeling strategies: with applications to linear models, logistic regression, and survival analysis. New York: Springer; 2002.
9. Little RJA, Rubin DB. Statistical analysis with missing data. 2nd ed. Hoboken, N.J.: Wiley; 2002.
10. Faeh D, William J, Tappy L, Ravussin E, Bovet P. Prevalence, awareness and control of diabetes in the Seychelles and relationship with excess body weight. BMC Public Health. 2007;7:163.
11. Seidell JC. Waist circumference and waist/hip ratio in relation to all-cause mortality, cancer and sleep apnea. Eur. J. Clin. Nutr. Jan 2010;64(1):35-41.
12. Cook NR. Use and misuse of the receiver operating characteristic curve in risk prediction. Circulation. Feb 20 2007;115(7):928-935.
13. Meigs JB, Shrader P, Sullivan LM, et al. Genotype score in addition to common risk factors for prediction of type 2 diabetes. N. Engl. J. Med. Nov 20 2008;359(21):2208-2219.
14. Lubbe SJ, Di Bernardo MC, Broderick P, Chandler I, Houlston RS. Comprehensive evaluation of the impact of 14 genetic variants on colorectal cancer phenotype and risk. Am J Epidemiol. Jan 1 2012;175(1):1-10.
15. Pencina MJ, D'Agostino RB, Sr., D'Agostino RB, Jr., Vasan RS. Evaluating the added predictive ability of a new marker: from area under the ROC curve to reclassification and beyond. Stat Med. Jan 30 2008;27(2):157-172; discussion 207-112.
16. Wilson PW, D'Agostino RB, Levy D, Belanger AM, Silbershatz H, Kannel WB. Prediction of coronary heart disease using risk factor categories. Circulation. May 12 1998;97(18):1837-1847.
17. Pencina MJ, D'Agostino RB, Sr., Steyerberg EW. Extensions of net reclassification improvement calculations to measure usefulness of new biomarkers. Stat Med. Jan 15 2011;30(1):11-21.
18. Kundu S, Aulchenko YS, van Duijn CM, Janssens AC. PredictABEL: an R package for the assessment of risk prediction models. Eur. J. Epidemiol. Apr 2011;26(4):261-264.

36
19. Mihaescu R, van Zitteren M, van Hoek M, et al. Improvement of risk prediction by genomic profiling: reclassification measures versus the area under the receiver operating characteristic curve. Am. J. Epidemiol. Aug 1 2010;172(3):353-361.
20. Muhlenbruch K, Heraclides A, Steyerberg EW, Joost HG, Boeing H, Schulze MB. Assessing improvement in disease prediction using net reclassification improvement: impact of risk cut-offs and number of risk categories. Eur. J. Epidemiol. Jan 2013;28(1):25-33.
21. Iglesias AI, Mihaescu R, Ioannidis JP, et al. Scientific reporting is suboptimal for aspects that characterize genetic risk prediction studies: A review of published articles based on the GRIPS statement. J. Clin. Epidemiol. 2014:In press.
22. Hemingway H, Riley RD, Altman DG. Ten steps towards improving prognosis research. BMJ. 2009;339:b4184.
23. Khoury MJ, Gwinn M, Yoon PW, Dowling N, Moore CA, Bradley L. The continuum of translation research in genomic medicine: how can we accelerate the appropriate integration of human genome discoveries into health care and disease prevention? Genetics in Medicine. 2007;9(10):665-674.