predictive utility of the total glasgow coma scale versus
TRANSCRIPT

TRAUMA/SYSTEMATIC REVIEW/META-ANALYSIS
Volume 70, no.
Predictive Utility of the Total Glasgow Coma ScaleVersus the Motor Component of the GlasgowComa Scale for Identification of Patients With
Serious Traumatic Injuries
Roger Chou, MD*; Annette M. Totten, PhD, MPA; Nancy Carney, PhD; Spencer Dandy, BS;Rongwei Fu, PhD; Sara Grusing, BA; Miranda Pappas, MA; Ngoc Wasson, MPH; Craig D. Newgard, MD, MPH
*Corresponding Author. E-mail: [email protected].
Study objective: The motor component of the Glasgow Coma Scale (mGCS) has been proposed as an easier-to-usealternative to the total GCS (tGCS) for field assessment of trauma patients by emergency medical services. We perform asystematic review andmeta-analysis to compare the predictive utility of the tGCS versus themGCS or SimplifiedMotor Scalein field triage of trauma for identifying patients with adverse outcomes (inhospital mortality or severe brain injury) or whounderwent procedures (neurosurgical intervention or emergency intubation) indicating need for high-level trauma care.
Methods: Ovid MEDLINE, Cumulative Index to Nursing and Allied Health Literature, PsycINFO, Health and PsychosocialInstruments, and the Cochrane databases were searched through June 2016 for English-language cohort studies. Weincluded studies that compared the area under the receiver operating characteristic curve (AUROC) of the tGCS versusthe mGCS or Simplified Motor Scale assessed in the field or shortly after arrival in the emergency department forpredicting the outcomes described above. Meta-analyses were performed with a random-effects model, and subgroupand sensitivity analyses were conducted.
Results: We included 18 head-to-head studies of predictive utility (n¼1,703,388). For inhospital mortality, the tGCSwas associated with slightly greater discrimination than the mGCS (pooled mean difference in [AUROC] 0.015; 95%confidence interval [CI] 0.009 to 0.022; I2¼85%; 12 studies) or the Simplified Motor Scale (pooled mean difference inAUROC 0.030; 95% CI 0.024 to 0.036; I2¼0%; 5 studies). The tGCS was also associated with greater discriminationthan the mGCS or Simplified Motor Scale for nonmortality outcomes (differences in AUROC from 0.03 to 0.05). Findingswere robust in subgroup and sensitivity analyses.
Conclusion: The tGCS is associated with slightly greater discrimination than the mGCS or Simplified Motor Scale foridentifying severe trauma. The small differences in discrimination are likely to be clinically unimportant and could beoffset by factors such as convenience and ease of use. [Ann Emerg Med. 2017;70:143-157.]
Please see page 144 for the Editor’s Capsule Summary of this article.
A podcast for this article is available at www.annemergmed.com.
0196-0644/$-see front matterCopyright © 2016 by the American College of Emergency Physicians.http://dx.doi.org/10.1016/j.annemergmed.2016.11.032
SEE EDITORIAL, P. 158.
INTRODUCTIONBackground
Unintentional injuries are the leading cause of deathin the United States among people aged 1 to 44 yearsand the third leading cause among people aged 45 to 64years.1 In 2011, there were approximately 40,000,000emergency department (ED) visits for injuries.2
Approximately 18% of patients treated in the ED for aninjury were transported by emergency medical services(EMS) personnel.3
2 : August 2017
ImportanceField triage by EMS personnel is a critical aspect of
trauma systems because it helps to identify potentiallyseriously injured patients and inform transport decisions.4-6
A key component of field triage for patients with trauma islevel-of-consciousness assessment. The Glasgow ComaScale (GCS)7,8 is an instrument widely used for level-of-consciousness assessment by EMS personnel in the fieldand in other settings.9 It consists of 3 items: eye (scored 1to 4), verbal (scored 1 to 5), and motor (scored 1 to 6);scores are summed to obtain the total GCS (tGCS) score,ranging from 3 to 15 (lower scores indicating lower levels of
Annals of Emergency Medicine 143

Glasgow Coma Scale for Patients With Serious Traumatic Injuries Chou et al
Editor’s Capsule Summary
What is already known on this topicThe Glasgow Coma Scale (GCS) is widely used forfield triage of injured patients to trauma centers.
What question this study addressedDo 2 simplified versions of the GCS predict traumaoutcomes as well as the full GCS?
What this study adds to our knowledgeIn this meta-analysis of 18 studies, the slenderpredictive advantage observed for the full GCS overthe 2 shorter scales was below reasonable thresholdsfor clinical importance.
How this is relevant to clinical practiceThe full GCS can be effectively replaced by either ofthe 2 simplified versions studied.
consciousness). The 2011 field triage guidelines from theCenters for Disease Control and Prevention (CDC)National Expert Panel recommend transporting patientswith tGCS scores of less than or equal to 13 to facilitiesproviding the highest level of trauma care.3
In some circumstances (eg, intoxication, intubation,medication use, presence of other injuries influencingability to respond), it may not be possible to accuratelyassess the verbal and eye components of the GCS, such thatassessments are primarily based on the motor component ofthe GCS (mGCS). Scores of 5 or less on the mGCS areconsidered an indication of severe injury.7,10-13 The mGCShas been proposed for assessment of trauma patients evenwhen the tGCS can be obtained because it may be easier touse by EMS personnel in the field.12 The Simplified MotorScale is a streamlined version of the mGCS (scored 0 to 2,with a score of 0 corresponding to 1 to 4 on the mGCS, 1corresponding to 5, and 2 corresponding to 6).14
During the development of the 2011 CDC field triageguideline,3 the Expert Panel considered use of the mGCSas an alternative to the tGCS as a way to potentiallysimplify field triage, but did not adopt it part because oflimited evidence in regard to predictive utility. However,more data are now available.
Goals of This InvestigationThe purpose of this article is to systematically review the
evidence on the predictive utility of the tGCS and mGCSin the field assessment of trauma for identifying patientswith serious injuries to help inform clinical practice and
144 Annals of Emergency Medicine
guideline development for field triage of trauma by EMSpersonnel. It is based on a larger report commissioned bythe Agency for Healthcare Research and Quality on use ofthe GCS in field triage.15
MATERIALS AND METHODSDetailed methods and data for this review, additional
outcomes, and additional key questions are available in thefull report.15 This article focuses on the comparative abilityof the tGCS and the mGCS or Simplified Motor Scale todiscriminate persons with serious from those with lessserious traumatic injuries. The protocol for this review wasdeveloped with a standardized process,16 with input fromthe National Highway Traffic Safety Administration,experts, and the public. The protocol was registered in theInternational Prospective Register of Systematic Reviews.17
Data Collection and ProcessingA research librarian searched the Cochrane Central
Register of Controlled Trials, Cochrane Database ofSystematic Reviews, CINAHL, PsycINFO, Health andPsychosocial Instruments, and Ovid MEDLINE (January1995 through June 2016) for relevant studies andsystematic reviews (search strategy shown in Figure E1,available online at http://www.annemergmed.com).Searches were started from 1995 because the first studies tocompare the predictive utility of the mGCS versus thetGCS were published in 1998 and 200312,13; only 5 stateshad fully implemented trauma systems as of the early1990s.18 We also reviewed reference lists and searchedclinicaltrials.gov. Inclusion was restricted to English-language articles. Studies published only as abstracts wereexcluded.
Selection of ParticipantsTwo reviewers (R.C., A.T., N.C., or N.W.)
independently evaluated each study on the basis ofpredefined criteria at the abstract and full-text review levels.We included prospective or retrospective cohort studies ofchildren and adults with known or suspected trauma thatcompared discrimination of the tGCS versus the mGCS orSimplified Motor Scale administered soon after injury (inthe field/out-of-hospital by EMS personnel or within 4hours of arrival to the ED) for identifying persons withserious injuries. Presence of a serious injury was based onthe following outcomes: inhospital mortality, receipt ofneurosurgical interventions (defined as a surgical procedureof the brain, skull, or meninges, including craniotomy,ventriculostomy, shunts, or intracerebral pressuremonitoring), meeting criteria for a severe traumatic brain
Volume 70, no. 2 : August 2017

Abstracts of potentially relevant articles identified through MEDLINE, CINAHL, HaPI, PsycINFO, Cochrane,* and other sources† (N=4,412)
Excluded abstracts and background articles (n=3,714)
Full-text articles reviewed for relevance to Key Questions (n=698)
Full-text articles excluded=666
Wrong population=48
Wrong intervention=382
Wrong outcomes=69
Wrong study design=12
Wrong publication type=33
Wrong comparison=7
Wrong setting=34
Included studies=24
(Total studies in the AHRQ report=32ठ)
18 head-to-head studies
6 indirect studies
Figure 1. Outline of study selection and inclusion. CINAHL,Cumulative Index to Nursing and Allied Health Literature; HaPI,Health and Psychosocial Instruments. *Cochrane databasesinclude the Cochrane Central Register of Controlled Trials andthe Cochrane Database of Systematic Reviews. †Other sourcesinclude reference list, experts, etc. ‡Two studies were usedboth for key question 1 and key question 4. §Key questions 2,3, and 4 that do not address predictive utility are addressed inthe full Agency for Healthcare Research and Quality report.15
Chou et al Glasgow Coma Scale for Patients With Serious Traumatic Injuries
injury (defined as imaging findings such as skull fracturewith underlying brain injury, intracerebral contusion,cerebral contusion, or cerebral edema; or receipt of an acuteintervention for brain injury), or receipt of emergencyintubation. The measure of discrimination was the areaunder the receiver operating characteristic curve (AUROC).The AUROC value represents the probability that a patientwho experiences an outcome will have a worse score on thescale than a person who does not experience it.19,20
Primary Data AnalysisOne investigator (R.C., A.T., N.C., or N.W.) abstracted
details about study characteristics and results. A secondinvestigator checked the abstracted data for accuracy. Twoinvestigators independently rated the quality of studies(good, fair, or poor), using prespecified criteria developedfor evaluation of studies on prognosis21 and diagnosis22
(Figure E2, available online at http://www.annemergmed.com). Investigators did not review, assess, or screen articlesthat they authored. Discrepancies were resolved byconsensus.
Meta-analyses were conducted to calculate pooleddifferences in the AUROC with the DerSimonian-Lairdrandom-effects model with Stata/IC (version 13.1;StataCorp, College Station, TX). We also performedanalyses with the profile likelihood method, an alternativerandom-effects model.23 We defined a small difference inthe AUROC a priori as a difference of less than 0.05,moderate as a difference of 0.05 to 0.10, and large as adifference of greater than 0.10. When a study reported onlythe point estimate of AUROC without providing a 95%confidence interval (CI) or a standard error, we imputedthe standard error with the average standard error fromother studies in the same meta-analysis. In all studies, themGCS or Simplified Motor Scale scores were derivedfrom the tGCS and applied to the same patient population.To account for this nonindependence, we assumed acorrelation of 0.5 when comparing the tGCS with themGCS or Simplified Motor Scale in the primary analysis.Two studies24,25 reported data that allowed calculation ofthe correlations between the AUROCs for the tGCS andthe mGCS or Simplified Motor Scale, which ranged from0.5 to 0.9, depending on the outcome and comparison.Therefore, 0.5 is a conservative assumption for thecorrelation. Additional analyses were conducted assumingcorrelations of 0.3 and 0.8; results were similar and are notreported separately.
Stratified and sensitivity analyses were performed on theage group evaluated (children versus adults or mixedpopulations), assessment setting (out-of-hospital versusED), study dates (all data collected after 2006 or some or
Volume 70, no. 2 : August 2017
all data collected before 2006), country (United Statesversus other), and risk of bias rating. Primary analyses werebased on all studies, including those conducted with theNational Trauma Data Bank. In 2012, 805 hospitalssubmitted data to the National Trauma Data Bank.26
Because populations evaluated in studies reporting datafrom single trauma centers or systems could be included(in part or in full) in the National Trauma Data Bank, weperformed a sensitivity analysis in which National TraumaData Bank studies were excluded. For the primary analysis,we included multiple studies from the same trauma centeror system unless there was clearly complete overlap in thepopulations assessed. In sensitivity analyses, we restrictedanalyses to one study from each trauma center that usedfield GCS scores; if multiple studies used field GCS scores,we used the study that evaluated more recent data.
For all comparisons and outcomes, we assessed thestrength of evidence as high, moderate, low, or insufficient,
Annals of Emergency Medicine 145

Table 1. Characteristics of head-to-head studies.
Author, Year Settings Years of Study
Assessment TimingMeasures or Scores
Compared N Population Characteristics
Acker et al,201428
USA, Colorado, urban 2 Level I pediatrictrauma centers, 2002 to 2011
EDA: tGCSB: mGCS
2,231 Age (mean), y: 6.9 (SD 5.8)Male patient: 65%Race: NRTBI: 100%ISS (median): 17 (IQR: 10–26)
Al-Salamah et al,200429
Canada, Ontariotrauma registry, 72% urban, 28%
suburban or rural, 1994 to 2002
Out-of-hospitalA: tGCS score �13B: mGCS score �5
795 Age (mean), y: 44 (SD 21)Male patient: 70%Race: NRTBI: NRISS: NR
Beskind et al,201411
USA, Southern Arizona urban, universityhealth network Level I trauma center,2008 to 2010
Out-of-hospitalA: tGCSB: mGCS
9,816 Age (median), y: 32 (IQR: 20–51)Male patient: 65.5%Race: NRTBI: NRISS �16: 11.7%
Brown et al,201430
USA trauma registry,* 2007 to 2008 Out-of-hospitalA: tGCS score �13B: mGCS score �5
811,143 Age (median), y: 39 (IQR: 23–57)Male patient: 66%Race: NRTBI: NRISS (median): 9 (IQR: 4–13)
Caterino andRaubenolt,201231
USA, Ohio urban, hospitals trauma andnontrauma centers, 2002 to 2007
Out-of-hospitalA: tGCS �13B: SMS �1
52,412 Age (mean), y: 53Male patient: 55.9%White: 79.9%Black: 13.5%Hispanic: 1.5%Other race: 1.7%Race not documented: 3.4%TBI: 15.2%ISS (median): 9ISS >15: 26.6%
Cicero and Cross,201332
USA trauma registry* 2007 to 2009 Out-of-hospitalA: tGCSB: mGCS
104,035 Age (mean), y: 12.6 (SD 5.5)Male patient: 67%Nonwhite race: 38%TBI: NRISS (mean): 9.9 (SD 10.3)Major injury (ISS >15): 15%
Corrigan et al,201433
USA trauma registry,* 2007 to 2010 Out-of-hospitalA: tGCSB: mGCS
77,470 NR
Davis et al,200634
USA, California (San Diego)Urban, other data NRDate NR
Out-of-hospital and EDA: tGCSB: mGCS
12,882 NR
Eken et al,200935
Turkey, tertiary care ED of hospital LevelIV trauma center, 2006
EDA: tGCSB: mGCS
185 Age (median), y: 59 (range 18–97)Male patient: 64%Race: NRTBI: NRISS: NR
Gill et al, 200514 USA, California (Loma Linda) urban,university Level I trauma center andchildren’s hospital, 1990 to 2002
EDA: tGCSB: mGCSC: SMS
8,412 Age (median), y: 24 (IQR 15–38)Male patient: 71.5%Race: NRTBI: 17.1%ISS: NR
Gill et al, 200636 USA, California (Loma Linda) urban,university Level I trauma center andchildren’s hospital, 1990 to 2002
Out-of-hospitalA: tGCSB: mGCSC: SMS
7,233 Age (median), y: 24 (IQR 16–38)Male patient: 70%Race: NRTBI: 17%ISS: NR
Glasgow Coma Scale for Patients With Serious Traumatic Injuries Chou et al
146 Annals of Emergency Medicine Volume 70, no. 2 : August 2017

Table 1. Continued.
Author, Year Settings Years of Study
Assessment TimingMeasures or Scores
Compared N Population Characteristics
Haukoos et al,200737
USA, Colorado urban, Denver HealthMedical Center, Level I traumacenter, 1995 to 2004
EDA: tGCSB: mGCSC: SMS
21,170 Age (median), y: 32 (IQR: 21–45)Male patient: 71%Race: NRTBI: 14%ISS score (median): 9 (IQR 2–14)
Healey et al,200312*
USA trauma registry,* 1994 to 2001 Out-of-hospitalA: tGCSB: mGCS
202,255 NR
Holmeset al, 200538
USA, California (Davis) Level I traumacenter, 1998 to 2001
EDA: tGCSB: mGCS
2,043 �2 y: 16%>2 y: 84%Male patient: NRRace: NRTBI: 5%ISS: NR
Kupaset al, 201639
USA, PennsylvaniaLevel I, II, III, or IV trauma centers,1999 to 2013
Out-of-hospitalA: tGCS score �13B: mGCS score �5
370,392 Age (median), y: 50Male patient: 62%White: 79%Black: 14%Asian: 0.9%TBI: NR (88% blunt trauma)ISS >15: 29%
Rosset al, 199813
USA, New Jersey Level I trauma center,1994 to 1996
Out-of-hospitalA: tGCS score �13B: mGCS score �5
1,410 Age (mean), y: 37.1 (range 13–95)Male patient: 69%Race: NRTBI: NRISS (mean): 14.4ISS (median): 13
Thompson et al,201125
USA, Colorado urban, Denver HealthMedical Center Level I trauma center,1999 to 2008
Out-of-hospitalA: tGCS �13B: mGCS score �5B: SMS �1
19,408 Age (median), y: 33 (IQR 22–48)Male patient: 71%Race: NRTBI: 18%ISS (median): 9 (IQR 4–17)
Van deVoordeet al,200840
Belgium pediatric trauma registry(PENTA) 2005
Out-of-hospital and EDA: tGCS score �13B: mGCS score �5
96 Age (mean), y: 8.2 (SD 5.3)Male patient: 59%Race: NRTBI: NRISS (median): 16
NR, Not reported; TBI, traumatic brain injury; ISS, Injury Severity Score; IQR, interquartile range; PENTA, Paediatric Network around Trauma registry.*Patients from the National Trauma Data Bank data set.
Chou et al Glasgow Coma Scale for Patients With Serious Traumatic Injuries
using the approach described in the Methods Guide forMedical Test Reviews16 and Methods Guide for Effectivenessand Comparative Effectiveness Reviews,27 based on the overallrisk of bias (graded low, moderate, or high); the consistencyof results across studies (graded consistent, inconsistent, orunable to determine when only one study was available); thedirectness of the evidence linking the intervention andhealth outcomes (graded direct or indirect); the precision ofthe estimate of effect, based on the number and size ofstudies and CIs for the estimates (graded precise orimprecise); and reporting bias (suspected or undetected).
RESULTSThe search and selection of articles for the full report
are summarized in the literature flow diagram (Figure 1).
Volume 70, no. 2 : August 2017
Database searches resulted in 4,412 potentially relevantcitations; 698 articles were selected for full-text reviewand 18 head-to-head studies evaluated predictiveutility.11-14,25,28-40
Twelve studies compared discrimination of the tGCSversus the mGCS, and 6 studies compared the tGCS versusthe Simplified Motor Scale (Table 1).11-14,25,28-40 All studieswere retrospective analyses. Sample sizes ranged from 96 to811,143. Fifteen studies were conducted in the United States,2 studies in Europe, and 1 in Canada. Four studies restrictedenrollment to children28,32,38,40; the other studies enrolledadults or mixed populations. Four studies used data collectedin or after 2006. GCS scores were obtained during out-of-hospital assessment in 11 studies,11-13,25,29-33,36,39 in the EDin 5 studies,14,28,35,37,38 and in mixed (ED or out-of-hospital)
Annals of Emergency Medicine 147
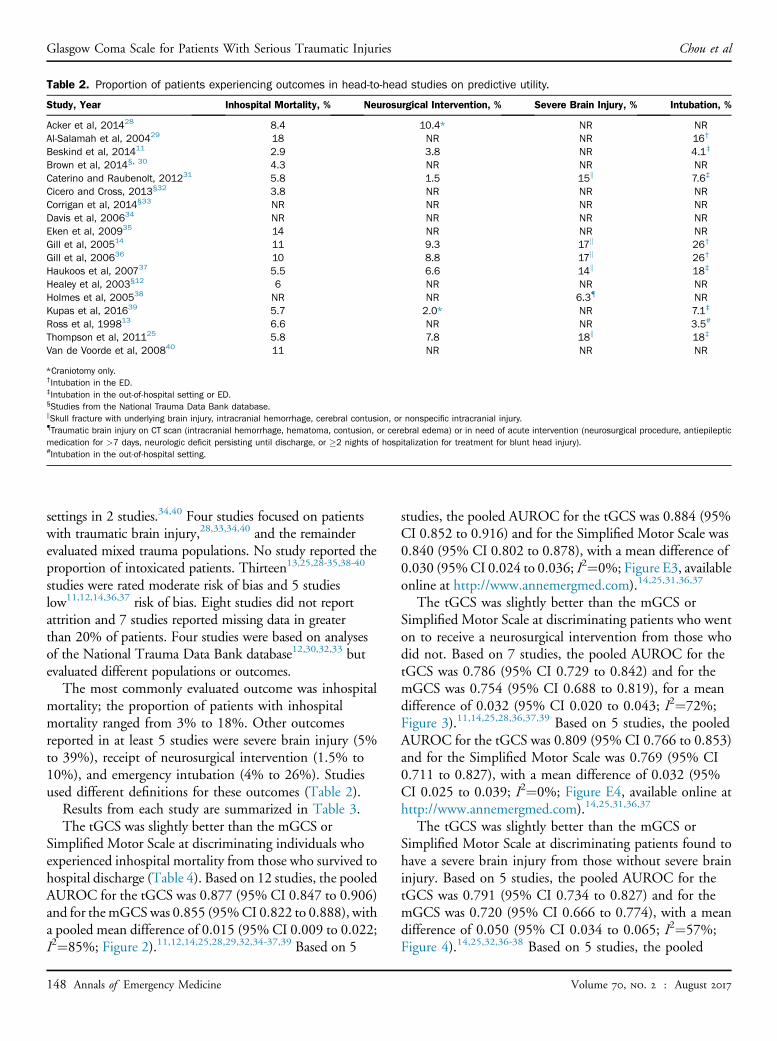
Table 2. Proportion of patients experiencing outcomes in head-to-head studies on predictive utility.
Study, Year Inhospital Mortality, % Neurosurgical Intervention, % Severe Brain Injury, % Intubation, %
Acker et al, 201428 8.4 10.4* NR NRAl-Salamah et al, 200429 18 NR NR 16†
Beskind et al, 201411 2.9 3.8 NR 4.1‡
Brown et al, 2014§, 30 4.3 NR NR NRCaterino and Raubenolt, 201231 5.8 1.5 15k 7.6‡
Cicero and Cross, 2013§32 3.8 NR NR NRCorrigan et al, 2014§33 NR NR NR NRDavis et al, 200634 NR NR NR NREken et al, 200935 14 NR NR NRGill et al, 200514 11 9.3 17k 26†
Gill et al, 200636 10 8.8 17k 26†
Haukoos et al, 200737 5.5 6.6 14k 18‡
Healey et al, 2003§12 6 NR NR NRHolmes et al, 200538 NR NR 6.3{ NRKupas et al, 201639 5.7 2.0* NR 7.1‡
Ross et al, 199813 6.6 NR NR 3.5#
Thompson et al, 201125 5.8 7.8 18k 18‡
Van de Voorde et al, 200840 11 NR NR NR
*Craniotomy only.†Intubation in the ED.‡Intubation in the out-of-hospital setting or ED.§Studies from the National Trauma Data Bank database.kSkull fracture with underlying brain injury, intracranial hemorrhage, cerebral contusion, or nonspecific intracranial injury.{Traumatic brain injury on CT scan (intracranial hemorrhage, hematoma, contusion, or cerebral edema) or in need of acute intervention (neurosurgical procedure, antiepilepticmedication for >7 days, neurologic deficit persisting until discharge, or �2 nights of hospitalization for treatment for blunt head injury).#Intubation in the out-of-hospital setting.
Glasgow Coma Scale for Patients With Serious Traumatic Injuries Chou et al
settings in 2 studies.34,40 Four studies focused on patientswith traumatic brain injury,28,33,34,40 and the remainderevaluated mixed trauma populations. No study reported theproportion of intoxicated patients. Thirteen13,25,28-35,38-40
studies were rated moderate risk of bias and 5 studieslow11,12,14,36,37 risk of bias. Eight studies did not reportattrition and 7 studies reported missing data in greaterthan 20% of patients. Four studies were based on analysesof the National Trauma Data Bank database12,30,32,33 butevaluated different populations or outcomes.
The most commonly evaluated outcome was inhospitalmortality; the proportion of patients with inhospitalmortality ranged from 3% to 18%. Other outcomesreported in at least 5 studies were severe brain injury (5%to 39%), receipt of neurosurgical intervention (1.5% to10%), and emergency intubation (4% to 26%). Studiesused different definitions for these outcomes (Table 2).
Results from each study are summarized in Table 3.The tGCS was slightly better than the mGCS or
Simplified Motor Scale at discriminating individuals whoexperienced inhospital mortality from those who survived tohospital discharge (Table 4). Based on 12 studies, the pooledAUROC for the tGCS was 0.877 (95% CI 0.847 to 0.906)and for themGCSwas 0.855 (95%CI 0.822 to 0.888), witha pooled mean difference of 0.015 (95% CI 0.009 to 0.022;I2¼85%; Figure 2).11,12,14,25,28,29,32,34-37,39 Based on 5
148 Annals of Emergency Medicine
studies, the pooled AUROC for the tGCS was 0.884 (95%CI 0.852 to 0.916) and for the Simplified Motor Scale was0.840 (95% CI 0.802 to 0.878), with a mean difference of0.030 (95%CI 0.024 to 0.036; I2¼0%; Figure E3, availableonline at http://www.annemergmed.com).14,25,31,36,37
The tGCS was slightly better than the mGCS orSimplified Motor Scale at discriminating patients who wenton to receive a neurosurgical intervention from those whodid not. Based on 7 studies, the pooled AUROC for thetGCS was 0.786 (95% CI 0.729 to 0.842) and for themGCS was 0.754 (95% CI 0.688 to 0.819), for a meandifference of 0.032 (95% CI 0.020 to 0.043; I2¼72%;Figure 3).11,14,25,28,36,37,39 Based on 5 studies, the pooledAUROC for the tGCS was 0.809 (95% CI 0.766 to 0.853)and for the Simplified Motor Scale was 0.769 (95% CI0.711 to 0.827), with a mean difference of 0.032 (95%CI 0.025 to 0.039; I2¼0%; Figure E4, available online athttp://www.annemergmed.com).14,25,31,36,37
The tGCS was slightly better than the mGCS orSimplified Motor Scale at discriminating patients found tohave a severe brain injury from those without severe braininjury. Based on 5 studies, the pooled AUROC for thetGCS was 0.791 (95% CI 0.734 to 0.827) and for themGCS was 0.720 (95% CI 0.666 to 0.774), with a meandifference of 0.050 (95% CI 0.034 to 0.065; I2¼57%;Figure 4).14,25,32,36-38 Based on 5 studies, the pooled
Volume 70, no. 2 : August 2017

Chou et al Glasgow Coma Scale for Patients With Serious Traumatic Injuries
AUROC for the tGCS was 0.763 (95% CI 0.710 to 0.815)and for the Simplified Motor Scale was 0.713 (95% CI0.654 to 0.771), with a mean difference of 0.048 (95% CI0.038 to 0.059; I2¼72%; Figure E5, available online athttp://www.annemergmed.com).14,25,31,36,37
The tGCS was slightly better than the mGCS orSimplified Motor Scale at discriminating patients whounderwent emergency intubation from those who didnot undergo intubation. Based on 6 studies, the pooledAUROC for the tGCS was 0.865 (95% CI 0.830 to0.901) and for the mGCS was 0.822 (95% CI 0.775 to0.870), with a mean difference of 0.034 (95% CI 0.020 to0.048; I2¼88%; Figure 5).11,14,25,36,37,39 Based on 5studies, the pooled AUROC for the tGCS was 0.843(95% CI 0.823 to 0.864) and for the Simplified MotorScale was 0.783 (95% CI 0.747 to 0.819), with a meandifference of 0.040 (95% CI 0.030 to 0.050; I2¼55%;Figure E6, available online at http://www.annemergmed.com).14,25,31,36,37
Sensitivity AnalysesFor all outcomes, estimates were similar when the profile
likelihood method was used to pool data. Findings werealso similar when studies were stratified according towhether they focused on children or evaluated adults ormixed populations, used out-of-hospital or ED GCS scores,and collected all data after 2006 or collected some or alldata before 2006 (Table 4). Findings were also similarwhen analyses were restricted to low-risk-of-bias studies,studies of patients with traumatic brain injury, or studiesconducted in the United States. Estimates were similarfrom National Trauma Data Bank and non–NationalTrauma Data Bank studies; excluding National TraumaData Bank studies had little effect on estimates (Table 4).For outcomes for which multiple studies were availablefrom a particular trauma center, restricting the analysis tothe most recent study from each center that used out-of-hospital GCS scores also had little effect on estimates.
For some analyses, statistical heterogeneity was present.However, overall findings were consistent across studiesand differences in AUROCs were generally similar. Forexample, for the tGCS versus the mGCS and inhospitalmortality, statistical heterogeneity was high (I2¼85%), butdifferences in AUROC values favored the tGCS in allstudies and ranged from 0.01 to 0.07. For tGCS versusmGCS and severe brain injury, the mean difference inAUROC was slightly higher in one study of children(0.121; 95% CI 0.068 to 0.174)32,38 than in 4 studies ofmixed populations of adults and children (0.046; 95% CI0.038 to 0.054; I2¼0%),14,25,36,37 but there was nostatistically significant interaction with age group (P¼.07).
Volume 70, no. 2 : August 2017
Differences in how severe brain injury was defined couldexplain some of the differences in estimates. The study inchildren used a composite outcome of head computedtomography (CT) imaging findings or need forintervention.38 All of the studies of mixed populations ofadults and children defined severe brain injury on the basisof CT imaging findings.
LIMITATIONSBecause of anticipated heterogeneity caused by
differences in patient populations, outcomes, assessmentsettings, and other factors, we used the random-effectsDerSimonian-Laird model to pool data. Statisticalheterogeneity was moderate or high in some analyses.The DerSimonian-Laird estimator can result in CIs that aretoo narrow when statistical heterogeneity is present.23
Therefore, we also performed analyses using an alternativerandom-effects model, the profile likelihood method,which may perform better under these conditions.Results were similar with the profile likelihood method.Statistical heterogeneity was high in some analyses,but tGCS was consistently associated with betterdiscrimination, and the ranges for differences in AUROCvalues across studies were relatively narrow. Given the largestudy sample sizes, small differences in AUROC amongstudies were detected as statistical heterogeneity. Analysesbased on the AUROC tend to favor measures based onscales with more input points, which “smooth” the curveand favor the tGCS (3-to-15 scale) over more abbreviatedscale.
We had to impute standard errors for some studiesincluded in pooled analyses. However, findings were similarwhen we used alternative imputation methods. Also, thetGCS and mGCS or Simplified Motor Scale was notperformed independently in any study, so it is uncertainhow findings on the other GCS components may haveaffected scoring of the mGCS. We assumed moderatecorrelation between tGCS and mGCS or Simplified MotorScale scores, but findings were similar with alternativecorrelation assumptions.
Most studies of predictive utility had methodologicallimitations, including failure to report attrition, missingdata, and unclear methods for measuring outcomes.However, restricting analyses to studies with low loss tofollow-up or overall low risk of bias had little influence onfindings. As detailed in the full report, data were limitedon discrimination for other outcomes indicating need forhigh-level trauma care (eg, meeting criteria for traumacenter need, having a high Injury Severity Score), althoughfindings were consistent with the outcomes reported inthis article.
Annals of Emergency Medicine 149

Table 3. Summary of discrimination (AUROC) of head-to-head studies.
Author, Year,Country
Assessment TimingMeasures or Scores
Compared N Age, YearsInhospital Mortality
(95% CI)Neurosurgical Intervention
(95% CI)Severe Brain Injury
(95% CI) Intubation (95% CI)
Acker et al,2014,28
USA
EDA: tGCSB: mGCS
2,231 �18Mean: 6.9
A: 0.949 (0.938 to 0.961)B. 0.941 (0.926 to 0.957)P¼.06
A: 0.642 (0.603 to 0.681)B: 0.638 (0.601 to 0.675)P¼.64*A: 0.808 (0.784 to 0.832)B: 0.774 (0.748 to 0.800)P<.001†
NR NR
Al-Salamah et al,2004,29
Canada
Out-of-hospitalA: tGCS score �13B: mGCS score �5
795 �16Mean: 44
A: 0.82B: 0.81P¼NR
NR NR NR
Beskind et al,2014,11
USA
Out-of-hospitalA: tGCSB: mGCS
9,816 Mean: 32 A: 0.899 (0.874 to 0.923)B: 0.888 (0.864 to 0.913)Mean difference¼0.010(0.002 to 0.018)
A: 0.571 (0.533 to 0.609)B: 0.570 (0.531 to 0.608)Mean difference¼0.002
(–0.013 to 0.016)
NR A: 0.966 (0.955 to 0.976)B: 0.948 (0.933 to 0.963)Mean difference¼0.018
(0.011 to 0.024)Caterino andRaubenolt,2012,31
USA
Out-of-hospitalA: tGCS �13B: SMS �1
52,412 �16Mean: 53
A: 0.85 (0.84 to 0.86)B: 0.82 (0.81 to 0.83)
A: 0.75 (0.73 to 0.77)B: 0.70 (0.68 to 0.72)
A: 0.72 (0.71 to 0.72)B: 0.66 (0.65 to 0.66)
A: 0.86 (0.85 to 0.87)B: 0.83 (0.82 to 0.83)
Cicero and Cross,2013,‡32
USA
Out-of-hospitalA: tGCSB: mGCS
104,035 <19Mean: 12.6
A: 0.946 (0.941 to 0.951)B: 0.940 (0.935 to 0.945)
NR NR NR
Corrigan et al,2014,‡33
USA
Out-of-hospitalA: tGCSB: mGCS
77,470 �18 A: 0.886 (NR)B: 0.878 (NR)
NR NR NR
Davis et al,2006,34
USA
Out-of-hospital andED
A: tGCSB: mGCS
12,882 NR A: 0.84 (NR)B: 0.83 (NR)
A: 0.80 (NR)B: 0.78 (NR)
NR NR
Eken et al,2009,35
Turkey
EDA: tGCSB: mGCS
185 >17 A: 0.735 (0.655 to 0.797)B: 0.662 (0.589 to 0.730)
NR NR NR
Gill et al, 2005,14
USAEDA: tGCSB: mGCSC: SMS
8,412 Median 24 A: 0.906 (NR)B: 0.894 (NR)C: 0.878 (NR)
A: 0.874 (NR)B: 0.848 (NR)C: 0.851 (NR)
A: 0.826 (NR)B: 0.789 (NR)C: 0.791 (NR)
A: 0.865 (NR)B: 0.826 (NR)C: 0.826 (NR)
Gill et al, 2006,36
USAOut-of-hospitalA: tGCSB: mGCSC: SMS
7,233 Median 24 A: 0.89 (0.88 to 0.90)B: 0.88 (0.87 to 0.89)C: 0.86 (0.86 to 0.89)
A: 0.86 (0.85 to 0.88)B: 0.84 (0.82 to 0.85)C: 0.83 (0.81 to 0.84)
A: 0.83 (0.82 to 0.84)B: 0.79 (0.78 to 0.81)C: 0.79 (0.77 to 0.80)
A: 0.83 (0.81 to 0.84)B: 0.79 (0.78 to 0.80)C: 0.79 (0.77 to 0.80)
Glasgow
Com
aScale
forPatients
With
SeriousTraum
aticInjuries
Chou
etal
150Annals
ofEmergency
Medicine
Volum
e70,no.2
:August
2017

Haukoos et al,2007,‡37
USA
EDA: tGCSB: mGCSC: SMS
21,170 Median 32 A: 0.92 (0.91 to 0.93)B: 0.90 (0.89 to 0.91)C: 0.89 (0.88 to 0.90)
A: 0.83 (0.82 to 0.84)B: 0.80 (0.79 to 0.81)C: 0.80 (0.79 to 0.81)
A: 0.76 (0.75 to 0.77)B: 0.71 (0.70 to 0.72)C: 0.71 (0.70 to 0.72)
A: 0.86 (0.85 to 0.87)B: 0.81 (0.80 to 0.82)C: 0.81 (0.80 to 0.82)
Healey et al,2003,12‡
USA
Out-of-hospitalA: tGCSB: mGCS
202,255 NR A: 0.891 (0.888 to 0.894)B: 0.873 (0.870 to 0.875)P<.001
NR NR NR
Holmes et al,2005,38
USA
EDA: tGCSB: mGCS
2,043 �2 NR NR �2 y:A: 0.72 (0.56 to 0.87)B: 0.60 (0.48 to 0.72)>2 y:A: 0.82 (0.76 to 0.87)B: 0.71 (0.65 to 0.77)AUROC (95% CI) for TBI in
need of acute intervention�2 y:A: 0.97 (0.94 to 1.0)B: 0.76 (0.59 to 0.93)>2 y:A: 0.87 (0.83 to 0.92)B: 0.76 (0.71 to 0.81)
NR
Kupas et al,2016,39
USA
Out-of-hospitalA: tGCSB: mGCS
370,392 �18 A: 0.831 (0.828 to 0.834)B: 0.803 (0.800 to 0.806)Difference¼0.028 (0.026 to0.030)
A: 0.724 (0.718 to 0.730)B: 0.676 (0.670 to 0.682)Difference¼0.048 (0.044 to
0.052)*
NR A: 0.904 (0.902 to 0.907)B: 0.884 (0.882 to 0.887)Difference¼0.020 (0.019 to
0.021)Thompson et al,2011,25
USA
Out-of-hospitalA: tGCS �13B: mGCS score �5B: SMS �1
19,408 Allmedian: 33
A: 0.82 (0.74 to 0.90)B: 0.76 (0.70 to 0.83)C: 0.74 (0.70 to 0.77)
A: 0.70 (0.64 to 0.77)B: 0.66 (0.61 to 0.71)C: 0.66 (0.64 to 0.69)
A: 0.66 (0.60 to 0.71)B: 0.61 (0.57 to 0.65)C: 0.61 (0.58 to 0.64)
A: 0.70 (0.63 to 0.77)B: 0.65 (0.60 to 0.70)C: 0.65 (0.62 to 0.67)
*Craniotomy only.†Intracranial pressure monitoring only.‡Studies from the National Trauma Data Bank database.
Chou
etal
Glasgow
Com
aScale
forPatients
With
SeriousTraum
aticInjuries
Volum
e70,no.2
:August
2017
Annals
ofEmergency
Medicine
151

Table 4. Pooled AUROC results of head-to-head studies.
Outcome and AnalysistGCS vs mGCS, Difference in
AUROC (95% CI)Number ofStudies I2, %
tGCS vs SMS, Differencein AUROC (95% CI)
Number ofStudies I2, %
Inhospital mortality, overall 0.015 (0.009 to 0.022) 12 85 0.030 (0.024 to 0.036) 5 0Adults or mixed 0.019 (0.012 to 0.025) 10 75 0.030 (0.024 to 0.036) 5 0Children 0.006 (0.002 to 0.011) 2 0 — — —Excluding NTDB studies 0.017 (0.008 to 0.025) 10 68 0.030 (0.024 to 0.036) 5 0Excluding studies with potential overlap* 0.016 (0.008 to 0.024) 9 88 0.031 (0.023 to 0.039) 3 0Out-of-hospital GCS score 0.016 (0.007 to 0.024) 7 91 0.031 (0.023 to 0.039) 3 0ED GCS score 0.020 (0.006 to 0.034) 3 23 0.030 (0.020 to 0.039) 2 0US setting 0.015 (0.008 to 0.022) 10 87 0.030 (0.024 to 0.036) 5 0TBI patients 0.009 (–0.002 to 0.020) 3 0 — — —Low-risk-of-bias studies 0.017 (0.015 to 0.020) 5 0 0.030 (0.022 to 0.037) 3 0Enrollment before 2006 0.018 (0.011 to 0.024) 10 77 0.030 (0.024 to 0.036) 5 0Enrollment after 2006 0.006 (0.001 to 0.011) 2 0 — — —
Neurosurgical intervention, overall 0.032 (0.020 to 0.043) 7 72 0.032 (0.025 to 0.039) 5 0Adults or mixed 0.031 (0.018 to 0.044) 6 76 0.032 (0.025 to 0.039) 5 0Children 0.034 (0.009 to 0.059) 1 — — — —Excluding studies with potential overlap* 0.032 (0.011 to 0.053) 4 79 0.038 (0.024 to 0.052) 3 19Out-of-hospital GCS score 0.032 (0.011 to 0.053) 4 79 0.038 (0.024 to 0.052) 3 19ED GCS score 0.029 (0.020 to 0.039) 2 0 0.029 (0.020 to 0.038) 2 0US setting 0.032 (0.020 to 0.044) 7 72 0.032 (0.025 to 0.039) 5 0TBI patients 0.017 (–0.022 to 0.056) 2 66 — — —Low-risk-of-bias studies 0.026 (0.019 to 0.034) 4 0 0.029 (0.021 to 0.037) 3 0Enrollment before 2006 0.033 (0.021 to 0.045) 6 74 0.032 (0.025 to 0.039) 5 0Enrollment after 2006 0.019 (–0.009 to 0.047) 1 — — — —
Severe brain injury, overall 0.050 (0.034 to 0.065) 5 57 0.048 (0.038 to 0.059) 5 72Adults or mixed 0.046 (0.038 to 0.054) 4 0 0.048 (0.038 to 0.059) 5 72Children 0.121 (0.068 to 0.174) 1 — — — —Excluding NTDB studies 0.050 (0.034 to 0.065) 5 57 0.048 (0.038 to 0.059) 5 72Excluding studies with potential overlap* 0.065 (0.020 to 0.111) 3 76 0.051 (0.034 to 0.068) 3 74Out-of-hospital GCS score 0.041 (0.028 to 0.053) 2 0 0.051 (0.034 to 0.068) 3 74ED GCS score 0.060 (0.028 to 0.093) 3 73 0.044 (0.030 to 0.059) 2 51US setting 0.050 (0.034 to 0.065) 5 57 0.048 (0.038 to 0.059) 5 72TBI patients — — — — — —Low-risk-of-bias studies 0.046 (0.038 to 0.053) 3 0 0.044 (0.035 to 0.053) 3 25Enrollment before 2006 0.050 (0.034 to 0.065) 5 57 0.048 (0.038 to 0.059) 5 72Enrollment after 2006 — — — — — —
Emergency intubation, overall 0.034 (0.020 to 0.048) 6 88 0.040 (0.030 to 0.050) 5 55Adults or mixed 0.034 (0.020 to 0.048) 6 88 0.040 (0.030 to 0.050) 5 55Children — — — — — —Excluding studies with potential overlap* 0.026 (0.015 to 0.037) 4 68 0.033 (0.025 to 0.040) 3 0Out-of-hospital GCS score 0.026 (0.015 to 0.037) 4 68 0.033 (0.025 to 0.040) 3 0ED GCS score 0.048 (0.039 to 0.057) 2 0 0.048 (0.039 to 0.057) 2 0US setting 0.034 (0.020 to 0.048) 6 88 0.040 (0.030 to 0.050) 5 55TBI patients 0.011 (–0.010 to 0.032) 1 — — — —Low-risk-of-bias studies 0.037 (0.022 to 0.052) 4 79 0.046 (0.038 to 0.054) 3 0Enrollment before 2006 0.038 (0.020 to 0.055) 5 91 0.040 (0.030 to 0.050) 5 55Enrollment after 2006 0.018 (0.005 to 0.031) 1 — — — —
NTDB, National Trauma Data Bank.*When multiple studies were published from the same trauma center, analysis was restricted to the most recent study using out-of-hospital GCS scores (excluded Gill 2005,14
Haukoos 2007,37 and Acker 201428).
Glasgow Coma Scale for Patients With Serious Traumatic Injuries Chou et al
We restricted analyses to English-language studies.However, we identified no foreign-language study thatappeared to meet inclusion criteria, and our focus was onstudies applicable to US trauma settings. We were limitedin our ability to assess publication bias, given the relativelysmall number of studies. We did not identify any ongoingstudies in clinicaltrials.gov on predictive utility of the tGCS
152 Annals of Emergency Medicine
versus the mGCS or Simplified Motor Scale, although suchstudies are unlikely to be registered in this database.
Several studies were based on the large National TraumaData Bank. We could not reliably determine the degree towhich studies that analyzed data from single centersenrolled populations also analyzed in the National TraumaData Bank studies. We performed sensitivity analyses in
Volume 70, no. 2 : August 2017

Figure 2. Pooled AUROC of inhospital mortality for the tGCS versus the motor component only. NR, Not reported. *Patients fromthe National Trauma Data Bank data set.
Chou et al Glasgow Coma Scale for Patients With Serious Traumatic Injuries
which National Trauma Data Bank studies were excluded,which had little effect on findings.
DISCUSSIONThe findings of this review are summarized in Table 5.
Based on head-to-head studies, the tGCS is associated withslightly better predictive utility than the mGCS, using theAUROC to compare the measures. The tGCS is betterable than the mGCS to discriminate people with traumawho undergo neurosurgical intervention, meet criteria forsevere brain injury, or undergo emergency intubation frompeople who do not experience these outcomes, although
Figure 3. Pooled AUROC of neurologic intervention for the total G*Intracranial pressure monitoring only.
Volume 70, no. 2 : August 2017
the differences in the AUROC on each of these outcomeswas small (<0.05). The tGCS was also better than themGCS at discriminating trauma patients who died duringhospitalization from those who survived to hospitaldischarge, but the difference in the AUROC was evensmaller (0.01) than for nonmortality outcomes. Findingsfor the tGCS versus the Simplified Motor Scale weresimilar to findings for the tGCS versus the mGCS fornonmortality outcomes, but the Simplified Motor Scaleperformed slightly worse than the mGCS for inhospitalmortality (difference in AUROC 0.03). Similar results forthe mGCS and the Simplified Motor Scale might be
CS versus the motor component only. NA, Not applicable.
Annals of Emergency Medicine 153

Figure 4. Pooled AUROC of severe brain injury for the total GCS versus the motor component only.
Glasgow Coma Scale for Patients With Serious Traumatic Injuries Chou et al
expected because the Simplified Motor Scale is based onthe same information as the mGCS, with the onlydifference being that for the Simplified Motor Scale, datafor patients with low scores on the mGCS (0 to 4) arecollapsed into a single category. Therefore, any differencesin predictive utility between the Simplified Motor Scaleand mGCS are likely to be primarily related to ease of use.Findings were robust in sensitivity and subgroup analysesbased on the age group analyzed (children versus adultsor mixed), study year (before 2006 or after 2006), andrisk-of-bias ratings. However, sensitivity and subgroupanalyses were limited by small numbers of studies,particularly for nonmortality outcomes.
Figure 5. Pooled AUROC of emergency intubation for
154 Annals of Emergency Medicine
Our findings indicate that for every 100 trauma patients,the tGCS is able to correctly discriminate 1 to 5 more casesof severe trauma from nonsevere trauma than the mGCS orthe Simplified Motor Scale. Although we classified suchdifferences as “small,” based on a priori thresholds, andunlikely to be clinically important, such thresholds are bynature somewhat arbitrary. The clinical importance ofsmall differences in discrimination depend in part on theseriousness of the outcome evaluated, the degree to whichtriage and other treatment decisions are based on the GCSversus other factors, and the degree to which actions basedon the GCS affect clinical outcomes. As detailed in the fullreport, no study compared the effects of using the tGCS
the total GCS versus the motor component only.
Volume 70, no. 2 : August 2017

Table5.Stren
gthof
eviden
ce,discriminationformarkers
ofseriou
strau
matic
injuries.
Com
paris
onNum
berof
Studies
(N)
Study
Limitations
Dire
ctne
ssCon
sisten
cyPrecision
Rep
orting
Bias
MainFind
ings
Stren
gthof
Eviden
ceGrade
Inho
spital
mortality
tGCSvs
mGCS
12(756,145)
Mod
erate
Direct
Con
sisten
t*Precise
Not
detected
Differen
cein
AUROC0.015(0.009–0.022)
Mod
erate
tGCSvs
SMS
5(110,435)
Mod
erate
Direct
Con
sisten
tPrecise
Not
detected
Differen
cein
AUROC0.030(0.024
–0.036)
Mod
erate
Neu
rosu
rgical
interven
tion
tGCSvs
mGCS
7(429,124
)Mod
erate
Direct
Con
sisten
tPrecise
Not
detected
Differen
cein
AUROC0.031
(0.018–0.044)
Mod
erate
tGCSvs
SMS
5(108,635)
Mod
erate
Direct
Con
sisten
tPrecise
Not
detected
Differen
cein
AUROC0.032(0.025–0.039)
Mod
erate
Sev
erebraininjury
tGCSvs
mGCS
5(134,186)
Mod
erate
Direct
Con
sisten
t*Precise
Not
detected
Differen
cein
AUROC0.050(0.034–0.065)
Mod
erate
tGCSvs
SMS
5(100,223)
Mod
erate
Direct
Con
sisten
t*Precise
Not
detected
Differen
cein
AUROC0.048(0.038–0.059)
Mod
erate
Emerge
ncyintuba
tion
tGCSvs
mGCS
6(436,391)
Mod
erate
Direct
Con
sisten
t*Precise
Not
detected
Differen
cein
AUROC0.034(0.020–0.048)
Mod
erate
tGCSvs
SMS
5(108,635)
Mod
erate
Direct
Con
sisten
t*Precise
Not
detected
Differen
cein
AUROC0.040(0.030–0.050)
Mod
erate
*I2
was
grea
terthan
50%
buttherang
ein
differen
cesin
AUROCacross
stud
ies<0.05.
Chou et al Glasgow Coma Scale for Patients With Serious Traumatic Injuries
Volume 70, no. 2 : August 2017
versus the mGCS or Simplified Motor Scale for fieldassessment of trauma on rates of over- or undertriage orclinical outcomes.15 Factors that might offset slightdifferences in discrimination include ease of use andreliability. As noted in the full report, there wereinsufficient data to determine comparative interraterreliability of the tGCS, mGCS, and Simplified MotorScale, although some evidence suggests that the mGCS ismore likely to be scored accurately than the tGCS.15
As detailed in the full report,15 data on other measures ofpredictive utility, such as diagnostic accuracy (sensitivityand specificity), were limited. Based on limited evidence,differences in diagnostic accuracy between the tGCS andthe mGCS with standard cutoffs (�13 for tGCS and �5for mGCS) were small.13,29,30,39,40 For inhospitalmortality, 5 studies found a difference in sensitivity of 0%to 3% favoring tGCS and a difference in specificity of 0%to 5% favoring mGCS.13,29,30,39,40 In the largest study,sensitivity was 70% for tGCS and 67% for mGCS, andspecificity was 88% and 90%, respectively.39 Interpretationof these findings depends on the relative importance ofcorrectly identifying persons with severe trauma(sensitivity) versus correctly identifying persons withoutsevere trauma (specificity). For other outcomes, data onsensitivity and specificity were available from only 2 or 3studies. Discrimination is calculated from sensitivity andspecificity over a range of test values, but decisions based onGCS scales are based on whether patients’ scores are aboveor below a threshold score. Therefore, it would be helpfulfor future studies comparing GCS scales to routinely reportdiagnostic accuracy at standard cutoffs, in addition tomeasures of discrimination, to better understandcomparative predictive utility.
Our findings on predictive utility of different GCS scalesappear to have broad applicability to field triage in theUnited States because they are based on large studiesconducted in US trauma settings in mixed populations ofadults and children with various types of trauma. However,prospective studies that independently assess patients withthe tGCS and the mGCS or Simplified Motor Scale wouldbe useful for confirming the findings of the currentlyavailable retrospective studies. Ideally, head-to-headobservational or randomized studies that assess one set ofpatients with the tGCS and another set with the SimplifiedMotor Scale or mGCS would be useful for understandinghow differences in discrimination affect clinical outcomes,as well as risk of over- or undertriage. Studies are alsoneeded to better understand the predictive utility inimportant subpopulations, including children, olderpatients, patients with specific types of trauma, and patientswho have received field interventions before assessment. It
Annals of Emergency Medicine 155

Glasgow Coma Scale for Patients With Serious Traumatic Injuries Chou et al
would also be helpful for studies to routinely record andreport the proportion of patients who are intoxicated orintubated, or in whom the nonmotor components of theGCS could not be adequately performed for other reasons.Studies that evaluate how the predictive utility of the tGCScompares with the mGCS or Simplified Motor Scale variesaccording to the level or type of training of assessing fieldpersonnel are also needed.
In conclusion, the tGCS is associated with slightly greaterdiscrimination than themGCS or SimplifiedMotor Scale forinhospital mortality, receipt of neurosurgical interventions,meeting criteria for severe brain injury, and emergencyintubation, with differences in the AUROC ranging from0.01 to 0.05. The small differences in discrimination arelikely to be clinically unimportant and could be offset byfactors such as convenience and ease of use.
Supervising editor: Steven M. Green, MD
Author affiliations: From the Pacific Northwest Evidence-basedPractice Center, Department of Medical Informatics and ClinicalEpidemiology (Chou, Totten, Carney, Dandy, Fu, Grusing, Pappas,Wasson) and the Department of Medicine (Chou), the School ofPublic Health (Fu), and the Center for Policy and Research inEmergency Medicine, Department of Emergency Medicine(Newgard), Oregon Health & Science University, Portland, OR.
Author contributions: RC conceived the study and obtainedresearch funding. RC and MP supervised the conduct of the studyand data collection. MP, SD, SG, and NW managed the data,including quality control. RC and RF provided statistical advice onstudy design and analyzed the data. RC, AMT, NW, and CDNdrafted the article, and all authors contributed substantially to itsrevision. RC takes responsibility for the paper as a whole.
Funding and support: By Annals policy, all authors are required todisclose any and all commercial, financial, and other relationshipsin any way related to the subject of this article as per ICMJE conflictof interest guidelines (see www.icmje.org). The authors have statedthat no such relationships exist. This project was funded undercontract 290-2015-00009-I from the Agency for HealthcareResearch and Quality (AHRQ), US Department of Health andHuman Services.
Publication dates: Received for publication October 4, 2016.Revision received November 9, 2016. Accepted for publicationNovember 18, 2016. Available online January 11, 2017.
All authors attest to meeting the four ICMJE.org authorship criteria:(1) Substantial contributions to the conception or design of thework; or the acquisition, analysis, or interpretation of data for thework; AND (2) Drafting the work or revising it critically for importantintellectual content; AND (3) Final approval of the version to bepublished; AND (4) Agreement to be accountable for all aspects ofthe work in ensuring that questions related to the accuracy orintegrity of any part of the work are appropriately investigated andresolved.
Trial registration number: CRD42016035944
156 Annals of Emergency Medicine
The authors of this article are responsible for its content.Statements in the article should not be construed as endorsementby the AHRQ or the US Department of Health and Human Services.AHRQ retains a license to display, reproduce, and distribute thedata and the report from which this article was derived under theterms of the agency’s contract with the author. This topic wasnominated by the National Highway Traffic Safety AdministrationUS Department of Transportation and selected by AHRQ forsystematic review by an Evidence-based Practice Center. Arepresentative from AHRQ served as a Contracting Officer’sTechnical Representative and provide technical assistance duringthe conduct of the full evidence report and provided comments ondraft versions of the full evidence report. AHRQ did not directlyparticipate in the literature search; determination of studyeligibility criteria; data analysis or interpretation; or preparation,review, or approval of the article for publication.
REFERENCES1. Centers for Disease Control and Prevention. 10 Leading causes of
death by age group, United States—2014. Available at: http://www.cdc.gov/injury/images/lc-charts/leading_causes_of_death_age_group_2014_1050w760h.gif. Accessed May 5, 2016.
2. Centers for Disease Control and Prevention. National HospitalAmbulatory Medical Care Survey: 2011 emergency departmentsummary tables. Available at: http://www.cdc.gov/nchs/data/ahcd/nhamcs_emergency/2011_ed_web_tables.pdf. Accessed May 5,2016.
3. Sasser SM, Hunt RC, Faul M, et al. Guidelines for field triage of injuredpatients: recommendations of the National Expert Panel on FieldTriage, 2011. MMWR Recomm Rep. 2012;61:1-20.
4. Rotondo MF, Cribari C, Smith RS, eds; Committee on Trauma, AmericanCollege of Surgeons. Resources for Optimal Care of the InjuredPatient. 6th ed. Chicago, IL: American College of Surgeons; 2014.
5. Baxt WG, Moody P. The impact of advanced prehospital emergencycare on the mortality of severely brain-injured patients. J Trauma.1987;27:365-369.
6. MacKenzie EJ, Rivara FP, Jurkovich GJ, et al. A national evaluation ofthe effect of trauma-center care on mortality. N Engl J Med.2006;354:366-378.
7. Teasdale G, Jennett B. Assessment of coma and impairedconsciousness. A practical scale. Lancet. 1974;2:81-84.
8. Teasdale G, Maas A, Lecky F, et al. The Glasgow Coma Scale at 40years: standing the test of time. Lancet Neurol. 2014;13:844-854.
9. Moppett IK. Traumatic brain injury: assessment, resuscitation andearly management. Br J Anaesth. 2007;99:18-31.
10. Singh B, Murad MH, Prokop LJ, et al. Meta-analysis of Glasgow ComaScale and Simplified Motor Score in predicting traumatic brain injuryoutcomes. Brain Inj. 2013;27:293-300.
11. Beskind DL, Stolz U, Gross A, et al. A comparison of the prehospitalmotor component of the Glasgow Coma Scale (mGCS) to theprehospital total GCS (tGCS) as a prehospital risk adjustment measurefor trauma patients. Prehosp Emerg Care. 2014;18:68-75.
12. Healey C, Osler TM, Rogers FB, et al. Improving the Glasgow ComaScale score: motor score alone is a better predictor. J Trauma.2003;54:671-678; discussion 678-680.
13. Ross SE, Leipold C, Terregino C, et al. Efficacy of the motor componentof the Glasgow Coma Scale in trauma triage. J Trauma.1998;45:42-44.
14. Gill M, Windemuth R, Steele R, et al. A comparison of the GlasgowComa Scale score to simplified alternative scores for the prediction oftraumatic brain injury outcomes. Ann Emerg Med. 2005;45:37-42.
15. Chou R, Totten A, Pappas M, et al. Glasgow Coma Scale for Field Triageof Trauma: A Systematic Review No. 182 (Prepared by the Pacific
Volume 70, no. 2 : August 2017

Chou et al Glasgow Coma Scale for Patients With Serious Traumatic Injuries
Northwest Evidence-based Practice Center under Contract No. 290-2015-00009-I.). Rockville, MD: Agency for Health Care Research &Quality; 2016. AHRQ Publication No. 16-EHC041-EF.
16. Agency for Healthcare Research & Quality. AHRQ methods for effectivehealth care. In: Chang SM, Matchar DB, Smetana GW, et al, eds.Methods Guide for Medical Test Reviews. Rockville, MD: Agency forHealthcare Research & Quality; 2012.
17. Graham E, Chou R, Newgard C, et al. Field triage guideline revision:Glasgow Coma Scale: systematic review. 2016. CRD42016035944.Available at: http://www.crd.york.ac.uk/PROSPERO/display_record.asp?ID¼CRD42016035944. Accessed December 21, 2016.
18. Bazzoli GJ, Madura KJ, Cooper GF, et al. Progress in the developmentof trauma systems in the United States. Results of a national survey.JAMA. 1995;273:395-401.
19. Zweig MH, Campbell G. Receiver-operating characteristic (ROC) plots: afundamental evaluation tool in clinical medicine. Clin Chem.1993;39:561-577.
20. Bewick V, Cheek L, Ball J. Statistics review 13: receiver operatingcharacteristic curves. Crit Care. 2004;8:508-512.
21. Hayden JA, van der Windt DA, Cartwright JL, et al. Assessing bias instudies of prognostic factors. Ann Intern Med. 2013;158:280-286.
22. Whiting PF, Rutjes AW, Westwood ME, et al. QUADAS-2: a revised toolfor the quality assessment of diagnostic accuracy studies. Ann InternMed. 2011;155:529-536.
23. Cornell JE, Mulrow CD, Localio R, et al. Random-effects meta-analysisof inconsistent effects: a time for change. Ann Intern Med.2014;160:267-270.
24. Beskind DL, Keim SM, Spaite DW, et al. Risk adjustment measuresand outcome measures for prehospital trauma research:recommendations from the Emergency Medical Services OutcomesProject (EMSOP). Acad Emerg Med. 2011;18:988-1000.
25. Thompson DO, Hurtado TR, Liao MM, et al. Validation of the SimplifiedMotor Score in the out-of-hospital setting for the prediction ofoutcomes after traumatic brain injury. Ann Emerg Med.2011;58:417-425.
26. Nance M, Rotondo M, Fildes J. National Trauma Data Bank 2013:Annual Report. Chicago, IL: American College of Surgeons; 2013.
27. Methods Guide for Effectiveness and Comparative EffectivenessReviews. Rockville, MD: Agency for Healthcare Research & Quality;2014. AHRQ Publication 10(14)-EHC063-EF. Available at: http://www.effectivehealthcare.ahrq.gov. Accessed December 22, 2015.
28. Acker SN, Ross JT, Partrick DA, et al. Glasgow motor scale alone isequivalent to Glasgow Coma Scale at identifying children at risk for
Did you k
Annals has a Facebook pahttps://www.facebook.com/pages/Annals-of-E
Volume 70, no. 2 : August 2017
serious traumatic brain injury. J Trauma Acute Care Surg.2014;77:304-309.
29. Al-Salamah MA, McDowell I, Stiell IG, et al. Initial emergencydepartment trauma scores from the OPALS study: the case for themotor score in blunt trauma. Acad Emerg Med. 2004;11:834-842.
30. Brown JB, Forsythe RM, Stassen NA, et al. Evidence-basedimprovement of the National Trauma Triage Protocol: the GlasgowComa Scale versus Glasgow Coma Scale motor subscale. J TraumaAcute Care Surg. 2014;77:95-102; discussion 101-102.
31. Caterino JM, Raubenolt A. The prehospital Simplified Motor Score is asaccurate as the prehospital Glasgow Coma Scale: analysis of astatewide trauma registry. Emerg Med J. 2012;29:492-496.
32. Cicero MX, Cross KP. Predictive value of initial Glasgow Coma Scalescore in pediatric trauma patients. Pediatr Emerg Care.2013;29:43-48.
33. Corrigan JD, Kreider S, Cuthbert J, et al. Components of traumaticbrain injury severity indices. J Neurotrauma. 2014;31:1000-1007.
34. Davis DP, Serrano JA, Vilke GM, et al. The predictive value of fieldversus arrival Glasgow Coma Scale score and TRISS calculations inmoderate-to-severe traumatic brain injury. J Trauma. 2006;60:985-990.
35. Eken C, Kartal M, Bacanli A, et al. Comparison of the Full Outline ofUnresponsiveness Score coma scale and the Glasgow Coma Scalein an emergency setting population. Eur J Emerg Med. 2009;16:29-36.
36. Gill M, Steele R, Windemuth R, et al. A comparison of five simplifiedscales to the out-of-hospital Glasgow Coma Scale for the predictionof traumatic brain injury outcomes. Acad Emerg Med. 2006;13:968-973.
37. Haukoos JS, Gill MR, Rabon RE, et al. Validation of the Simplified MotorScore for the prediction of brain injury outcomes after trauma. AnnEmerg Med. 2007;50:18-24.
38. Holmes JF, Palchak MJ, MacFarlane T, et al. Performance of thepediatric Glasgow Coma Scale in children with blunt head trauma.Acad Emerg Med. 2005;12:814-819.
39. Kupas DF, Melnychuk EM, Young AJ. Glasgow Coma Scale MotorComponent (“patient does not follow commands”) performs similarlyto Total Glasgow Coma Scale in predicting severe injury in traumapatients. Ann Emerg Med. 2016;68:744-750.e3.
40. Van de Voorde P, Sabbe M, Rizopoulos D, et al. Assessing the level ofconsciousness in children: a plea for the Glasgow coma motorsubscore. Resuscitation. 2008;76:175-179.
now?
ge. Please “like” us at:mergency-Medicine/108117005909415
Annals of Emergency Medicine 157

Figure E1. Search strategy criteria.
Glasgow Coma Scale for Patients With Serious Traumatic Injuries Chou et al
157.e1 Annals of Emergency Medicine Volume 70, no. 2 : August 2017

Figure E1. Continued.
Chou et al Glasgow Coma Scale for Patients With Serious Traumatic Injuries
Volume 70, no. 2 : August 2017 Annals of Emergency Medicine 157.e2

Figure E1. Continued.
Glasgow Coma Scale for Patients With Serious Traumatic Injuries Chou et al
157.e3 Annals of Emergency Medicine Volume 70, no. 2 : August 2017
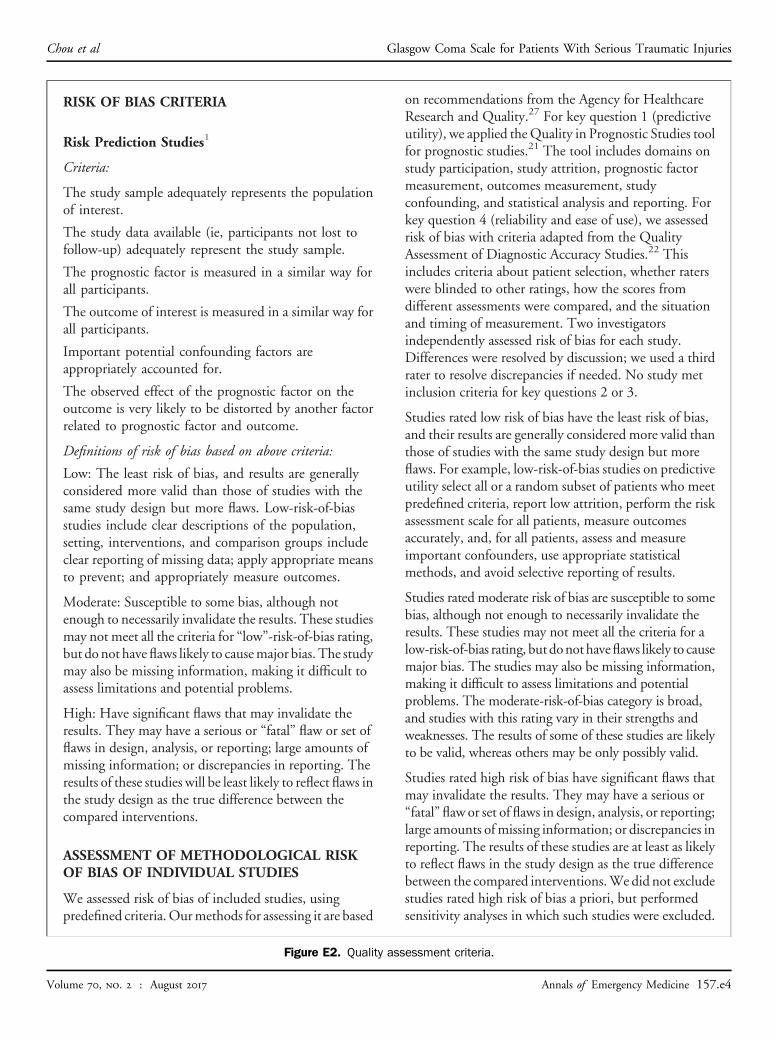
Figure E2. Quality assessment criteria.
Chou et al Glasgow Coma Scale for Patients With Serious Traumatic Injuries
Volume 70, no. 2 : August 2017 Annals of Emergency Medicine 157.e4
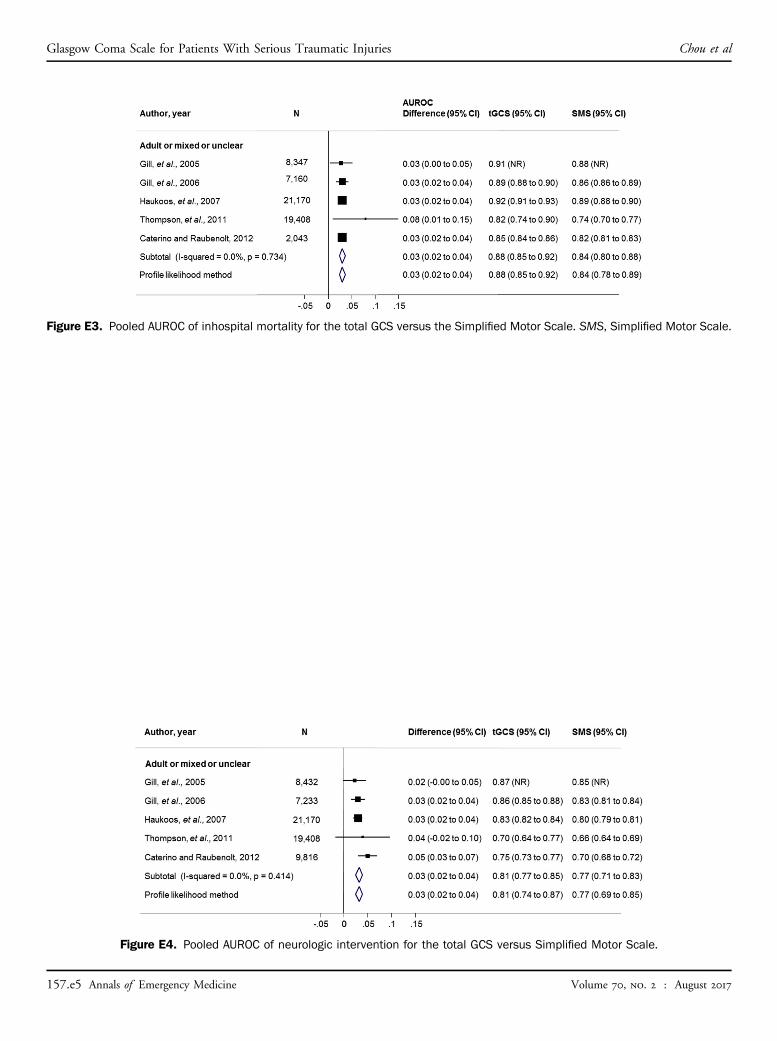
Figure E3. Pooled AUROC of inhospital mortality for the total GCS versus the Simplified Motor Scale. SMS, Simplified Motor Scale.
Glasgow Coma Scale for Patients With Serious Traumatic Injuries Chou et al
Figure E4. Pooled AUROC of neurologic intervention for the total GCS versus Simplified Motor Scale.
157.e5 Annals of Emergency Medicine Volume 70, no. 2 : August 2017

Figure E5. Pooled AUROC of severe brain injury for the total GCS versus the Simplified Motor Scale.
Figure E6. Pooled AUROC of intubation for the total GCS versus the Simplified Motor Scale.
Chou et al Glasgow Coma Scale for Patients With Serious Traumatic Injuries
Volume 70, no. 2 : August 2017 Annals of Emergency Medicine 157.e6