predictors of student enrollment patterns in high school
TRANSCRIPT

University of South FloridaScholar Commons
Graduate Theses and Dissertations Graduate School
January 2013
Predictors of Student Enrollment Patterns in HighSchool Career AcademiesE. Daniel CoxUniversity of South Florida, [email protected]
Follow this and additional works at: http://scholarcommons.usf.edu/etd
Part of the Other Education Commons, and the Secondary Education and Teaching Commons
This Dissertation is brought to you for free and open access by the Graduate School at Scholar Commons. It has been accepted for inclusion inGraduate Theses and Dissertations by an authorized administrator of Scholar Commons. For more information, please [email protected].
Scholar Commons CitationCox, E. Daniel, "Predictors of Student Enrollment Patterns in High School Career Academies" (2013). Graduate Theses andDissertations.http://scholarcommons.usf.edu/etd/4878
Predictors of Student Enrollment Patterns in High School Career Academies
by
E. Daniel Cox
A dissertation submitted in partial fulfillment of the requirements for the degree of
Doctor of Philosophy Department of Adult, Career and Higher Education
College of Education University of South Florida
Co-Major Professor: Victor M. Hernández-Gantes, Ph.D. Co-Major Professor: Edward C. Fletcher, Jr., Ph.D.
William R. Black, Ph.D. Yi-Hsin Chen, Ph.D.
Date of Approval: November 14, 2013
Keywords: underrepresented, trends, minority, performance, CTE
Copyright © 2013, E. Daniel Cox

DEDICATION
The body of this work is dedicated to Dr. Louis E. Dunbar, my extraordinary life-
partner who not only inspires me each day, but who also put forth the challenge of
beginning this amazing and incredible journey so long ago and has been remarkable in
lifting me up every day along the way. I am eternally grateful for the unconditional love,
unbounded patience and understanding, companionship, and support you bring to my life.
For none of this could have happened in your absence.
The manuscript developed from this body of work was composed in memory of
my mother, Jane Elisabeth Truax-Cox who left us too soon, as well as her mother,
Marjorie (Marge) Packard Truax who while with us, consistently encouraged me to
further my education and to strive to make a difference in the world.
And to my friend Jason Norton, whose work ethic and determined eagerness to
achieve his own educational goals also served as inspiration to me on this journey.

ACKNOWLEDGMENTS
It is with sincere humility and the most humbling sense of gratitude I
acknowledge Dr. Victor Hernández-Gantes for his ever consistent quest for perfection
and unwavering demand for superior quality work from his students. He succeeded in
developing another learner into a scholar-minded individual and I am grateful to have
shared in this experience. In conjunction, I offer much credit to Dr. Edward C. Fletcher,
Jr., whom I hold in high regard for generously sharing his expertise on this journey and
for collaborating with me to conduct relevant research parallel to the dissertation study.
Immense appreciation and recognition are owed to Dr. Yi-Hsin Chen for graciously
leading me through the logistical labyrinth of this research project and helping me to
make sense of the statistical findings. His kind demeanor was most reassuring as I
questioned the veracity of our finding interpretations. And to Dr. William Black, who
steadily reminded us of the meaning of “full-membership” and why it is so vitally
important to not only think about all students, but to also speak for those whose voices
are oftentimes unheard, I offer my deepest thanks.

i
TABLE OF CONTENTS
LIST OF TABLES ............................................................................................................. iv LIST OF FIGURES ......................................................................................................... viii ABSTRACT .......................................................................................................................xv CHAPTER ONE: INTRODUCTION ..................................................................................1 The New Vocationalism ..........................................................................................1 Shifting Enrollment Trends......................................................................................3 Career Academies ....................................................................................................4 Implications for Student Participation .....................................................................5 Problem Statement ...................................................................................................6 Purpose and Research Questions .............................................................................8 Conceptual Framework ............................................................................................9 Limitations .............................................................................................................11 Delimitations ..........................................................................................................12 Significance of the Study .......................................................................................13 CHAPTER TWO: REVIEW OF THE LITERATURE .....................................................15 New Directions in the Field of CTE ......................................................................16 Vocational education .................................................................................16 Emerging vocationalism ............................................................................17 Enrollment Patterns in CTE ...................................................................................18 Organization and delivery ..........................................................................18 Characteristics of CTE participants ...........................................................20 Participation of students by gender ................................................20 Participation of students by race and ethnicity ..............................22 Participation of students with disability status...............................25 Participation of students with limited English
proficiency (LEP).....................................................................26 Participation of students known as academic
achievers ..................................................................................26 Students attending rural vs. urban/suburban schools .....................29 Changes in academic course taking ...........................................................31 Career and technical education trends: 1980 – 2005 .................................33 Occupational education trends: 1980 – 2005 .............................................34 Labor market trends ...................................................................................35 Issues/implications .....................................................................................38

ii
Career Academies ..................................................................................................41 Communities of support .............................................................................41 Simplified conceptual model of the career academy
approach ...............................................................................................42 Growth and evolution of career academies ................................................44 Career academies evaluation......................................................................46 Research study design ....................................................................47 Patterns of enrollment ....................................................................47 Effects of career academies ...........................................................49 Impacts on educational attainment.................................................51 Transitions to postsecondary..........................................................52 Labor market outcomes..................................................................54 Factors associated with career academy outcomes ........................56 Policy implications.....................................................................................57 Summary ....................................................................................................59 Enrollment Patterns in Career Academies .............................................................61 Who participates in career academies? ......................................................61 California Partnership Academies .................................................62 Florida Career and Professional Education ....................................64 Course taking and program patterns ..........................................................66 Summary ....................................................................................................71 Tracking in Secondary Education ..........................................................................72 Effects of tracking ......................................................................................73 Implications of tracking .............................................................................74 Theoretical Framework ..........................................................................................75 Summary ................................................................................................................82 CHAPTER THREE: METHODOLOGY ..........................................................................85 Research Design.....................................................................................................86 Sampling Method ...................................................................................................87 Research Setting.....................................................................................................88 Researcher ..................................................................................................88 Participants .................................................................................................88 Institutional context ...................................................................................89 Human subject considerations ...................................................................91 Variables ................................................................................................................92 Data Collection ......................................................................................................95 Data collection procedures .........................................................................97 Data preparation .........................................................................................99 Data Analysis ......................................................................................................100 Writing and Presentation of Results ....................................................................102 CHAPTER FOUR: RESULTS ........................................................................................103 Participation Trends in Career Academies ..........................................................104 Enrollment trends by Career Clusters™ ..................................................104 Enrollment trends by gender ....................................................................105

iii
Enrollment trends by race/ethnicity .........................................................109 Enrollment trends by socio-economic status ...........................................114 Predicting Participation in Career Academies .....................................................117 Student demographics ..............................................................................117 Prior learning experience .........................................................................119 Prior performance measures ....................................................................121 Testing of predictors of participation in career academies ......................121 Prediction of Participation by Type of Career Academy .....................................125 Student demographics ..............................................................................126 Prior learning experience .........................................................................130 Health science: Reference group demographics ......................................132 Testing predictors of participation by type of career
academy .............................................................................................133 Participation in Agriculture, Food & Natural
Resources cluster ...................................................................136 Architecture & Construction cluster ............................................137 Arts, A/V Technology & Communications cluster......................138 Finance cluster .............................................................................139 Hospitality & Tourism cluster .....................................................140 Information Technology cluster ...................................................140 Law, Public Safety, Corrections & Security cluster ....................141 Marketing cluster .........................................................................141 Science, Technology, Engineering & Mathematics
(STEM) cluster.......................................................................142 Summary ..............................................................................................................143 CHAPTER FIVE: SUMMARY, DISCUSSION AND IMPLICATIONS ......................147 Summary of Results .............................................................................................147 Summary of results for research question one .........................................148 Summary of results for research question two .........................................149 Summary of results for research question three .......................................150 Discussion of Results ...........................................................................................151 Six-year enrollment trends .......................................................................151 Predicting career academy participation ..................................................155 Predicting career academy participation by Career
Cluster™ ............................................................................................157 Connections to the conceptual framework ...............................................159 Implications and Limitations for Practice ............................................................165 Opportunities for Future Research .......................................................................170 REFERENCES ................................................................................................................172 APPENDICES .................................................................................................................183 ABOUT THE AUTHOR ....................................................................................... End Page

iv
LIST OF TABLES
Table 2.1: Percentage of Occupational Concentrators by Race/Ethnicity: 1982 – 2005................................................................................................24
Table 2.2: Percentage of Students Participating in CTE: 1982 - 2005 .......................35
Table 2.3: Student Percentages in California Partnership Academies by Gender and Race/Ethnicity ........................................................................63
Table 2.4: Percentage of Student Demographics From 12 Florida School Districts in 2006-07....................................................................................65
Table 2.5: Percentage of CPA Enrollment by Industry Area and Gender in 2004-05 & 2009-10 ....................................................................................67
Table 2.6: Percentage of Florida Academy Enrollments by Career Cluster and Gender in 2006-07 .....................................................................................68
Table 2.7: Percentage of Students Enrolled in CPAs by Race/Ethnicity & Industry Area in 2004-05 ...........................................................................69
Table 2.8: Percentage of Florida Academy Students by Career Cluster & Race/Ethnicity in 2006-07 .........................................................................70
Table 2.9: Percentage of Florida Academy Students by Career Cluster & Other Characteristics ..................................................................................71
Table 3.1: Enrollment Percentages by District, All High Schools, and Career Academies ..................................................................................................91

v
Table 3.2: Summary of Independent and Dependent Variables by Research Question .....................................................................................................93
Table 3.3: Listing of 32 District Offered Career Academies Organized by Career Cluster™ ........................................................................................96
Table 3.4: Six-year High School and Career Academy Enrollment Trends ...............97
Table 4.1: Six-year Enrollment Trends in Career Academies by Career Cluster™ ..................................................................................................106
Table 4.2: Six-year Comparisons of Enrollment Trends in Career Academies by Gender and Career Cluster™ ..............................................................109
Table 4.3: Six-Year High School Population and Career Academy Participant Demographics ..........................................................................................110
Table 4.4: Six-year Comparison Indicating the Proportion of Students Identified as Caucasian Enrolled in Career Academies by Career Cluster™ ..................................................................................................111
Table 4.5: Six-year Comparison Indicating the Proportion of Students Identified as Asian Enrolled in Career Academies by Career Cluster™ ..................................................................................................112
Table 4.6: Six-year Comparison Indicating the Proportion of Students Identified as African American Enrolled in Career Academies by Career Cluster™ ......................................................................................113
Table 4.7: Six-year Comparison Indicating the Proportion of Students Identified as Hispanic Enrolled in Career Academies by Career Cluster™ ..................................................................................................114
Table 4.8: Six-year Comparison Indicating the Proportion of Career Academy Students Participating in NSLP by Career Cluster™ ..............................116

vi
Table 4.9: District High School Population and Demographics for Research Question Two ...........................................................................................118
Table 4.10: Sample Demographics by Career Academy Participant/Non-Participant ................................................................................................120
Table 4.11: Mean Number of Semesters of CTE Coursework Taken in Middle School ......................................................................................................120
Table 4.12: Mean Scores on FCAT Reading and Mathematics in Middle School (8th grade) ....................................................................................122
Table 4.13: Career Academy Participants Binary Logistic Regression Model Goodness of Fit – Omnibus .....................................................................123
Table 4.14: Career Academy Participants Binary Logistic Regression Model Goodness of Fit – Log Likelihood ...........................................................123
Table 4.15: Career Academy Participants Binary Logistic Regression Model Goodness of Fit – Hosmer & Lemeshow .................................................124
Table 4.16: Predictor Variables in the Equation for Binary Logistic Regression Addressing the Likelihood of Students to Enroll in Career Academies ................................................................................................126
Table 4.17: District High School Population and Career Academy Sample Demographics ..........................................................................................127
Table 4.18: Career Academy Demographics – Gender by Career Cluster™ .............128
Table 4.19: Career Academy Demographics – Race/Ethnicity by Career Cluster™ ..................................................................................................129
Table 4.20: Career Academy Demographics – Socio-economic Status by Career Cluster™ ......................................................................................130

vii
Table 4.21: Mean Number of Semesters of CTE Coursework Taken in Middle School ......................................................................................................131
Table 4.22: Mean Scores on FCAT Reading and Mathematics in Middle School (8th grade) ....................................................................................132
Table 4.23: Career Academy Sample and Health Science (Reference Group) Demographics ..........................................................................................133
Table 4.24: Health Science (Reference Group) Sample Means for Prior Learning & Performance..........................................................................133
Table 4.25: Model Fitting Information for Multinomial Logistic Regression Analysis....................................................................................................135
Table 4.26: Goodness of Fit Information for Multinomial Logistic Regression Analysis....................................................................................................135
Table 4.27: Pseudo R2 for Multinomial Logistic Regression Analysis ......................135
Table 4.28: Likelihood Ratio Tests for Multinomial Logistic Regression Analysis....................................................................................................136
Table 5.1: Six-year Proportional Comparisons of Students of Color Within the High School Population and Those Enrolled in a Career Academy ..................................................................................................153

viii
LIST OF FIGURES
Figure 2.1: Simplified Conceptual Model of the Career Academy Approach .............43
Figure 2.2: Conceptual Framework for Analyzing Career Academy Participation ...............................................................................................83
Figure 4.1: Six-year School District Enrollment Trends of High Schools and Career Academies ....................................................................................105
Figure 4.2: Six-year School District Gender Trends of High Schools and Career Academies ....................................................................................108
Figure 4.3: Six-year School District SES Trends of High Schools and Career Academies ................................................................................................115
Figure A1: Comparison of All District High School Students vs. Career Academy Students ...................................................................................184
Figure A2: Proportion of District High School Students Actively Enrolled in a Career Academy by School Year .............................................................184
Figure A3: Gender Comparison of All District High School Students vs. Career Academy Students by School Year ..............................................185
Figure A4: Gender Proportions of Students Enrolled in Career Academies Within the Agriculture, Food & Natural Resources Career Cluster ........185

ix
Figure A5: Gender Proportions of Students Enrolled in Career Academies Within the Architecture & Construction Career Cluster..........................186
Figure A6: Gender Proportions of Students Enrolled in Career Academies Within the Arts, A/V Technology & Communications Career Cluster ......................................................................................................186
Figure A7: Gender Proportions of Students Enrolled in Career Academies Within the Business, Management & Administration Career Cluster ......................................................................................................187
Figure A8: Gender Proportions of Students Enrolled in Career Academies Within the Education & Training Career Cluster ....................................187
Figure A9: Gender Proportions of Students Enrolled in Career Academies Within the Finance Career Cluster ...........................................................188
Figure A10: Gender Proportions of Students Enrolled in Career Academies Within the Government & Public Administration and Law, Public Safety, Corrections & Security Career Clusters ......................................188
Figure A11: Gender Proportions of Students Enrolled in Career Academies Within the Health Science Career Cluster ...............................................189
Figure A12: Gender Proportions of Students Enrolled in Career Academies Within the Hospitality & Tourism Career Cluster ...................................189
Figure A13: Gender Proportions of Students Enrolled in Career Academies Within the Information Technology Career Cluster ................................190
Figure A14: Gender Proportions of Students Enrolled in Career Academies Within the Marketing Career Cluster .......................................................190

x
Figure A15: Gender Proportions of Students Enrolled in Career Academies Within the Science, Technology, Engineering & Mathematics (STEM) Career Cluster ............................................................................191
Figure A16: Percentage of Career Academy Students by Race/Ethnicity ...................192
Figure A17: Proportion of Career Academy Caucasian Students Over Time .............192
Figure A18: Proportion of Career Academy Students of Color by Race/Ethnicity Over Time .......................................................................193
Figure A19: Comparison of All African American District High School Students vs. African American Career Academy Students by School Year ..............................................................................................193
Figure A20-a: Comparison of All Asian District High School Students vs. Asian Career Academy Students by School Year ..............................................194
Figure A20-b: Comparison of All Asian District High School Students vs. Asian Career Academy Students by School Year ..............................................194
Figure A21: Comparison of All Caucasian District High School Students vs. Caucasian Career Academy Students by School Year ............................195
Figure A22: Comparison of All Hispanic District High School Students vs. Hispanic Career Academy Students by School Year ...............................195
Figure A23-a: Comparison of All Multi-Racial District High School Students vs. Multi-Racial Career Academy Students by School Year ........................196
Figure A23-b: Comparison of All Multi-Racial District High School Students vs. Multi-Racial Career Academy Students by School Year ........................196
xi
Figure A24: Racial/Ethnic Proportions of Students Enrolled in Career Academies Within the Agriculture, Food & Natural Resources Career Cluster ..........................................................................................197
Figure A25: Racial/Ethnic Proportions of Students Enrolled in Career Academies Within the Architecture & Construction Career Cluster .......197
Figure A26: Racial/Ethnic Proportions of Students Enrolled in Career Academies Within the Arts, A/V Technology & Communications Career Cluster ..........................................................................................198
Figure A27: Racial/Ethnic Proportions of Students Enrolled in Career Academies Within the Business, Management & Administration Career Cluster ..........................................................................................198
Figure A28: Racial/Ethnic Proportions of Students Enrolled in Career Academies Within the Education & Training Career Cluster .................199
Figure A29: Racial/Ethnic Proportions of Students Enrolled in Career Academies Within the Finance Career Cluster ........................................199
Figure A30: Racial/Ethnic Proportions of Students Enrolled in Career Academies Within the Government & Public Administration and Law, Public Safety, Corrections & Security Career Clusters ..................200
Figure A31: Racial/Ethnic Proportions of Students Enrolled in Career Academies Within the Health Science Career Cluster ............................200
Figure A32: Racial/Ethnic Proportions of Students Enrolled in Career Academies Within the Hospitality & Tourism Career Cluster ................201
Figure A33: Racial/Ethnic Proportions of Students Enrolled in Career Academies Within the Information Technology Career Cluster .............201

xii
Figure A34: Racial/Ethnic Proportions of Students Enrolled in Career Academies Within the Marketing Career Cluster ....................................202
Figure A35: Racial/Ethnic Proportions of Students Enrolled in Career Academies Within the Science, Technology, Engineering & Mathematics (STEM) Career Cluster ......................................................202
Figure A36: Socio-economic Comparison of All District High School Students Eligible for the National School Lunch Program (NSLP) vs. Career Academy Students Eligible for the National School Lunch Program (NSLP) by School Year ............................................................203
Figure A37: Proportions of Students Eligible for NSLP Enrolled in Career Academies Within the Agriculture, Food & Natural Resources Career Cluster ..........................................................................................203
Figure A38: Proportions of Students Eligible for NSLP Enrolled in Career Academies Within the Architecture & Construction Career Cluster .......204
Figure A39: Proportions of Students Eligible for NSLP Enrolled in Career Academies Within the Arts, A/V Technology & Communications Career Cluster ..........................................................................................204
Figure A40: Proportions of Students Eligible for NSLP Enrolled in Career Academies Within the Business, Management & Administration Career Cluster ..........................................................................................205
Figure A41: Proportions of Students Eligible for NSLP Enrolled in Career Academies Within the Education & Training Career Cluster .................205
Figure A42: Proportions of Students Eligible for NSLP Enrolled in Career Academies Within the Finance Career Cluster ........................................206
Figure A43: Proportions of Students Eligible for NSLP Enrolled in Career Academies Within the Government & Public Administration and Law, Public Safety, Corrections & Security Career Clusters ..................206

xiii
Figure A44: Proportions of Students Eligible for NSLP Enrolled in Career Academies Within the Health Science Career Cluster ............................207
Figure A45: Proportions of Students Eligible for NSLP Enrolled in Career Academies Within the Hospitality & Tourism Career Cluster ................207
Figure A46: Proportions of Students Eligible for NSLP Enrolled in Career Academies Within the Information Technology Career Cluster .............208
Figure A47: Proportions of Students Eligible for NSLP Enrolled in Career Academies Within the Marketing Career Cluster ....................................208
Figure A48: Proportions of Students Eligible for NSLP Enrolled in Career Academies Within the Science, Technology, Engineering & Mathematics (STEM) Career Cluster ......................................................209
Figure A49: Career Academy Enrollments Within the Agriculture, Food & Natural Resources Career Cluster ............................................................210
Figure A50: Career Academy Enrollments Within the Architecture & Construction Career Cluster .....................................................................210
Figure A51: Career Academy Enrollments Within the Arts, A/V Technology & Communications Career Cluster ..............................................................211
Figure A52: Career Academy Enrollments Within the Business, Management & Administration Career Cluster .................................................................211
Figure A53: Career Academy Enrollments Within the Education & Training Career Cluster ..........................................................................................212
Figure A54: Career Academy Enrollments Within the Finance Career Cluster ..........212

xiv
Figure A55: Career Academy Enrollments Within the Government & Public Administration and the Law, Public Safety, Corrections & Security Career Clusters .........................................................................................213
Figure A56: Career Academy Enrollments Within the Health Science Career Cluster ......................................................................................................213
Figure A57: Career Academy Enrollments Within the Hospitality & Tourism Career Cluster ..........................................................................................214
Figure A58: Career Academy Enrollments Within the Information Technology Career Cluster ..........................................................................................214
Figure A59: Career Academy Enrollments Within the Marketing Career Cluster ......215
Figure A60: Career Academy Enrollments Within the Science, Technology, Engineering & Mathematics (STEM) Career Cluster ..............................215

xv
ABSTRACT
The purpose of this study was to describe participation patterns at the district level
of students enrolled in career academies and determine whether participation in career
academies is a function of demographic and/or prior learning experience and prior
performance variables. Ex-post facto data was used to determine six-year enrollment
trends. In addition, both binary logistic regression and multinomial logistic regression
methods were employed to determine the extent demographic along with prior learning
experience and prior performance variables could be used to predict participation within
career academies. Trend data results indicated slight increases in the proportions of
students of color (including African American, Hispanic, and Multi-Racial) enrolling in
career academies. However, Caucasian students continued to be overrepresented in
career academies. Furthermore, female students, as well as students from economically
advantaged families, enrolled to higher degrees in career academies. Moreover, students
who enrolled in career academies were found to have taken more CTE coursework while
enrolled in middle school and they demonstrated higher mean scores on the reading and
mathematics portions of the state assessment during the school year prior to entering high
school. The study is significant as it seeks to address a gap in the literature on career
academy program participation, supporting the notion that the demographic (gender,
race/ethnicity, and socio-economic status) make up of career academies mirror the
demographics of the schools, districts, and the communities in which they operate.
1
CHAPTER ONE: INTRODUCTION
The vocational education movement began with the Smith-Hughes Act of 1917
with a focus on training workers for low and semi-skilled occupations as required by the
emerging industrial revolution (Silverberg, Warner, Fong, & Goodwin, 2004). That is,
the purpose of vocational education was “to prepare students for entry-level jobs in
occupations requiring less than a baccalaureate degree” (Levesque, Lauen, Teitelbaum,
Alt, & Librera, 2000, p. 1). As initially enacted, vocational education provided specific
preparation for work in the growing U.S. industrial era, while academic education
prepared the college-bound students. For nearly a century, this tracking model remained
largely unchanged and vocational education was viewed as a “dumping ground” for
students who were at risk of dropping out including minorities and students with low
socioeconomic backgrounds (Agodini, Uhl, & Novak, 2004). Since virtually all students
with a high school diploma were able to find jobs, this model worked until the1980’s
when new demands in the world of work began to require different sets of entry-level
workforce skills.
The New Vocationalism
In response to new skill requirements over the past two decades, the goals and
objectives of a “new vocationalism” shifted from specific training for work to a more
rigorous academic/technical grounding focused on preparation for careers for all students

2
(Hernández-Gantes, Phelps, Jones, and Holub, 1995; Kemple & Snipes, 2000; Levesque
& Hudson, 2003a, 2003b; Levesque et al., 2008; Levesque et al., 2000; Silverberg et al.,
2004). As part of national comprehensive high school reform, and to reflect the new shift
in focus, the field of vocational education embraced a new identity as career and
technical education (CTE) (Plank, DeLuca, & Estacion, 2005). The goal of CTE is to
prepare students for further postsecondary education as well as for broader career pursuits
(Agodini et al., 2004; Kemple & Snipes, 2000; Levesque & Hudson, 2003b; Levesque et
al., 2008; Levesque et al., 2000; Silverberg et al., 2004). The underlying premises of
CTE has emphasized an increased rigor in vocational programs, a shift to high-wage and
high-tech career preparation, and increased integration with academic education to
support further preparation for postsecondary education or work (Levesque & Hudson,
2003a; Levesque & Hudson, 2003b; Levesque et al., 2008; Levesque et al., 2000;
Silverberg et al., 2004).
Federal (Carl D. Perkins) legislation led the way for states and school districts to
develop strategies to increase rigor in CTE programs by incorporating academic core
standards and encouraging the integration of cross-curricular projects (U.S. Department
of Education, 2011). Furthermore, advancements in technology and the changing nature
of work have contributed to a stronger focus on programs that prepare students for high-
skill, high-wage and high-demand occupations in the 21st century (Bureau of Labor
Statistics, 2005). Beyond that, increased graduation requirements in many states have
also led to shifts in academic course taking where students enroll in a higher number of
college prep courses. Moreover, the push to increase the number of qualified members of
the workforce, specifically in science, technology, engineering and mathematics (STEM)

3
fields, has served to compound this phenomenon (Anderson, 2010; Brown, 2011;
Hagedorn & Purnamasari, 2012). At the core of these reform efforts is the radical move
from specific preparation for work for low-performing students to preparing all students
for both college and careers (Kemple & Snipes, 2000; Levesque & Hudson, 2003a,
2003b; Levesque et al., 2008; Levesque et al., 2000; Silverberg et al., 2004).
Shifting Enrollment Trends
As a result of the shift to prepare all students for college and careers, CTE
programs experienced considerable enrollment transformations over the past two
decades. While still popular in the mid 1990s, trade and industry related programs
suffered a marked decline in enrollments, while at the same time, enrollment in programs
focused on communications, health care, and technology nearly doubled (Levesque et al.,
2000). This shift in enrollment led more students away from the general education
pathway to one aligned with preparation for either college or work. Historically, students
considered to be low achieving and not headed for college following high school
graduation were often tracked in occupational programs (Agodini & Deke, 2004; Agodini
et al., 2004; Kemple & Snipes, 2000; Levesque & Hudson, 2003a, 2003b; Levesque et
al., 2008; Levesque et al., 2000; Silverberg et al., 2004). As the field has changed in the
last two decades with emerging program designs such as career academies, students
participating in CTE programs have become more eclectic and diverse with nearly one in
five students transitioning to postsecondary institutions earning a minimum of a
bachelor’s degree (Silverberg et al., 2004).
Several reports from the National Center for Educational Statistics (NCES) have
confirmed this shift in enrollment patterns during the 1990s. That is, students across the

4
country were enrolling in more academic and college-prep courses due in part to
increased high school graduation requirements (Levesque & Hudson, 2003b; Levesque et
al., 2008; Levesque et al., 2000). As CTE programs increased rigor and ties to academic
content standards, these programs began attracting “more academically talented”
students. Thus, overall enrollment in CTE now includes students concentrating in CTE
programs along with an increasing number of non-concentrators who take courses
selectively for their academic purposes (Silverberg et al., 2004, p. 42).
Career Academies
A promising initiative meeting the premises of the CTE reform movement is the
career academy model. By 2004, there were approximately 4800 high schools across the
country that offered career academies (Castellano et al., 2007; Kemple & Snipes, 2000;
Levesque et al., 2000; National Center for Educational Statistics, 2011; Stern, Raby, &
Dayton, 1992). Career academies are small learning communities delivering a college-
prep curriculum with a career theme and have active partnerships with employers, the
community, and higher education. They are structured programs at comprehensive high
schools designed to increase student engagement and achievement while developing the
skill sets and necessary credentials to pursue postsecondary education or enter into the
workforce (Kemple & Snipes, 2000; Orr, Bailey, Hughes, Karp, & Kienzl, 2004). Career
academies integrate academic with CTE content in an effort to increase rigor while
building relevancy to students’ career interests (Castellano et al., 2007; Kemple &
Snipes, 2000; Levesque et al., 2000; Stern et al., 1992).
The original intent of career academies was to reduce the dropout rate while
preparing students for the labor market (Agodini & Deke, 2004; Silverberg et al., 2004).

5
To this end, according to Kemple and Snipes (2000), when career academies incorporate
interpersonal supports among students, their peers, and their teachers, the results show
improved outcomes for students at high risk for school failure. Positive outcomes
included increased attendance and increased academic course-taking, which in turn,
increased the likelihood of students earning sufficient credits for graduation, thereby
reducing dropout rates. However, in career academies where there was no evidence of
enhanced interpersonal supports, resulting outcomes were not positive and actually
resulted in higher dropout rates. The extent to which interpersonal supports are
incorporated in career academies appears to make a difference in student outcomes.
Regarding academic performance, there is evidence indicating that students
participating in career academies perform as well as counterparts in other college
preparatory tracks (Kemple & Snipes, 2000; Silverberg et al., 2004). In terms of
postsecondary outcomes, results have suggested that compared to general education
pathway students, a higher number of career academy students reported having a
transitional plan upon graduation from high school. In addition, findings from
longitudinal studies have also indicated that male students who participated in a career
academy program were more likely to have a stable family and home life compared to the
control group 15 years after the study began (Kemple & Willner, 2008).
Implications for Student Participation
While expanding the base of students served in CTE programs has been a federal
and societal milestone for social change, there may also be implications for those students
who come from less-advantaged backgrounds. In an environment where CTE programs
are becoming more rigorous, and with the increasing participation of students from more-

6
advantaged backgrounds, the implications of these shifting participation trends could
result in limiting participation of students from less-advantaged backgrounds. This is
especially critical for students at-risk for school failure who view CTE programs as their
reason for coming to school. If sub groups of students are choosing to not enroll in CTE
programs designed to increase the likelihood they might enter high wage, high demand
career fields, including STEM careers, it is possible these (less-advantaged) students,
who critically need the connection of school to life relevancy, might not participate in
and therefore, not realize the benefit from these highly rigorous programs (Anderson,
2010; Fletcher & Cox, 2012).
Problem Statement
Career academies were originally developed to keep students considered at-risk of
dropping out enrolled in school through graduation (Kemple & Snipes, 2000). However,
as the career academy movement gained momentum, there were unintended
consequences regarding enrollment, in particular for students at risk for dropping out. As
the benefits of career academies became more widely recognized, students with stronger
academic skills began to enroll in career academies (Castellano et al., 2007; Kemple &
Snipes, 2000). As a result, career academies began attracting greater numbers of
advantaged students. So paradoxically speaking, while career academies were originally
designed to boost the skills of students who needed academic assistance, the opportunity
appears to have been seized by academically robust students. To that end, there could be
further implications to the growing challenge of increasing the high-skill workforce,
particularly in the STEM occupation fields (Anderson, 2010; Ndura, Robinson, & Ochs,
2003; Syed & Chemers, 2011; Whalen & Shelley, 2010).

7
In this context, there is a gap in the CTE literature on program participation,
supporting the notion that the demographic (gender, race/ethnicity, and socio-economic
status) make up of career academies mirror the demographics of the schools, districts,
and the communities in which they operate (Silverberg et al., 2004). There should be a
clear alignment between the demographics of the students enrolled in career academies
and the communities in which their families live and work. That is, the programs which
serve as the foundation to career academies within the schools and community should
also align with employment opportunities within said community.
Agodini et al. (2004) confirmed that while there are numerous research studies
which identify the populations of students enrolled in CTE programs, those findings do
not indicate the factors that influence participation nor the student demographics of each
program under the CTE umbrella. Further, little is known about the rate of participation
and/or the factors promoting or inhibiting students’ interest in and decision to participate
in career academies. Given the significant policy implications of related inquiry, Agodini
et al. (2004) called for further research to analyze these participation patterns. Thus, the
present study aimed to explore and more fully understand this phenomenon beginning
with a focus on identifying the demographic characteristics of students participating in
career academies.
Recognizing this may be an issue of access and equity, as well as pre-conceived
notions of what CTE programs have to offer students, now is a critical time to investigate
this problem. Pertinent questions to ask include: What are the recent participation trends
in career academies? Do the demographic characteristics of career academies reflect
overall school and district demographics? Are certain demographic groups of students

8
drawn to certain types of career academies more so than others? What are the factors
associated with decisions for participation? In this regard, there are a limited number of
studies in the literature focused on the factors which contribute to students’ decision-
making processes on whether or not they choose to participate in career academies
(Kemple & Snipes, 2000; Levesque et al., 2000; Silverberg et al., 2004). Realizing the
scope of such an undertaking, this study takes the first step in exploring these phenomena
by analyzing recent trends and present career academy participation rates.
Purpose and Research Questions
The purpose of this study was to describe participation patterns at the district level
of students enrolled in career academies and determine whether participation in career
academies in general, and in specific types of career academies, is a function of
demographic and/or prior learning experience and performance variables. The following
research questions guided this study:
1) What are the participation trends in career academies over a recent six-year
period (2007-2012) based on demographic variables including gender,
race/ethnicity, and socio-economic status (SES)?
2) To what extent do demographic, prior learning experience, and performance
variables predict participation in career academies?
3) To what extent do demographic, prior learning experience, and performance
variables predict participation within specific types of career academies
(based upon Career Clusters™)?
For the purpose of this study, patterns of participation referred to enrollment
demographics over the span of at least five years to determine who chooses to participate

9
in career academies. This served as the foundation to determine participation rates.
These participation rates are described in terms of demographic data (gender,
race/ethnicity and socio-economic status). Learning experience refers to the number of
career exploration (CTE) courses taken at the middle school level prior to a student’s
decision to enroll in a career academy at the high school level. Prior performance was
the student’s academic achievement at the middle school level as measured by annual
state assessment scores. Predicting participation refers to the alignment between certain
demographic and prior experience variables and the propensity to participate in a career
academy. Career Clusters™ refers to the organization of various occupations and career
pathways as determined by the knowledge and skill set they require (National
Association of State Directors of Career Technical Education Consortium, 2011).
The 16 nationally recognized Career Clusters™ include: (a) Agriculture, Food &
Natural Resources, (b) Architecture & Construction, (c) Arts, A/V Technology &
Communications, (d) Business Management & Administration, (e) Education & Training,
(f) Finance, (g) Government & Public Administration, (h) Health Science, (i) Hospitality
& Tourism, (j) Human Services, (k) Information Technology, (l) Law, Public Safety,
Corrections & Security, (m) Manufacturing, (n) Marketing, (o) Science, Technology,
Engineering & Mathematics (STEM), and (p) Transportation, Distribution & Logistics
(National Association of State Directors of Career Technical Education Consortium,
2011).
Conceptual Framework
Several social cognitive theoretical models have been developed to help
researchers understand the satisfaction levels experienced in vocational and educational

10
pursuits of high school students and graduates. These models have suggested that social
cognitive variables, such as self-efficacy and goals, function together with personality
traits and are intricately linked to future job satisfaction. Bandura’s social cognitive
theory states people learn from one another through observation and modeling. Informed
by Bandura’s theory, the social cognitive career theory (SCCT) has three components
including self efficacy, outcome expectations, and personal goals. Each of these factors
constantly influences the other two (Lent, Brown, & Hackett, 1994). Building upon these
theoretical premises, the social learning theory of career decision making (SLTCDM)
developed by John Krumboltz suggests that career decisions are the result of various
learning experiences enhanced by interactions with people, institutions and events which
occur in a person’s environment (Canadian Career Development Foundation, 2012).
According to Mitchell and Krumboltz (1990), the social learning theory of career
decision making allows researchers to understand why individuals choose to enter
particular educational programs and/or occupational fields. Krumboltz’s social learning
theory of career decision making served as the foundational theory used to formulate the
conceptual framework which guided this research study (Krumboltz, Mitchell, & Jones,
1976).
Krumboltz’s theory is comprised of four factors including: (a) background
variables, (b) environmental conditions and events, (c) learning experiences, and (d) task
approach skills. Background variables include gender, race/ethnicity, and socio-
economic status, along with special abilities such as artistic, musical, and athletic talents
as well as various physical handicaps. Environmental conditions include social, political,
cultural and economic conditions as well as events such as natural disasters. Learning

11
experiences are those events which help learners differentiate between possible careers.
Task approach skills are the performance outcomes of the interaction between the three
previous factors. Furthermore, the resulting consequences of all four factors contribute to
an individual’s perspective on varying career choices (Krumboltz et al., 1976).
Accordingly, the variables described in the methods section of this dissertation align with
the factors from this underlying theory and served to inform both the conceptual
framework as well as assisted in the interpretation of the findings from this study.
Limitations
This study was designed to describe enrollment trends and participation patterns
at the district level of high school students in career academies and to determine whether
participation in career academies in general, and within specific types of career
academies, is a function of demographic and/or prior learning experience and
performance variables. One of the foremost concerns in this research study is the
inability to control for confounding variables which may account for reasons students
chose to enroll in a career academy. There may in fact be many reasons beyond the
scope of the demographic and/or prior learning experience and performance variables
being investigated in this research study that account for students enrolling in career
academies.
A second limitation centered on data collection. For data related to the first
research question, only aggregate demographic numbers were available for investigation.
These data were collected as part of the end-of-year reporting requirements by the state of
Florida. As the data available for collection for each category is counted individually,

12
there was no meaningful way to determine which if any of these students crossed
categories by gender, race/ethnicity and socio-economic status.
For the second and third research questions, there was a lack of data available for
those presently enrolled high school students who did not attend middle school within
Volusia County. While these students were still be part of the analysis for demographic
variables, results for tests related to prior learning experience and performance variables
were limited to those students who were enrolled in Volusia County middle schools.
Delimitations
Participation in this study was delimited to secondary students who: (a) attended
public high school, (b) in Volusia County, Florida, and (c) had the opportunity to enroll
and participate in a career academy experience. The following delimitations served to set
the parameters for this study. There were approximately 17,900 high school students in
Volusia County. Data was collected from each of the 10 comprehensive high schools
within the school district. There were 32 career academies within the district’s 10
comprehensive high schools.
While there are many aspects of career academy participation that contribute to
the knowledge base, (attendance rates, discipline referral rates, GPA, volunteer hours,
dropout vs. graduation rates, etc.), this study only focused on demographic and prior
learning experience and performance variables and how these variables might be used to
predict participation within a career academy. This research study did not focus on issues
surrounding curriculum development or integration, the benefits or challenges of
operating a career academy, or specific members of the school population such as

13
students with handicaps. Furthermore, this study was not designed to follow students
beyond high school graduation.
In addition, this research study did not take into account parent or guardian levels
of education, employment status, or household income. This study did not investigate
students’ perceptions of CTE or career academies, or the factors that contributed to their
decision to participate within a career academy. This research study was delimited to
analyzing ex-post facto data available within the school district information management
systems. No students, parents, teachers, counselors, or other individuals were directly
involved in providing data for this research study.
Significance of the Study
This study adds important insights into the knowledge base and begins to fill a
gap in the literature on career academies. A number of reasons exist to ensure diverse
representation in career academies: (1) academy participation equips young people with
the knowledge and skills to be successful beyond high school, in postsecondary education
and in the workforce; (2) students benefit from developing deeper relationships with their
peers and the academy teaching team and; (3) diversity enhances the experiences of all
members in the academy. This study provides empirical data to add to the body of
knowledge, related to racial/ethnic and socio-economic disparities among career clusters,
which can be used to evaluate and compare career academy participation rates in other
areas of the country.
Over the years, many reform efforts have been proposed and developed in an
attempt to adequately prepare secondary students for careers and postsecondary
education. Students realize increased benefit when programs are infused within a career

14
academy model. If career academies are designed to assist students of all levels to be
successful, one must ask the question “are there groups of students choosing to
participate in career academy opportunities more or less than other groups?” By asking
this question, the researcher sought to determine if there were any demographically
underrepresented groups in career academies. To that end, if there were groups found to
be underrepresented in career academies, then strategies could be developed to encourage
underrepresented students to consider career academies as a viable high school option.
Research studies have been conducted on the benefits of career academy
participation and the results tend to be positive. “Career academies… link school to the
world outside, place academic instruction in a practical context, engage students in a
learning community, avoid tracking, and prepare students for both work and further
education” (Stern et al., 1992, p. 163). What is lacking from the research knowledge base
is an investigation into whether there are groups of students within the secondary school
population who choose not to participate in career academies, or choose to focus on
academies primarily within certain Career Clusters™. The results of this study will allow
other school district administrators to evaluate their own career academy models and
determine if opportunities for segments of the population are being disregarded. From
this increased awareness, educators can develop strategies to correct any imbalance.

15
CHAPTER TWO: REVIEW OF THE LITERATURE
There is a considerable gap in the literature focused on students who participate in
career academies and the reasons or factors which contribute to their decisions to enroll.
Realizing the scale of such a project, the purpose of this research study was to take an
initial look into these phenomena and determine demographically who the students are
that actively participate in career academies. The findings from this research study
provide the literature with a base of information from which researchers can begin to
examine the factors associated with such participation. Thus, the scope and sequence of
this chapter is as follows. Initially, a brief overview of new directions in the field of
career and technical education (CTE) is provided. Second, career academies and
outcomes are presented. Third, shifts in enrollment patterns in CTE are discussed.
Fourth, available literature on career academy enrollment trends is explored. Fifth,
literature on tracking structure is discussed. Sixth, Krumboltz’s social learning theory of
career decision-making is described as support for the conceptual framework upon which
this study was designed. Finally, the conceptual framework guiding this study is
articulated. While the term career and technical education is the preferred up-to-date
nomenclature used to describe this area of education and training, the term vocational
education may still be used to accurately describe CTE within the historical context.
16
New Directions in the Field of CTE
Vocational education. Training for occupations and careers has been around as
long as work itself has existed. In earlier societies, young men learned the application of
trade skills through apprenticeships from their fathers or other longtime craftsmen.
Through organized apprenticeships in early America, five basic essentials were provided
to youth: (a) shelter, food and clothing; (b) religious instruction; (c) general instruction in
reading, writing and mathematics; (d) instruction on the trade itself; and (e) related trade
instruction (Barlow, 1976).
Early land grant acts, such as the Morrill Acts, provided initial support of
vocational education as far back as 1862 (Gordon, 2008). However, the vocational
education movement officially began with the Smith-Hughes Act of 1917 with a focus on
training workers for low and semi-skilled occupations as required by the emerging
industrial revolution (Silverberg et al., 2004). That is, the purpose of vocational
education was “to prepare students for entry-level jobs in occupations requiring less than
a baccalaureate degree” (Levesque et al., 2000, p. 1). As initially enacted, vocational
education provided specific preparation for work in the growing U.S. industrial era, while
academic education prepared the college-bound students. For nearly a century, this
tracking model remained largely unchanged and vocational education was oftentimes
viewed as a “dumping ground” for students who were at risk of dropping out including
minorities and students with low socioeconomic backgrounds (Agodini et al., 2004).
However, within the last three decades, the purpose of vocational education began to shift
toward a broader preparation of academic, vocational and technical skills that provides a
wide range of career choices (Levesque et al., 2000).

17
Emerging vocationalism. During the 1980s, educational reform efforts were
employed with the intent of making strides with lower-achieving students. Goals
included (a) increasing achievement of students regarded in the lower third ability group,
(b) increasing high school graduation rates, and (c) reducing levels of youth poverty.
Students who were oftentimes considered to be in at-risk situations were the main foci of
these reform efforts. Unfortunately, little success was realized as a result of these
initiatives. Consequently, reform initiatives of the next decade (1990s) expanded to a
comprehensive model that focused on increasing educational opportunities for all
students (Hernández-Gantes et al., 1995).
As part of this reform movement, and federal legislation including the 1990
Perkins Act, vocational education emerged with a new focus. This “New” or “Emerging
Vocationalism” no longer focused on solely providing training for a particular job in
industry, but rather opened up educational opportunities for students to gain knowledge
about all aspects of the industry in which they shared an interest (Heebner, 1995).
Hernández-Gantes et al. (1995) describe this new paradigm as incorporating: (a) the
integration of academic and vocational curricula, (b) integration between secondary and
postsecondary programs of study, and (c) stronger links between educational systems and
the workforce. Through this model, the goals were to increase academic and
occupational skills for all students. Many new curriculum models were developed in
order to facilitate this shift in teaching and learning. Some of the new models included:
(a) career magnets, (b) high schools based upon career clusters, (c) school-based
enterprises, and (d) career academies (Heebner, 1995). All of these models were

18
designed to increase relevancy for students and to assist students in seeing the pathways
from high school to postsecondary education and work (Lewis & Cheng, 2006).
Enrollment Patterns in CTE
The original purpose of vocational education was to prepare secondary students
for entry-level work in occupations that required less than a baccalaureate degree
(Levesque et al., 2000). According to Silverberg et al. (2004) more recent legislation has
promoted educational equity, improvements in program quality, and a shift in direction
from the original intent of vocational education as a separate program or track. Over the
past two decades, the purpose of vocational education has been expanded to incorporate a
broader curriculum context along with a structure that prepares all students for both
college and careers (Levesque et al., 2000).
Organization and delivery. The Secondary School Taxonomy (SST) developed
by the National Center for Education Statistics (NCES) categorizes high school
vocational/career and technical programs into three main curricula: (a) specific labor
market or occupational education, (b) general labor market preparation, and (c) family
and consumer sciences education (Levesque & Hudson, 2003a, 2003b). Specific labor
market occupational courses convey a base of knowledge and skill set that is required in a
specific occupation or within a set of related occupations such as drafting, the
construction trades, or health science. General labor market curricula includes such
programs as introductory technology education or business related courses that provide
transferrable, non-specific skills like keyboarding and other general work experience
classes. Family and consumer science programs are comprised of courses designed to

19
prepare students for everyday roles in life outside of the recognized paid labor market
(Levesque & Hudson, 2003a, 2003b; Silverberg et al., 2004).
Vocational education has typically been offered in comprehensive high schools,
area vocational (CTE) schools, and full-time vocational (CTE) schools. Levesque et al.
(2008) reported that in 2002, there were approximately 18,000 public high schools in the
U.S. Five percent were considered full-time CTE high schools. Forty-six percent were
comprehensive high schools served by area CTE schools and 49% were comprehensive
high schools not served by area CTE schools. In looking strictly at those schools that
offered some degree of CTE coursework in 2004, Silverberg et al. (2004) counted close
to 9500 comprehensive high schools, 1000 vocational high schools, and approximately
800 area or regional vocational schools across the country offering CTE courses and
programs. Overall, 88% of all public high schools offered at least one occupational
program either on or off-site with the most common being business (97%) and computer
technology (94%) (Levesque et al., 2008).
Following a period of declining enrollments, participation has remained stable
over the past 10-15 years. Nearly 96.6% of all students take some form of career and
technical education (Silverberg et al., 2004). Participation in CTE programs are most
often measured by the number of credits students earn. The term vocational course taker
is used to identify a student who earns any type of vocational or CTE credit. This
represents approximately 97% of all students. Students who earn three or more CTE
credits, regardless of how these credits may be organized, are called investors. Investors
account for 44.5% of all students and can be further broken down into concentrators and
explorers.
20
A concentrator is a student who earns three or more credits within a single CTE
program. About 26% of students complete a third year of coursework within a chosen
program sequence. Students who complete three or more credits, where those credits
cross multiple program areas, are termed explorers. Approximately 18.5% of students
explore CTE offerings without making a commitment to any particular program sequence
(Silverberg et al., 2004). A specialist is a vocational student who completes four or more
credits within a specific CTE program area (Levesque et al., 2000). The research
literature has traditionally been centered in overall trends of vocational education and
includes a focus on patterns of course taking of occupational concentrators as this group
is a common focus of federal and state accountability efforts (Levesque & Hudson,
2003b). Occupational concentrators are considered most likely to be preparing for a job
or career (Silverberg et al., 2004).
Characteristics of CTE participants. From the 2004 National Assessment of
Vocational Education (NAVE) report, Silverberg et al. (2004) indicated that
vocational/CTE students emerge from a diverse setting including special populations.
The majority of CTE participators are considered middle range in terms of academic and
economic advantage. In addition, those who are: (a) male, (b) have disabilities, (c) attend
lower-income or rural schools, or (d) enter high school with low academic achievement
participate in CTE to a higher degree than other students. Moreover, while there continue
to be challenges in overcoming gender differences in particular programs, CTE does
appear to be attracting more academically robust students.
Participation of students by gender. All students regardless of gender decreased
the amount of vocational/CTE coursework they completed between 1982 and 1994.

21
During the 1980s, declines in CTE participation were steeper for female students than
male students. Generally, among 1982 graduates, males took more CTE coursework than
female students, and as a result, were more prone to concentrate in occupational
education programs. During the early 1980s, male students concentrated in the following
CTE programs: (a) agriculture, (b) construction, (c) mechanics and repair, (d) print
production, and (e) materials production. Females, on the other hand, concentrated in: (a)
business services, (b) health care, (c) child care and education, as well as (d) personal and
other services programs (Levesque & Hudson, 2003a). By 1994, there was still a gender
gap in occupational education where 29% of male students were vocational concentrators
compared with 22% of female students (Levesque et al., 2000).
By 1998, there was a narrowing of the gender gaps within the business services,
computer technology, mechanics and repair, and materials production programs
(Levesque & Hudson, 2003a; Silverberg et al., 2004). In comparison to 1982, by 1998
more male students and fewer female students were likely to concentrate in business. In
addition, a gender gap reduction was realized in mechanics and repair, as well as in
materials production programs, because fewer male students were enrolling in these
programs. At the same time, the gender gap in child care and education increased as a
result of more female students enrolling in this program area (Levesque & Hudson,
2003a).
By 2005, male students generally still took more occupational courses than their
classmates who were female. Overall, CTE course taking by male students was
measured at 94.4% and course taking by female students measured at 89.8% (Levesque et
al., 2008). The proportion of male occupational concentrators was 25.3% and the

22
proportion of female concentrators was 16.5%. Between 1990 and 2005, female students
experienced a four percentage point decline in occupational concentration from 21% to
17%. Levesque et al. (2008) also found that on average males earned 3.5 credits and
female students earned nearly a full credit less (2.6). In the ensuing years, female
students continued to concentrate in the same traditional program areas. Whereas by
2005, male students began to earn more credits in computer technology than their female
counterparts.
Participation of students by race and ethnicity. All students, regardless of race
or ethnicity, decreased the amount of vocational/CTE coursework they completed
between 1982 and 1994. During the 1980s, Hispanic students realized the most
significant declines in CTE participation. African American students participated in CTE
more than Asian students, but less than students from other racial and ethnic backgrounds
(Silverberg et al., 2004). Rates for occupational concentrators also declined for most
groups over the decade of the 1980s; while concentration rates for African American and
Asian/Pacific Islander ethnic groups remained about the same (Levesque et al., 2000).
Furthermore, Silverberg et al. (2004) also found that African American students were
more likely to concentrate in: (a) health, (b) food and hospitality, (c) personal services,
and (d) business services programs, which were all occupational education programs
showing projected job growth, albeit below average earnings. Interestingly, although the
number of occupational credits Asian/Pacific Islander students earned increased over
time, these students still completed fewer CTE courses compared with other racial/ethnic
groups (Levesque & Hudson, 2003a; Levesque et al., 2000).

23
Most statistically significant differences between occupational education
concentrators among racial and ethnic groups evident in 1982 were no longer significant
by 1998. Diminishing rates in the occupational concentration gaps were due to a decline
in the concentration rates of Hispanics and Whites while the American Indian/Alaskan
Native, Asian/Pacific Islander, and African American students’ rates of concentration did
not change (Levesque & Hudson, 2003a). As a result, although Asian/Pacific Islander
students were less likely to concentrate in occupational education overall in 1982, by
1998 no gaps were detected for Asian/Pacific Islander students in: (a) business services,
(b) communication technology, (c) food service and hospitality, (d) health care, or (e)
marketing programs (Levesque & Hudson, 2003a). In addition, American
Indian/Alaskan Native students were less likely than Whites in 1982 to concentrate in
computer technology, but any discernible gaps in this program area had also disappeared
by 1998.
When compared to White students in 1998, African American students were still
less likely to concentrate in agriculture or trade and industry programs. However, they
were more likely than American Indian/Native Alaskan students to concentrate in
business services and more likely than Hispanic students to concentrate in construction
trades (Levesque & Hudson, 2003a). African American students were also less likely
than White and Hispanic students to concentrate in materials production programs in
1982 and these gaps did continue to exist through 1998. While communication
technology programs were experiencing tremendous growth, increases in participation
were not realized by African American or Hispanic students. This trend occurred in spite
of data that indicated African American students were taking more computer-related

24
courses by 1998 compared to Asian/Pacific Islander students (Levesque & Hudson,
2003a).
By 2005, 96.6% of all students took at least one CTE course during their high
school career. When dissecting occupational education programs 93.3% of African
American students, 93.0% of Hispanic students, 92.0% of White students, and 87.0% of
Asian students took at least one occupational course (Levesque et al., 2008).
Furthermore, in comparing occupational concentration rates by race/ethnicity as shown in
Table 2.1, Levesque et al. (2008) found that only 21.8% of White students, 21.2% of
African American students, 18.2% of Hispanic students and 12.6% of Asian students
actually completed a concentration in a chosen occupational education program.
Moreover, White students earned 3.13 credits, while African American students earned
3.02, Hispanic students earned 2.80, and Asian students earned 2.26 CTE credits
(Levesque et al., 2008).
Table 2.1
Percentage of Occupational Concentrators by Race/Ethnicity: 1982 - 2005
Race/Ethnicity 1982 1990 1994 2005 American Indian/Alaskan Native 46.6 38.0 20.9 19.0 Asian/Pacific Islander 17.3 16.6 14.2 12.6 African American 32.7 27.3 29.0 21.2 Hispanic 37.7 27.9 24.9 18.2 White 33.2 28.5 25.3 21.8 Note. Data compiled from Levesque and Hudson (2003a, 2003b); Levesque et al. (2008); Levesque, Lauen, Teitelbaum, Alt, and Librera (2000), and Silverberg, Warner, Fong, and Goodwin (2004).
Overall, Asian students were found to have earned below average credits in: (a)
agriculture, (b) business services, (c) child care and education, (d) communications
technology, (e) construction, (f) materials production, and (g) mechanics and repair.
Hispanic students were found to have fewer credits in: (a) agriculture, (b) business
25
management, and (c) communications technology. While African American students
earned above average numbers of credits in business services and in health care, they also
earned below average credits in agriculture, materials production, mechanics and repair,
and print production (Levesque et al., 2008).
Participation of students with disability status. Following the Perkins II
guidelines, which called for a higher level of access to CTE for students with disabilities,
there was a marked increase in CTE participation, as well as the number of occupational
education credits earned by students with disabilities (Levesque et al., 2000). Students
with disabilities increased CTE participation by about 24% between 1982 and 1994 while
students without disabilities decreased participation by about 17% (Levesque et al.,
2000). When comparing overall CTE course credits, 83% of 1998 graduates with
disabilities enrolled in three or more CTE courses and earned on average, 5.85 credits.
This was significant when compared to 60.9% of their non-disabled counterparts who
enrolled in three or more CTE courses earning an average of 3.95 credits (Levesque &
Hudson, 2003a).
Following this pattern, occupational concentration rates and the average number
of credits earned in occupational education also increased for students with disabilities
(Levesque et al., 2000). According to Levesque and Hudson (2003a) there were no
significant differences between students with and without disabilities in relation to
occupational concentration rates in 1982. However, by 1998 students with disabilities
were more likely to concentrate in occupational education programs, specifically in: (a)
agriculture, (b) construction, (c) mechanics and repair, and (d) materials production. This
trend continued into the new millennium with the addition of food services and

26
hospitality. Conversely, graduates from the class of 2005 who were disabled earned
fewer credits in: (a) business services, (b) business management, (c) marketing, (d)
computer technology, and (e) communications technology (Levesque et al., 2008).
Participation of students with limited English proficiency (LEP). Levesque and
Hudson (2003a) reported that between 1982 and 1998, disadvantaged student groups took
significantly more CTE coursework when compared to more advantaged peers with the
exception of students with limited English proficiency (LEP). In this case, LEP students
actually earned fewer credits (3.19 vs. 4.0) than their English proficient peers.
Moreover, students with limited English proficiency were much less likely to participate
in and/or concentrate in occupational education programs than other students who
exhibited proficiency with the English language (Levesque & Hudson, 2003a; Silverberg
et al., 2004). By 2005, while 91.3% of students with limited English proficiency took
some level of CTE coursework, only 11.8% were found to be occupational concentrators
earning an average of 2.32 credits (Levesque et al., 2008). When compared to their non-
LEP peers, students with limited English proficiency earned fewer credits in: (a)
agriculture, (b) business services, (c) business management, (d) construction, (e)
communications technology, (f) food services, (g) marketing, and (h) materials
production (Levesque et al., 2008).
Participation of students known as academic achievers. Generally, between
1982 and 1994, students with lower GPAs completed a higher number of CTE credits
while students with higher GPAs typically earned fewer CTE credits (Levesque et al.,
2000). In comparing 1998 advantaged groups (low, moderate and highly advantaged,
with GPAs of <2.0, 2.0 – 3.5, >3.5 respectively), 79.5% of occupational concentrators
27
had mid-level GPAs and 75.5% of all 1998 graduates had mid-level GPAs (Levesque et
al., 2008). At the same time, Levesque & Hudson (2003a) reported that graduates with
higher GPAs (3.5 and greater) were more likely than students with lower GPAs to
concentrate in the broad technology program area. Moreover, students with higher GPAs
were also more likely to specifically concentrate in communications technology than
those students with mid-range GPAs.
At the turn of the millennium, occupational concentrators were still less likely to
be from highly-advantaged groups. That is, concentrators were less likely to have
completed high-level academic coursework and they were less likely to have high-level
GPAs. These students were also less likely to have taken high-level mathematics courses
(geometry or higher) in 9th grade. In fact, when comparing math levels of occupational
education concentrators in 1998, the percentage of concentrators who took lower
mathematics courses in 9th grade was 20.2% while the percentage of concentrators who
took higher levels of mathematics courses in 9th grade was 14.3% (Levesque & Hudson,
2003a).
However, over the decade and a half from 1982 to 1998, changes began to appear
evident in the characteristics of CTE occupational concentrators. These changes were
mirrored reflections of changes taking place in the larger student body as a result of
increased graduation requirements imposed by states. Students in general who graduated
in 1998, as well as occupational concentrators in particular, increased their levels of
academic course taking over this sixteen-year timeframe. More to the point, occupational
concentrators in 1998 were more likely than in 1982 to have completed high-level

28
academic coursework, have taken mid-or high-level mathematics in 9th grade, and have
generated a mid-or high-level GPA (Levesque & Hudson, 2003a).
Overall by 2005, the majority of occupational concentrators were found to have
taken mid-level mathematics courses (pre-algebra or algebra) in 9th grade (Levesque et
al., 2008). Nonetheless, graduates from the class of 2005 who completed high-level
mathematics courses (geometry or higher) in 9th grade, generally continued to participate
in occupational education less often than their 9th grade peers who took low-level math.
According to Levesque et al. (2008), while 93.4% of students who completed lower-level
mathematics in 9th grade were found to have taken CTE coursework, data reflected that
less than 90% (89.9) of students who completed high-level mathematics in 9th grade were
found to have taken CTE coursework. Furthermore, students who completed low-level
mathematics concentrated in occupational education at a rate of 25.0%, earning on
average 3.47 credits, while students who completed high-level mathematics concentrated
at the rate of only 16.2%, earning on average 2.62 credits (Levesque et al., 2008). In
spite of these data, when compared to their 1990 counterparts, by 2005 more students
who had taken high-level mathematics courses (geometry or higher) in 9th grade were
participating in occupational programs.
Students from the graduating class of 1990 who took geometry or higher-level
math courses in 9th grade earned less than two (1.8) CTE credits while their 2005
counterparts earned more than two and a half (2.6) credits. In addition, the concentration
rates of members from the 2005 graduating class who took high-level math courses in 9th
grade doubled from eight to 16% when compared to their 1990 counterparts (Levesque et
al., 2008). Comparatively, this trend was echoed by 9th grade students from the 2005

29
graduating class who took mid-level mathematics courses (pre-algebra or algebra) and
earned 3.1 CTE credits, whereas their 1990 counterparts earned only 2.7 CTE credits.
In the face of increasing academic requirements, data from the 2005 graduating
class indicates that the majority of occupational concentrators were not the highest
academic achievers. While students who completed higher-level mathematics in 9th
grade still earned fewer credits in: (a) agriculture, (b) construction, (c) food services, (d)
mechanics and repair, and (e) materials production, these same students were found to
have earned more credits in computer technology and communications technology
(Levesque et al., 2008). Moreover, students who took high-level mathematics in 9th
grade were enrolling in marketing programs in larger numbers, and students who
completed all high-level academic coursework were participating at higher rates in print
production programs (Levesque & Hudson, 2003a). In summary, the academic
attainment levels of CTE participators and occupational concentrators have steadily
increased over the past two decades.
Students attending rural vs. urban / suburban schools. Generally, students who
attended rural schools between 1982 and 2000 were found to have taken more CTE
coursework than students attending either urban or suburban educational settings. In the
National Assessment of Vocational Education, Silverberg et al. (2004) reported that while
rural schools account for about 32.3% of all students in the nation, they also serve 40.1%
of all occupational concentrators. Conversely, Silverberg also found that while 28.4% of
students attend urban schools, these facilities serve only 26.2% of occupational
concentrators. Similarly, suburban schools serve 39.3% of all students in the country, but
only reach 33.8% of the occupational concentrators. The course taking patterns of rural

30
students indicated that they were less likely than urban students to concentrate in
marketing, but more likely than both urban and suburban students to take computer-
related courses (Levesque & Hudson, 2003a). Students who attended small schools,
many of which are located in rural settings, experienced more credits earned in the
following CTE programs: (a) agriculture, (b) business services, (c) computer technology,
(d) construction, (e) mechanics and repair, and (f) materials production (Levesque et al.,
2008). Furthermore, graduates from the class of 2005 who attended the smallest schools
(with less than 500 students) earned on average nearly four CTE credits (3.9) compared
to their 1990 counterparts who earned nearly a full credit less (3.0) (Levesque et al.,
2008).
School poverty levels were determined based on the percentage of students
participating in the National School Lunch Program (NSLP). That is, schools with 50%
or more of the student population served by the NSLP were considered high poverty.
Schools with an NSLP population less than five percent were considered low poverty,
and the middle range were schools with an NSLP population between five and 50%
(Levesque & Hudson, 2003a, 2003b). Students enrolled in high poverty schools were
considered to be “disadvantaged” while students from low poverty schools were
considered “high advantaged”. Students from the mid-range schools were considered of
“mixed advantage” (Levesque & Hudson, 2003a, 2003b). When compared their middle
poverty counterparts, students from high-poverty schools were less likely to concentrate
in CTE programs such as food service and other hospitality-related programs (Levesque
& Hudson, 2003a).

31
Furthermore, male students participated more often than female students and
students enrolled in rural settings participated at higher levels compared to their
counterparts in urban or suburban environments (Levesque & Hudson, 2003a). Levesque
and Hudson (2003a) point out that when students were categorized into three advantage
level groups (low, moderate and high – based upon GPA, academic coursework, school
poverty and 9th grade level of mathematics), most vocational education concentrators
belonged to the middle group classification. In comparison, occupational concentrators
were less likely to be from the high achievement group.
Changes in academic course taking. Following the 1983 release of the National
Commission on Excellence in Education’s report A Nation at Risk, policymakers and
educators began advocating for local, state, and federal reform efforts. These efforts
were designed and employed to strengthen academic learning and to better prepare
students for the world of work (Levesque et al., 2000). As a result of these reform
efforts, many states increased requirements for high school graduation (Levesque &
Hudson, 2003a, 2003b; Levesque et al., 2000, 2008; Medrich, Brown, Henke, & Ross,
1992; Silverberg et al., 2004).
The “New Basics” core academic standards which evolved from academic reform
efforts included four years of English and three years each of mathematics, science and
social studies. The percentage of all graduates meeting the New Basics standards
increased from 13% in 1982 to 38% in 1990 and to 50% in 1994 (Levesque et al., 2000).
When compared to college prep students in 1994, vocational concentrators were 33% less
likely to meet the increased standards. However, vocational concentrators were just as
likely as general education students (30%) to do so.

32
In states that experienced an increase in core academic course credit requirements
and/or a decrease in vocational credit requirements for high school graduation, there was
a marked decrease in vocational participation. Core academic courses include: (a)
English, (b) mathematics, (c) science, and (d) social studies. Levesque and Hudson
(2003b) reported the average number of core academic credits students earned in 1982
was 11.87. By 1998, the average number of core academic credits students earned
increased to 14.51. Furthermore, Silverberg et al. (2004) reported the average number of
academic credits earned in 2000 had reached 18.8. However, despite the overall decline
in vocational credits, and increases in academic credits, students were still earning more
credits in vocational education (4.2) than math (3.5) or science (3.2) or social studies
(3.8).
In states where core academic requirements increased by two (2.0) or more
credits, students earned, on average, one (1.0) fewer vocational credits by 1998
(Levesque & Hudson, 2003b). These states also experienced a significant decline (9.6%)
in the proportion of occupational concentrators (Silverberg et al., 2004). In comparison,
students attending schools where graduation requirements were increased by fewer than
two (2.0) credits, did not experience a statistically significant decline in these measures.
Further, Levesque & Hudson (2003b) found that in states where non-vocational
requirements (such as foreign language) were increased, students experienced about one-
half (.5) fewer vocational credits. However, students in states which did not increase
graduation requirements had the opportunity to experience an increase in vocational
course taking and were more likely to invest three (3.0) credits in occupational education
(Levesque & Hudson, 2003b). Finally, of those graduates from the class of 1998,

33
occupational concentrators from groups considered more advantaged earned more core
academic credits compared to their peers from less advantaged groups (Levesque &
Hudson, 2003a).
As the shift toward taking more academic courses continued, the proportion of
vocational credits earned decreased. In 1982, vocational credits made up 22% of all high
school credits. By 2000, vocational credits constituted only 16% of all credits earned
(Levesque et al., 2000; Silverberg et al., 2004). While all students increased their core
academic course taking, the rate of increase was greater for vocational concentrators
when compared to both college prep and other general education students. However,
while vocational concentrators increased their levels of rigor in math, science and social
studies courses, they still completed fewer total credits in each of these core subjects
compared to students participating in the college prep or general education track.
Career and technical education trends: 1980 - 2005. The 1980s was the decade
of declining enrollments for CTE. According to Levesque and Hudson (2003b), the
primary change was not in the proportion of students participating in CTE, but instead
was related to the depth of coursework in which they enrolled. While over 95% of all
students continued to enroll and participate in CTE, the patterns of course taking began to
change. The overall decline was a result of students taking fewer courses within a
program (depth) rather than fewer students taking any (breadth) vocational coursework at
all (Levesque & Hudson, 2003a). The average number of credits earned in CTE fell from
4.7 credits in 1982 to 4.2 credits in 1990 and then fluctuated between 4.0 and 4.2 credits
by 2000 (Levesque & Hudson, 2003a ; Silverberg et al., 2004).

34
Trends within vocational sub-curricular areas also experienced declines between
1982 and 1992. General labor market course enrollments declined by .33 credits from
.95 in 1982 to .62 in 1992 which was significant. Although not statistically significant,
family and consumer science course enrollments also declined by .18 credits over this
same time period. However, the number of occupational (specific labor market) credits
remained statistically about the same from 1982 (3.03) through 1998 (2.87). By 1998,
occupational education course credits counted for nearly 70% of all vocational credits.
As a result, occupational education became a prominent component of vocational
education during the 1980s and 1990s (Levesque & Hudson, 2003b).
Occupational education trends: 1980 - 2005. As with vocational course taking,
there were not any significant changes in the breadth of occupational course taking from
1982 through 2005. The percentage of all vocational credits earned in occupational
education actually increased between 1982 and 1998 from 59.4% to 68.4% respectively
(Levesque & Hudson, 2003a, 2003b). In fact, the percentage of students taking at least
one occupational course in 1982 was 88.7%. In 1990, the percentage rose to 90.6%, and
in 1994 it was 90.8% (Levesque et al., 2000). By 2005, nearly 92% of students took at
least some occupational coursework (Levesque et al., 2008).
That is to say, of all the students who took any vocational education coursework
by 2005, nearly every one took at least one course in a specific labor market or
occupational education program and on average, earned 2.9 – 3.0 occupational credits in
occupational education (Levesque et al., 2008). However, that is not to say that this
number of students were occupational concentrators. Mirroring the decline in overall
vocational education concentration rates, and as shown in Table 2.2, the percentage of

35
students concentrating in occupational education actually declined from 34% in 1982 to
25% in 1994 and then hovered around 21% by 2005 (Levesque et al., 2000, 2008). A
clear trend emerged showing that rather than concentrating within a chosen area, students
were exploring opportunities across multiple occupational program areas (Silverberg et
al., 2004).
Table 2.2
Percentage of Students Participating in CTE: 1982 - 2005 Year
At Least One CTE Course
At Least One Occupational Course
Occupational Concentratora
1982 98.2 88.7 33.7 1990 98.0 90.6 27.8 1992 97.7 92.2 24.9 1994 97.2 90.8 25.4 1998 96.5 90.7 25.0 2000 96.6 90.9 21.8 2005 96.6 92.0 20.8 Note. Data compiled from Levesque and Hudson (2003a, 2003b); Levesque et al. (2008); Levesque, Lauen, Teitelbaum, Alt, and Librera (2000), and Silverberg, Warner, Fong, and Goodwin (2004). aOccupational Concentrators are CTE participants enrolled in an organized program of three or more sequential courses within a single occupational education program.
Labor market trends. In addition to rising academic standards due to
educational policy, changes in the labor market also contributed to increased academic
course taking (Levesque & Hudson, 2003b; Rosenthal, 1995). Much like the industrial
revolution which led people working in agriculture to find employment in factories at the
beginning of the 20th century, advancements in information technology at the end of the
20th century have resulted in further employment shifts from manufacturing to service-
producing firms (Levesque et al., 2000). As part of the shifting labor market, there were
rising trends in the labor market calling for higher skill levels to meet labor market needs
(Rosenthal, 1995). In the U.S., the two main employment sectors are the good-producing
and service-producing industries.

36
The good-producing industries include: agriculture, mining, construction and
manufacturing (both durable and non-durable goods). The service-producing industries
include: (a) transportation, (b) communications, (c) utilities, (d) wholesale and retail
trade, (e) finance, (f) government, etc. The services industry, which falls under the
service-producing industries umbrella, is comprised of: (a) health care, (b)
advertising/public relations, (c) computer and data processing, (d) engineering, (e) private
education, (f) personnel or accounting, and (f) social and/or legal services. The service-
producing industries, which include the services industry, accounted for nearly 75% of
the total U.S. employment in 1997 (Levesque et al., 2000).
More than half the total gross domestic product in major industrialized economies
is now knowledge-based. That includes: (a) telecommunications, (b) computers, (c)
software, (d) pharmaceuticals, and (e) education and television. As industrialized
economies become knowledge-based economies, creativity, along with innovation and
the ability to distribute and use that information, has become increasingly more important
(Levesque et al., 2000). Shifting trends toward a service-based and information-based
economy have had critical implications for vocational education programs. Changes in
participation in occupational programs have been consistent with labor market trends
which saw increases in four key areas: (a) health care, (b) child care and education, (c)
food service and hospitality, and (d) technology and communication (Silverberg et al.,
2004).
A major shift in vocational curricula offerings centered on decreasing industrial
arts programs while increasing opportunities for students to participate in technology
education courses. Industrial arts programs grew out of the manual training movement of
37
the late 1800s and introduced young men to the world of mechanized work (Levesque &
Hudson, 2003b). In the late 1980s and early 1990s, schools began phasing out industrial
arts shops for modern technology education labs designed to introduce students (male and
female) to the “high technology” of the information age. Many of the technology
education programs were intended for all students while a few were specially configured
as pre-engineering programs for a select group of students (Levesque & Hudson, 2003b).
Industrial arts program enrollments declined 6.1% between 1982 and 1994 while
technology education enrollments increased by four percent (Levesque & Hudson,
2003b). Between 1990 and 1994, the percentage of students completing at least one
course in technology education increased from eight tenths of a percent to 4.2%. During
the same period, students completing at least one course in industrial arts declined from
14 to eight percent (Levesque et al., 2000). From 1994 through 1998, industrial arts
programs realized another 3.9% decline while technology education programs
experienced an increase in participation by the same amount (Levesque & Hudson,
2003b).
Trends in business-related course taking followed a similar route to that of
industrial arts and technology education. Course taking in typewriting/keyboarding
courses experienced declining enrollments between 1982 and 1998 while students began
taking courses in business computing. Most computer-related courses, categorized as
occupational education, are listed as business services and computer technology
programs. These programs include: (a) computer applications, (b) computer data
processing, (c) computer programming, (d) computer science and systems, and (e)
computer mathematics (Levesque & Hudson, 2003b). During this time, students earned

38
on average, 1.05 credits in computer-related courses. Seven-tenths of a credit was earned
under occupational education offerings while the remainder (.35 credits) was earned in
general labor market courses. Basic typewriting/keyboarding course taking declined
from .45 credits in 1990 down to .35 in 1998. While nearly zero 1982 graduates took
computer applications, their 1998 counterparts earned more credits in computer
applications than any other computer technology field (Levesque & Hudson, 2003b).
Issues/implications. During the period between 1982 and 1998 when vocational
programs experienced a decline in participation, the decline was not attributed to a lesser
number of students enrolling, but rather to a decline in the number of courses in which
each student participated (Levesque & Hudson, 2003b; Levesque et al., 2000). Reasons
for this decline included increases in high school graduation requirements (Medrich et al.,
1992) as well as trends indicating a rise in academic course taking was becoming
necessary to achieve higher skill levels required for adequate preparation for the job
market (Rosenthal, 1995). In regard to racial and ethnic characteristics of students
enrolled in vocational education programs between 1982 and 1994, most demographic
groups experienced a decline. However, percentages of African American and
Asian/Pacific Islander students realized little or no change. In addition, students with
disabilities actually experienced an increase in enrollment of vocational programs
(Levesque et al., 2000). Furthermore, differences in participation rates among various
racial/ethnic groups enrolled in occupational programs in 1982 were not evident by 1998
(Levesque & Hudson, 2003a). Moreover, Levesque & Hudson (2003a) reported
characteristics of occupational program concentrators mirrored changes in the general

39
student population, where graduates in general, and more specifically, occupational
concentrators became more academically advantaged by 1998.
As a result of states increasing the requirements necessary for high school
graduation, many CTE programs realized a decline in participation levels. Levesque &
Hudson (2003b) reported that while the percentage of graduates taking vocational or
technical courses between 1990 and 1998 did not show any significant differences in the
average number of credits earned, course-taking patterns did vary somewhat. For
example, in states where high school graduation requirements increased by two (2.0) or
more credits, students earned an average of one (1.0) fewer vocational credits by 1998.
In comparison, students attending schools where high school graduation requirements
were not increased or increased by fewer than two (2.0) credits, did not experience a
statistically significant decline in these measures (Levesque & Hudson, 2003b). Finally,
of those graduates in the class of 1998, occupational concentrators from groups
considered more advantaged earned more core academic credits compared to their peers
from less advantaged groups (Levesque & Hudson, 2003a).
Gordon (2008) identifies the term special needs populations as “individuals who
are: (a) members of minority groups, (b) limited-English speaking, (c) physically and/or
mentally disabled, (d) economically and/or academically disadvantaged, or (e) gifted and
talented” (p. 149). Minority refers to ethnic and racial demographics such as African
American, Hispanic, Asian, and Multi-Racial. While African American students have a
long history of participation in CTE, historical participation data on students of Hispanic
origin are more limited. Apprenticeship programs for African Americans were available
as far back as the 1600s (Gordon, 2008; Scott & Sarkees-Wircenski, 2008). In addition,

40
manual labor schools opened for African American students in the 1830s. During the
Industrial Revolution, trends in participation shifted in vocational education as more
Whites sought access to better jobs. By the mid 1930s, African American students were
underrepresented in vocational education programs (Gordon, 2008, p. 152). Anderson
(1982) attributes this decline in vocational program enrollment due to the exclusion of
African Americans in the new industrial trades requiring higher skilled workers. Over
the course of the next 60 years, participation of African American students did rebound
as more White students began taking higher level courses aimed at college preparation
(Castellano et al., 2007; Silverberg et al., 2004).
As mentioned above, data are more limited on the historical participation of
Hispanic students in CTE. This lack of data may have serious implications for Hispanic
youth for whom a large portion do not earn any type of post secondary credential
including those required to obtain high-skill, high-wage employment (Maldonado, 2006).
Wirsching and Stenberg (1992) indicated that age, level of acculturation, and various
barriers to participation were likely factors leading to non-participation of Hispanic
students in CTE programs. Moreover, having a lack of minority leaders (both African
American as well as Hispanic) in professional CTE roles further compounds the issue of
limited minority participation in CTE programs. Finally, after a history of being limited
to lower-level educational and occupational opportunities, it is possible that many
students of color and their families view CTE programs as inferior to academic tracks
leading to college (Arnold & Levesque, 1992). This perception is likely to continue until
such time as students of color are equally as prepared for and acquire occupational

41
opportunities with the skill sets needed for successful employment in the highly technical
workforce of the 21st century (Nall, 1997).
Career Academies
The career academy model is recognized as a promising initiative meeting the
objectives of the CTE reform movement (Castellano et al., 2007; Kemple & Snipes,
2000; Levesque et al., 2000; Orr, 2005; Stern et al., 1992). Career academies are small
learning communities that deliver college-prep curriculum based upon a career theme and
incorporate active partnerships with employers, the community, and higher education.
Career academies are structured programs at comprehensive high schools designed to
increase student engagement and achievement while developing the skill sets and
necessary credentials to pursue postsecondary education or enter into the workforce
(Florida Department of Education, 2011; Kemple & Snipes, 2000). Career academies
integrate academic with CTE content in an effort to increase rigor while building
relevancy to students’ career interests (Castellano et al., 2007; Kemple & Snipes, 2000;
Levesque et al., 2000; Orr, 2005; Stern et al., 1992).
Communities of support. The literature reveals that, built upon three career
academy organizational elements, (small learning communities, integrated college-prep
curriculum, and employer partnerships), career academies have become recognized
communities of support for both students and teachers alike (Orr, 2005). In small
learning communities, students enroll and participate in courses with the same teachers
for a minimum of two years. In addition, mostly pure scheduling, where all students in
the class are members of the career academy, allows the group of students to travel as a
cohort from class to class. Teachers typically share a common planning period and one

42
teacher from the team is designated as the lead for the academy (Stern, Dayton, & Raby,
2000).
The college-prep curriculum is typically integrated across both academic and CTE
courses and projects are formulated based upon the career theme of the CTE program(s).
Rigorous academic courses are designed to meet graduation and college entrance
requirements and the CTE courses include a work-based learning component.
Furthermore, the employer partnerships provide the academies with potential advisory
group members, guest speakers, and student internships, along with various other in-kind
supports (Stern et al., 2000).
Kemple (1997) noted for students enrolled in a career academy, there were at least
modest increases in the level of support they received from their teachers and their peers.
These supports served to enhance student motivation because they were focused around
the connections students made in their learning and how those connections related to their
future education and career goals. In-so-far as teacher support, Kemple noted that when
compared to non-career academy teachers, the literature suggests that career academy
teachers are more likely to consider themselves part of a strong learning community
while they emphasized personal attention to their students. Career academy teachers
have more opportunities to collaborate with colleagues and share greater opportunities to
influence decisions in key areas of their work. As a result, these teachers expressed
higher levels of their own job satisfaction.
Simplified conceptual model of the career academy approach. Kemple and
Snipes (2000) developed a conceptual model (see Figure 2.1) for the career academy
approach. The model is organized under four main components: (a) career academy
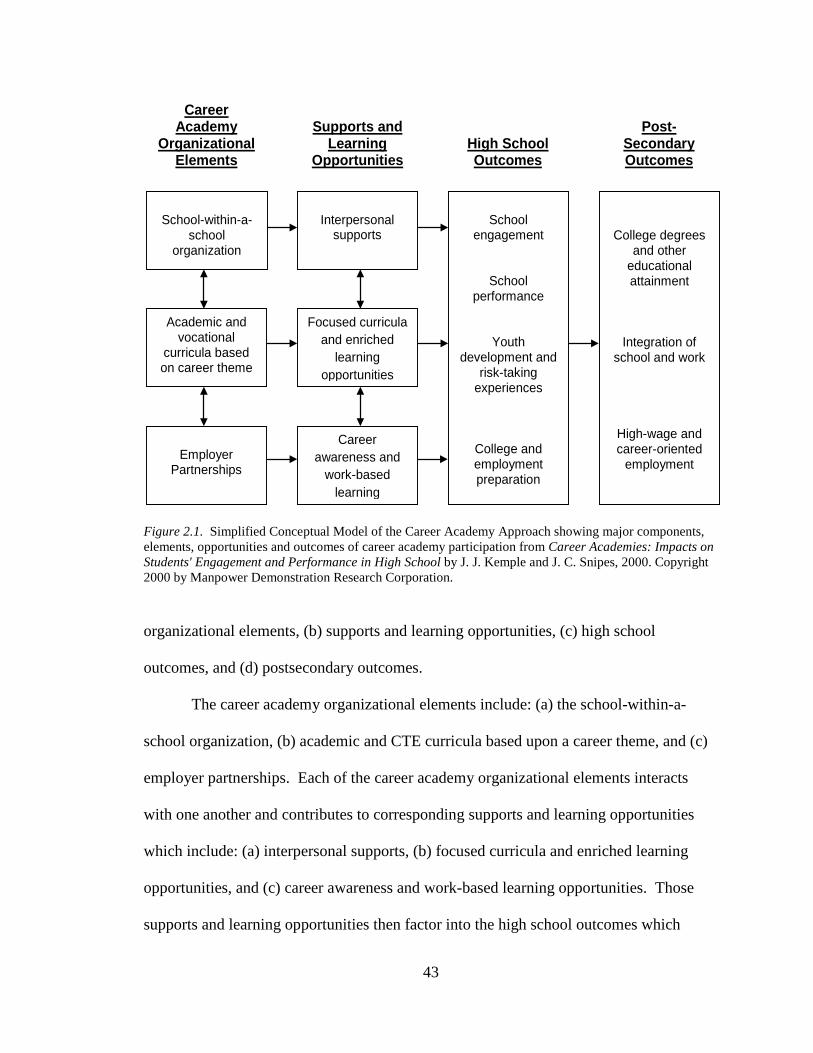
43
Figure 2.1. Simplified Conceptual Model of the Career Academy Approach showing major components, elements, opportunities and outcomes of career academy participation from Career Academies: Impacts on Students' Engagement and Performance in High School by J. J. Kemple and J. C. Snipes, 2000. Copyright 2000 by Manpower Demonstration Research Corporation.
organizational elements, (b) supports and learning opportunities, (c) high school
outcomes, and (d) postsecondary outcomes.
The career academy organizational elements include: (a) the school-within-a-
school organization, (b) academic and CTE curricula based upon a career theme, and (c)
employer partnerships. Each of the career academy organizational elements interacts
with one another and contributes to corresponding supports and learning opportunities
which include: (a) interpersonal supports, (b) focused curricula and enriched learning
opportunities, and (c) career awareness and work-based learning opportunities. Those
supports and learning opportunities then factor into the high school outcomes which
School-within-a-
school organization
Academic and vocational
curricula based on career theme
Employer
Partnerships
Interpersonal
supports
Focused curricula and enriched
learning opportunities
Career awareness and
work-based learning
School
engagement
School performance
Youth development and
risk-taking experiences
College and employment preparation
College degrees and other
educational attainment
Integration of school and work
High-wage and career-oriented
employment
Career Academy
Organizational Elements
Supports and
Learning Opportunities
High School Outcomes
Post-
Secondary Outcomes

44
include: (a) school engagement, (b) school performance, (c) youth development and risk-
taking experiences, and (d) college and employment preparation. All high school
outcomes then lead to postsecondary outcomes which include: (a) college degrees and
other educational attainment, (b) integration of school and work, and (c) high-wage and
career-oriented employment.
To this end, according to Kemple and Snipes (2000), when career academies
incorporate interpersonal supports among students, their peers, and their teachers, the
results show improved outcomes for students at high-risk for school failure. High school
outcomes include increased attendance and increased academic course-taking, which in
turn, increases the likelihood of students earning a sufficient number of credits for
graduation, thereby reducing dropout rates. However, in career academies where there
was no evidence of enhanced interpersonal supports, resulting outcomes were not
positive and actually resulted in higher dropout rates. The extent to which interpersonal
supports are incorporated in career academies appears to make a difference in student
outcomes (Dixon, Cotner, Wilson, & Boreman, 2011; Kemple & Snipes, 2000).
Growth and evolution of career academies. The original intent of career
academies was to reduce the high school dropout rate while preparing students to enter
the labor market (Agodini & Deke, 2004; Silverberg et al., 2004; Stern et al., 2000).
Based upon this intent, the first career academy was created in Philadelphia in 1969. It
was the Electrical Academy at Edison High School and was sponsored by the
Philadelphia Electric Company specifically as a dropout prevention program targeting
non-college bound students (Kemple & Rock, 1996; Kemple & Snipes, 2000; Stern et al.,
2000).

45
In 1981, California premiered two career academies: (1) the Computer Academy
at Menlo-Atherton High School and (2) the Electronics Academy at Sequoia High School
in Silicon Valley. As a result of these successful openings, policymakers in California
crafted legislation to open 50 more career academies (Stern et al., 2000). By 2000, there
were 290 career academies across the state of California alone. Growth rates for career
academies across the country show that in 1996, there were approximately 300 academies
(Kemple & Rock, 1996). A year later, there were between 600-700 high schools with
career academies. This considerable increase occurred largely as a result of the School-
to-Work Opportunities Act (STWOA), which served to accelerate the implementation of
career academies across the country (Kemple, 1997). At the turn of the millennia,
Kemple (2001) reported an estimated 2500 high schools offering career academies
nationwide. By 2004, there were 4800 high schools across the U.S. that offered career
academies (National Center for Educational Statistics, 2011).
Furthermore, during the 1980s, the American Express (AMEX) company
sponsored the Academies of Finance in New York City. Eventually, AMEX collaborated
with other industry partners to create the National Academy Foundation which added
academies of Travel and Tourism (1987), Public Service (1990), and Information
Technology (1999) which were all oriented for college-bound students (Stern et al.,
2000). Additional program supports became available with the creation of the National
Career Academy Coalition (NCAC) in 1996 and the Career Academy Support Network
(CASN) two years later. While the NCAC provided technical assistance for new and
developing career academies, CASN worked to develop a consistent definition for career
academies (Kemple & Snipes, 2000).

46
Stern et al. (2000) reported that until the 1990s, career academies operated only as
small, separate units from within larger schools with a focus on keeping students who had
been identified as high-risk for school failure in school through 12th grade. As part of the
movement to increase requirements for high school graduation, many schools themselves
evolved into small learning communities (SLCs) some of which were comprised of career
academies. At the same time, many of these career academies also evolved to include
academic preparation for four-year colleges and universities. By 2000, the focus of
career academies had evolved from a dropout prevention program to a focus on preparing
all students for both college and careers. Strategies to reach this ambitious goal included
expanding the base of students to include a broad range of students in career academies
as well as combining rigorous academic curricula with information on all aspects of the
career academy-related industry (Kemple, 2001; Kemple & Rock, 1996; Kemple &
Snipes, 2000; Stern et al., 2000).
Career academies evaluation. Several studies have been conducted on career
academies primarily focused on performance outcomes for students who have
participated in the career academy experience during their high school careers
(Castellano et al., 2007; Kemple, 1997, 2001, 2004; Kemple & Rock, 1996; Kemple &
Snipes, 2000; Kemple & Willner, 2008; Kemple, Poglinco, & Snipes, 1999; Silverberg et
al., 2004; Stern et al., 2000). One of the most prominent studies in the literature is the
longitudinal Career Academies Evaluation by Manpower Demonstration Research
Corporation (2011), now more commonly known as MDRC (Kemple, 1997, 2001, 2004;
Kemple & Rock, 1996; Kemple & Snipes, 2000; Kemple & Willner, 2008; Kemple et al.,

47
1999). This research project began in 1993 and transformed into the Career Academies
Project in 2009 with the final report due out in 2012 (MDRC, 2012).
Research study design. The Career Academies Evaluation research project
utilized a large-scale, multi-site, random assignment research design to determine the
impact participation in a career academy has on student outcomes (Kemple, 1997, 2001,
2004; Kemple & Rock, 1996; Kemple & Snipes, 2000; Kemple & Willner, 2008; Kemple
et al., 1999; Stern et al., 2000). Using a lottery system, students who had applied for
acceptance into a career academy were assigned to either the treatment group (academy
students) or the control group (non-academy student) for the duration of their high school
career. When the study began in 1993, there were 1953 students participating. Of those,
1064 were academy students (treatment) and 889 were non-academy students (control)
(Kemple & Rock, 1996).
Patterns of enrollment. Of those randomly selected to participate in a career
academy, 88% actually enrolled. Of those students, 58% were still enrolled at the end of
their 12th grade year (Kemple & Snipes, 2000). Said another way, of the students eligible
to participate in a career academy, 42% either did not enroll or chose to enroll for a short
period of time and then elected to leave the academy (Kemple & Snipes, 2000). Of
students eligible to enroll in a career academy, but choosing not to enroll and participate,
the most common reasons students gave included: wanting to enroll in another program,
student lost interest in the occupational area, or the student did not believe the career
academy would help them get into a good college (Kemple & Snipes, 2000). Fletcher
and Cox (2012) also found collegiate aspirations to be a major factor in student decisions
to enroll or not enroll in career academies.

48
Although originally designed as a dropout prevention measure explicitly targeting
students who were at high-risk of dropping out of school, career academies have
developed an appeal to students from a wide range of both demographic and educational
backgrounds (Kemple & Rock, 1996). Over the past two decades, career academies have
actively worked to recruit a broader mix of students (Kemple, 2001; Kemple & Rock,
1996; Kemple & Snipes, 2000; Stern et al., 2000). Reasons for this philosophical change
in direction included the stigma attached to serving only low-achieving students, the
misconception that career academies did not provide a pathway to college, and an
increase in demand for highly skilled workers in the workforce (Kemple & Rock, 1996).
With strategies employed to address each of the aforementioned concerns, the attraction
to career academies has now reached beyond those students who may have been at risk
for school failure to also include students who have typically done well in school
(Kemple & Rock, 1996).
Early research study participants were predominately Hispanic (56%) or African
American (30%) (Kemple & Snipes, 2000). In addition, a moderate proportion came
from lower socio-economic status (SES) homes:
• 38% of participants lived in single-parent households
• 47% of participants reported both parents were working
• 11% of participants indicated neither parent was working
• 24% of participants reported their families were receiving assistance
• 41% of participants reported their families had moved at least once in the
previous two years
• 29% indicated neither parent received a high school diploma or GED

49
Regardless of personal or family challenges, virtually all participants in the study
expected to graduate from high school and two-thirds reported they expected to graduate
from college as well. Nearly 80% of the sample demonstrated attendance rates at 91% or
better with just over two-thirds of those students exhibiting rates over 95% (Kemple &
Snipes, 2000).
Effects of career academies. Stern et al. (2000) indicated that career academies
have been found to be effective in improving student performance in high school.
Following the Philadelphia Academies, the California Partnership Academies, and the
NAF Academies, Stern et al. (2000) also suggested that by dividing larger schools in
smaller units, career academies have been shown to be a promising strategy for high
school reform.
Studies have shown that academy students perform better than similar students in
the same high schools who are individually matched with academy students on
demographic characteristics and ninth grade records of low grades, high
absenteeism, and disciplinary problems. (Stern et al., 2000, p. 12)
Linnehan (1996) reported that graduates from Philadelphia academies had better
attendance while in high school and that this behavior carried forward with them into
their post-high school jobs. Maxwell and Rubin (2000) found that academy graduates
were more likely to come from high schools with large proportions of low-income
minority students. In addition, Maxwell and Rubin (1997) also found that students who
enrolled and participated in career academies were at least as likely to be enrolled in four-
year colleges after high school graduation as those students who were previously
identified as being on the academic track in high school. Moreover, these academy

50
graduates were less likely to require remedial coursework and more likely to earn their
bachelor’s degree compared to other graduates from the same school district (Maxwell &
Rubin, 2000). While Maxwell and Rubin (2000) noted that students in career academies
earned significantly better grades, they also suggested that these higher grades could be a
factor in their higher rate of college attendance. These findings suggest that academies
help low-income students not only graduate from high school, but also from college.
Further examination of the MDRC longitudinal study however, shows a more
complex landscape. This particular study was designed to provide educators and
policymakers data on the effectiveness of career academies in the areas of student
engagement while enrolled in high school as well as their transitions beyond high school.
In a study that initially showed positive outcomes, these results should be interpreted with
caution as it relates to standard measures of achievement across the country. In 2000,
Kemple and Snipes reported that career academies increased the levels of interpersonal
supports students experienced as well as their levels of participation in career awareness
and work-based learning activities while enrolled in the career academies. They also
found that for students at high-risk for dropping out of school, career academies reduced
dropout rates by improving attendance rates, increasing academic course-taking, and
increasing the likelihood that students in this group would earn a sufficient number of
credits to graduate on time.
However, the researchers also determined that career academies did not improve
student scores on standardized reading and math achievement tests. This lack of
supporting evidence that career academies might contribute to the improvement of
standardized test scores is particularly important because these types of state and national

51
assessments are oftentimes regarded as the best measure of student achievement (Stern et
al., 2000). Furthermore, career academies had little if any influence on course content as
well as classroom instructional delivery practices (Kemple, 2001). As a result, when
averaged across the diverse groups of students in the full research study sample, career
academies produced only slight reductions in dropout rates and only modest increases in
the other measures of school engagement (Kemple & Snipes, 2000). Moreover, by 2001,
Kemple reported that when compared to the control group (non-academy students),
career academies demonstrated little or no impact on high school graduation rates, initial
postsecondary education, or employment outcomes.
Impacts on educational attainment. Research has shown there are a number of
indicators which serve as reliable predictors of students’ likelihood of dropping out of
high school (Castellano et al., 2007; Kemple, 1997, 2001, 2004; Kemple & Rock, 1996;
Kemple & Snipes, 2000; Kemple & Willner, 2008; Kemple et al., 1999; Silverberg et al.,
2004; Stern et al., 2000). Those characteristics include:
• Average daily attendance
• GPA
• Number of credits earned toward graduation
• Whether the student was over-age for grade level (retained)
• Whether the student had a sibling who dropped out
• Whether the student had transferred schools two or more times beyond the
regular school transitions of elementary to middle/junior to high school.
The MDRC study sample was separated into subgroups related to the likelihood
that students would drop out of school before the end of their 12th grade year. Just over

52
one-quarter of the study sample participants were categorized as being in the high-risk
subgroup. One-quarter of the participants were defined as being in the low-risk
subgroup. The remaining one-half of the sample was classified as being in the medium-
risk subgroup. For those students in the high-risk subgroup, Kemple and Snipes (2000)
found that career academies significantly reduced rates of dropping out of school by
increasing their rates of attendance and their levels of preparation for postsecondary
education and training. The researchers reported that the dropout rate for students in the
high-risk subgroup was reduced from 32% in the non-academy control group to 21% in
the academy treatment group (Kemple & Snipes, 2000; Stern et al., 2000).
For students in the low-risk subgroup, where many students were likely to be
enrolled in the college-prep program, career academies increased the likelihood that
students would enroll in career-related course-taking without reducing the likelihood of
completing the academic core curriculum. There were no measureable changes to
outcomes for students in the medium-risk subgroup. Again, the career academy
experience was not linked to any improvement in standardized test scores across the full
sample of research study participants. While students in the high-risk subgroup did
experience an average increase in test scores relative to their counterparts who were non-
academy students, these differences were not significant (Kemple & Snipes, 2000).
Transitions to postsecondary. Career academies in the MDRC study appeared to
have had a small impact on students’ plans for postsecondary education. Regarding
academic performance, there is evidence indicating that students participating in career
academies perform as well as counterparts in other college preparatory tracks (Kemple &
Snipes, 2000; Silverberg et al., 2004). However, in terms of postsecondary outcomes,

53
results have suggested that compared to general education pathway students, a higher
number of career academy students reported having a transitional plan upon graduation
from high school (Kemple & Snipes, 2000; Silverberg et al., 2004).
As it relates to the longitudinal study, more students in the high-risk subgroup
who participated in a career academy were found to have taken the ACT or SAT,
researched various options for attending postsecondary education, and submitted at least
one application for admission into a two- or four-year institution (Kemple & Snipes,
2000). Compared to their non-academy counterparts, this was significant. While 35% of
academy students reported taking the ACT or SAT, only 22% of non-academy students
did so. This 13 percentage point difference represents a 55% increase in academy
students over non-academy students. Furthermore, while just over half the students in the
academy group reported submitting an application to a two- or four-year institution, only
35% of students in the non-academy group indicated they had submitted an application
(Kemple & Snipes, 2000).
For students in the low-risk subgroup, participation in a career academy did not
have an impact on the plans they developed or steps they took toward enrolling in a
postsecondary institution. Within this subgroup, the majority of students (both academy
and non-academy) planned to work and go to college and about three-quarters indicated
an expectation of graduation from postsecondary education (Kemple & Snipes, 2000).
However, students within the academy group were somewhat less likely (71%) than their
non-academy peers (79%) to have submitted an application for admission into a two- or
four-year institution. There were no measureable differences in plans or steps taken
toward postsecondary education for the students identified in the medium-risk subgroup

54
(Kemple & Snipes, 2000). Furthermore, when looking at the larger sample of career
academy students, 25% did not graduate from high school on time. Of those that did
graduate, 45% did not enroll in postsecondary within a year following graduation and
only 15% of those enrolled in bachelor level degree programs (Kemple, 2001). These
findings present a challenge to educators and policymakers to strengthen the career
academy model in order to increase high school completion rates as well as rates of
matriculation into postsecondary education. This can be especially important for students
of color who typically have been underrepresented in higher education settings
(Thompson, Gorin, Obeidat, & Chen, 2006).
Labor market outcomes. Early in the MDRC study, Kemple and Snipes (2000)
found that career academies increased the levels of student participation in career
awareness and work-based learning activities. Ironically, by 2001, the academies
involved in the MDRC evaluation showed little or no impact on students’ rates of high
school graduation, enrollment in postsecondary education or employment during the year
following high school graduation (Kemple, 2001). It is important to note however, this
lack of impacts may have been due to the high performance of students in the non-
academy group, who like their peers, also had the initiative to apply to an academy. It is
also important to note that earlier reports from the MDRC study indicated positive
impacts from career academy participation; but by 2001, the study was exhibiting
findings contrary to those reported earlier.
Kemple (2004) later found that four years beyond high school graduation, career
academies did improve labor market prospects considerably for young men; however,
they offered no significant impacts, positive or negative, in the labor market for young

55
women. The positive impacts for young men were realized primarily within the academy
subgroups identified as high- or medium-risk and showed positive earnings gains of 18%
(up to $10,000) more than their counterparts in the non-academy groups. This was based
on factors including the number of months employed, number of hours worked per week,
and the hourly wage paid for that work. In other words, for young males in the high- or
medium-risk subgroups, participating in a career academy helped them obtain better
paying jobs that more often were full-time as opposed to part-time employment. In
regards to the lack of impact on female students, Kemple (2004) posited that these young
women may have shared a greater propensity to attend school and/or were taking care of
young children. Furthermore, when compared to the female students in the non-academy
group, young women who participated in a career academy worked a similar number of
hours per week at a similar wage and were employed for a similar number of months.
Examining longer-term impacts on labor market outcomes, Kemple and Willner
(2008) reported that students who had participated in career academies realized earnings
gains that averaged 11% ($2088) more per year compared to non-academy students eight
years after high school graduation. This earnings gain was a drop from 18% four years
earlier. Still, these earnings gains were concentrated among young men in the study. In
addition, Kemple and Willner found that students who participated in career academies
demonstrated higher levels of young people living independently with children and a
spouse or partner. Moreover, young men also experienced positive impacts on marriage
and being custodial parents. That is to say male students who participated in a career
academy program were more likely to have a stable family and home life compared to the
control group 15 years after the study began (Kemple & Willner, 2008). The findings

56
are encouraging, particularly for young men of color who are oftentimes left behind in
the labor market.
Factors associated with career academy outcomes. Generally, Kemple and
Snipes (2000) found that the strongest associations were between the interpersonal
supports (including teacher expectations and peer collaboration) and various measures of
students’ performance or engagement in school. Kemple and Snipes (2000) simplified
conceptual model of the career academy approach is comprised of four constructs
including: (a) career academy organizational elements, (b) supports and learning
opportunities, (c) high school outcomes, and (d) postsecondary outcomes. Students who
reported higher degrees of support from their teachers and peers were found to be less
likely to drop out of high school and more likely to complete a core curriculum (Kemple
& Snipes, 2000). Students who participated in career awareness and work-based learning
activities were more engaged in school and more likely to attend postsecondary education
than those who did not participated in such activities. The researchers caution however,
that these career academy impacts may not directly result in the outcomes such as
dropout rates or credits earned toward graduation. As Stern et al. (2000) recognized,
since the students must take the initiative to apply for acceptance into a career academy,
it’s quite possible that these students possess higher levels of motivation, ambition,
parental support or other unmeasured characteristics compared to students who hold no
interest in participating in a career academy. Moreover, about two-thirds of both
academy and non-academy students were highly engaged in school, indicating that these
students were likely to be engaged in school whether they were participating in a career
academy or not (Kemple, 1997).
57
Policy implications. In 1996, Kemple and Rock reported that students were
graduating from high school lacking the knowledge and skill sets required for obtaining a
good job; and for those students who dropped out of school, the employment prospects
were especially grim. The School-to-Work Opportunities Act (STWOA) of 1994 was
focused on enhancing rigor and relevance in secondary classrooms as well as increasing
work-based learning activities for students while building distinct pathways from high
schools to postsecondary institutions and careers (Kemple & Snipes, 2000). Career
academies have been recognized as a viable approach to creating supportive secondary
environments that increase students’ exposure to career awareness and work-based
activities while integrating core academic curricula into the students’ high school
experience (Castellano et al., 2007; Kemple, 1997, 2001, 2004; Kemple & Rock, 1996;
Kemple & Snipes, 2000; Kemple & Willner, 2008; Kemple et al., 1999; Silverberg et al.,
2004; Stern et al., 2000). Research studies have shown that while career academies do
not impact student scores on standardized achievement tests in reading and mathematics,
they have made an impact on the dropout rate for students, especially those identified as
being at high-risk for dropping out of school (Castellano et al., 2007; Kemple, 1997,
2001, 2004; Kemple & Rock, 1996; Kemple & Snipes, 2000; Kemple & Willner, 2008;
Kemple et al., 1999; Silverberg et al., 2004; Stern et al., 2000).
Furthermore, career academies have been identified as an effective strategy for
helping students gain credentials required for high school graduation as well as to prepare
them for entry into postsecondary education (Castellano et al., 2007; Kemple, 1997,
2001, 2004; Kemple & Rock, 1996; Kemple & Snipes, 2000; Kemple & Willner, 2008;
Kemple et al., 1999; Silverberg et al., 2004; Stern et al., 2000). Findings from various

58
research studies on career academies have led researchers to conclude that by serving a
heterogeneous population of students, all members of the academy realize some level of
benefit. Therefore, the literature is robust with suggestions related to maintaining diverse
student populations within career academies (Castellano et al., 2007; Kemple, 1997,
2001, 2004; Kemple & Rock, 1996; Kemple & Snipes, 2000; Kemple & Willner, 2008;
Kemple et al., 1999; Silverberg et al., 2004; Stern et al., 2000). Moreover, career
academies can serve as microcosms for schools working towards achieving full
membership where “all students receive the supports they need to achieve in relationship-
filled learning environments” (Black & Burrello, 2010, p. 6).
By 2001, Kemple indicated that when compared to the control group (non-
academy students), career academies demonstrated little or no impact on high school
graduation rates, initial postsecondary education, or employment outcomes. Therefore,
Kemple (2001) suggested that career academies begin considering expanding efforts to:
• recruit students who may not be motivated to enroll in academies on their
own,
• provide college counseling from the beginning of high school, and
• ensure access to professional development designed to improve
curriculum/instruction.
To that end, the primary issue to be addressed by the proposed study is an investigation
into whom, demographically speaking, participates in career academy programs. That is
to ask, are there certain types of career academies, organized by Career Cluster™ that
appeal more to one gender, race/ethnicity, or socio-economic status than career

59
academies from another cluster? Presently, there is limited literature available that
focuses on the demographics of students actively participating in career academies.
Summary. Career academies are small learning communities which deliver
integrated curriculum based upon a career theme interest and have active partnerships
with local business and industry. Originally designed to keep students, identified as at-
risk for dropping out of school, in school through their 12th grade year, career academies
became known as a promising initiative and strategic component of overall efforts to
bring reform to high schools. During the mid 1990s, the career academy movement
shifted focus from students considered at-risk for leaving school prior to graduation, to a
model preparing all students for both college and work. Studies on the outcomes
associated with career academies have provided researchers, educators and policymakers
with mixed results on the effectiveness of this educational reform model (Castellano et
al., 2007; Kemple, 1997, 2001, 2004; Kemple & Rock, 1996; Kemple & Snipes, 2000;
Kemple & Willner, 2008; Kemple et al., 1999; Silverberg et al., 2004; Stern et al., 2000).
Early reports from Kemple and Rock (1996) indicated that career academies
attracted students with a high degree of demographic and educational diversity. Career
academies were found to provide a considerable amount of interpersonal supports for
both students and teachers; and career academy students were also significantly more
likely to participate in career awareness and development activities compared to their
non-academy peers (Kemple, 1997; 2001; Kemple & Snipes, 2000; Stern et al., 2000).
Kemple and Snipes (2000) also found that career academies improved attendance rates
and academic course-taking for students considered at high-risk, which in turn increased
the likelihood of on-time graduation and reduced the dropout rate (Kemple, 2001).

60
However, career academies that did not increase interpersonal supports, actually realized
an increase in dropout rates (Kemple & Snipes, 2000). Moreover, the researchers found
that although the findings had supported several positive outcomes, career academies
were not able to positively impact standardized reading and mathematics achievement
test scores (Kemple, 2001; Kemple & Snipes, 2000; Stern et al., 2000).
Later reports indicated that while career academies improved participating
students’ high school experiences, the career academies had little if any influence on
course content or classroom instructional practices (Kemple, 2001). Furthermore, when
the treatment group (academy students) was compared to the control group (non-academy
students), the career academies were found to have little or no impact on high school
graduation rates, initial postsecondary enrollments, or employment outcomes. However,
the most noticeable impacts were realized by the students identified as being at high-risk
for dropping out of school (Kemple, 2001). Regardless, career academies continued to
not have an impact on standardized achievement scores (Kemple, 2001).
In regards to labor market outcomes, career academies were shown to improve
employment prospects for young men; however they had no impact (positive or negative)
for young women (Kemple, 2004). Again these impacts were realized most by those
male students who had been identified as at high- or medium-risk for dropping out of
school. And while career academies did appear to serve as viable pathways to
postsecondary, when compared to their non-academy counterparts, study findings do not
support the notion that career academies were any more effective in getting career
academy students enrolled in postsecondary education programs (Kemple, 2004). Long-
term labor market outcome findings showed a slight decline, but that young men who had

61
participated in a career academy were still realizing earnings gains and they were more
likely to have a stable family and home life compared to the control group 15 years after
the study began (Kemple & Willner, 2008). The findings in the literature suggest that
career academies, while not a perfect solution, provide a viable option for students and
when the academy is comprised of a heterogeneous grouping of students, all students in
the academy benefit.
Enrollment Patterns in Career Academies
Brand (2009) along with the National Center for Education Statistics (2011)
indicated that in 2004, there were approximately 4,800 high schools that offered career
academies as a pathway for their students. Brand (p. 3) also estimated that in 2009, while
“no one has a precise count” there were somewhere in the neighborhood of a million
students enrolled in career academies nationwide. That is to say, while the federal entity
within the U.S. Department of Education has a realistic estimate of the numbers of
students enrolled in CTE courses and programs across the nation, a single clearinghouse
that maintains accurate numbers on students enrolled and participating in career
academies across the country simply does not exist.
Who participates in career academies? In 2011-12, the National Academy
Foundation (NAF) (2012) reported there were 464 career academies operating as NAF
affiliates. These academy models deliver content under the following industry clusters:
(a) 208 Academies of Finance, (b) 74 Academies of Hospitality and Tourism, (c) 105
Academies of Information Technology, (d) 62 Academies of Engineering, and (e) 15
Academies of Health Sciences. Through this network, NAF claims to support up to
60,000 students nationally. Demographically speaking, two-thirds (67%) of these

62
students are African American or Hispanic/Latino and 63% of the students served also
qualify for the free and reduced lunch program.
While NAF (2012) maintains data on these career academies, the data collected is
restricted to career academies that partner with and operate under the rules of NAF (Orr
et al., 2004). That partnership also requires financial payments made to NAF in order to
become an official NAF academy. Therefore, there are a plethora of academies across
the nation not reflected in the official NAF counts. Similarly, the National Career
Academy Coalition (NCAC, 2011) maintains a record of its members as they are
considered affiliates of the organization. The Career Academy Support Network (CASN)
- now referred to as the College and Career Academy Support Network (CCASN) - is
reported to have the best listing of career academies across the country. However, a
review of the academy directory listing available through the CCASN website was found
to have considerable errors and substantially out-dated information (Career Academy
Support Network, 2011).
California Partnership Academies. CCASN has twice published reports on
career academy profiles for those career academies located within the state partnership
group known as the California Partnership Academies (2012). This profile was first
developed in 2004-05 and updated in 2009-10. Data from the 2004-05 profile show that
of the students enrolled in partnership academies 43% were male and 57% were female.
Furthermore, when reviewing racial and ethnic backgrounds, the profile indicated the
following distribution: (a) 46% Hispanic/Latino (b) 26% White, (c) 11% African
American, (d) 10% Asian, (e) 4% Filipino, (f) 1% Native American or Alaskan Native,
(g) 1% Pacific Islander, and (h) 1% Multiple (Bradby, Dayton, Hanna, & Malloy, 2007).

63
In the 2009-10 updated profile, the following demographics were shared. Gender
distribution narrowed a bit to 47% male and 53% female. Racial and ethnic backgrounds
demonstrated the following distributions: (a) 59% Hispanic, (b) 16% White, (c) 10%
Asian, (d) 9% African American, (e) 3% Mixed or other, (f) 2.5% Pacific Islander, and
(g) 0.5% Native American or Alaskan (Dayton, Hester, & Stern, 2011). Table 2.3 details
these demographics from both profiles.
Table 2.3
Student Percentages in California Partnership Academies by Gender and Race/Ethnicity
Gender/Race 2004-05a 2009-10b Male 42.7 47.2 Female 57.3 52.8 Hispanic 46.3 59.2 White 26.2 15.8 Asian 9.6 10.3 Black 11.1 8.7 Mixed Race 5.0 3.2 Pacific Islander 1.1 2.5 Native American 0.7 0.4 Note. Data compiled from Bradby, Dayton, Hanna, & Malloy (2007); Dayton, Hester, & Stern (2011). California Partnership Academy (CPA) students are enrolled in an academy during grades 10-12. an = 33,028. bn = 48,436.
In order to address the needs of students considered “at risk”, and as per
California Assembly Bill 3104 which launched the California Partnership Academies, the
legislation requires a minimum of 50% of academy students must meet at least three of
the following six criteria for being designated as students “at risk”: (a) economically
disadvantaged, (b) having poor attendance, (c) maintaining a low grade point average, (d)
earning low scores on state-wide assessments, (e) significantly lagging in credits for
graduation, and (f) demonstrating a lack of motivation for traditional school programs
(Bradby et al., 2007; Dayton et al., 2011). However, it is important to note that while the

64
academies were required to enrolled a minimum of 50% “at-risk” students, Bradby et
al.(2007) caution there is a lack of information to substantiate the degree to which the
academies met this requirement.
Florida Career and Professional Education. In 2007, the state of Florida
legislature enacted the Career and Professional Education (CAPE) Act to increase the
number and quality of career academies across the state (Estacion, D'Souza, & Bozick,
2011). Up until this time, school districts implemented career academies to varying
degrees and in a variety of format models. CAPE legislation required that each of the 67
school districts in the state of Florida would develop and implement at least one career
academy for the 2007-08 school year. At the time, data reporting from school districts on
career academies was sparse and inconsistent. Since the enacting of the CAPE Act, the
Florida Department of Education requires each school district to register career
academies.
Estacion et al. (2011) reported data on career academies as they existed just prior
to the CAPE Act. In other words, this report was based upon data from the 2006-07
school year. Through their study, data from 12 school districts across the state were
analyzed in terms of the: (a) number and type of career academies, (b) characteristics of
the schools offering career academies, and (c) number and characteristics of students
enrolled in the career academies. Data from Table 2.4 details a gender split of 46% male
and 54% female students participating in these academies. The representation of Asian
students in career academies closely reflected the overall percentage of Asian students in
high schools across the 12 sample school district. However, the table shows a higher
percentage of African American students participating when compared to the overall

65
student population, while percentages were lower for both Hispanic and White students.
Furthermore, the data elucidates participation comparisons for economically
disadvantaged students along with students for whom English is not their native
language, as well as students who receive special education programming.
Table 2.4
Percentage of Student Demographics From 12 Florida School Districts in 2006-07
Demographic All Studentsa Academy Studentsb Male 49.6 45.8 Female 50.4 54.2 American Indianc 0.3 0.3 Asiand 2.4 2.5 Blacke 26.3 29.4 White 38.1 37.4 Hispanicf 30.9 28.0 Multi-Racial 2.1 2.4 NSLPg 38.4 38.6 ELLh 6.1 2.2 ESEi 19.1 18.2 Note. Data compiled from Estacion, D'Souza, and Bozick (2011). an = 332,010. bn = 47,795. cAmerican Indian includes Alaska Native. dAsian includes Native Hawaiian and other Pacific Islander. eBlack includes African American. FHispanic includes Latino. gStudents who participate in the National School Lunch Program (NSLP) receive free or reduced cost meals due to family economic status. hEnglish Language Learners (ELL) are students whose native language is one other than English. iStudents who participate in Exceptional Student Education (ESE) receive special educational services.
Comparing the data from the California career academies and the Florida career
academies, it appears that a higher percentage of males (in California) participate in
career academies while a higher percentage of females participate in Florida. Also, a
higher percentage of Asian and Hispanic students participate in California while in
Florida, participation percentages are higher for African American and White students.
Unfortunately, the California profiles fell short of accurately describing students other
characteristics including socio-economic status, as well as participation in language or
66
special education programs. In this regard, academy students in Florida receiving free or
reduced priced meals matched the percentages for the larger sample of all students
(control group). Those students receiving special education programs were comparable
to the control group as well. However, of the students recognized as English language
learners, only a third were found to be participating in career academies (Estacion et al.,
2011).
Course taking and program patterns. During the 2004-05 school year, the
California Partnership Academies served about 33, 028 students in grades 10-12
(approximately two percent of students enrolled statewide) in 290 career academies
focused on one of the 15 industry sectors established by the state department of
education. By 2010, the number of students served had grown to approximately 48,436
students (approximately three percent of students enrolled statewide) in 467 career
academies statewide.
When considering enrollment by career cluster and gender as shown in Table 2.5,
data from the 2004-05 California Partnership Academies profile articulate male students
were more prominent in those academies tied to the following clusters: (a) manufacturing
81.7%, (b) building trades and construction 72.8%, and (c) energy and utilities 63.2%.
During the same time, female students showed heavier concentrations in: (a) education
and child development 76.9%, (b) health science and medical technology 75.0%, and (c)
hospitality, tourism and recreation 63.1%. By 2010, male students demonstrated
increased enrollments in engineering and design (69%) while female students participated
substantially in fashion and interior design (79%) (Bradby et al., 2007; Dayton et al.,
2011).

67
Table 2.5
Percentage of CPA Enrollment by Industry Area and Gender in 2004-05 & 2009-10
2004-05a
2009-10b Industry Area Male Female Malec Femaled Fashion/Interior Designe - - 21 79 Health Science/Medical Technology 25.0 75.0 30 70 Education, Child Development 23.1 76.9 30 70 Hospitality, Tourism & Recreation 36.9 63.1 40 60 Marketing, Sales & Servicef - - 45 55 Public Services 43.7 56.3 48 52 Arts, Media & Entertainment 49.0 51.0 50 50 Finance & Business 45.6 54.4 50 50 Agriculture & Natural Resources 45.5 54.5 51 49 Energy & Utilities 63.2 36.8 51 49 Information Technology 54.2 45.8 59 41 Transportation 61.9 38.1 61 39 Engineering & Design 60.4 39.6 69 31 Building Trades & Construction 72.8 27.2 71 29 Manufacturing & Product Development 81.7 18.3 78 22 Note. Data compiled from Bradby, Dayton, Hanna, & Malloy (2007); Dayton, Hester, & Stern (2011). California Partnership Academy (CPA) students are enrolled in an academy during grades 10-12. an = 33,028. bn = 48,436. cMale percentages for 2009-10 are approximate. dFemale percentages for 2009-10 are approximate. eNo CPA data for this industry area in 2004-05. fNo CPA data for this industry area in 2004-05.
Comparative data in Table 2.6 show that in Florida during the 2006-07 school
year, male students were found to participate heavily in: (a) transportation, distribution
and logistics 91.7%, (b) manufacturing 87.7%, and (c) architecture and construction
72.2%. Female students demonstrated healthy concentrations in the areas of: (a)
education and training 84.4%, (b) human services 78.0%, and (c) health science 74.2%
(Estacion et al., 2011).

68
Table 2.6
Note. Data compiled from Estacion, D'Souza, and Bozick (2011). n = 47,795.
When investigating 2004-05 course taking patterns of students in the California
Partnership Academies based on racial and ethnic demographics, the highest
concentration of Asian students (24.3%) was found within the energy and utilities
industry cluster. As shown in Table 2.7, for Asian students, engineering and design was
close behind with 22.8%. Construction trades and public service clusters boast the
highest percentage of Hispanic students (60.3%), while information technology and
agriculture hold the highest percentages of Black (15.4%) and White (43.1%) students
respectively (Bradby et al., 2007). Unfortunately, the 2010 profile update fell short of
describing course taking patterns based on racial or ethnic heritage (Dayton et al., 2011).
Percentage of Florida Academy Enrollments by Career Cluster and Gender in 2006-07 Career Academy Cluster
Male
Female
Agriculture, Food & Natural Resources 46.4 53.6 Architecture & Construction 72.2 27.8 Arts, A/V Technology & Communications 43.2 56.8 Business, Management, & Administration 53.6 46.4 Education & Training 15.6 84.4 Finance 49.9 50.1 Government & Public Administration 45.8 54.2 Health Science 25.8 74.2 Hospitality & Tourism 44.8 55.2 Human Services 22.1 78.0 Information Technology 60.5 39.5 Law, Public Safety, & Security 34.9 65.1 Manufacturing 87.7 12.4 Marketing, Sales, & Services 43.9 56.1 Science, Technology, Engineering & Mathematics (STEM) 62.9 37.1 Transportation, Distribution, & Logistics 91.7 8.3

69
Table 2.7
Percentage of Students Enrolled in CPAs by Race/Ethnicity & Industry Area in 2004-05
Racial and Ethnic Composition Industry Area Asiana Hispanic Black White Otherb Agriculture 9.3 39.7 6.2 43.1 1.7 Arts & Media 14.9 46.6 11.9 25.2 1.4 Construction Trades 9.2 60.3 5.5 23.8 1.1 Finance/Business 14.2 47.7 11.5 24.4 2.2 Education/Development 15.2 42.7 12.9 27.6 1.6 Energy & Utilities 24.3 47.0 2.4 25.7 0.6 Engineering & Design 22.8 32.3 8.9 34.9 0.9 Health Sciences 15.0 46.2 11.3 25.3 2.3 Hospitality/Tourism 16.6 46.3 8.4 25.2 3.4 Information Technology 15.1 40.3 15.4 27.1 2.0 Manufacturing 20.7 41.3 11.1 25.9 1.0 Public Services 9.5 60.2 13.9 14.9 1.5 Transportation 10.7 58.0 5.0 26.1 0.3 Note. Data compiled from Bradby, Dayton, Hanna, & Malloy (2007). California Partnership Academy (CPA) students are enrolled in an academy during grades 10-12. N = 33,028. Comparable data from the 2009-10 profile update was not available. aAsian also includes Pacific Islander and Filipino students. bOther also includes Native American/Alaskan and Multi-racial students.
In comparison, 2006-07 data from the 12 sample school districts in Florida drew a
slightly different picture of diversity. Of the 332,010 students enrolled across the 12
school districts in the sample, nearly 15% (49,795) were also participating in a career
academy (Estacion et al., 2011). As shown in Table 2.8, the manufacturing cluster
appealed to the highest percentage of Asian students (6.2%) while Health Science drew
nearly half (49.4%) of students from African American heritage. The human services
cluster attracted the highest proportion of Hispanic students (40.1%). Similar to
California students, White students (61.0%) were especially drawn to career academies in
the agriculture and natural resources cluster, as well as to academies in the transportation
and logistics (60.7%) cluster (Estacion et al., 2011).

70
Table 2.8
Percentage of Florida Academy Students by Career Cluster & Race/Ethnicity in 2006-07
Racial and Ethnic Composition Career Academy Cluster Asiana Blackb Hispanicc White Multi-Raciald Agriculture & Natural Resources 0.5 13.7 20.9 61.0 3.9 Architecture & Construction 1.3 21.3 34.8 40.1 2.4 Arts, A/V & Communications 2.2 23.7 28.1 42.6 3.3 Business & Management 2.4 31.8 29.3 33.0 3.4 Education & Training 1.5 38.2 21.9 36.4 2.1 Finance 2.7 24.3 24.3 31.0 2.2 Gov’t & Public Administration 3.0 25.5 26.4 42.6 2.4 Health Science 4.0 49.4 11.6 32.3 2.8 Hospitality & Tourism 1.4 29.4 24.7 41.3 3.3 Human Services 1.7 46.7 40.1 9.7 1.8 Information Technology 2.8 29.0 28.4 37.7 2.2 Law & Public Safety 1.2 37.8 31.7 26.4 2.9 Manufacturing 6.2 23.5 18.5 46.9 4.9 Marketing, Sales, & Services 3.7 31.9 15.6 45.4 3.4 STEM 3.1 14.4 36.1 44.0 2.4 Transportation & Logistics 2.3 17.3 16.6 60.7 3.2 Note. Data compiled from Estacion, D'Souza, and Bozick (2011). N = 47,795. aAsian includes Native Hawaiian and other Pacific Islander. bBlack includes African American. cHispanic includes Latino. dMulti-racial also includes American Indian and Alaska Native.
Table 2.9, also complied from Estacion et al. (2011) details career academy
participation in the 12 sample school districts within Florida based upon three other
characteristics namely: (a) socio-economic status, (b) English language learners, and (c)
students enrolled in special education programs. As articulated in Table 2.4, for students
participating in the National School Lunch Program, the proportion of students also
participating in a career academy (38.6%) was relative to the percentage of students in
the control group (38.4%). Nearly half of the students (49.8%) enrolled in career
academies focused on the law and public safety cluster, and just over half (50.7%) of the
students enrolled in the human services cluster, received benefits from the NSLP. While
students participating in the English language learner (ELL) program were not found to

71
enroll in career academies relative to the proportion of students in the control, for those
who did participate in career academies, the strongest presence (8.6%) was found in the
manufacturing cluster. Interestingly, the government and public administration cluster
had the highest proportion of ESE students (who received special education services)
enrolled in career academies (Estacion et al., 2011).
Table 2.9
Percentage of Florida Academy Students by Career Cluster & Other Characteristics
Other Characteristics Career Academy Cluster NSLPa ELLb ESEc Agriculture & Natural Resources 31.3 0.6 18.0 Architecture & Construction 36.0 2.4 20.9 Arts, A/V & Communications 30.6 1.8 20.7 Business & Management 44.6 6.5 10.2 Education & Training 44.3 2.3 11.1 Finance 37.4 1.3 17.2 Gov’t & Public Administration 40.6 3.1 23.0 Health Science 44.1 1.5 10.4 Hospitality & Tourism 36.0 3.3 15.9 Human Services 50.7 3.6 18.6 Information Technology 38.2 2.5 12.7 Law & Public Safety 49.8 1.4 16.1 Manufacturing 33.3 8.6 14.8 Marketing, Sales, & Services 32.3 2.0 14.6 STEM 34.2 2.4 21.7 Transportation & Logistics 32.3 1.5 20.8 Note. Data compiled from Estacion, D'Souza, and Bozick (2011). N = 47,795. aStudents who participate in the National School Lunch Program (NSLP) receive free or reduced cost meals due to family economic status. bEnglish Language Learners (ELL) are students whose native language is one other than English. cStudents who participate in Exceptional Student Education (ESE) receive special educational services.
Summary. The California Partnership Academies report that gender and ethnic
data suggest that academies are comprised of diverse student bodies. Compared to the
state average, higher proportions of Hispanic/Latino students further suggests that
academies are actively working to recruit a diverse pool of students “or at least reflecting

72
the makeup of their high school populations” (Bradby et al., 2007, p. 30). Furthermore,
data which shows that nearly 60% of academy students are female mitigates the ideology
that CTE programs are designed for male students. Moreover, while the student
population includes “at-risk” students who attend low performing schools, nearly 90% of
the academy students plan to graduate and attend post-secondary education. Sixty-five
percent of those also plan to work while attending college (Dayton et al., 2011). Similar
to the California academies, Estacion et al. (2011) found a higher proportion of female
students compared to male students participating in career academies in Florida. The
researchers also found that, on average, the Florida career academies tended to serve a
more advantaged group of students as opposed to having a focus on students who might
be considered “at-risk”. This was especially true for Hispanic students and those students
participating in the English language learners (ELL) program (Estacion et al., 2011).
Tracking in Secondary Education
As described in the introduction of this dissertation, tracking has occurred in
secondary education for over a hundred years (Agodini et al., 2004; Levesque et al.,
2000). The term tracking is the practice of placing students into groups based upon their
ability levels and other similar factors (Akos, Lambie, Milsom, & Gilbert, 2007;
Hallinan, 1994; Oakes, 1987). Originally, this model separated students into academic or
vocational tracks and was designed to assist students in their preparation for college or
careers respectively (Agodini et al., 2004; Levesque et al., 2000). Early research on
tracking indicated the purpose supported teachers’ efforts to tailor instruction to the
ability and needs of their particular students. The overarching goal in tracking students
was to maximize the efficiency of instruction (Akos et al., 2007; Hallinan, 1994; Oakes,

73
1987). It was believed that by creating a learning environment where the level of
instructional complexity matched the students’ ability to grasp multifarious thoughts and
concepts, educators would be able to bring about an increase in achievement for all
students.
More recent research has argued that tracking is not in the best interest of all
students and that it does in fact confound the pathways of many lower-achieving students.
Rubin (2006a) indicates that tracking contributes considerably to the creation of
inequalities within the educational system. Moreover, students from African American
and Hispanic heritage, in addition to students from low socio-economic families, are
over-represented in the lower academic tracks and vocational education (Rubin, 2006a;
Rubin, 2006b). As a result, tracking serves to further racially and ethnically segregate
students while at the same time, providing these students with a lower quality level of
education (Akos et al., 2007; Oakes & Guiton, 1995; Rubin, 2006a; Rubin, 2006b). This
did not occur by happenstance, but rather as a result of institutional design.
Effects of tracking. While tracking was originally aimed at helping young
people gain the knowledge and skill sets they would need in their respective occupations,
research has shown that this system has not provided all students with the level of equity
and focus on individual differences and abilities as originally intended (Mayer, 2008, p.
10). While students in high-ability tracks tend to gain a larger base of knowledge at a
quicker rate than students in lower-ability tracks, research has also indicated that tracking
provides little or no distinct advantage in performance measures over mixed grouping for
students in the mid-range group (Hallinan, 1994). Mayer (2008) indicated that while
classes in the higher track such as college prep courses tend to have better skilled and

74
experienced teachers, those classes in the lower tracks tend to have less qualified
teachers.
And, where the coursework in the higher tracks is more engaging, requiring
higher-level and critical thinking skills, curricula in the lower tracks is oftentimes based
on memorization techniques. Research studies have generally found that low-ability
students tend to see more academic gains when they are part of heterogeneous classrooms
(Archbald & Keleher, 2008). All of this is to say that, except for those students in the
highest ranks, tracking is both ineffective as well as inequitable. Furthermore, since
many students who emerge from minority or low SES backgrounds tend to be in the
lower-ability groups, tracking discriminates against these students (Hallinan, 1994;
Oakes, 1987).
Implications of tracking. Akos et al. (2007) appropriately point out that while
the ongoing debate about tracking has focused on in-school achievement, a longer-term
concern for students’ future career aspirations is equally as important. As many students
begin their career awareness and development while attending secondary schools, the
classes they enroll and participate in help to form those aspirations. Academic tracking
had the potential to discourage students from certain career aspirations. While tracking
has shown benefit for students within the higher-ranks, Gamoran (1992) and Hallinan
(1994) suggested that students need to have the flexibility to move from one track to
another, as research suggests that schools with more mobility within tracking systems
have demonstrated higher achievement overall. Furthermore, opportunities should be
made available by the school for all students to enroll and participate in various levels of

75
coursework as these courses oftentimes set the boundaries for student experiences and
future aspirations (Akos et al., 2007; Gamoran, 1987).
As the research continues to suggest that tracking is a factor linking students’
demographic backgrounds with academic achievement (Lee & Bryk, 1988), there is a
need for further research on tracking which considers the socio-economic as well as
racial and ethnic diversity of schools (Lucas & Berends, 2002). Although Gamoran
(2001) predicted a decrease in educational inequality based on race; he continues to
project considerable educational inequality based on socio-economic conditions. Finally,
Lewis (2007) argued that low SES students, and in particular children of minority
heritage, continue to be less likely to be enrolled in highly rigorous coursework compared
to their more economically advantaged peers. As such, these students are lacking the
ability to develop the knowledge and skill set required in the global economy. Albeit the
“new vocationalism” has brought considerable changes to the delivery of academic and
vocational instruction, SES will continue to be a significant factor of inequality in
education. And as race is embedded in SES, it too remains a critical factor in the debate
on tracking (Lewis & Cheng, 2006).
Theoretical Framework
“Social learning theory recognizes that humans are intelligent problem-solving
individuals who strive at all times to understand the reinforcement contingencies that
surround them and who in turn control their environments to suit their own purposes and
needs” (Mitchell & Krumboltz, 1990, p. 145). If, as the literature suggests, career
academies encourage students to stay in school thereby reducing the dropout rate, and if
career academies provide a more solid foundation preparing young graduates to

76
successfully begin postsecondary education or enter into workforce endeavors, it is
critical to understand the factors which contribute to student participation levels in such
programs. In this context, Krumboltz’s Social Learning Theory of Career Decision
Making (SLTCDM), provides a framework for understanding the role of background
variables on enrollment decisions in particular programs.
Krumbotlz’s theory suggests that career decisions are the result of a myriad of
various learning experiences enhanced by interactions with people, institutions and
events which occur in a person’s environment (Canadian Career Development
Foundation, 2012; Krumboltz et al., 1976). Krumbotlz’s career decision making theory is
an extension of the general learning theory of behavior most often associated with Albert
Bandura (Mitchell & Krumboltz, 1990). Bandura’s social cognitive theory states that
people learn from one another through observation and modeling. The three components
of Bandura’s theory focus on the person, the behavior and the environment. Bandura
believes that each of these factors constantly influences the others. Furthermore, Bandura
identified three types of learning experiences: (a) instrumental, (b) associative, and (c)
vicarious. Instrumental learning experiences are those where the person is reinforced
(positively or negatively) for a particular behavior and the associated cognitive skills
(Krumboltz et al., 1976; Mitchell & Krumboltz, 1990). Associative learning occurs when
the individual associates a neutral event with an emotionally laden stimulus. Vicarious
learning takes place when a person develops new skills as a result of observing those
skills or behaviors in others or by gaining that new knowledge from various media
including books, films and television (National Guidance Research Forum, 2004).

77
According to Mitchell and Krumboltz (1990) the social learning theory of career
decision making is designed to help researchers understand why individuals choose to
enter particular educational programs and/or occupational fields. The theory also assists
researchers in understanding why an individual might decide to change educational
programs or occupations along with understanding why he/she might express certain
levels of interest or preferences for various occupational activities at different points in
their lives. The social learning theory of career decision making is grounded in four
factors: (a) background variables, (b) environmental conditions and events, (c) learning
experiences, and (d) task approach skills (Krumboltz et al., 1976).
As a result of background variables, people oftentimes experience various levels
of access to learning experiences as well as various levels of benefit from those learning
experiences. Said another way, some people are born with greater or lesser abilities to
benefit from experiences or offered different experiences as a result of their innate or
inherited qualities. Background variables include gender, race/ethnicity, and SES, along
with special abilities such as artistic, musical, and athletic talents as well as various
physical handicaps. An example of this construct would be a student who demonstrates
musical talent, however due to economic constraints, cannot take full advantage of a
musical program to fully reach his/her potential (Patton and McMahon, 2006).
Environmental conditions include social, political, cultural and economic
conditions as well as events such as natural disasters. These types of factors are typically
outside the control of the individual and can be either planned or unplanned (Mitchell &
Krumboltz, 1990; National Guidance Research Forum, 2004). In this context, special
attention will be given to the local economic climate including statistics such as: (a)

78
median household income, (b) median home sales prices, (c) unemployment rates, and
(d) a description of the skill set of those seeking work.
Similar to Bandura’s social cognitive theory, Krumboltz’s theory focuses on two
main types of learning experiences: (a) instrumental learning, and (b) associative
learning. In instrumental learning, the learner responds to the environment in an attempt
to achieve a particular objective. Brought on by some type of stimuli, a behavioral
response elicits a particular consequence in this type of learning. In associative learning,
the learner realizes a connection between stimuli and the environment. For example,
reading or hearing about, or observing someone in a particular occupation can lead the
individual to develop certain stereotypes about that occupation (Krumboltz et al., 1976;
Mitchell & Krumboltz, 1990; National Guidance Research Forum, 2004). Task approach
skills are factors that influence outcomes. They include: (a) standards of performance,
(b) work habits and values, (c) perceptual and cognitive processes, as well as (d)
emotional responses. Task approach skills are developed as a result of interactions
between the previous three described factors (background characteristics, environmental
influences, and learning experiences).
The consequences of the interaction between these four main factors, with
particular emphasis on learning experiences, assist learners in developing their own set of
beliefs surrounding careers and their own role in life (self-observational generalizations).
These beliefs then serve as prominent influences on the individual’s educational and
career choices. Moreover, the learning experiences cause the individual to view some
occupations as being more attractive than others. This is especially true when the
learning experiences are observational in nature and involved important role models to

79
the individual, including parents, teachers, and other significant persons (Canadian
Career Development Foundation, 2012).
In addition to the interactions taking place between the four main factors of the
theoretical model, positive and negative influences contribute to the career decision
making process. Positive influences increase the likelihood that the learner will develop
the cognitive and performance skills required for goal setting, career planning, and self-
observing. Positive influences also increase the likelihood the learner will develop
appropriate career behaviors by having access to people and resources that can assist the
learner in the career decision making process. Furthermore, positive influences can also
increase the likelihood that the individual will enroll in an educational program designed
to prepare them for work in a certain field. Negative influences, on the other hand,
decrease the likelihood of these events occurring. Moreover, negative influences can
result in an individual being less likely to seek enrollment in a career-oriented program or
career field, especially if the anticipated cost of enrolling in that program would exceed
the benefits as perceived by the individual. To summarize, as a result of the interaction
of the four main factors, (background variables, environmental conditions and events,
learning experiences, and task approach skills), along with various sources of influence, a
learner can travel down various pathways toward a career. That is to say, as a result of
the learning experiences and the skills that develop from them, individuals engage in
practice leading to career entry. This practice includes applying for a job or enrolling in
an educational training program (Krumboltz et al., 1976; Mitchell & Krumboltz, 1990).
The objective to this research study was to identify demographically those
students who participate in career academies and to determine if students with particular

80
demographic backgrounds and/or prior experiences tend to participate in career
academies related by Career Clusters™. The Career Clusters™ are part of a national
framework designed to provide structure for organizing and delivering quality CTE
programs. There are 16 Career Clusters encompassing approximately 80 different Career
Pathways. As students progress through a CTE program, they build a base of knowledge
and skill set that can prepare them for occupations and further training within the various
pathways of the chosen career cluster. For example, a student in the Agriculture, Food &
Natural Resources cluster develops the skills necessary for employment across various
pathways including: (a) Food Products & Processing Systems, (b) Plant Systems or
Animal Systems, or (c) Environmental Service Systems. The Career Clusters™
encompass both secondary and postsecondary knowledge and skills sets. Consequently,
the framework serves as a bridge to improve student transition from secondary to
postsecondary education. As such, the Career Clusters™ help students discover their
interests and empower them to pursue an educational pathway leading to success in high
school, college and careers (National Association of State Directors of Career Technical
Education Consortium, 2011).
The alignment between Krumboltz’s theory and the variables in this research
study is described as follows. Krumboltz’s first factor of background variables is
reflected in the demographic variables of this study. The factor on learning experiences
was aligned with the study variable describing students’ previous middle school course-
taking patterns, especially as it relates to career exploration (CTE) courses. Task
approach skills from Krumboltz’s model were aligned to performance measures taken
during study participants’ middle school experiences. Finally, Krumboltz’s factor on

81
environmental conditions and events were aligned to local economic and workforce
statistics and were considered a constant for all research study participants’ data. The
alignment between factors of the theory and the variables analyzed in this research study
allowed for the development of a graphic conceptual framework illustrating the
relationships in this research study.
First, the conceptual framework illustrates the demographic (independent)
variables of race/ethnicity, gender, and socio-economic status of students who
participated in career academies (dependent variable) over the past six-year period. The
relationship between these variables is illustrated by way of dash-lined arrows. This
provided initial trend data. Research has indicated students from various racial/ethnic
and socio-economic backgrounds have participated in career academies in the past
(Bradby et al., 2007; Dayton et al., 2011; Kemple & Snipes, 2000).
Second, 2012-13 participation rates in career academies were examined. The
relationship between these variables is illustrated by way of solid-lined arrows. The
framework outlines the focus of the study with an emphasis on determining the extent to
which demographic, prior learning experience, and performance variables predict
participation in career academies. While the demographic along with prior learning
experience and performance variables are the independents, participation in a career
academy is the dependent variable. Environmental conditions, including the economic
status of the community, were a constant and relative to all students within the school
district. Research on student tracking (Akos et al., 2007; Lewis, 2007; Oakes & Guiton,
1995) has indicated substantial participation in CTE and career academies (Bradby et al.,
2007; Dayton et al., 2011) by members of various groups including African American,
82
Hispanic, and students from low SES families. The literature has also shown various
factors contribute to students’ decision-making process in deciding whether or not to
participate in career development and other related activities (Mitchell & Krumboltz,
1990). Third, the diagram points to the outcome of determining the extent to which
demographic, prior learning experience, and performance variables predict participation
within specific types of career academies based upon Career Clusters™. The relationship
between these variables is again illustrated by way of solid-lined arrows. Recent research
literature has indicated concern for the lack of participation of students in high-skill,
high-wage, high-demand careers with a specific interest in science, technology,
engineering and math (STEM) career fields (Anderson, 2010; Ndura et al., 2003; Syed &
Chemers, 2011; Whalen & Shelley, 2010). This research study investigated recent
participation trends, as well as present participation rates of students enrolled in career
academies in order to contribute to existing literature. As shown in Figure 2.2, the
conceptual framework underlying this research study delineates the research questions
including independent variables and the dependent variables of this study.
Summary. The career academy model continues to demonstrate increased levels
of achievement by way of: (a) increased attendance, (b) reduced dropout rates, and (c)
higher earnings potential for students following high school graduation. By conducting
this study, the researcher sought to understand demographically, who participates in
career academies. The results of this study add to the knowledge base and field of
literature enabling other researchers and practitioners to evaluate local participation rates
in career academies. The social learning theory of career decision making along with the

83
Figure 2.2 Conceptual Framework for Analyzing Career Academy Participation
Demographic Variables
• Gender • Race/Ethnicity • SES
Career Academy Participant
Career Academy Non-Participant
Career Academy Participant by Career Cluster™
• Agriculture, Food & Natural Resources • Architecture & Construction • Arts, A/V Technology & Communications • Finance • Health Science • Hospitality & Tourism • Information Technology • Law, Public Safety, Corrections & Security • Marketing • Science, Technology, Engineering & Mathematics
(STEM)
Learning Experiences and
Prior Performance
Environmental Conditions

84
articulated conceptual framework served as the foundational support structure for this
particular research study and may do so for future work in investigating factors that lead
to career academy participation.
The problem addressed by the proposed study, was a gap in the knowledge base
regarding student participation rates in career academy programs. Considerable literature
exists that supports outcomes from active student participation in career academies.
There are also research studies that focus on perceptions of CTE programs, as well as
studies focused on factors contributing to the decision-making process. Some of these
studies include demographic data, while others do not; and some focus on career
academies while others focus on courses related to career development. As a result, there
was a significant gap in the literature supporting the notion that the demographic
composition of career academies reflects the schools, districts and communities in which
they operate. By investigating enrollment trends and participation rates of students in
career academies, this study aimed to explore and more fully understand this
phenomenon. Chapter three explicates the research methods used in this research study.

85
CHAPTER THREE: METHODOLOGY
The first section of this chapter recaps the purpose of this research study along
with the research questions. The second section describes the type of research design
being employed in this research study. The third section discusses the research setting,
participants, and institutional context. The fourth section explains the variables examined
in this study. The fifth section describes the data collection methods for this research
study. The sixth section describes the procedures for data analysis for each research
question. Finally, the seventh section articulates how the study results will be shared.
The purpose of this research was to describe and explain (Babbie, 1990; Gall,
Gall, & Borg, 2007; Grimm, 1993). To this end, the study seeks to describe participation
trends of students enrolled in career academies, and determine whether participation in
career academies in general, and in particular types of career academies is a function of
demographic and/or prior learning experience and performance variables. Thus, this
chapter articulates the methods used to investigate the following research questions:
1) What are the participation trends in career academies over a recent six-year
period (2007-2012) based on demographic variables including gender,
race/ethnicity, and socio-economic status (SES)?
2) To what extent do demographic, prior learning experience, and performance
variables predict participation in career academies?

86
3) To what extent do demographic, prior learning experience, and performance
variables predict participation within specific types of career academies
(based upon Career Clusters™)?
Research Design
This research study was developed and conducted as a non-experimental
descriptive/causal-comparative design project (Gall et al., 2007). The non-experimental
design is appropriate when investigating phenomena where the treatment (independent
variable) has not been manipulated (Gall et al., 2007; Johnson, 2001). Gall et al. (2007)
indicated that descriptive research designs are appropriate when researchers are seeking
to describe phenomena in a quantitative manner. The authors define descriptive research
as “a type of quantitative research that involves making careful descriptions of
educational phenomena” (Gall et al., 2007, p. 300). Descriptive research was therefore
an appropriate analysis technique for the first research question in this study. Gall et al.
(2007) further indicated that causal-comparative studies are useful not only when
searching for leading causes, but also when studying the effects of a particular
phenomena. This is accomplished by examining groups of people for whom the
independent variable is present or absent and making a determination about how the
groups differ on the dependent variable (Gall et al., 2007; Johnson, 2001). As such,
causal-comparative research was appropriate for addressing both the second and third
research questions in this study.
In causal-comparative research studies, independent variables are measured as
categorical (nominal or ordinal scale) variables (Gall et al., 2007; Johnson, 2001). While
causal-comparative research designs provide a means for investigating important

87
educational research questions, these designs also suffer from a weakness related to
internal validity. Selection threats are a typical limitation in this type of research design
(Trochim & Donnelly, 2007). Selection threats occur when the researcher lacks control
over the comparison or reference (control) group. As a result, groups in the research
study may vary in terms of the independent variable(s) other than the outcome of the
treatment. Therefore, it is sometimes difficult to draw conclusions about the larger
population from the findings of causal-comparative research studies.
Sampling method. This research study utilized non-probability convenience
sampling to investigate the articulated research questions (Gall et al., 2007; Trochim &
Donnelly, 2007). In non-probability sampling, research study participants are not
selected randomly or chosen to participate by any degree of chance. Gall et al. (2007)
indicated when using non-probability sampling there are limits to which the researcher
can generalize the results of the research study. However, the authors also acknowledge
that non-probability sampling methods are used in more than 95% of social science
research studies.
Convenience sampling is a specific type of non-probability sampling used when
the researcher seeks to develop a sample of participants for a particular study where the
sample meets certain criteria (Gall et al., 2007; Trochim & Donnelly, 2007). Those
criteria might include such conditions as: (a) close proximity of participants to the
research setting, (b) special access to data, and (c) ex-post facto collection of data.
Convenience sampling was used to address the research questions in this research study.

88
Research Setting
Researcher. The researcher in this study was a full-time employee of the School
District of Volusia County which is located in Florida. He served as a curriculum
specialist in the CTE department for at least 12 years. As a curriculum specialist, the
researcher provided support to CTE programs at each of the middle and high schools
within the district. As part of this role, the researcher had access to various school district
datasets which are considered relevant to the job function. Therefore, the researcher had
the ability, as part of normal job duties and responsibilities, to access such data for the
purposes of designing and implementing strategies for program improvement. All
datasets that contain individual student data were stripped of personal identifiers during
the data preparation phase of the research study. All datasets were protected by
electronic passwords during and beyond this research study.
Participants. The target or theoretical population for this research study included
high school students in the United States who attend secondary institutions that offer
career academy experiences to their students (Gall et al., 2007). The accessible
population included students from publicly-funded high schools within the School
District of Volusia County (Gall et al., 2007). Participant data for the first research
question emanate in aggregate form from end-of-year district reports. These data
indicated by gender, race/ethnicity and SES, the number of students enrolled in career
academies by Career Cluster™ areas. The sampling frame for the second and third
research questions included all students enrolled in grades 9-12 across the ten
comprehensive high schools during the 2012-13 academic year and emerged from
computer-generated reports provided by the school district involved in this research study

89
(Fowler, 2009). In this research study, all students attending high school within this
school district served as primary units of analysis for the second research question
(Babbie, 1990).
A convenience sample of approximately 3233 high school students who were
recognized as being actively enrolled and participating in a career academy served as the
focus of the third research question in this research study. These students ranged from
14-18 years of age and were enrolled in grades 9-12 at one of the school district’s 10 high
schools. From this convenience sample, 1549 students were male (47.9%) while 1684
were female (52.1%). Un-weighted grade point averages (GPA) for a sub-group of
students in grades 10-12 spanned from a low of 0.75 to a high of 4.0 on a four-point
grading scale. The mean GPA for this sub-group was 3.13. Students in 9th grade were
not included in the aforementioned grade point calculation as they had not yet completed
their first year of high school. That is, the students in 9th grade lacked a GPA covering an
entire academic year. When including students enrolled in 9th grade, the mean GPA for
the complete research sample of all (3233) career academy students in all grades (9-12)
was 2.78. Furthermore, 463 students (14%) from the full sample of 3233 career academy
participants received some level of Exceptional Student Education (ESE), while 119
students (4%) received support in English Language Learning (ELL) in the four domains
of language learning: (a) listening, (b) speaking, (c) reading, and (d) writing. Moreover,
15 students (.5%) received both ESE and ELL services.
Institutional context. The target population for this research study included high
school students (grades 9-12) enrolled in secondary institutions which offered career
academies as a pathway through the high school experience. The Volusia County School
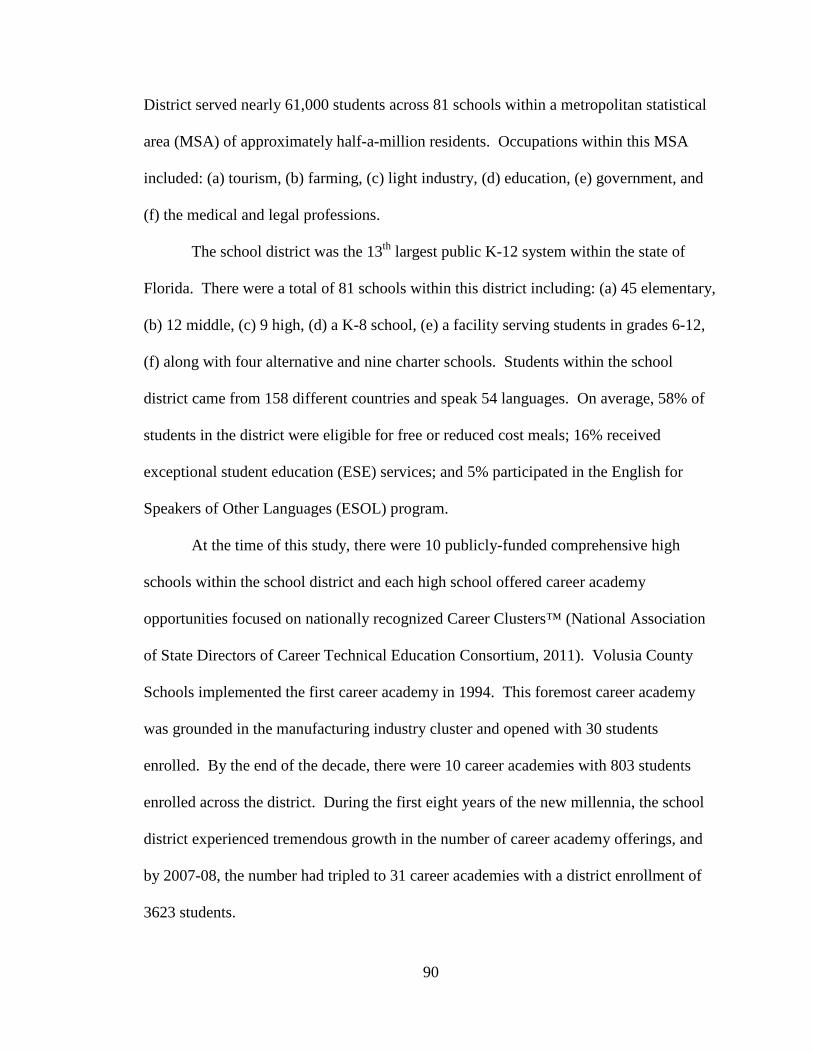
90
District served nearly 61,000 students across 81 schools within a metropolitan statistical
area (MSA) of approximately half-a-million residents. Occupations within this MSA
included: (a) tourism, (b) farming, (c) light industry, (d) education, (e) government, and
(f) the medical and legal professions.
The school district was the 13th largest public K-12 system within the state of
Florida. There were a total of 81 schools within this district including: (a) 45 elementary,
(b) 12 middle, (c) 9 high, (d) a K-8 school, (e) a facility serving students in grades 6-12,
(f) along with four alternative and nine charter schools. Students within the school
district came from 158 different countries and speak 54 languages. On average, 58% of
students in the district were eligible for free or reduced cost meals; 16% received
exceptional student education (ESE) services; and 5% participated in the English for
Speakers of Other Languages (ESOL) program.
At the time of this study, there were 10 publicly-funded comprehensive high
schools within the school district and each high school offered career academy
opportunities focused on nationally recognized Career Clusters™ (National Association
of State Directors of Career Technical Education Consortium, 2011). Volusia County
Schools implemented the first career academy in 1994. This foremost career academy
was grounded in the manufacturing industry cluster and opened with 30 students
enrolled. By the end of the decade, there were 10 career academies with 803 students
enrolled across the district. During the first eight years of the new millennia, the school
district experienced tremendous growth in the number of career academy offerings, and
by 2007-08, the number had tripled to 31 career academies with a district enrollment of
3623 students.

91
At the time of this study, there were a total of 32 career academies throughout the
school district. As of December 18, 2012, there were 17,929 students enrolled in grades
9-12 across the district. Of those, 3233 students (18%) were designated as participating
in a career academy. Demographics for the school district, high school population and
active career academy participants are shown in Table 3.1.
Table 3.1
Enrollment Percentages by District, All High Schools, and Career Academies Enrollment Demographic
Districta (PK-12)
High Schoolsb (9-12)
Career Academiesc (9-12)
Male 51.3 % 50.7 % 47.9 % Female African American American Indian Asian/Pacific Islander Caucasian Hispanic Multi-Racial NSLPd
48.7 % 15.1 % 0.3 % 1.9 % 61.2 % 17.8 % 3.7 %
58.9 %
49.3 % 13.4 % 0.3 % 2.1 % 64.4 % 16.6 % 3.2 % 48.2 %
52.1 % 10.1 % 0.2 % 2.1 % 73.1 % 11.2 % 3.4 % 37.4 %
Note. aDistrict (PK-12) enrollment n = 60,802. bHigh School (9-12) enrollment n = 17,929. cCareer Academies (9-12) enrollment n = 3233. dStudents participating in the National School Lunch Program (NSLP) receive free or reduced cost meals.
Human subjects considerations. In order to conduct research within the Volusia
County School District, a formal request to conduct research was submitted for approval
to the assistant director for assessment and accountability as well as the deputy
superintendent for instructional services. This process required the research candidate to
provide specific information including: (a) statement of the problem, (b) description of
the research (e.g. research design, procedures and statistical treatments), (c) an indication
of the person(s) and time the study would require, along with (d) copies of the research
study abstract, evidence of a literature review, instrument(s) to be used, procedures to
ensure confidentiality, as well as any parental and participant permission forms.

92
In addition to school district protocols, adhered to the University of South Florida
Institutional Review Board (IRB) required processes for conducting an exempt study.
This research study did not involve any human subjects. Existing school district reports
provided the data for this research study. Furthermore, reporting of the research study
findings were only shared through aggregate means in order to ensure no individual’s
information was identifiable (Fowler, 2009). Moreover, the publicly-funded institutions
from which the sample was derived were not named in further efforts to safeguard the
individual’s rights to confidentiality. Finally, at no time during this research study were
experimental procedures for diagnostic treatment purposes conducted on the participants.
Variables
Variables in this research study included both continuous as well as categorical
data and emerged from the data collection process. Categorical variables were dummy
coded in order to prepare the dataset for statistical analysis. As shown in Table 3.2, there
were several categorical independent variables including race/ethnicity, gender, and
socio-economic status.
Race/Ethnicity (independent variable) included persons of African American,
Asian, Caucasian, Hispanic, and multi-racial heritage. The race/ethnicity variable was
dummy coded with five levels and Caucasian served as the reference group. Gender
(independent variable) refers to male or female. The gender variable was dummy coded
with two levels and males served as the reference group.
SES status (independent variable) was determined by free or reduced lunch status.
There were two levels of the SES variable, one for those students who qualified to
receive free or reduced-cost lunches while attending school and a second level for those

93
Table 3.2
Summary of Independent and Dependent Variables by Research Question Question/Variable
Type
Variable Description
Levels
Question #1 Independent Categorical Gender 2 Independent Categorical Race/Ethnicity 5 Independent Categorical Socio-economic Status (SES) 2 Dependent Categorical Career Academy Participant 2
Question #2 Independent Categorical Gender 2 Independent Categorical Race/Ethnicity 5 Independent Categorical Socio-economic Status (SES) 2 Independent Continuous Learning Experience N/A Independent Continuous Prior Performance N/A Dependent Categorical Career Academy Participant 2
Question #3 Independent Categorical Gender 2 Independent Categorical Race/Ethnicity 5 Independent Categorical Socio-economic Status (SES) 2 Independent Continuous Learning Experience N/A Independent Continuous Prior Performance N/A Dependent Categorical Career Academy Participant/Cluster 10
students who do not qualify to receive free or reduced cost meals while at school. SES
was dummy coded with students participating in the National School Lunch Program
(NSLP) serving as the reference group.
In addition, continuous independent variables related to learning experiences
(course taking patterns) and achievement by way of prior performance measures were
also analyzed. Learning experiences constituted a continuous (independent) variable
which documented course-taking patterns related to career exploration at the middle
school level. Participation was measured in terms of semester enrollments. Students in
middle school could typically enroll in up to six semesters of CTE course work.
Recognized courses included those listed under: (a) agriscience education, (b) business

94
technology education, (c) technology education, and (d) family and consumer science
education. Students who took a minimum of one semester of CTE coursework at the
middle school level were considered as having prior learning experience related to career
exploration. Students with less than a semester of middle school CTE coursework were
considered as lacking career-related coursework.
In addition, achievement scores from the Florida Comprehensive Achievement
Test (FCAT) made up the prior performance (independent) continuous variable. These
data included both reading and mathematics achievement scores from research study
participants’ middle school years. Score data was available in both developmental scale
score (DSS) as well as the more popular FCAT level score. The DSS is a raw score
indicating individual achievement on the assessment and ranges from 100-500 for both
the reading and mathematics sections. The DSS is oftentimes converted into the FCAT
level score (1-4) which groups students by achievement level. Level 1 is the lowest
ability while level 4 is recognized as the highest ability grouping.
Participation in a career academy was the dichotomous dependent variable for the
first and second research questions. The dependent variable was dummy coded using
active participation as the reference group. For the purpose of this research study, the
term enrolled students included any student on the list of students officially enrolled in a
recognized career academy, while a participant was defined as an academy student who
had taken at least three credits of the CTE program associated within that career
academy. Participation in a particular career academy designated by Career Cluster™
was the multi-categorical dependent variable for the third research question. In
examining this research question, all career academies offered within the high schools in

95
the participating school district were organized under the Career Cluster™ from which
the career and technical education program emerged. For example, all career academies
which were based on CTE programs which emerged from the Agriculture, Food &
Natural Resources Career Cluster™ were aggregated together under that cluster for
statistical analysis purposes. Although there are sixteen nationally recognized career
clusters, at the time of this study the school district offered 32 career academies across 10
of the 16 national clusters. Participation in the Health Science cluster served as the
reference group. Table 3.3 articulates this clustering of career academies for the purpose
of this research study.
Data Collection
CrossPointe Schools OnLine™ is a fully integrated, complete school administration data
management system used by the school district participating in this research study.
CrossPointe Schools OnLine™ is integrated with a collection of information that is
shared by all components of the system, with transactions affecting the content of the
database processed interactively, and updated in real-time. Data reports can be generated
in a myriad of layouts organized by attendance codes, discipline codes, community
service codes, as well as by school, by program, by time period, or by other locally
defined categories. For this research project, data was collected from the locally
designed Career Academy Progress Monitoring Report which provided data on: (a)
race/ethnicity, (b) gender, attendance, (c) grade point average (GPA), (d) number of
discipline referrals, and (e) community service hour data for a given period in time.
CrossPointe Schools OnLine™ software was used to generate the Career Academy

96
Progress Monitoring Report for each of the 32 career academies within the 10
comprehensive high schools across the school district.
Table 3.3
Listing of 32 District Offered Career Academies Organized by Career Cluster™
Career Cluster™ Career Academy Agriculture, Food & Natural Resources Agriscience
Agriscience, Education, & Communications Environmental Sciences Horticultural, Environmental & Marine Science Plant Biotechnology
Architecture & Construction Building Construction Arts, A/V Technology & Communications
Communications & Arts in Performance Communications & Multimedia Technology Graphic Arts & Design Web & Digital Media
Finance Finance (two career academies) Health Science
Biomedical Health Services Medical Science & Medicine Sports Science & Emergency Services
Hospitality & Tourism
Culinary Arts Culinary Design Hospitality & Culinary Arts
Information Technology
Gaming, Simulation, & Robotics Information Technology & Robotics Simulation & Robotics
Law, Public Safety, Corrections & Security
Law & Government
Marketing
Entertainment & Sports Marketing Entrepreneurship, Marketing & Management Sports Science
Science, Technology, Engineering & Mathematics (STEM)
Design & Manufacturing Technology Drafting & Design Engineering (three career academies)
Note. At the time of this research study, the participating school district did not offer career academies within the following nationally recognized Career Clusters™: (a) Business Management & Administration, (b) Education & Training, (c) Government & Public Administration, (d) Human Services, (e) Manufacturing, or (f) Transportation, Distribution & Logistics.

97
Data on prior learning experiences and performance was also collected through
the CrossPointe Schools OnLine™ software system. Specifically, documentation on
course taking patterns related to career exploration (CTE) during the students’ middle
school years was compiled. In addition, scores from the annual statewide assessment
were also garnered through the CrossPointe Schools OnLine™ software system. Along
with the course taking patterns, these test scores were used to develop a learning
experience and prior performance proxy that was used in the analysis of the third research
question in this study.
Data collection procedures. In order to address the first research question, (to
describe the participation trends in career academies based on demographic variables
including gender, race/ethnicity, and socio-economic status), six-year enrollment data
trends for career academies were assimilated from reports provided by the publicly-
funded school district participating in the research study. Table 3.4 details the population
of high school students enrolled in the school district in each of the six years addressed in
this research question.
Table 3.4
Six-year High School and Career Academy Enrollment Trends School Year High School Population Career Academy Students 2006-07 19,888 3,361 2007-08 19,543 3,623 2008-09 18,868 3,740 2009-10 18,899 3,579 2010-11 18,700 4,545 2011-12 18,730 3,827
Yearly reports for school years 2006-07 through 2011-12 contained aggregate
career academy enrollment data including the categorical independent variables described

98
in this research study and were coupled with the nationally recognized Career Clusters™.
These data were originally collected by the school district via the “career academy
participation” data element within the student master file. This data element has been
part of a comprehensive end-of-year report (Survey 5) required by the state Department
of Education. These data were provided in response to a request through the school
district’s technology services department.
Data for the second and third research questions: (a) to what extent do
demographic, prior learning experience, and performance variables predict participation
in career academies and (b) to what extent do demographic, prior learning experience,
and performance variables predict participation within specific types of career academies
based on Career Clusters™ were also provided by the participating school district. This
dataset was assembled through the district’s CrossPointe Schools OnLine™ software
system. In order to garner this data, the researcher had proper security clearance as well
as login access to the CrossPointe Schools OnLine™ software system. Once logged into
the system, the researcher had responsible access to certain degrees of student-related
information, including access to various enrollment reports and downloads. Three
reports in particular were accessed in order to compile an accurate portrait of career
academy participation. Those reports included: (a) Membership Report which provided
official student counts at designated times during the academic year, (b) Gender/Ethnicity
Report which detailed the student membership by gender and race/ethnicity for each
grade level, (c) the Career Academy Progress Monitoring Report which provided further
detailed information on each student enrolled in a career academy within the school
district. Collection of these data from the 10 high schools participating in this research

99
study took place simultaneously. In addition, data on middle school course taking
patterns and state assessment scores were downloaded and made available to the
researcher. This cross-sectional approach to data collection helped to ensure a consistent
dataset across the research study setting.
Data preparation. There was a process used to ensure the data collected through
the CrossPointe Schools OnLine™ software system was compatible with the data
analysis software. Data was downloaded from CrossPointe Schools OnLine™ software
system into Microsoft Excel where some initial clean up took place. Some of the data
elements contained textual or other non-numerical characters. In addition, lines within
the downloaded reports also contained extraneous information that needed to be cleaned
out prior to importing the data into the data analysis software package. Some variable
fields including gender, race/ethnicity, and SES status also needed to be dummy coded.
Performing this data clean up prior to importing this vast amount of data into the data
analysis software package helped to ensure consistent and accurate statistical analyses.
Dummy coding took place within SPSS.
There were inconsistencies in some variables where data were available for some
of the study participants while lacking for other participants. For example, certain data
elements such as middle school learning experiences or prior performance indicators
were not available for students who attended middle school in another school district.
Research study data for these participants were still included in statistical analyses for
demographic purposes, but were not included in the tests which investigated middle
school predictors. This, in effect, reduced the number of participants in the latter
analyses, but there was still be an acceptable return rate.

100
Data Analysis
Data collected during this research study was analyzed using SPSS (Statistical
Package for the Social Sciences) version 21.0 software. In order to address the first
research question, (describe the participation trends in career academies based on
demographic variables including gender, race/ethnicity, and socio-economic status),
using descriptive statistics, the researcher compared patterns of participation in career
academies from a demographic (gender, race/ethnicity, and SES) perspective. This
analysis focused on aggregate numbers of students and their participation in career
academies as designated by Career Cluster™. Descriptive data, primarily frequency
distributions, were used to describe the base of students who participated in career
academies over the previous six academic years from 2006-07 through 2011-12.
Logistic regression was employed to analyze the data for the second and third
research questions articulated in this research study. Logistic regression is a statistical
regression model used to predict categorical dependent variables based on categorical or
continuous independent variables (Garson, 2012). This is accomplished by transforming
probabilities into logits and then estimating the odds of a certain event occurring versus
not occurring (Pampel, 2000). Logistic regression can also be used to determine the
effect size, as well as to rank the relative importance of the independent variables. The
impact (effect size) of predictor variables are typically explained in terms of “odds ratios”
(Garson, 2012).
In order to address the second research question, (to what extent do demographic,
prior learning experience, and performance variables predict participation in career
academies?) a binary logistic regression was conducted on the independent variables.

101
This statistical analysis allowed the researcher to determine the maximum likelihood
estimation of students from a given gender, racial or ethnic background, or socio-
economic status participating in a career academy. This test also considered prior
learning experience, and performance as continuous variables in the analysis. Maximum
Likelihood Estimation (MLE) is the method used to calculate logit coefficients. MLE
methods seek to maximize the log likelihood (LL) which articulates the odds (how likely
it is) that an observed value (dependent variable) can be predicted by the independent
variables (Garson, 2012; Pampel, 2000). In the analysis for the second research question,
demographic indicators including gender, race/ethnicity, and SES for all (17,929)
students in grades 9-12, along with the continuous variables of learning experience and
prior performance, were entered into SPSS simultaneously with the resulting
dichotomous dependent variable being: (a) career academy participant, or (b) non-career
academy participant.
Addressing the third research question (to what extent do demographic, prior
learning experience, and performance variables predict participation within specific types
of career academies based on Career Clusters™?) required the use of multinomial logistic
regression. Multinomial logistic regression is appropriate when the categorical outcome
has more than two discrete values (Pampel, 2000). In this research question, there are
potentially ten discrete values for the dependent variable. Therefore, multinomial logistic
regression was used to determine any significant differences in measures between groups
of students (based on race/ethnicity, gender, and/or SES, as well as previous learning
experiences and performance) and the career academies in which they choose to
participate (Pampel, 2000). Specifically, in the third question, the researcher sought to

102
understand if students were more likely or less likely to participate in a certain types of
career academies (based on Career Clusters™) relative to the student’s gender,
race/ethnicity, and/or socio-economic status.
Writing and Presentation of Results
Results of this research study have been articulated in the fourth chapter of this
dissertation. Descriptive statistics have been provided as a means to identify and describe
the participants in this research study in terms of the demographic variables. The use of
tables, charts/graphs were employed to illustrate these data findings for the first research
question. Question two and three are addressed separately with findings expressed in
both descriptive and inferential format. Results of question two focused on the data
interpretation of the binary logistic regression analysis and the results of question three
focused on the data interpretation of the multinomial logistic regression analysis. The use
of tables, charts/graphs was also employed to illustrate the findings for the second and
third research questions. Chapter five follows with a summary of the research study,
findings, discussion and conclusions, along with implications for practice and suggestions
for possible future research. After the final dissertation was approved, a manuscript was
developed for submission to appropriate peer-reviewed journals as well as for
presentation at relevant state and national conferences.

103
CHAPTER 4: RESULTS
This chapter articulates the findings and results of this research study. Initially,
descriptive statistics are used to identify and describe enrollment trends in career
academies in terms of gender, race/ethnicity, and socio-economic status demographic
variables over a six-year period from 2007-2012. This initial discussion addresses the
first research question. Next, descriptive statistics are used to describe the research study
participants in terms of demographic variables including gender, race/ethnicity, and
socio-economic status utilized to address research question two. To further address
research question two, the results of a binary logistic regression analysis on the use of
predictor variables (including demographic, prior learning experience and prior
performance) to foretell the likelihood of students to participate in career academies are
presented utilizing inferential statistics. In addition, descriptive statistics are used to
describe the research study participants in terms of demographic variables including
gender, race/ethnicity, and socio-economic status utilized to address research question
three focusing strictly on active career academy students and the career academy clusters
in which they were enrolled. Finally, to specifically address research question three, the
results of a multinomial logistic regression analysis used to predict career academy
participation within specific Career Clusters™ are presented by way of inferential
statistics.

104
Participation Trends in Career Academies
Research question one was concerned with determining the participation trends in
career academies over a recent six-year period (2007-2012) based on demographic
variables including gender, race/ethnicity, and socio-economic status (SES). The findings
from this study illustrate a changing landscape in the population of students who are
participating in career academies at the district level.
In the participating school district, following what had become an annual district-
wide trend of increasing full-time equivalent (FTE) student enrollments, with some years
showing an increase of up to 1000-1200 students per year, the school district began to
realize a loss of student enrollments beginning in the 2006-07 school year. While the
overall school district was experiencing declining enrollments between the years of 2007
to 2012, the number and percentage of students enrolling in career academy experiences
appeared to have risen. Data indicated that during the 2006-07 school year, there were
19,888 students enrolled across nine comprehensive high schools within the school
district (the tenth high school involved in this research study opened for students in the
fall of 2010). Of those, 3,361 students (16.9%) were found enrolled in a career academy.
By the end of the six-year period, overall high school enrollments had declined 5.9% to
18,730; however, there were 3,827 students (20.4%) enrolled in career academies during
that same (2011-12) school year (see Figure 4.1).
Enrollment trends by Career Clusters™. Overall career academy enrollments
increased during the six-years from 2006-07 through 2011-12. Furthermore, enrollments
in career academies tied to the following Career Clusters™ mirrored or exceeded the
overall trend of increasing enrollments: (a) Finance, (b) Health Science, (c) Hospitality &

105
Figure 4.1. Six-year school district enrollment trends of high schools and career academies.
Tourism, and (d) Marketing. As evident in Table 4.1, while Architecture & Construction,
as well as Information Technology related career academies experienced consistent
growth during the first five-years, there was a considerable drop in enrollment during the
sixth year (2011-12). Other Career Clusters™ which experienced decreasing enrollments
in career academies included: (a) Agriculture, Food & Natural Resources, (b)
Government & Public Administration, and (c) Law, Public Safety, Corrections &
Security. Career academies grounded within the Science, Technology, Engineering, and
Math (STEM) Career Cluster™ experienced increasing and decreasing enrollments
indicative of an oscillating pattern.
Enrollment trends by gender. During the 2006-07 school year, with male and
female career academy enrollments at about 50.5% and 49.5% respectively, gender
distribution in career academies mirrored the high school population gender proportions
of 50.3% (male) and 49.7% (female). Moreover, each gender group at the school/district
2006-07 2007-08 2008-09 2009-10 2010-11 2011-12District 19,888 19,543 18,868 18,899 18,700 18,730 Academies 3,361 3,623 3,740 3,579 4,545 3,827
0
5,000
10,000
15,000
20,000
25,000
High
Sch
ool E
nrol
lmen
ts

106
Table 4.1
Six-year Enrollment Trends in Career Academies by Career Cluster™ School Year Career Cluster™ 2006-07 2007-08 2008-09 2009-10 2010-11 2011-12 Agriculture, Food & Natural Resources
377
437
110
168
202
222 Architecture & Construction
69
110
214
420
553
274
Arts, A/V Technology & Communications
526
480
92
91
126
174 Business, Management & Administrationa
20
21
7
Education & Training
30
207
38
174
27
16
Finance 100 122 214 249 326 354 Government & Public Administration and the Law, Public Safety, Corrections & Securityb
652
480
516
65
99
103 Health Science 429 529 569 608 672 618 Hospitality & Tourism
118
140
147
253
412
390
Information Technology
89
143
586
573
622
395
Marketingc 30 46 80 119 Science, Technology, Engineering & Mathematics (STEM)
753
755
1203
925
1426
1162 Note. Data compiled from school district end-of-year reports. aThe career academy in the Business, Management and Administration cluster opened in 2007-08 and then reverted back to a standard CTE program after the 2009-10 school year. bDue to program overlap, career academy enrollments within the Government & Public Administration and the Law, Public Safety, Corrections & Security career clusters were combined. As a result of program changes, these career academies migrated from the GPA cluster to the LPSC&S cluster. cWhile marketing education programs existed in the school district in years prior to 2008-09, none were connected to a career academy until the 2008-09 school year.

107
level was moving closer towards 50.0% over the next two years. However, data from the
third year indicated a change in this trend at the career academy level. That is, when
compared to the overall high school population, the gender gap between male and female
students was more considerable for career academy students.
By 2010-11 male student enrollments accounted for 52.6% of career academy
students but less than 50.9% of the overall high school population. At the same time,
female student enrollments accounted for only 47.4% of career academy students but just
over 49.1% of the high school population. That is, while the gap between genders was
clearly evident within the high school populations, it was more pronounced within the
career academy program enrollments. Interestingly however, by 2011-12 both gender
groups at the school/district level were again moving closer towards 50.0% each while
the gender distribution of career academy students actually inverted and for the first time
within this six-year period, there was a higher proportion of female students (50.8%)
compared to male students (49.2%) enrolled in career academies (see Figure 4.2).
Many Career Cluster™ areas realized shifting enrollment patterns during 2010-
11. In 2006-07, student enrollments in career academies associated with the Finance
cluster were 52.0% female and 48.0% male. The following school year, this difference
expanded on either side by 4.6% (to 56.6% female and 43.4% male) and has remained
relatively consistent since that time. Interestingly, while data from career academies
within the Information Technology cluster initially showed a gender gap of 59.6% (male)
to 40.4% (female) students, during the next year, that gap narrowed to 52.4% and 47.6%
respectively. However, following that single (2007-08) school year, the gender gap again
increased, and by 2011-12 it was 66.6% male to 34.4% female.

108
Figure 4.2. Six-year school district gender trends of high schools and career academies. Data labels show gender proportions for career academy students.
Other Career Cluster™ areas realized enrollment patterns leading to a decrease in
the gender gap. For example, career academies within the Health Science cluster had a
gender spread of 80.2% (female) and 19.8% (male) in 2006-07. By 2008-09, this gap had
been reduced to 69.4% (female) and 30.6% (male) and has remained consistent since that
time. Career academies within both the Marketing cluster as well as the STEM cluster
also experienced a narrowing of the enrollment gender gap. Academies associated with
the Marketing cluster realized a shift in enrollment patterns from 76.7% (female) and
23.3% (male) to 54.6% and 45.4% respectively by 2011-12. Similarly, STEM-related
career academies experienced a reduction in the gender gap from 68.7% (male) and
31.3% (female) in 2006-07 to 54.6% (male) and 45.4% (female) six years later (see Table
4.2). Line graphs within the Appendix (Figures A4 – A15) illustrate gender proportions
over time for career academies across career clusters.
50.5%50.2%
51.4%51.8%
52.6%
49.2%49.5% 49.8%
48.6%48.2%
47.4%
50.8%
47.0%
48.0%
49.0%
50.0%
51.0%
52.0%
53.0%
2006-07 2007-08 2008-09 2009-10 2010-11 2011-12
Perc
enta
ge o
f Stu
dent
s by
Gend
er
School Year
All Academies - Male
All Academies - Female
District High Schools - Male
District High Schools - Female

109
Table 4.2
Six-year Comparisons of Enrollment Trends in Career Academies by Gender and Career Cluster™ 2006-07a,c 2011-12 Career Cluster™ Female Male Female Male Agriculture, Food & Natural Resources 57.3% 42.7% 51.4% 48.6% Architecture & Construction 20.3% 79.7% 15.0% 85.0% Arts, A/V Technology & Communications 28.7% 71.3% 57.5% 42.5% Business, Management & Administrationa 70.0% 30.0% 57.1% 42.9% Education & Training 93.3% 6.7% 87.5% 12.5% Finance 52.0% 48.0% 55.9% 44.1% Government & Public Administration and the Law, Public Safety, Corrections & Securityb
66.8%
33.2%
60.2%
39.8%
Health Science 80.2% 19.8% 68.9% 31.1% Hospitality & Tourism 67.8% 32.2% 67.4% 32.6% Information Technology 40.4% 59.6% 33.4% 66.6% Marketingc 76.7% 23.3% 54.6% 45.4% Science, Technology, Engineering & Mathematics (STEM)
31.3%
68.7%
45.4%
54.6%
Note. Data compiled from school district end-of-year reports. During the 2006-07 school year, there were 1,664 female students and 1,697 male students enrolled in a career academy. During the 2011-12 school year, there were 1,943 female students and 1,884 male students enrolled in a career academy. aThe career academy in the Business, Management and Administration cluster opened in 2007-08 and then reverted back to a standard CTE program after the 2009-10 school year. bDue to program overlap, career academy enrollments within the Government & Public Administration and the Law, Public Safety, Corrections & Security career clusters were combined. As a result of program changes, these career academies migrated from the GPA cluster to the LPSC&S cluster. cWhile marketing education programs existed in the school district in years prior to 2008-09, none were connected to a career academy until the 2008-09 school year.
Enrollment trends by race/ethnicity. As noted in Table 4.3, over the 2007 to
2012 period, the enrollment patterns of Asian, African American, Hispanic and Multi-
Racial students in the district’s career academies increased. In 2006-07, Asian students
made up 1.6% of all high school students in the school district. African American
students made up 13.9% of all high school students. Hispanic students comprised 13.3%,
Multi-Racial students represented 1.9%, and Caucasian students made up 69.0% percent
of all high school students. During the same school year, these groups of students
represented the following proportions of career academy enrollments: (a) Asian, 0.9%,

110
(b) African American, 9.3%, (c) Hispanic, 4.3%, (d) Multi-Racial, 1.6%, and (e)
Caucasian 83.7%.
Table 4.3
Six-Year High School Population and Career Academy Participant Demographics 2006-07 2011-12 Demographics
High Schools
Career Academies
High Schools
Career Academies
N 19,888 3,361 18,730 3,827 Gender Female 49.7% 49.5% 49.8% 50.8% Male 50.3% 50.5% 50.2% 49.2% Race/Ethnicity African American 13.9% 9.3% 13.2% 11.7% American Indian 0.2% 0.3% 0.3% 0.2% Asian 1.6% 0.9% 2.0% 1.9% Caucasian 69.0% 83.7% 64.7% 71.7% Hispanic 13.3% 4.3% 16.8% 11.3% Multi-Racial 1.9% 1.6% 2.9% 3.2% Pacific Islander 0.0% 0.0% 0.1% 0.0% NSLPa Yes 28.3% 23.0% 46.0% 40.7% No 71.7% 77.0% 54.0% 59.3% Note. Data compiled from school district reports. In 2006-07, there were 19,888 students enrolled in grades 9-12 across the school district. During the 2006-07 school year, 3,361 (16.9%) of high school students were also enrolled in career academies. In 2011-12, there were 18,730 students enrolled in grades 9-12 across the school district. During the 2011-12 school year, 3,827 (20.4%) of high school students were also enrolled in career academies. aNSLP is the National School Lunch Program which provides free or low-cost meals to students who are members of families considered to be of lower socio-economic status.
By 2012, the proportion of high school students were reported as: (a) 2.0% Asian,
(b) 13.2% African American, (c) 16.8% Hispanic, (d) 2.9% Multi-Racial, and (e) 64.7%
Caucasian. In comparison, career academy enrollment ratios for the same group of
students in 2012 were: (a) 1.9% Asian, (b) 11.7% African American, (c) 11.3% Hispanic,
(d) 3.2% Multi-Racial, and (e) 71.7% Caucasian.
As shown in Table 4.4, with the exception of those career academies tied to the
Architecture & Construction and Information Technology career clusters, most

111
academies experienced a reduction in the proportion of enrolled Caucasian students.
Consequently, career academies associated with most other Career Clusters™ realized an
increased proportion of students of color during the six-year timeframe being described.
Table 4.4
Six-year Comparison Indicating the Proportion of Students Identified as Caucasian Enrolled in Career Academies by Career Cluster™ Career Cluster™ 2006-07a,c 2011-12 Agriculture, Food & Natural Resources 88.9 80.6 Architecture & Construction 71.0 77.7 Arts, A/V Technology & Communications 84.6 56.9 Business, Management & Administrationa 45.0 14.3 Education & Training 70.0 56.3 Finance 86.0 76.3 Government & Public Administration and the Law, Public Safety, Corrections & Securityb
81.3
64.1
Health Science 78.1 66.2 Hospitality & Tourism 91.5 75.9 Information Technology 71.9 79.7 Marketingc 46.7 44.5 Science, Technology, Engineering & Mathematics (STEM)
85.5
71.8
Note. aThe career academy in the Business, Management and Administration cluster opened in 2007-08 and then reverted back to a standard CTE program after the 2009-10 school year. bDue to program overlap, career academy enrollments within the Government & Public Administration and the Law, Public Safety, Corrections & Security career clusters were combined. As a result of program changes, these career academies migrated from the GPA cluster to the LPSC&S cluster. cWhile marketing education programs existed in the school district in years prior to 2008-09, none were connected to a career academy until the 2008-09 school year.
Over the six-year timeframe, Asian students were better represented in career
academies related to: (a) Arts, A/V Technology & Communications (0.8% to 1.7%), (b)
Finance (1.0% to 4.2%), (c) Health Science (0.9% to 2.3%), (d) Marketing (0.0% to
3.4%), and (e) STEM (0.9% to 2.4%). As shown in Table 4.5, enrollments of Asian
students decreased slightly or held steady with regard to the following career academies:
(a) Agriculture, Food & Natural Resources (1.1% to 0.9%), (b) Architecture &

112
Construction (2.9% to 0.4%), (c) Hospitality & Tourism (0.0% to 0.5%), and (d)
Information Technology (0.0% to 0.5%).
Table 4.5
Six-year Comparison Indicating the Proportion of Students Identified as Asian Enrolled in Career Academies by Career Cluster™ Career Cluster™ 2006-07a,c 2011-12 Agriculture, Food & Natural Resources 1.1 0.9 Architecture & Construction 2.9 0.4 Arts, A/V Technology & Communications 0.8 1.7 Business, Management & Administrationa 0.0 0.0 Education & Training 0.0 0.0 Finance 1.0 4.2 Government & Public Administration and the Law, Public Safety, Corrections & Securityb
1.5
2.9
Health Science 0.9 2.3 Hospitality & Tourism 0.0 0.5 Information Technology 0.0 0.5 Marketingc 0.0 3.4 Science, Technology, Engineering & Mathematics (STEM)
0.9
2.4
Note. aThe career academy in the Business, Management and Administration cluster opened in 2007-08 and then reverted back to a standard CTE program after the 2009-10 school year. bDue to program overlap, career academy enrollments within the Government & Public Administration and the Law, Public Safety, Corrections & Security career clusters were combined. As a result of program changes, these career academies migrated from the GPA cluster to the LPSC&S cluster. cWhile marketing education programs existed in the school district in years prior to 2008-09, none were connected to a career academy until the 2008-09 school year.
African American students also participated to higher degrees in: (a) Education
(16.7% to 31.3%), (b) Health Science (9.8% to 14.7%), (c) Hospitality & Tourism (2.5%
to 12.3%), (d) Law, Public Safety, Corrections & Security (11.6% to 19.4%), (e)
Marketing (13.3% to 17.7%), and (f) STEM (8.9% to 11.9%). As shown in Table 4.6,
there was less participation by African American students in career academies related to:
(a) Architecture & Construction (15.9% to 8.0%), (b) Finance (11.0% to 8.2%), and (c)
Information Technology (22.5% to 10.9%).

113
Similarly, as noted in Table 4.7, career academies within several clusters
experienced increased enrollments of students from Hispanic heritage including: (a)
Agriculture, Food & Natural Resources (2.9% to 12.2%), (b) Architecture &
Construction (7.2% to 10.9%), (c) Arts, A/V Technology & Communications (2.9% to
23.0%), (d) Finance (2.0% to 8.8%), (e) Health Science (8.9% to 13.8%), and (f) STEM
(3.2% to 10.8%). Line graphs within the Appendix (Figures A16 – A35) provide
additional detail on racial/ethnic proportions over time for career academies across career
clusters.
Table 4.6
Six-year Comparison Indicating the Proportion of Students Identified as African American Enrolled in Career Academies by Career Cluster™ Career Cluster™ 2006-07a,c 2011-12 Agriculture, Food & Natural Resources 5.0 3.6 Architecture & Construction 15.9 8.0 Arts, A/V Technology & Communications 9.1 12.6 Business, Management & Administrationa 20.0 14.3 Education & Training 16.7 31.3 Finance 11.0 8.2 Government & Public Administration and the Law, Public Safety, Corrections & Securityb
11.6
19.4
Health Science 9.8 14.7 Hospitality & Tourism 2.5 12.3 Information Technology 22.5 10.9 Marketingc 13.3 17.6 Science, Technology, Engineering & Mathematics (STEM)
8.9
11.9
Note. aThe career academy in the Business, Management and Administration cluster opened in 2007-08 and then reverted back to a standard CTE program after the 2009-10 school year. bDue to program overlap, career academy enrollments within the Government & Public Administration and the Law, Public Safety, Corrections & Security career clusters were combined. As a result of program changes, these career academies migrated from the GPA cluster to the LPSC&S cluster. cWhile marketing education programs existed in the school district in years prior to 2008-09, none were connected to a career academy until the 2008-09 school year.

114
Table 4.7
Six-year Comparison Indicating the Proportion of Students Identified as Hispanic Enrolled in Career Academies by Career Cluster™ Career Cluster™ 2006-07a,c 2011-12 Agriculture, Food & Natural Resources 2.9 12.2 Architecture & Construction 7.2 10.9 Arts, A/V Technology & Communications 2.9 23.0 Business, Management & Administrationa 25.0 42.9 Education & Training 6.7 12.5 Finance 2.0 8.8 Government & Public Administration and the Law, Public Safety, Corrections & Securityb
4.9
8.7
Health Science 8.9 13.8 Hospitality & Tourism 5.1 6.7 Information Technology 4.5 5.1 Marketingc 30.0 31.9 Science, Technology, Engineering & Mathematics (STEM)
3.2
10.8
Note. aThe career academy in the Business, Management and Administration cluster opened in 2007-08 and then reverted back to a standard CTE program after the 2009-10 school year. bDue to program overlap, career academy enrollments within the Government & Public Administration and the Law, Public Safety, Corrections & Security career clusters were combined. As a result of program changes, these career academies migrated from the GPA cluster to the LPSC&S cluster. cWhile marketing education programs existed in the school district in years prior to 2008-09, none were connected to a career academy until the 2008-09 school year.
Enrollment trends by socio-economic status. Students who were eligible for
free/reduced lunch in 2006-07 made up 28.3% of the high school population. By the end
of 2012, that proportion had risen to 46.0%. In comparison, the percentage of career
academy students in 2006-07 who were eligible for free/reduced lunch was 23.0% and by
2012, had reached 40.7%. That is, while the trend line increased nearly parallel to the
district high school average, it was still slightly below the district high school average,
indicating that a higher proportion of economically advantaged students were enrolling in
career academies (see Figure 4.3).
115
Figure 4.3. Six-year school district SES trends of high schools and career academies.
Based on SES in 2006-07, student enrollments in most career academies across
the Career Clusters™ reflected the average level of SES for all career academies (23%)
combined. In other words, in career academies within most of the Career Clusters™,
approximately 23% of enrolled students participated in the National School Lunch
Program (NSLP). However, from 2007 to 2012, the number and proportion of low SES
students enrolled in several of these clusters increased above the district high school
average of 46.0%. That is, in career academies tied to particular career clusters, the
proportion of academy students on free or reduced lunch increased and exceeded the
proportion of students on free or reduced lunch across all high schools (46.0%) in the
district. Those clusters included: (a) Agriculture, Food & Natural Resources at 47.3%,
(b) Arts, A/V Technology & Communications at 52.3%, and (c) Marketing at 62.2% (see
Table 4.8).
23.0% 25.1%
30.5%35.9%
39.8%40.7%
28.3% 29.4%33.4%
40.0%
45.2% 46.0%
0.0%
5.0%
10.0%
15.0%
20.0%
25.0%
30.0%
35.0%
40.0%
45.0%
50.0%
2006-07 2007-08 2008-09 2009-10 2010-11 2011-12Perc
enta
ge o
f Stu
dent
s Elig
ible
for
NSL
P
School Year
All Academies
District High Schools

116
Table 4.8
Six-year Comparison Indicating the Proportion of Career Academy Students Participating in NSLP by Career Cluster™ Career Cluster™ 2006-07a,c 2011-12 Agriculture, Food & Natural Resources 23.3 47.3 Architecture & Construction 23.2 35.8 Arts, A/V Technology & Communications 24.0 52.3 Business, Management & Administrationa 25.0 42.9 Education & Training 43.3 37.5 Finance 6.0 19.8 Government & Public Administration and the Law, Public Safety, Corrections & Securityb
22.6
45.6
Health Science 20.0 44.3 Hospitality & Tourism 3.4 39.5 Information Technology 19.1 36.5 Marketingc 33.8 62.2 Science, Technology, Engineering & Mathematics (STEM)
20.1
42.5
Note. aThe career academy in the Business, Management and Administration cluster opened in 2007-08 and then reverted back to a standard CTE program after the 2009-10 school year. bDue to program overlap, career academy enrollments within the Government & Public Administration and the Law, Public Safety, Corrections & Security career clusters were combined. As a result of program changes, these career academies migrated from the GPA cluster to the LPSC&S cluster. cWhile marketing education programs existed in the school district in years prior to 2008-09, none were connected to a career academy until the 2008-09 school year.
Other clusters which increased their ratio of low-SES students compared to career
academies overall as well as the overall district included: (a) Government & Public
Administration and Law, Public Safety and Security at 45.6%, (b) Health Science at
44.3%, (c) STEM at 42.5%. The following clusters also experienced increases in the
proportion of students from low-SES families: (a) Architecture & Construction at 35.7%,
(b) Finance at 19.8%, and (c) Information Technology at 36.5%. However, the 2012
proportion of students from low-SES families enrolled in these career academies was
slightly lower than both the district (46.0%) as well as overall career academy (40.7%)
averages for SES. Line graphs within the Appendix (Figures A36 – A48) detail SES
proportion trends over time for career academies across career clusters.
117
Predicting Participation in Career Academies
Research question two sought to determine the extent to which demographic,
prior learning experience, and performance variables predict participation in career
academies. To make this determination, the analysis was conducted on data for the 2012-
2013 school year. What follows is a description of student demographics, prior learning
experience as measured by number of semesters of CTE coursework completed in middle
school, and student performance as measured by FCAT scores in eighth grade. Next, the
results of regression analysis are presented.
Student demographics. In 2012-13, the high school population in the school
district participating in this research study included 17, 934 students enrolled across ten
comprehensive high schools. During this year, the school district was predominately
Caucasian (64.4%) with smaller proportions of Hispanic (16.6%), African American
(13.4%), Multi-Racial (3.2%), and Asian (2.0%) students. The gender breakdown was
nearly even at 49.3% female and 50.7% male. Forty-eight percent of the high school
students participated in the National School Lunch Program (NSLP) for free or reduced
cost meals. Approximately 17.9% of the high school students were enrolled in a career
academy during the 2012-13 school year.
As part of the data screening process, the dataset was limited to only those records
that contained scores for both reading and mathematics from the annual state assessment
taken during the student’s eighth grade year – prior to entering high school. These scores
were only available in the original data file if the student took the Florida Comprehensive
Assessment Test (FCAT) in a public school within Volusia County. As a result, 7,230
students were removed from the original (17,934) population.

118
Table 4.9 compares the overall 2012-13 district high school population
demographics of students in grades 9-12 to the sample demographics for the second
research question. After running an initial logistic regression analysis to check for
interaction effects and possible outliers based upon the casewise listing (indicating those
cases with standardized residuals greater than two standard deviations from the mean),
Table 4.9
District High School Population and Demographics for Research Question Two High School
Population Binary Logistic
Regression Sample Demographic N % n % 2013 Population/Sample 17,934 100 10,578 100 Gender Female 8,839 49.3 5,288 50.0 Male 9,095 50.7 5,290 50.0 Race/Ethnicity African American 2,409 13.4 1,365 12.9 American Indian 60 0.3 25 0.2 Asian 357 2.0 202 1.9 Caucasian 11,542 64.4 6,960 65.8 Hispanic 2,978 16.6 1,702 16.1 Multi-Racial 576 3.2 319 3.0 Pacific Islander 12 0.1 5 0.0 NSLPa Yes 8,649 48.2 4,772 45.1 No 9,285 51.8 5,806 54.9 Career Academy Participant Yes 3,206 17.9 2,165 20.5 No 14,728 82.1 8,413 79.5 Note. Data compiled from school district reports. In 2012-13, there were 17,934 students enrolled in grades 9-12 across the school district. A sample of that population 10,578 (59.9%) of high school students were included in the binary logistic regression model. aNSLP is the National School Lunch Program which provides free or low-cost meals to students who are members of families considered to be of lower socio-economic status. 126 outliers were identified and removed from the sample. The final sample to address
research question two was thereby reduced to 10,578 students. This final sample of
participants for this research question were split evenly on gender and 2,165 students
(20%) of the 10,578 sample were determined to be enrolled in a career academy.

119
In terms of career academy participation among the sample of 10,578 students
included in the binary logistic regression model, female students represented 52.8% of
active career academy participants. While African American, Hispanic, and Caucasian
students comprised 12.9%, 16.1% and 65.8% respectively of the sample of 10,578
students included in the binary logistic regression model, as noted in Table 4.10, students
from these groups made up 10.5%, 9.7% and 74.9% of active career academy students
from their respective racial/ethnic backgrounds. Furthermore, while 45.1% of the
students from the sample of 10,578 students included in the binary logistic regression
model received benefits from the free/reduced cost lunch program, only 34.3% of active
career academy students within the sample did so.
Prior learning experience. A comparison of means on the continuous independent
variable for prior learning experience was conducted between all students in the general
population and the 10,578 students sampled for the binary logistic regression analysis of
the second research question. Prior learning experience was measured in terms of the
number of semesters of CTE coursework a student completed while in middle school,
prior to entering high school. When analyzing the entire population of (N = 17,934) high
school students, results indicated that prior to entering high school, students completed an
average of 1.93 semesters of CTE coursework during their middle school years (grades 6-
8). Of those (n = 10,578) students sampled for the analysis of who participates in career
academies, the mean number of semesters of CTE coursework taken at the middle school
level was 2.24. Further comparison showed for the 2,165 students within this sample
actively enrolled in career academies, the mean number of semesters of CTE coursework
taken during middle school was 2.46. As shown in Table 4.11, the mean number of

120
semesters of CTE coursework taken by non career academy participants was found to be
less than the sample group mean overall (2.19 semester credits).
Table 4.10
Sample Demographics by Career Academy Participant/Non-Participant Career Academy Students Participant Non-Participant Demographics n % n % Sample 2,165 20.5 8,413 79.5 Gender Female 1,143 52.8 4,145 49.3 Male 1.022 47.2 4,268 50.7 Race/Ethnicity African American 228 10.5 1,137 13.5 American Indian 2 0.1 23 0.3 Asian 34 1.6 168 2.0 Caucasian 1,621 74.9 5,339 63.5 Hispanic 209 9.7 1,493 17.7 Multi-Racial 71 3.3 248 2.9 Pacific Islander 0 0.0 5 0.1 NSLPa Yes 742 34.3 4,030 47.9 No 1,423 65.7 4,383 52.1 Note. Data compiled from school district reports. The sample of 10,578 high school students included in the binary logistic regression model were further broken down into career academy participants, n=2,165 (20.5%), and non-participants, n=8,413 (79.5%). aNSLP is the National School Lunch Program which provides free or low-cost meals to students who are members of families considered to be of lower socio-economic status.
Table 4.11
Mean Number of Semesters of CTE Coursework Taken in Middle School
Group M SD Min Max N High School Population 1.93 1.85 0 8 17,934 Binary Logistic Regression Sample
2.24
1.82
0
8
10,578
Career Academy Participant 2.46 1.83 0 8 2,165 Non-Participant 2.19 1.82 0 8 8,413

121
Prior performance measures. A comparison of means on FCAT scores as prior
performance was also conducted between all students in the general population and those
students sampled for analysis who participated in career academies. Scores from the
annual state assessment (i.e., FCAT) taken while the students were enrolled in eighth
grade were used in this comparison. The mean score on the annual state assessment in
reading for all students in the population (N = 17,934) was 315.86 and the mean score in
mathematics taken the same year was 324.52. The mean reading and mathematics scores
for the students (n = 10,578) sampled for analysis who participated in career academies
were 316.36 and 324.93, respectively. Furthermore, as evident in Table 4.12, data for
students actively enrolled in career academies demonstrated mean reading and
mathematics scores of 332.29 and 339.86. Mean scores for students within the sample
for research question two who were not enrolled in a career academy was slightly lower
than the overall sample group mean.
Testing of predictors of participation in career academies. The binary logistic
regression analysis was employed in an effort to determine the likelihood of students
enrolling in career academies based upon distinct predictors. Those predictors included
demographic characteristics along with measures of prior learning experience (prior CTE
coursework) as well as prior performance (FCAT scores) on statewide assessments. To
set the context for the related results, it is important to note that binary logistic regression
does not assume that a linear relationship exists between the independent and dependent
variables. The independent variables are not required to be measurable in interval scales
nor are they required to be normally distributed. In addition, they do not need to be
linearly related or of equal variance within each group.

122
Table 4.12
Mean Scores on FCAT Reading and Mathematics in Middle School (8th grade)
Group M SD Min Max N Reading Scores Population 315.86 46.40 100 500 17,934 Sample 316.36 46.20 100 500 10,578 Career Academy Participant 332.29 34.91 100 500 2,165 Non-Participant 312.26 47.84 100 500
8,413
Mathematics Scores Population 324.52 40.61 100 500 17,934 Sample 324.93 40.44 100 500 10,578 Career Academy Participant 339.86 27.20 101 500 2,165 Non-Participant 321.09 42.35 100 500 8,413
Further, the groups (categories) must be mutually exclusive—a case can only
belong to one group and each case must be a member of one of the groups. Finally, the
dependent variable is dichotomous and each case must belong to one or the other
dependent values.
In this context and in response to research question two, (to what extent do
demographic, prior learning experience, and performance variables predict participation
in career academies), the criterion variable (career academy participation) was regressed
on the predictor variables which included: (a) gender, (b) race/ethnicity, (c) SES, (d) prior
learning experience, and (e) prior performance. The full model was found to be
statistically significant (χ2(18) = 602.86, p < .001), indicating that the predictors in the
model significantly explained career academy participation (See Table 4.13).

123
Table 4.13
Career Academy Participants Binary Logistic Regression Model Goodness of Fit - Omnibus
Omnibus Tests of Model Coefficients Chi-square df Sig. Step 1 Step 602.86 18 .000 Block 602.86 18 .000 Model 602.86 18 .000
However, as suggested in Table 4.14, Cox & Snell’s Pseudo R2 (.055) as well as
Nagelkerke’s Pseudo R2 (.087) indicated less than 9% of the variance in the dependent
variable could be explained by the independent demographic, prior learning experience,
and/or performance variables. Therefore, the model summary statistics indicated the
model exhibited a weak relationship between the predictor variables and the outcome.
Table 4.14
Career Academy Participants Binary Logistic Regression Model Goodness of Fit – Log Likelihood
Model Summary Step -2 Log likelihood Cox & Snell R2 Nagelkerke R2 1 10119.18 .055 .087
The Hosmer and Lemeshow Test (Table 4.15) also pointed toward a significant
chi-square result further indicating the data did not fit the model well. Albeit the model
summary statistics, along with the statistics from the Hosmer and Lemeshow Test,
indicated a weak model, several of the findings in this study were found to be significant
and therefore were reported as such. Significant predictor variables of career academy

124
Table 4.15
Career Academy Participants Binary Logistic Regression Model Goodness of Fit – Hosmer & Lemeshow
Hosmer and Lemeshow Test Step Chi-square df Sig. 1 177.28 8 .000
participation included: (a) gender for female students, (b) race/ethnicity in particular for
Asian and Hispanic students, (c) SES for higher advantaged families, (d) prior learning
experience, (e) prior performance in reading and/or mathematics, along with the
following interaction effects: (a) gender and race, (b) gender/female and race/Hispanic,
(c) gender/female and SES/no.
Results of this analysis suggested that in comparison to males, with a regression
coefficient (B) of .258 and with an odds ratio of 1.294, p < .01, female students were
29.4% (or 1.3 times) more likely than male students to enroll in career academies.
Regarding race and ethnicity, compared to Caucasians, students of Hispanic heritage
were 55.6% less likely to enroll in career academies (odds ratio = .444, p < .001).
Compared to Caucasians, students of Asian ethnicity were also 43.1% less likely to enroll
in career academies (odds ratio = .569, p < .05). In terms of interaction between gender
and race/ethnicity, with an indicated odds ratio of 1.778, p = .001, female Hispanic
students were found to be 77.8% (or 1.78 times) more likely to enroll in a career academy
than their male Hispanic counterparts. Regarding socio-economic status, with an odds
ratio of 1.509, p < .001, students with higher economic advantage were 50.9% (or 1.51
times) more likely to enroll in career academies compared to students of lower socio-
economic status. However, females who were higher SES students, were 23.6% less
likely to enroll in a career academy (odds ratio = .764, p < .05).

125
Turning to significant continuous variables, students who participated in one
semester of CTE coursework at the middle school level were 7.4% more likely to enroll
in a career academy compared to students who did not take CTE coursework in middle
school. In other words, the likelihood of a student enrolling in a career academy
increased by 7.4% for each unit increase in the number of semesters of CTE coursework
that student completed at the middle school level (odds ratio = 1.074, p < .001).
Following suit, for every unit increase in the reading scale score a student earned on the
state assessment at the middle school level, the odds were 1.003, p < .001, or three-tenths
of one percent greater they would enroll in a career academy. Likewise, for mathematics,
for every unit increase in the mathematics scale score a student earned on the state
assessment at the middle school level, the odds were 1.010, p < .001, or one percent
greater they would enroll in a career academy. See Table 4.16 for further details on
predictor variables included in the equation.
Prediction of Participation by Type of Career Academy
Research question three sought to further determine the extent to which
demographic, prior learning experience, and performance variables predict participation
within specific types of career academies (based upon Career Clusters™). To set the
context for the presentation of results, what follows is a description of student
demographics, prior learning experience as measured by number of semesters of CTE
coursework completed in middle school, and student performance as measured by FCAT
scores in eighth grade. The focus of the description is on the sample of students
participating in career academies. Next, the corresponding results of regression analysis
are presented.

126
Table 4.16
Predictor Variables in the Equation for Binary Logistic Regression Addressing the Likelihood of Students to Enroll in Career Academies Variable/Level B S.E. Wald df Sig. Exp(B) Gender (Female) .26 .10 7.03 1 .01 1.29 Race (Caucasian) 43.65 6 .00 Asian -.56 .26 4.64 1 .03 .57 African American .01 .13 .01 1 .92 1.01 Hispanic -.81 .13 38.88 1 .00 .44 American Indian .03 .81 .00 1 .97 1.03 Multi-Racial -.03 .22 .02 1 .89 .97 Pacific Islander -20.19 27199.96 .000 1 1.00 .00 NSLPa (No) .41 .08 27.07 1 .00 1.51 Gender * Race 12.16 6 .06 Female Asian -.17 .39 .18 1 .67 .85 Female African American .11 .17 .42 1 .52 1.11 Female Hispanic .58 .17 11.60 1 .00 1.78 Female American Indian -19.91 10437.16 .00 1 1.00 .00 Female Multi-Racial .21 .29 .52 1 .47 1.23 Female Pacific Islander 1.12 34835.41 .00 1 1.00 3.05 Female * NSLP (No) -.27 .12 6.20 1 .01 .76 Semester Counts .07 .01 27.05 1 .00 1.07 Reading Scale Score .00 .00 15.25 1 .00 1.00 Math Scale Score .01 .00 91.33 1 .00 1.01 Constant -6.15 .27 521.77 1 .00 .00 Note. Data compiled from school district reports. Reference groups are included in parentheses. aNSLP is the National School Lunch Program which provides free or low-cost meals to students who are members of families considered to be of lower socio-economic status. The reference group for this variable includes those students who participated in the NSLP.
Student demographics. The population in the school district participating in this
research study included 17, 934 students enrolled across 10 comprehensive high schools.
Approximately 3,200 students (18% of the high school population) were determined to be
enrolled in a career academy during the 2012-13 school year. Table 4.17 compares the
overall district high school population demographics of students in grades 9-12 to the
demographics for students enrolled in career academies.

127
Table 4.17
District High School Population and Career Academy Sample Demographics High School
Population Career Academy
Sample Demographic N % n % Population/Sample 17,934 100 3,206 100 Gender Female 8,839 49.3 1,672 52.2 Male 9,095 50.7 1,534 47.8 Race/Ethnicity African American 2,409 13.4 320 10.0 American Indian 60 0.3 5 0.2 Asian 357 2.0 67 2.1 Caucasian 11,542 64.4 2,346 73.2 Hispanic 2,978 16.6 359 11.2 Multi-Racial 576 3.2 108 3.4 Pacific Islander 12 0.1 1 0.0 NSLPa Yes 8,649 48.2 1,199 37.4 No 9,285 51.8 2,007 62.6 Note. Data compiled from school district reports. aNSLP is the National School Lunch Program which provides free or low-cost meals to students who are members of families considered to be of lower socio-economic status.
Table 4.18 describes the gender composition of career academy students by
Career Cluster™. Female students made up higher proportions of career academy
enrolled membership within the following Career Clusters™: (a) Agriculture, Food &
Natural Resources (61.7%), (b) Health Science (74.7%), and Hospitality & Tourism
(70.0%). Male students made up higher proportions of career academy enrolled
membership within the following Career Clusters™: (a) Architecture & Construction
(96.8%), (b) Information Technology (83.7%), and Science, Technology, Engineering, &
Mathematics (84.7%).
When surveying enrollments in the various Career Clusters™ to determine which
clusters attracted higher proportions of students indentified by racial or ethnic grouping,
data indicated African American students made up 26.5% of the students enrolled in

128
Table 4.18
Career Academy Demographics – Gender by Career Cluster™
Female Male Career Cluster™ n % n % Agriculture, Food & Natural Resources
214 61.7% 133 38.3%
Architecture & Construction 1 3.2% 30 96.8% Arts, A/V Technology & Communications
95
53.1%
84
46.9%
Finance 188 56.1% 147 43.9% Health Science 716 74.7% 242 25.3% Hospitality & Tourism 205 70.0% 88 30.0% Information Technology 51 16.3% 262 83.7% Law, Public Safety, Corrections & Security
52
53.6%
45
46.4%
Marketing 76 44.7% 94 55.3% Science, Technology, Engineering & Mathematics (STEM)
74
15.3%
409
84.7%
career academies within the Marketing cluster along with 13.3% of students enrolled in
Health Science academies. Asian students comprised 3.6% of those students enrolled in
Finance career academies. Hispanic students made up 22.6% of students enrolled in
Architecture & Construction related career academies as well as 15.9% of students
enrolled in Health Science academies. Multi-Racial students comprised 5.9% of those
students in the Marketing cluster. Caucasian students filled 83.9% and 82.2% of the seats
within the Agriculture, Food & Natural Resources and the STEM career academies
respectively. When compared to the overall career academy sample, each of these
statistics reflect higher proportions of students from each respective group. Table 4.19
elucidates the racial/ethnic structure of career academy students.

129
Table 4.19
Career Academy Demographics – Race/Ethnicity by Career Cluster™
Percentage of Students in Career Academies by Career Cluster™ Career Cluster™
African American
Asian
Caucasian
Hispanic
Multi-Racial
Agriculture, Food & Natural Resources
2.0%
1.4%
83.9%
8.9%
3.2% Architecture & Construction
3.2% 0.0% 74.2% 22.6% 0.0%
Arts, A/V Technology & Communications
10.1%
1.1%
72.6%
12.3%
3.4% Finance 7.5% 3.6% 78.8% 8.4% 1.8% Health Science 13.3% 3.1% 64.0% 15.9% 3.7% Hospitality & Tourism
9.9%
0.0%
78.5%
7.2%
4.1%
Information Technology
8.3%
2.2%
75.4%
10.9%
3.2%
Law, Public Safety, Corrections & Security
11.3%
3.1%
74.2%
8.2%
3.1% Marketing 26.5% 1.2% 52.9% 13.5% 5.9% Science, Technology, Engineering & Mathematics (STEM)
6.4%
1.2%
82.2%
6.8%
3.1%
Table 4.20 reveals the proportions of career academy students who participated in
the National School Lunch Program differentiated by Career Cluster™. Career
academies within the Finance Career Cluster™ enrolled the highest proportion (80%) of
economically advantaged students (not participating in the NSLP), while career
academies within the Marketing cluster were evenly split with half the students (50%)
enrolled participating in the NSLP and half the students (50%) not participating in the
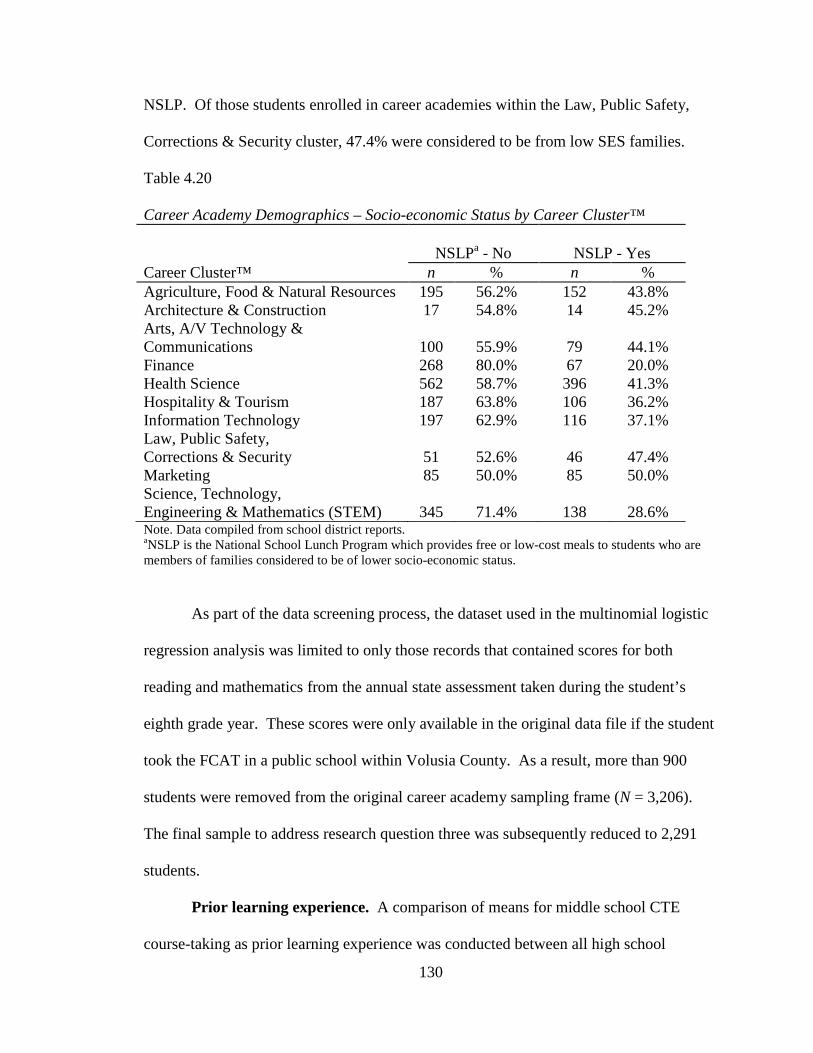
130
NSLP. Of those students enrolled in career academies within the Law, Public Safety,
Corrections & Security cluster, 47.4% were considered to be from low SES families.
Table 4.20
Career Academy Demographics – Socio-economic Status by Career Cluster™
NSLPa - No NSLP - Yes Career Cluster™ n % n % Agriculture, Food & Natural Resources 195 56.2% 152 43.8% Architecture & Construction 17 54.8% 14 45.2% Arts, A/V Technology & Communications
100
55.9%
79
44.1%
Finance 268 80.0% 67 20.0% Health Science 562 58.7% 396 41.3% Hospitality & Tourism 187 63.8% 106 36.2% Information Technology 197 62.9% 116 37.1% Law, Public Safety, Corrections & Security
51
52.6%
46
47.4%
Marketing 85 50.0% 85 50.0% Science, Technology, Engineering & Mathematics (STEM)
345
71.4%
138
28.6%
Note. Data compiled from school district reports. aNSLP is the National School Lunch Program which provides free or low-cost meals to students who are members of families considered to be of lower socio-economic status.
As part of the data screening process, the dataset used in the multinomial logistic
regression analysis was limited to only those records that contained scores for both
reading and mathematics from the annual state assessment taken during the student’s
eighth grade year. These scores were only available in the original data file if the student
took the FCAT in a public school within Volusia County. As a result, more than 900
students were removed from the original career academy sampling frame (N = 3,206).
The final sample to address research question three was subsequently reduced to 2,291
students.
Prior learning experience. A comparison of means for middle school CTE
course-taking as prior learning experience was conducted between all high school

131
students in the general population and those students sampled for analysis of the third
research question (to what extent do demographic, prior learning experience, and
performance variables predict participation within specific types of career academies
based upon Career Clusters™). When analyzing the entire population of high school
students (N = 17,934), results indicated that prior to entering high school, students
completed an average of 1.93 semesters of CTE coursework during their middle school
years (grades 6-8). Of those students (n = 2,291) sampled for analysis of the third
research question, the mean number of semesters of CTE coursework taken at the middle
school level was 2.41 as shown in Table 4.21.
Table 4.21
Mean Number of Semesters of CTE Coursework Taken in Middle School
Group M SD Min Max N High School Population
1.93
1.85
0
8
17,934
Career Academy Sample
2.41
1.82
0
8
2,291
A comparison of means for FCAT scores as prior performance was also
conducted between all students in the general population and those students sampled for
analysis of the third research question. Scores from the annual state assessment (i.e.,
FCAT) taken while the students were enrolled in eighth grade were used in this
comparison. The mean score on the annual state assessment in reading for all students in
the population (N =17,934) was 315.86 and the mean score in math taken the same year
was 324.52. As shown in Table 4.22, the mean reading and mathematics scores for the
students enrolled in career academies (n = 2,291) sampled for analysis to determine the
extent demographic, prior learning experience, and performance variables can predict

132
participation in specific career academies were found to be 329.09 and 337.11,
respectively.
Table 4.22
Mean Scores on FCAT Reading and Mathematics in Middle School (8th grade) Group M SD Min Max N FCAT Reading Scores High School Population
315.86
46.40
100
500
17,934
Career Academy Sample
329.09
37.88
100
500
2,291
FCAT Mathematics Scores High School Population
324.52
40.61
100
500
17,934
Career Academy Sample
337.11
30.28
101
500
2,291
Health science: Reference group demographics. The career academies
grounded within the Health Science Career Cluster™ demonstrated the highest total
enrollment of all clusters (n = 958 out of 3,206). After removing those cases lacking
prior performance data, the health science career academies maintained 670 students of
the 2,291 sample used to address research question three. As such, this cluster was
chosen to serve as the reference group for the multinomial logistic regression analysis in
research question three. SPSS statistical analysis output does not include the reference
group data. Thus, Table 4.23 provides reference group demographics, and Table 4.24
provides reference group data on prior learning experiences (mean number of semesters
of CTE coursework completed during middle school years) as well as prior performance
(eighth grade mean FCAT scores in reading and mathematics).

133
Table 4.23
Career Academy Sample and Health Science (Reference Group) Demographics Career Academy
Sample Health Science
Reference Group Demographic n % n % Career Academy Sample
2,291
100
670
100
Gender Female 1,190 51.9 495 73.9 Male 1,101 48.1 175 26.1 Race/Ethnicity African American 243 10.6 83 12.4 Asian 41 1.8 17 2.5 Caucasian 1,651 72.1 437 65.2 Hispanic 278 12.1 107 16.0 Multi-Racial 74 3.2 26 3.9 NSLPa Yes 850 37.1 264 39.4 No 1,441 62.9 406 60.6 Note. Data compiled from school district reports. aNSLP is the National School Lunch Program which provides free or low-cost meals to students who are members of families considered to be of lower socio-economic status.
Table 4.24
Health Science (Reference Group) Sample Means for Prior Learning & Performance Variable M SD Min Max n Middle School CTE 2.13 1.73 0 8 670 FCAT Reading Scores 331.96 35.86 100 500 670 FCAT Mathematics Scores 337.09 28.87 211 500 670
Testing predictors of participation by type of career academy. The
multinomial logistic regression analysis was employed in an effort to determine the
likelihood students would enroll in specific career academies related to specific Career
Clusters™. The predictor variables included demographic characteristics along with
measures of prior learning experience (prior CTE coursework) as well as prior
performance (FCAT scores) on statewide assessments. Multinomial logistic regression
allows for more than two discreet outcomes and was chosen for this analysis due to the

134
fact that the dependent variable had 10 possible categories. In addition, the independent
variables for this analysis were a mix of both categorical and continuous variables. The
categorical independents were entered into the model as factors and the continuous
independents were entered as covariates.
Multinomial logistic regression assumes data are case specific. That is to say,
each independent variable has a single value for each case and that there are no missing
cases. Multinomial logistic regression also assumes the dependent variable cannot be
perfectly predicted from the independent variables for any given case. Furthermore,
multicollinearity is assumed to be low, as it becomes increasingly more difficult to
differentiate between the contributions of multiple independent variables if they are
found to be highly correlated. Finally, large sample sizes are also assumed when running
multiple logistic regression analyses.
Thus, to address research question three, the criterion variable (Career Cluster™)
was regressed on the predictor variables which included: (a) gender, (b) race/ethnicity, (c)
SES, (d) prior learning experience, and (e) prior performance. Two models of
multinomial logistic regression were run during the analyses. The first model analyzed
the main effects while the second was a full factorial model seeking to determine if any
interaction effects existed between the categorical independent variables.
By examining the model fitting information (Table 4.25), the (main effects)
model that included the predictors: (a) gender, (b) race/ethnicity, (c) SES, (d) prior
learning experience, and (e) prior performance, produced a -2 log likelihood of 8536.44
compared to the intercept only model -2 log likelihood of 9465.13. This indicated that
when compared to the null model, the final model demonstrated an improvement in fit

135
due to the explanatory variables. Furthermore, the statistics indicated this final model
with predictor variables was a significant (p < .001) improvement over the null model.
Table 4.25
Model Fitting Information for Multinomial Logistic Regression Analysis Likelihood Ratio Tests Model -2 Log likelihood Chi-square df Sig. Intercept Only 9465.13 Final 8536.44 928.69 90 .000
Statistics from the goodness-of-fit (Table 4.26) showed a significance of 1.00; and
where p > .05, the indication is that this model adequately fit the data.
Table 4.26
Goodness of Fit Information for Multinomial Logistic Regression Analysis Goodness of Fit
Chi-square df Sig. Pearson 19471.34 20457 1.00 Deviance 8528.12 20457 1.00
In addition, the Cox & Snell and the Nagelkerke Pseudo R2 indicators in Table
4.27 suggest that approximately 34% of the variance could be explained by way of the
demographic, prior learning experience and prior performance predictor variables.
Table 4.27
Pseudo R2 for Multinomial Logistic Regression Analysis Pseudo R-Square
Cox and Snell .33 Nagelkerke .34 McFadden .10
Moreover, as shown in Table 4.28, the likelihood ratio tests also indicated all
predictors were significant (p < .05).

136
Table 4.28
Likelihood Ratio Tests for Multinomial Logistic Regression Analysis Likelihood Ratio Tests Effect -2 Log likelihood Chi-square df Sig. Intercept 8536.44 .00 0 . Semester Counts 8653.71 117.27 9 .000 Reading Scale Score 8557.37 20.93 9 .013 Math Scale Score 8587.24 50.80 9 .000 Gender 9007.89 471.45 9 .000 Race 8655.06 118.62 45 .000 NSLP 8568.44 32.00 9 .000
Participation in the Agriculture, Food & Natural Resources cluster. Significant
predictors of students enrolling in a career academy tied to the Agriculture, Food &
Natural Resources Career Cluster™ compared to participating in career academies tied to
the Health Science Career Cluster™ included: (a) gender, (b) race/ethnicity, (c) prior
learning experience, and (d) prior performance. Socio-economic status was not a
significant predictor of students participating within career academies tied to the
Agriculture, Food & Natural Resources Career Cluster™.
Results of this research study suggested that in comparison to males, female
students were 34.2% less likely to participate in career academies tied to the Agriculture,
Food & Natural Resources Career Cluster™ (odds ratio = .658, p < .05). Inverting the
odds for easier interpretation, male students were 1.52 times more likely to enroll in a
career academy tied to Health Science (reference) than female students were to enroll in a
career academy tied to the Agriculture, Food & Natural Resources Career Cluster™.
With regard to race and ethnicity, African American students (odds ratios = .088,
p < .001) as well as Hispanic students (odds ratios = .520, p < .01) were 91.2% and
48.0%, respectively, less likely than Caucasian students to enroll in career academies tied

137
to the Agriculture, Food & Natural Resources Career Cluster™. Again, inverting the
odds for easier interpretation, data indicated that Caucasian students were 11.36 times
more likely to enroll in a career academy tied to the cluster as African American students
and 1.92 times more likely than Hispanic students to enroll in this cluster.
Students who completed at least one semester of CTE coursework during their
middle school experience were 47.9%, (or nearly one and a half times) more likely to
enroll in career academies tied to the Agriculture, Food & Natural Resources Career
Cluster™ compared to students who lacked at least a semester of CTE experience in
middle school (odds ratio = 1.479, p < .001). However, for every unit (point) increase in
a student’s FCAT mathematics score, participation in career academies tied to the
Agriculture, Food & Natural Resources Career Cluster™ was 1.0% less likely (odds ratio
= .990, p < .01). In terms of interaction, Hispanic female students were also found to be
82.9% less likely than Caucasian female students to enroll in career academies tied to the
Agriculture, Food & Natural Resources Career Cluster™ (odds ratio = .171, p < .05). In
other words, when compared to Hispanic female students enrolled in a career academy
connected to Agriculture, Food & Natural Resources, Caucasian female students were
5.85 times more likely to enroll in a career academy connected to Health Science.
Architecture & Construction cluster. Significant predictors of students enrolling
in a career academy tied to the Architecture & Construction Career Cluster™ compared
to participating in career academies tied to the Health Science Career Cluster™ included
gender and prior learning experience. Non-significant predictors included: (a)
race/ethnicity, (b) prior performance, and (c) socio-economic status.

138
Results from this research study suggested that in comparison to males, female
students were 98.5% less likely to participate in career academies tied to the Architecture
& Construction Career Cluster™ (odds ratio = .015, p < .001). Inverting the odds for
easier interpretation, male students were 66.66 times more likely than female students to
enroll in a career academy tied to the Architecture & Construction Career Cluster™.
In contrast, students who completed at least a semester of CTE coursework during
their middle school experience were 24.4% (or one and a quarter times) more likely to
enroll in career academies tied to the Architecture & Construction Career Cluster™ (odds
ratio = 1.244, p < .05).
Arts, A/V Technology & Communications cluster. Significant predictors of
students enrolling in a career academy tied to the Arts, A/V Technology &
Communications Career Cluster™ compared to participating in career academies tied to
the Health Science Career Cluster™ only included gender from the main effects analysis.
Non-significant predictors included: (a) race/ethnicity, (b) prior learning experience, (c)
prior performance, and (d) socio-economic status.
Results from this research study suggested that in comparison to males, female
students were 57% less likely to participate in career academies tied to the Arts, A/V
Technology & Communications Career Cluster™ (odds ratio = .430, p < .001). Inverting
the odds for easier interpretation, male students were 2.33 times more likely than female
students to enroll in a career academy tied to the Arts, A/V Technology &
Communications Career Cluster™. Moreover, statistics from the full factorial analysis
further suggested that both African American female students (odds ratio = .123, p < .05)
and Hispanic female students (odds ratio = .175, p < .05) were found to be (87.7% and

139
82.5% respectively) less likely to enroll in career academies tied to the Arts, A/V
Technology & Communications Career Cluster™. Said another way, Caucasian female
students were 8.13 times more likely to enroll in career academies tied to the Health
Science cluster than African American female students to enroll in career academies tied
to the Arts, A/V Technology & Communications Career Cluster™. Caucasian female
students were also 5.71 times more likely to enroll in career academies tied to the Health
Science cluster than Hispanic female students to enroll in career academies tied to the
Arts, A/V Technology & Communications Career Cluster™.
Finance cluster. Significant predictors of students enrolling in a career academy
tied to the Finance Career Cluster™ compared to participating in career academies tied to
the Health Science Career Cluster™ included gender and socio-economic status. Non-
significant predictors included: (a) race/ethnicity, (b) prior learning experience, and (c)
prior performance.
The results suggested that in comparison to males, female students were 57.2%
less likely to participate in career academies tied to the Finance Career Cluster™ (odds
ratio = .428, p < .001). That is, male students were 2.34 times more likely than female
students to enroll in career academies tied to the Finance cluster. In terms of economic
advantage, when compared to students from low SES families, students who did not
participate in the NSLP were 83.6% (or 1.84 times) more likely to enroll in career
academies tied to the Finance Career Cluster™ (odds ratio = 1.836, p = .001). In
addition, statistics from the full factorial analysis further suggested the odds ratio for
female students to be .160, p < 001; while female students who did not participate in the
NSLP had odds ratios of 3.109, p < .05. That is to say, while female students in general

140
were less likely to enroll in career academies tied to the Finance Career Cluster™, female
students who specifically did not participate in the NSLP program were more likely
(three times more likely) to participate in career academies tied to the Finance Career
Cluster™. However, Hispanic female students who did not participate in the NSLP were
found to be 91.1% less likely to participate in career academies tied to the Finance cluster
(odds ratio = .089, p < .05). In other words, Hispanic female students who did participate
in NSLP, were 11.24 times more likely to enroll in career academies related to Health
Science compared to Hispanic female students who did not participate in NSLP and who
were enrolled in career academies tied to finance.
Hospitality & Tourism cluster. Significant predictors of students enrolling in a
career academy tied to the Hospitality & Tourism Career Cluster™ compared to
participating in career academies tied to the Health Science Career Cluster™ included
race/ethnicity and prior performance indicators. Non-significant predictors included: (a)
gender, (b) prior learning experience, and (c) socio-economic status.
Results from this research study suggested that Hispanic students were 56.0% less
likely to enroll in career academies tied to the Hospitality & Tourism Career Cluster™
(odds ratio = .440, p < .01). Inverting the odds, Caucasian students were 2.27 times more
likely than Hispanic students to enroll in a career academy tied to the cluster. In addition,
for every unit (point) increase in a student’s FCAT reading score, participation in career
academies tied to the Hospitality & Tourism Career Cluster™ was also 1.0% less likely
(odds ratio = .990, p = .001).
Information Technology cluster. Significant predictors of students enrolling in a
career academy tied to the Information Technology Career Cluster™ compared to
141
participating in career academies tied to the Health Science Career Cluster™ included
only gender. Non-significant predictors included: (a) race/ethnicity, (b) prior learning
experience, (c) prior performance, and (d) socio-economic status. Results from this
research study suggested that in comparison to males, female students were 93.1% less
likely to participate in career academies tied to the Information Technology Career
Cluster™ (odds ratio = .069, p < .001). Male students were 14.49 times more likely than
female students to be enrolled in a career academy related to information technology.
Law, Public Safety, Corrections & Security cluster. Significant predictors of
students enrolling in a career academy tied to the Law, Public Safety, Corrections &
Security Career Cluster™ compared to participating in career academies tied to the
Health Science Career Cluster™ included only gender. Non-significant predictors
included: (a) race/ethnicity, (b) prior learning experience, (c) prior performance, and (d)
socio-economic status. Results from this research study suggested that in comparison to
males, female students were 51.9% less likely to participate in career academies tied to
the Law, Public Safety, Corrections & Security Career Cluster™ (odds ratio = .481, p <
.01). Male students were 2.08 times more likely than female students to be enrolled in a
career academy related to law, public safety, corrections and security.
Marketing cluster. Significant predictors of students enrolling in a career
academy tied to the Marketing Career Cluster™ compared to participating in career
academies tied to the Health Science Career Cluster™ included gender, race/ethnicity,
and prior performance. Non-significant predictors included prior learning experience and
socio-economic status.
142
Results from this research study suggested that in comparison to males, female
students were 72.6% less likely to participate in career academies tied to the Marketing
Career Cluster™ (odds ratio = .274, p < .001). That is, male students were 3.65 times
more likely than female students to enroll in career academies tied to marketing.
In addition, for every unit (point) increase in a student’s FCAT reading score,
results suggested participation in career academies tied to the Marketing Career Cluster™
was also 0.7% less likely (odds ratio = .993, p < .05). However, the indication for
African American students was that they were 114.4% (or 2.14 times) more likely than
Caucasian students to participate in career academies tied to the Marketing Career
Cluster™ (odds ratio = 2.144, p < .01). Statistics from the full factorial analysis were
even higher for African American students (odds ratio to 3.395, p < .05).
Science, Technology, Engineering & Mathematics (STEM) cluster. Significant
predictors of students enrolling in a career academy tied to the Science, Technology,
Engineering & Mathematics (STEM) Career Cluster™ compared to participating in
career academies tied to the Health Science Career Cluster™ included gender,
race/ethnicity, and prior performance. Non-significant predictors included prior learning
experience and socio-economic status.
Results from this research study suggested that in comparison to males, female
students were 93.4% less likely to participate in career academies tied to the Science,
Technology, Engineering & Mathematics (STEM) Career Cluster™ (odds ratio = .066, p
< .001). As a result, male students were 15.15 times more likely than female students to
enroll in STEM-related career academies. In addition, the indication for Hispanic
students was that they were 61.3% less likely to participate in career academies tied to the

143
STEM Career Cluster™ (odds ratio = .387, p = .001). So, compared to Hispanic
students, Caucasian students were 2.58 times more likely to enroll in STEM-related
career academies. Similarly, for every unit (point) increase in a student’s FCAT math
score, results suggested participation in career academies tied to the STEM Career
Cluster™ was 1.6% more likely (odds ratio = 1.016, p < .001).
Summary
Over the six-year period from 2007 – 2012, enrollments in career academies
increased even as the overall population of the school district was decreasing. A higher
percentage of male students enrolled in career academies in each of the years from 2007
– 2011 when there was an inverse shift in enrollments leading to a higher proportion of
female students having enrolled in career academies. By 2012, female students had
higher proportions of enrollment in the following Career Clusters™: (a) Agriculture,
Food & Natural Resources, (b) Education & Training, (c) Finance, (d) Government &
Public Administration and the Law, Public Safety, Corrections & Security, (e) Health
Science, (f) Hospitality & Tourism, and (g) Marketing. At the same time, male students
had higher proportions of enrollment in career academies within the Architecture &
Construction, (b) Information Technology, and (c) Science, Technology, Engineering &
Mathematics (STEM) clusters.
While there was a considerable gap in terms of the racial/ethnic balance among
career academies, over the six years described in this study, the gap has begun to narrow.
By 2012, more students of color (African American, Asian, Hispanic and Multi-Racial)
were enrolled in career academies. With the exception of the Architecture &
Construction and Information Technology clusters, most career academies realized

144
reduced proportions of Caucasian students. Furthermore, Asian students increased
enrollment in career academies related to finance and marketing while African American
students increased proportions in career academies related to education & training as well
as hospitality & tourism. Hispanic students were enrolled in higher proportions within
career academies in the arts, A/V technology & communications cluster as well as
STEM-related career academies. However, data indicates there continues to be a heavy
Caucasian presence within career academies and the school district as a whole.
Turning to SES, the district experienced a period of decreasing wealth as more
families within the MSA were in need of financial assistance – thereby qualifying a
higher number and proportion of students for the free/reduced lunch program. While the
district (high school) percentage of students on free/reduced lunch escalated to 46.0%,
career academies in the following Career Clusters™: (a) Agriculture, Food & Natural
Resources, (b) Arts, A/V Technology & Communications, (c) Government & Public
Administration and the Law, Public Safety, Corrections & Security, (d) Health Science,
(e) Marketing, and (f) Science, Technology, Engineering & Mathematics (STEM) all had
over 40.0% of enrolled students receiving free/reduced meal benefits. Contrary to this
depiction, less than 20.0% of students enrolled in career academies within the finance
cluster participated in the free/reduced program.
By 2013, approximately 17.9% of high school students were enrolled in a career
academy. While the demographic outlook had improved over previous years, there still
remained a gap in particular between the racial/ethnic makeup of the high school
population and the students enrolled in career academies. The same was true for the SES
landscape.

145
In reviewing the predictors of career academy participation, prior learning
experiences as well as prior performance on the annual state assessment were significant
indicators of students enrolling in a career academy. Those students who had a minimum
of one semester of CTE while attending middle school were found to be more likely to
enroll in a career academy as part of their high school experience. In addition, students
enrolled in career academies also demonstrated high mean scores on both the reading and
mathematics portions of the FCAT taken while attending middle school.
Although results indicated the data did not fit the statistical model well, each of
the predictor variables was deemed significant. Female students were 1.29 times more
likely than male students to enroll in a career academy. When compared to Asian and
Hispanic students, Caucasians were more likely to enroll in a career academy by 1.76
times and 2.25 times, respectively. Furthermore, higher economically advantaged
students were 1.5 times more likely to enroll in a career academy when compared to
students from lower SES families.
In terms of analyzing the predictors to Career Clusters™, the results indicated the
data fit the model with increased predictive accuracy, although only about 34% of the
variance could be explained by way of the predictor variables. From a gender
perspective, the analysis suggested male students were significantly more likely to enroll
in career academies tied to the: (a) Agriculture, Food & Natural Resources, (b)
Architecture & Construction, (c) Arts, A/V Technology & Communications, (d) Finance,
(e) Government & Public Administration and the Law, Public Safety, Corrections &
Security, (f) Information Technology, (g) Marketing, and (h) Science, Technology,
Engineering & Mathematics (STEM) Career Clusters™.
146
Regarding racial and ethnic data, the results suggested that African American
students were more likely to enroll in career academies tied to marketing while Caucasian
students were more likely than African American and Hispanic students to enroll in
career academies to agriculture. Further, when compared to Hispanic students, Caucasian
students were also more likely to enroll in career academies in hospitality and tourism as
well as career academies related to STEM.
Moreover, both prior learning experience as well as prior performance variables
were also found to be significant predictors of enrollment. In particular, having taken
CTE in middle school was a significant predictor for enrolling in agriculture-related and
architecture/construction-related career academies. Prior performance was an indicator
of enrollment in career academies tied to agriculture, hospitality, marketing and STEM.

147
CHAPTER 5: SUMMARY, DISCUSSION AND IMPLICATIONS
This chapter is comprised of four sections. The first section summarizes the
findings of this research study. The second section interprets these findings and connects
the results to relevant literature and the conceptual framework in which this research
study was grounded. The third section explains the importance of this study along with
implications for practice. The final section discusses opportunities for further research.
Summary of Results
The objectives in conducting the study were threefold. The first objective was to
describe participation patterns of students enrolled in career academies at the district
level. The second and third objectives were to determine whether participation in career
academies in general, and in specific types of career academies, is a function of
demographic and/or prior learning experience and performance variables. Based on
study data, the findings from this study support the notion that enrollment in career
academies has been on the rise especially for female students and students of color, in
particular those students from Asian, African American and Hispanic backgrounds as
well as Multi-Racial students. In addition, it was determined that independent variables
such as demographics, prior learning experience and prior performance may be used to
predict enrollment within career academies. Finally, it was also evident that those same
predictors could be utilized to adumbrate enrollment patterns within certain career

148
academies based on connections to the national Career Clusters™. Further elaboration is
provided below to support these conclusions.
Summary of results for research question one. What are the participation
trends in career academies over a recent six-year period (2007-2012) based on
demographic variables including gender, race/ethnicity, and socio-economic status
(SES)? Data from this study indicated that between the years of 2007 through 2012, there
was an overall increase in the rate of high school students participating in career
academies. While 16.9% of high school students were enrolled in a career academy in
2006-07, that proportion increased to 20.4% by 2011-12. More specifically over this six-
year period, career academies within the finance, health science, hospitality & tourism, as
well as the marketing Career Clusters™ experienced marked increases in enrollments.
That is, enrollments in the finance cluster increased by 3.54 times, health science
increased by 1.44 times, hospitality and tourism increased by 3.3 times, and marketing
increased by 3.97 times over the period between 2006-07 and 2011-12.
While there was a higher percentage of male students enrolled in career
academies during the 2006-07 school year, by the end of the 2011-12 school year, gender
enrollments transposed and female students represented more than half of career academy
students. During this timeframe, African American students, Asian students as well as
students from Hispanic and Multi-Racial heritage all experienced increases in the
proportion of students enrolled in career academies. Regarding socio-economic status,
while the percentage of enrolled career academy students participating in the National
School Lunch Program increased during the timeframe of reference, the proportion

149
remained lower than the district high school average of students who received free and
reduced cost meals.
Summary of results for research question two. To what extent do
demographic, prior learning experience, and performance variables predict participation
in career academies? Sample data from this research study indicated a higher proportion
of female students compared to male students were enrolled in career academies.
Furthermore, the proportions of students of color, (in particular students of Asian,
African American, and Hispanic heritage, as well as Multi-Racial students), within the
high school population as well as the career academy sample also showed an increase.
However, the proportion of students from each of these groups enrolled in career
academies continued to fall short of the overall population ratios. Likewise, students
considered to be from families of lower SES also enrolled in career academies to a lesser
degree than their higher advantaged counterparts. Moreover, students enrolled in career
academies demonstrated higher means on the number of semesters of CTE coursework
completed in middle school as well as higher mean scores in both reading and
mathematics as measured on the FCAT annual state assessment.
All independent variables were found to be statistically significant in the binary
logistic regression model used to address this research question. Thus, for a student from
a lower SES family, with zero semesters of CTE coursework, and below mean FCAT
scores, a reasonable prediction would be that this student would not enroll in a career
academy. Similarly, for a female student with three semesters of CTE courses, and high
FCAT scores, a reasonable prediction would be that this student would enroll in a career
academy. For African American and Hispanic students who shared both a combination
150
of middle school CTE courses and high FCAT scores, the prediction would be that they
would enroll in a career academy, however not to the extent of their Caucasian peers.
Summary of results for research question three. To what extent do
demographic, prior learning experience, and performance variables predict participation
within specific types of career academies (based upon Career Clusters™)? Sample data
from this research study indicated that a higher proportion of female students enrolled in
career academies tied to six of the 10 career clusters examined. Those clusters included:
(a) Agriculture, Food & Natural Resources, (b) Arts, A/V Technology &
Communications, (c) Finance, (d) Health Science, (e) Hospitality & Tourism, and (f)
Law, Public Safety, Corrections & Security. Proportionally speaking, students of color
were better represented in career academies within the following Career Clusters™: (a)
Architecture & Construction, (b) Finance, and (c) Marketing. Said another way, career
academies tied to the marketing cluster enrolled the highest proportion of African
American (26.5%) and Multi-Racial (5.9%) students. The highest proportion of Asian
students (3.6%) were enrolled in career academies connected to the finance cluster and
the highest proportion of Hispanic students (22.6%) were enrolled in career academies
operating under the architecture and construction cluster. In addition, students from
lower SES backgrounds tended to demonstrate higher proportions of enrollment in career
academies tied to the following Career Clusters™: (a) Architecture & Construction, (b)
Law, Public Safety, Corrections & Security, and (C) Marketing. Conversely, students
from higher SES backgrounds represented more career academy students in the Finance
and STEM Career Clusters™. Moreover, the numbers of semesters of CTE coursework
completed in middle school as well as FCAT scores were found to be significant

151
predictors of enrollment in career academies within specific Career Clusters™. Prior
learning experience was significant for career academies within the Agriculture, Food &
Natural Resources, and the Architecture & Construction clusters. Prior performance was
significant for career academies within the: (a) Agriculture, Food & Natural Resources,
(b) Hospitality & Tourism, (c) Marketing, and (d) Science, Technology, Engineering &
Mathematics (STEM) clusters.
Again, all independent variables were found to be statistically significant in the
multinomial logistic regression model used to address this research question. Based on
these results it was concluded that for a male student with three semesters of CTE
coursework, and better than mean FCAT scores, one could predict participation in a
career academy within the STEM cluster. Adding Caucasian into the mix would increase
the prediction that the student would enroll in a career academy tied to agriculture and
natural resources, while the prediction for African American males would be to enroll in
marketing-related academies and Hispanic males would tend to enroll in career
academies under the architecture & construction cluster.
Discussion of Results
Six-year enrollment trends. Albeit school district enrollment numbers have
shown a declining trend over the past several years, this study found the number and
proportion of students enrolling in career academies as part of their high school
experience has been increasing. That is, data indicated even with 5.9% fewer high school
students enrolled in the district, career academy enrollments experienced a 3.5% increase
in overall participation. This increased enrollment could be a reflection of the ideology
surrounding the notion that based upon students’ career interests, the career academy

152
model has evolved into one of preparation for all students for both college and careers
(Castellano et al., 2007; Fletcher & Cox, 2012; Kemple & Snipes, 2000; Levesque et al.,
2000; Stern et al., 1992). In alignment with earlier CTE literature, those programs seeing
the greatest increase in enrollments tend to be focused on health science and technology
areas as opposed to trade and industrial programs (Levesque et al., 2000).
While more students are recognizing the perceived benefits of, and taking
advantage of career academy participation, a slight gap in gender enrollments continues
to exist. Unlike data from Bradby, et al., (2007) and Estacion, et al., (2011), the career
academies in this study did not narrow the gender gap across the district. Interestingly
however, while male students demonstrated a higher proportion of enrollments in career
academies over the first five years analyzed in this study, female students claimed 50.8%
of career academy enrollments during the sixth year. Still, in looking at specific Career
Clusters™ such as Finance and Information Technology, the gender gap has actually
widened over time. This may be cause for concern as larger studies have shown a
narrowing of the gender gap within career academies across the nation (Bradby, et al.,
2007; Estacion, et al., 2011). Data did however indicate a reduction in the gender gap for
career academies related to Health Science, Marketing and STEM clusters.
Data in this study did tend to indicate a change in the landscape of students being
served in career academies, which is in accordance with large-scale demographic changes
taking place within the participating school district. Over the six-year period examined in
this study, and as shown in Table 5.1, the demographics of the school district have
become slightly more diverse with increasing proportions of students of color attending
school and enrolling in career academies. However, the proportions of students of color

153
Table 5.1
Six-year Proportional Comparisons of Students of Color Within the High School Population and Those Enrolled in a Career Academy 2006-07 2011-12 Race/Ethnicity
High School Population
Career Academy Participant
High School Population
Career Academy Participant
African American 13.9 9.3 13.2 11.7 Asian 1.6 0.9 2.0 1.9 Hispanic 13.3 4.3 16.8 11.3 Multi-Racial 1.9 1.5 2.9 3.2
enrolled in career academies does not yet meet the proportions of African American,
Asian or Hispanic students enrolled across the 10 comprehensive high schools in the
district. In this regard, many students of color (African American, Asian, Hispanic) are
participating more in career academies related to Health Science and STEM clusters,
again aligning with national program trends (Levesque et al., 2000). Furthermore, while
Asian and African American students are enrolling to higher degrees in career academies
tied to the Marketing cluster, the career academies associated with the Arts, A/V
Technology & Communication and the Finance clusters are experiencing growth in Asian
and Hispanic students.
In regards to decreasing enrollments, except for Hispanic students, the
Architecture and Construction cluster has seen a decrease in enrollments from most
students of color. Moreover, Asian students and African American students have also
shown a reduction in enrollment of career academies related to Information Technology.
In this context, these evolving enrollment patterns may suggest support for the claim that
fewer students are interested in post-high school trade related work, and are rather opting
for a pathway that leads to post-secondary education and then work (Levesque &
Hudson, 2003a; Levesque & Hudson, 2003b; Levesque et al., 2008; Levesque et al.,

154
2000; Silverberg et al., 2004). This also could be seen as an indicator that students of
color are in fact interested in career pathways within the STEM occupation fields (Ndura,
et al., 2003; Syed & Chemers, 2011; Whalen & Shelley, 2010). Recently, there has been
increased attention along with a considerable investment in STEM-related experiences,
particularly at the post-secondary and occupational levels, with special focus on
underrepresented groups (Palmer & Wood, 2013).
Regarding socio-economic factors, the school district population participating in
this study has become poorer over the timeframe included in the data analyses. A higher
proportion of children come to school from families who require some degree of financial
assistance and therefore more students are eligible to participate in the free and reduced
lunch program. Career academies within the Agriculture, Food & Natural Resources,
Arts, A/V Technology & Communications, and Marketing clusters shared the highest
rates of economically challenged youth. Conversely, the career academies within the
Architecture & Construction, the Finance, and the Information Technology clusters
shared the lowest proportions of students from low-income families.
Although the initial legislation enacting the California Partnership Academies
required that 50% of admitted students meet some level of need (the first being
economic), admittedly there was no system in place to ensure that ratio was met (Bradby,
et al., 2007). In comparison to the data from Estacion, et al., (2011) where the proportion
of low-SES students attending career academies was relative to the proportion of low-
SES in the school/district, the percentage of low-SES students attending career academies
in the school district participating in this study was considerably lower than the

155
school/district average. This could be an indication that more students from families of
higher economic advantage are choosing to participate in career academies.
Predicting career academy participation. The school district continued to
experience a trend of declining enrollments into the 2012-13 school year. Furthermore,
following several years of increasing enrollments, the number and percentage of students
participating in career academies also declined from a high point of 4545 (24.3%) in
2010-11 to 3206 (17.9%) in 2012-13. Regardless, as the appeal of participating in career
academies has expanded over the past two decades (Kemple, 2001; Kemple & Rock,
1996; Kemple & Snipes, 2000; Stern et al., 2000), a higher proportion of female students,
as well as students of color were found to be taking advantage of the career academy
pathway. These trends coincide with other recent research on career academies within
the state of Florida (Estacion et al., 2011).
That is not to say, however, that the overall participation rates of career academy
students mirrored the overall population of the high schools within the participating
school district. When compared to data from the National Academy Foundation (2012),
the California Partnership Academies (Bradby, Dayton, Hanna, & Malloy, 2007; Dayton,
Hester, & Stern, 2011), and the Florida research on career academies (Estacion et al.,
2011), the school district participating in this research study continued to experience
career academy enrollment gaps related to racial and ethnic diversity. This enrollment
gap also remained for students who are considered to be from families of lower socio-
economic status.
Students within this research study who were found to have taken CTE
coursework as part of their middle school experience were also found to have been more
156
likely to enroll in a career academy as part of their high school experience. Taking CTE
coursework at the middle school level was recognized as prior learning experience
(continuous independent variable), which allowed students to gain exposure into various
career fields prior to making commitments for their high school program of study. This
falls in line with the notion that while career academies were originally designed to help
keep students at risk for early school departure in school through graduation (Agodini &
Deke, 2004; Silverberg et al., 2004; Stern et al., 2000), career academies are now
designed to prepare all students for both college and careers (Kemple, 2001; Kemple &
Rock, 1996; Kemple & Snipes, 2000; Stern et al., 2000).
Moreover, while research from Kemple and Snipes (2000) has shown that career
academies did not improve student scores on standardized reading and math achievement
tests, data from this study indicate that students enrolled in career academies
demonstrated higher mean scores in both reading and mathematics on the Florida
Comprehensive Achievement Test (FCAT). This could be due in part to the ideology
that more academically robust students are enrolling and participating in career
academies (Castellano et al., 2007; Kemple & Snipes, 2000). That is, students with higher
prior academic achievement in math and reading will probably continue to achieve at
similar levels in career academies, thus showing no significant differences in their overall
academic performance. However, data from other recent studies outside of career
academies also suggest a possible connection between CTE course-taking patterns where
core subject standards have been emphasized and higher corresponding mean scores on
standardized assessments have been realized (Pierce, 2013; Stone, Alfeld, Pearson, Lewis
and Jensen, 2006).

157
Finally, it is important to note that while all the independent variables analyzed in
this research study were found to be statistically significant, those findings could be due
in part to the large sample size. As the constant model was determined to have a weak
association (Nagelkerke = .087) indicating less than 9% of the variance in the dependent
variable could be explained by the predictors in the model, the researcher acknowledges
there may be other predictors not utilized in this analysis that could assist in making the
model stronger. That is, aside from gender, race/ethnicity, socio-economic status, along
with data on prior learning experience and prior performance, there exist many other
factors which contribute to a student’s decision to enroll and participate in a career
academy. Other factors worthy of further investigation would include variables related
to: (a) parental education levels, (b) sources of highest influence, (c) family background
and dynamics, and (d) attitudes and perceptions about career academies.
Predicting career academy participation by Career Cluster™. Career
academy enrollments within specific Career Clusters™ did illustrate an alignment with
earlier research on career academies. In terms of gender, female students enrolled in
career academies within the school district participating in this research study
participated at higher rates in career academies tied to the: (a) Agriculture, Food &
Natural Resources, (b) Health Science, and (c) Hospitality & Tourism clusters. This
reflects participation data from both the California Partnership Academies (Bradby et al.,
2007; Dayton et al., 2011) as well as the Florida research conducted by Estacion et al.
(2011). Data from this research study also indicated that male student enrollments in the
Architecture & Construction cluster matched with earlier research (Bradby et al., 2007;
Dayton et al., 2011; Estacion et al., 2011); while in the participating school district, male

158
students were also enrolled heavily in both Information Technology and STEM cluster
career academies. These enrollments were in contrast to the six-year trend data discussed
previously which were more equally distributed and in concert with other related
literature (Bradby et al., 2007; Dayton et al., 2011; Estacion et al., 2011).
In regards to racial and ethnic participation in career academies by Career
Clusters™, Caucasian students in the participating district enrolled at higher proportions
in career academies related to Agriculture, Food & Natural Resources much like
Caucasian students in the related literature (Bradby et al., 2007; Dayton et al., 2011;
Estacion et al., 2011; Fletcher, 2012). Similar to students in the California Partnership
Academies, Hispanic students in the participating district enrolled also at higher
proportions in career academies related to Architecture & Construction. African
American students in the participating school district enrolled to higher degrees in career
academies related to Marketing, which differed from both of the earlier studies. The
increased enrollment in marketing-related career academies could be due in part to the
high concentration of jobs related to tourism and the service industries within the
metropolitan statistical area.
The highest concentration of students who participated in the free/reduced lunch
program within the participating district were found to be enrolled in career academies
related to either the Law, Public Safety, Corrections & Security cluster or the Marketing
cluster. Higher enrollments in the Law, Public Safety, Corrections & Security cluster
align with earlier research by Estacion et al. (2011). In contrast, career academies related
to the Finance cluster as well as the STEM cluster appeared to attract the highest
proportions of economically advantaged students. These results varied slightly from

159
Estacion’s research which showed the career academies from the Agriculture, Food &
Natural Resources cluster and the Arts, A/V Technology & Communications cluster as
having the highest proportions of economically advantaged students.
As discussed earlier, while research from Kemple & Snipes (2000) has shown that
career academies did not improve student scores on standardized reading and math
achievement tests, data from this study indicated that students enrolled in career
academies demonstrated higher mean scores in both reading and mathematics on the
Florida Comprehensive Achievement Test (FCAT). Again, this could be due in part to
the notion that students may be better prepared academically as they enroll and
participate in career academies (Castellano et al., 2007; Kemple & Snipes, 2000), albeit
other research suggests that core-enhanced CTE classrooms have also shown increased
test scores (Pierce, 2013; Stone et al., 2006).
Finally, it is important to reiterate that while all the independent variables
analyzed in this research study were found to be statistically significant, those findings
could be due in part to the large sample size. As noted above, there are many other
factors, aside from gender, race/ethnicity, socio-economic status as well as prior learning
experiences and prior performance, which contribute to a student’s decision to enroll and
participate in a career academy. Exploring the impact of other factors may warrant
further investigation.
Connections to the conceptual framework. According to Mitchell and
Krumboltz (1990) the social learning theory of career decision making (SLTCDM)
should help researchers understand why individuals choose to enter particular educational
programs and/or occupational fields. Specifically, the role of background variables—the

160
first factor in Krumboltz’s theory—served to focus the inquiry on the demographics of
students enrolled in career academies (Mitchell & Krumboltz, 1990). As such, the study
was centered on determining who participates in career academies from a gender,
racial/ethnic, and socio-economic perspective.
The findings of this study indicated that more students are participating in career
academies overall. The findings also suggested that for the first time in more than six
years, when compared to male students, a higher proportion of female students were
enrolled in career academies during the 2012-13 school year. And while this indicates an
inverse shift in gender enrollment trends, there continues to be a slight gender gap across
career academies relative to the district high school population. Furthermore, within
specific types of career academies, based on Career Cluster™, some gender gaps remain
considerable. In addition, the findings also suggested there has been an increase in the
participation rates among students of color, albeit these data do not yet correlate to
population ratios of high school students across the school district. While there are
pockets of diversity in corners of the district, the metropolitan statistical area is still
heavily Caucasian. More to the point, Caucasian students continue to hold more seats
across career academies, regardless of Career Cluster™, compared to their peers.
Furthermore, while a higher proportion of students who participated in the NSLP also
participated in career academies, there continues to be an enrollment gap based on socio-
economic status. A higher percentage of economically advantaged students were found
to be participating in career academies relative to the proportion of economically
advantaged students in the general population.

161
The role of prior learning experiences, Krumboltz’s second factor, served to focus
the inquiry on the degree of CTE coursework students experienced as part of their middle
school experience—prior to making the decision to enroll in a career academy.
Krumbotlz’s theory suggests that career decisions are the result of various learning
experiences enhanced by interactions with people, institutions and events which occur in
a person’s environment (Canadian Career Development Foundation, 2012). As a result,
this component of the theory assists researchers in understanding why an individual
might decide to pursue certain educational programs or occupations along with
understanding why he/she might express certain levels of interest or preferences for
various occupational activities at different points in their lives.
Learning experiences assist students in developing their own set of beliefs
surrounding careers and their own role in life. Moreover, the learning experiences cause
the individual to view some occupations as being more attractive than others (Canadian
Career Development Foundation, 2012). A student’s decision to enroll in a career
academy may be attributed in part to the extent of participation in career awareness
programs at the middle school level. For the purpose of this study, a proxy for prior
learning experiences was identified as the extent of CTE coursework taken in middle
school. The findings of this study indicated that students who shared meaningful
experiences of a semester or longer in a CTE program were more likely to participate in a
career academy. These data were particularly significant in the prediction of students
enrolling in career academies related to career academies within the Agriculture, Food &
Natural Resources, and Architecture & Construction Career Clusters™.

162
Task approach skills, which relates to academic performance, was also a factor
from the SLTCDM used in the statistical analyses as a way to provide prior performance
data on students from their middle school experience. That is, student scores from the
Florida Comprehensive Assessment Test (FCAT) administered during the students’
eighth grade year were entered into the model as a covariate to assist with the prediction
of who participates in career academies. As FCAT is the recognized annual assessment
given to all students across the state of Florida, the scores served as reliable indicators of
past performance and are oftentimes utilized in research studies as predictors of future
performance. The findings of this study indicated that students with higher scores on the
reading and mathematics portions of the FCAT were also more likely to participate in a
career academy. These data were particularly significant in the prediction of students
enrolling in career academies related to the following Career Clusters™: (a) Agriculture,
Food & Natural Resources, (b) Hospitality & Tourism, (c) Marketing, and (d) STEM.
Finally, environmental conditions, specifically the local economic climate, served
to inform the final factor of Krumboltz’s SLTCDM. As the local economy impacts all
persons within a community, this factor was considered a constant for all participants
within this research study. As such, related indicators of environmental conditions were
not included in the analysis. However, to provide context for the interpretation of results,
further elaboration is provided to set the context for observed results focusing on the
following: (a) unemployment rates, (b) a description of the skill set of those seeking
work, (c) median household income, and (d) median home sales prices.
Following a construction boom during the early 2000s, the metropolitan statistical
area in and around Volusia County suffered economic losses on several fronts. Initially,
163
the construction field lost momentum and there was considerable loss of jobs in the
construction workforce. This in turn led to loss in other segments of employment and
subsequently resulted in many families moving out of the geographical area.
In January 2006, just prior to the onset of the recession, the unemployment rate in
the area served by the Region 11 Workforce Board which included Volusia and Flagler
counties was just under 3.5%. By March 2008, that rate had increased to 4.9% (Urquhart,
2008). By 2010, the unemployment rate had reached a high of 12.3% (Volusia County
Division of Economic Development, 2012). Although the unemployment rate had begun
to fall and by December 2012 was at 8.4%, it still hovered above both the national and
the state unemployment rates of 7.6% and 7.9% respectively (Employ Florida, 2013).
By February 2013, there were 70,059 potential workforce candidates seeking
employment within Region 11. Of the candidates seeking to join or rejoin the workforce,
17.9% held a bachelor’s degree, 11.6% held an associate’s degree, and 32.0% held a high
school diploma or equivalent. Moreover, when combined with individuals who
possessed varying levels of education spanning from less than a high school diploma to
having some college but no degree, 91.2% of those unemployed held less than a graduate
degree (Employ Florida, 2013). As Volusia County relies heavily on tourism dollars to
fuel the economic engine, more than half (approximately 53%) of those seeking work
possessed skill sets related to customer service (Volusia County Division of Economic
Development, 2012). Other skill sets held by persons seeking to re-join the workforce
included business and professional services, warehouse distribution, manufacturing, and
maintenance/repair related skills. The main industries within Region 11 include: (a)
health care and social assistance, (b) retail trade, (c) accommodation and food services,

164
(d) education, and (e) public administration. This could partially account for increasing
enrollments in career academies related to the health science, hospitality & tourism, and
marketing clusters.
Median household income for Volusia County residents in 2011 was $39,879.
That figure was approximately 9.5% less than the state median household income and
approximately 20.6% less than the national median household income (Volusia County
Division of Economic Development, 2012). Furthermore, while the median cost for a
single-family home in the state of Florida at the height of the construction boom (2006)
was approaching $250,000, the median cost of a single-family home in Volusia County
was approximately $210,000. This was nearly double the median cost for a home
purchased four years earlier; however by 2011, the median cost of a single-family home
in Volusia County had fallen to near 2002 prices (Volusia County Division of Economic
Development, 2012).
As a result of these and other factors, what had been a strong growth pattern for
the school district, where annual enrollments had been increasing considerably since the
mid 1990s, suddenly following the end of the construction boom, the trend reversed and
enrollments continued to decline even at the time of this writing. In fact, by the 2011-12
school year, the school district FTE enrollment was lower than it had been since the
1997-98 school year (Volusia County Schools, 2012). This trend suggests that due to the
economic climate of the community in which this research study was conducted, many
factors affected the environmental conditions considered to be a constant for all
participators within this research study. Although not an overt component of this
research study, the economic climate certainly contributed to the decisions students made

165
as part of the process to develop their high school program of study. As such, there may
be value to examining this particular factor more closely in future research efforts.
Implications and Limitations for Practice
The original intent of career academies was to reduce the high school dropout rate
while preparing students to enter the labor market (Agodini & Deke, 2004; Silverberg et
al., 2004; Stern et al., 2000). By 2000, the focus of career academies had evolved from a
dropout prevention program to a focus on preparing all students for both college and
careers (Kemple, 2001; Kemple & Rock, 1996; Kemple & Snipes, 2000; Stern et al.,
2000). Earlier research has shown that although participation in a career academy does
not impact student scores on standardized achievement tests in reading and mathematics,
participation does have an impact on the dropout rate for students, especially those
identified as being at high-risk for dropping out of school (Castellano et al., 2007;
Kemple, 1997, 2001, 2004; Kemple & Rock, 1996; Kemple & Snipes, 2000; Kemple &
Willner, 2008; Kemple et al., 1999; Silverberg et al., 2004; Stern et al., 2000). That is,
students considered to be academic achievers are going to do well regardless of the
supports offered to them through the career academy model. However, for those students
considered to be in at-risk situations, the gains in academic achievement along with the
social benefits afforded by participation in a career academy are clearly more evident.
Furthermore, career academies have been recognized as a viable approach to
creating supportive secondary environments that increase students’ exposure to career
awareness and work-based activities while integrating core academic curricula into the
students’ high school experience (Castellano et al., 2007; Kemple, 1997, 2001, 2004;
Kemple & Rock, 1996; Kemple & Snipes, 2000; Kemple & Willner, 2008; Kemple et al.,

166
1999; Silverberg et al., 2004; Stern et al., 2000). This is especially important for students
who may be considering dropping out of school, and for whom employment prospects are
becoming increasingly grim (Kemple & Rock, 1996). For many students, career
academies have been found to be effective in improving student performance in high
school as well as preparing students for the next level which in most cases is some form
of post secondary education (Fletcher & Cox, 2012; Linnehan, 1996; Maxwell & Rubin,
1997, 2000; Stern, et al., 2000).
As the benefits of career academies became more widely recognized, students
with stronger academic skills began to enroll in career academies (Castellano et al., 2007;
Kemple & Snipes, 2000). As a result, career academies began attracting greater numbers
of advantaged students. So consequently, while career academies were originally
designed to boost the skills of students who needed academic assistance, the opportunity
appears to have been seized by academically robust students.
The National Center for Education Statistics (2011) indicated that in 2004, there
were approximately 4,800 high schools that offered career academies as a pathway for
their students. Brand (2009, p. 3) estimated there were somewhere in the neighborhood
of a million students enrolled in career academies nationwide in 2009; however “no one
has a precise count”. In this context, there is a gap in the CTE literature on program
participation, supporting the notion that the demographic (gender, race/ethnicity, and
socio-economic status) make up of career academies mirror the demographics of the
schools, districts, and the communities in which they operate (Silverberg et al., 2004).
Agodini et al. (2004) confirmed that while there are numerous research studies
which identify the populations of students enrolled in CTE programs, those findings do

167
not indicate the factors that influence participation nor the student demographics of each
program under the CTE umbrella. Further, little is known about the rate of participation
and/or the factors promoting or inhibiting students’ interest in and decision to participate
in career academies. Given the significant policy implications of related inquiry, Agodini
et al. (2004) called for further research to analyze these participation patterns.
This research study sought to describe participation patterns at the district level of
students enrolled in career academies and to statistically determine whether participation
in career academies in general, and in specific types of career academies, was a function
of demographic and/or prior learning experience and performance variables. There
should be a clear alignment between the demographics of the students enrolled in career
academies and the communities in which their families live and work. That is, the
programs which serve as the foundation to career academies within the schools and
community should also align with employment opportunities within said community.
Thus, the present research study aimed to explore and more fully understand this
phenomenon.
The scope of participation in this study was delimited to secondary students who:
(a) attended public high school, (b) in Volusia County, Florida, and (c) had the
opportunity to enroll and participate in a career academy experience. One of the
foremost concerns and limitations in this research study was the inability to control for
confounding variables which may account for reasons students choose to enroll in career
academies. There may in fact be many reasons beyond the scope of the demographic
and/or prior learning experience and performance variables investigated in this research
study that account for students enrolling in career academies.

168
A second limitation centered on data collection. For data related to enrollment
trends, only aggregate demographic numbers were available for investigation. These data
were collected as part of the end-of-year reporting requirements by the state of Florida.
As the data available for collection for each demographic variable was counted
individually by category, there was no meaningful way to account for interaction effects
and to accurately determine which if any of the students crossed categories by gender,
race/ethnicity and socio-economic status. Further, in predicting enrollment patterns,
there was a lack of data available for those high school students who did not attend
middle school within the participating school district. While data on those students were
still incorporated into the analyses for overall descriptive purposes based on demographic
variables, results for statistical tests related to prior learning experience and prior
performance continuous variables were limited to only those students who matriculated
through Volusia County middle schools.
While there are many aspects of career academy participation that contribute to
the knowledge base, (attendance rates, discipline referral rates, GPA, volunteer hours,
dropout vs. graduation rates, etc.), this study only focused on demographic and prior
learning experience and performance variables and how those variables might be used to
predict participation within a career academy. This research study did not focus on issues
surrounding curriculum development or integration, the benefits or challenges of
operating a career academy, or specific members of the school population such as
students with handicaps. Furthermore, this study was not designed to follow students
beyond high school graduation. In addition, this research study did not take into account
parent or guardian levels of education or employment status. This study did not
169
investigate students’ perceptions of CTE or career academies, or the factors that
contributed to their decision to participate within a career academy.
While causal-comparative research designs provide a means for investigating
important educational research questions, these designs also suffer from a weakness
related to internal validity. Selection threats are a typical limitation in this type of
research design (Trochim & Donnelly, 2007). Selection threats occur when the
researcher lacks control over the comparison or reference (control) group. As a result, it
is sometimes difficult to draw conclusions about the larger population from the findings
of causal-comparative research studies. Therefore, external validity, or generalizability
may be limited to school districts of comparable size and similar student demographics.
The results of this study add a valuable contribution to the knowledge base and
begin to fill a gap in the literature on who participates in career academies. Results of
this research study are empirical in nature and are focused on the gender, racial/ethnic,
and socio-economic compositions of career academies among the national Career
Clusters™. This research study can serve as a model for school districts, states and
national educational researchers to analyze career academy participation rates in other
areas of the country.
This level of research will help to ensure that the shift to the “new vocationalism”
from specific training for work to a more rigorous academic/technical grounding focused
on preparation for careers for all students (Hernández-Gantes, Phelps, Jones, and Holub,
1995; Kemple & Snipes, 2000; Levesque & Hudson, 2003a, 2003b; Levesque et al.,
2008; Levesque et al., 2000; Silverberg et al., 2004) remains accessible to all students
while continuing to link educational systems to the workforce.

170
Opportunities for Future Research
Future studies might consider taking a look at longitudinal trends in career
academy enrollments from a state, regional and/or national perspective. Further
examination should consider entering additional demographic variables including
indicators of exceptional student education (ESE) participation along with participation in
English for Speakers of Other Languages (ESOL) programs. Likewise, incorporating
continuous variables (such as prior learning experience as well as prior performance
indicators) into an ex-post facto model can be helpful in understanding if a trend exists
where higher academic achievers are enrolling and participating in career academies.
Incorporating variables related to parental education levels may also help to strengthen
the model used to predict career academy participation.
Furthermore, research is also needed to identify the sources of highest influence
contributing to students’ decision-making processes when deciding to participate in a
career academy. This research should take into account the messages disseminated about
the potential benefits and costs of career academy participation, and the possible cultural
constructs that might impact the reception of those messages. Conducting a repeated
measures analysis on the attitudes and perceptions of eighth grade students before and
following the exposure of career academy opportunities as a treatment could shed light
on the thought processes taking place at this critical time of development.
Qualitative research might be warranted as well to more fully understand
students’ lived experiences and associated reasoning for electing to participate or not in
career academies. While Fletcher and Cox (2012) began some of that work by employing
student-based inquiry, it might be valuable to also seek out the attitudes and perceptions

171
of parents and guardians of those students about to enter high school. Understanding the
family background and dynamics would add valuable insight into the decision-making
process for students considering a career academy option. Furthermore, research
examining the breadth and depth of CTE course taking, based on the number of credits,
and the relation to demographic variables would also be beneficial. Finally, investigating
the relationship between CTE course taking patterns and other indicators of performance
including academic, earned industry certifications, ties to degree attainment and the labor
market would provide a more comprehensive pictorial landscape of outcomes realized as
a result of participating in career and technical education.
In summary, this research study provided evidence indicating a greater proportion
of female students compared to male students enroll in career academies. The enrollment
of African American, Asian and Multi-Racial students in career academies increased
slightly over time. However, a more poignant finding of this research was in the
substantial increase of Hispanic student and decrease of Caucasian student enrollments
within career academies. In spite of this, even with a decreasing trend in career
academies, Caucasian students continued to be overrepresented in career academies
compared to their overall participation in the district high schools. And while career
academy enrollment trends of students identified by SES paralleled the district
proportions of students eligible to receive services, students from higher economically
advantaged families enrolled in career academies to higher degrees than their lower SES
counterparts. In addition, students who took CTE as part of their middle school
experience, as well as those who scored higher on the annual state assessment, were also
found to be more likely to enroll in career academies.

172
REFERENCES
Agodini, R., & Deke, J. (2004, February). The relationship between high school vocational education and dropping out. Princeton, NJ: Mathematica Policy Research, Inc.
Agodini, R., Uhl, S., & Novak, T. (2004, August). Factors that influence participation in
secondary vocational education. Princeton, NJ: Mathematica Policy Research, Inc.
Akos, P., Lambie, G. W., Milsom, A., & Gilbert, K. (2007). Early adolescents'
aspirations and academic tracking: An exploratory investigation. Professional School Counseling, 11(1), 57-64.
Anderle, S. T. (2008). The integration of academics into career-technical education in
two California charter schools (Doctoral dissertation, University of Southern California, Los Angeles, USA). Available from Dissertations & Theses: Full Text Database. (Publication No. AAT 3331186)
Anderson, D. (2010). S.T.E.M. Initiatives (Research Brief). Eastern Michigan University:
Ypsilanti, MI. Anderson, J. D. (1982). The historical development of Black vocational education. In H.
Kantor & D. B. Tyack (Eds.), Work, youth, and schooling (pp. 180-222). Stanford, CA: Stanford University Press.
Archbald, D., & Keleher, J. (2008). Measuring conditions and consequences of tracking
in the high school curriculum. American Secondary Education, 36(2), 26-42. Arnold, C. L., & Levesque, K. A. (1992, December). Black Americans and vocational
education: Participation in the 1980s. Macomb, IL: National Center for Research in Vocational Education.
Austin, C. Y. (2010). Perceived factors that influence career decision self-efficacy and
engineering-related goal intentions of African American high school students. Career and Technical Education Research, 35(3), 119-135.
Babbie, E. (1990). Survey research methods (2nd ed.). Belmont, CA: Wadsworth.

173
Barlow, M. L. (1976, February). Implications from the history of vocational education. Retrieved April 8, 2012, from http://www.eric.ed.gov/
Black, W. R., & Burrello, L. C. (2010). Towards the cultivation of full membership in
schools. Values and Ethics in Educational Administration, 9(1), 1-8. Bradby, D., Dayton, C., Hanna, T., & Malloy, A. (2007, March). A Profile of the
California Partnership Academies, 2004-2005. Retrieved from http://casn.berkeley.edu/resource_files/profile_of_the_cpas.pdf
Brady, J. T. (1999). My son, the technician... Tech Directions, 58(7), 41-41. Brand, B. (2009, November). High school career academies: A 40-year proven model for
improving college and career readiness. Retrieved from http://www.aypf.org/documents/092409CareerAcademiesPolicyPaper.pdf
Brown, Jr., E. E. (2011). A multicontextual model for broadening participation in STEM
related disciplines. US-China Education Review, 8(3), 323-332. Bureau of Labor Statistics (2005). New and emerging occupations at the start of the 21st
century. Retrieved from http://www.bls.gov/opub/ted/2005/jan/wk1/art03.htm California Partnership Academies (2012). California Partnership Academies. Retrieved
from http://casn.berkeley.edu/cpa.php Canadian Career Development Foundation (2012). Big picture view of career
development theory. Retrieved February 26, 2012, from http://www.ccdf.ca/ccdf/NewCoach/english/ccoache/e4a_bp_theory.htm
Career Academy Support Network (CASN) (2011). Career academies: An overview.
Retrieved October 22, 2011, from http://casn.berkeley.edu/resources.php?r=250 Carmines, E. G., & Zeller, R. A. (1979). Reliability and validity assessment. Thousand
Oaks, CA: Sage Publications, Inc. Carpenter, II, D. M., Ramirez, A., & Severn, L. (2006). "Gap" or "gaps": Challenging the
singular definition of the achievement gap. Education and Urban Society, 39(1), 113-127.
Castellano, M., Stone III, J. R., Stringfield, S., Farley-Ripple, E. N., Overman, L. T., &
Hussain, R. (2007, October). Career-based comprehensive school reform: Serving disadvantaged youth in minority communities. St. Paul, MN: University of Minnesota.
Cohen, J. (1992). Quantitative methods in psychology: A power primer. Psychological
Bullentin, 112(1), 155-159.

174
Cronbach, L. J. (1971). Test validation. In R. L. Thorndike (Ed.), Educational measurement (2nd ed., Rev., pp. 443-507). Washington, D.C.: American Council on Education.
Dayton, C., Hester, C. H., & Stern, D. (2011, October). Profile of the California
Partnership Academies, 2009-2010. Retrieved from http://casn.berkeley.edu/downloads/CPA_Report_2009-10.pdf
Dennis, D. H., & Hudson, C. C. (2007). Workforce education and two important
viewpoints. Journal of Industrial Teacher Education, 44(2), 89-98. Dixon, M. L., Cotner, B. A., Wilson, T. C., & Boreman, K. M. (2011). Implementing
career academies in Florida: A case study approach to understanding successes and obstacles. Career and Technical Education Research, 36(3), 207-227.
Driscoll, C. M. (2005). Getting the message right: Does investing in CTE appeal to the
public? Techniques, 80(2), 8-9. Employ Florida (2013). Labor market facts: Area profile. Retrieved February 4, 2013,
from https://www.employflorida.com/vosnet/lmi/area/areasummary.aspx?enc=SgfjA5gOXyjl8J88h1RJLQcZlP8Aoj9deDT8+gS8L4xF7yqCU2b+5n2N7qQwrHWA
Estacion, A., D'Souza, S., & Bozick, R. (2011, March). Characteristics of career
academies in 12 Florida school districts (REL 2011 - No. 106). Greensboro, NC: National Center for Education Evaluation and Regional Assistance.
Fletcher, Jr., E. C. (2012). Predicting the influence of demographic differences and
schooling experiences in adolescence on occupational choice in adulthood. Career and Technical Education Research, 37(2), 121-139.
Fletcher, Jr., E. C., & Cox, E. D. (2012). Exploring the meaning African American
students ascribe to their participation in high school career academies and the challenges they experience. The High School Journal, 96(1), 4-19.
Florida Department of Education (2011). Career academies. Retrieved July 1, 2011, from
http://www.fldoe.org/workforce/careeracademies/ca_home.asp Fowler, Jr., F. J. (2009). Survey research methods (4th ed.). Thousand Oaks, CA: Sage
Publications, Inc. Gall, M. D., Gall, J. P., & Borg, W. R. (2007). Educational research (8th ed.). Boston,
MA: Pearson Education, Inc. Gamoran, A. (1987). The stratification of high school learning opportunities. Sociology of
Education, 60(3), 135-155.
175
Gamoran, A. (1992). The variable effects of high school tracking. American Sociological Review, 57(6), 812-828.
Gamoran, A. (2001). American schooling and educational inequality: A forecast for the
21st century. Sociology of Education, 74(Extra Issue), 135-153. Gamoran, A., & Mare, R. D. (1989). Secondary school tracking and educational
inequality: Compensation, reinforcement, or neutrality? American Journal of Sociology, 94(5), 1146-1183.
Garson, G. D. (2012). Logistic regression: Binary and multinomial. Asheboro, NC:
Statistical Publishing Associates. Gaunt, D., & Palmer, L. B. (2005). Positive student attitudes toward CTE. Techniques,
80(8), 44-47. Gehrt, V. C. (1990). Student choice of career program in vocational high schools.
Dissertation Abstracts International: Section A. Humanities and Social Sciences, (), .
Gordon, H. R. (2008). The history and growth of career and technical education in
America (3rd ed., Rev.). Long Grove, IL: Waveland Press. Grimm, L. G. (1993). Statistical applications for the behavioral sciences (4th ed.).
Hoboken, NJ: John Wiley & Sons, Inc. Hagedorn, L. S., & Purnamasari, A. V. (2012). A realistic look at STEM and the role of
community colleges. Community College Review, 40(2), 145-164. Hagen, S. (2010). The effects of mandated career and technical education (CTE) on the
college and career preparation of high school students. Dissertation Abstracts International: Section A. Humanities and Social Sciences, (), .
Hallinan, M. T. (1994). Tracking: From theory to practice. Sociology of Education, 67(2),
79-84. Hanser, L., & Stasz, C. (1999). The effects of enrollment in the transportation career
academy program on student outcomes. Retrieved July 2, 2012, from http://www.eric.ed.gov/
Hazel, N. F. (n.d.). A comparative study of career academy involvement and non-career
academy involvement and their relationship to student achievement and student attendance in a specific urban high school in New Jersey. Dissertation Abstracts International: Section A. Humanities and Social Sciences, (), .

176
Heebner, A. L. (1995). The impact of career magnet high schools: Experimental and Qualitative Evidence. Journal of Vocational Education Research, 20(2), 27-55.
Hernández-Gantes, V. M., Phelps, L. A., Jones, J., & Holub, T. (1995). School climate in
emerging career-oriented programs: Students' perspectives. Journal of Vocational Education Research, 20(2), 5-24.
Jaccard, J. (1998). Interaction effects in factorial analysis of variance. Thousand Oaks,
CA: Sage Publications, Inc. Johnson, B. (2001). Toward a new classification of nonexperimental quantitative
research. Educational Researcher, 30(2), 3-13. Jones, K. H., Womble, M., & Searcy, C. A. (1997). T&I education students' perceptions
of courses. Journal of Industrial Teacher Education, 34, 82-101. Kelly, S. (2007). The contours of tracking in North Carolina. The High School Journal,
90(4), 15-31. Kemple, J. J. (1997, November). Career academies- Communities of support for students
and teachers: Further findings from a 10-site evaluation. Retrieved June 15, 2012, from http://www.mdrc.org/publications/155/execsum.html
Kemple, J. J. (2001, December). Career academies: Impacts on students' initial
transitions to post-secondary education and employment. Retrieved June 15, 2012, from http://www.mdrc.org/publications/105/overview.html
Kemple, J. J. (2004, March). Career academies: Impacts on labor market outcomes and
educational attainment. Retrieved June 15, 2012, from http://www.mdrc.org/publications/366/overview.html
Kemple, J. J., Poglinco, S. M., & Snipes, J. C. (1999, May). Career Academies: Building
career awareness and work-based learning activities through employer partnerships. Retrieved June 15, 2012, from http://www.mdrc.org/publications/70/execsum.html
Kemple, J. J., & Rock, J. L. (1996, July). Career academies: Early implementation
lessons from a 10-site evaluation. Retrieved June 15, 2012, from http://www.mdrc.org/publications/162/execsum.html
Kemple, J. J., & Snipes, J. C. (2000, March). Career academies: Impacts on students'
engagement and performance in high school. Retrieved June 15, 2012, from http://www.mdrc.org/publications/41/execsum.html

177
Kemple, J. J., & Willner, C. J. (2008, June). Career academies: Long-term impacts on labor market outcomes, educational attainment, and transitions to adulthood. Retrieved June 15, 2012, from http://www.mdrc.org/publications/482/overview.html
Kim, J., & Mueller, C. W. (1978). Introduction to factor analysis. Newbury Park, CA:
Sage Publications, Inc. Krumboltz, J. D., Mitchell, A. M., & Jones, G. B. (1976). A social learning theory of
career selection. The Counseling Psychologist, 6(1), 71-81. Lee, V. E., & Bryk, A. S. (1988). Curriculum tracking as mediating the social distribution
of high school achievement. Sociology of Education, 61(2), 78-94. Lent, R. W., & Brown, S. D. (2006). Integrating person and situation perspectives on
work satisfaction: A social-cognitive view. Journal of Vocational Behavior, 69(2), 236-247.
Lent, R. W., Brown, S. D., & Hackett, G. (1994). Toward a unifying social cognitive
theory of career and academic interest, choice, and performance. Journal of Vocational Behavior, (45), 79-122.
Levesque, K., & Hudson, L. (2003a). Public high school graduates who participated in
vocational/technical education: 1982-1998 (NCES 2003-024). Washington, D.C: U.S. Department of Education.
Levesque, K., & Hudson, L. (2003b). Trends in high school vocational/technical
coursetaking: 1982-1998 (NCES 2003-025). Washington, D.C.: U.S. Department of Education.
Levesque, K., Laird, J., Hensley, E., Choy, S. P., Cataldi, E. F., & Hudson, L. (2008).
Career and technical education in the United States: 1990 to 2005 (NCES 2008-035). Washington, D.C.: U.S. Department of Education.
Levesque, K., Lauen, D., Teitelbaum, P., Alt, M., & Librera, S. (2000). Vocational
education in the United States: Toward the year 2000 (NCES 2000-029). Washington, D.C.: U.S. Department of Education.
Lewis, T. (2007). Social inequality in education: A constraint on an American high-skills
future. Curriculum Inquiry, 37(4), 329-349. Lewis, T., & Cheng, S. (2006). Tracking expectations, and the transformation of
vocational education. American Journal of Education, 113(1), 67-99.

178
Linnehan, F. (1996). Measuring the effectiveness of a career academy program from an employer's perspective. Educational Evaluation and Policy Analysis, 18(1), 73-89.
Lucas, S. R., & Berends, M. (2002). Sociodemographic diversity, correlated
achievement, and de facto tracking. Sociology of Education, 75(4), 328-348. Maldonado, C. (2006). Does generation status matter? An examination of Latino college
completers. Online Journal for Workforce Education and Development, 1(5), 1-28. Retrieved from http://wed.siu.edu/journal/volume5/latino.htm
Manpower Demonstration Research Corporation (MDRC) (2011). Career academies.
Retrieved October 22, 2011, from http://www.mdrc.org/project_29_1.html Maxwell, N. L., & Rubin, V. (1997). The relative impact of a career academy on post-
secondary work and education skills in urban, public high schools. Retrieved from http://www.eric.ed.gov/ERICWebPortal/contentdelivery/servlet/ERICServlet?accno=ED436652
Maxwell, N. L., & Rubin, V. (2000). High school career academies: A pathway to
educational reform in urban schools? (1st ed.). Kalamazoo, MI: Upjohn Institute for Employment Research.
Mayer, A. (2008). Understanding how U.S. secondary schools sort students for
instructional purposes: Are all students being served equally? American Secondary Education, 36(2), 7-25.
MDRC (2012). Career academies project: Linking education and careers. Retrieved
September 16, 2012, from http://www.mdrc.org/project_29_1.html Medrich, E., Brown, C., Henke, R., & Ross, L. (1992). Overview and inventory of state
requirements for school coursework and attendance. Washington, D.C.: U.S. Department of Education.
Mitchell, L. K., & Krumboltz, J. D. (1990). Social learning approach to career decision
making: Krumboltz's theory. In D. Brown & L. Brooks (Eds.), Career choice and development: Applying contemporary theories to practice (2nd ed., pp. 145-196). San Fransisco, CA: Jossey-Bass.
Moser, K. (2008). Americans favor career and technical colleges over community
colleges, poll finds. The Chronicle of Higher Education, 54(40), 1. Nall, H. (1997). Vocational education and the African American experience: An
historical and philosophical perspective. Journal of Intergroup Relations, 24(3), 26-48.

179
National Academy Foundation (2012). NAF statistics and research. Retrieved from http://naf.org/statistics-and-research
National Association of State Directors of Career Technical Education Consortium
(2011). The 16 career clusters. Retrieved October 22, 2011, from http://www.careertech.org/career-clusters/glance/careerclusters.html
National Career Academy Coalition (2011). History of career academies. Retrieved
October 22, 2011, from http://www.ncacinc.com/index.php?option=com_content&view=article&id=1&Itemid=22
National Center for Education Statistics (NCES) (2011). Career/technical education
(CTE). Retrieved July 1, 2011, from http://nces.ed.gov/surveys/ctes/index.asp National Guidance Research Forum (2004, August 29). Learning theory of careers choice
& counselling. Retrieved February 26, 2012, from http://www.guidance-research.org/EG/impprac/ImpP2/traditional/learning-theory/view?searchterm=social learning theory
Ndura, E., Robinson, M., & Ochs, G. (2003). Minority students in high school advanced
placement courses: Opportunity and equity denied. American Secondary Education, 32(1), 21-38.
Oakes, J. (1987). Tracking in secondary schools: A contextual perspective. Educational
Psychologist, 22(2), 129-153. Oakes, J., & Guiton, G. (1995). Matchmaking: the dynamics of high school tracking
decisions. American Educational Research Journal, 32(1), 3-33. Orr, M. T. (2005). Career academies as a professionally engaging and supportive
teaching experience. Education and Urban Society, 37(4), 453-489. Orr, M. T., Bailey, T., Hughes, K. L., Karp, M. M., & Kienzl, G. S. (2004, February).
The National Academy Foundation's career academies: Shaping postsecondary transitions. National Academy Foundation.
Overbay, A. E. (n.d.). Career values and perceptions of agricultural careers of gifted and
talented students in the Virginia Governor's School for Agriculture (Doctoral dissertation, Virginia Polytechnic Institute and State University). retrieved from http://scholar.lib.vt.edu/theses/available/etd-11132006-165917/
Palmer, R. T., & Wood, J. L. (Eds.). (2013). Community colleges and STEM: Examining
underrepresented racial and ethnic minorities. New York, NY: Routledge.

180
Pampel, F. C. (2000). Logistic regression: A primer. Sage University Papers Series on Quantitative Applications in the Social Sciences, 07-132. Thousand Oaks, CA: Sage Publications, Inc.
Patton, W., & McMahon, M. (2006). Career development and systems theory (2nd ed.).
Rotterdam, The Netherlands: Sense Publishers. Perry, J. C. (2008). School engagement among urban youth of color: Criterion pattern
effects of vocational exploration and racial identity. Journal of Career Development, 34(4), 397-422.
Pierce, K. B. (2013). Do mathematics and reading competencies integrated into career
and technical education courses improve high school student state assessment scores (Doctoral dissertation, University of South Florida, Tampa, USA). retrieved from http://scholarcommons.usf.edu/etd/4563/
Plank, S., DeLuca, S., & Estacion, A. (2005). Dropping out of high school and the place
of career and technical education: A survival analysis of surviving high school. St. Paul, MN: National Research Center for Career and Technical Education.
Polizzi, T. B., & Ethington, C. A. (1998). Factors affecting gains in career preparation: A
comparison on vocational groups. Community College Journal of Research and Practice, 22(1), 39-52.
Rayfield, J., Compton, K., Doerfert, D., Fraze, S., & Akers, C. (2008). Factors that
influence the decision to participate in youth organizations in rural high schools in three states. Journal of Agricultural Education, 49(4), 83-95.
Rehm, M. L. (2008). Career and technical education teachers' perceptions of culturally
diverse classes: Rewards, difficulties, and useful teaching strategies. Career and Technical Education Research, 33(1), 45-64.
Rosenthal, N. (1995). The nature of occupational employment growth: 1983-93. Monthly
Labor Review, (118), 45-54. Rubin, B. C. (2006a). This issue. Theory Into Practice, 45(1), 1-3. Rubin, B. C. (2006b). Tracking and detracking: Debates, evidence, and best practices for
a heterogeneous world. Theory Into Practice, 45(1), 4-14. Ryken, A. E. (2006). "Goin' somewhere": How career and technical education programs
support and constrain urban youths' career decision-making. Career and Technical Education Research, 31(1), 49-71.
Scott, J. L., & Sarkees-Wircenski, M. (2008). Overview of career and technical
education (4 ed.). Orland Park, IL: American Technical Publishers, Inc.

181
Silverberg, M., Warner, E., Fong, M., & Goodwin, D. (2004, June). National assessment of vocational education: Final report to Congress. Washington,D.C.: U.S. Department of Education.
Smith, T. J. (2002, January). Course taking, test preparation, and career academy
programs: Findings from a field study. Retrieved June 15, 2012, from http://www.mdrc.org/publications/91/abstract.html
Smith, T. J. (2008, August). Striking the balance: Career academies combine academic
rigor and workplace relevance. Retrieved June 15, 2012, from http://www.betterhighschools.org/docs/MDRC_CareerAcademiesSnapshot_08-01-08.pdf
Stern, D., Dayton, C., & Raby, M. (2000, October). Career academies: Building blocks
for reconstructing American high schools (ED455445). Career Academy Support Network.
Stern, D., Raby, M., & Dayton, C. (1992). Career academies: Partnerships for
reconstructing American high schools (1st ed.). San Fransisco, CA: Jossey-Bass. Stone, III, J. R., Alfeld, C., Pearson, D., Lewis, M. V., & Jensen, S. (2006, July).
Building academic skills in context: Testing the value of enhanced math learning in CTE. Columbus, OH: The Ohio State University.
Syed, M., & Chemers, M. M. (2011). Ethnic minorities and women in STEM: Casting a
wide net to address a persistent social problem. The Society for the Psychological Study of Social Issues, 67(3), 435-441.
Thompson, B. (2004). Exploratory and confirmatory factor analysis. Washington, D.C.:
American Psychological Association. Thompson, M. S., Gorin, J. S., Obeidat, K., & Chen, Y. (2006). Understanding
differences in postsecondary educational attainment: A comparison of predictive measures for black and white students. Journal of Negro Education, 75(3), 546-562.
Trochim, W., & Donnelly, J. P. (2007). The research methods knowledge base (3 ed.).
Mason, OH: Cengage Learning. Urquhart, S. (2008). State of opportunity: Building a competitive workforce for Florida
[PowerPoint slides]. Retrieved February 4, 2013, from http://www.onestops.com/staff/WFI/Steve_U_Board%20Presentation_Region_11%20(FINAL)_files/frame.htm

182
U.S. Department of Education (2011). Carl D. Perkins Career and Technical Education Act of 2006. Retrieved October 22, 2011, from http://www2.ed.gov/policy/sectech/leg/perkins/index.html
Usoff, C. (1998). Accounting students' perceptions of important skills for career success.
Journal of Education for Business, 73(4), 215-220. Vail, K. (2007). A changing world. American School Board Journal, 194(2), 15-19. Volusia County - Division of Economic Development (2012, April 18). Volusia County,
Florida 2012 Data Report. Retrieved July 15, 2012, from http://www.floridabusiness.org/stats.htm
Volusia County Schools (2012). Demographics and statistics. Retrieved December 17,
2012, from http://myvolusiaschools.org/Community-Information-Services/Pages/Demographics-and-Statistics.aspx
Whalen, D. F., & Shelley, M. C. (2010). Academic success for STEM and non-STEM
majors. Journal of STEM Education, 11(1 & 2), 45-60. Wirsching, T., & Stenberg, L. (1992). Determinants of Idaho Hispanic female
participation in adult vocational education programs. Journal of Vocational Education Research, 17(3), 35-61.
Wooden, O. S. (n.d.). The African American tradition and college preparation for
African American high school students in Southwest Georgia. Dissertation Abstracts International: Section A. Humanities and Social Sciences.

183
APPEDNDICES

184
Appendix A: Six-Year Trends in Career Academy Enrollment
Figure A1: Comparison of all district high school students vs. career academy students.
Figure A2: Proportion of district high school students actively enrolled in a career academy by school year.
2006-07 2007-08 2008-09 2009-10 2010-11 2011-12District 19,888 19,543 18,868 18,899 18,700 18,730 Academies 3,361 3,623 3,740 3,579 4,545 3,827
0
5,000
10,000
15,000
20,000
25,000Hi
gh S
choo
l Enr
ollm
ents
16.9%
18.5% 19.8%18.9%
24.3%
20.4%
0.0%
5.0%
10.0%
15.0%
20.0%
25.0%
30.0%
2006-07 2007-08 2008-09 2009-10 2010-11 2011-12
Perc
enta
ge o
f Aca
dem
y St
uden
ts
School Year

185
Appendix A: Six-Year Trends in Career Academy Enrollment
Figure A3: Gender comparison of all district high school students vs. career academy students by school year. Data labels show gender proportions for career academy students.
Figure A4: Gender proportions of students enrolled in career academies within the Agriculture, Food & Natural Resources career cluster.
50.5%50.2%
51.4%51.8%
52.6%
49.2%49.5% 49.8%
48.6%48.2%
47.4%
50.8%
47.0%
48.0%
49.0%
50.0%
51.0%
52.0%
53.0%
2006-07 2007-08 2008-09 2009-10 2010-11 2011-12
Perc
enta
ge o
f Stu
dent
s by
Gend
er
School Year
All Academies - Male
All Academies - Female
District High Schools - Male
District High Schools - Female
42.7% 45.1%49.1%
51.8%
50.0% 48.6%
57.3% 54.9%50.9%
48.2%
50.0% 51.4%
0.0%
10.0%
20.0%
30.0%
40.0%
50.0%
60.0%
70.0%
80.0%
90.0%
100.0%
2006-07 2007-08 2008-09 2009-10 2010-11 2011-12
Perc
enta
ge o
f Stu
dent
s by
Gend
er
Agriculture, Food & Natural Resources
Male
Female

186
Appendix A: Six-Year Trends in Career Academy Enrollment
Figure A5: Gender proportions of students enrolled in career academies within the Architecture & Construction career cluster.
Figure A6: Gender proportions of students enrolled in career academies within the Arts, A/V Technology & Communications career cluster.
79.7% 81.8% 84.1%
87.1%
86.8%85.0%
20.3% 18.2%15.9%
12.9%
13.2% 15.0%
0.0%
10.0%
20.0%
30.0%
40.0%
50.0%
60.0%
70.0%
80.0%
90.0%
100.0%
2006-07 2007-08 2008-09 2009-10 2010-11 2011-12
Perc
enta
ge o
f Stu
dent
s by
Gend
er
Architecture & Construction
Male
Female
71.3%69.6%
47.8%
38.5% 38.1%
42.5%28.7% 30.4%
52.2%61.5%
61.9%57.5%
0.0%
10.0%
20.0%
30.0%
40.0%
50.0%
60.0%
70.0%
80.0%
90.0%
100.0%
2006-07 2007-08 2008-09 2009-10 2010-11 2011-12
Perc
enta
ge o
f Stu
dent
s by
Gend
er
Arts, A/V Technology & Communications
Male
Female

187
Appendix A: Six-Year Trends in Career Academy Enrollment
Figure A7: Gender proportions of students enrolled in career academies within the Business, Management & Administration career cluster. The career academy in this cluster reverted back to a standard CTE program after the 2009-10 school year.
Figure A8: Gender proportions of students enrolled in career academies within the Education & Training career cluster.
30.0%
23.8%
42.9%
70.0%76.2%
57.1%
0.0%
10.0%
20.0%
30.0%
40.0%
50.0%
60.0%
70.0%
80.0%
90.0%
100.0%
2007-08 2008-09 2009-10
Perc
enta
ge o
f Stu
dent
s by
Gend
er
Business, Management & Administration
Male
Female
6.7%
18.4%
2.6% 8.0% 7.4% 12.5%
93.3%
81.6%
97.4% 92.0% 92.6% 87.5%
0.0%
10.0%
20.0%
30.0%
40.0%
50.0%
60.0%
70.0%
80.0%
90.0%
100.0%
2006-07 2007-08 2008-09 2009-10 2010-11 2011-12
Perc
enta
ge o
f Stu
dent
s by
Gend
er
Education & Training
Male
Female

188
Appendix A: Six-Year Trends in Career Academy Enrollment
Figure A9: Gender proportions of students enrolled in career academies within the Finance career cluster.
Figure A10: Gender proportions of students enrolled in career academies within the Government & Public Administration and Law, Public Safety, Corrections & Security career clusters. As a result of a program change, these career academies migrated from the GPA cluster to the LPSC&S cluster.
48.0% 43.4% 43.5% 44.2% 42.9%
44.1%
52.0% 56.6% 56.5% 55.8% 57.1%
55.9%
0.0%
10.0%
20.0%
30.0%
40.0%
50.0%
60.0%
70.0%
80.0%
90.0%
100.0%
2006-07 2007-08 2008-09 2009-10 2010-11 2011-12
Perc
enta
ge o
f Stu
dent
s by
Gend
er
Finance
Male
Female
33.2%40.9%
32.2%
41.5%36.4%
39.8%
66.8%59.1%
67.8%58.5%
63.6%
60.2%
0.0%10.0%20.0%30.0%40.0%50.0%60.0%70.0%80.0%90.0%
100.0%
2006-07 2007-08 2008-09 2009-10 2010-11 2011-12
Perc
enta
ge o
f Stu
dent
s by
Gend
er
Government & Public Administration andLaw, Public Safety, Corrections & Security
Male
Female

189
Appendix A: Six-Year Trends in Career Academy Enrollment
Figure A11: Gender proportions of students enrolled in career academies within the Health Science career cluster.
Figure A12: Gender proportions of students enrolled in career academies within the Hospitality & Tourism career cluster.
19.8% 25.9%30.6% 29.8% 30.8%
31.1%
80.2%74.1%
69.4% 70.2% 69.2% 68.9%
0.0%
10.0%
20.0%
30.0%
40.0%
50.0%
60.0%
70.0%
80.0%
90.0%
100.0%
2006-07 2007-08 2008-09 2009-10 2010-11 2011-12
Perc
enta
ge o
f Stu
dent
s by
Gend
er
Health Science
Male
Female
32.2%25.7% 24.5%
32.4% 33.3%32.6%
67.8%74.3% 75.5%
67.6% 66.7% 67.4%
0.0%
10.0%
20.0%
30.0%
40.0%
50.0%
60.0%
70.0%
80.0%
90.0%
100.0%
2006-07 2007-08 2008-09 2009-10 2010-11 2011-12
Perc
enta
ge o
f Stu
dent
s by
Gend
er
Hospitality & Tourism
Male
Female

190
Appendix A: Six-Year Trends in Career Academy Enrollment
Figure A13: Gender proportions of students enrolled in career academies within the Information Technology career cluster.
Figure A14: Gender proportions of students enrolled in career academies within the Marketing career cluster. While there were marketing education programs offered in the school district in prior years, none were connected to a career academy until 2008-09.
59.6% 52.4% 59.2% 59.2%61.6% 66.6%
40.4% 47.6% 40.8% 40.8%38.4% 33.4%
0.0%
10.0%
20.0%
30.0%
40.0%
50.0%
60.0%
70.0%
80.0%
90.0%
100.0%
2006-07 2007-08 2008-09 2009-10 2010-11 2011-12
Perc
enta
ge o
f Stu
dent
s by
Gend
er
Information Technology
Male
Female
23.3%28.3% 31.3%
45.4%
76.7% 71.7%
68.8%
54.6%
0.0%
10.0%
20.0%
30.0%
40.0%
50.0%
60.0%
70.0%
80.0%
90.0%
100.0%
2008-09 2009-10 2010-11 2011-12
Perc
enta
ge o
f Stu
dent
s by
Gend
er
Marketing
Male
Female

191
Appendix A: Six-Year Trends in Career Academy Enrollment
Figure A15: Gender proportions of students enrolled in career academies within the Science, Technology, Engineering & Mathematics (STEM) career cluster.
68.7% 68.7% 67.9% 64.6%58.2% 54.6%
31.3% 31.3% 32.1% 35.4%
41.8% 45.4%
0.0%
10.0%
20.0%
30.0%
40.0%
50.0%
60.0%
70.0%
80.0%
90.0%
100.0%
2006-07 2007-08 2008-09 2009-10 2010-11 2011-12
Perc
enta
ge o
f Stu
dent
s by
Gend
er
Science, Technology, Engineering & Mathematics (STEM)
Male
Female

192
Appendix A: Six-Year Trends in Career Academy Enrollment
Figure A16: Percentage of career academy students by race/ethnicity. This graph represents 99.7% of all career academy students enrolled in 2006-07 and 99.8% of all career academy students enrolled in 2011-12. Enrollment numbers of students from American Indian and/or Pacific Islander heritage did not warrant inclusion in the graph.
Figure A17: Proportion of career academy Caucasian students over time.
0.0%
10.0%
20.0%
30.0%
40.0%
50.0%
60.0%
70.0%
80.0%
90.0%
2006-07 2007-08 2008-09 2009-10 2010-11 2011-12
Perc
enta
ge o
f Stu
dent
s by
Race
/Eth
nicit
y
School Year
African American
Asian
Caucasian
Hispanic
Multi-Racial
83.7%
81.3%80.0%
76.9%
75.2%
71.7%
70.0%
72.0%
74.0%
76.0%
78.0%
80.0%
82.0%
84.0%
2006-07 2007-08 2008-09 2009-10 2010-11 2011-12
Perc
enta
ge o
f Stu
dent
s by
Race
/Eth
nicit
y
School Year
Caucasian
Pacific Islander

193
Appendix A: Six-Year Trends in Career Academy Enrollment
Figure A18: Proportion of career academy Students of Color by race/ethnicity over time.
Figure A19: Comparison of all African American district high school students vs. African American career academy students by school year.
9.3% 9.4% 9.6%10.3% 10.4%
11.7%
0.9% 1.4% 1.6% 2.0% 1.7% 1.9%
4.3%
5.5%6.0%
8.5% 9.6%
11.3%
1.5%2.2% 2.6% 2.2% 2.7%
3.2%
0.0%
2.0%
4.0%
6.0%
8.0%
10.0%
12.0%
14.0%
2006-07 2007-08 2008-09 2009-10 2010-11 2011-12
Perc
enta
ge o
f Stu
dent
s by
Race
/Eth
nicit
y
School Year
African American
Asian
Hispanic
Multi-Racial
9.3% 9.4% 9.6% 10.3% 10.4%11.7%
13.9% 13.4% 13.3% 13.0% 12.8% 13.2%
0.0%
5.0%
10.0%
15.0%
20.0%
25.0%
2006-07 2007-08 2008-09 2009-10 2010-11 2011-12
Perc
enta
ge o
f Stu
dent
s by
Race
/Eth
nicit
y
School Year
All Academies
District High Schools
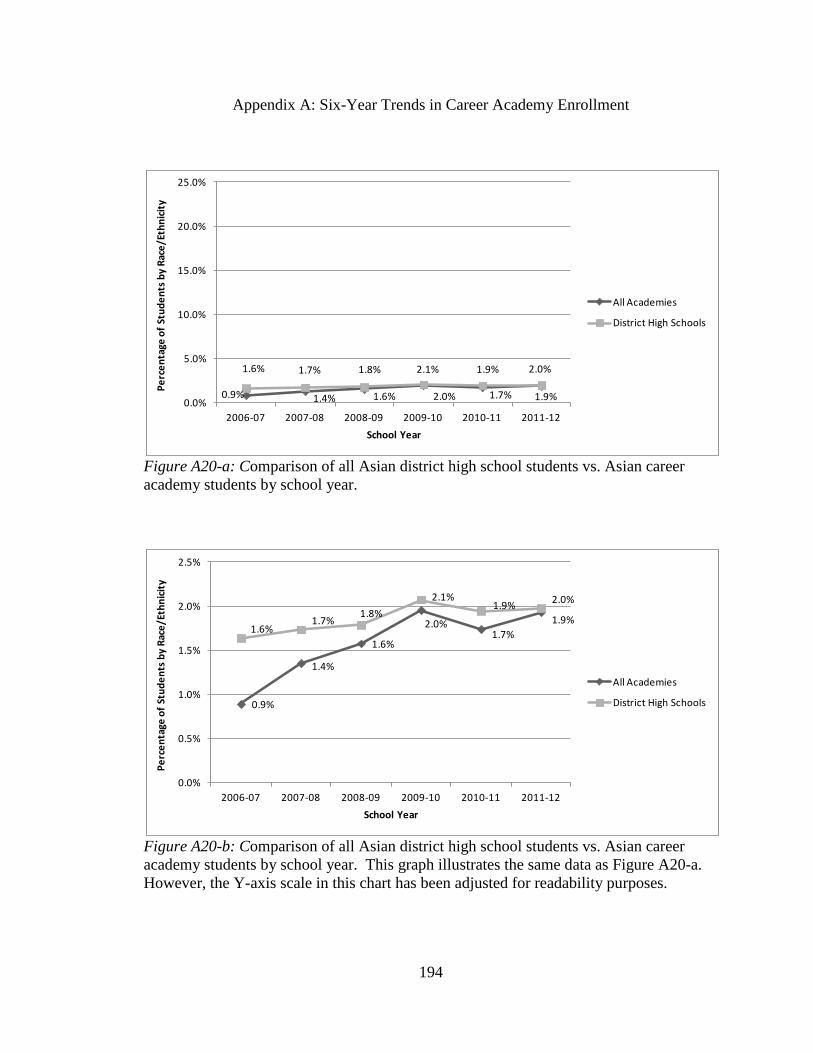
194
Appendix A: Six-Year Trends in Career Academy Enrollment
Figure A20-a: Comparison of all Asian district high school students vs. Asian career academy students by school year.
Figure A20-b: Comparison of all Asian district high school students vs. Asian career academy students by school year. This graph illustrates the same data as Figure A20-a. However, the Y-axis scale in this chart has been adjusted for readability purposes.
0.9% 1.4% 1.6% 2.0% 1.7% 1.9%
1.6% 1.7% 1.8% 2.1% 1.9% 2.0%
0.0%
5.0%
10.0%
15.0%
20.0%
25.0%
2006-07 2007-08 2008-09 2009-10 2010-11 2011-12
Perc
enta
ge o
f Stu
dent
s by
Race
/Eth
nicit
y
School Year
All Academies
District High Schools
0.9%
1.4%
1.6%
2.0%1.7%
1.9%1.6%
1.7%1.8%
2.1%1.9% 2.0%
0.0%
0.5%
1.0%
1.5%
2.0%
2.5%
2006-07 2007-08 2008-09 2009-10 2010-11 2011-12
Perc
enta
ge o
f Stu
dent
s by
Race
/Eth
nicit
y
School Year
All Academies
District High Schools

195
Appendix A: Six-Year Trends in Career Academy Enrollment
Figure A21: Comparison of all Caucasian district high school students vs. Caucasian career academy students by school year.
Figure A22: Comparison of all Hispanic district high school students vs. Hispanic career academy students by school year.
83.7%81.3%
80.0%
76.9%75.2%
71.7%
69.0%68.4% 67.2%
65.7% 65.5% 64.7%
60.0%
65.0%
70.0%
75.0%
80.0%
85.0%
2006-07 2007-08 2008-09 2009-10 2010-11 2011-12
Perc
enta
ge o
f Stu
dent
s by
Race
/Eth
nicit
y
School Year
All Academies
District High Schools
4.3%5.5% 6.0%
8.5%9.6%
11.3%
13.3% 14.0% 14.4%16.1% 16.5% 16.8%
0.0%
5.0%
10.0%
15.0%
20.0%
25.0%
2006-07 2007-08 2008-09 2009-10 2010-11 2011-12
Perc
enta
ge o
f Stu
dent
s by
Race
/Eth
nicit
y
School Year
All Academies
District High Schools

196
Appendix A: Six-Year Trends in Career Academy Enrollment
Figure A23-a: Comparison of all Multi-Racial district high school students vs. Multi-Racial career academy students by school year.
Figure A23-b: Comparison of all Multi-Racial district high school students vs. Multi-Racial career academy students by school year. This graph illustrates the same data as Figure A23-a. However, the Y-axis scale in this chart has been adjusted for readability purposes.
1.5% 2.2% 2.6% 2.2% 2.7% 3.2%
1.9% 2.4%3.0% 2.9% 2.9% 2.9%
0.0%
5.0%
10.0%
15.0%
20.0%
25.0%
2006-07 2007-08 2008-09 2009-10 2010-11 2011-12
Perc
enta
ge o
f Stu
dent
s by
Race
/Eth
nicit
y
School Year
All Academies
District High Schools
1.5%
2.2%
2.6%
2.2%
2.7%
3.2%
1.9%
2.4%
3.0% 2.9% 2.9%2.9%
0.0%
0.5%
1.0%
1.5%
2.0%
2.5%
3.0%
3.5%
2006-07 2007-08 2008-09 2009-10 2010-11 2011-12
Perc
enta
ge o
f Stu
dent
s by
Race
/Eth
nicit
y
School Year
All Academies
District High Schools

197
Appendix A: Six-Year Trends in Career Academy Enrollment
Figure A24: Racial/ethnic proportions of students enrolled in career academies within the Agriculture, Food & Natural Resources career cluster. Data labels indicate percentages of Caucasian and Hispanic enrollments.
Figure A25: Racial/ethnic proportions of students enrolled in career academies within the Architecture & Construction career cluster. Data labels indicate percentages of Caucasian and Hispanic enrollments.
88.9% 89.5% 90.9%88.1% 84.2% 80.6%
2.9% 2.1% 8.2% 8.9% 11.4% 12.2%
0.0%
10.0%
20.0%
30.0%
40.0%
50.0%
60.0%
70.0%
80.0%
90.0%
100.0%
2006-07 2007-08 2008-09 2009-10 2010-11 2011-12
Perc
enta
ge o
f Stu
dent
s by
Race
/Eth
nicit
y
Agriculture, Food & Natural Resources
African American
Asian
Caucasian
Hispanic
Multi-Racial
71.0%
66.4% 67.8% 69.8%70.9%
77.7%
7.2% 10.9% 13.6% 15.7% 15.7%10.9%
0.0%
10.0%
20.0%
30.0%
40.0%
50.0%
60.0%
70.0%
80.0%
90.0%
100.0%
2006-07 2007-08 2008-09 2009-10 2010-11 2011-12
Perc
enta
ge o
f Stu
dent
s by
Race
/Eth
nicit
y
Architecture & Construction
African American
Asian
Caucasian
Hispanic
Multi-Racial

198
Appendix A: Six-Year Trends in Career Academy Enrollment
Figure A26: Racial/ethnic proportions of students enrolled in career academies within the Arts, A/V Technology & Communications career cluster. Data labels indicate percentages of Caucasian and Hispanic enrollments.
Figure A27: Racial/ethnic proportions of students enrolled in career academies within the Business, Management & Administration career cluster. Data labels indicate percentages of Caucasian and Hispanic enrollments. The career academy in this cluster reverted back to a standard CTE program after the 2009-10 school year.
84.6%79.4%
67.4%
58.2% 56.3% 56.9%
2.9% 5.4%
15.2% 17.6%
21.4% 23.0%
0.0%
10.0%
20.0%
30.0%
40.0%
50.0%
60.0%
70.0%
80.0%
90.0%
100.0%
2006-07 2007-08 2008-09 2009-10 2010-11 2011-12
Perc
enta
ge o
f Stu
dent
s by
Race
/Eth
nicit
y
Arts, A/V Technology & Communications
African American
Asian
Caucasian
Hispanic
Multi-Racial
45.0% 47.6%
14.3%
25.0% 19.0%
42.9%
0.0%
10.0%
20.0%
30.0%
40.0%
50.0%
60.0%
70.0%
80.0%
90.0%
100.0%
2007-08 2008-09 2009-10
Perc
enta
ge o
f Stu
dent
s by
Race
/Eth
nicit
y
Business, Management & Administration
African American
Asian
Caucasian
Hispanic
Multi-Racial
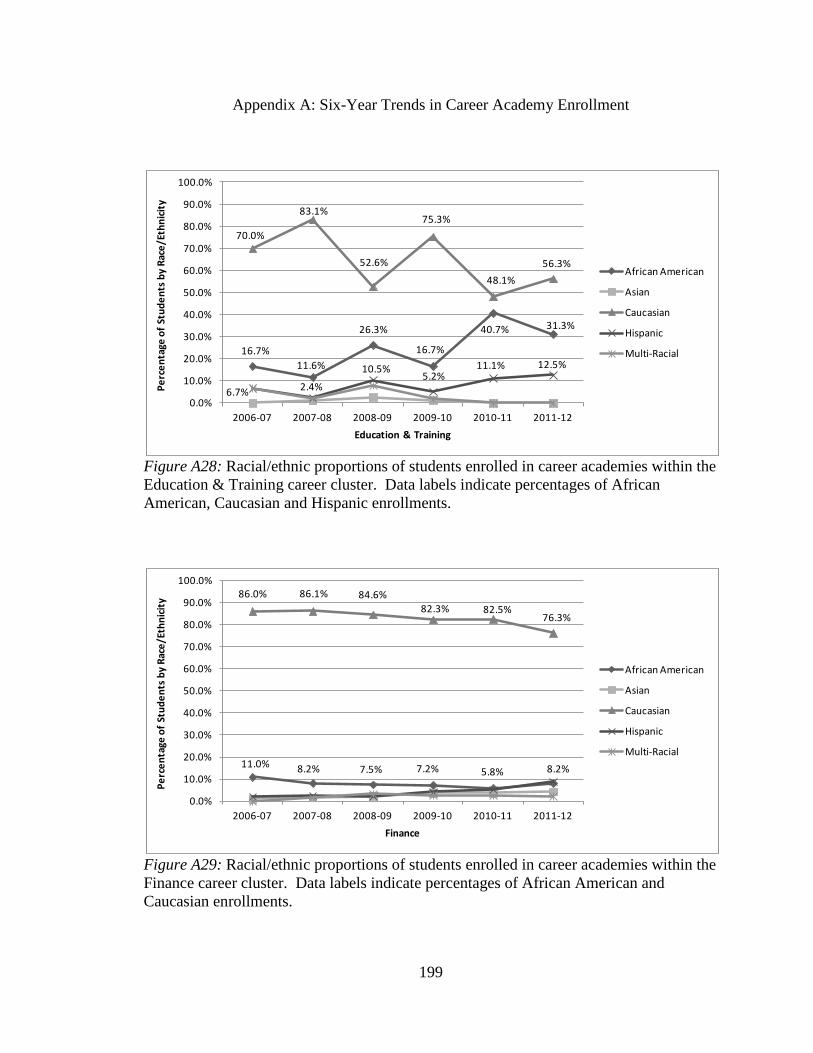
199
Appendix A: Six-Year Trends in Career Academy Enrollment
Figure A28: Racial/ethnic proportions of students enrolled in career academies within the Education & Training career cluster. Data labels indicate percentages of African American, Caucasian and Hispanic enrollments.
Figure A29: Racial/ethnic proportions of students enrolled in career academies within the Finance career cluster. Data labels indicate percentages of African American and Caucasian enrollments.
16.7%11.6%
26.3%
16.7%
40.7% 31.3%
70.0%
83.1%
52.6%
75.3%
48.1%56.3%
6.7% 2.4%
10.5%5.2%
11.1% 12.5%
0.0%
10.0%
20.0%
30.0%
40.0%
50.0%
60.0%
70.0%
80.0%
90.0%
100.0%
2006-07 2007-08 2008-09 2009-10 2010-11 2011-12
Perc
enta
ge o
f Stu
dent
s by
Race
/Eth
nicit
y
Education & Training
African American
Asian
Caucasian
Hispanic
Multi-Racial
11.0% 8.2% 7.5% 7.2% 5.8% 8.2%
86.0% 86.1% 84.6%82.3% 82.5%
76.3%
0.0%
10.0%
20.0%
30.0%
40.0%
50.0%
60.0%
70.0%
80.0%
90.0%
100.0%
2006-07 2007-08 2008-09 2009-10 2010-11 2011-12
Perc
enta
ge o
f Stu
dent
s by
Race
/Eth
nicit
y
Finance
African American
Asian
Caucasian
Hispanic
Multi-Racial

200
Appendix A: Six-Year Trends in Career Academy Enrollment
Figure A30: Racial/ethnic proportions of students enrolled in career academies within the Government & Public Administration and Law, Public Safety, Corrections & Security career clusters. Data labels indicate percentages of African American and Caucasian enrollments. As a result of a program change, these career academies migrated from the GPA cluster to the LPSC&S cluster.
Figure A31: Racial/ethnic proportions of students enrolled in career academies within the Health Science career cluster. Data labels indicate percentages of African American and Caucasian enrollments. Hispanic data closely mirrors that of African American students.
11.6%13.1%
8.7%
18.5%22.2%
19.4%
81.3% 79.0%86.0%
72.3%62.6% 64.1%
0.0%
10.0%
20.0%
30.0%
40.0%
50.0%
60.0%
70.0%
80.0%
90.0%
100.0%
2006-07 2007-08 2008-09 2009-10 2010-11 2011-12
Perc
enta
ge o
f Stu
dent
s by
Race
/Eth
nicit
y
Government & Public Administration and Law, Public Safety, Corrections & Security
African American
Asian
Caucasian
Hispanic
Multi-Racial
9.8%
10.4% 13.5% 12.3% 12.6% 14.7%
78.1% 74.7%
69.2% 69.2% 68.8% 66.2%
0.0%
10.0%
20.0%
30.0%
40.0%
50.0%
60.0%
70.0%
80.0%
90.0%
100.0%
2006-07 2007-08 2008-09 2009-10 2010-11 2011-12
Perc
enta
ge o
f Stu
dent
s by
Race
/Eth
nicit
y
Health Science
African American
Asian
Caucasian
Hispanic
Multi-Racial

201
Appendix A: Six-Year Trends in Career Academy Enrollment
Figure A32: Racial/ethnic proportions of students enrolled in career academies within the Hospitality & Tourism career cluster. Data labels indicate percentages of African American and Caucasian enrollments.
Figure A33: Racial/ethnic proportions of students enrolled in career academies within the Information Technology career cluster. Data labels indicate percentages of African American and Caucasian enrollments.
2.5% 5.0% 2.0%5.9%
9.2% 12.3%
91.5% 87.9% 89.8% 84.2%79.6% 75.9%
0.0%
10.0%
20.0%
30.0%
40.0%
50.0%
60.0%
70.0%
80.0%
90.0%
100.0%
2006-07 2007-08 2008-09 2009-10 2010-11 2011-12
Perc
enta
ge o
f Stu
dent
s by
Race
/Eth
nicit
y
Hospitality & Tourism
African American
Asian
Caucasian
Hispanic
Multi-Racial
22.5% 23.1%
10.9% 10.5% 11.3% 10.9%
71.9% 67.8%
79.7% 80.6% 79.6% 79.7%
0.0%
10.0%
20.0%
30.0%
40.0%
50.0%
60.0%
70.0%
80.0%
90.0%
100.0%
2006-07 2007-08 2008-09 2009-10 2010-11 2011-12
Perc
enta
ge o
f Stu
dent
s by
Race
/Eth
nicit
y
Information Technology
African American
Asian
Caucasian
Hispanic
Multi-Racial

202
Appendix A: Six-Year Trends in Career Academy Enrollment
Figure A34: Racial/ethnic proportions of students enrolled in career academies within the Marketing career cluster. Data labels indicate percentages of African American, Caucasian and Hispanic enrollments. While there were marketing education programs offered in the school district in prior years, none were connected to a career academy until 2008-09.
Figure A35: Racial/ethnic proportions of students enrolled in career academies within the Science, Technology, Engineering & Mathematics (STEM) career cluster. Data labels indicate percentages of Caucasian and Hispanic enrollments.
13.3%17.4% 17.5% 17.6%
46.7%
54.3% 52.5%
44.5%
30.0%
21.7% 22.5%
31.9%
0.0%
10.0%
20.0%
30.0%
40.0%
50.0%
60.0%
70.0%
80.0%
90.0%
100.0%
2008-09 2009-10 2010-11 2011-12
Perc
enta
ge o
f Stu
dent
s by
Race
/Eth
nicit
y
Marketing
African American
Asian
Caucasian
Hispanic
Multi-Racial
85.5% 84.2% 85.0%81.3% 78.1% 71.8%
3.2%
4.8% 3.2% 5.2% 7.7% 10.8%
0.0%
10.0%
20.0%
30.0%
40.0%
50.0%
60.0%
70.0%
80.0%
90.0%
100.0%
2006-07 2007-08 2008-09 2009-10 2010-11 2011-12
Perc
enta
ge o
f Stu
dent
s by
Race
/Eth
nicit
y
Science, Technology, Engineering & Mathematics (STEM)
African American
Asian
Caucasian
Hispanic
Multi-Racial
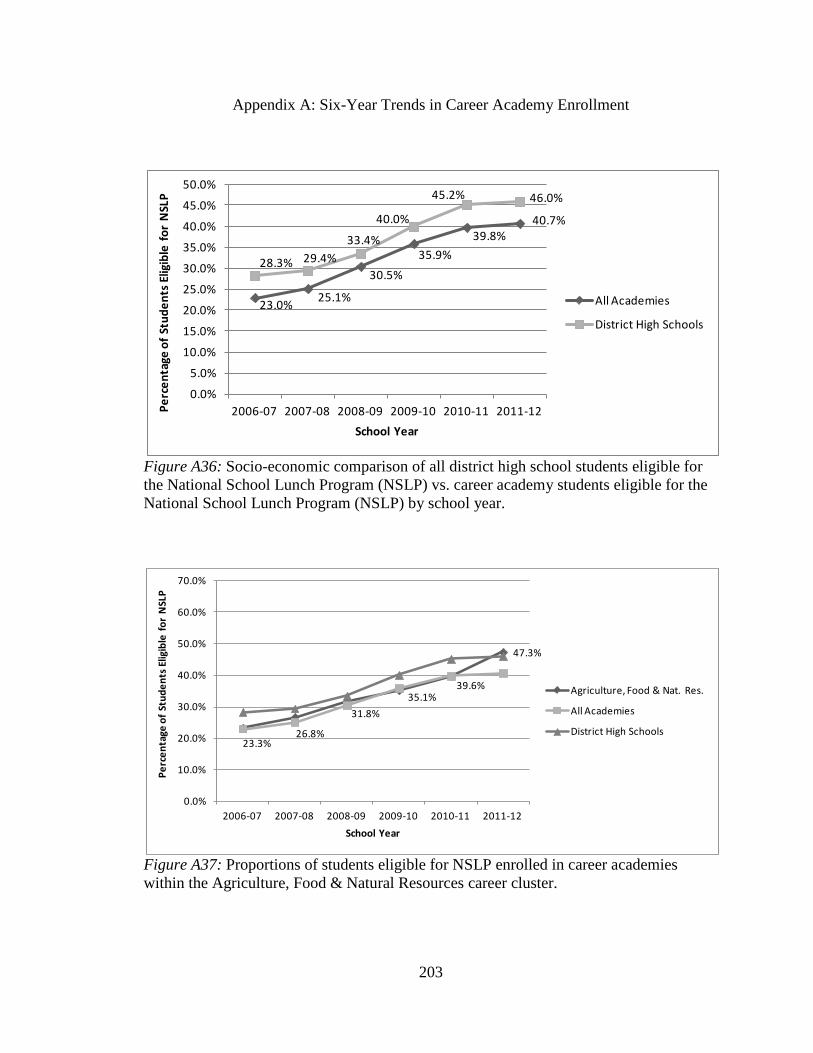
203
Appendix A: Six-Year Trends in Career Academy Enrollment
Figure A36: Socio-economic comparison of all district high school students eligible for the National School Lunch Program (NSLP) vs. career academy students eligible for the National School Lunch Program (NSLP) by school year.
Figure A37: Proportions of students eligible for NSLP enrolled in career academies within the Agriculture, Food & Natural Resources career cluster.
23.0% 25.1%
30.5%35.9%
39.8%40.7%
28.3% 29.4%33.4%
40.0%
45.2% 46.0%
0.0%
5.0%
10.0%
15.0%
20.0%
25.0%
30.0%
35.0%
40.0%
45.0%
50.0%
2006-07 2007-08 2008-09 2009-10 2010-11 2011-12Perc
enta
ge o
f Stu
dent
s Elig
ible
for
NSL
P
School Year
All Academies
District High Schools
23.3%26.8%
31.8%35.1%
39.6%
47.3%
0.0%
10.0%
20.0%
30.0%
40.0%
50.0%
60.0%
70.0%
2006-07 2007-08 2008-09 2009-10 2010-11 2011-12
Perc
enta
ge o
f Stu
dent
s Elig
ible
for
NSL
P
School Year
Agriculture, Food & Nat. Res.
All Academies
District High Schools

204
Appendix A: Six-Year Trends in Career Academy Enrollment
Figure A38: Proportions of students eligible for NSLP enrolled in career academies within the Architecture & Construction career cluster.
Figure A39: Proportions of students eligible for NSLP enrolled in career academies within the Arts, A/V Technology & Communications career cluster.
23.2%23.6%
29.4%
43.3%41.0%
35.8%
0.0%
10.0%
20.0%
30.0%
40.0%
50.0%
60.0%
70.0%
2006-07 2007-08 2008-09 2009-10 2010-11 2011-12
Perc
enta
ge o
f Stu
dent
s Elig
ible
for
NSL
P
School Year
Architecture & Construction
All Academies
District High Schools
24.0%
31.5%35.9%
44.0%
47.6%52.3%
0.0%
10.0%
20.0%
30.0%
40.0%
50.0%
60.0%
70.0%
2006-07 2007-08 2008-09 2009-10 2010-11 2011-12
Perc
enta
ge o
f Stu
dent
s Elig
ible
for
NSL
P
School Year
Arts, A/V Tech & Communication
All Academies
District High Schools

205
Appendix A: Six-Year Trends in Career Academy Enrollment
Figure A40: Proportions of students eligible for NSLP enrolled in career academies within the Business, Management & Administration career cluster. The career academy in this cluster reverted back to a standard CTE program after the 2009-10 school year.
Figure A41: Proportions of students eligible for NSLP enrolled in career academies within the Education & Training career cluster.
25.0%
47.6%
42.9%
0.0%
10.0%
20.0%
30.0%
40.0%
50.0%
60.0%
70.0%
2006-07 2007-08 2008-09 2009-10 2010-11 2011-12
Perc
enta
ge o
f Stu
dent
s Elig
ible
for
NSL
P
School Year
Business, Management and Administration
All Academies
District High Schools
43.3%
32.9%
28.9%
50.0%
59.3%
37.5%
0.0%
10.0%
20.0%
30.0%
40.0%
50.0%
60.0%
70.0%
2006-07 2007-08 2008-09 2009-10 2010-11 2011-12
Perc
enta
ge o
f Stu
dent
s Elig
ible
for
NSL
P
School Year
Education & Training
All Academies
District High Schools

206
Appendix A: Six-Year Trends in Career Academy Enrollment
Figure A42: Proportions of students eligible for NSLP enrolled in career academies within the Finance career cluster.
Figure A43: Proportions of students eligible for NSLP enrolled in career academies within the Government & Public Administration and Law, Public Safety, Corrections & Security career clusters. As a result of a program change, these career academies migrated from the GPA cluster to the LPSC&S cluster.
6.0% 8.2% 7.9% 10.0%
17.2% 19.8%
0.0%
10.0%
20.0%
30.0%
40.0%
50.0%
60.0%
70.0%
2006-07 2007-08 2008-09 2009-10 2010-11 2011-12
Perc
enta
ge o
f Stu
dent
s Elig
ible
for
NSL
P
School Year
Finance
All Academies
District High Schools
22.6%22.9%
36.8% 40.0%
51.5%45.6%
0.0%
10.0%
20.0%
30.0%
40.0%
50.0%
60.0%
70.0%
2006-07 2007-08 2008-09 2009-10 2010-11 2011-12
Perc
enta
ge o
f Stu
dent
s Elig
ible
for
NSL
P
School Year
Government & Public Administration and Law, Public Safety & Security All Academies
District High Schools
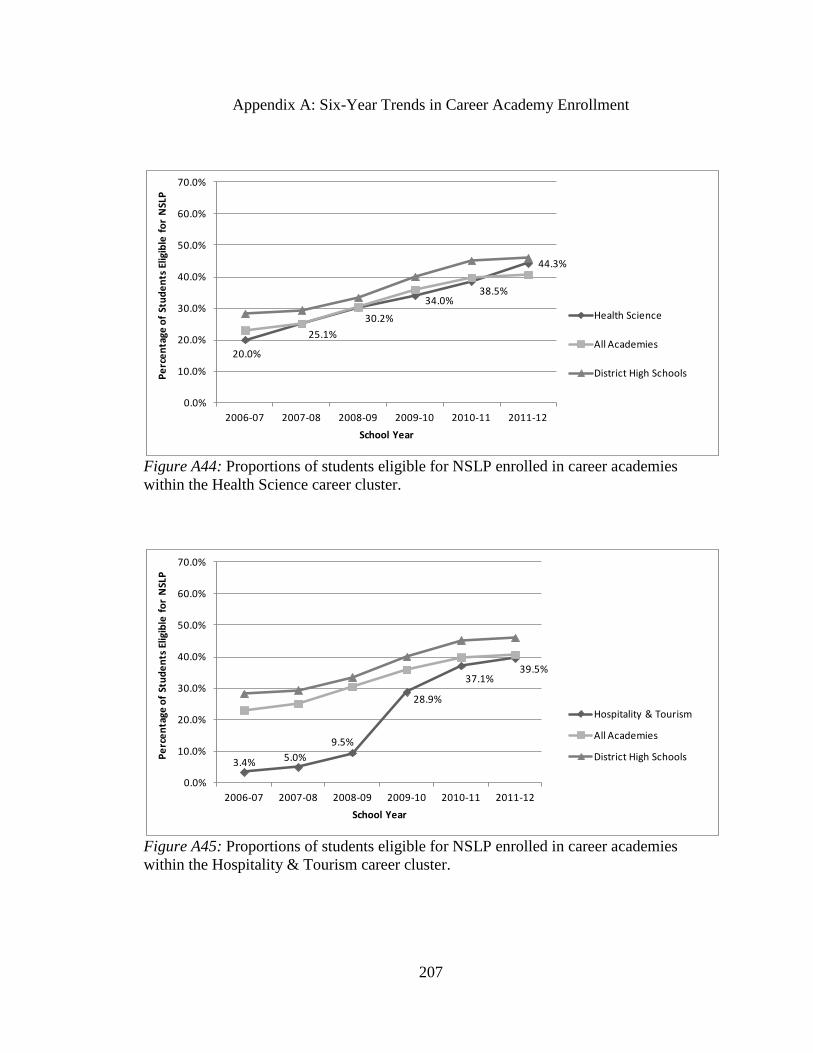
207
Appendix A: Six-Year Trends in Career Academy Enrollment
Figure A44: Proportions of students eligible for NSLP enrolled in career academies within the Health Science career cluster.
Figure A45: Proportions of students eligible for NSLP enrolled in career academies within the Hospitality & Tourism career cluster.
20.0%
25.1%30.2%
34.0%38.5%
44.3%
0.0%
10.0%
20.0%
30.0%
40.0%
50.0%
60.0%
70.0%
2006-07 2007-08 2008-09 2009-10 2010-11 2011-12
Perc
enta
ge o
f Stu
dent
s Elig
ible
for
NSL
P
School Year
Health Science
All Academies
District High Schools
3.4% 5.0%9.5%
28.9%
37.1%39.5%
0.0%
10.0%
20.0%
30.0%
40.0%
50.0%
60.0%
70.0%
2006-07 2007-08 2008-09 2009-10 2010-11 2011-12
Perc
enta
ge o
f Stu
dent
s Elig
ible
for
NSL
P
School Year
Hospitality & Tourism
All Academies
District High Schools

208
Appendix A: Six-Year Trends in Career Academy Enrollment
Figure A46: Proportions of students eligible for NSLP enrolled in career academies within the Information Technology career cluster.
Figure A47: Proportions of students eligible for NSLP enrolled in career academies within the Marketing career cluster. While there were marketing education programs offered in the school district in prior years, none were connected to a career academy until 2008-09.
19.1% 18.9%
30.0%
36.0%40.0%
36.5%
0.0%
10.0%
20.0%
30.0%
40.0%
50.0%
60.0%
70.0%
2006-07 2007-08 2008-09 2009-10 2010-11 2011-12
Perc
enta
ge o
f Stu
dent
s Elig
ible
for
NSL
P
School Year
Information Technology
All Academies
District High Schools
33.3%
41.3%
51.3%
62.2%
0.0%
10.0%
20.0%
30.0%
40.0%
50.0%
60.0%
70.0%
2006-07 2007-08 2008-09 2009-10 2010-11 2011-12
Perc
enta
ge o
f Stu
dent
s Elig
ible
for
NSL
P
School Year
Marketing, Sales & Service
All Academies
District High Schools

209
Appendix A: Six-Year Trends in Career Academy Enrollment
Figure A48: Proportions of students eligible for NSLP enrolled in career academies within the Science, Technology, Engineering & Mathematics (STEM) career cluster.
20.1% 22.8%
33.9%
38.7%43.2%
42.5%
0.0%
10.0%
20.0%
30.0%
40.0%
50.0%
60.0%
70.0%
2006-07 2007-08 2008-09 2009-10 2010-11 2011-12
Perc
enta
ge o
f Stu
dent
s Elig
ible
for
NSL
P
School Year
Science, Tech, Eng, & Math
All Academies
District High Schools

210
Appendix A: Six-Year Trends in Career Academy Enrollment
Figure A49: Career academy enrollments within the Agriculture, Food & Natural Resources career cluster.
Figure A50: Career academy enrollments within the Architecture & Construction career cluster.
377437
110 168
202 222
0100200300400500600700800900
100011001200130014001500
2006-07 2007-08 2008-09 2009-10 2010-11 2011-12
Stud
ent E
nrol
lmen
t
Agriculture, Food & Natural Resources
69 110214
420
553
274
0100200300400500600700800900
100011001200130014001500
2006-07 2007-08 2008-09 2009-10 2010-11 2011-12
Stud
ent E
nrol
lmen
t
Architecture & Construction

211
Appendix A: Six-Year Trends in Career Academy Enrollment
Figure A51: Career academy enrollments within the Arts, A/V Technology & Communications career cluster.
Figure A52: Career academy enrollments within the Business, Management & Administration career cluster. The career academy in this cluster reverted back to a standard CTE program after the 2009-10 school year.
526 480
92 91
126 174
0100200300400500600700800900
100011001200130014001500
2006-07 2007-08 2008-09 2009-10 2010-11 2011-12
Stud
ent E
nrol
lmen
t
Arts, A/V Technology & Communications
20 2170
100200300400500600700800900
100011001200130014001500
2007-08 2008-09 2009-10
Stud
ent E
nrol
lmen
t
Business, Management & Administration

212
Appendix A: Six-Year Trends in Career Academy Enrollment
Figure A53: Career academy enrollments within the Education & Training career cluster.
Figure A54: Career academy enrollments within the Finance career cluster.
30
20738
17427
160100200300400500600700800900
100011001200130014001500
2006-07 2007-08 2008-09 2009-10 2010-11 2011-12
Stud
ent E
nrol
lmen
t
Education & Training
100122
214 249326 354
0100200300400500600700800900
100011001200130014001500
2006-07 2007-08 2008-09 2009-10 2010-11 2011-12
Stud
ent E
nrol
lmen
t
Finance

213
Appendix A: Six-Year Trends in Career Academy Enrollment
Figure A55: Career academy enrollments within the Government & Public Administration and the Law, Public Safety, Corrections & Security career clusters. As a result of a program change, these career academies migrated from the GPA cluster to the LPSC&S cluster.
Figure A56: Career academy enrollments within the Health Science career cluster.
652 480 516
6599 103
0100200300400500600700800900
100011001200130014001500
2006-07 2007-08 2008-09 2009-10 2010-11 2011-12
Stud
ent E
nrol
lmen
t
Government & Public Administration andLaw, Public Safety, Corrections & Security
429
529569 608
672618
0100200300400500600700800900
100011001200130014001500
2006-07 2007-08 2008-09 2009-10 2010-11 2011-12
Stud
ent E
nrol
lmen
t
Health Science

214
Appendix A: Six-Year Trends in Career Academy Enrollment
Figure A57: Career academy enrollments within the Hospitality & Tourism career cluster.
Figure A58: Career academy enrollments within the Information Technology career cluster.
118140
147253
412390
0100200300400500600700800900
100011001200130014001500
2006-07 2007-08 2008-09 2009-10 2010-11 2011-12
Stud
ent E
nrol
lmen
t
Hospitality & Tourism
89143
586573
622
395
0100200300400500600700800900
100011001200130014001500
2006-07 2007-08 2008-09 2009-10 2010-11 2011-12
Stud
ent E
nrol
lmen
t
Information Technology

215
Appendix A: Six-Year Trends in Career Academy Enrollment
Figure A59: Career academy enrollments within the Marketing career cluster. While there were marketing education programs offered in the school district in prior years, none were connected to a career academy until 2008-09.
Figure A60: Career academy enrollments within the Science, Technology, Engineering & Mathematics (STEM) career cluster.
30 4680 119
0100200300400500600700800900
100011001200130014001500
2008-09 2009-10 2010-11 2011-12
Stud
ent E
nrol
lmen
t
Marketing
753 755
1203
925
1426
1162
0100200300400500600700800900
100011001200130014001500
2006-07 2007-08 2008-09 2009-10 2010-11 2011-12
Stud
ent E
nrol
lmen
t
Science, Technology, Engineering & Mathematics (STEM)

216
Appendix B: Institutional Review Board (IRB) Letter

ABOUT THE AUTHOR
Daniel Cox has worked in education for more than 20 years. He began his career in the K-12 public school arena working in Migrant Education where he developed a dropout prevention program targeting students in grades 4-6. During the 1990s, Cox taught middle school technology education in a rural school district located in north-central Florida. In 2000, Daniel transitioned into a district-level position providing support to career and technical education (CTE) programs within the Volusia County School District. Cox holds a bachelor’s degree in advertising from the University of Florida, a master’s in educational technology leadership from The George Washington University, and defended his doctoral dissertation at the University of South Florida.