preferences toward leniency under mandatory criminal
TRANSCRIPT

Bryn Mawr CollegeScholarship, Research, and Creative Work at Bryn MawrCollege
Economics Faculty Research and Scholarship Economics
2017
Preferences Toward Leniency under MandatoryCriminal Sentencing Guidelines: Role-in-the-Offense Adjustments for Federal Drug TraffickingDefendantsAndrew NuttingBryn Mawr College, [email protected]
Let us know how access to this document benefits you.
Follow this and additional works at: http://repository.brynmawr.edu/econ_pubs
Part of the Economics Commons
This paper is posted at Scholarship, Research, and Creative Work at Bryn Mawr College. http://repository.brynmawr.edu/econ_pubs/9
For more information, please contact [email protected].
Custom CitationNutting, Andrew W. 2017. Preferences Toward Leniency under Mandatory Criminal Sentencing Guidelines: Role-in-the-OffenseAdjustments for Federal Drug Trafficking Defendants. The B.E. Journal of Economic Analysis & Policy 17.1.
1
PREFERENCES TOWARDS LENIENCY UNDER MANDATORY CRIMINAL SENTENCING
GUIDELINES: ROLE-IN-THE-OFFENSE ADJUSTMENTS FOR FEDERAL DRUG
TRAFFICKING DEFENDANTS
Andrew W. Nutting
Assistant Professor of Economics
Bryn Mawr College
401 N Merion Ave
Bryn Mawr, PA 19010
November 2016
ABSTRACT
This paper tests whether judges and/or prosecutors manipulated mandatory federal sentencing guidelines
to shorten prison sentences. It finds that, among drug traffickers convicted under the federal guidelines’
former mandatory sentencing system, those who faced harsher underlying charges were found to have
played significantly lower-level roles in their conspiracies. This is consistent with guideline manipulation
for defendants facing longer sentences. Women received significantly larger role-in-the-offense
reductions related to harsher underlying charges than men. Effects were insignificant if defendants were
eligible for lower-cost alternative methods of sentence reduction, namely substantial assistance departures
and safety-valve reductions from mandatory minimum sentences.

2
[T]he Guidelines…have made charlatans and dissemblers of us all. We spend our time plotting and
scheming, bending and twisting, distorting and ignoring the law in an effort to achieve a just result. All
under the banner of “truth in sentencing”!
—Unnamed federal judge quoted in Weinstein (1992)
I. Introduction
Researchers have found that agents in the criminal justice system sometimes bend rules to
achieve more lenient penalties for defendants facing harsh punishments. Bjerk (2005) shows that state
prosecutors are significantly more likely to reduce felony arrests to misdemeanor charges when a felony
conviction would trigger a long, “third-strike” prison sentence.1 Leipold (2005) finds that federal judges
are more likely than federal juries to acquit defendants, and hypothesizes that judges—who, unlike juries,
know the potential penalties defendants face—are likely to acquit guilty defendants who face especially
severe punishments if convicted.2
Anecdotal evidence suggests that federal judges and prosecutors have manipulated the federal
sentencing guidelines—a system mapping measures of a federal defendant’s crime and criminal history to
a range of months imprisonment—to similar ends. In a 1992 article, federal judge Jack Weinstein of the
Eastern District of New York discussed his fellow judges’ attitudes toward the guidelines, which had then
been in effect for five years. Weinstein described the guidelines as “requiring an undesirably harsh
outcome” with “penalties [that] are almost always inflated,” and wrote that many judges responded by
gaming the guidelines to the benefit of defendants. For example, the guidelines required that “disputed
facts” affecting the measure of a defendant’s crime were to be proved by “a preponderance of the
evidence,” but Weinstein wrote that if such facts were to increase a defendant’s prison sentence, some
judges would use higher burdens of proof, namely “clear and convincing evidence” or “proof beyond a
reasonable doubt.”
1 Bjerk (2005) reviews a literature of anecdotal findings that prosecutors reduce charges for defendants who face
unduly long sentences if convicted. 2 Such leniency may be selective and applied more to some groups than others. Starr and Rehavi (2012), for
example, find that federal prosecutors are less likely to charge whites with crimes carrying a mandatory minimum
sentence than blacks arrested for the same crime.
3
Schulhofer and Nagel (1997) wrote that federal prosecutors behaved similarly, circumventing
guidelines in 25-30% of cases to shorten sentences. One such method of prosecutorial manipulation took
place during “fact bargaining” sessions with the defense, where prosecutors would agree to an unduly
lenient mitigating-role adjustment, i.e. state that the defendant played a lower-level role in a conspiracy
than the facts indicated. More lenient mitigating-role adjustments translated into shorter prison sentences.
This paper empirically tests whether defendants’ prison sentences under the mandatory federal
sentencing guidelines regime—as will soon be discussed, the guidelines have not been mandatory since
2005—were indeed reduced via such offense level manipulations. It does so by examining how the
severity of a drug trafficking defendant’s underlying conspiracy charge—his base offense level, in the
parlance of the guidelines—affected the extent to which he received a more lenient mitigating-role
adjustment. Specifically, I hypothesize that judges and/or prosecutors, wanting to reduce stiff guideline
sentences, ceteris paribus gave defendants with higher base offense levels more lenient mitigating-role
adjustments. This hypothesis is based on the assumption of judges’ and prosecutors’ disutility of sentence
length, as anecdotally outlined in Weinstein (1992) and Schulhofer and Nagel (1997). Judges and
prosecutors did not enjoy issuing long sentences, and exerted effort to shortening sentence by intensifying
mitigating-role adjustments. Critically, I assume their efforts to reduce offense levels would be stronger
at higher offense levels, where prison sentences were longer and where marginal reductions in sentence
associated with offense level reductions were larger.3
The mitigating-role adjustment is optimal for studying guideline manipulations for three reasons.
First, Schulhofer & Nagel (1997) specifically mention the manipulation of mitigating-role adjustments as
a method of sentence reduction. Second, the size of the mitigating-role adjustment is constant at different
offense levels. Other adjustments that decrease offense levels, such as the acceptance of responsibility
adjustment, are larger for defendants facing more severe charges, complicating the analysis of their
judicial or prosecutorial application. Third, the application of mitigating-role adjustments seems to be
3 See Appendix Table 1. For example, for a defendant with no criminal history, a decrease in final offense level from
31 to 30 decreased the minimum guideline sentence by 11 months, but a decrease from 32 to 31 decreased it by 13
months.
4
quite subjective—it involves deciding whether a defendant played a “minor” or “minimal” role in a
conspiracy, or somewhere in between the two—perhaps granting judges and prosecutors more control
over it.
Consistent with expectations, results from maximum likelihood estimations show that defendants
with higher base offense levels under mandatory guidelines were awarded significantly more lenient role-
in-the-offense adjustments. Effects were significantly larger for women than for men, a finding that is
consistent with extensive research showing that women receive relatively lenient treatment in the
criminal-justice system.
Difference-in-difference estimates show that there was no significantly more lenient mitigating-
role adjustment for two sets of defendants: 1) those receiving substantial assistance departures for
providing information against other defendants; and 2) those charged with mandatory minimum sentences
but who were eligible to avoid them via safety-valve releases. The common theme in these results is that
sentences were more likely to be reduced via role-in-the-offense manipulations only when they could not
be reduced via low-cost alternative methods like substantial assistance departures and safety-valve
reductions. Additional estimations concerning the 2005 U.S. v. Booker Supreme Court decision, which
changed the sentencing guidelines from “mandatory” to “advisory,” supports these findings.
The rest of this paper is organized as follows. Section II discusses the federal sentencing
guidelines system. Section III discusses this paper’s dataset and Section IV outlines the empirical
strategy. Section V shows baseline results and Section VI shows several tests elucidating the baseline
results. Section VII concludes.
II. The Federal Sentencing Guidelines
(Throughout this section, terms critical to the empirical portion of this paper are italicized and put
in bold.) In 1984, Congress passed the Sentencing Reform Act, which abolished parole4 for federal
crimes committed after November 1, 1987 and gave much control over criminal sentencing to the newly-
4 Up to 15% of a sentence to be waived for inmates exhibiting good behavior while in custody.

5
established United States Sentencing Commission (USSC).5 Sentences were to be determined at a post-
conviction sentencing hearing. The USSC established a guideline system that determined a defendant’s
criminal sentence according to two factors: crime severity and past criminal history.6 The sentencing
guidelines remain in place today.
Crime severity is captured by the final offense level. The final offense level, lower-bounded at 1
and upper-bounded at 43, is the sum of the base offense level, adjustments, and specific offense
characteristics.
The base offense level is an offense level score that corresponds with the specific crime
of which a defendant has been convicted beyond a reasonable doubt. Its value is
determined with the criminal conviction and before the sentencing hearing. When a
defendant is convicted of multiple criminal counts, the base offense level is superseded
by the combined adjusted offense level, which is established through a guidelines formula
and is designed to ensure that defendants convicted of multiple similar charges do not
receive excessive sentences. In drug trafficking crimes, the base offense level/combined
adjusted offense level is determined by the amount of drugs a defendant conspired to
deal.7
Adjustments are crime-related characteristics that increase or decrease the offense level.
According to the guidelines, they are determined by a judge at the sentencing hearing.
Adjustments include the role a defendant played in a criminal conspiracy, whether the
defendant obstructed justice, whether the defendant accepted responsibility for his crime,
and more. (The combined adjusted offense level, mentioned above, technically falls
under adjustments.)
5 For a thorough history of the considerations that led to the passage of the Sentencing Reform Act, see Stith and
Kuo (1993). 6 The analysis here is taken from Chapters 2-6 of the United States Sentencing Commission Guidelines Manual,
2003 edition. 7 Different drug types have different scales mapping weight of drugs to base offense level.
6
Specific offense characteristics are similar to adjustments, but only apply to specific
crimes. They do not play a role in this paper.
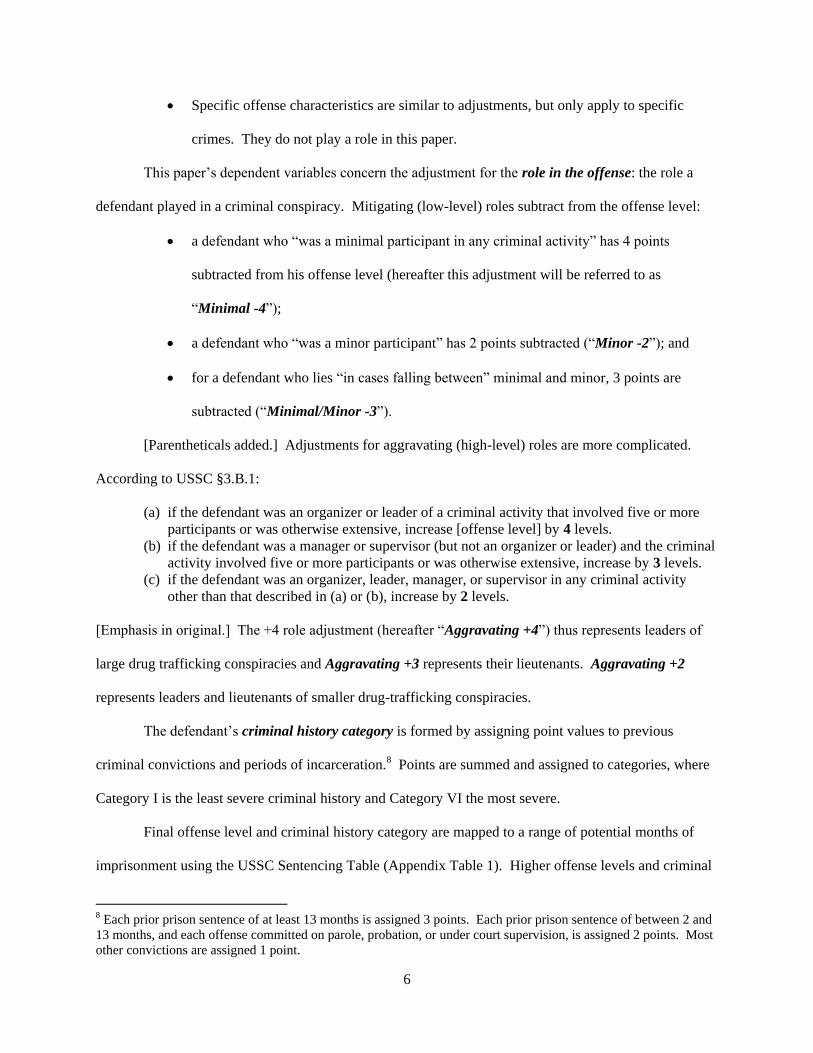
This paper’s dependent variables concern the adjustment for the role in the offense: the role a
defendant played in a criminal conspiracy. Mitigating (low-level) roles subtract from the offense level:
a defendant who “was a minimal participant in any criminal activity” has 4 points
subtracted from his offense level (hereafter this adjustment will be referred to as
“Minimal -4”);
a defendant who “was a minor participant” has 2 points subtracted (“Minor -2”); and
for a defendant who lies “in cases falling between” minimal and minor, 3 points are
subtracted (“Minimal/Minor -3”).
[Parentheticals added.] Adjustments for aggravating (high-level) roles are more complicated.
According to USSC §3.B.1:
(a) if the defendant was an organizer or leader of a criminal activity that involved five or more
participants or was otherwise extensive, increase [offense level] by 4 levels.
(b) if the defendant was a manager or supervisor (but not an organizer or leader) and the criminal
activity involved five or more participants or was otherwise extensive, increase by 3 levels.
(c) if the defendant was an organizer, leader, manager, or supervisor in any criminal activity
other than that described in (a) or (b), increase by 2 levels.
[Emphasis in original.] The +4 role adjustment (hereafter “Aggravating +4”) thus represents leaders of
large drug trafficking conspiracies and Aggravating +3 represents their lieutenants. Aggravating +2
represents leaders and lieutenants of smaller drug-trafficking conspiracies.
The defendant’s criminal history category is formed by assigning point values to previous
criminal convictions and periods of incarceration.8 Points are summed and assigned to categories, where
Category I is the least severe criminal history and Category VI the most severe.
Final offense level and criminal history category are mapped to a range of potential months of
imprisonment using the USSC Sentencing Table (Appendix Table 1). Higher offense levels and criminal
8 Each prior prison sentence of at least 13 months is assigned 3 points. Each prior prison sentence of between 2 and
13 months, and each offense committed on parole, probation, or under court supervision, is assigned 2 points. Most
other convictions are assigned 1 point.
7
histories correspond with longer prison sentences. At the sentencing hearing, the judge chooses a specific
number of months within the guideline range for the defendant to serve.9
Defendants can receive sentences outside the guideline range, however. One method is via a
substantial assistance departure, which is obtained by providing evidence against another defendant. If
government prosecutors informed a judge that a particular defendant had cooperated with the government
and provided evidence against at least one other individual, a federal judge could sentence a defendant to
any sentence beneath the guidelines (Weinstein 1999), including a period of no imprisonment.
And although the sentencing guidelines were called “mandatory” until 2005, federal judges were
permitted to “depart” from them in the absence of government-requested substantial assistance
departures. A judge who felt the guidelines mandated a level of imprisonment that inadequately reflected
the defendant’s criminal conduct could impose a downward departure (sentence a defendant to less than
the minimum guideline sentence) or an upward departure (more than the maximum guideline sentence).
Such departures came at a cost: they had to be explained by the judge in writing, could not be justified by
the defendant’s race, creed, sex, education, or socioeconomic status, and could not be justified by factors
already covered by the base offense level, adjustments, or specific offense characteristics.
Two years after the sentencing reform act was passed, but one year before they were activated,
the Anti-Drug Abuse Act of 1986 created mandatory minimum terms of imprisonment—usually 60 or
120 months, but also possibly 240 months or life without parole—for defendants convicted of violating
specific drug laws. Judges were not permitted to sentence a defendant below the mandatory minimum
term of imprisonment unless the prosecutor requested a substantial assistance departure. A safety valve
provision in the 1994 Omnibus Crime Bill weakened the “mandatory” nature of mandatory minimum
sentences. Defendants with no more than one criminal history point (i.e., a criminal history category of I)
and no violent history, who had not played a high-level role in a criminal conspiracy, and who had
cooperated with the government—even if that cooperation did not provide information that aided in the
9 Defendants in Zone A of the Sentencing Table are permitted to receive no period of imprisonment. Defendants in
Zone B must receive at least one month of imprisonment, and defendants in Zone C are permitted to serve up to half
their sentence via house arrest or in a halfway house.

8
prosecution of another—were eligible for safety-valve reductions below their mandatory minimum terms
of imprisonment.
In January 2005, the U.S. Supreme Court ruled 5-4 in U.S. v. Booker and U.S. v. Fanfan that
mandatory sentencing guidelines unconstitutionally violated a defendant’s right to a jury trial, and that the
guidelines were heretofore advisory rather than mandatory (Mauro 2005). This effectively made judges’
imposition of downward departures and upward departures less costly.
Though the guidelines state that judges determine adjustments and specific offense characteristics
at the sentencing hearing, in practice they are often negotiated before the hearing by the prosecution and
the defense in a process known as fact bargaining (Schulhofer and Nagel 1997, Stith and Cabranes
1998). Though this paper examines whether defendants facing more severe drug-trafficking charges
received significantly larger mitigating-role offense level reductions, it unfortunately cannot distinguish
whether such manipulations were applied during fact bargaining or by judges themselves at the
sentencing hearing.10
III. Data
The data for this paper come from Monitoring Federal Criminal Sentences (MFCS), published
every fiscal year by the USSC and available via the ICPSR. MFCS collects a substantial amount of
information concerning demographics, criminal history, and the crime committed by each defendant
sentenced in federal court. This paper’s primary sample consists of drug traffickers who were sentenced
in the fiscal years 1998-2002. Stopping in 2002 prevents the sample from being distorted by possible
changes in sentencing caused by the 2003 Feeney Amendment (Freeborn and Hartmann 2010) or the
2005 Booker Supreme Court decision (Fischman and Schanzenbach 2012, Nutting 2013).
The sample is restricted to defendants convicted of drug trafficking for two reasons. First, such
defendants received more role-in-the-offense adjustments than other types of sentenced defendants,
10 Even if role-in-the-offense adjustments are negotiated via fact bargaining, it is possible that judges’ tendencies
towards leniency could affect the negotiating process. Prosecutors and defense attorneys may bargain “in the
shadow of the judge” (Lacasse and Payne 1999), and agree to larger mitigating-role adjustments when facing more
lenient judges.

9
providing more opportunity for identifying the relationship between underlying charge and manipulation
of offense level. In fiscal year 2002, for example, almost 35 percent of federal defendants convicted of
one count of drug trafficking received a role-in-the-offense adjustment, while less than eight percent of
defendants convicted of one count of a non-drug-trafficking crime received one. Second, the mapping of
amount of drugs dealt to base offense level establishes a plausibly exogenous and easily captured measure
of a defendant’s underlying crime (Boylan and Long 2005).
Table 1 shows the sample’s summary statistics for defendants who pleaded guilty before going to
trial. Defendants who received substantial assistance departures are separated from non-substantial-
assistance defendants.
In non-substantial-assistance cases, almost 25 percent of defendants received a Minor -2 role
adjustment, two percent received a Minimal/Minor -3 adjustment, and six percent received a Minimal -4
adjustment. Only five percent received an aggravating-role adjustment.11
The average base offense level was 26.12 Twenty-two percent of defendants received a judicially-
imposed downward departure—reinforcing the idea that judges felt the sentencing guidelines were too
severe—while hardly any (approximately 1 in 400) received upward departures.
Thirty-seven percent of non-substantial-assistance defendants primarily sold marijuana (the
omitted drug category), approximately one-fifth primarily dealt cocaine, and another one-fifth primarily
dealt crack.13 The average criminal history category was at Level II. Half of defendants were Hispanic
and over 35 percent were not U.S. citizens. Thirteen percent of defendants were female. Fewer than half
had a full high school education. Attorney data, which does not appear to be complete (the omitted
category is “unreported”), shows that most defendants appeared to have court-appointed counsel while
fewer were represented either by private attorneys or federal public defenders.
11 A tiny handful of observations have defendants are recorded as having received both an aggravating-role
adjustment and a mitigating-role adjustment. These observations are removed. 12 As discussed in the next section, base offense level is replaced by combined adjusted offense level for defendants
convicted of multiple charges. 13 If a defendant trafficked more than one kind of drug, the drug dummy variables represent the primary drug dealt
only.

10
Defendants who received substantial assistance departures tended to play higher-level roles, face
higher base offense levels, and have longer criminal histories. They were also more likely to be black,
female, U.S citizens, high school graduates, and represented by private attorneys. Mustard (2001) and
Nutting (2015) more thoroughly detail the characteristics of defendants who receive substantial assistance
departures.
Another dataset is utilized in this paper to examine whether the 2005 Booker decision affected the
relationship between base offense level and mitigating-role adjustment. This sample consists of a
window of drug trafficking sentencings, from March 2004 to September 2005, around that Supreme Court
ruling.
IV. Estimation Strategy
Estimations of the equation
Ridt =Cidt) + Xidt + Zidt + d + t + idt (1)
where i is individual defendant, t is year, and d is federal district are performed. The dependent variable
R is defined as the role-in-the-offense adjustment applied to i. Since all estimations are either ordered
probit or probit, equation (1) is estimated via maximum likelihood.
There are four different definitions of R in this paper. The first sets R equal to the size of i’s
mitigating-role adjustment, i.e. 0 for defendants who receive no role adjustment or an Aggravating-role
adjustment, -2 for defendants who received a Minor -2 adjustment, -3 for defendants who received a
Minimal/Minor -3 adjustment, and -4 for defendants who received a Minimal -4 adjustment. Since there
is monotonicity in the value of mitigating-role adjustments, ordered probit estimations are performed
when R is defined this way. Estimations determine whether there was an overall statistically significant
relationship between a defendant’s charge severity and the size of his mitigating-role adjustment.
Positive coefficients mean less lenient mitigating-role adjustments, higher final offense levels, and longer
prison sentences; negative coefficients mean more lenient mitigating-role adjustments, lower final offense
levels, and shorter prison sentences.
11
The second definition of R is a dummy equal to 1 if the defendant did not receive a mitigating-
role adjustment and 0 if he did. (The larger value reflects “no adjustment” because “no adjustment” is
associated with a higher final offense level and longer prison sentence.) Estimations using this definition
of R determine whether defendants facing more serious charges were more or less likely to receive
mitigating-role adjustments. Probit estimations are used when R has this definition.
The third definition sets R equal to 1 if i received either no adjustment or a Minor -2 adjustment
and 0 if he received either a Minimal/Minor -3 or Minimal -4 adjustment. The fourth and final definition
sets R equal to 1 if i received no adjustment, a Minor -2 adjustment, or a Minimal/Minor -3 adjustment,
and 0 if he received a Minimal -4 adjustment. Estimations using these final two definitions of R
respectively determine whether defendants facing more serious charges were more likely to receive
Minimal/Minor -3 or Minimal -4 adjustments. Probit estimations are used when R has either of these
final two definitions.
Cidt) captures severity of the charge of which the defendant has been convicted. Charge
severity is proxied by base offense level, or combined adjusted offense level for defendants convicted of
multiple charges. (For simplicity, this paper combines these two variables and refers to all defendants as
having a base offense level.) In some estimations it adds a dummy variable for conviction at trial.
X consists of criminality-related factors that could affect a defendant’s role-in-the-offense
adjustment: dummy variables for criminal history category, weapon, and type of drug dealt; and a linear
control for the number of different drugs dealt. Z consists of demographic factors: dummies for race,
citizenship status, sex, education level, and type of lawyer retained; and linear controls for age and
number of dependents. d is a vector of federal district fixed effects, t is a vector of year fixed effects,
and idt is a normally distributed random error term.
Individual judges and prosecutors—who strongly influence the application of mitigating-role
adjustments—are not observed in the dataset. Since judges and prosecutors tend to work exclusively in a

12
specific federal district, Equation (1) standard errors are clustered by district. This has the effect of
increasing standard errors, making statistical significance of coefficients more difficult to attain.
IV. Results
a. Baseline results
Table 2 shows results of estimations of Equation (1) where the sample is limited to defendants
who pleaded guilty (i.e., were not convicted at trial) and did not receive a substantial assistance departure.
(Substantial assistance estimations will be performed later in the paper.)
Column 1 shows results of the ordered probit estimation of Equation (1). The coefficient on base
offense level is significantly negative at the 10% level, showing that defendants facing more severe
charges receive significantly more lenient mitigating-role adjustments to shorten their sentences. This is
consistent with the hypothesis of this paper.
Column 2 shows results where R is 1 if the defendant did not receive a mitigating-role adjustment
and 0 if he received one. Base offense level is insignificant, showing that facing more severe charges did
not significantly change a defendant’s probability of receiving a mitigating-role adjustment. In Column 3
base offense level is significantly negative, showing that defendants facing more severe charges were
more likely to receive Minimal/Minor -3 adjustments than Minor -2 adjustments.14 Columns 2-3 thus
show that though defendants facing higher base offense levels were not more frequently found to have
played mitigating roles, they were found to have played significantly more intensely mitigating roles,
conditional on having played a mitigating role in the first place. Column 4 shows that defendants with
higher base offense levels did not receive significantly more Minimal -4 adjustments than Minimal/Minor
-3 adjustments.
Other coefficients in Table 2 show that a defendant’s race did not have a significant effect on
mitigating-role adjustment. Women received substantially more lenient adjustments than men.
Consistent with Borjas, Grogger and Hanson (2010), non-U.S. citizens receive more lenient
14 Sample sizes are smaller in Columns 2-3 because some districts issue no Minimal/Minor -3 or Minimal -4
adjustments, causing perfect classification problems.

13
adjustments.15 Defendants with public defenders received more lenient adjustments while better-educated
defendants and defendants represented by private attorneys received less lenient adjustments. Defendants
who dealt harder drugs than marijuana (the omitted category) were much less likely to receive mitigating-
role adjustments than marijuana dealers (Column 2). Defendants with weapons-related enhancements and
those with longer criminal histories received less lenient adjustments.
Table 3 Columns 1-4 repeat Table 2 but limit the display to coefficients on the base offense level.
In addition to coefficients and standard errors, Table 3 shows marginal effects, defined as changes in the
dependent variable when increasing the base offense level by one standard deviation (approximately 7
base offense levels).16 The marginal effect in Column 1—calculated by multiplying each offense level
adjustment (0, -2, -3, -4) by the probability of the latent ordered probit predicted value ending up in its
range—shows that a one-standard-deviation increase in base offense level decreased a defendant’s
mitigating offense level score by 0.027 on a scale from 0 to -4. Though statistically significant, this effect
is not large, and corresponds with Weinstein’s (1992) claim that a very small share of federal criminal
sentencings—“fewer than five percent”—contained disputes over final offense level.
Columns 5-8 add defendants who were convicted at trial to the sample and controls for trial
convictions with a dummy variable. The purpose of these estimations is to determine whether the
relationships between base offense level and mitigating role are robust to a more heterogeneous
population. Coefficients and marginal effects on base offense level in Columns 5-8 are very similar to
those in Columns 1-4. The dummy variable indicating trial conviction is significantly positive in all
estimations, suggesting that low-level defendants were less likely to proceed to trial and/or defendants
convicted at trial were less likely to receive mitigating-role adjustments.17 Since the base offense level
coefficients in Columns 1-4 and Columns 5-8 are so similar, the rest of this paper omits trial observations
15 Borjas, Grogger, and Hanson (2010) suggest that immigrants’ potential deportation is a substitute for longer
periods of incarceration. 16 It is calculated by finding the average expected value of R when increasing each i’s base offense level from 0.5
standard deviations below its actual value to 0.5 standard deviations above it. 17 Marginal effects of dummy variables in Table 3 are calculated by examining the change in the expected value of R
when changing TRIAL from 0 to 1.
14
from all estimations in order to simplify the reporting of results and limit testing to a more homogenous
sample.
Columns 9-12 uses further examines the relationship between base offense level and mitigating-
role adjustment by adding dummy variables for judicially-imposed downward and upward departures.
Since judges could reduce a defendant’s prison sentence either via a downward departure or a role-in-the-
offense adjustment, it is possible that downward departures served as a substitute for role-in-the-offense
adjustments. In this case, failing to control for departures could bias the negative coefficients on base
offense level in Table 2 Columns 1-4 towards zero (Wooldridge 2002).
Adding departure controls does not change the base offense level coefficients, suggesting that
downward departures did not serve as meaningful substitutes for role mitigation. Coefficients on
downward departure show that defendants who receive downward departures did not receive significantly
more mitigating-role adjustments (Column 10), but were significantly more likely to receive larger
mitigating-role adjustments conditional on receiving one (Columns 11-12). This suggests that judges
used downward departures to further reduce sentences for lower-level conspirators. Defendants who
receive upward departures received significantly and substantially less lenient mitigating-role
adjustments, perhaps reflecting judges’ and prosecutors’ beliefs that such defendants possessed moral
turpitude.
b. Demographic differences
Table 4 shows results from estimations interacting base offense level with different demographic
and drug-type controls to determine whether the relationship between base offense level and mitigating-
role adjustment differed for different types of defendants. Stand-alone dummy variables capturing mean
differences by demographics and drug type are included in all estimations, but they are not reported.
Marginal effects are omitted due to space constraints.
The Columns 1-4 coefficients on Base Offense Level*Female show that women received
significantly more lenient mitigating-role adjustments related to high base offense levels than men. This
result is consistent with numerous findings that women receive relatively lenient treatment in the
15
criminal-justice system (Mustard 2001, Schazenbach 2005, Albonetti 2007, Sorensen et al 2012, Nutting
2013 and 2015).18 Black defendants who faced higher base offense levels received significantly fewer
Minimal/Minor -3 and Minimal -4 adjustments than white defendants (Columns 3-4).
Effects for women are unchanged when adding controls for interactions between base offense
level and drug type (Columns 5-8). The positive coefficients in on Base Offense Level*Black disappear,
presumably because blacks were more likely to be crack dealers, and crack dealers received significantly
fewer Minimal/Minor -3 and Minimal -4 adjustments when facing higher base offense levels.19 The
negative coefficient on Base Offense Level*Hispanic in Column 7 becomes insignificant when I add
interaction controls for base offense level with immigration status and education level (not shown).
Coefficients on base offense level itself are insignificant in all eight columns in Table 4. This
suggests that most all of the effect of more severe charges regarding role-in-the-offense adjustments
accrued to female defendants.
c. Does conspiracy size explain role-in-the-offense adjustments?
This subsection of the paper attempts to test whether a factor so far omitted from estimations—
conspiracy size—helps explain why defendants facing higher base offense levels receive more lenient
role-in-the-offense adjustments. It is possible that larger conspiracies may, simply because of their size,
have had more lower-level traffickers than smaller conspiracies. This could drive the results showing that
high base offense levels, representing large amounts of drugs dealt by (presumably) large conspiracies,
are correlated with lower-level roles in the offense.
Unfortunately, MFCS does not contain a variable capturing the conspiracy size of low-level or
mid-level defendants, so adding a direct control for conspiracy size to Equation (1) is not possible. But a
proxy for conspiracy size can be created through aggravating (high-level) role adjustment variables,
which are partially defined by conspiracy size: Aggravating +4 and +3 adjustments are reserved for
conspiracies “that involved five or more participants or [were] otherwise extensive” while Aggravating
18 Schazenbach (2005) finds that male judges, but not female judges, sentence female defendants more leniently. 19 Almost 60 percent of black defendants in the sample are convicted crack dealers.
16
+2 adjustments are for leaders of smaller conspiracies. Aggravating roles are more likely in larger
conspiracies: estimations available from the author upon request show that defendants who are involved
in larger conspiracies, as approximated by their base offense levels (which are determined by quantity of
drugs trafficked), are significantly and substantially more likely to receive larger aggravating-role
adjustments.
Higher base offense levels, then, are associated both with more lenient mitigating-role
adjustments (Tables 2-3) and more severe aggravating-role adjustments, perhaps because higher base
offense levels are correlated with larger conspiracies. We can proxy conspiracy size, then, by controlling
for the frequency of aggravating-role adjustments in a defendant’s drug trafficking milieu. This may
explain some of the relationship between higher base offense levels and more lenient mitigating-role
adjustments.
Since a defendant’s “drug-trafficking milieu” is hard to define, I use two alternative definitions.
One defines milieu as defendants who dealt primary drug n and were sentenced in federal district d during
all years in the sample. The other defines milieu as the defendants who dealt primary drug n and were
sentenced in year t in all districts in the sample. For both definitions, I create AGGRAV_SHARE, a vector
of three controls capturing the share of defendants (excluding defendant i himself) who had Aggravating
+4, +3, and +2 adjustments in each milieu. Adding these new controls yields
Rindt =Cindt) + Xindt + Zindt + AGGRAV_SHAREnd+d + t + n + indt (2a)
when milieu is defined as drug-district intersection and
Rindt =Cindt) + Xindt + Zindt + AGGRAV_SHAREtd+d + t + n + indt (2b)
when milieu is defined as drug-year intersection. n represents fixed effects control for drug type. In
Equation (1) n was included in X.
According to my expectations, larger shares of Aggravating +4 and +3 defendants —i.e. more
frequent exposure to high-level dealers—should indicate a larger presence of large drug conspiracies and
therefore a greater probability of a defendant receiving a more lenient mitigating-role adjustment. Thus

17
coefficients on share Aggravating +4 and +3 should be negative. More importantly, if defendants with
higher base offense levels receive more lenient role-in-the-offense adjustments because of their
involvement in larger conspiracies, controlling for AGGRAV_SHARE should attenuate the negative
coefficients on base offense level towards zero.
Table 5 shows results of estimations of Equations (2) and (3). Columns 1-4 show the results from
Table 3 Panel A, i.e. base offense level coefficients when omitting AGGRAV_SHARE controls. Columns
5-8 show results when including AGGRAV_SHARE controls defining milieu as drug-district intersection
and Columns 9-12 show results defining milieu as drug-year intersection. Coefficients on base offense
level in Columns 5-8 and 9-12 are slightly larger than their counterparts in Columns 1-4. This suggests
that conspiracy size does not explain the observed relationship between base offense level and mitigating-
role adjustments, boosting the probability that defendants facing higher base offense levels received more
lenient mitigating-role adjustments because of judicial and/or prosecutorial manipulation of sentencing
guidelines. The AGGRAV_SHARE coefficients depend substantially on which definition of milieu is
used. When using drug-district intersection (Columns 5-8), coefficients on Aggravating +3 share indicate
that more frequent large conspiracies are associated, if anything, with less lenient mitigating-role
adjustments, the opposite of what had been hypothesized. 20 When using drug-year intersection (Columns
9-12), coefficients on Aggravating +4 share indicate that more large conspiracies are associated with
more low-level roles.
Since Table 4 suggests that conspiracy size does not explain why defendants with higher base
offense levels receive more lenient mitigating-role adjustments, the rest of the estimations in this paper
omit these controls.
d. Substantial assistance departures, mandatory minimums, and safety valves
Results from Tables 2-5 show some evidence consistent with the hypothesis that judges and/or
prosecutors manipulated mitigating role-in-the-offense adjustments to reduce prison sentences for
20 It is possible that large conspiracies are so large as to crowd out other competing conspiracies, meaning that fewer
high-level defendants may correspond with more lower-level defendants. This would cause the coefficients on share
Aggravating +4 and +3 to be positive.

18
defendants facing especially high base offense levels. This section tests whether the relationship between
base offense level and mitigating role adjustment differed among defendants facing different situations,
such as mandatory minimum sentences and/or substantial assistance departures. I hypothesize that
defendants who received substantial assistance departures and/or were eligible for safety valve releases
from mandatory minimum sentences experienced less of a relationship between base offense level and
mitigating-role adjustment than other defendants. These defendants could see their prison sentences
reduced by judges and/or prosecutors at very low cost—specifically, a simple application of the
substantial assistance departure or safety valve—and judges and/or prosecutors would not have to
manipulate mitigating-role adjustments to shorten their prison sentences.
Table 6 shows results of Equation (1) on the population of defendants who received substantial
assistance departures. No Table 6 coefficient is significant, indicating that there was no significant
emphasis on reduction of offense levels for substantial-assistance defendants facing higher base offense
levels. Table 6 indicates that when judges used substantial assistance sentence reductions, role-in-the-
offense manipulations via mitigating-role adjustments did not occur. This is consistent with an
explanation that, in terms of sentence reduction, substantial assistance departures were a low-cost
substitute to mitigating-role manipulations.
To further examine the role of substantial assistance departures and safety valves, I perform
difference-in-difference estimations taking the form
Ridt =Cidt) + Xidt + Zidt + d + t + SUBASSTidt + SAFETYELIGIBLEidt +
SUBASSTidt*Cidt) + SAFETYELIGIBLEidt*Cidt) + idt. (3)
SUBASST is a dummy variable equal to 1 if the defendant received a substantial assistance departure.
SAFETYELIGIBLE is a dummy equal to 1 if the defendant was eligible a safety valve release from a
mandatory minimum sentence, defined as a having criminal history category of I, no weapon
enhancement, and no aggravating-role adjustment. These two dummies are interacted with Cidt), the
linear control for base offense level. A positive coefficient on SUBASSTidt*Cidt) would indicate that
19
defendants who received substantial assistance departures received less lenient mitigating-role
adjustments when facing more severe charges. This would be consistent with the hypothesis of this
paper, since such defendants could receive a lower sentence through the low-cost substantial assistance
departure. Likewise, a positive coefficient on SAFETYELIGIBLEidt*Cidt) would indicate that
defendants who were eligible for safety valve releases from mandatory minimum sentences did not need
their mitigating-role adjustments lowered when facing more severe charges, because their sentence could
be lowered via the lower-cost safety valve.21
Table 7 shows the sample distributions of mitigating-role adjustments for defendants who pleaded
guilty, i.e. were not convicted at trial. Distributions are separated by length of mandatory minimum
sentence faced (0, 60, or 120 months),22 plus whether the defendants received a substantial assistance
departure. Defendants who did not receive a substantial assistance departure are further separated by
whether they were ineligible or eligible for a safety valve. Among defendants who did not face a
mandatory minimum sentence (Columns 1-2), mitigating-role adjustments were more common for those
not receiving a substantial assistance departure. Among defendants facing mandatory minimum
sentences (Columns 3-8), mitigating-role departures were most common for those who did not receive a
substantial assistance departure but were eligible for a safety valve. They were least common among
those who did not receive a substantial assistance departure and were not eligible for a safety valve.
I perform estimations of Equation (3) separately for defendants facing no mandatory minimum,
those facing a 60-month minimum, and those facing a 120-month minimum. Results are in Table 8. To
conserve space, results are limited to ordered probit estimations where mitigating-role adjustment (0 to -
4) is the dependent variable. Since defendants facing no mandatory minimum sentence are by definition
not eligible for a safety valve, the safety eligibility dummy and its interaction with base offense level are
excluded from that population (Column 1).
21 I also performed estimations using SAFETYRECEIPT, a dummy equal to 1 for defendants who received a safety-
valve departure, instead of SAFETYELIGIBLE. The SAFETYELIGIBLE results were consistently stronger than the
SAFETYRECEIPT results. 22 Because of small sample size, defendants who faced a mandatory minimum of 240 months or more are not
included in Table 6.

20
The base offense level coefficient in Column 1 shows that, among defendants not facing
mandatory minimum sentences, those who did not receive substantial assistance departures received
significantly, at the 1% level, more lenient mitigating-role adjustments. The positive coefficient on Base
Offense Level*Substantial Assistance, though insignificant, shows that defendants received less lenient
mitigating-role adjustments related to higher base offense levels if they received substantial assistance
departures. The sum of the base offense level and interaction coefficients show that non-substantial-
assistance defendants did not receive significantly more lenient mitigating offense levels when facing
higher base offense levels (p-value of 0.169). Thus only defendants who could have their sentences
shortened via the low-cost alternative to offense level manipulation did not have their mitigating-role
adjustments manipulated. This is consistent with the hypothesis of this paper.
Column 2 shows results for defendants facing 60-month mandatory minimum sentences. Base
offense level is again significantly negative. The coefficient on Base Offense Level*Substantial
Assistance is significantly positive and the sum of the base offense level coefficient and the Base Offense
Level*Safety Valve Eligible coefficient has a p-value of 0.267. The former result shows that defendants
who received substantial assistance departures experienced less-lenient mitigating-role adjustments than
those who did not, and the latter result shows they experienced no significant relationship between base
offense level and mitigating-role adjustment.
Base Offense Level*Safety Eligible is positive (though insignificant), and the sum of Base
Offense Level and Base Offense Level *Safety Eligible is insignificantly different from zero. The former
result shows that defendants eligible for safety valves experienced less-lenient mitigating-role
adjustments than those who were not, and the latter result shows they experienced no significant
relationship between base offense level and mitigating-role adjustment.
All of the results in Column 2 are thus consistent with the hypothesis of this paper. Column 3
repeats Column 2 for the sample of defendants facing 120-month mandatory minimum sentences. Results
are very similar to those for defendants facing 60-month minimums. Columns 4-5 repeat Columns 2-3
but change the definition of the “Safety Valve Eligible” dummy so that it equals zero for defendants who
21
receive substantial assistance departures. Defendants who receive substantial assistance departures,
according to this modification, could receive vastly reduced sentences through the substantial assistance
departures alone, and did not require a safety-valve release. Coefficients on the interaction terms become
larger than in Columns 2-3.
Table 8 thus shows strong evidence in support of the hypothesis of this paper. Judges and/or
prosecutors manipulated mitigating-role adjustments to reduce sentences for defendants facing high base
offense levels. Defendants who could see their sentences reduced via different, lower-cost methods of
sentence reduction—substantial assistance departures and safety-valve releases from mandatory minimum
sentences—did not experience significant relationships between higher base offense levels and more
lenient mitigating-role adjustments. Mitigating-role adjustments did not need to be manipulated for them
to receive shorter sentences.
These results should be viewed with the knowledge that prosecutors, not judges, controlled the
application of mandatory minimum sentences. It would seem odd for prosecutors to seek leniency vis-à-
vis a more lenient role-in-the-offense adjustments while simultaneously hammering defendants with stiff,
unavoidable mandatory minimum sentences. Thus Table 8 suggests that judges, not prosecutors, were
responsible for the significantly negative relationships between base offense levels and mitigating-role
adjustments. Judges may have used mitigating-role adjustments to counteract prosecutorial zeal
associated with mandatory minimums.23
V. The Booker decision
This paper’s last set of estimations tests whether the January 2005 Supreme Court decision U.S. v.
Booker had any effect on the relationship between base offense level and manipulation of mitigating-role
adjustments. The Booker decision changed the guidelines from “mandatory” to “advisory,” allowing
judges to depart from the guidelines at a lower cost. This may have reduced the incentive for judges and
23 Fischman and Schanzenbach (2012) find evidence that judges use their sentencing discretion to mitigate racial
differences in the application of mandatory minimum charges.
22
prosecutors to manipulate mitigating-role adjustments for defendants with high base offense levels, since
final offense level would be less constraining of a defendant’s prison sentence.
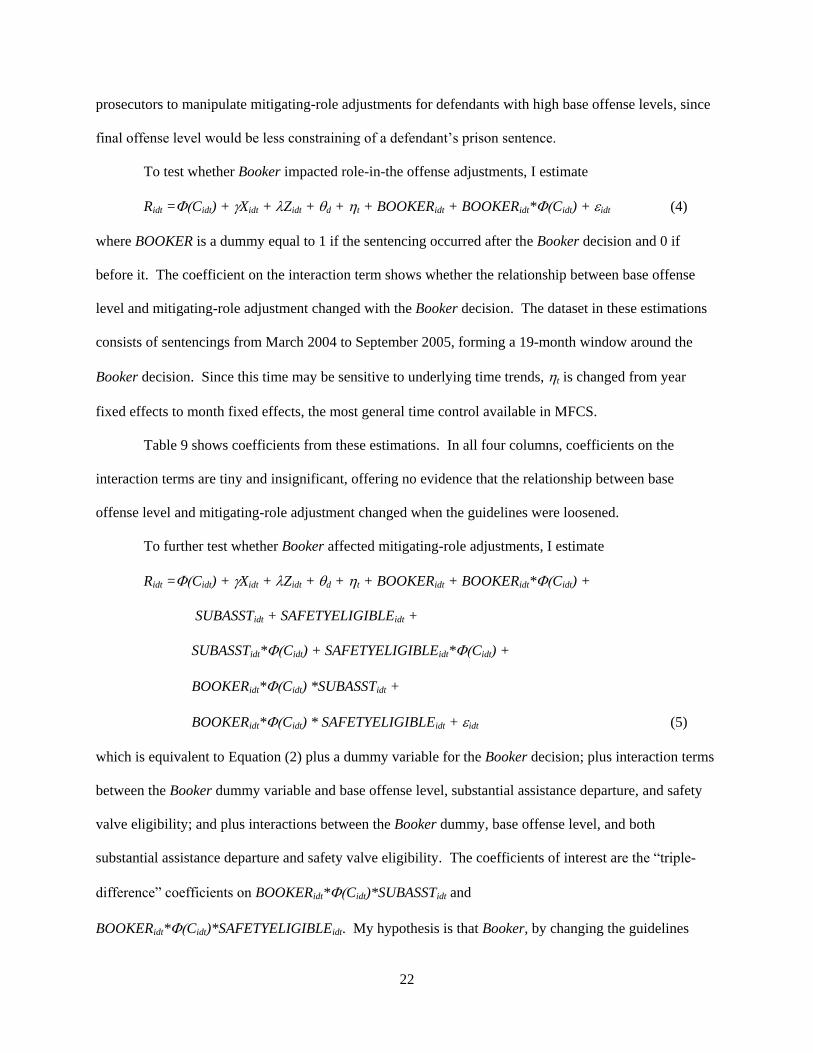
To test whether Booker impacted role-in-the offense adjustments, I estimate
Ridt =Cidt) + Xidt + Zidt + d + t + BOOKERidt + BOOKERidt*Cidt) + idt (4)
where BOOKER is a dummy equal to 1 if the sentencing occurred after the Booker decision and 0 if
before it. The coefficient on the interaction term shows whether the relationship between base offense
level and mitigating-role adjustment changed with the Booker decision. The dataset in these estimations
consists of sentencings from March 2004 to September 2005, forming a 19-month window around the
Booker decision. Since this time may be sensitive to underlying time trends, t is changed from year
fixed effects to month fixed effects, the most general time control available in MFCS.
Table 9 shows coefficients from these estimations. In all four columns, coefficients on the
interaction terms are tiny and insignificant, offering no evidence that the relationship between base
offense level and mitigating-role adjustment changed when the guidelines were loosened.
To further test whether Booker affected mitigating-role adjustments, I estimate
Ridt =Cidt) + Xidt + Zidt + d + t + BOOKERidt + BOOKERidt*Cidt) +
SUBASSTidt + SAFETYELIGIBLEidt +
SUBASSTidt*Cidt) + SAFETYELIGIBLEidt*Cidt) +
BOOKERidt*Cidt) *SUBASSTidt +
BOOKERidt*Cidt) * SAFETYELIGIBLEidt + idt (5)
which is equivalent to Equation (2) plus a dummy variable for the Booker decision; plus interaction terms
between the Booker dummy variable and base offense level, substantial assistance departure, and safety
valve eligibility; and plus interactions between the Booker dummy, base offense level, and both
substantial assistance departure and safety valve eligibility. The coefficients of interest are the “triple-
difference” coefficients on BOOKERidt*Cidt)*SUBASSTidt and
BOOKERidt*Cidt)*SAFETYELIGIBLEidt. My hypothesis is that Booker, by changing the guidelines

23
from mandatory to advisory, caused mitigating-role adjustments to rise. But defendants who received
substantial assistance departures and were eligible for safety valves did not have their mitigating-role
adjustments manipulated pre-Booker anyways, as Table 8 showed, so they should have experienced less
of an increase in mitigating-role adjustments post-Booker. Thus the coefficients on the triple-difference
terms should be negative.
Table 10 shows results of these “triple-difference” estimations. Estimations are limited to
ordered probit estimations with mitigating-role adjustment (-4 to 0) as the dependent variable. Among
defendants not facing a mandatory minimum sentence (Column 1), the coefficient on Base Offense
Level*Substantial Assistance*Booker is significantly negative, in accordance with my hypothesis. Base
Offense Level*Substantial Assistance*Booker is also significantly negative among defendants facing a
60-month mandatory minimum (Columns 2 and 4). Base Offense Level*Safety Valve Eligible*Booker is
significantly negative among defendants facing 120-month mandatory minimums (Columns 3 and 5).
Thus Table 10 shows evidence, consistent with my hypothesis, that the application of more lenient
mitigating-role adjustments related to higher base offense levels was reduced by the Booker decision.
VI. Conclusion
This paper finds that under the federal government’s former mandatory sentencing guidelines
system, drug trafficking defendants who faced higher base offense levels (more severe underlying
charges) received significantly more lenient role-in-the-offense adjustments when being sentenced. Such
findings are consistent with anecdotal reports that federal judges and prosecutors manipulated offense
levels to reduce prison sentences. Female defendants received larger role-in-the-offense reductions than
men when facing higher base offense levels, a finding that is consistent with research showing that
women receive relatively lenient treatment in the criminal justice system. The finding that high base
offense levels were related to more-lenient role-in-the-offense adjustments remained intact when
controlling for conspiracy size, though this paper’s metric of conspiracy size is very raw.
Difference-in-difference estimations show that there was no significant relationship between base
offense level and mitigating-role adjustment among defendants who were eligible for either substantial
24
assistance departures or safety-valve reductions from mandatory minimum sentences. This suggests that
mitigating-role manipulation was a relatively high-cost means of sentence reduction that was only used
when lower-cost substitutes were unavailable. That offense levels were reduced for defendants whose
high base offense levels were accompanied by stiff, unavoidable mandatory minimum prison sentences
suggests that judges may have imposed more lenient role-in-the-offense adjustments to counteract
prosecutorial harshness. Findings are supported by estimations showing Booker decision changed
mitigating-role adjustments less for substantial-assistance defendants and safety-valve eligible defendants.
Future research, perhaps with more detailed data regarding the multi-stage sentencing process,
may better be able to pinpoint the place—either through judges at the sentencing hearing, or prosecutors
during fact bargaining—where role-in-the-offense adjustments are manipulated for defendants facing
stiffer underlying charges. And additional research into the current sentencing guidelines regime, in
which guidelines are advisory rather than mandatory, may shed more light on the use of offense level
manipulation as a means of sentence reduction.
References
Ai, Chunrong; Norton, Edward C. (2003) “Interaction Terms in Logit and Probit Models.” Applied
Economics Letters 80:3, pp. 123-29.
Albonetti, Celesta A. (1997) “Sentencing under the Federal Sentencing Guidelines: Effects of
Defendant Characteristics, Guilty Pleas, and Departures on Sentence Outcomes for Drug Offenses, 1991-
1992.” Law & Society Review 31:3, pp. 789-822.
Bjerk, David. (2005) “Making the Crime Fit the Penalty: The Role of Prosecutorial Discretion under
Mandatory Minimum Sentencing.” Journal of Law and Economics 48:2, pp. 591-625.
Borjas; George R; Grogger, Jeffrey; Hanson, Gordon H. (2010) “Immigration and the Economic Status
of African-American Men.” Economica 77:306, April 2010, pp. 255-82.
Boylan, Richard T.; Long, Cheryl X. (2005) “Salaries, Plea Rates, and the Career Objectives of Federal
Prosecutors.” Journal of Law and Economics 48:2, pp. 627-51.
Fischman, Joshua B.; Schanzenbach, Max M. “Racial Disparities Under the Federal Sentencing
Guidelines: The Role of Judicial Discretion and Mandatory Minimums.” Journal of Empirical Legal
Studies 9:4, pp. 729-764.

25
Freeborn, Beth A.; Hartmann, Monica E. (2010) “Judicial Discretion and Sentencing Behavior: Did the
Feeney Amendment Rein in District Judges?” Journal of Empirical Legal Studies 7:2, pp. 355-78.
Lacasse, Chantale; Payne, A. Abigail (1999). “Federal Sentencing Guidelines and Mandatory Minimum
Sentences: Do Defendants Bargain in the Shadow of the Judge?” Journal of Law and Economics 41:S1,
pp. 245-70.
Leipold, Andrew D. (2005) “Why are Federal Judges So Acquittal Prone?” Washington University Law
Review 83:1, pp. 150-227.
Mauro, Tony. (2005) “Supreme Court: Guidelines Advisory, Not Mandatory.” Legal Times, January 12.
Mustard, David B. (2001) “Racial, Ethnic, and Gender Disparities in Sentencing: Evidence from the
U.S. Federal Courts.” Journal of Law and Economics 44:1, pp. 285-314.
Nutting, Andrew W. (2013) “The Booker Decision and Discrimination in Federal Criminal Sentences.”
Economic Inquiry 51:1, pp. 637-652.
Nutting, Andrew W. (2015) “Squealer Dealers: The Market for Information in Federal Drug Trafficking
Prosecutions.” Economic Inquiry 53:1, pp. 486-507.
Schanzenbach, Max M. (2005) “Racial and Sex Disparities in Prison Sentences: The Effect of District-
Level Judicial Demographics.” Journal of Legal Studies, 32:2, pp. 57–92.
Schulhofer, Stephen J.; Nagel, Ilene H. (1997) “Plea Negotiations Under the Federal Sentencing
Guidelines.” Northwestern University Law Review, 91:4, pp. 1284-1316.
Sorensen, Todd; Sarnikar, Supriya; Oaxaca, Ronald L. (2012) “Race and Gender Differences Under
Federal Sentencing Guidelines.” American Economic Review: Papers and Proceedings 102:3, pp. 256-
60.
Starr, Sonja B.; Rehavi, M. Marit. (2012) “Racial Disparity in Federal Criminal Charging and Its
Sentencing Consequences.” University of Michigan Law School, Working Paper No. 12-002.
Stith, Kate; Cabranes, Jose A.. Fear of Judging: Sentencing Guidelines in the Federal Courts. Chicago:
University of Chicago Press, 1998.
Stith, Kate; Kuo, Steve Y. (1993) “The Politics of Sentencing Reform: The Legislative History of the
Federal Sentencing Guidelines.” Wake Forest Law Review 28, pp. 223-290.
Weinstein, Jack B. (1992) “A Trial Judge’s Second Impression of the Federal Sentencing Guidelines.”
Southern California Law Review 66:1, pp. 357–66.
Wooldridge, Jeffrey M. 2002. Econometric Analysis of Cross Section and Panel Data. Cambridge,
Massachusetts: The MIT Press.

Table 1Summary Statistics
Mean SD Min Max Mean SD Min MaxWIN 0.58 0.49 0 1 0.58 0.49 0 1Better-Ranked Coach Black 0.07 0.26 0 1 0.07 0.26 0 1Worse-Ranked Coach Black 0.16 0.37 0 1 0.16 0.37 0 1BETTERRANK 8.0 5.4 1 24 8.1 5.6 1 24WORSERANK 16.6 6.0 2 25 16.7 6.0 2 25BETTERRANKHOME 0.37 0.48 0 1 0.35 0.48 0 1NEUTRALSITE (Non-NCAA Tournament) 0.15 0.36 0 1 0.16 0.37 0 1NCAAEARLYROUND 0.08 0.27 0 1 0.08 0.27 0 1NCAAREGIONAL 0.07 0.25 0 1 0.07 0.25 0 1NCAAFINALFOUR 0.02 0.14 0 1 0.02 0.14 0 1WEEKOFSEASON (percentage, 0-100) 49.2 32.6 0 95 48.4 32.8 0 95CONFERENCEGAME 0.65 0.48 0 1 0.63 0.48 0 1
Panel A: Media Poll (Obs = 983) Panel B: Coaches Poll (Obs = 998)

Table 2Media Poll estimations on probability of better-ranked team winningStandard errors clustered by better-ranked coach and worse-ranked coach in brackets*** = significant at 1%; ** = significant at 5%; * = significant at 10%
(1) (2) (3) (4) (5) (6)Better-Ranked Coach Black 0.005 0.046 0.050 0.057 0.072 0.093*
[0.070] [0.067] [0.061] [0.061] [0.057] [0.054]Worse-Ranked Coach Black 0.032 0.027 0.019 0.018 0.007 0.010
[0.042] [0.041] [0.043] [0.043] [0.043] [0.039]BETTERRANK -0.020*** -0.019*** -0.031***
[0.003] [0.003] [0.009](BETTERRANK 2 )/10 0.006
[0.004]WORSERANK 0.013*** 0.014*** 0.020
[0.003] [0.003] [0.014](WORSERANK 2 )/10 -0.002
[0.004]BETTERRANKHOME 0.241*** 0.243*** 0.247*** 0.259***
[0.038] [0.037] [0.038] [0.043]NEUTRALSITE 0.106*** 0.108*** 0.110*** 0.131***
[0.036] [0.037] [0.040] [0.039]NCAAEARLYROUND -0.012 -0.011 -0.011 0.008
[0.071] [0.071] [0.072] [0.075]NCAAREGIONAL 0.014 0.010 0.018 0.023
[0.069] [0.069] [0.073] [0.078]NCAAFINALFOUR 0.150** 0.146** 0.221*** 0.227***
[0.068] [0.069] [0.076] [0.061]WEEKOFSEASON -0.000 -0.000 0.000 -0.000
[0.001] [0.001] [0.001] [0.001]CONFERENCEGAME -0.087 -0.087 -0.094* -0.081*
[0.055] [0.054] [0.049] [0.048]
N 983 983 983 983 983 1076R-sq 0.013 0.052 0.103 0.105 0.155 0.154
Linear Fixed EffectsRank Controls None Linear Quadratic Fixed
Effects

Table 3Coaches Poll estimations on probability of better-ranked team winningStandard errors clustered by better-ranked coach and worse-ranked coach in brackets*** = significant at 1%; ** = significant at 5%; * = significant at 10%
(1) (2) (3) (4) (5) (6)Better-Ranked Coach Black 0.035 0.063 0.059 0.074 0.082 0.082*
[0.068] [0.067] [0.061] [0.060] [0.050] [0.050]Worse-Ranked Coach Black 0.025 0.017 0.011 0.010 0.009 0.014
[0.041] [0.038] [0.040] [0.039] [0.038] [0.035]BETTERRANK -0.017*** -0.015*** -0.037***
[0.003] [0.003] [0.008](BETTERRANK 2 )/10 0.010***
[0.004]WORSERANK 0.011*** 0.012*** 0.029*
[0.003] [0.003] [0.017](WORSERANK 2 )/10 -0.006
[0.005]BETTERRANKHOME 0.247*** 0.251*** 0.247*** 0.251***
[0.042] [0.041] [0.045] [0.043]NEUTRALSITE 0.152*** 0.155*** 0.147*** 0.137***
[0.037] [0.038] [0.044] [0.046]NCAAEARLYROUND -0.011 -0.005 -0.029 -0.019
[0.073] [0.075] [0.074] [0.071]NCAAREGIONAL 0.002 -0.006 -0.029 -0.018
[0.068] [0.068] [0.081] [0.084]NCAAFINALFOUR 0.107 0.106 0.108 0.108
[0.074] [0.078] [0.092] [0.091]WEEKOFSEASON -0.001 -0.001 -0.001 -0.001
[0.001] [0.001] [0.001] [0.001]CONFERENCEGAME -0.052 -0.049 -0.045 -0.049
[0.054] [0.054] [0.053] [0.053]
N 1000 1000 1000 1000 1000 1076R-sq 0.018 0.046 0.100 0.105 0.137 0.137
Fixed Effects
Fixed EffectsRank Controls None Linear Linear Quadratic
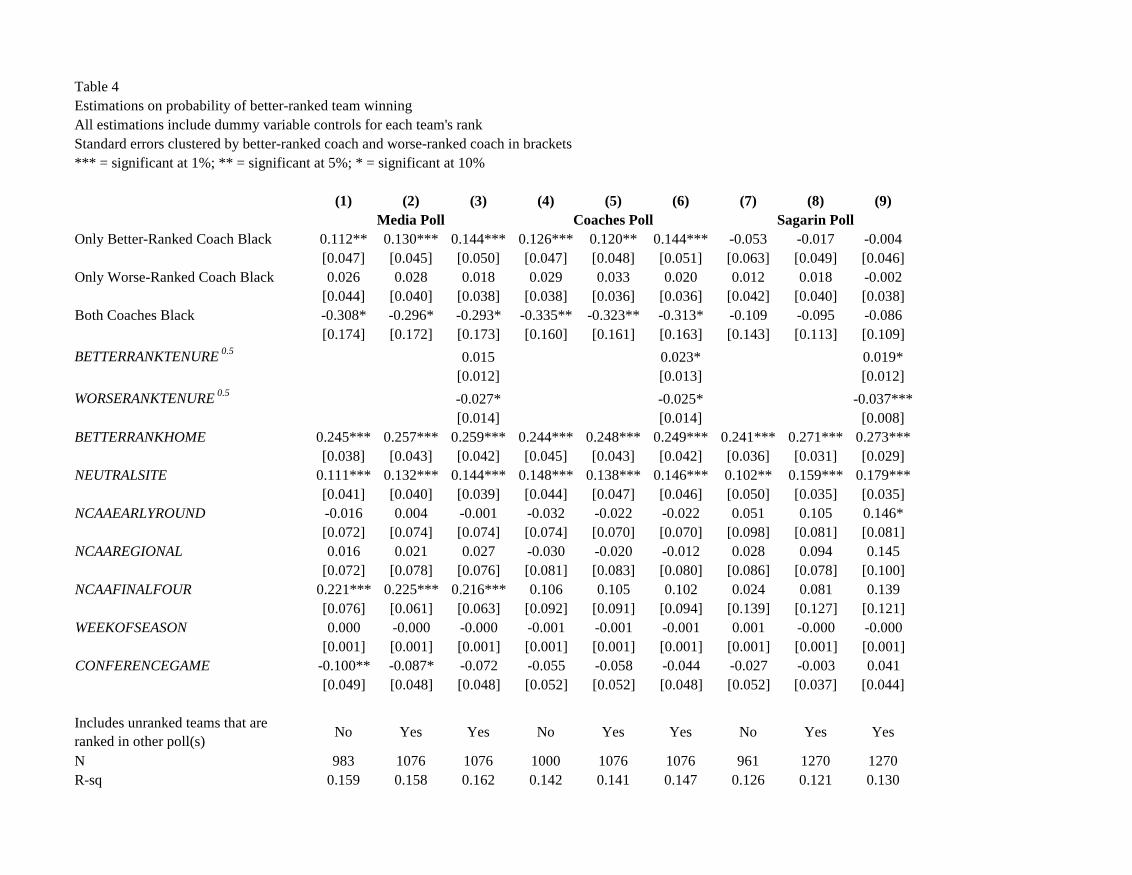
Table 4Estimations on probability of better-ranked team winningAll estimations include dummy variable controls for each team's rankStandard errors clustered by better-ranked coach and worse-ranked coach in brackets*** = significant at 1%; ** = significant at 5%; * = significant at 10%
(1) (2) (3) (4) (5) (6) (7) (8) (9)
Only Better-Ranked Coach Black 0.112** 0.130*** 0.144*** 0.126*** 0.120** 0.144*** -0.053 -0.017 -0.004[0.047] [0.045] [0.050] [0.047] [0.048] [0.051] [0.063] [0.049] [0.046]
Only Worse-Ranked Coach Black 0.026 0.028 0.018 0.029 0.033 0.020 0.012 0.018 -0.002[0.044] [0.040] [0.038] [0.038] [0.036] [0.036] [0.042] [0.040] [0.038]
Both Coaches Black -0.308* -0.296* -0.293* -0.335** -0.323** -0.313* -0.109 -0.095 -0.086[0.174] [0.172] [0.173] [0.160] [0.161] [0.163] [0.143] [0.113] [0.109]
BETTERRANKTENURE 0.5 0.015 0.023* 0.019*[0.012] [0.013] [0.012]
WORSERANKTENURE 0.5 -0.027* -0.025* -0.037***[0.014] [0.014] [0.008]
BETTERRANKHOME 0.245*** 0.257*** 0.259*** 0.244*** 0.248*** 0.249*** 0.241*** 0.271*** 0.273***[0.038] [0.043] [0.042] [0.045] [0.043] [0.042] [0.036] [0.031] [0.029]
NEUTRALSITE 0.111*** 0.132*** 0.144*** 0.148*** 0.138*** 0.146*** 0.102** 0.159*** 0.179***[0.041] [0.040] [0.039] [0.044] [0.047] [0.046] [0.050] [0.035] [0.035]
NCAAEARLYROUND -0.016 0.004 -0.001 -0.032 -0.022 -0.022 0.051 0.105 0.146*[0.072] [0.074] [0.074] [0.074] [0.070] [0.070] [0.098] [0.081] [0.081]
NCAAREGIONAL 0.016 0.021 0.027 -0.030 -0.020 -0.012 0.028 0.094 0.145[0.072] [0.078] [0.076] [0.081] [0.083] [0.080] [0.086] [0.078] [0.100]
NCAAFINALFOUR 0.221*** 0.225*** 0.216*** 0.106 0.105 0.102 0.024 0.081 0.139[0.076] [0.061] [0.063] [0.092] [0.091] [0.094] [0.139] [0.127] [0.121]
WEEKOFSEASON 0.000 -0.000 -0.000 -0.001 -0.001 -0.001 0.001 -0.000 -0.000[0.001] [0.001] [0.001] [0.001] [0.001] [0.001] [0.001] [0.001] [0.001]
CONFERENCEGAME -0.100** -0.087* -0.072 -0.055 -0.058 -0.044 -0.027 -0.003 0.041[0.049] [0.048] [0.048] [0.052] [0.052] [0.048] [0.052] [0.037] [0.044]
N 983 1076 1076 1000 1076 1076 961 1270 1270R-sq 0.159 0.158 0.162 0.142 0.141 0.147 0.126 0.121 0.130
Yes
Sagarin Poll
Includes unranked teams that are ranked in other poll(s) No YesNo Yes Yes No Yes
Media Poll
Yes
Coaches Poll
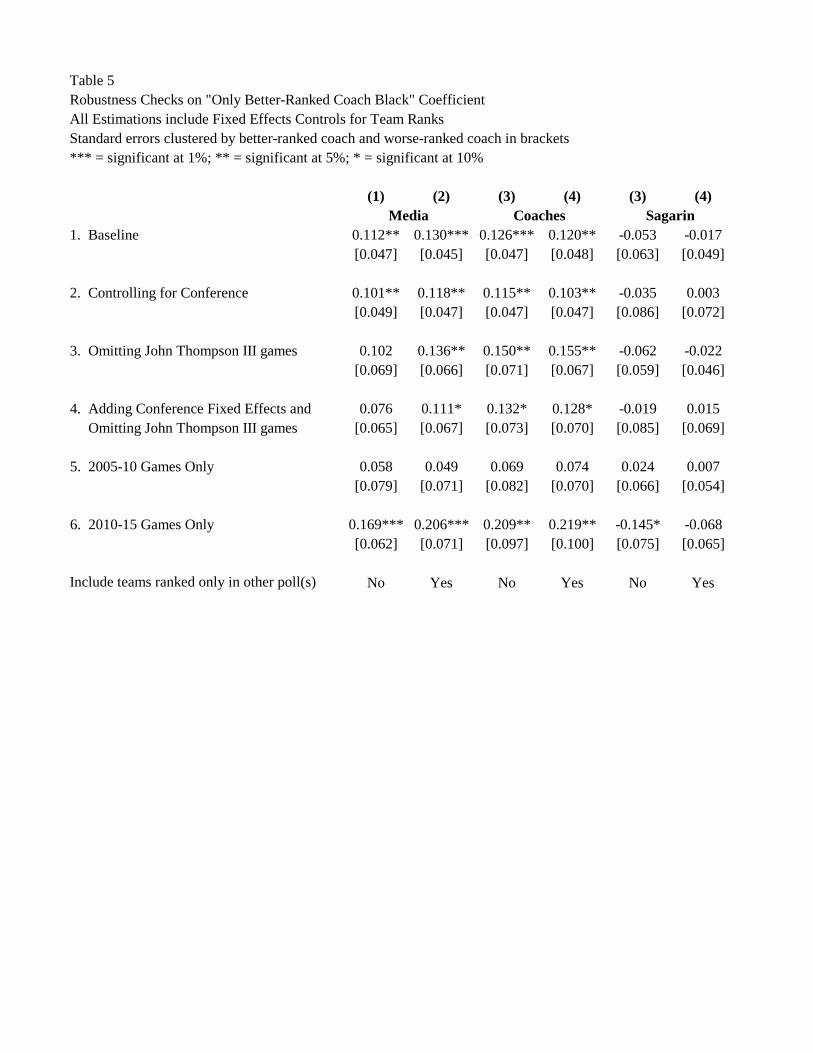
Table 5Robustness Checks on "Only Better-Ranked Coach Black" CoefficientAll Estimations include Fixed Effects Controls for Team RanksStandard errors clustered by better-ranked coach and worse-ranked coach in brackets*** = significant at 1%; ** = significant at 5%; * = significant at 10%
(1) (2) (3) (4) (3) (4)
1. Baseline 0.112** 0.130*** 0.126*** 0.120** -0.053 -0.017[0.047] [0.045] [0.047] [0.048] [0.063] [0.049]
2. Controlling for Conference 0.101** 0.118** 0.115** 0.103** -0.035 0.003[0.049] [0.047] [0.047] [0.047] [0.086] [0.072]
3. Omitting John Thompson III games 0.102 0.136** 0.150** 0.155** -0.062 -0.022[0.069] [0.066] [0.071] [0.067] [0.059] [0.046]
4. Adding Conference Fixed Effects and 0.076 0.111* 0.132* 0.128* -0.019 0.015 Omitting John Thompson III games [0.065] [0.067] [0.073] [0.070] [0.085] [0.069]
5. 2005-10 Games Only 0.058 0.049 0.069 0.074 0.024 0.007[0.079] [0.071] [0.082] [0.070] [0.066] [0.054]
6. 2010-15 Games Only 0.169*** 0.206*** 0.209** 0.219** -0.145* -0.068[0.062] [0.071] [0.097] [0.100] [0.075] [0.065]
Include teams ranked only in other poll(s) No Yes No Yes No Yes
Media Coaches Sagarin

Table 6Media Poll estimations on probability of better-ranked team winningFixed Effects for worse-ranked teamStandard errors clustered by better-ranked coach and worse-ranked coach in brackets*** = significant at 1%; ** = significant at 5%; * = significant at 10%
(1) (2) (3) (4) (5) (6) (7) (8) (9)
Better-Ranked Coach Black -0.077*** -0.044** -0.045** -0.042** -0.040* -0.034* -0.033* -0.061*** -0.059***[0.024] [0.020] [0.018] [0.020] [0.021] [0.019] [0.019] [0.020] [0.020]
BETTERRANK -0.008*** -0.008***[0.001] [0.001]
WORSERANK
WORSERANKUNRANKED
BETTERRANKTENURE 0.5 0.003 0.002 0.005[0.006] [0.006] [0.005]
BETTERRANKHOME 0.202*** 0.201*** 0.201*** 0.203*** 0.203*** 0.203*** 0.203***[0.015] [0.015] [0.015] [0.015] [0.015] [0.018] [0.018]
NEUTRALSITE 0.149*** 0.149*** 0.149*** 0.149*** 0.149*** 0.132*** 0.132***[0.025] [0.025] [0.025] [0.026] [0.026] [0.030] [0.030]
NCAAEARLYROUND 0.145*** 0.146*** 0.146*** 0.138*** 0.138*** 0.138*** 0.138***[0.037] [0.038] [0.037] [0.041] [0.041] [0.041] [0.041]
NCAAREGIONAL 0.413*** 0.397*** 0.399*** 0.417*** 0.418*** 0.455*** 0.456***[0.073] [0.074] [0.073] [0.077] [0.076] [0.077] [0.076]
NCAAFINALFOUR 0.869*** 0.905*** 0.904*** 1.082*** 1.081*** 1.080*** 1.075***[0.281] [0.276] [0.277] [0.191] [0.191] [0.177] [0.176]
WEEKOFSEASON -0.000 -0.000* -0.000* -0.001** -0.001** -0.000 0.000[0.000] [0.000] [0.000] [0.000] [0.000] [0.000] [0.000]
CONFERENCEGAME -0.017 -0.015 -0.015 -0.011 -0.011 0.001 0.001[0.023] [0.023] [0.023] [0.022] [0.022] [0.022] [0.022]
N 6832 6832 6832 6832 6832 6800 6800 6554 6554R-sq 0.355 0.368 0.411 0.415 0.415 0.417 0.417 0.413 0.413
Rank Controls None Linear Linear Fixed Effects
Fixed Effects
Coaches SagarinMedia
Fixed Effects
Fixed Effects
Fixed Effects
Fixed Effects
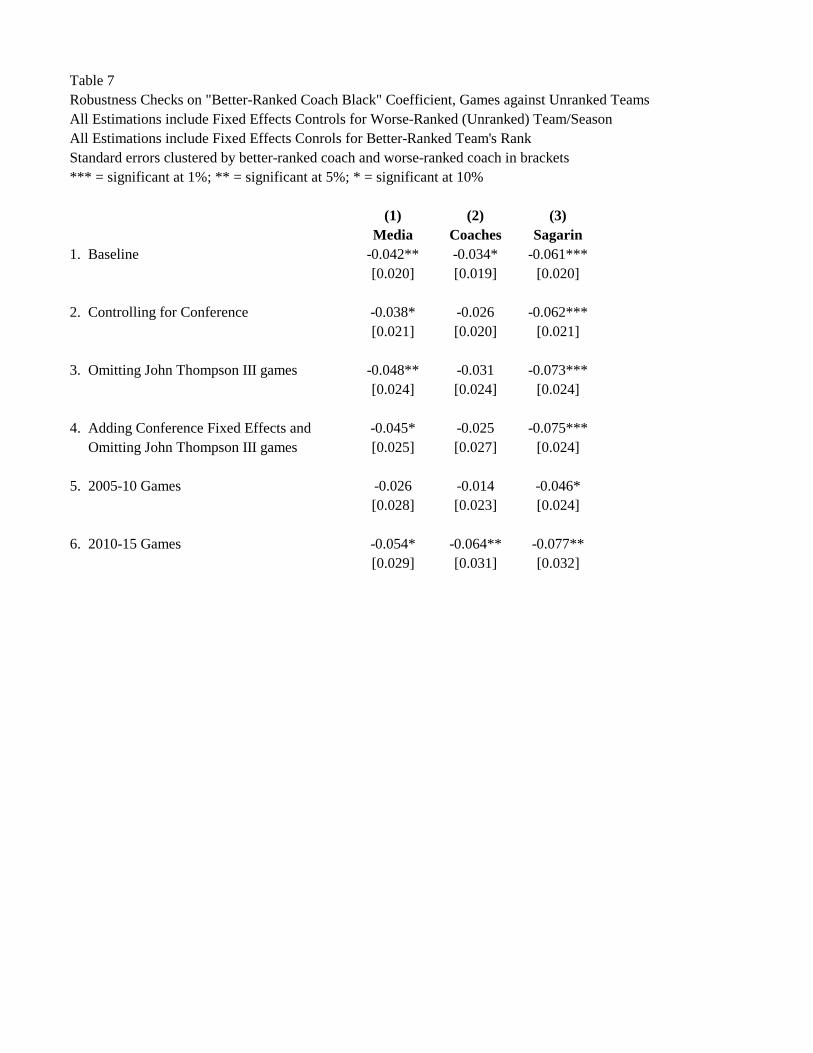
Table 7Robustness Checks on "Better-Ranked Coach Black" Coefficient, Games against Unranked TeamsAll Estimations include Fixed Effects Controls for Worse-Ranked (Unranked) Team/SeasonAll Estimations include Fixed Effects Conrols for Better-Ranked Team's RankStandard errors clustered by better-ranked coach and worse-ranked coach in brackets*** = significant at 1%; ** = significant at 5%; * = significant at 10%
(1) (2) (3)Media Coaches Sagarin
1. Baseline -0.042** -0.034* -0.061***[0.020] [0.019] [0.020]
2. Controlling for Conference -0.038* -0.026 -0.062***[0.021] [0.020] [0.021]
3. Omitting John Thompson III games -0.048** -0.031 -0.073***[0.024] [0.024] [0.024]
4. Adding Conference Fixed Effects and -0.045* -0.025 -0.075*** Omitting John Thompson III games [0.025] [0.027] [0.024]
5. 2005-10 Games -0.026 -0.014 -0.046*[0.028] [0.023] [0.024]
6. 2010-15 Games -0.054* -0.064** -0.077**[0.029] [0.031] [0.032]

Appendix Table 1Summary Statistics
Mean SD Min MaxWIN 0.61 0.49 0 1Better-Ranked Coach Black 0.08 0.27 0 1Worse-Ranked Coach Black 0.16 0.37 0 1BETTERRANK 8.1 5.6 1 24WORSERANK 16.2 5.9 2 25BETTERRANKHOME 0.38 0.49 0 1NEUTRALSITE (Non-NCAA Tournament) 0.16 0.36 0 1NCAAEARLYROUND 0.08 0.27 0 1NCAAREGIONAL 0.07 0.25 0 1NCAAFINALFOUR 0.02 0.15 0 1WEEKOFSEASON (percentage, 0-100) 62.9 27.6 0 95CONFERENCEGAME 0.67 0.47 0 1
Sagarin Poll (Obs = 961)

Appendix Table 2Observations of Black Coaches in SampleGames where Both Teams are Ranked
John Thompson III 24 37 61 21 39 60 27 37 64Tubby Smith 8 13 21 8 16 24 5 10 15Lorenzo Romar 3 17 20 4 15 19 2 9 11Mike Anderson 5 12 17 6 12 18 5 15 20Oliver Purnell 2 14 16 3 12 15 8 14 22Frank Haith 6 6 12 7 6 13 6 7 13Kevin Ollie 1 11 12 2 10 12 1 8 9Leonard Hamilton 1 11 12 0 10 10 1 8 9Ernie Kent 5 5 10 3 5 8 1 6 7Trent Johnson 3 7 10 3 5 8 5 5 10Al Skinner 5 2 7 6 2 8 1 7 8Jeff Capel 3 4 7 4 4 8 5 1 6Mike Davis 2 5 7 2 5 7 2 6 8Paul Hewitt 0 7 7 1 6 7 2 9 11Shaka Smart 1 2 3 1 4 5 1 1 2Tommy Amaker 1 2 3 0 2 2 2 3 5Chris Lowery 1 1 2 0 2 2 1 3 4Ed Cooley 0 2 2 0 3 3 0 1 1Karl Hobbs 0 2 2 0 2 2 1 1 2Tony Barbee 0 0 0 0 1 1 0 1 1Johnny Dawkins 0 0 0 0 1 1 0 1 1Dave Leitao 0 0 0 0 1 1 0 0 0Anthony Grant 0 0 0 0 0 0 1 1 2Cuonzo Martin 0 0 0 0 0 0 0 2 2Stan Heath 0 0 0 0 0 0 0 1 1Ricardo Patton 0 0 0 0 0 0 0 1 1Total 71 160 231 71 163 234 77 158 235
Sagarin PollBetter
RankedWorse
Ranked TotalTotal
Media Poll Coaches PollWorse
RankedBetter
RankedWorse
RankedBetter
Ranked Total