preliminary analysis for the south atlantic albacore …
TRANSCRIPT

SCRS/2013/118 Collect. Vol. Sci. Pap. ICCAT, 70(3): 1276-1287 (2014)
PRELIMINARY ANALYSIS FOR THE SOUTH ATLANTIC ALBACORE
STOCK USING A NON-EQUILIBRIUM PRODUCTION MODEL
Takayuki Matsumoto1, Laurie Kell2, Haritz Arrizabalaga3 and Hidetada Kiyofuji1
SUMMARY
A Stock-Production Model Incorporating Covariates (ASPIC), a non-equilibrium
surplus-production model, was attempted for the stock assessment for the southern Atlantic
Ocean, using the software package ASPIC ver. 5.34. The model configuration and fleet
categorization are similar to those for 2011 stock assessment. Several CPUE indices used for
the last assessment were not used based on decision at 2013 albacore data preparatory meeting.
Four models, which were selected for final models at 2011 assessment, were examined. In
general, all the models except for one predicted that at some stage in the recent past, the
southern Albacore stock had been overfishing and had been overfished. In these cases, the
fishing pressure appears to have eased in recent years, with a subsequent recovery in biomass.
Based on the results of future projection, both fishing mortality and total biomass will recover
to MSY level if future catch is same as or slightly (<10%) higher than current (2011) level.
RÉSUMÉ
Un modèle stock-production incorporant des covariances (ASPIC), un modèle de production
excédentaire en conditions de non-équilibre, a été tenté pour l'évaluation du stock de germon de
l'océan Atlantique Sud, en utilisant le logiciel ASPIC ver 5.34. La configuration du modèle et la
catégorisation des flottilles sont similaires à celles de l'évaluation du stock de 2011. Plusieurs
indices de CPUE utilisés dans la dernière évaluation n'ont pas été utilisés conformément à la
décision prise lors de la réunion de préparation des données sur le germon de 2013. Quatre
modèles, qui ont été sélectionnés comme modèles finaux à l'évaluation de 2011, ont été
examinés. En règle générale, tous les modèles, sauf un, ont prédit qu'à un moment donné dans
le passé récent, le stock de germon du Sud avait fait l'objet de surpêche et avait été surexploité.
Dans ces cas, la pression de la pêche semble s'être atténuée au cours de ces dernières années,
la biomasse s'étant rétablie par la suite. Sur la base des résultats de futures projections, la
mortalité par pêche et la biomasse totale se rétabliront au niveau de la PME si les prises
futures sont similaires ou légèrement supérieures (<10%) au niveau actuel (2011).
RESUMEN
Se probó un modelo de producción de stock que incorporaba covariables (ASPIC), un modelo
de producción excedente en no equilibrio, para la evaluación de stock para el océano Atlántico
sur, utilizando un paquete ASPIC versión 5.34. La configuración del modelo y la categorización
de las flotas fueron similares a las de la evaluación de stock de 2011. Varios de los índices de
CPUE utilizados en la última evaluación no se utilizaron basándose en las decisiones tomadas
durante la Reunión de preparación de datos de atún blanco de 2013. Se examinaron cuatro
modelos seleccionados para modelos finales en la evaluación de 2011. En general, todos los
modelos, excepto uno, predijeron que en alguna etapa del pasado reciente, el stock de atún
blanco del sur había sido objeto de sobrepesca y había estado sobrepescado. En estos casos, la
presión pesquera parece haberse atenuado en años recientes, con la consiguiente recuperación
de la biomasa. Basándose en los resultados de proyecciones futuras, la mortalidad por pesca y
la biomasa total se recuperarán hasta el nivel de RMS si la captura futura se sitúa en el mismo
nivel o en un nivel ligeramente superior (<10%) que el nivel actual (2011).
KEYWORDS
Stock assessment, mathematical model, yield predictions, albacore, catch/effort
1 National Research Institute of Far Seas Fisheries, 5-7-1, Orido, Shimizu, Shizuoka-shi, 424-8633 Japan.
2 ICCAT Secretariat. Corazón de Maria 8, Madrid Spain 28002. 3 AZTI - Tecnalia /Itsas Ikerketa Saila, Herrera Kaia Portualde z/g, 20110 Pasaia Gipuzkoa, Spain.
1276
1 Introduction
At 2011 ICCAT albacore stock assessment meeting, stock assessment of south Atlantic albacore was held based
on a Stock-Production Model Incorporating Covariates (ASPIC) and Bayesian Surplus Production (BSP) model.
At that time the results of ASPIC analyses indicated that in many cases the stock was in the “red” zone of Kobe
plot, and current catch was below MSY level. At 2013 ICCAT Atlantic albacore data preparatory meeting, the
working group decided to use ASPIC and BSP for stock assessment of south Atlantic albacore held in June 2013.
At that time the group also discussed which CPUE indices to use.
This paper provides preliminary results for ASPIC model version 5.34 (Prager 1992) applied to the albacore tuna
stock in the southern Atlantic Ocean.
2 Model description and data input
2.1. Data
The model was fit to eight time series of catch (1956-2011) and four time series of CPUE (1959-2011) data
covering 8 distinct fishing fleets. Fleet description (
Table 1) is similar to that used for ASPIC model at 2011 assessment (ICCAT 2012), and several fisheries, which
were not included in the data for 2011 assessment, were added. In 2011, eight CPUE series were used. However,
at 2013 ICCAT Atlantic albacore data preparatory meeting, the working group decided not to use indices for
Japanese longline transition period (1970-1975), Brazilian longline and South African baitboat. Table 2 and
Figure 1 show catch by fleet and Table 3 and Figure. 2 show CPUE indices used for the models.
2.2. Structural assumptions of the model
Basically, the same models as those for 2011 assessment were examined. Both logistic (Schaefer) and FOX
shape were used to fit the data. B1/K was fixed to 0.9 based on decision at 2011 stock assessment meeting
(ICCAT, 2012). Thus four scenarios (Table 4) were examined.
2.3. Future projection
Based on bootstrapping (500 times) of above four scenarios, future projections were conducted. Projection
period is 10 years (2012-2021). Constant future catch with -40% to +40% (at 10% interval) of 2011 level (24,122
t) was assumed (Table 5). Catch for 2012 was assumed to be the same as 2011 level.
3 Result and discussion
Table 6 shows summary results of ASPIC runs. Estimation of MSY ranged 20 to 28 thousand tons, which was
more or less 2011 catch (24 thousand tons). Estimation of r (intrinsic growth rate) differed depending on
scenarios.
Model fits to the indices of abundance are similar among scenarios, and Figure 3 shows an example (Run 02).
CPUE fit was good except for fleet 2 (Japanese longline target period). The level of fishing mortality differed
depending on scenarios, but the trends are similar; it increased up until 2001, and then decreased (Figure 4).
Figure 5 shows trends of B-ratio (B/BMSY) and F-ratio (F/FMSY) for each scenario, and Figure 6 shows Kobe I
plot. In the case of Run 02, 06 and 08, it appears that the stock had been overfishing and overfished during the
last 10-20 years, but is recovering in recent year especially as for B-ratio, which has become almost MSY level.
The results of Run 07 are much more pessimistic and the stock is not recovering in recent years. Confidence
surface of the current level for Run 07 in the Kobe I plot seems strange.
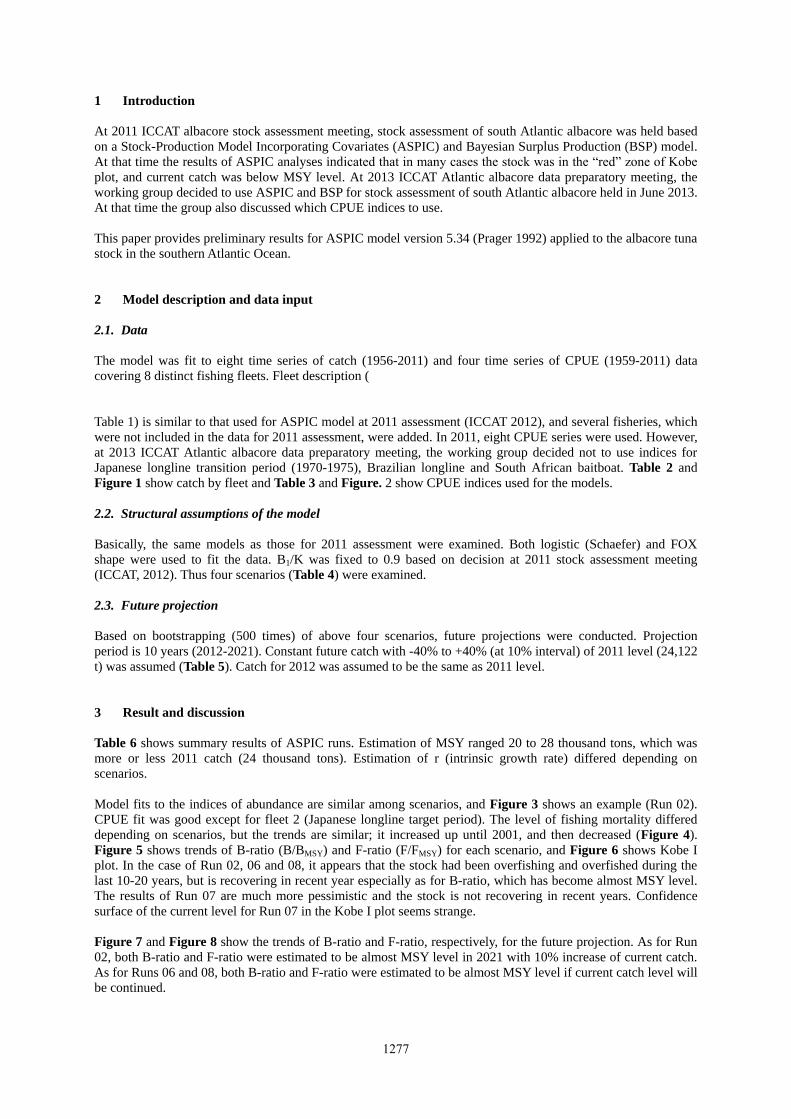
Figure 7 and Figure 8 show the trends of B-ratio and F-ratio, respectively, for the future projection. As for Run
02, both B-ratio and F-ratio were estimated to be almost MSY level in 2021 with 10% increase of current catch.
As for Runs 06 and 08, both B-ratio and F-ratio were estimated to be almost MSY level if current catch level will
be continued.
1277

Table 7 and Table 8 show Kobe II matrixes (risk assessment) based on future projections of four scenarios. As
for both biomass and F, the risk of exceeding MSY level become higher if future catch is higher than 2011 level
except for Run 07, which is much more pessimistic.
It seems that, in recent years, due to lower catch level (Figure 1), south Atlantic albacore stock shows sign of
recovery, and will continue to recover if current catch level is continued. The results for Runs 02, 06 and 08 are
comparatively similar, but Run 08 and Runs 02 and 06 are more optimistic as for biomass and F, respectively.
Of the four runs examined, the results of Run 07 seem to be not reasonable because fishing mortality and r are a
bit too low and confidence surface of Kobe I plot appears strange. Therefore, Runs 02, 06 and 08, which have
similar results, will be potential base cases.
References
Anon. 2012b. Report of the 2011 ICCAT South Atlantic and Mediterranean Atlantic and Mediterranean Albacore
Stock Assessment Session (Madrid, Spain – July 25 to 29, 2011). Col. Vol. Sci. Pap. ICCAT 68(2):
387-491.
Anon. 2014. Report of the 2013 ICCAT North and South Atlantic Albacore Data Preparatory Meeting (Madrid,
Spain - April 22 to 26, 2013). 67pp.
Prager, M.H. 1992, ASPIC: A Surplus-Production Model Incorporating Covariates. Col. Vol. Sci. Pap. ICCAT,
28: 218-229.
Table 1. Fleet descriptions used in the ASPIC models in this study.
Fleet Fleet 1 Fleet 2 (1956 –1969)
Fleet 3 (1970 –1975)
Fleet 4 (1976 –2011)
Fleet 5 Fleet 6 (1956 –1998)
Fleet 7 (1999 –2011)
Fleet 8
CPUE Chinese
Taipei
(LL)
Japan (LL)
None (1970-1975)
None None Uruguay
(LL)
Catch Chinese
Taipei
(LL)
Korea
(LL)
China (LL)
E. C. Spain (LL)
E. C. Portugal (LL)
Japan (LL)
Philippines (LL)
St Vincent and
Grenadier (LL)
USA (LL)
USSR (LL)
Vanuatu (LL)
Honduras (LL)
Nei (LL)
Côte D'Ivoire (LL)
EU.United Kingdom
(LL)
Seychelles (LL)
UK.Sta Helena (LL)
Brazil (LL, SU)
Panama (LL)
South Africa (LL,
UN)
Argentina (LL,
TW, UN)
Belize (LL)
Cambodia (LL)
Cuba (LL, UN)
Namibia (LL)
Brazil (BB, GN, HL, PS,
UN)
E. C. Spain (PS)
E. C. France (PS)
E. C. Portugal (BB, PS)
Japan (BB, PS)
Namibia (BB)
Korea (BB)
Maroc (PS)
Panama (PS)
South Africa (BB, HL, PS,
RR, SP)
USA (PS)
USSR (PS, SU)
UK St Helena (BB, RR)
Chinese Taipei (GN)
Nei (PS)
Netherlands (PS)
Argentina (PS)
Belize (PS)
Cape Verde (PS)
Curaçao (PS)
Guatemala (PS)
Uruguay
(LL)
1278

Table 2. Catches (t) for each fleet listed in Table 1.
Year Fleet 1 Fleet 2 Fleet 3 Fleet 4 Fleet 5 Fleet 6 Fleet 7 Fleet 8 1956 21 1957 725 1958 1,047
1959 3,015 1,700 1960 8,673 1,802 1961 8,893 1,872 1962 16,422 2,549 1963 15,104 2,281 1964 115 23,738 2,124 22
1965 346 28,309 1,190 1966 5,275 21,023 998 1967 7,412 7,719 752 1968 12,489 11,857 1,304 38 1969 21,732 6,331 430 1970 17,255 5,898 500
1971 21,323 3,218 344 1972 30,640 2,087 352 110 1973 25,888 277 1,969 100 1974 19,079 109 365 163 1975 16,614 306 536 151
1976 17,976 73 1,129 197 1977 19,858 105 1,162 330 1978 21,837 135 867 256 1979 21,218 105 666 651 1980 19,400 333 1,024 2,189 1981 18,869 558 996 3,594 23
1982 23,363 569 1,114 4,391 235 1983 10,101 162 1,360 2,922 373 1984 8,237 224 1,061 4,551 526 1985 20,154 623 517 8,272 1,531 1986 27,913 739 1,263 7,111 262 1987 29,173 357 1,733 9,189 178
1988 20,926 405 816 7,926 100 1989 18,440 450 788 7,450 83 1990 20,461 587 638 6,973 55 1991 19,914 804 1,333 3,930 34 1992 23,068 1,001 3,374 9,089 31 1993 19,420 748 3,753 8,863 28
1994 22,576 923 1,684 10,100 16 1995 18,354 695 941 7,513 49 1996 18,974 785 1,165 7,426 75 1997 18,169 673 769 8,354 56 1998 16,113 487 3,098 10,787 110 1999 17,391 1,560 1,651 6,965 90
2000 17,239 3,041 4,027 6,989 90 2001 15,834 5,235 6,834 10,757 135 2002 17,321 1,142 3,097 10,074 111 2003 17,356 534 2,641 7,364 108 2004 13,325 703 606 7,789 120 2005 10,772 1,446 727 5,905 32
2006 12,359 2,247 3,041 6,712 93 2007 13,202 1,313 538 5,181 34 2008 10,054 2,633 478 5,640 53 2009 9,052 2,470 493 10,133 97 2010 11,105 1,693 649 5,721 24 2011 13,102 1,888 1,417 7,677 37
1279

Table 3. Standardized CPUE series included in the ASPIC models.
Fleet
represented Fleet 1 Fleet 2 Fleet 3* Fleet 4 Fleet 5 Fleet 6 Fleet 7 Fleet 8
CPUE series
flag
Chinese
Taipei LL Japan LL1 Japan LL2 Japan LL3 (None) (None) (None)
Uruguay
LL
1959
1.888
1960
1.780
1961
1.430
1962
1.025
1963
0.992
1964
0.996
1965
0.671
1966
0.610
1967 2.078 0.648
1968 2.135 0.598
1969 2.275 0.362 2.199
1970 1.713
1.057
1971 1.730
1.673
1972 1.190
0.897
1973 1.034
0.603
1974 1.172
0.357
1975 1.376
0.213 1.040
1976 1.442
1.220
1977 1.579
0.781
1978 1.406
1.421
1979 1.305
0.580
1980 1.197
0.852
1981 0.956
1.761
1982 0.953
1.396
1983 0.934
1.105
1.689 1984 1.051
1.143
1.459
1985 0.993
1.902
1.526 1986 0.977
2.212
1.509
1987 0.872
0.906
1.411 1988 0.627
0.649
1.467
1989 0.558
0.808
1.754 1990 0.597
1.111
1.148
1991 0.671
1.286
1.333 1992 0.798
0.707
0.884
1993 0.683
0.608
1.546 1994 0.869
0.878
0.690
1995 0.867
0.563
1.103 1996 0.922
0.614
1.511
1997 0.872
0.813
1.110 1998 0.753
0.793
1.532
1999 0.631
0.834
1.217 2000 0.583
1.435
0.970
2001 0.706
1.477
0.564 2002 0.570
0.950
0.455
2003 0.534
0.996
0.317 2004 0.650
1.067
0.229
2005 0.752
0.818
0.145 2006 0.574
0.438
0.561
2007 0.654
0.332
0.706 2008 0.679
0.691
0.531
2009 0.660
0.839
0.671 2010 0.749
1.039
0.589
2011 0.672 0.936 0.371
* Only for sensitivity analysis
1280

Table 4. Details of model runs presented in this paper.
Run Weight B1/K Model
(fixed)
2 Equal for all fleets 0.9 Logistic
6 Equal for all fleets 0.9 Fox
7 Weighted by catch 0.9 Logistic
8 Weighted by catch 0.9 Fox
Table 5. Amount of future catch (2013-2021) for ASPIC future projections.
Catch level
compared with
2011 catch
-40% -30% -20% -10% 2011
catch +10% +20% +30% +40%
Catch (t) 14,473 16,885 19,298 21,710 24,122 26,534 28,946 31,359 33,771
Table 6. Results of the ASPIC model runs with those of 2011 assessment.
Results
2011 results
Mode
l run
MSY
(t)
FMS
Y
BMSY
(t)
B2012
/
BMS
Y
F2011
/
FMS
Y
K (t) r Mode
l run
MSY
(t)
FMS
Y
B2009
/
BMS
Y
F2009
/
FMS
Y
Run2 28,06
0 0.301 93,330 0.813 1.076
186,70
0
0.6
0 Run2
27,39
0 0.248 0.624 1.342
Run6 25,66
0 0.199
128,80
0 0.861 1.098
350,00
0
0.2
0 Run6
25,65
0 0.204 0.762 1.180
Run7 20,16
0 0.052
390,30
0 0.695 1.704
780,70
0
0.1
0 Run7
23,63
0 0.072 0.931 1.038
Run8 24,25
0 0.127
191,30
0 0.950 1.047
520,00
0
0.1
3 Run8
24,85
0 0.095 1.204 0.765
1281
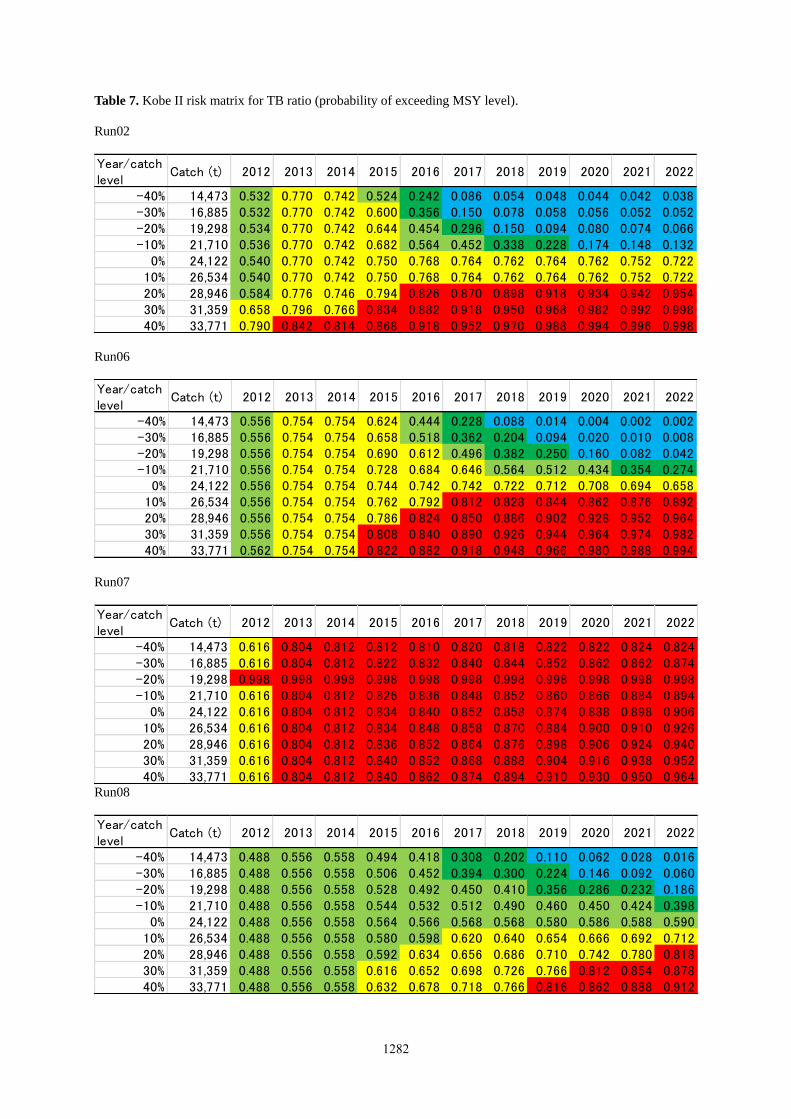
Table 7. Kobe II risk matrix for TB ratio (probability of exceeding MSY level).
Run02
Run06
Run07
Run08
Year/catchlevel
Catch (t) 2012 2013 2014 2015 2016 2017 2018 2019 2020 2021 2022
-40% 14,473 0.532 0.770 0.742 0.524 0.242 0.086 0.054 0.048 0.044 0.042 0.038-30% 16,885 0.532 0.770 0.742 0.600 0.356 0.150 0.078 0.058 0.056 0.052 0.052-20% 19,298 0.534 0.770 0.742 0.644 0.454 0.296 0.150 0.094 0.080 0.074 0.066-10% 21,710 0.536 0.770 0.742 0.682 0.564 0.452 0.338 0.228 0.174 0.148 0.132
0% 24,122 0.540 0.770 0.742 0.750 0.768 0.764 0.762 0.764 0.762 0.752 0.72210% 26,534 0.540 0.770 0.742 0.750 0.768 0.764 0.762 0.764 0.762 0.752 0.72220% 28,946 0.584 0.776 0.746 0.794 0.826 0.870 0.898 0.918 0.934 0.942 0.95430% 31,359 0.658 0.796 0.766 0.834 0.882 0.918 0.950 0.968 0.982 0.992 0.99840% 33,771 0.790 0.842 0.814 0.868 0.918 0.952 0.970 0.988 0.994 0.996 0.998
Year/catchlevel
Catch (t) 2012 2013 2014 2015 2016 2017 2018 2019 2020 2021 2022
-40% 14,473 0.556 0.754 0.754 0.624 0.444 0.228 0.088 0.014 0.004 0.002 0.002-30% 16,885 0.556 0.754 0.754 0.658 0.518 0.362 0.204 0.094 0.020 0.010 0.008-20% 19,298 0.556 0.754 0.754 0.690 0.612 0.496 0.382 0.250 0.160 0.082 0.042-10% 21,710 0.556 0.754 0.754 0.728 0.684 0.646 0.564 0.512 0.434 0.354 0.274
0% 24,122 0.556 0.754 0.754 0.744 0.742 0.742 0.722 0.712 0.708 0.694 0.65810% 26,534 0.556 0.754 0.754 0.762 0.792 0.812 0.828 0.844 0.862 0.876 0.89220% 28,946 0.556 0.754 0.754 0.786 0.824 0.850 0.886 0.902 0.928 0.952 0.96430% 31,359 0.556 0.754 0.754 0.808 0.840 0.890 0.926 0.944 0.964 0.974 0.98240% 33,771 0.562 0.754 0.754 0.822 0.882 0.918 0.948 0.966 0.980 0.988 0.994
Year/catchlevel
Catch (t) 2012 2013 2014 2015 2016 2017 2018 2019 2020 2021 2022
-40% 14,473 0.616 0.804 0.812 0.812 0.810 0.820 0.818 0.822 0.822 0.824 0.824-30% 16,885 0.616 0.804 0.812 0.822 0.832 0.840 0.844 0.852 0.862 0.862 0.874-20% 19,298 0.998 0.998 0.998 0.998 0.998 0.998 0.998 0.998 0.998 0.998 0.998-10% 21,710 0.616 0.804 0.812 0.826 0.836 0.848 0.852 0.860 0.866 0.884 0.894
0% 24,122 0.616 0.804 0.812 0.834 0.840 0.852 0.858 0.874 0.888 0.898 0.90610% 26,534 0.616 0.804 0.812 0.834 0.848 0.858 0.870 0.884 0.900 0.910 0.92620% 28,946 0.616 0.804 0.812 0.836 0.852 0.864 0.876 0.898 0.906 0.924 0.94030% 31,359 0.616 0.804 0.812 0.840 0.852 0.868 0.888 0.904 0.916 0.938 0.95240% 33,771 0.616 0.804 0.812 0.840 0.862 0.874 0.894 0.910 0.930 0.950 0.964
Year/catchlevel
Catch (t) 2012 2013 2014 2015 2016 2017 2018 2019 2020 2021 2022
-40% 14,473 0.488 0.556 0.558 0.494 0.418 0.308 0.202 0.110 0.062 0.028 0.016-30% 16,885 0.488 0.556 0.558 0.506 0.452 0.394 0.300 0.224 0.146 0.092 0.060-20% 19,298 0.488 0.556 0.558 0.528 0.492 0.450 0.410 0.356 0.286 0.232 0.186-10% 21,710 0.488 0.556 0.558 0.544 0.532 0.512 0.490 0.460 0.450 0.424 0.398
0% 24,122 0.488 0.556 0.558 0.564 0.566 0.568 0.568 0.580 0.586 0.588 0.59010% 26,534 0.488 0.556 0.558 0.580 0.598 0.620 0.640 0.654 0.666 0.692 0.71220% 28,946 0.488 0.556 0.558 0.592 0.634 0.656 0.686 0.710 0.742 0.780 0.81830% 31,359 0.488 0.556 0.558 0.616 0.652 0.698 0.726 0.766 0.812 0.854 0.87840% 33,771 0.488 0.556 0.558 0.632 0.678 0.718 0.766 0.816 0.862 0.888 0.912
1282

Table 8. Kobe II risk matrix for F ratio (probability of exceeding MSY level).
Run02
Run06
Run07
Run08
Year/catchlevel
Catch (t) 2012 2013 2014 2015 2016 2017 2018 2019 2020 2021 2022
-40% 14,473 0.532 0.564 0.012 0.004 0.004 0.000 0.000 0.000 0.000 0.000 0.000-30% 16,885 0.532 0.564 0.028 0.006 0.004 0.004 0.004 0.004 0.004 0.004 0.004-20% 19,298 0.532 0.564 0.094 0.034 0.016 0.010 0.010 0.006 0.006 0.006 0.006-10% 21,710 0.532 0.564 0.276 0.126 0.078 0.042 0.034 0.032 0.030 0.028 0.030
0% 24,122 0.532 0.564 0.686 0.678 0.684 0.678 0.638 0.632 0.628 0.622 0.60210% 26,534 0.532 0.564 0.686 0.678 0.684 0.678 0.638 0.632 0.628 0.622 0.60220% 28,946 0.532 0.564 0.812 0.842 0.878 0.904 0.922 0.932 0.946 0.962 0.97430% 31,359 0.532 0.564 0.902 0.930 0.950 0.964 0.976 0.990 0.992 0.998 0.99840% 33,771 0.532 0.564 0.932 0.956 0.970 0.986 0.992 0.994 0.998 0.998 0.998
Year/catchlevel
Catch (t) 2012 2013 2014 2015 2016 2017 2018 2019 2020 2021 2022
-40% 14,473 0.552 0.668 0.002 0.000 0.000 0.000 0.000 0.000 0.000 0.000 0.000-30% 16,885 0.552 0.668 0.044 0.006 0.000 0.000 0.000 0.000 0.000 0.000 0.000-20% 19,298 0.552 0.668 0.212 0.108 0.036 0.006 0.002 0.000 0.000 0.000 0.000-10% 21,710 0.552 0.668 0.456 0.384 0.290 0.208 0.146 0.096 0.048 0.028 0.016
0% 24,122 0.552 0.668 0.654 0.648 0.646 0.618 0.600 0.584 0.568 0.542 0.51810% 26,534 0.552 0.668 0.792 0.816 0.828 0.840 0.860 0.874 0.890 0.902 0.91820% 28,946 0.552 0.668 0.864 0.898 0.916 0.932 0.946 0.962 0.966 0.974 0.98230% 31,359 0.552 0.668 0.922 0.944 0.956 0.968 0.980 0.986 0.990 0.996 0.99640% 33,771 0.552 0.668 0.952 0.962 0.980 0.986 0.990 0.996 0.996 0.996 0.996
Year/catchlevel
Catch (t) 2012 2013 2014 2015 2016 2017 2018 2019 2020 2021 2022
-40% 14,473 0.616 0.876 0.626 0.618 0.610 0.594 0.576 0.562 0.538 0.522 0.488-30% 16,885 0.616 0.876 0.802 0.802 0.804 0.820 0.828 0.832 0.846 0.854 0.862-20% 19,298 0.994 0.998 0.998 0.998 0.998 0.998 0.998 0.998 0.998 0.998 0.998-10% 21,710 0.616 0.876 0.856 0.862 0.866 0.874 0.886 0.896 0.900 0.910 0.920
0% 24,122 0.616 0.876 0.884 0.892 0.904 0.912 0.924 0.940 0.948 0.962 0.96810% 26,534 0.616 0.876 0.920 0.926 0.940 0.954 0.960 0.966 0.980 0.984 0.98620% 28,946 0.616 0.876 0.946 0.958 0.968 0.976 0.984 0.988 0.988 0.992 0.99630% 31,359 0.616 0.876 0.968 0.980 0.986 0.988 0.992 0.992 0.996 0.996 0.99640% 33,771 0.616 0.876 0.984 0.988 0.992 0.992 0.996 0.996 0.996 0.996 0.998
Year/catchlevel
Catch (t) 2012 2013 2014 2015 2016 2017 2018 2019 2020 2021 2022
-40% 14,473 0.492 0.552 0.004 0.000 0.000 0.000 0.000 0.000 0.000 0.000 0.000-30% 16,885 0.492 0.552 0.062 0.028 0.010 0.000 0.000 0.000 0.000 0.000 0.000-20% 19,298 0.492 0.552 0.204 0.150 0.098 0.068 0.040 0.022 0.010 0.002 0.000-10% 21,710 0.492 0.552 0.412 0.382 0.350 0.308 0.264 0.238 0.208 0.180 0.142
0% 24,122 0.492 0.552 0.554 0.564 0.564 0.562 0.568 0.580 0.584 0.588 0.58810% 26,534 0.492 0.552 0.672 0.694 0.704 0.712 0.730 0.744 0.770 0.794 0.81820% 28,946 0.492 0.552 0.744 0.768 0.798 0.814 0.848 0.868 0.882 0.900 0.91430% 31,359 0.492 0.552 0.810 0.846 0.866 0.882 0.902 0.922 0.940 0.950 0.95840% 33,771 0.492 0.552 0.866 0.884 0.908 0.930 0.946 0.954 0.958 0.968 0.974
1283

Figure 1. Annual trend of catch amount by fleet for ASPIC models.
Figure. 2. Annual trend of standardized CPUE included in the ASPIC models.
1284
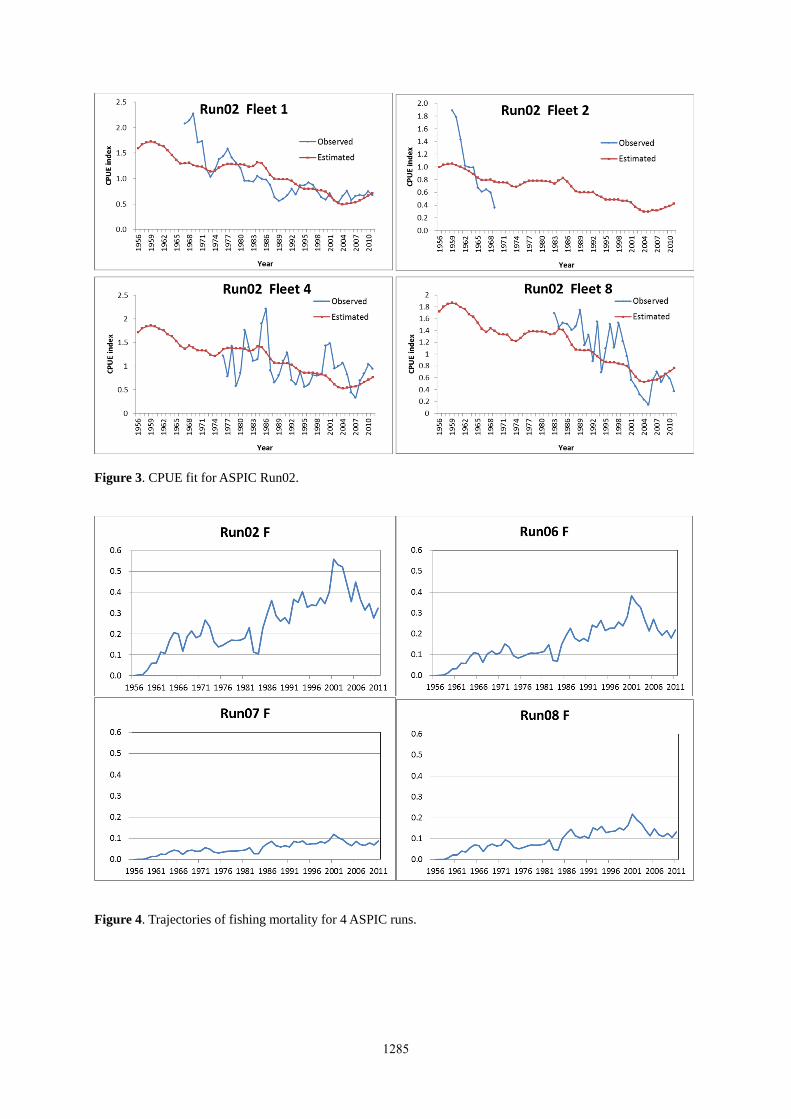
Figure 3. CPUE fit for ASPIC Run02.
Figure 4. Trajectories of fishing mortality for 4 ASPIC runs.
1285

Figure 5. Trajectories of B-ratio (B/BMSY) and F-ratio (F/FMSY) with 80% confidence limits (dashed lines) for 4
ASPIC runs.
Figure 6. KobeI plot for 4 ASPIC runs.
1286
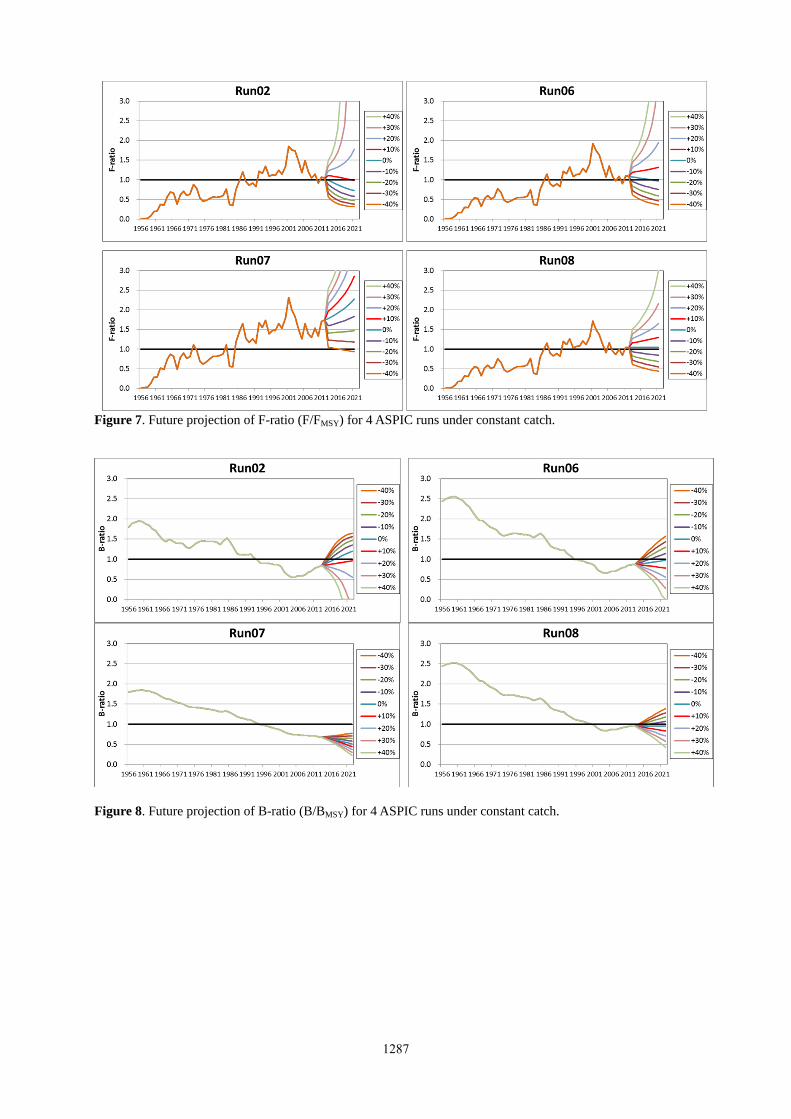
Figure 7. Future projection of F-ratio (F/FMSY) for 4 ASPIC runs under constant catch.
Figure 8. Future projection of B-ratio (B/BMSY) for 4 ASPIC runs under constant catch.
1287