preliminary analysis of mctg fy2018 data...• 53 airlines • 4,706 aircraft ~20% of the world...
TRANSCRIPT

Preliminary Analysis ofMCTG FY2018 Data
Geraldine CROS
Manager, Ops Cost Management, IATA
1.
3.
Presentation Outline
Maintenance Cost Methodology
2. FY2018 Data Preliminary Analysis
IATA Maintenance Cost Dashboard

1.
3.
Presentation Outline
Maintenance Cost Methodology
2. FY2018 Data Preliminary Analysis
IATA Maintenance Cost Dashboard
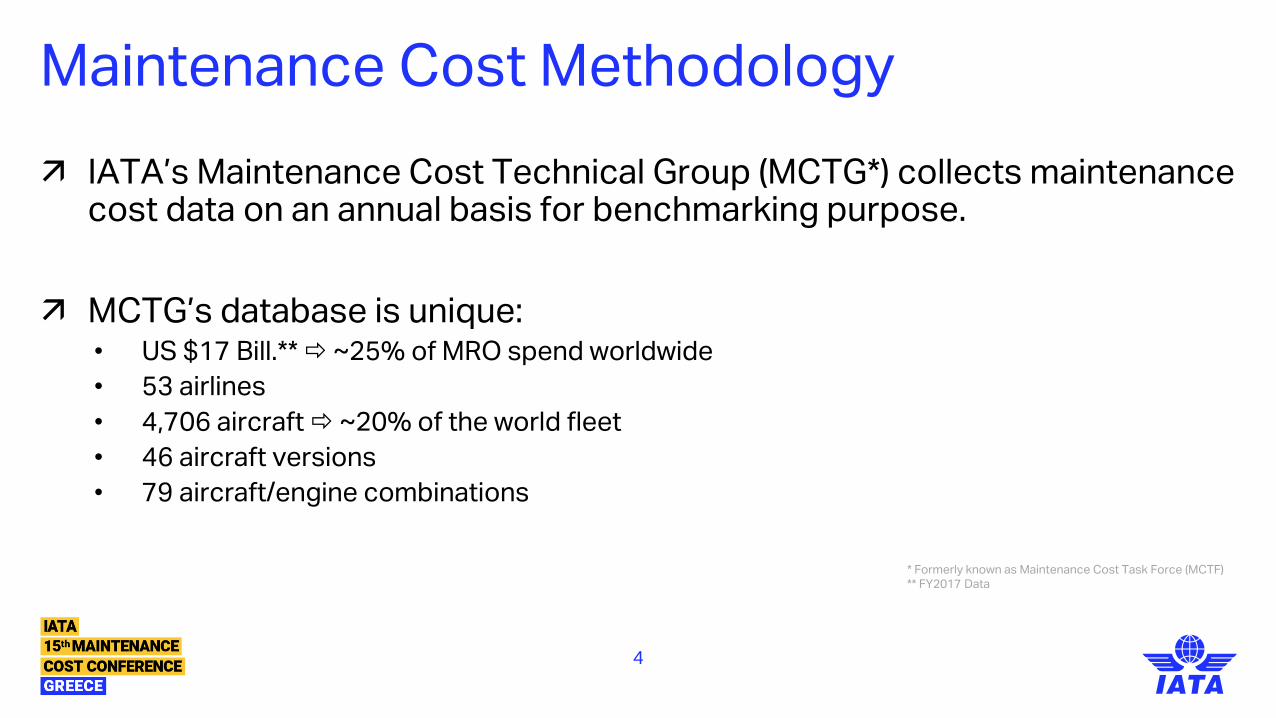
Maintenance Cost Methodology
IATA’s Maintenance Cost Technical Group (MCTG*) collects maintenance cost data on an annual basis for benchmarking purpose.
MCTG’s database is unique:• US $17 Bill.** ~25% of MRO spend worldwide
• 53 airlines
• 4,706 aircraft ~20% of the world fleet
• 46 aircraft versions
• 79 aircraft/engine combinations
* Formerly known as Maintenance Cost Task Force (MCTF)** FY2017 Data
4
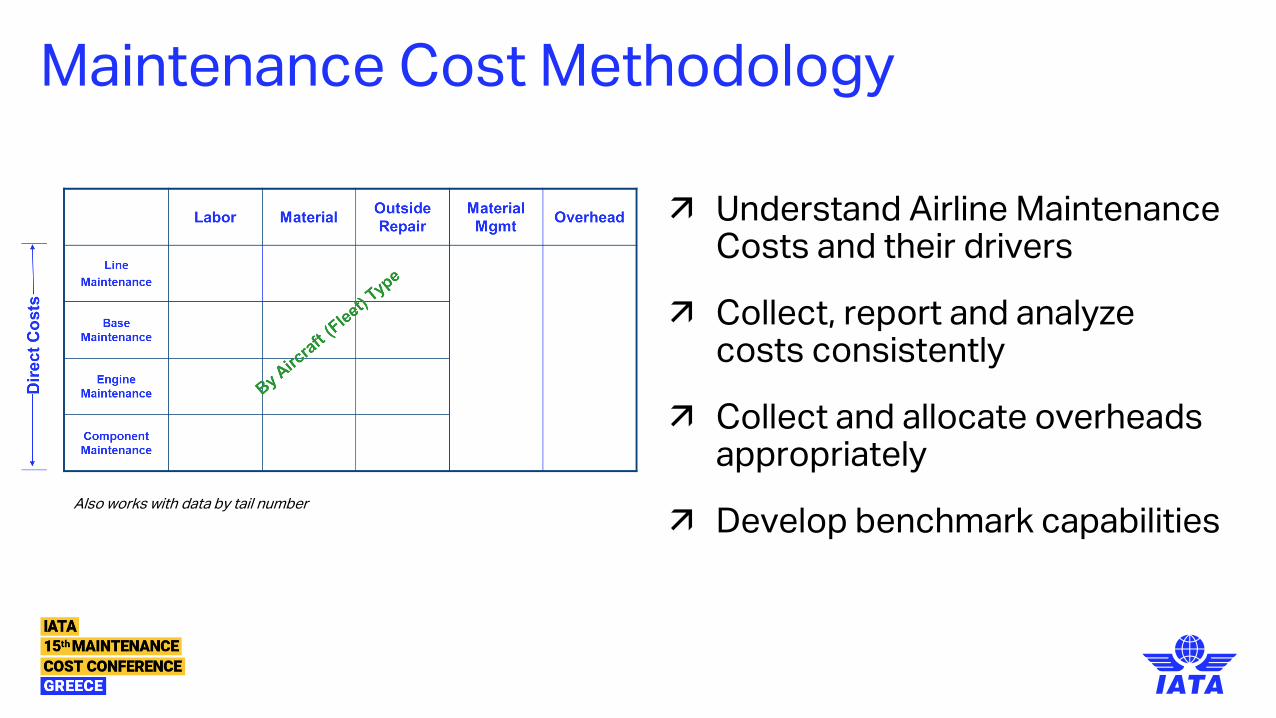
Maintenance Cost Methodology
Understand Airline Maintenance Costs and their drivers
Collect, report and analyze costs consistently
Collect and allocate overheads appropriately
Develop benchmark capabilitiesAlso works with data by tail number
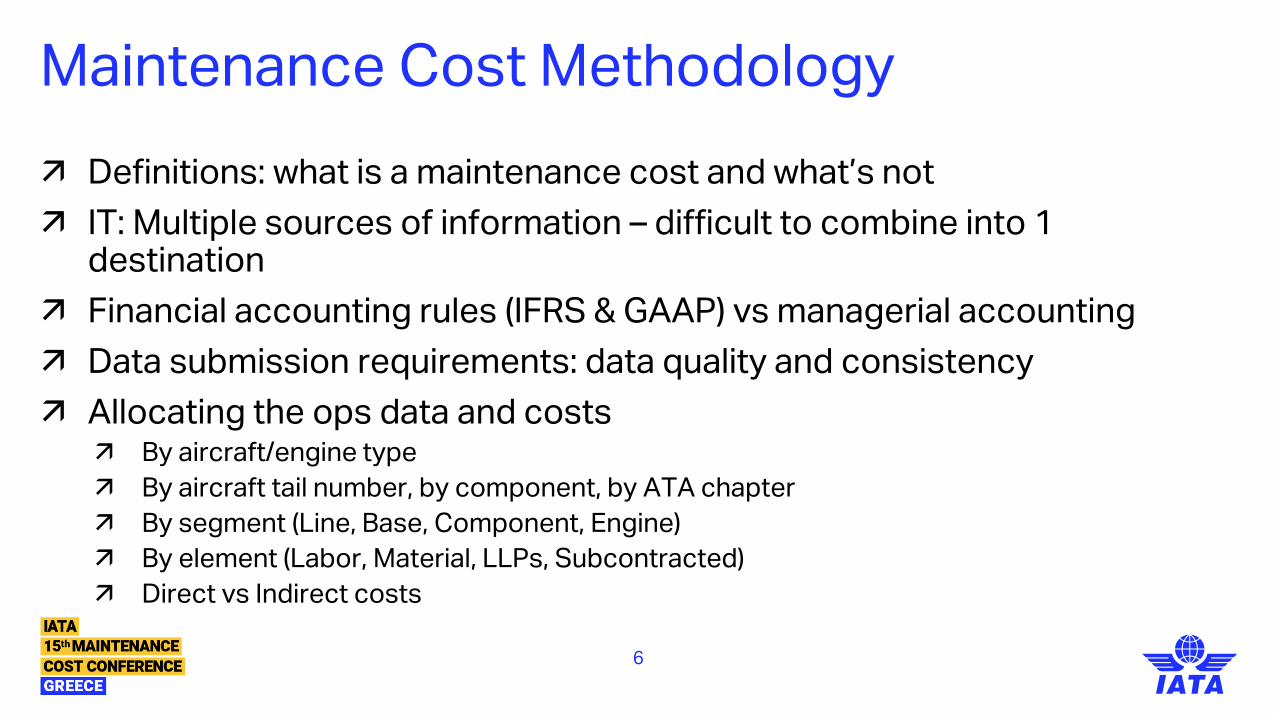
Maintenance Cost Methodology
Definitions: what is a maintenance cost and what’s not
IT: Multiple sources of information – difficult to combine into 1 destination
Financial accounting rules (IFRS & GAAP) vs managerial accounting
Data submission requirements: data quality and consistency
Allocating the ops data and costs By aircraft/engine type
By aircraft tail number, by component, by ATA chapter
By segment (Line, Base, Component, Engine)
By element (Labor, Material, LLPs, Subcontracted)
Direct vs Indirect costs
6
Maintenance Cost Methodology
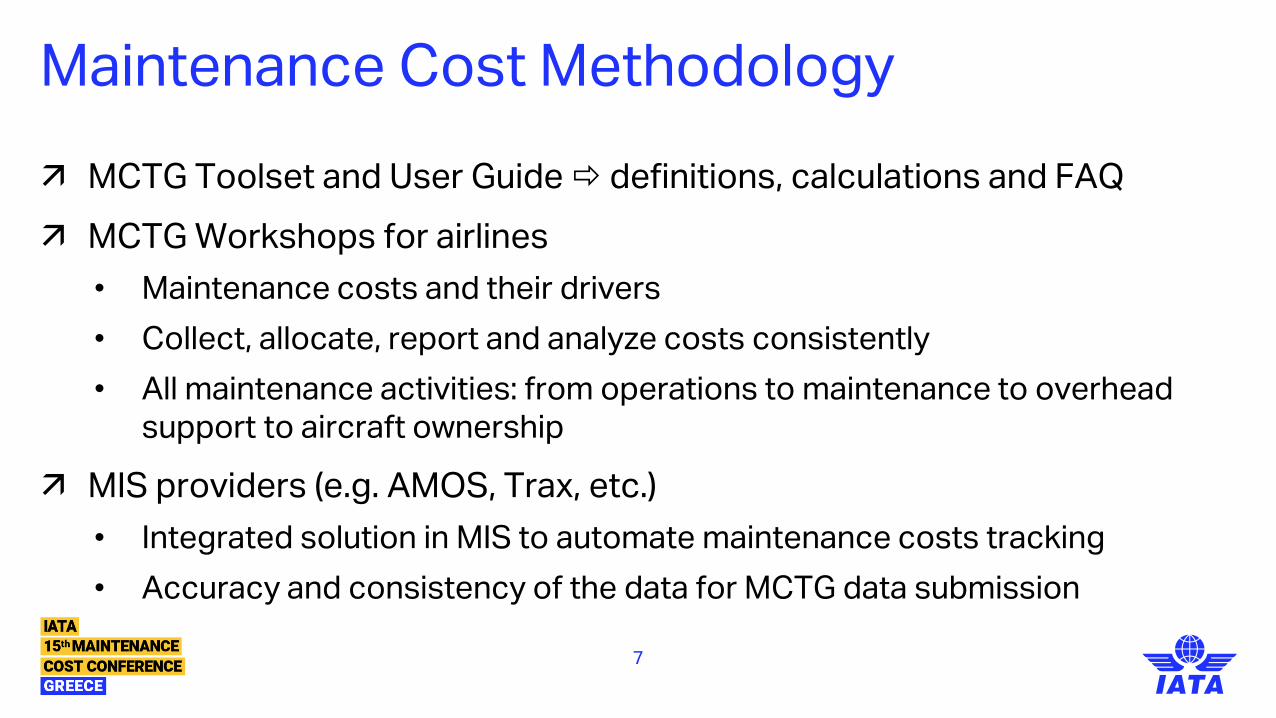
MCTG Toolset and User Guide definitions, calculations and FAQ
MCTG Workshops for airlines
• Maintenance costs and their drivers
• Collect, allocate, report and analyze costs consistently
• All maintenance activities: from operations to maintenance to overhead support to aircraft ownership
MIS providers (e.g. AMOS, Trax, etc.)
• Integrated solution in MIS to automate maintenance costs tracking
• Accuracy and consistency of the data for MCTG data submission
7
1.
3.
Presentation Outline
Maintenance Cost Methodology
2. FY2018 Data Preliminary Analysis
IATA Maintenance Cost Dashboard
9
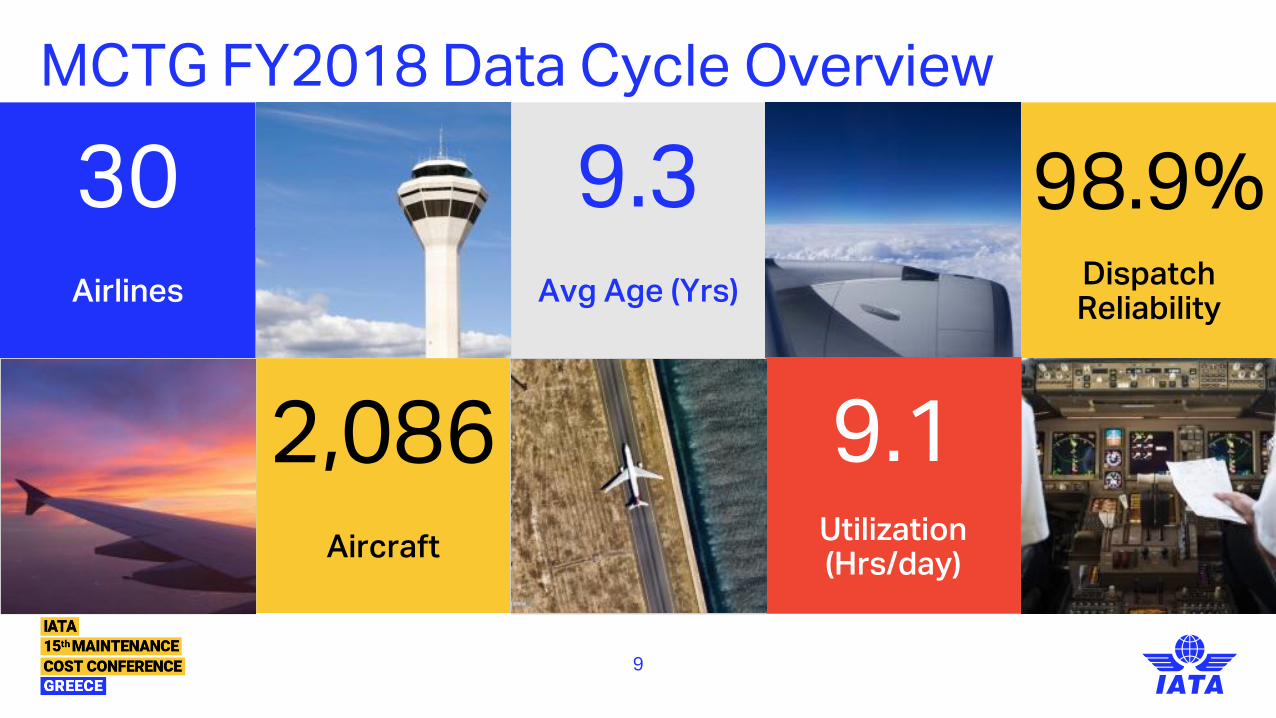
MCTG FY2018 Data Cycle Overview
30Airlines
9.3Avg Age (Yrs)
98.9%Dispatch Reliability
2,086Aircraft
Utilization (Hrs/day)
9.1
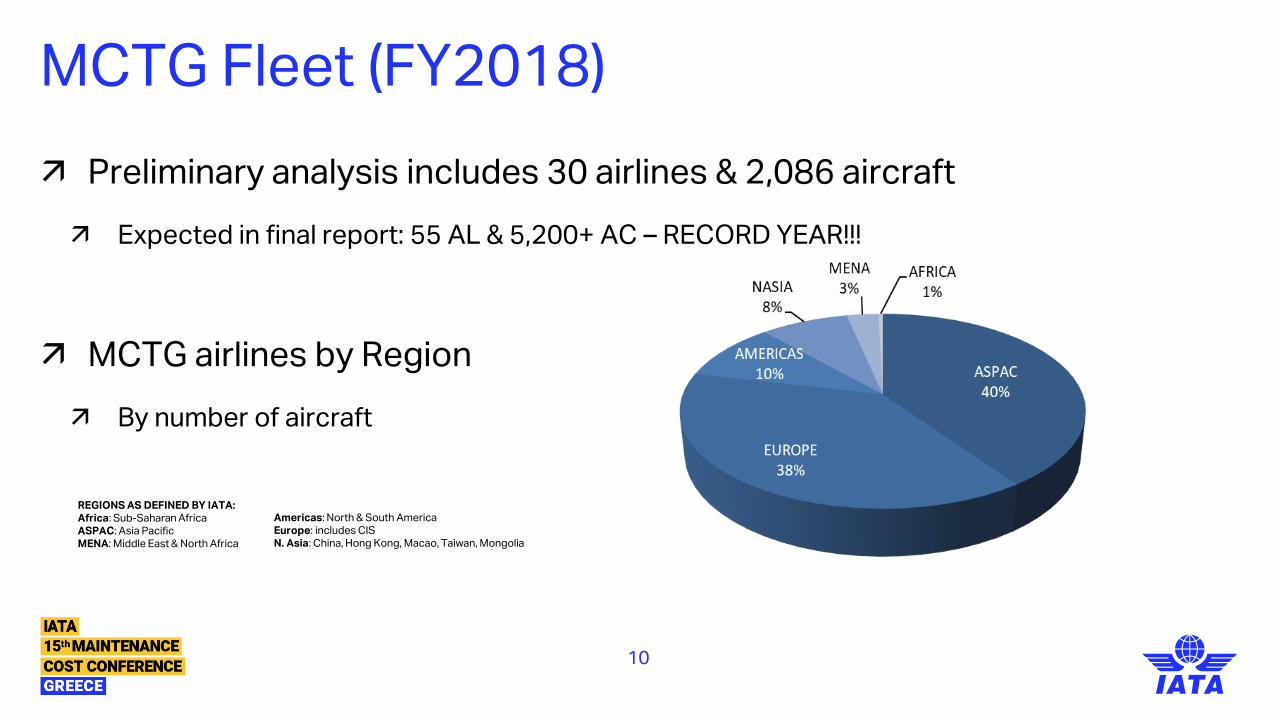
MCTG Fleet (FY2018)
Preliminary analysis includes 30 airlines & 2,086 aircraft
Expected in final report: 55 AL & 5,200+ AC – RECORD YEAR!!!
MCTG airlines by Region
By number of aircraft
10
REGIONS AS DEFINED BY IATA:Africa: Sub-Saharan Africa ASPAC: Asia PacificMENA: Middle East & North Africa
Americas: North & South America Europe: includes CISN. Asia: China, Hong Kong, Macao, Taiwan, Mongolia
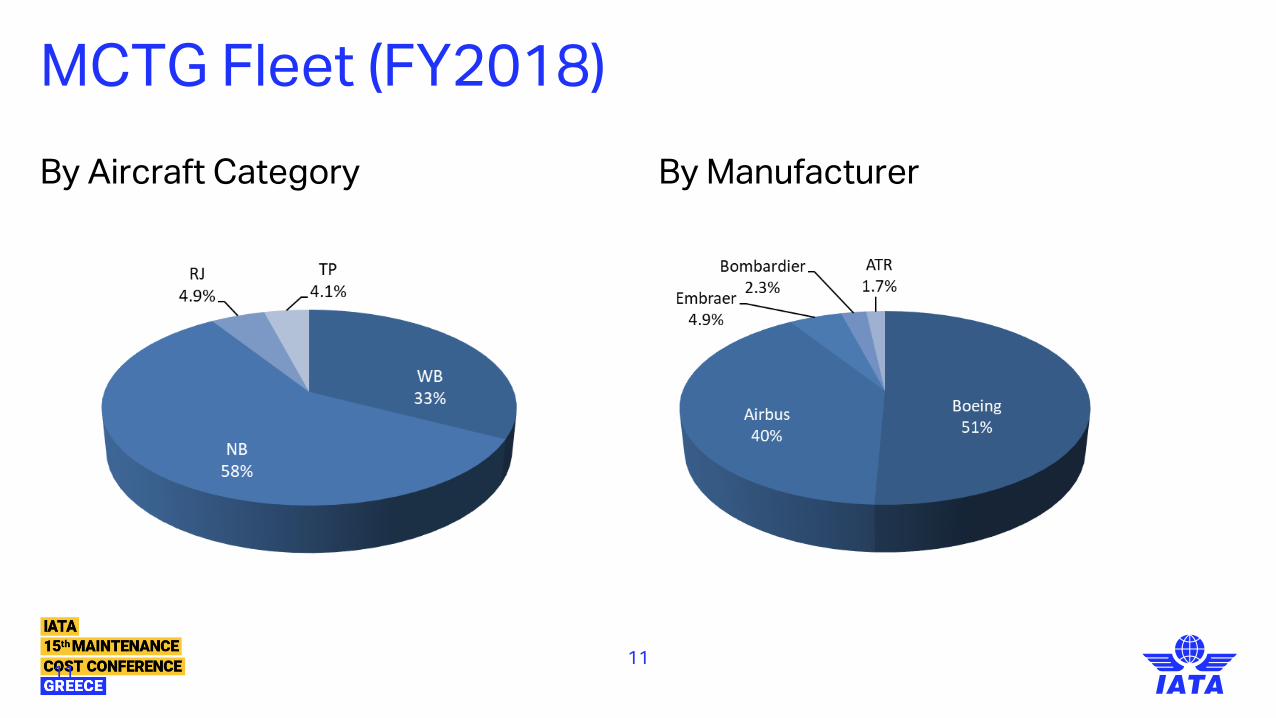
MCTG Fleet (FY2018)
By Aircraft Category By Manufacturer
1111
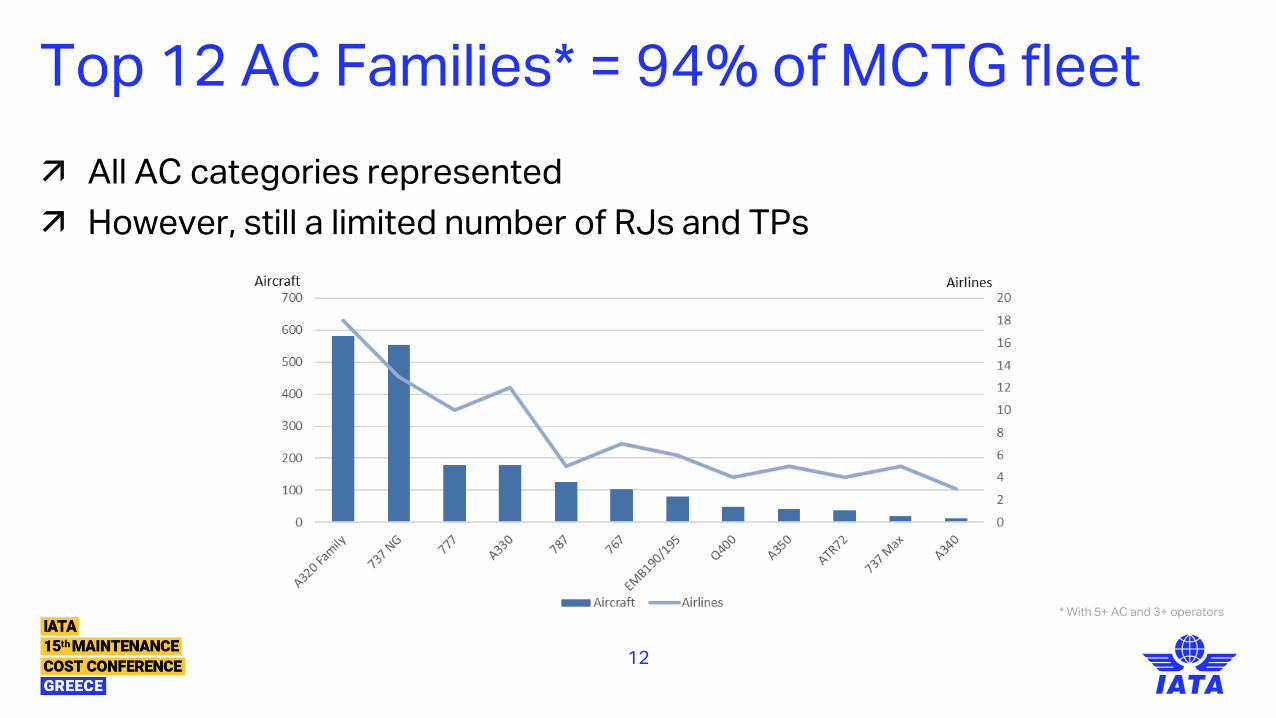
Top 12 AC Families* = 94% of MCTG fleet
All AC categories represented
However, still a limited number of RJs and TPs
12
* With 5+ AC and 3+ operators
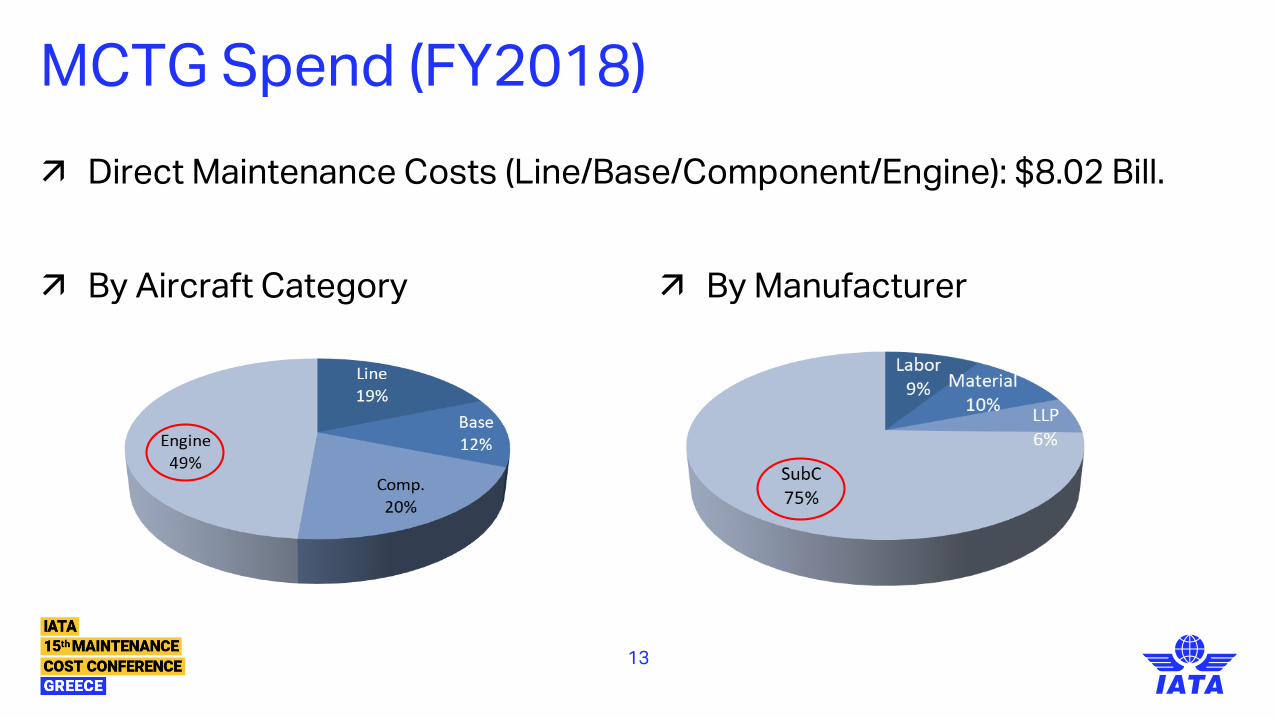
MCTG Spend (FY2018)
Direct Maintenance Costs (Line/Base/Component/Engine): $8.02 Bill.
13
By Aircraft Category By Manufacturer
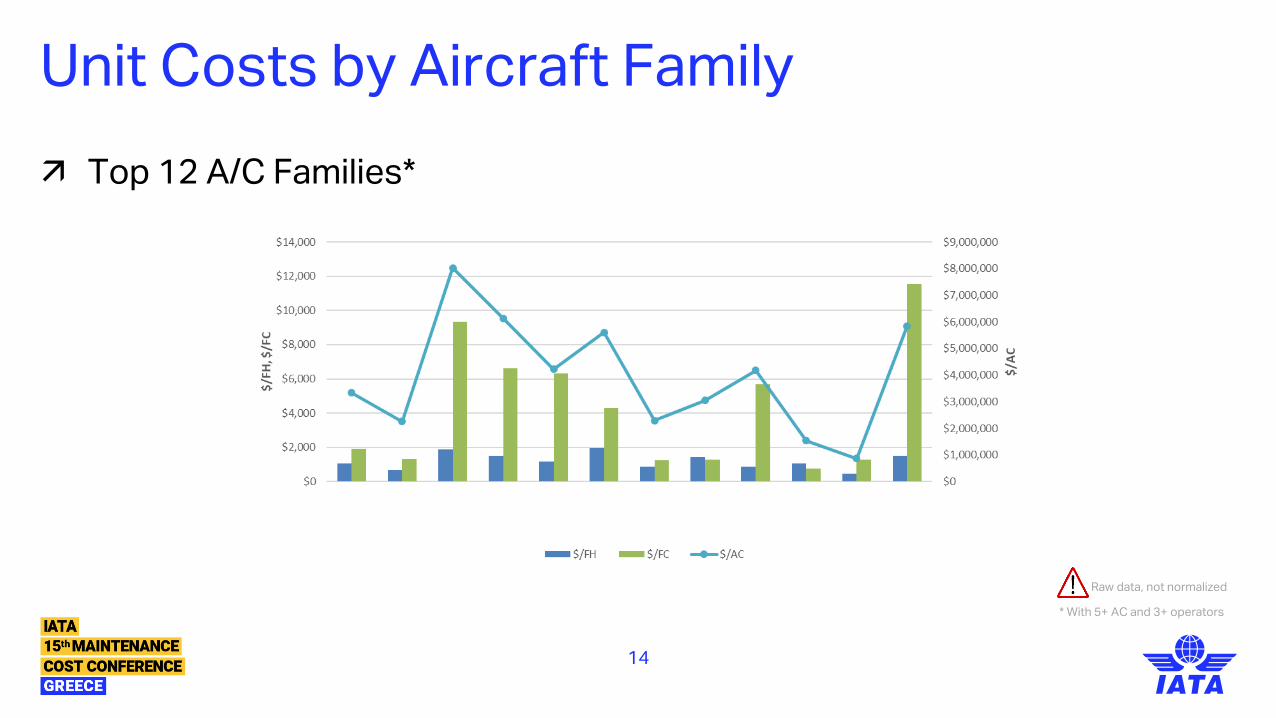
Unit Costs by Aircraft Family
Top 12 A/C Families*
14
Raw data, not normalized
* With 5+ AC and 3+ operators

Spares & Inventory
Averages: $3.9Mill. per AC ; $263Mill. per AL
15
24 airlines, 1,636 aircraft
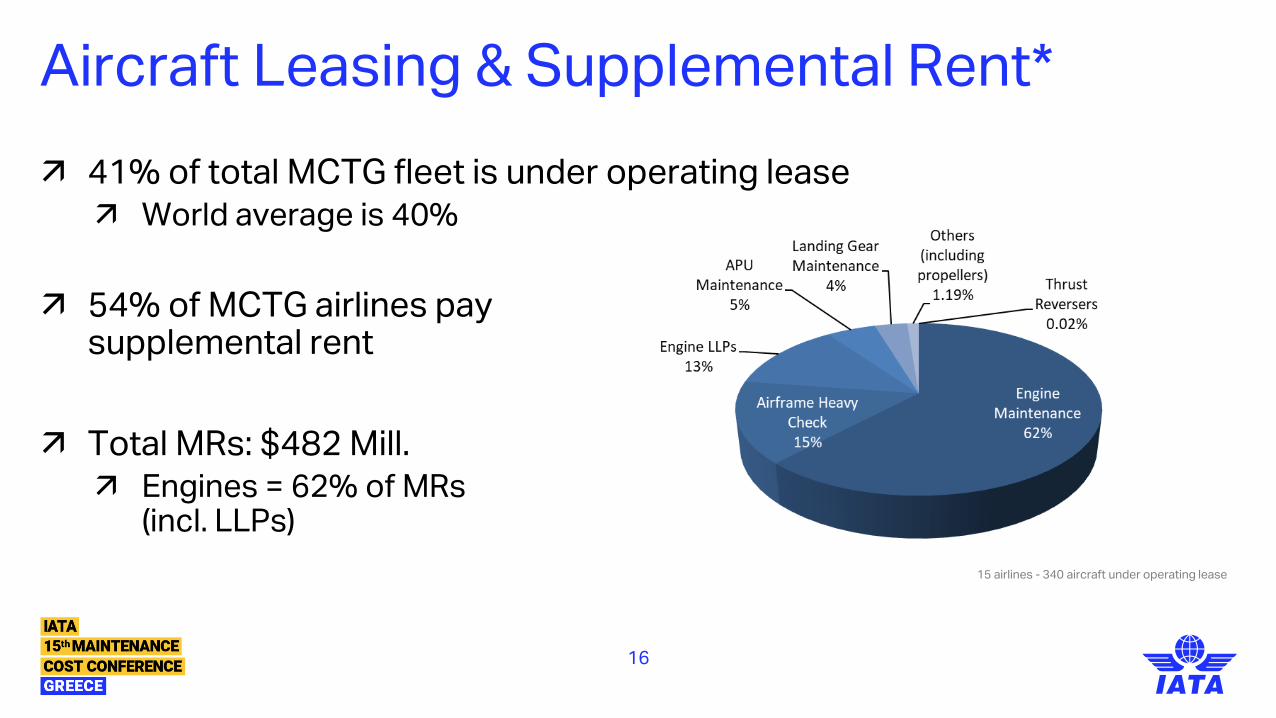
Aircraft Leasing & Supplemental Rent*
41% of total MCTG fleet is under operating lease World average is 40%
54% of MCTG airlines pay supplemental rent
Total MRs: $482 Mill. Engines = 62% of MRs
(incl. LLPs)
16
15 airlines - 340 aircraft under operating lease
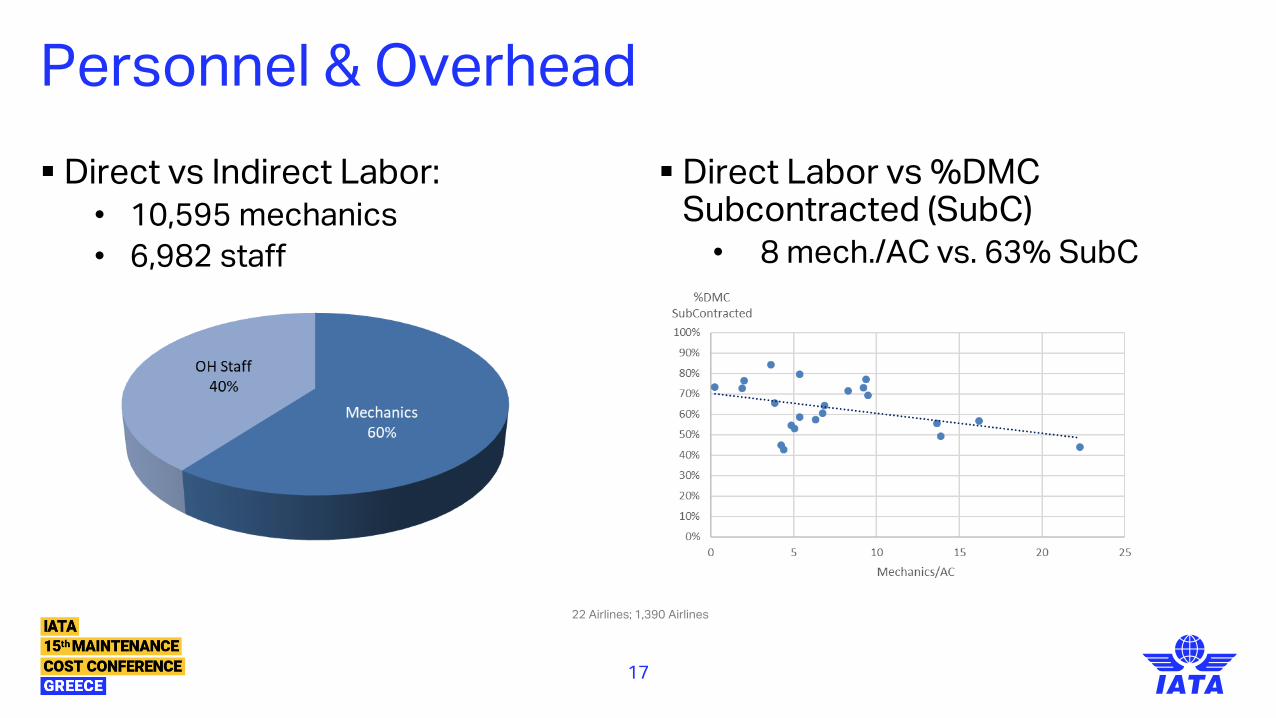
Personnel & Overhead
▪ Direct vs Indirect Labor: • 10,595 mechanics
• 6,982 staff
▪ Direct Labor vs %DMC Subcontracted (SubC)• 8 mech./AC vs. 63% SubC
17
22 Airlines; 1,390 Airlines
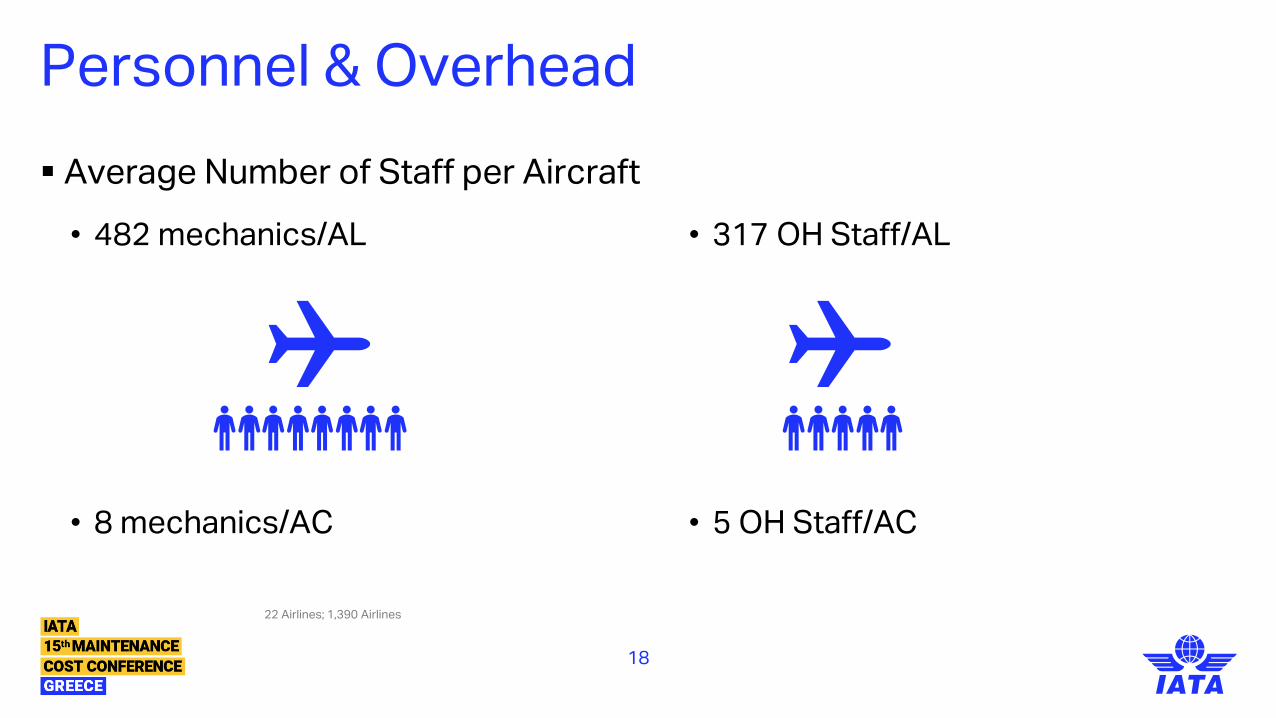
Personnel & Overhead
▪ Average Number of Staff per Aircraft
18
• 482 mechanics/AL
• 8 mechanics/AC
• 317 OH Staff/AL
• 5 OH Staff/AC
22 Airlines; 1,390 Airlines
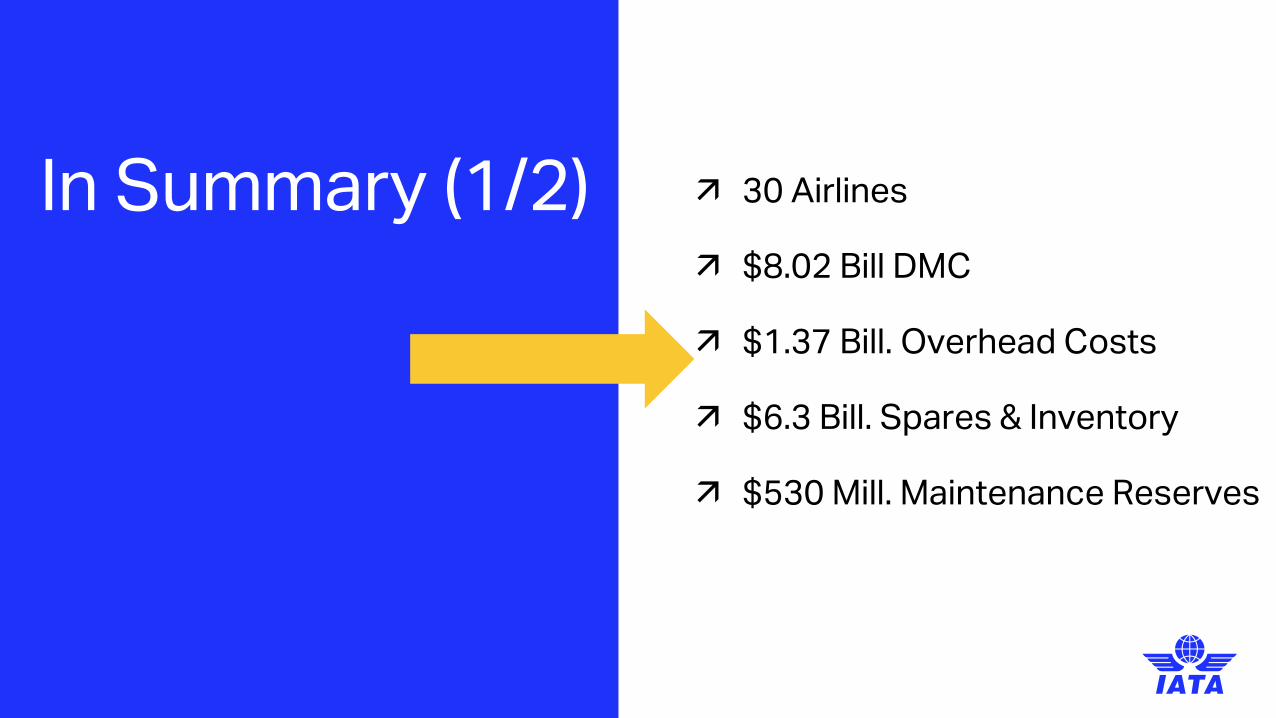
In Summary (1/2) 30 Airlines
$8.02 Bill DMC
$1.37 Bill. Overhead Costs
$6.3 Bill. Spares & Inventory
$530 Mill. Maintenance Reserves
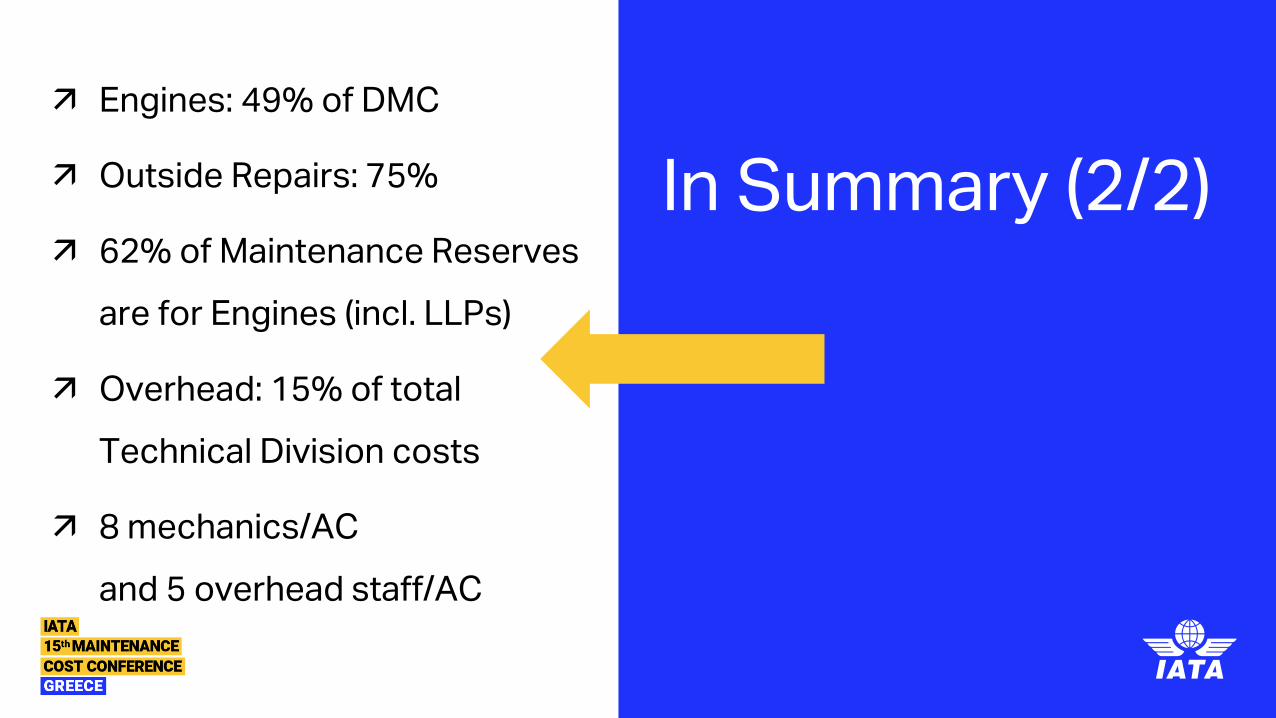
In Summary (2/2)
Engines: 49% of DMC
Outside Repairs: 75%
62% of Maintenance Reserves
are for Engines (incl. LLPs)
Overhead: 15% of total
Technical Division costs
8 mechanics/AC
and 5 overhead staff/AC
1.
3.
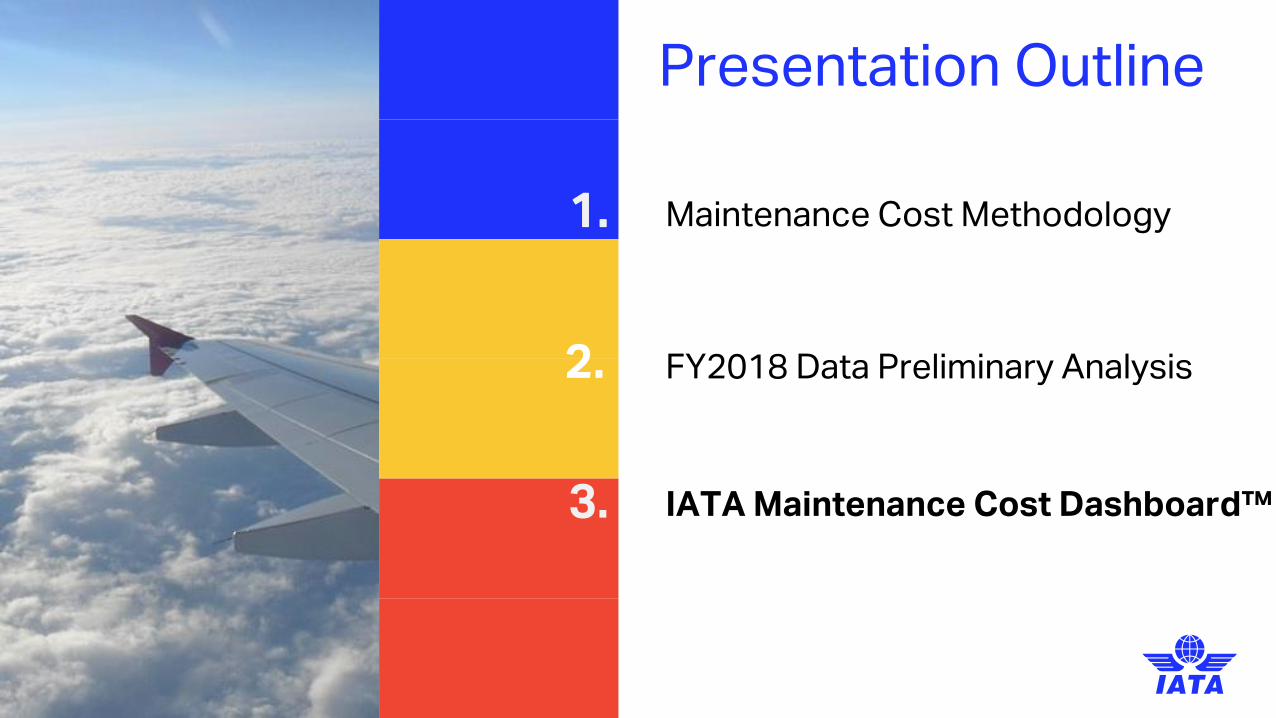
Presentation Outline
Maintenance Cost Methodology
2. FY2018 Data Preliminary Analysis
IATA Maintenance Cost Dashboard™
IATA’s Maintenance Cost Dashboard
Exclusive access for airlines that provide data
Perform your own benchmark analyses
Export data to create graphs and presentations
22
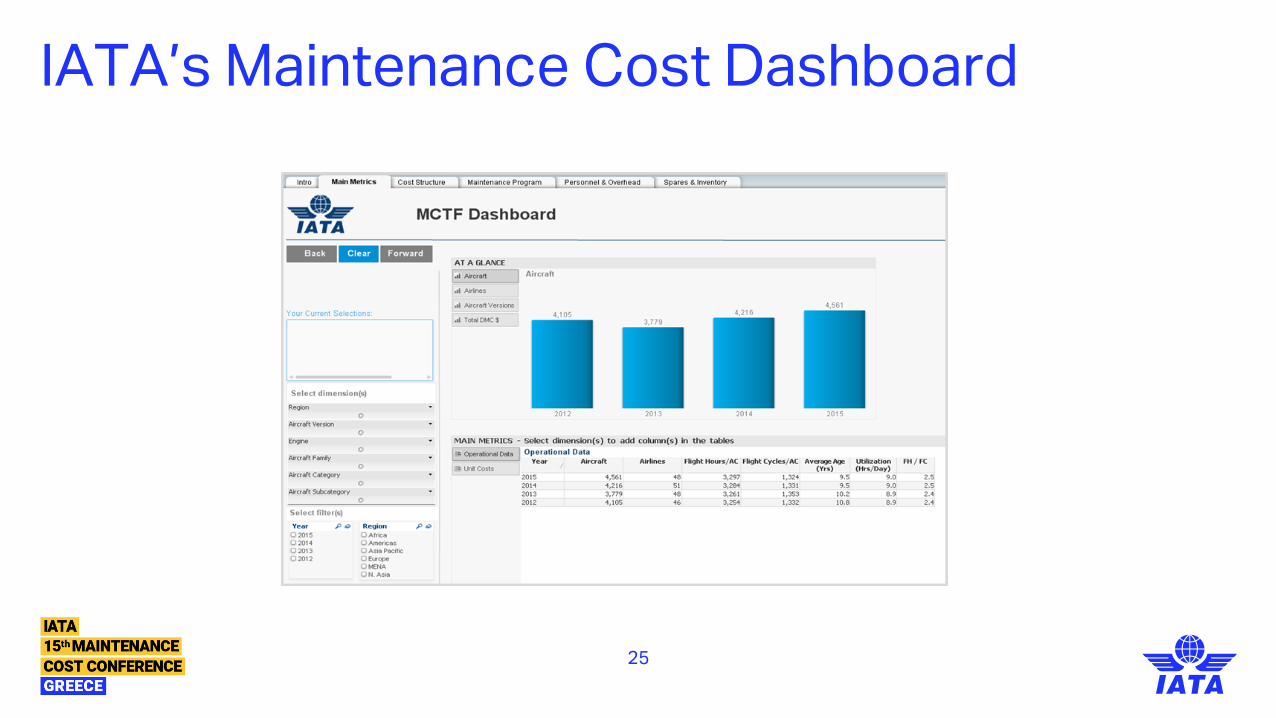
IATA’s Maintenance Cost Dashboard
23
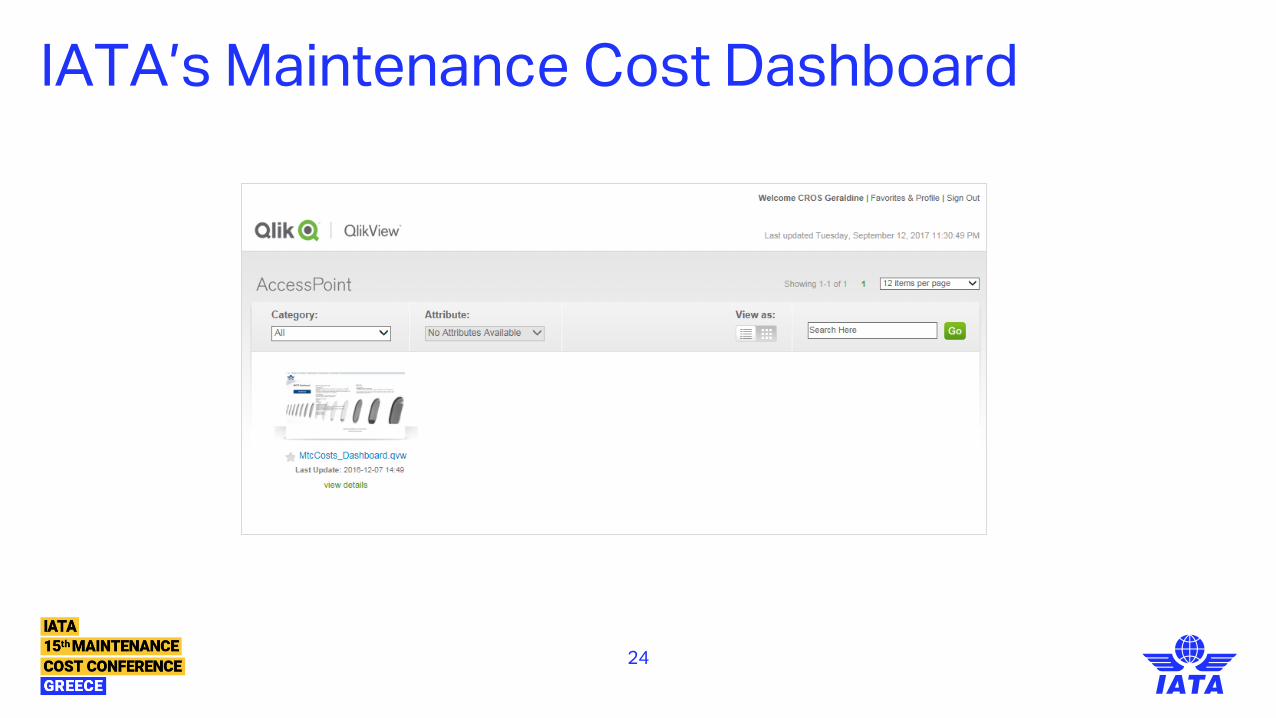
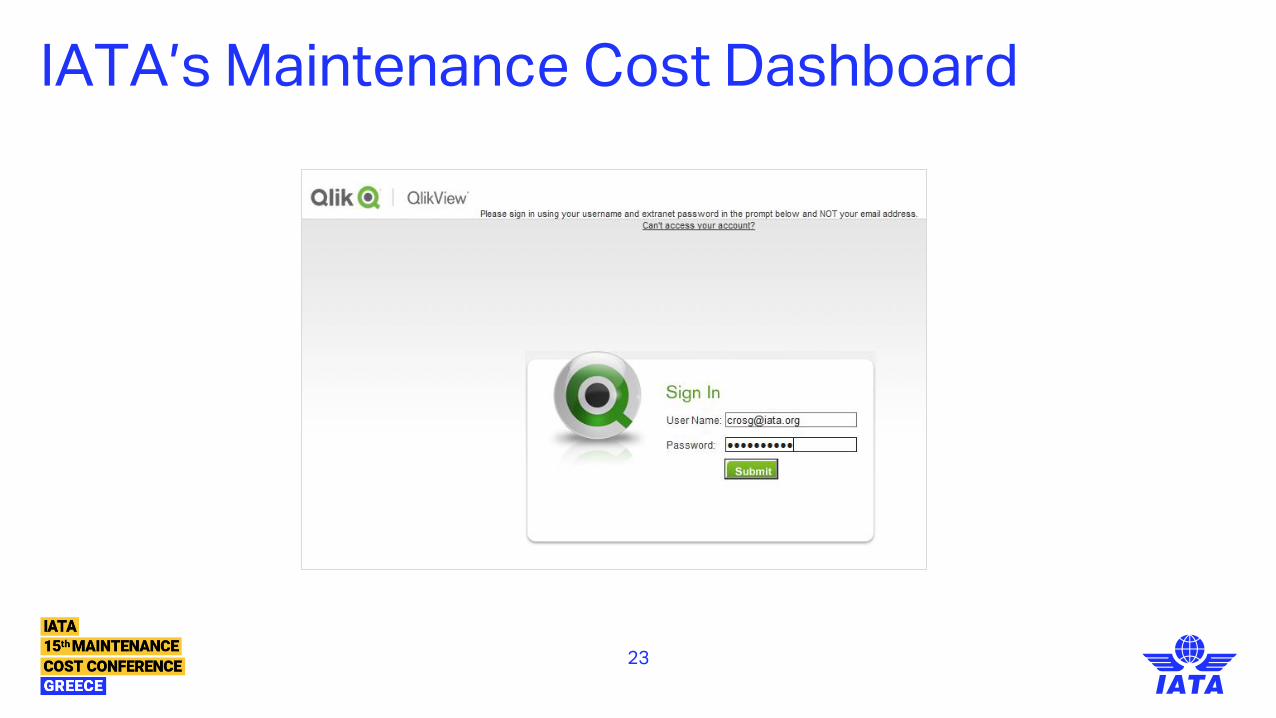
IATA’s Maintenance Cost Dashboard
24
IATA’s Maintenance Cost Dashboard
25
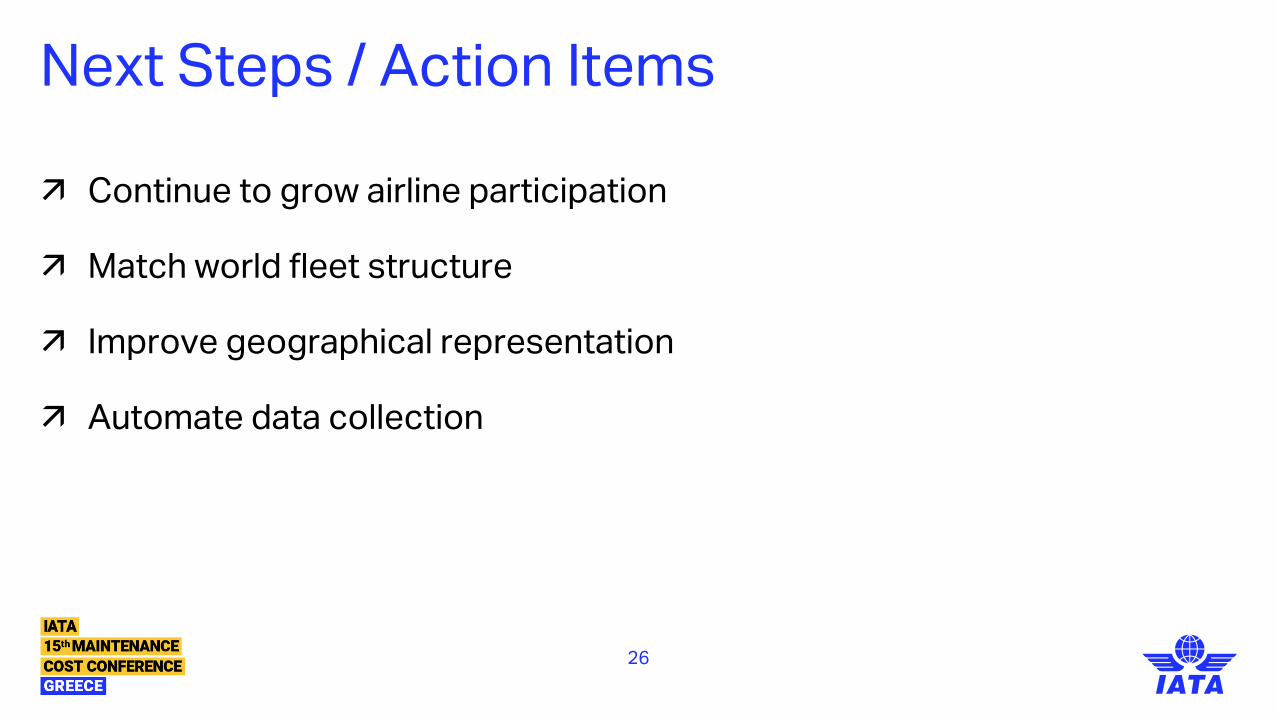
Next Steps / Action Items
Continue to grow airline participation
Match world fleet structure
Improve geographical representation
Automate data collection
26
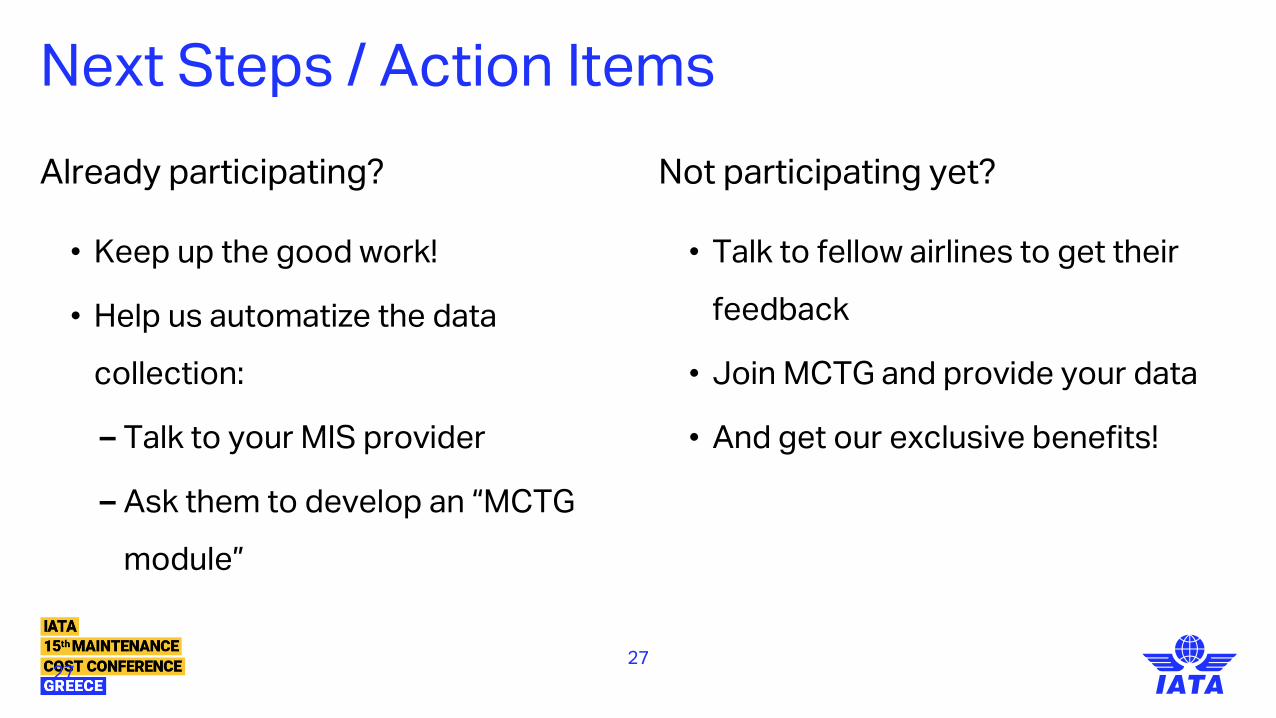
Next Steps / Action Items
Already participating? Not participating yet?
27
• Keep up the good work!
• Help us automatize the data
collection:
– Talk to your MIS provider
– Ask them to develop an “MCTG
module”
• Talk to fellow airlines to get their
feedback
• Join MCTG and provide your data
• And get our exclusive benefits!
27
Thank you
For more information, please visit
www.iata.org/mctg
Contact
• Geraldine Cros, [email protected]