preliminary draft actual and forecasted flood district
TRANSCRIPT

$0
$10,000,000
$20,000,000
$30,000,000
$40,000,000
$50,000,000
$60,000,000
$70,000,000
$80,000,000
$90,000,000
$100,000,000
$0
$5,000,000
$10,000,000
$15,000,000
$20,000,000
$25,000,000
$30,000,000
$35,000,000
2008 2009 2010 2011 2012 2013 2014 2015 2016 2017 2018 2019 2020 2021 2022 2023 2024 2025
PRELIMINARY DRAFT Actual and Forecasted Flood District Expenditures by TypeJuly 10, 2019
FCD Projects
FCD Acquisitions
Other Agencies
Opportunity Fund
WRIA Grants
Flood Reduction Grants
Fund Balance
Annual Levy*
*Annual levy assumes a 1% increase per year.
part 2 - page 1

King County Flood Control District
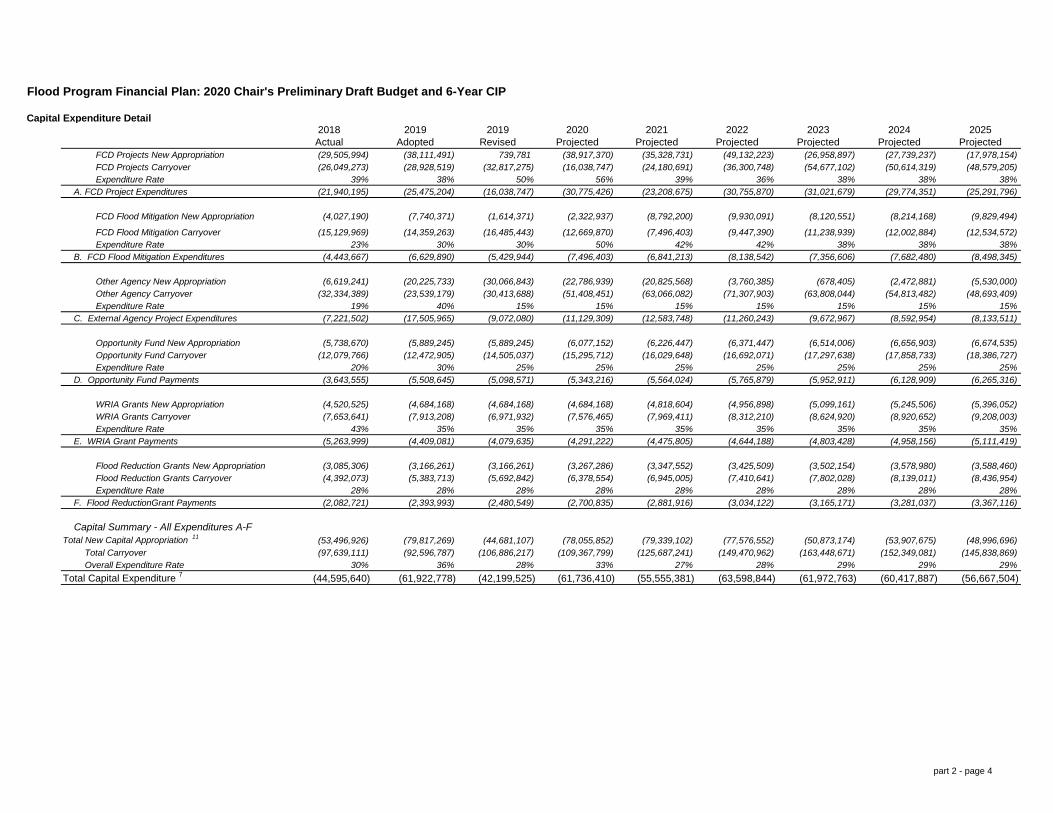
Flood Program Financial Plan: 2020 Chair's Preliminary Draft Budget and 6-Year CIP
2018
Actual
2019
Adopted
2019
Revised
2020
Projected
2021
Projected
2022
Projected
2023
Projected
2024
Projected
2025
Projected
Beginning Balance 71,766,740 64,898,272 81,912,806 89,876,187 80,657,942 78,525,823 69,303,745 59,655,728 52,362,517
Revenue
Flood District
Flood District Levy 1
56,861,309 57,568,377 57,819,986 59,405,202 60,864,587 62,281,987 63,675,528 65,072,368 65,244,725
Interest Earnings 2
1,481,810 896,400 1,691,302 1,855,726 1,665,392 1,621,369 1,430,955 1,231,747 1,081,160
Miscellaneous Revenue 3
284,874 300,000 300,000 300,000 300,000 300,000 300,000 300,000 300,000
King County
Inter-County River Improvement 4
46,000 45,000 45,000 45,000 45,000 0 0 0 0
Grants 10
5,562,332 8,607,085 4,389,000 2,869,028 2,869,028 2,869,028 0 0 0
Miscellaneous Revenue 5
189,274 175,000 175,000 175,000 175,000 175,000 175,000 175,000 175,000
Total Revenue 64,425,600 67,591,862 64,420,288 64,649,957 65,919,007 67,247,384 65,581,483 66,779,115 66,800,885
Expenditure
District Administration 6
(774,817) (886,638) (886,638) (983,237) (1,012,735) (1,043,117) (1,074,410) (1,106,642) (1,139,842)
Other District Expenditures
Tax Refund
Operating Expenditure (8,909,077) (12,839,055) (13,370,743) (11,148,555) (11,483,011) (11,827,502) (12,182,327) (12,547,797) (12,924,230)
Capital Expenditure (44,595,640) (61,922,778) (42,199,525) (61,736,410) (55,555,381) (63,598,844) (61,972,763) (60,417,887) (56,667,504)
Total Expenditure (54,279,534) (75,648,471) (56,456,906) (73,868,202) (68,051,127) (76,469,462) (75,229,500) (74,072,326) (70,731,576)
Ending Fund Balance (Cash) 81,912,806 56,841,663 89,876,187 80,657,942 78,525,823 69,303,745 59,655,728 52,362,517 48,431,826
Fund Balance Reserves
Subregional Opportunity Fund Reserve (12,853,505) (15,295,712) (16,029,648) (16,692,071) (17,297,638) (17,858,733) (18,386,727) (18,795,947)
WRIA Grants Reserve (8,188,294) (7,576,465) (7,969,411) (8,312,210) (8,624,920) (8,920,652) (9,208,003) (9,492,636)
Flood Reduction Grants Reserve (6,155,981) (6,378,554) (6,945,005) (7,410,641) (7,802,028) (8,139,011) (8,436,954) (8,658,298)
Cash Advance (4,000,000) (4,000,000) (4,000,000) (4,000,000) (4,000,000) (4,000,000) (4,000,000) (4,000,000)
Self-insured Retention (6,500,000) (6,500,000) (6,500,000) (6,500,000) (6,500,000) (6,500,000) (6,500,000) (6,500,000)
District Admin 90-Day Reserve (221,660) (221,660) (245,809) (253,184) (260,779) (268,603) (276,661) (284,960)
District Operations 90-Day Reserve (3,209,764) (3,342,686) (2,787,139) (2,870,753) (2,956,875) (3,045,582) (3,136,949) (3,231,058)
Total Reserves (41,129,204) (43,315,076) (44,477,012) (46,038,858) (47,442,241) (48,732,581) (49,945,294) (50,962,899)
Ending Unreserved Fund Balance 8
81,912,806 15,712,459 46,561,111 36,180,930 32,486,964 21,861,504 10,923,147 2,417,223 (2,531,073)
Target Fund Balance 0 0 0 0 0 0 0 0
Budgetary Carryover Reserves (106,540,398) (110,491,278) (109,367,799) (125,687,241) (149,470,962) (163,448,671) (152,349,081) (145,838,869) (138,168,061)
Ending Budgetary Fund Balance 9
(24,627,592) (53,649,615) (19,491,612) (45,029,299) (70,945,140) (94,144,926) (92,693,354) (93,476,353) (89,736,235)
7/10/2019
part 2 - page 2

Flood Program Financial Plan: 2020 Chair's Preliminary Draft Budget and 6-Year CIP Notes:
1 Property tax forecast provided by the Office of Economic and Financial Analysis in March 2019, less undercollection assumption of 1%. 2 Future interest earnings approximated using the ration of prior year interest to prior year fund ending fund balance. 3
4 The ICRIF amount is based on the 1919 Inter-County Agreement for improvements to the White River, set to expire at the end of 2020.5
6 Costs based on contract established under FCD 2008-07 for District executive services, and inflated at 3% in succeeding years. 7
A. Based on prior year experience and knowledge of existing staff capacity to implement construction projects implemented by WLR Division. The expenditure rate increases at the end of the six years as new appropriation decreases and carryover projects are completed.B. Based on prior year experience for acquisitions and home elevations, where expenditure patterns are strongly influenced by factors such as landowner willingness. Rate shown here is similar to the expenditure rate for acquisition-focused funds such as King County’s Conservation Futures Trust (CFT).C. Based on increase from past expenditure rates as city projects move through the engineering design phase toward construction.D-E. Based on prior year experience with expenditure rates for these capital grant programs, which have a 2-3 year minimum time lag between appropriation and expenditures due to funding allocation decision-making process, execution of agreements for awarded projects, and reimbursement of eligible expenditures during or following implementation by the grant recipient. While the Opportunity Fund does not require time for an allocation process, many jurisdictions choose to accrue funding over multiple years which limits the expenditure rate. Note that a constant expenditure rate results in increased expenditures as unspent allocations are carried over each year.
8
9
10
11
District miscellaneous revenue due to multiple sources such as state forest sales, private timber harvest tax, unrealized investments, leashold excise taxes, and immaterial corrections from prior years.
Miscellaneous revenue due to multiple sources such as state forest sales, private timber harvest tax, rent from tenants of acquired real estate, and immaterial corrections from prior years. In 2017 this included the sale of the Rivers Edge
Business park, an acquisition under the Briscoe Levee Setback that was ultimately not needed for the project. While this sale could be considered a reduction in project expenditures, governmental accounting rules required it be categorized
as a revenue.
Total New Capital Appropriation corresponds to the "Grand Total" shown in each year on Attachment H.
The Unreserved Fund Balance is the remaing balance less reserves described in resolution FCD2016-21.1 adopting a fund balance reserve policy. While the policy provides general guidance on types of reserves, it does not specify their
quantification. The reserve quantities above reflect initial considerations by the District in lieu of more formal direction. The budgetary fund balance assumes 100% expenditure of all budgeted amounts and is used to understand the District's total budgetary commitment.
The capital expenditure is equal to the expenditure rate times the sum of the new capital appropriation and carryover. Rationale for the expenditure rates forecasted for A-E in the capital program is as follows:
Grant revenue is assumed only for grants that have been awarded or where an award is likely and imminent.
part 2 - page 3
Flood Program Financial Plan: 2020 Chair's Preliminary Draft Budget and 6-Year CIP
Capital Expenditure Detail2018
Actual
2019
Adopted
2019
Revised
2020
Projected
2021
Projected
2022
Projected
2023
Projected
2024
Projected
2025
Projected
FCD Projects New Appropriation (29,505,994) (38,111,491) 739,781 (38,917,370) (35,328,731) (49,132,223) (26,958,897) (27,739,237) (17,978,154)
FCD Projects Carryover (26,049,273) (28,928,519) (32,817,275) (16,038,747) (24,180,691) (36,300,748) (54,677,102) (50,614,319) (48,579,205)
Expenditure Rate 39% 38% 50% 56% 39% 36% 38% 38% 38%
A. FCD Project Expenditures (21,940,195) (25,475,204) (16,038,747) (30,775,426) (23,208,675) (30,755,870) (31,021,679) (29,774,351) (25,291,796)
FCD Flood Mitigation New Appropriation (4,027,190) (7,740,371) (1,614,371) (2,322,937) (8,792,200) (9,930,091) (8,120,551) (8,214,168) (9,829,494)
FCD Flood Mitigation Carryover (15,129,969) (14,359,263) (16,485,443) (12,669,870) (7,496,403) (9,447,390) (11,238,939) (12,002,884) (12,534,572)
Expenditure Rate 23% 30% 30% 50% 42% 42% 38% 38% 38%
B. FCD Flood Mitigation Expenditures (4,443,667) (6,629,890) (5,429,944) (7,496,403) (6,841,213) (8,138,542) (7,356,606) (7,682,480) (8,498,345)
Other Agency New Appropriation (6,619,241) (20,225,733) (30,066,843) (22,786,939) (20,825,568) (3,760,385) (678,405) (2,472,881) (5,530,000)
Other Agency Carryover (32,334,389) (23,539,179) (30,413,688) (51,408,451) (63,066,082) (71,307,903) (63,808,044) (54,813,482) (48,693,409)
Expenditure Rate 19% 40% 15% 15% 15% 15% 15% 15% 15%
C. External Agency Project Expenditures (7,221,502) (17,505,965) (9,072,080) (11,129,309) (12,583,748) (11,260,243) (9,672,967) (8,592,954) (8,133,511)
Opportunity Fund New Appropriation (5,738,670) (5,889,245) (5,889,245) (6,077,152) (6,226,447) (6,371,447) (6,514,006) (6,656,903) (6,674,535)
Opportunity Fund Carryover (12,079,766) (12,472,905) (14,505,037) (15,295,712) (16,029,648) (16,692,071) (17,297,638) (17,858,733) (18,386,727)
Expenditure Rate 20% 30% 25% 25% 25% 25% 25% 25% 25%
D. Opportunity Fund Payments (3,643,555) (5,508,645) (5,098,571) (5,343,216) (5,564,024) (5,765,879) (5,952,911) (6,128,909) (6,265,316)
WRIA Grants New Appropriation (4,520,525) (4,684,168) (4,684,168) (4,684,168) (4,818,604) (4,956,898) (5,099,161) (5,245,506) (5,396,052)
WRIA Grants Carryover (7,653,641) (7,913,208) (6,971,932) (7,576,465) (7,969,411) (8,312,210) (8,624,920) (8,920,652) (9,208,003)
Expenditure Rate 43% 35% 35% 35% 35% 35% 35% 35% 35%
E. WRIA Grant Payments (5,263,999) (4,409,081) (4,079,635) (4,291,222) (4,475,805) (4,644,188) (4,803,428) (4,958,156) (5,111,419)
Flood Reduction Grants New Appropriation (3,085,306) (3,166,261) (3,166,261) (3,267,286) (3,347,552) (3,425,509) (3,502,154) (3,578,980) (3,588,460)
Flood Reduction Grants Carryover (4,392,073) (5,383,713) (5,692,842) (6,378,554) (6,945,005) (7,410,641) (7,802,028) (8,139,011) (8,436,954)
Expenditure Rate 28% 28% 28% 28% 28% 28% 28% 28% 28%
F. Flood ReductionGrant Payments (2,082,721) (2,393,993) (2,480,549) (2,700,835) (2,881,916) (3,034,122) (3,165,171) (3,281,037) (3,367,116)
Capital Summary - All Expenditures A-F
Total New Capital Appropriation 11
(53,496,926) (79,817,269) (44,681,107) (78,055,852) (79,339,102) (77,576,552) (50,873,174) (53,907,675) (48,996,696)
Total Carryover (97,639,111) (92,596,787) (106,886,217) (109,367,799) (125,687,241) (149,470,962) (163,448,671) (152,349,081) (145,838,869)
Overall Expenditure Rate 30% 36% 28% 33% 27% 28% 29% 29% 29%
Total Capital Expenditure 7
(44,595,640) (61,922,778) (42,199,525) (61,736,410) (55,555,381) (63,598,844) (61,972,763) (60,417,887) (56,667,504)
part 2 - page 4

Chair's Preliminary Draft 2020 Operating Budget - King County Flood Control District
10-Jul-19
FCD Work Category
Sum of
Adopted 2019
FCD Budget
Sum of
Proposed
2020 FCD
Budget Difference Program Description Changes from 2019
1 Annual Maintenance 3,327,451 3,327,451 -
Maintenance activities to properly operate and maintain the District’s investments, including levees, revetments, properties, and pump stations, as well as large wood hazard
investigations in support of the King County Sheriff. Facility inspections and assessments may lead to proposed repairs in the capital program. Inspections and assessments
also help to increase the potential for federal funding assistance for future flood damages. This includes implementation of routine flood facility inspection and maintenance for
approximately 500 levees and and revetments along 119 miles of river so that minor maintenance needs do not become larger scale repair problems. The program also
includes property inspections and maintenance for the approximately 800 acres of publicly owned floodplain property (managed as 200 separate sites), a responsibility that
grows each year as property is acquired to reduce flood risks and/or support capital project construction. Maintenance actions to identify and resolve problems that might pose
a risk to the community such as attractive nuisances (a hazardous object or condition that poses a risk), illegal dumping, noxious weeds, and public health risks. This category
includes maintenance, facility assessment and monitoring, facility maintenance and repair, management of sediment and large wood, and monitoring of flood protection assets.
The largest expenditures in this category are (1) operation and maintenance of the Green River Pump Stations (2) maintenance crew time and (3) inspections of levees,
revetments, and property on a 2-year cycle. No changes.
2 Flood Hazards Plan,
Grants, Outreach 675,380 675,380 -
Programmatic elements of floodplain management include many approaches to understand and communicate risk so that all floodplain residents and users can prepare and
protect themselves from flooding and related riverine hazards. Other programmatic elements include organizational performance measurement. This category includes funding
for the Flood Hazard Management Plan Update, and coordinating compliance with FEMA’s Community Rating System. Also included is the planning, outreach and grant
submittals associated with repetitive loss mitigation projects, while the actual buyouts and elevations are funded via the capital program. All of this work is only conducted with
prior authorization from the Flood Control District. Public outreach associated with specific capital projects is funded through the capital program. No changes.
3 Flood Hazard Studies,
Maps, Technical Services 2,598,916 933,416 (1,665,500)
Generate technical information used to characterize, quantify, and delineate flood risks, as well as to develop and implement strategies and actions to reduce those risks.
Flood hazard technical information types include hydrologic and hydraulic studies, floodplain and channel migration zone (CMZ) maps, geologic studies, geographic
information system (GIS) land use data, dam operations studies, risk assessments and flood hazard management corridor working maps. These technical assessments are
used to inform the capital project feasibility, prioritization, and design process funded by the capital program. The base budget includes funding for LiDAR and post-flood
channel evaluations that will not occur unless there are high flow events.
Net reduction comparted to 2019 due to several one-time budget items
were added to the budget in 2019. Work on these studies will continue
in 2020, including the $900,000 small stream flood studies, $275,000 for
a South Fork Skykomish flood study, $250,000 for evaluation of future
flooding scenarios with the University of Washington, and $300,000 for
Phase 2 of Levee Breach Analysis studies. Following completion of
CMZ studues on the Middle White and Raging Rivers in 2019, CMZ
studies will continue in 2020 for the Greenwater and Lower Snoqualmie
Rivers. No new flood studies are proposed until the small streams and
South Fork Skykomish are complete.
4 Flood Preparation, Flood
Warning Center 1,127,992 1,027,992 (100,000)
Implement a comprehensive approach to preparing and educating the community for flood events, coordinating emergency response and regional flood warning center
operations during flood events, and ensuring consistency across basins for post-flood recovery actions. Post-flood damage assessments may result in capital projects to repair
damaged facilities. Flood and post- flood activities are tracked with a unique project number so that expenditures may be submitted for any federal assistance that becomes
available following a federal disaster declaration. Base budget includes annual flood preparedness campaign, sandbag supplies for distribution centers in each basin, the King
County Flood Alert system, King County Sheriff's Office staff for flood emergency respone and cost-share with U.S. Geological Survey for operations and maintenance of real-
time river gauges around King County.
The Office of Emergency Management Dam Safety Report
Recommendations project has ended, reducing the 2020 budget by
$100,000.
5 Program Management,
Supervision, Finance,
Budget 1,727,017 1,727,017 -
Provide supervisory, financial management, contract administration, capital program oversight, and administrative services for the River and Floodplain Management Section
to implement the District's work program. Financial management tasks include forecasting, budget development, accounting, and financial and peformance audits from the
State of Washington, Flood Control District, King County Council, state and federal grantors, as well as quarterly internal audits by King County Procurement. This category
also include contract development and administration for work order contracts, individual work orders are budgeted and accounted for under other work categories or under a
specific capital project. No changes.
6 Program Implementation 246,986 246,986 -
Implement flood hazard management programs and coordinate capital improvement projects for the District. This work category includes river basin team as well as the
countywide capital strike team, responsible for identifying, implementing, and tracking flood risk reduction program and project actions within a given basin. This work category
includes coordination with other flood risk reduction partners through the Basin Technical Committees, and similar multi-stakeholder efforts to manage risk and coordinate
efforts in each river basin. This category also includes coordination meetings at the Section, team, and individual supervisory level, coordination with the District, as well as
trainings for River and Floodplain Management Section staff. Time spent on capital projects is reimbursed from the capital project fund. No changes.
7 Overhead / Central Costs 3,135,313 3,135,313 -
This category includes use-based and FTE-based overhead costs from the Water and Land Resources Division of the Department of Natural Resources and Parks and King
County. Examples include use-based charges for the Prosecuting Attorney’s Office, risk management, and the financial management system, as well as FTE-based charges
for building rent and utilities. When staff loan out from the operating fund to the capital fund, the capital fund reimburses the operating fund for FTE-related overhead charges.
Per the Inter-Local Agreement between the District and King County, "administrative overhead costs shall be determined in accordance with the Overhead Cost Allocation
Policy adopted as part of the County’s Comprehensive Financial Management Policies, as currently in effect and as amended, and with the overhead costs in the adopted
County budget." No changes. Based on 2020 adopted King County budget.
Grand Total 12,839,055 11,073,555 (1,765,500)
part 2 - page 5

King County Flood Control District
Chair's Preliminary Working Draft for Discussion Purposes Only Capital Investment Strategy Project
2020 - 2025 Six-Year CIP Project Allocations - DRAFT Grant/External Revenue Awarded
Attachment H Cost Share Contribution to Others
Added in 2019
Proposed New Add in 2020
No. Title Basin Type of project
2018 Inception
to Date
Expenditure
2019
Inception to
Date Budget
2019 Available
Budget
2020
Requested
2021
Forecasted
2022
Forecasted
2023
Forecasted
2024
Forecasted
2025
Forecasted
6-Year CIP
Total
CIS
Year 7-10
CIS
10+ Year
Project Life
Total Comments
1 WLFL0 SF SKYKMSH REP LOSS MIT SF Skykomish FCD Acqu/Elev $638,668 $1,145,404 $506,736 $0 $0 $0 $0 $0 $115,927 $115,927 $1,261,331
Baring. This project will elevate or buyout individual structures in the South Fork
Skykomish Basin to eliminate the risk of flooding or erosion damage during future
flood events.
2 WLFL0 SKY W RVR DR FLOOD STUDY SF Skykomish FCD Const $2,856 $81,237 $78,381 ($78,381) $78,381 $0 $0 $0 $0 $0 $81,237
Skykomish. This project would improve infrastructure at the mouth of Maloney Creek
and on the SF Skykomish River to reduce the frequency of flooding of homes and
property within the Town of Skykomish.
3 WLFL0 SKYKOMISH LB DOWN 2016 REPAIR SF Skykomish FCD Const $85,402 $150,000 $64,599 $0 $0 $0 $0 $0 $0 $0 $150,000
Skykomish. Approximately 50-foot-long section of missing armor rock immediately
downstream of the bridge. Further flooding may compromise or severely damage
facility.
4 WLFL0 TIMBER LN EROSN BUYOUTS SF Skykomish FCD Acqu/Elev $1,959,242 $2,409,874 $450,632 ($365,632) $0 $765,632 $0 $0 $0 $400,000 $2,809,874
Skykomish. This project will continue to acquire and remove homes along a stretch of
the Skykomish River that are endangered by erosive forces as well as inundation in
some places.
5 WLFL0 TIMBERLANE 2016 REPAIR SF Skykomish FCD Const $11,115 $16,040 $4,925 $0 $0 $0 $0 $0 $0 $0 $16,040
Skykomish. Project will lay back the privately-built rockery to reconstruct rock wall
into stable revetment geometry. Will likely be implemented by the Strike Team.
6 WLFL0 TIMBERLANE 2019 REPAIR SF Skykomish FCD Const $0 $600,000 $600,000 $0 $0 $0 $0 $0 $0 $0 $600,000
Skykomish. Revetment is approximately 300 LF along left bank of South Fork
Skykomish River. Unstable section of vertical stacked rock is approximately 150 LF
(needs verification). Failure has occurred previously in this section of revetment.
7 WLFL1 428TH AVE SE BR FEASIBILITY Upper Snoq FCD Const $309,028 $309,028 $0 $0 $0 $0 $0 $0 $0 $0 $309,028
North Bend. Reduce neighborhood isolation from flooding. Develop a set of
alternatives for improvements to 428th Avenue SE, SE 92nd Street, and Reinig
Road to reduce the frequency of community isolation caused by floodwaters
overtopping these roadways.
8 WLFL1 CIRCLE RVR RANCH RISK RED Upper Snoq FCD Const $127,225 $540,165 $412,940 $133,524 $238,175 $4,052,588 $4,560 $0 $0 $4,428,848 $4,969,013
North Bend. This project will determine a preferred action to reduce long term risks
from channel migration in the Circle River Ranch Neighborhood on the South Fork
Snoqualmie River. Being conducted concurrent with South Fork Snoqualmie
Corridor Plan.
9 WLFL1 MF SNO CORRIDOR IMP Upper Snoq FCD Const $954 $954 $0 $0 $1,162,249 $1,196,980 $1,232,889 $377,890 $0 $3,970,008 $3,970,962 North Bend. Placeholder for corridor plan implementation project(s)
10 WLFL1 MF SNO CORRIDOR PLAN Upper Snoq FCD Const $1,502,409 $1,824,912 $322,503 $27,585 $0 $0 $0 $0 $0 $27,585 $1,852,497
North Bend. Middle Fork Snoqualmie Corridor Planning, scheduled for completion in
2018.
11 WLFL1 NORMAN CREEK DS CULV Upper Snoq Agreement $722,582 $724,000 $1,418 $0 $0 $0 $0 $0 $0 $0 $724,000
North Bend. Replace two existing rusted out 48” corrugated metal pipes on Norman
Creek under 428th Ave SE with a new precast concrete box culvert. The new culvert
will reduce the time it takes to drain the flood waters off of private property by
increasing the capacity of the crossing. Currently when the North Fork Snoqualmie
River overflows water backs up against 428th and impedes use of the roadway as
the Norman Creek crossing is the normal outflow for this flood water once the North
Fork has overtopped the adjacent levees.
12 WLFL1 NORMAN CREEK US 2024 CULV Upper Snoq Agreement $0 $0 $0 $0 $0 $0 $350,000 $750,000 $0 $1,100,000 $1,100,000
North Bend. Improve SE 92nd Street, east of 428th Street, and alleviate roadway
flooding by installing a new box culvert.
13 WLFL1 NORTH FORK BRIDGE 2016 REPAIR Upper Snoq Agreement $177,742 $177,742 $0 $0 $0 $0 $0 $0 $0 $0 $177,742
North Bend. The North Fork Bridge was originally built in 1951 and is extremely
vulnerable to scour as the channel thalweg migrates. In order to keep the bridge safe
and reliable during a flood, it is important to protect the piers and abutments from
scour failure.
14 WLFL1 NORTH FORK BRIDGE FEASIBILITY Upper Snoq Agreement $0 $200,000 $0 $0 $0 $0 $0 $0 $0 $0 $200,000
North Bend. Initiate feasibility study to mitigate the risk of scour damage to the North
Fork Bridge by retrofitting the existing structure with deep foundations or alternative
risk mitigation strategies.
15 WLFL1 RECORD OFFICE 2016 REPAIR Upper Snoq FCD Const $29,181 $987,835 $958,654 $0 $0 $0 $0 $0 $0 $0 $987,835
Snoqualmie. Repair downstream 200 lineal feet of facility which is missing face rock
and toe rock. A significant scour hole has formed around a City of Snoqualmie
stormwater outfall pipe at the downstream end of facility. Potential erosion impact to
Park Ave SE in City of Snoqualmie, an area included in the City's planned
"Riverwalk" park and trail project. Project implemented by City of Snoqualmie as
part of Riverwalk project, construction is scheduled for 2020.
16 WLFL1 REIF RD LEVEE IMPROVEMENTS Upper Snoq FCD Const $0 $0 $0 $0 $0 $265,438 $318,421 $385,937 $457,218 $1,427,014 $1,427,014
North Bend. Conduct a feasibility study to determine ways of preventing the
overtopping of the Reif Rd Levee. Potential solutions include: repair and/or raise
levee in place / setback levee / gravel removal / home elevations.
17 WLFL1 BENDIGO UPR SETBACK NORTH BEND Upper Snoq Agreement $0 $50,000 $50,000 $0 $0 $0 $0 $0 $4,200,000 $4,200,000 $4,250,000
North Bend. Cost-share of $8.4M levee setback project. The overtops at a 20-year or
greater flood, inundating undeveloped property, railway lines and roadways. Project
would reconnect 25 acres of floodplain and construct a new levee that meets current
engineering guidelines. City has submitted grant application for the remaining $4.2
million
18 WLFL1 REINIG RD ELEVATION Upper Snoq Agreement $0 $0 $0 $0 $0 $0 $0 $50,000 $100,000 $150,000 $150,000
Snoqualmie. Elevate low section of Reinig Rd to alleviate flooding that blocks
roadway.
19 WLFL1 REINIG RD RVTMNT 2016 REPAIR Upper Snoq FCD Const $391,568 $1,200,000 $808,432 $4,057,657 $25,462 $0 $0 $0 $0 $4,083,119 $5,283,119
North Bend. Repair three primary damage sites just upstream and directly across
from the South Fork Snoqualmie confluence totaling ~285 lineal feet. Construction is
anticipated in 2020.
20 WLFL1 RIBARY CREEK Upper Snoq FCD Const $0 $36,492 $36,492 $150,000 $450,000 $2,338,618 $3,223,883 $0 $0 $6,162,501 $6,198,993
North Bend. Address flooding from Ribary Creek at Bendigo Blvd in North Bend as
the Snoqualmie levees prevent drainage to the river during high flows.
21 WLFL1 SF CIS MED TERM Upper Snoq FCD Const $0 $0 $0 $0 $0 $0 $0 $0 $0 $0 $43,000,000 $43,000,000
North Bend. Implement projects identified in the Capital Investment Strategy,
approved as policy direction by the Executive Committee.
22 WLFL1 SF CIS LONG TERM Upper Snoq FCD Const $0 $0 $0 $0 $0 $0 $0 $0 $0 $0 $57,100,000 $57,100,000
North Bend. Implement projects identified in the Capital Investment Strategy,
approved as policy direction by the Executive Committee.
23 WLFL1 SF SNO CORRIDOR PLAN Upper Snoq FCD Const $2,573,493 $2,573,493 $0 $0 $0 $0 $0 $0 $0 $0 $2,573,493
North Bend. SF Snoqualmie Corridor planning process and development of capital
investment strategy.
24 WLFL1 SF SNO LEVEE REMEDIATION Upper Snoq FCD Const $173,977 $388,000 $214,023 $0 $727,790 $1,031,736 $0 $0 $0 $1,759,526 $2,147,526
North Bend. Six levee deficiencies have been identified in this leveed segment. The
project will design and reconstruct the impaired segment of levee in place.
25 WLFL1 SHAKE MILL LB 2016 REPAIR Upper Snoq FCD Const $388,601 $3,550,000 $3,161,399 $0 $0 $0 $0 $0 $0 $0 $3,550,000
North Bend. Total breach of levee - erosion and lateral channel migration is ongoing.
No immediately adjacent private property or infrastructure. Continued erosion could
threaten 428th Ave embankment or bridge.
7/10/2019
Page 1 of 7 part 2 - page 6

No. Title Basin Type of project
2018 Inception
to Date
Expenditure
2019
Inception to
Date Budget
2019 Available
Budget
2020
Requested
2021
Forecasted
2022
Forecasted
2023
Forecasted
2024
Forecasted
2025
Forecasted
6-Year CIP
Total
CIS
Year 7-10
CIS
10+ Year
Project Life
Total Comments
26 WLFL1 SHAKE MILL RB 2016 REPAIR Upper Snoq FCD Const $1,090 $51,090 $50,000 $100,000 $360,910 $0 $0 $0 $0 $460,910 $512,000
North Bend. Between 428th St Bridge and Tate Creek, several locations on levee
where toe-rock dislodged and corresponding minor bank erosion along 50-60 feet of
river bank. Actual gaps range between 6-10 feet. Missing toe rock compromises
levee integrity, increasing its vulnerability to further scour and potential failure. Failure
of this facility could result in damage to a heavily used county road (428th Ave SE).
Scheduled for 2018 construction.
27 WLFL1 SI VIEW RM4 2017 REPAIR Upper Snoq FCD Const $136,754 $396,754 $260,000 $0 $0 $0 $0 $0 $0 $0 $396,754
North Bend. Repair approximately 25 lineal feet of the facility with missing toe rock
and shallow scour scallop into bank that is approximately 1-2 feet deep. Si View
Levee is a relatively short flood containment levee that protects 50+ homes in the Si
View Park Neighborhood of North Bend from flooding. Project scheduled for 2018
construction.
28 WLFL1 SR202 SF BRIDGE LENGTHEN Upper Snoq FCD Const $0 $0 $0 $0 $0 $0 $0 $0 $100,000 $100,000 $100,000
North Bend. Placeholder funding to partner with WSDOT to expand bridge SR202
opening over South Fork Snoqualmie and Ribary Creek to improve conveyance and
reduce upstream flood impacts. Supported by North Bend. Requires state or federal
funding. Relative contribution of this project is being evaluated in the SF Snoqualmie
Corridor Plan.
29 WLFL1 TATE CR SCOUR FEASIBILITY Upper Snoq Agreement $0 $0 $0 $0 $0 $0 $150,000 $0 $0 $150,000 $150,000
North Bend. Prepare a Concept Development Report (CDR) to analyze and select
best span/alignment replacement bridge and road-raising option as the current bridge
does not provide enough hydraulic opening due to the transport of sediments and
water overtops the approaches during floods.
30 WLFL1 UPPER SNOQ 2015 FLOOD REPAIR Upper Snoq FCD Const $555,771 $556,781 $1,009 $0 $0 $0 $0 $0 $0 $0 $556,781
North Bend. Flood damage repairs from January 2015 flood event. Locations include
Mason-Thorson Ells and Mason-Thorson Extension (Middle Fork Snoqualmie);
North Park (North Fork Snoqualmie); and Record Office, Meadowbrook, and
Railroad (Snoqualmie mainstem).
31 WLFL1 UPR SNO RES FLD MITIGTN Upper Snoq FCD Acqu/Elev $11,411,570 $12,717,550 $1,305,980 $1,756,037 $2,295,755 $2,364,628 $2,435,567 $2,508,634 $2,583,893 $13,944,513 $26,662,063
Snoqualmie. This project will continue to acquire or elevate flood-prone structures in
the Upper Snoqualmie basin to reduce the risk of flood, erosion, and channel
migration damage. Partnership with City of Snoqualmie to elevate homes and cost-
share acquisition of homes where City is planning to construct the Riverwalk project.
32 WLFL1 USACE PL 84-99 SF SNO Upper Snoq FCD Const $4,769 $333,377 $328,608 $0 $352,868 $363,454 $0 $0 $0 $716,322 $1,049,699
North Bend. Ensure eleven South Fork Snoqualmie River levees meet the standards
of the US Army Corps of Engineers PL 84-99 program in order to receive future
assistance from the Corps in the event of flood damage to the levees..
33 WLFL2 264TH AVE NE AT SR 202 FLD IMPRVMNT Lower Snoq Agreement $0 $0 $0 $0 $0 $0 $0 $0 $540,000 $540,000 $540,000
Redmond. Alleviate flooding on this sole access road by replacing the existing
culverts and raising the roadway to elminate over-topping.
34 WLFL2 334TH AVE SE & SE 43RD PL FLD IMPRVMNT Lower Snoq Agreement $0 $0 $0 $0 $0 $0 $0 $0 $500,000 $500,000 $500,000
Improve drainage to alleviate neighborhood flooding by constructing a drainage
system to flow to the Snoqualmie River.
35 WLFL2 DUTCHMAN RD REPAIR Lower Snoq FCD Const $0 $48,593 $48,593 $0 $200,000 $500,000 $0 $0 $0 $700,000 $748,593
Duvall. Repair approximately 200 feet of revetment. Dutchman Road in this location
provides the sole access to residences and business on the west side of the
Snoqualmie Valley downstream of Duvall. Continued erosion of the revetment could
result in erosion of the road (West Snoqualmie Valley Road NE) which would
severely limit access to the downstream property owners during or following a flood
event.
36 WLFL2 L SNO SCOUR REPAIR 2017 Lower Snoq Agreement $143,386 $150,000 $6,614 $0 $0 $0 $0 $0 $0 $0 $150,000
Fall City. The foundation of the main-span pier is exposed and is vulnerable to
destabilization during a flood. Add scour mitigation measures to protect footing.
Bridge crosses the Snoqualmie River at Duvall and is the city's primary route.
37 WLFL2 FARM PAD PROGRAM Lower Snoq FCD Acqu/Elev $805,446 $979,803 $174,357 $0 $115,214 $118,670 $122,230 $125,897 $129,674 $611,685 $1,591,488
Carnation. This project provides technical and cost-sharing assistance to agricultural
landowners in the Lower Snoqualmie floodplain to help them better withstand the
impacts of flooding. Specific project actions include farm pads and elevation or flood
proofing of agricultural structures.
38 WLFL2 L SNO REP LOSS MITGTION Lower Snoq FCD Acqu/Elev $1,269,231 $1,695,671 $426,440 $0 $0 $0 $0 $0 $0 $0 $1,695,671
Carnation. Funding as possible local match for FEMA grants to elevate or acquire at-
risk structures.
39 WLFL2 L SNO/ALDAIR CORRDOR PLN Lower Snoq FCD Const $6,326,158 $7,365,814 $1,039,656 $0 $0 $0 $0 $0 $0 $0 $7,365,814
Fall City. Cost-shared contribution to multiple levee setbacks and high priority flood
risk reduction acquisitions in the Fall City reach of the Lower Snoqualmie. Projects
reduce flood and erosion risk to revetments, roads, and landowners. FCD
expenditure leverages habitat restoration funding from other sources.
40 WLFL2 LWR SNO RESDL FLD MITGTN Lower Snoq FCD Acqu/Elev $2,201,472 $3,043,609 $842,137 $272,863 $530,450 $546,363 $562,754 $579,637 $0 $2,492,068 $5,535,677
Carnation. This project provides technical and cost-sharing assistance to residential
and agricultural landowners in the Lower Snoqualmie floodplain to help them better
withstand the impacts of flooding. Specific project actions include farm pads,
elevations of homes, and elevation or flood proofing of agricultural structures.
41 WLFL2 SE 19TH WAY REVETMENT Lower Snoq FCD Const $1,643,036 $1,916,294 $273,258 $0 $0 $0 $0 $0 $0 $0 $1,916,294
Fall City. Rebuild revetment to protect road access to high value agricultural
operations and lands. Construction is complete.
42 WLFL2 SE DAVID POWELL RD DOWNSTREAM Lower Snoq Agreement $594,807 $595,098 $291 $0 $0 $0 $0 $0 $0 $0 $595,098
Fall City. Reduce neighborhood isolation from flooding. Prevent slope failure of sole
access roadway that would isolate 150 homes.
43 WLFL2 L SNO 2019 BANK REPAIR Lower Snoq Agreement $226,149 $2,200,000 $1,973,851 $0 $0 $0 $0 $0 $0 $0 $2,200,000
Fall City. The river is scouring the road away and David Powell Road is collapsing
into the river. This project will repair an existing failing revetment and extend MSE
wall to prevent undercutting of the riverbank and roadway.
44 WLFL2 SE FISH HATCHERY RD Lower Snoq Agreement $496,163 $496,163 $0 $0 $0 $0 $0 $0 $0 $0 $496,163
Fall City. Reduce neighborhood isolation from flooding. Prevent slope failure of sole
access roadway that would isolate 20-30 homes.
45
WLFL2 FISH HATCHERY RD BR #61B REPAIR
Lower Snoq Agreement $0 $0 $0 $80,000 $620,000 $0 $0 $0 $0 $700,000 $700,000
Duvall. Strengthen the bridge structure to stabilize it after the most recent flood event,
rebuild the east approach roadway to address the current issue and to protect it
against major flood events in the future, and restore the eroded creek bed and
riverbank profile to buffer the bridge against scour.
45 WLFL2 SINNEMA QUAALE 2011 REPR Lower Snoq FCD Const $12,439,513 $12,508,516 $69,003 $0 $0 $0 $0 $0 $0 $0 $12,508,516
Duvall. Large capital project to repair 1000 linear feet of the Sinnema Quaale Upper
revetment. Protects SR 203, two regional fiber optic lines, and Snoqualmie Valley
Trail. Construction is complete.
46 WLFL2 SNOQUALMIE VALLEY FEAS Lower Snoq Agreement $0 $0 $0 $0 $250,000 $250,000 $0 $0 $0 $500,000 $500,000
Duvall. Regional flooding in the Snoqualmie Valley cuts off access to eastern cities.
Determine which major roadway(s) that cross the Snoqualmie Valley would be the
most cost effective to improve in the valley with chronic flood issues impacting over
25,000 daily drivers.
47 WLFL2 STOSSEL RB 2018 REPAIR Lower Snoq FCD Const $907,886 $1,107,886 $200,000 $0 $0 $0 $0 $0 $0 $0 $1,107,886
Carnation. This completed project repaired approximately 250 feet of damage
identified in late March 2018 to a section of the Stossel Bridge Right Bank
Revetment on the Snoqualmie River, downstream of the City of Carnation.
48 WLFL2 STOSSEL LONG TERM REPAIR Lower Snoq FCD Const $0 $0 $0 $50,000 $150,000 $170,000 $500,000 $2,500,000 $0 $3,370,000 $3,370,000
CarnationPlaceholder costs for long-term facility improvement project to prevent
erosion undermining 310th Ave NE.
49 WLFL2 TOLT PIPELINE PROTECTION Lower Snoq FCD Const $10,342,073 $10,778,068 $435,995 $0 $0 $0 $0 $0 $0 $0 $10,778,068
Carnation. This project will repair approximately 800 linear feet of the Winkelman
(formerly RM 13.5) revetment. Erosion along the right bank of the Snoqualmie River
channel threatens to undermine the Seattle Public Utilities water supply line at this
location south of Duvall. Construction is complete.
Page 2 of 7part 2 - page 7

No. Title Basin Type of project
2018 Inception
to Date
Expenditure
2019
Inception to
Date Budget
2019 Available
Budget
2020
Requested
2021
Forecasted
2022
Forecasted
2023
Forecasted
2024
Forecasted
2025
Forecasted
6-Year CIP
Total
CIS
Year 7-10
CIS
10+ Year
Project Life
Total Comments
50 WLFL2 DUVALL SLOUGH 2017 IMPRV Lower Snoq Agreement $277,937 $400,000 $122,063 $0 $0 $0 $0 $0 $0 $0 $400,000
Duvall. These two bridges are subject to having the roadway approach fill wash out
during a flood. Excavate approaches and rebuild approaches to prevent loosing
approaches during flooding. A similar repair was done on Woodinville-Duvall Bridge
No. 1136D.
51 WLFL3 FREW LEVEE 2016 REPAIR Tolt FCD Const $164,558 $360,360 $195,802 $0 $0 $0 $0 $0 $0 $0 $360,360
Carnation. Face rock displaced along approximately 50 feet of levee face. Some core
material appears to have been lost, resulting in an over steepened bank relative to
upstream and downstream undamaged levee sections. Top of damaged face
approximately 6 feet from edge of gravel trail. Continued erosion will cut off popular
riverside trail. Potential impact to highway if facility breaches during a major flood.
Construction is complete.
52 WLFL3 GIRL SCOUT LEVEE 2016 REPAIR Tolt FCD Const $160,096 $311,000 $150,904 $0 $0 $0 $0 $0 $0 $0 $311,000
Carnation. Repair approximately 20 feet of face and toe rock dislodged from Girl
Scout Camp levee revetment below side channel confluence with mainstem. Missing
face and toe rock compromises levee integrity, increasing its vulnerability to further
scour and potential failure. Scheduled for 2018 construction.
53 WLFL3 HOLBERG 2019 REPAIR Tolt FCD Const $0 $25,000 $25,000 $25,000 $450,000 $0 $0 $0 $0 $475,000 $500,000
Carnation. Facility failure has consequences for property owners immediately
landward of facility. Potential for high flows and erosive damage to residences and
property.
54 WLFL3 HOLBERG FEASIBILITY Tolt FCD Const $62,156 $263,969 $201,813 $84,222 $0 $0 $0 $0 $0 $84,222 $348,191
Carnation. Feasibility study to determine the nature and extent of levee
improvements necessary to remove four homes in unincorporated King County from
the regulatory Channel Migration Zone as mapped in the March 2017 Draft Tolt
River Channel Migration study
55 WLFL3 LOWER FREW LEVEE SETBACK Tolt FCD Const $237 $478,664 $478,427 $100,000 $700,000 $850,000 $700,000 $14,650,000 $100,000 $17,100,000 $17,578,664
Carnation. Capital Investment Strategy: Design, based on level of service analysis,
the highest priority levee setback for flood risk reduction. Phase 2 construction
estimated in CIS at $14.5M-$16.7M
56 WLFL3 LOWER TOLT RIVER ACQUISITION Tolt FCD Acqu/Elev $529,475 $744,475 $215,000 ($190,000) $0 $0 $0 $0 $0 ($190,000) $554,475
Carnation. Acquisition between the Swiftwater development and the river for the
future setback of the Upper Frew Levee
57 WLFL3 REMLINGER LEVEE 2017 REPAIR Tolt FCD Const $139,912 $311,000 $171,088 $0 $0 $0 $0 $0 $0 $0 $311,000
Carnation. Damage is approximately 60 lineal feet of the facility with missing toe rock
and undermined face rock near the Snoqualmie Valley Trail. The damage is at the
downstream end of Remlinger facility and a breach or continued erosion would
increase flooding impacts on portions of the Remlinger property. Construction
complete.
58 WLFL3 RIO VISTA PROPERTY ACQ Tolt FCD Acqu/Elev $203 $500,000 $499,797 ($449,797) $0 $449,797 $0 $0 $0 $0 $500,000
Carnation. Capital Investment Strategy: Acquire 2 at-risk homes from willing sellers;
acquire remaining 14 homes as funds become available.
59 WLFL3 SAN SOUCI NBRHOOD BUYOUT Tolt FCD Acqu/Elev $4,359,533 $4,953,353 $593,820 $0 $0 $0 $0 $0 $0 $0 $4,953,353
Carnation. This project will buyout remaining properties and remove all homes and
privately-constructed rubble levee at upstream end of the community access road,
ultimately completing project initiated 20 years ago by others. Approximatlely 20
homes removed from high hazard areas within and just upstream and downstream of
San Souci neighborhood.
60 WLFL3 SAN SOUCI REACH IMPRVMNTS Tolt FCD Const $0 $160,000 $160,000 $25,000 $90,000 $700,000 $700,000 $825,000 $0 $2,340,000 $2,500,000
Carnation. Capital Investment Strategy: Construct Tolt Road NE road elevation in
one location. Remove illegal revetment and roads in San Souci neighborhood.
61 WLFL3 SEDIMENT MGMT FEAS Tolt FCD Const $6,499 $402,805 $396,306 $38,553 $15,648 $0 $0 $0 $0 $54,201 $457,006
Carnation. Capital Investment Strategy: Conduct sediment management feasibility
study and develop a plan. Update and include upper watershed sediment production
estimates
62 WLFL3 SR 203 BR IMPRVMNTS FEAS Tolt FCD Const $1,104 $395,900 $394,796 $0 $0 $0 $0 $0 $0 $0 $395,900
Carnation. Capital Investment Strategy: Initiate study (with potential future design and
construct) to add bridge span(s), raise the highway and relocate King County Parks
parking area.
63 WLFL3 TOLT 2015 FLOOD REPAIRS Tolt FCD Const $46,909 $46,909 $0 $0 $0 $0 $0 $0 $0 $0 $46,909
Carnation. Flood damage repairs from January 2015 flood event. Locations include
Frew, Upper Frew, Remlinger, and Girl Scout Camp.
64 WLFL3 TOLT CIS MED TERM Tolt FCD Const $0 $0 $0 $0 $0 $0 $0 $0 $0 $0 $56,250,000 $56,250,000
Carnation. Implement projects identified in the Capital Investment Strategy, approved
as policy direction by the Executive Committee.
65 WLFL3 TOLT CIS LONG TERM Tolt FCD Const $0 $0 $0 $0 $0 $0 $0 $0 $0 $0 $28,800,000 $28,800,000
Carnation. Implement projects identified in the Capital Investment Strategy, approved
as policy direction by the Executive Committee.
66 WLFL3 TOLT CORRIDOR PLAN Tolt FCD Const $1,138,802 $1,153,657 $14,855 $0 $0 $0 $0 $0 $0 $0 $1,153,657
Carnation. The corridor plan for the lower 6 miles of the Tolt River will develop a
prioritized implementation strategy for near-term and long-term floodplain
management actions. Scheduled for adoption in 2017.
67 WLFL3 TOLT R LEVEE L.O.S. ANALYSIS Tolt FCD Const $156,769 $413,484 $256,715 $278,651 $31,031 $0 $0 $0 $0 $309,682 $723,166
Carnation. Capital Investment Strategy: Conduct a detailed hydraulic analysis to
optimize the elevation of new levees to maximize flood risk reduction benefits
68 WLFL3 TOLT R MILE 1.1 ACQ Tolt FCD Acqu/Elev $4,120,326 $4,306,106 $185,781 ($50,781) $850,781 $0 $0 $0 $0 $800,000 $5,106,106
Carnation. Acquisition funding for high risk properties in levee setback project area.
Project priorities will be determined by the Board through adoption of the Tolt Corridor
Plan.
69 WLFL3 TOLT R NATURAL AREA ACQ Tolt FCD Acqu/Elev $2,550,314 $2,605,067 $54,753 $1,350,247 $0 $685,000 $0 $0 $0 $2,035,247 $4,640,314Carnation. Capital investment strategy: acquire at-risk homes from willing sellers.
70 WLFL3 TOLT R RD ELEVATION FEASIBILITY Tolt FCD Const $49,508 $250,000 $200,492 $0 $0 $0 $0 $0 $0 $0 $250,000
Carnation. Reduce neighborhood isolation from flooding. Evaluate feasibility of
elevating sections of Tolt River Road.
71 WLFL3 TOLT R RD NE IMPROVEMENTS Tolt FCD Const $0 $0 $0 $0 $53,045 $109,273 $225,102 $1,043,347 $1,432,863 $2,863,628 $2,863,628
Carnation. Capital Investment Strategy: Initiate design for elevation of one road
location to reduce or eliminate isolation. Implement additional road elevations as
funds become available.
72 WLFL3 UPPER FREW LEVEE SETBACK Tolt FCD Const $0 $0 $0 $50,000 $159,090 $175,099 $1,200,000 $1,500,000 $14,800,000 $17,884,189 $17,884,189
Carnation. Capital Investment Strategy: Initiate the levee setback design in order to
apply for grant funding. Levee setback to increase sediment storage and floodwater
conveyance; protect adjacent development; reduce damage to trail bridge.
73 WLFL4 ALPINE MANOR NEIGHBORHOOD BUYOUTS Raging FCD Acqu/Elev $1,753,659 $1,853,460 $99,801 $0 $0 $0 $0 $0 $0 $0 $1,853,460
Fall City. Acquisition of single-family homes and future acquisition of mobile home
park at risk of channel migration along the Raging River in the Alpine Manor
neighborhood.
74 WLFL4 RAGING MOUTH TO BR 2017 REPAIR Raging FCD Const $257,426 $500,000 $242,574 $0 $0 $0 $0 $0 $0 $0 $500,000
Fall City. Repair 150 lineal feet of discontinuous damage and missing toe rock. The
levee protects the landward area from flooding and serves as the road embankment
for Dike Rd, an access road to the Fall City boat launch. The damaged levee section
is immediately adjacent to the Twin Rivers golf course barn, which would experience
greater flooding if the levee were breached. Scheduled for 2018 construction.
75 WLFL4 RAGING SCOUR REPAIR 2017 Raging Agreement $25,062 $80,000 $54,938 $0 $0 $0 $0 $0 $0 $0 $80,000
Fall City. This bridge has a history of scour damage. One of the arch foundations is
exposed. Repair scour mitigation measures to protect the footing. It serves only one
house but is a designated King County Landmark.
76 Snoqualmie-South Fork Skykomish Subtotal $74,399,800 $94,421,452 $19,821,651 $7,444,748 $9,906,849 $16,933,277 $11,725,407 $25,296,341 $25,059,575 $96,366,196 $99,250,000 $85,900,000 $375,937,648
77
78
79 WLFL5 ALLEN LK OUTLET IMPRVMNT Sammamish Agreement $0 $0 $0 $400,000 $1,400,000 $1,000,000 $0 $0 $0 $2,800,000 $2,800,000
Sammamish. To address chronic flooding on this sole access roadway with
approximately 200 properties, look at upstream and downstream retention/detention
options; study road-raining options; prepare Concept Development Report, analyze
and select best options.
Page 3 of 7
part 2 - page 8
No. Title Basin Type of project
2018 Inception
to Date
Expenditure
2019
Inception to
Date Budget
2019 Available
Budget
2020
Requested
2021
Forecasted
2022
Forecasted
2023
Forecasted
2024
Forecasted
2025
Forecasted
6-Year CIP
Total
CIS
Year 7-10
CIS
10+ Year
Project Life
Total Comments
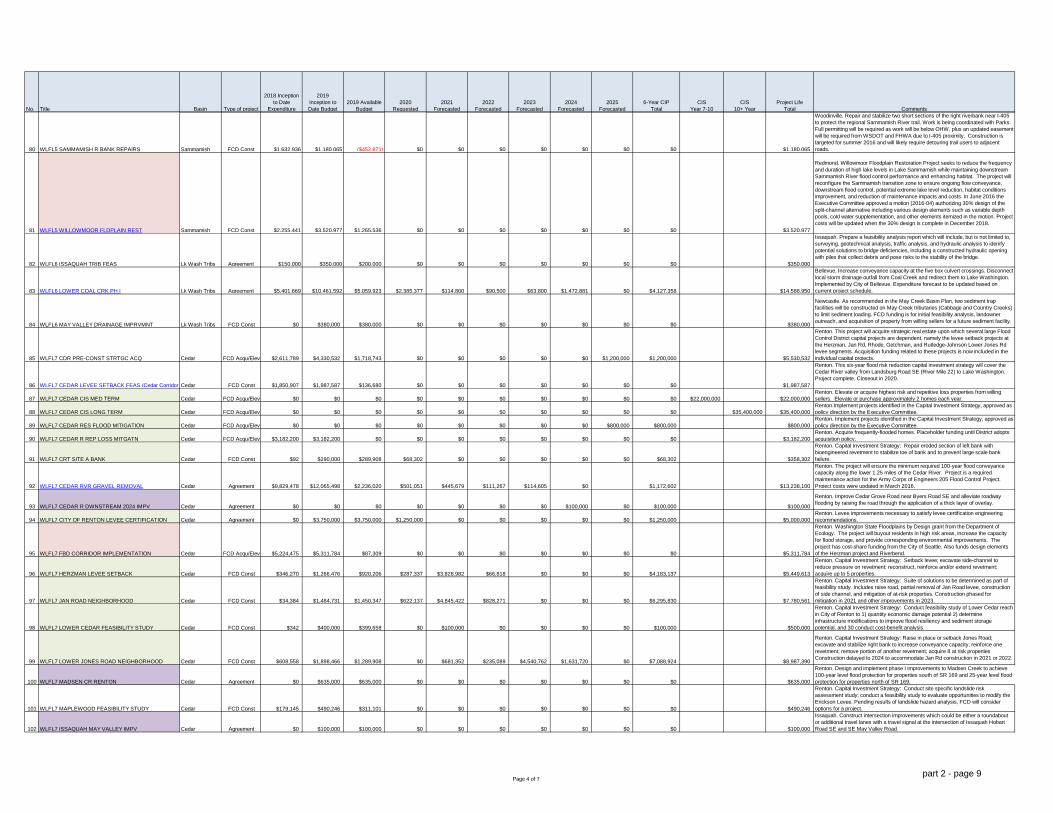
80 WLFL5 SAMMAMISH R BANK REPAIRS Sammamish FCD Const $1,632,936 $1,180,065 ($452,871) $0 $0 $0 $0 $0 $0 $0 $1,180,065
Woodinville. Repair and stabilize two short sections of the right riverbank near I-405
to protect the regional Sammamish River trail. Work is being coordinated with Parks.
Full permitting will be required as work will be below OHW, plus an updated easement
will be required from WSDOT and FHWA due to I-405 proximity. Construction is
targeted for summer 2016 and will likely require detouring trail users to adjacent
roads.
81 WLFL5 WILLOWMOOR FLDPLAIN REST Sammamish FCD Const $2,255,441 $3,520,977 $1,265,536 $0 $0 $0 $0 $0 $0 $0 $3,520,977
Redmond. Willowmoor Floodplain Restoration Project seeks to reduce the frequency
and duration of high lake levels in Lake Sammamish while maintaining downstream
Sammamish River flood control performance and enhancing habitat. The project will
reconfigure the Sammamish transition zone to ensure ongoing flow conveyance,
downstream flood control, potential extreme lake level reduction, habitat conditions
improvement, and reduction of maintenance impacts and costs. In June 2016 the
Executive Committee approved a motion (2016-04) authorizing 30% design of the
split-channel alternative including various design elements such as variable depth
pools, cold water supplementation, and other elements itemized in the motion. Project
costs will be updated when the 30% design is complete in December 2018.
82 WLFL6 ISSAQUAH TRIB FEAS Lk Wash Tribs Agreement $150,000 $350,000 $200,000 $0 $0 $0 $0 $0 $0 $0 $350,000
Issaquah. Prepare a feasibility analysis report which will include, but is not limited to,
surveying, geotechnical analysis, traffic analysis, and hydraulic analysis to idenify
potential solutions to bridge deficiencies, including a constructed hydraulic opening
with piles that collect debris and pose risks to the stability of the bridge.
83 WLFL6 LOWER COAL CRK PH I Lk Wash Tribs Agreement $5,401,669 $10,461,592 $5,059,923 $2,385,377 $114,800 $90,500 $63,800 $1,472,881 $0 $4,127,358 $14,588,950
Bellevue. Increase conveyance capacity at the five box culvert crossings. Disconnect
local storm drainage outfall from Coal Creek and redirect them to Lake Washington.
Implemented by City of Bellevue. Expenditure forecast to be updated based on
current project schedule.
84 WLFL6 MAY VALLEY DRAINAGE IMPRVMNT Lk Wash Tribs FCD Const $0 $380,000 $380,000 $0 $0 $0 $0 $0 $0 $0 $380,000
Newcastle. As recommended in the May Creek Basin Plan, two sediment trap
facilities will be constructed on May Creek tributaries (Cabbage and Country Creeks)
to limit sediment loading. FCD funding is for initial feasibility analysis, landowner
outreach, and acquisition of property from willing sellers for a future sediment facility.
85 WLFL7 CDR PRE-CONST STRTGC ACQ Cedar FCD Acqu/Elev $2,611,789 $4,330,532 $1,718,743 $0 $0 $0 $0 $0 $1,200,000 $1,200,000 $5,530,532
Renton. This project will acquire strategic real estate upon which several large Flood
Control District capital projects are dependent, namely the levee setback projects at
the Herzman, Jan Rd, Rhode, Getchman, and Rutledge-Johnson Lower Jones Rd
levee segments. Acquisition funding related to these projects is now included in the
individual capital projects.
86 WLFL7 CEDAR LEVEE SETBACK FEAS (Cedar Corridor Plan)Cedar FCD Const $1,850,907 $1,987,587 $136,680 $0 $0 $0 $0 $0 $0 $0 $1,987,587
Renton. This six-year flood risk reduction capital investment strategy will cover the
Cedar River valley from Landsburg Road SE (River Mile 22) to Lake Washington.
Project complete. Closeout in 2020.
87 WLFL7 CEDAR CIS MED TERM Cedar FCD Acqu/Elev $0 $0 $0 $0 $0 $0 $0 $0 $0 $0 $22,000,000 $22,000,000
Renton. Elevate or acquire highest risk and repetitive loss properties from willing
sellers. Elevate or purchase approximately 2 homes each year.
88 WLFL7 CEDAR CIS LONG TERM Cedar FCD Acqu/Elev $0 $0 $0 $0 $0 $0 $0 $0 $0 $0 $35,400,000 $35,400,000
Renton.Implement projects identified in the Capital Investment Strategy, approved as
policy direction by the Executive Committee.
89 WLFL7 CEDAR RES FLOOD MITIGATION Cedar FCD Acqu/Elev $0 $0 $0 $0 $0 $0 $0 $0 $800,000 $800,000 $800,000
Renton. Implement projects identified in the Capital Investment Strategy, approved as
policy direction by the Executive Committee.
90 WLFL7 CEDAR R REP LOSS MITGATN Cedar FCD Acqu/Elev $3,182,200 $3,182,200 $0 $0 $0 $0 $0 $0 $0 $0 $3,182,200
Renton. Acquire frequently-flooded homes. Placeholder funding until District adopts
acquisition policy.
91 WLFL7 CRT SITE A BANK Cedar FCD Const $92 $290,000 $289,908 $68,302 $0 $0 $0 $0 $0 $68,302 $358,302
Renton. Capital Investment Strategy: Repair eroded section of left bank with
bioengineered revetment to stabilize toe of bank and to prevent large scale bank
failure.
92 WLFL7 CEDAR RVR GRAVEL REMOVAL Cedar Agreement $9,829,478 $12,065,498 $2,236,020 $501,051 $445,679 $111,267 $114,605 $0 $1,172,602 $13,238,100
Renton. The project will ensure the minimum required 100-year flood conveyance
capacity along the lower 1.25 miles of the Cedar River. Project is a required
maintenance action for the Army Corps of Engineers 205 Flood Control Project.
Project costs were updated in March 2016.
93 WLFL7 CEDAR R DWNSTREAM 2024 IMPV Cedar Agreement $0 $0 $0 $0 $0 $0 $0 $100,000 $0 $100,000 $100,000
Renton. Improve Cedar Grove Road near Byers Road SE and alleviate roadway
flooding by raising the road through the application of a thick layer of overlay.
94 WLFL7 CITY OF RENTON LEVEE CERTIFICATION Cedar Agreement $0 $3,750,000 $3,750,000 $1,250,000 $0 $0 $0 $0 $0 $1,250,000 $5,000,000
Renton. Levee improvements necessary to satisfy levee certification engineering
recommendations.
95 WLFL7 FBD CORRIDOR IMPLEMENTATION Cedar FCD Acqu/Elev $5,224,475 $5,311,784 $87,309 $0 $0 $0 $0 $0 $0 $0 $5,311,784
Renton. Washington State Floodplains by Design grant from the Department of
Ecology. The project will buyout residents in high risk areas, increase the capacity
for flood storage, and provide corresponding environmental improvements. The
project has cost-share funding from the City of Seattle. Also funds design elements
of the Herzman project and Riverbend.
96 WLFL7 HERZMAN LEVEE SETBACK Cedar FCD Const $346,270 $1,266,476 $920,206 $287,337 $3,828,982 $66,818 $0 $0 $0 $4,183,137 $5,449,613
Renton. Capital Investment Strategy: Setback levee; excavate side-channel to
reduce pressure on revetment; reconstruct, reinforce and/or extend revetment;
acquire up to 5 properties.
97 WLFL7 JAN ROAD NEIGHBORHOOD Cedar FCD Const $34,384 $1,484,731 $1,450,347 $622,137 $4,845,422 $828,271 $0 $0 $0 $6,295,830 $7,780,561
Renton. Capital Investment Strategy: Suite of solutions to be determined as part of
feasibility study. Includes raise road, partial removal of Jan Road levee, construction
of side channel, and mitigation of at-risk properties. Construction phased for
mitigation in 2021 and other improvements in 2023.
98 WLFL7 LOWER CEDAR FEASIBILITY STUDY Cedar FCD Const $342 $400,000 $399,658 $0 $100,000 $0 $0 $0 $0 $100,000 $500,000
Renton. Capital Investment Strategy: Conduct feasibility study of Lower Cedar reach
in City of Renton to 1) quantity economic damage potential 2) determine
infrastructure modifications to improve flood resiliency and sediment storage
potential, and 30 conduct cost-benefit analysis.
99 WLFL7 LOWER JONES ROAD NEIGHBORHOOD Cedar FCD Const $608,558 $1,898,466 $1,289,908 $0 $681,352 $235,089 $4,540,762 $1,631,720 $0 $7,088,924 $8,987,390
Renton. Capital Investment Strategy: Raise in place or setback Jones Road;
excavate and stabilize right bank to increase conveyance capacity; reinforce one
revetment; remove portion of another revetment; acquire 8 at risk properties
Construction delayed to 2024 to accommodate Jan Rd construction in 2021 or 2022.
100 WLFL7 MADSEN CR RENTON Cedar Agreement $0 $635,000 $635,000 $0 $0 $0 $0 $0 $0 $0 $635,000
Renton. Design and implement phase I improvements to Madsen Creek to achieve
100-year level flood protection for properties south of SR 169 and 25-year level flood
protection for properties north of SR 169.
101 WLFL7 MAPLEWOOD FEASIBILITY STUDY Cedar FCD Const $179,145 $490,246 $311,101 $0 $0 $0 $0 $0 $0 $0 $490,246
Renton. Capital Investment Strategy: Conduct site specific landslide risk
assessment study; conduct a feasibility study to evaluate opportunities to modify the
Erickson Levee. Pending results of landslide hazard analysis, FCD will consider
options for a project.
102 WLFL7 ISSAQUAH MAY VALLEY IMPV Cedar Agreement $0 $100,000 $100,000 $0 $0 $0 $0 $0 $0 $0 $100,000
Issaquah. Construct intersection improvements which could be either a roundabout
or additional travel lanes with a travel signal at the intersection of Issaquah Hobart
Road SE and SE May Valley Road.
Page 4 of 7part 2 - page 9

No. Title Basin Type of project
2018 Inception
to Date
Expenditure
2019
Inception to
Date Budget
2019 Available
Budget
2020
Requested
2021
Forecasted
2022
Forecasted
2023
Forecasted
2024
Forecasted
2025
Forecasted
6-Year CIP
Total
CIS
Year 7-10
CIS
10+ Year
Project Life
Total Comments
103 WLFL7 RIVERBEND MHP ACQ Cedar FCD Acqu/Elev $4,362,885 $5,231,042 $868,157 $0 $0 $0 $0 $0 $0 $0 $5,231,042
Renton. This project represents the Flood District contribution to a larger project that
relocates mobile home park tenants and initiates preliminary engineering design for
potential levee setback / realignment to reduce flood heights, velocities and channel
migration risk in this reach. Disappropriate remainder after FCD portion of scope is
complete.
104 WLFL7 MADSEN CR CULVERT 2017 Cedar Agreement $206,205 $1,100,000 $893,795 $1,430,000 $0 $0 $0 $0 $0 $1,430,000 $2,530,000
Renton. To address a culvert failure affecting approximately 10 properties, prepare
Concept Development Report to analyze and select best culvert replacement and
road-raising option; and analyze upstream and downstream retention/detention
impacts.
105 WLFL7 SR 169 FEASIBILITY STUDY Cedar FCD Const $170,603 $646,800 $476,197 $138,203 $0 $0 $0 $0 $0 $138,203 $785,003
Renton. Conduct feasibility study in coordination with WSDOT to evaluate flood risk
reduction opportunities, such as elevating SR 169, upgrading the local drainage
infrastructure, and / or installation of back flow prevention gates. Funding added in
2019 pending FCD decision to move forward with preliminary design.
106 Cedar-Sammamish Subtotal $38,047,379 $60,062,996 $22,015,617 $7,082,407 $11,416,235 $2,331,945 $4,719,167 $3,204,601 $2,000,000 $30,754,355 $22,000,000 $35,400,000 $148,217,351
107
108
109 WLFL8 212TH AVE SE @ SR 164 FLD IMPRVMNT Green Agreement $0 $0 $0 $0 $0 $0 $0 $0 $190,000 $190,000 $190,000
Enumclaw. Improve the drainage system to alleviate neighborhood flooding. May
require improvements outside of the road right-of-way.
110 WLFL8 BRISCOE LEVEE SETBACK Green Agreement $21,072,606 $23,330,271 $2,257,665 $0 $0 $0 $0 $0 $0 $0 $23,330,271
Kent. Floodwall construction at four locations completed by the City of Kent. Final
expenditures for the remainder of 2017 will include reimbursement for property
acquisition and riparian plantings. The revised 2017 financial plan includes revenue
of $4.1 million for the sale of the Rivers Edge Business Park. Per FCD 2016-20
Section 6, this revenue makes expenditure authority available for the Lower Russell
Levee Setback project. The Briscoe project will be closed out once the District's ILA
with Kent expires in 2018.
111 WLFL8 BRPS CONTROL BLDG RPLCMT Green FCD Const $106 $380,506 $380,400 $1,926,876 $7,813,278 $13,241,331 $9,647 $0 $0 $22,991,133 $23,371,639
Renton. This project will design and build the second phase of renovations to the
Black River pump station. Major components include replacement of the control
building, replacement of the trash rake system, and replacement of the screen spray
system.
112 WLFL8 BRPS FISH PASS IMPRVMNTS Green FCD Const $0 $0 $0 $0 $992,079 $3,782,881 $4,107,257 $3,453,157 $92,073 $12,427,447 $12,427,447
Renton. This project will design and build the fourth phase of renovations to the
Black River pump station, revising and replacing the obsolete fish passage systems.
113 WLFL8 BRPS HIGH-USE ENGINES Green FCD Const $215,646 $1,484,646 $1,269,000 $1,949,130 $33,949 $0 $0 $0 $0 $1,983,079 $3,467,725
Renton. This project will design and build the first phase of renovations to the Black
River pump station, replacing the three smaller pump engines which run much more
frequently than the other, larger pump engines.
114 WLFL8 BRPS SUPPORT SYS UPGRADES Green FCD Const $0 $0 $0 $1,149 $183,181 $940,317 $876,479 $12,074 $0 $2,013,200 $2,013,200
Renton. This project will design and build the third phase of renovations to the Black
River pump station, replacing support systems such as engine control panels, cooling
systems, oilers and hoists.
115 WLFL8 GALLI-DYKSTRA FEASIBILITY Green FCD Const $0 $330,000 $330,000 $2,430 $0 $0 $0 $0 $0 $2,430 $332,430
Auburn. Conduct a feasibility study to raise the levee providing 100-year flood
protection plus 3 feet of freeboard.
116 WLFL8 GALLI-DYKSTRA 2020 REPAIR Green FCD Const $0 $200,000 $200,000 $407,314 $1,550,783 $0 $0 $0 $0 $1,958,097 $2,158,097
Auburn. Complete Phase 1 repair per a request from the City of Auburn. Elevate
3500 feet levee reach to meet FEMA levee certification requirements.
117 WLFL8 GREEN PRE-CONST ACQ Green FCD Acqu/Elev $393,751 $10,368,856 $9,975,105 $0 $5,000,000 $5,000,000 $5,000,000 $5,000,000 $5,000,000 $25,000,000 $35,368,856
Tukwila. This project will acquire strategic real estate upon which future large Flood
Control District capital projects are dependent, thereby reducing risks to construction
schedules for those projects.
118 WLFL8 GREEN R PL84-99 MITIGATN Green FCD Const $5,173,981 $5,660,542 $486,561 $0 $0 $0 $0 $0 $0 $0 $5,660,542
Auburn. This project will result in actions to mitigate environmental damage from tree
cutting during 2008-9 (as required by permitting agencies) to maintain eligibility for
US Army Corps of Engineers PL84-99 program. The current mitigation effort is the
Teufel project scheduled for 2018 construction.
119 WLFL8 HSB BREDA SETBACK KENT Green Agreement $834,330 $4,758,953 $3,924,623 $2,431,377 $8,381,110 $43,709 $0 $0 $0 $10,856,196 $15,615,149
Kent. New project to implement interim SWIF adopted by Board of Supervisors. This
project will reconstruct the Horseshoe Bend Levee at the Breda reach (RM 24.46-
24.72) to a more stable configuration in order to reduce flood risk to the surrounding
areas. The project will also raise levee crest elevations to contain the 500-year
(0.2% annual chance) flood. This segment of the levee has the lowest factor of
safety rating of the Horseshoe Bend levee.
120 WLFL8 HSB MCCOY REALIGNMENT KENT Green Agreement $4,138 $400,000 $395,862 $116,138 $2,333,980 $764,909 $0 $0 $0 $3,215,027 $3,615,027
Kent. New project to implement interim SWIF adopted by Board of Supervisors. This
PL 84-99 levee segment contains a ‘Minimally acceptable’ rating by the USACE due
to a slope deficiency at RM 24.3 (over steepened slopes from 1.3 to 1.7H:1V for 500
feet). The City of Kent constructed a secondary containment levee in this reach, set
back from the river’s edge, which is currently not part of the federal levee. The only
remaining structure between the two levees is a Puget Sound Energy facility. The
Horseshoe Bend Levee Certification Report calculated Factor of Safety (FOS)
values for rapid drawdown of 1.08 and 1.55 at about RM 24.3 and RM 24.4,
respectively. River bed scour in this reach between 1986 and 2011 is 2.7 feet at RM
24.24. Funding of $400,000 covers the cost of major modification to the federal levee
so that the City of Kent's secondary containment levee can be incorporated into the
federal levee project.
121 WLFL8 HSB NURSING HOME SETBACK Green FCD Const $0 $0 $0 $0 $100,000 $2,000,000 $500,000 $0 $0 $2,600,000 $2,600,000
Kent. New project to implement interim SWIF adopted by Board of Supervisors. The
Nursing Home levee is over-steepened and does not meet current engineering
standards. The economic consequence of levee failure or overtopping to the lower
Green River valley is extensive and could cause tens of millions of dollars in
damage. This capital project area contains a ‘Minimally Acceptable’ deficiency by the
US Army Corps of Engineers at RM 25. 5 (over steepened slopes from 1. 25 to 1.
7H:1V for 225 feet). The Horseshoe Bend Levee Certification Report calculated a
Factor of Safety (FOS) value for rapid drawdown of 1. 01 at RM 25. 57 (Section F).
This is barely above the minimum FOS (1. 0) from the US Army Corps of Engineers
manual.
122 WLFL8 INTERIM SWIF IMPLEMENTATION Green FCD Const $66,887 $85,000 $18,113 $0 $0 $0 $0 $0 $0 $0 $85,000
Kent. Coordination and planning activities to implement recommendations of interim
SWIF. Maintenance work associated with the interim SWIF is included in the
operating budget.
123 WLFL8 LOWER RUSSELL ACQ KENT Green Agreement $1,059,834 $1,023,656 ($36,178) $0 $0 $0 $0 $0 $0 $0 $1,023,656Kent. Acquisitions by the City of Kent for the Lower Russell levee setback project.
124 WLFL8 LWR GRN R CORRIDOR PLAN/EIS Green FCD Const $233,117 $1,743,249 $1,510,132 $0 $0 $0 $0 $0 $0 $0 $1,743,249Kent. Lower Green River Corridor Planning and Environmental Impact Statement.
Page 5 of 7
part 2 - page 10
No. Title Basin Type of project
2018 Inception
to Date
Expenditure
2019
Inception to
Date Budget
2019 Available
Budget
2020
Requested
2021
Forecasted
2022
Forecasted
2023
Forecasted
2024
Forecasted
2025
Forecasted
6-Year CIP
Total
CIS
Year 7-10
CIS
10+ Year
Project Life
Total Comments
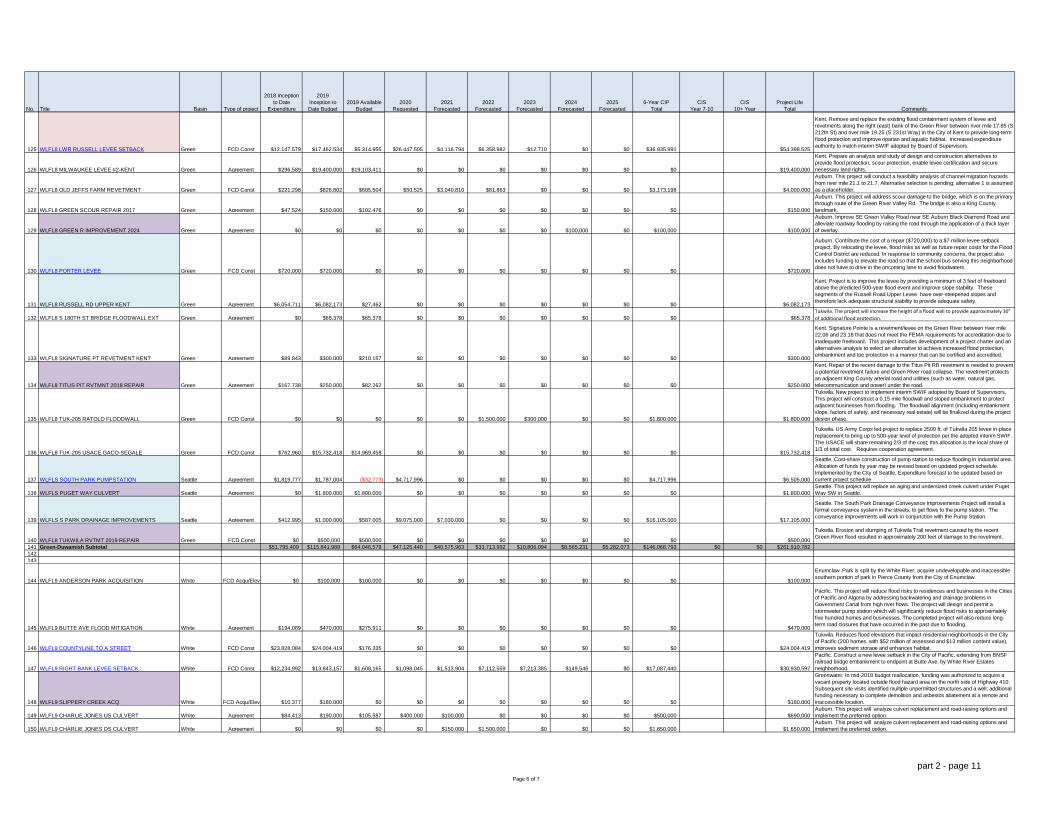
125 WLFL8 LWR RUSSELL LEVEE SETBACK Green FCD Const $12,147,579 $17,462,534 $5,314,955 $26,447,505 $4,116,794 $6,358,982 $12,710 $0 $0 $36,935,991 $54,398,525
Kent. Remove and replace the existing flood containment system of levee and
revetments along the right (east) bank of the Green River between river mile 17.85 (S
212th St) and river mile 19.25 (S 231st Way) in the City of Kent to provide long-term
flood protection and improve riparian and aquatic habitat. Increased expenditure
authority to match interim SWIF adopted by Board of Supervisors.
126 WLFL8 MILWAUKEE LEVEE #2-KENT Green Agreement $296,589 $19,400,000 $19,103,411 $0 $0 $0 $0 $0 $0 $0 $19,400,000
Kent. Prepare an analysis and study of design and construction alternatives to
provide flood protection, scour protection, enable levee certification and secure
necessary land rights.
127 WLFL8 OLD JEFFS FARM REVETMENT Green FCD Const $221,298 $826,802 $605,504 $50,525 $3,040,810 $81,863 $0 $0 $0 $3,173,198 $4,000,000
Auburn. This project will conduct a feasibility analysis of channel migration hazards
from river mile 21.1 to 21.7. Alternative selection is pending; alternative 1 is assumed
as a placeholder.
128 WLFL8 GREEN SCOUR REPAIR 2017 Green Agreement $47,524 $150,000 $102,476 $0 $0 $0 $0 $0 $0 $0 $150,000
Auburn. This project will address scour damage to the bridge, which is on the primary
through route of the Green River Valley Rd. The bridge is also a King County
landmark.
129 WLFL8 GREEN R IMPROVEMENT 2024 Green Agreement $0 $0 $0 $0 $0 $0 $0 $100,000 $0 $100,000 $100,000
Auburn. Improve SE Green Valley Road near SE Auburn Black Diamond Road and
alleviate roadway flooding by raising the road through the application of a thick layer
of overlay.
130 WLFL8 PORTER LEVEE Green FCD Const $720,000 $720,000 $0 $0 $0 $0 $0 $0 $0 $0 $720,000
Auburn. Contribute the cost of a repair ($720,000) to a $7 million levee setback
project. By relocating the levee, flood risks as well as future repair costs for the Flood
Control District are reduced. In response to community concerns, the project also
includes funding to elevate the road so that the school bus serving this neighborhood
does not have to drive in the oncoming lane to avoid floodwaters.
131 WLFL8 RUSSELL RD UPPER KENT Green Agreement $6,054,711 $6,082,173 $27,462 $0 $0 $0 $0 $0 $0 $0 $6,082,173
Kent. Project is to improve the levee by providing a minimum of 3 feet of freeboard
above the predicted 500-year flood event and improve slope stability. These
segments of the Russell Road Upper Levee have over-steepened slopes and
therefore lack adequate structural stability to provide adequate safety.
132 WLFL8 S 180TH ST BRIDGE FLOODWALL EXT Green Agreement $0 $65,378 $65,378 $0 $0 $0 $0 $0 $0 $0 $65,378
Tukwila. The project will increase the height of a flood wall to provide approximately 30"
of additional flood protection.
133 WLFL8 SIGNATURE PT REVETMENT KENT Green Agreement $89,843 $300,000 $210,157 $0 $0 $0 $0 $0 $0 $0 $300,000
Kent. Signature Pointe is a revetment/levee on the Green River between river mile
22.06 and 23.18 that does not meet the FEMA requirements for accreditation due to
inadequate freeboard. This project includes development of a project charter and an
alternatives analysis to select an alternative to achieve increased flood protection,
embankment and toe protection in a manner that can be certified and accredited.
134 WLFL8 TITUS PIT RVTMNT 2018 REPAIR Green Agreement $167,738 $250,000 $82,262 $0 $0 $0 $0 $0 $0 $0 $250,000
Kent. Repair of the recent damage to the Titus Pit RB revetment is needed to prevent
a potential revetment failure and Green River road collapse. The revetment protects
an adjacent King County arterial road and utilities (such as water, natural gas,
telecommunication and power) under the road.
135 WLFL8 TUK-205 RATOLO FLOODWALL Green FCD Const $0 $0 $0 $0 $0 $1,500,000 $300,000 $0 $0 $1,800,000 $1,800,000
Tukwila. New project to implement interim SWIF adopted by Board of Supervisors.
This project will construct a 0.15 mile floodwall and sloped embankment to protect
adjacent businesses from flooding. The floodwall alignment (including embankment
slope, factors of safety, and necessary real estate) will be finalized during the project
design phase.
136 WLFL8 TUK-205 USACE GACO-SEGALE Green FCD Const $762,960 $15,732,418 $14,969,458 $0 $0 $0 $0 $0 $0 $0 $15,732,418
Tukwila. US Army Corps led project to replace 3500 ft. of Tukwila 205 levee in-place
replacement to bring up to 500-year level of protection per the adopted interim SWIF.
The USACE will share remaining 2/3 of the cost; this allocation is the local share of
1/3 of total cost. Requires cooperation agreement.
137 WLFLS SOUTH PARK PUMPSTATION Seattle Agreement $1,819,777 $1,787,004 ($32,773) $4,717,996 $0 $0 $0 $0 $0 $4,717,996 $6,505,000
Seattle. Cost-share construction of pump station to reduce flooding in industrial area.
Allocation of funds by year may be revised based on updated project schedule.
Implemented by the City of Seattle. Expenditure forecast to be updated based on
current project schedule.
138 WLFLS PUGET WAY CULVERT Seattle Agreement $0 $1,800,000 $1,800,000 $0 $0 $0 $0 $0 $0 $0 $1,800,000
Seattle. This project will replace an aging and undersized creek culvert under Puget
Way SW in Seattle.
139 WLFLS S PARK DRAINAGE IMPROVEMENTS Seattle Agreement $412,995 $1,000,000 $587,005 $9,075,000 $7,030,000 $0 $0 $0 $0 $16,105,000 $17,105,000
Seattle. The South Park Drainage Conveyance Improvements Project will install a
formal conveyance system in the streets, to get flows to the pump station. The
conveyance improvements will work in conjunction with the Pump Station.
140 WLFL8 TUKWILA RVTMT 2019 REPAIR Green FCD Const $0 $500,000 $500,000 $0 $0 $0 $0 $0 $0 $0 $500,000
Tukwila. Erosion and slumping of Tukwila Trail revetment caused by the recent
Green River flood resulted in approximately 200 feet of damage to the revetment.
141 Green-Duwamish Subtotal $51,795,409 $115,841,988 $64,046,578 $47,125,440 $40,575,963 $33,713,992 $10,806,094 $8,565,231 $5,282,073 $146,068,793 $0 $0 $261,910,782
142
143
144 WLFL9 ANDERSON PARK ACQUISITION White FCD Acqu/Elev $0 $100,000 $100,000 $0 $0 $0 $0 $0 $0 $0 $100,000
Enumclaw. Park is split by the White River; acquire undevelopable and inaccessible
southern portion of park in Pierce County from the City of Enumclaw.
145 WLFL9 BUTTE AVE FLOOD MITIGATION White Agreement $194,089 $470,000 $275,911 $0 $0 $0 $0 $0 $0 $0 $470,000
Pacific. This project will reduce flood risks to residences and businesses in the Cities
of Pacific and Algona by addressing backwatering and drainage problems in
Government Canal from high river flows. The project will design and permit a
stormwater pump station which will significantly reduce flood risks to approximately
five hundred homes and businesses. The completed project will also reduce long-
term road closures that have occurred in the past due to flooding.
146 WLFL9 COUNTYLINE TO A STREET White FCD Const $23,828,084 $24,004,419 $176,335 $0 $0 $0 $0 $0 $0 $0 $24,004,419
Tukwila. Reduces flood elevations that impact residential neighborhoods in the City
of Pacific (200 homes, with $52 million of assessed and $13 million content value),
improves sediment storage and enhances habitat.
147 WLFL9 RIGHT BANK LEVEE SETBACK White FCD Const $12,234,992 $13,843,157 $1,608,165 $1,098,045 $1,513,904 $7,112,559 $7,213,385 $149,546 $0 $17,087,440 $30,930,597
Pacific. Construct a new levee setback in the City of Pacific, extending from BNSF
railroad bridge embankment to endpoint at Butte Ave. by White River Estates
neighborhood.
148 WLFL9 SLIPPERY CREEK ACQ White FCD Acqu/Elev $10,377 $180,000 $0 $0 $0 $0 $0 $0 $0 $0 $180,000
Greenwater. In mid-2018 budget reallocation, funding was authorized to acquire a
vacant property located outside flood hazard area on the north side of Highway 410.
Subsequent site visits identified multiple unpermitted structures and a well; additional
funding necessary to complete demolition and asbestos abatement at a remote and
inaccessible location.
149 WLFL9 CHARLIE JONES US CULVERT White Agreement $84,413 $190,000 $105,587 $400,000 $100,000 $0 $0 $0 $0 $500,000 $690,000
Auburn. This project will analyze culvert replacement and road-raising options and
implement the preferred option.
150 WLFL9 CHARLIE JONES DS CULVERT White Agreement $0 $0 $0 $0 $150,000 $1,500,000 $0 $0 $0 $1,650,000 $1,650,000
Auburn. This project will analyze culvert replacement and road-raising options and
implement the preferred option.
Page 6 of 7
part 2 - page 11

No. Title Basin Type of project
2018 Inception
to Date
Expenditure
2019
Inception to
Date Budget
2019 Available
Budget
2020
Requested
2021
Forecasted
2022
Forecasted
2023
Forecasted
2024
Forecasted
2025
Forecasted
6-Year CIP
Total
CIS
Year 7-10
CIS
10+ Year
Project Life
Total Comments
151 WLFL9 STUCK R DR 2019 REPAIR White FCD Const $0 $200,000 $200,000 $446,374 $0 $0 $0 $0 $0 $446,374 $646,374
Auburn. Loss of facing rock along 130’ of the lower half of the embankment. Some of
the gravel fill under the rock has eroded as well, leaving a near-vertical face
supporting the rock remaining on the upper slope. The rock that slid down is currently
providing scour protection at the toe.
152 White Subtotal $36,351,955 $38,987,576 $2,465,998 $1,944,419 $1,763,904 $8,612,559 $7,213,385 $149,546 $0 $19,683,814 $0 $0 $58,671,390
153
154
155 WLFLX CORRIDOR PLN DESIGN/CONST PLACEHOLDERCountywide FCD Const $0 $0 $0 $0 $0 $0 $0 $0 $0 $0 $0 Placeholder for corridor plan implementation project(s)
156 Countywide Corridor Plan Imp Subtotal $0 $0 $0 $0 $0 $0 $0 $0 $0 $0 $0 $0 $0
157
158
159 WLFLG FLOOD REDUCTION GRANTS Countywide Grant $8,993,154 $17,852,257 $8,859,103 $3,267,286 $3,347,552 $3,425,509 $3,502,154 $3,578,980 $3,588,460 $20,709,941 $38,562,198
Competitive grant program for flood reduction projects. Increases as a proportion of
total FCD tax revenue.
160 WLFLG WRIA GRANTS Countywide Grant $20,647,848 $32,303,948 $11,656,100 $4,684,168 $4,818,604 $4,956,898 $5,099,161 $5,245,506 $5,396,052 $30,200,389 $62,504,337
Cooperative Watershed Management Grant Program; priorities recommended by
watershed groups. Increase based on assumed inflation rate.
161 WLFLM EFFECTIVENESS MONITORING Countywide FCD Const $2,385,821 $2,929,221 $543,400 $330,232 $890,956 $834,056 $892,524 $804,751 $585,512 $4,338,030 $7,267,251
Evaluation of capital projects to determine effectiveness and identify project design
improvements.
162 WLFLO SUBREGNL OPPRTNTY FUND Countywide Grant $34,916,901 $55,311,183 $20,394,282 $6,077,152 $6,226,447 $6,371,447 $6,514,006 $6,656,903 $6,674,535 $38,520,490 $93,831,673
Allocation to all King County jurisdictions for flooding, water quality, or watershed
management projects. Increases as a proportion of total FCD tax revenue.
163 WLFLX CONST MATERIALS STOCKPILE Countywide FCD Const $0 $500,000 $500,000 $0 $0 $0 $0 $0 $0 $0 $500,000 Stockpile role for future flood damage repairs.
164 WLFLX CENTRAL CHARGES Countywide FCD Const $748,397 $1,011,493 $263,096 $100,000 $142,592 $146,870 $151,276 $155,815 $160,489 $857,042 $1,868,535 Central charges related to the FCD's capital fund.
165 WLFLX FLOOD EMERGENCY CONTGNCY Countywide FCD Const $419,042 $1,050,917 $631,875 $0 $250,000 $250,000 $250,000 $250,000 $250,000 $1,250,000 $2,300,917 Contingency for emergency response actions during a flood event.
166 Countywide Subtotal $68,111,164 $110,959,019 $42,847,856 $14,458,838 $15,676,151 $15,984,779 $16,409,120 $16,691,955 $16,655,048 $95,875,892 $0 $0 $206,834,911
167
168 Grand Total $268,705,708 $420,273,031 $151,197,700 $78,055,852 $79,339,102 $77,576,552 $50,873,174 $53,907,675 $48,996,696 $388,749,051 $121,250,000 $121,300,000 $1,051,572,082
Page 7 of 7
part 2 - page 12